Ground Improvement (2005) 9, No. 4, 149–162
149
Deep-well pumping in the Bangkok Plain and its
influence on ground improvement development
with surcharge and vertical drains
A. S. BALASUBRAMANIAM*, E. Y. N. OH*, M. W. BOLTON*,
D. T. BERGADO† and N. PHIENWEJ†
*School of Engineering, Griffith University Gold Coast Campus, Australia; †School of Civil
Engineering, Asian Institute of Technology, Bangkok, Thailand
The Bangkok subsoil that forms part of the larger Chao
Phraya Plain consists of a broad basin filled with sedimentary soil deposits that form alternate layers of sand, gravel
and clay. The depth of the bedrock is still undetermined,
but its level in the Bangkok area is known to vary between
400 m and 1800 m deep. The aquifer system beneath the
city area is very complex, and the deep-well pumping from
the aquifers over the last 50 years or so has caused
substantial piezometric drawdown in the upper soft and
highly compressible clay layer. In this paper, the influence
of the piezometric drawdown on the performance of
vertical drains with surcharge on the upper clay layer is
examined. Instrumented test embankments were built and
the performance of large-diameter sand drains, sand wicks
and prefabricated vertical drains was examined. A novel
interpretation technique was adopted to evaluate the
settlements from pore pressure dissipation and to compare
with those measured directly from settlement measurements.
Keywords : Bangkok subsoil; ground improvement;
subsidence
Introduction
It is interesting to look back on the lessons learnt from the
development of ground improvement techniques with surcharge and vertical drains in Bangkok subsoils. The potential
use of surcharge and vertical drains as a ground improvement technique was explored as early as 1966 (Eide, 1977)
for its application in bridge approaches. A test section on the
Bangkok–Siracha Highway was built and tested with 0.20 m
diameter sand drains; the depth of the sand drains varied in
steps from 4 to 13 m. During construction, failure of the soft
clay occurred in five locations, and the 2.2 m high embankment was furnished with 8 m wide berms to ensure stability.
From the observed settlement of the test embankment, Eide
(1977) concluded that the drained embankment section
settled most to start with, but after one year the rate of
settlement was almost the same, approximately 0.0025 m per
(GI 4202) Paper received 24 March 2002; last revised 31 March 2005;
accepted 8 April 2005
Le sous-sol de Bangkok qui forme une partie de la plaine
plus vaste de Chao Phraya est constitué d’un large bassin
rempli de dépôts sédimentaires qui forment des couches
alternées de sable, de gravier et d’argile. La profondeur du
lit rocheux reste indéterminée mais on sait que son niveau
dans la zone de Bangkok se situe entre 400 m et 1800 m de
profondeur. Le système aquifère sous la ville est très
complexe et un pompage à puits profonds au cours des 50
dernières années a causé une baisse substantielle du
niveau piézométrique dans la couche argileuse supérieure
molle et hautement compressible. Dans cet exposé, nous
examinons l’influence de la baisse piézométrique sur la
performance de drains verticaux surchargés sur la couche
argileuse supérieure. Des berges de contrôle instrumentées
ont été construites et la performance de drains de sable de
gros diamètre, de mèches de sable et de drains verticaux
préfabriqués a été étudiée. Nous avons adopté une technique d’interprétation innovante pour évaluer les tassements d’après la dissipation de la pression interstitielle et
pour les mesures de tassement directes.
month on both the drained and undrained sections. The
practical conclusion reached by Eide (1977) was that this
type of drain and spacing would not serve the purpose in
bridge approaches. However, Eide (1977) agreed that the
results obtained might have been affected by other factors,
such as slip failures, the remoulding effect from the installation of drains, the low permeability and greater secondary
consolidation settlement of the soft clay.
A second attempt was made in 1975–1977, with the
construction of a dockyard for the Royal Thai Navy, and a
test embankment was built in order to evaluate the performance and suitability of sand drains (sand wick type) as a
means to accelerate the consolidation of the soft clay. Without an understanding of the recharge effect due to the sand
wicks on the piezometric drawdown, doubts were cast on
the pore pressure measurements as revealed below the
natural terrain in which the sand wick was installed, and
this led to the installation of additional piezometers; finally
there were a total of 166 piezometers monitoring the pore
pressures below the clay surface. It was found that the
installation of the sand wicks had recharged the area below
1365-781X # 2005 Thomas Telford Ltd
�Balasubramaniam et al.
the test embankment with and without drains, and erased
the normal piezometric drawdown that normally existed in
the Bangkok subsoils due to deep-well pumping, as can be
seen in the area that was not influenced by the test
embankment location installed with sand wick drains. This
recharging effect was somehow not envisaged in the original
planning and design of the test embankment. However, it
gave valuable insights into the extensive deep-well pumping
in the Bangkok Plain, and the piezometric drawdown that
has resulted in the Bangkok subsoils as a consequence of
this groundwater withdrawal.
In 1983, the most extensive sand drain studies were
performed as part of the investigations related to the Second
International Airport, which is currently under completion.
The purpose of the trial tests was to ensure the effectiveness
of using non-displacement types of sand drain for accelerating consolidation settlement of soft clay. Sand drains of
minimum diameter 0.26 m were installed to a depth of
14.5 m by the water-jetting method. During this study, the
feasibility of the use of vacuum drains was also investigated,
but the idea was abandoned as several leaks developed and
the vacuum was unable to be maintained.
However, additional knowledge gained was that a settlement of the order of 0.4 m was experienced over a period of
6 months after the installation of the sand blanket (only
0.8 m thick) alone and prior to the use of surcharge fills. This
observation has led to the interpretation of possible hydraulic connections between the sand drains and the first sand
layer located at 25 m depth with a piezometric drawdown of
12 m (120 kPa).
The above experiences and the lessons learnt led to a
rather cautious approach on the final studies carried out (for
a two-year period from 1994 to 1995) for the construction of
the runway and other structures at the Second Bangkok
International Airport (SBIA) site. In this study, it was
concluded that the use of prefabricated vertical drains
(PVDs) and surcharge was the most suitable ground improvement technique. This paper describes the history of
groundwater pumping in the Bangkok Plain, the accumulated piezometric drawdown, and its influence in the
development of surcharge with PVDs as a suitable ground
improvement technique.
Bangkok subsoil conditions and the
effect of deep-well pumping
Geology and hydrogeology of the Bangkok
Plain
Bangkok is situated on the floodplain and delta of the
Chao Phraya River, which traverses the Lower Central Plain
of Thailand. The clastic sediments overlying the basement
complex are unconsolidated and semi-consolidated clay,
sand and gravel ranging in age from Tertiary to Quaternary
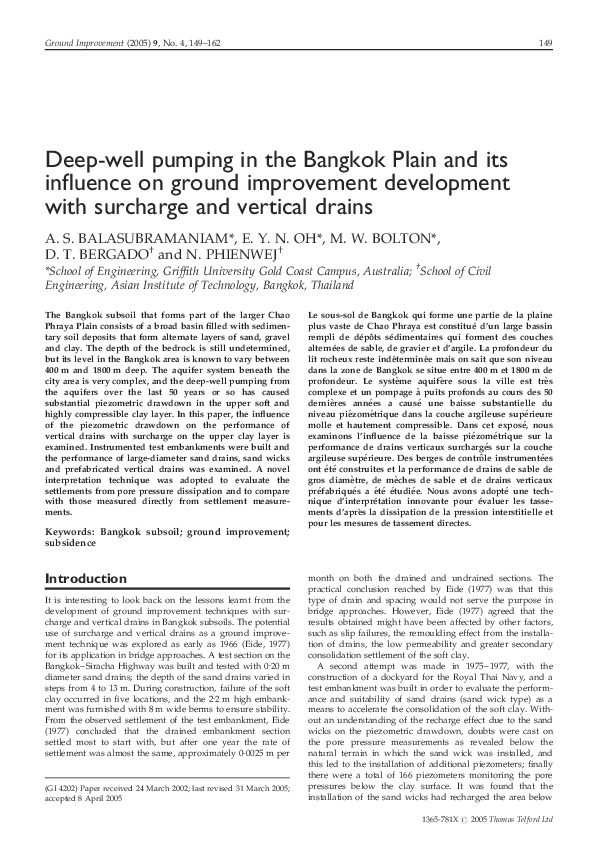
(see Fig. 1). Muktabhant et al. (1967) have described how the
late Tertiary structural movements of the earth crust and the
sequence of alluvial cycles were probably influenced by the
formation of the depression of the Chao Phraya Basin. The
subsequent marine sedimentation resulted in the unconsolidated deposition of the Bangkok subsoils. Also, according to
Eide (1968), the overlying soft clay was deposited when the
sea level rose for the second time after a period of recession.
When the water level dropped below the ground surface,
soft clay was exposed to physical and chemical weathering
processes of alternating wetting and drying cycles, which
eventually yielded the hard, shallow crust that covers the
whole area of the Chao Phraya Plain.
Muktabhant et al. (1967) and Moh et al. (1969) have divided
the subsurface soil conditions into four apparent layers. The
top layer is a weathered zone of soft clay, which is dark
brown in colour with variable thicknesses from location to
location, averaging about 4.5 m thick. The second layer is soft
clay and extends to about 10–15 m below the weathered
crust. A third stiff clay layer, often fissured and about 15 m
thick, follows the weathered crust and the soft clay. The clay
layers described above, and generally called Bangkok clay,
are followed by a layer of sand (the fourth layer). Below this
upper sand layer (with some sandy clay), lie alternate layers
of clay, and sand and gravel extends to approximately 400 m
deep in the east and more than 1800 m deep west of Bangkok.
Fig. 2 shows the compressibility characteristics of the clay
layers at the AIT campus in Bangkok. In this figure the highly
compressible characteristics of the soft clay in the upper 7 m
are clearly evident. The medium soft clay at 11–14 m was
moderately compressible, and the stiff and hard clays at
deeper depths are found to be least compressible.
Bangkok
N
Depth: m
Samutprakan
Singburi
Chainat
Angthong Ayut Thaya
Pathumthani
Phranakhon
Bangban
Bangsai
Phomburi Chaiyo
Phrakhanong
Nonthaburi
Manorom Chao Phraya Dam
Inburi
Thachang
Pamok
AIT
Bangkhen
Gulf of Thailand
50
0
50
Phrapradaeng
100
150
Bangkok
Nakhonluang
Bedrock
Nonthaburi
200
250
Samkok
300
350
400
Penang
450
500
Fig. 1. Hydrological profile of Bangkok aquifer system in north–south direction
150
S
Bedrock
�Deep-well pumping in the Bangkok Plain
0
Soft clay
Depth 5
2·14 m
Pore pressure: kPa
100
0
5·08
Stiff clay
10
0
P0
200
AIT (1973)
7·03
Hard clay
30
Sand
2·0
20
SOFT
CLAY
210
70
Depth: m
Sand
Void ratio, e
1·0
11·0
13·0
14·0
0·5
90
Borehole log
Dummy
19941995
study
220
Stiff
clay
Sand
59·9
80·0
62·7
88·2 64·2
65·7
72·2
Hard clay
80
Hydrostatic
pressure
Hard
clay Sand
60
Hard clay
50
Sand
Depth: m
1·5
40
230
Fig. 3. Piezometric drawdown due to deep-well pumping at SBIA site
10
100
Pressure: kN/m2
1000
Fig. 2. Compressibility characteristics of Bangkok soft clay
According to Ramnarong and Buapeng (1991), in the upper
600 m there exist eight artesian aquifers, separated from each
other by thick layers of clay or sandy clay. These aquifers are
named Bangkok (BK), Phrapadaeng (PD), Nakornluang
(NL), Nonthaburi (NB), Sam Khok (SK), Phaya Thai (PT),
Thonburi (TB) and Pak Nam (PN). They are located at depths
of 50, 100, 150, 200, 300, 350, 450 and 550 m respectively. The
Bangkok aquifer is already depleted, and most of the water
supply in Bangkok comes from the second (Phrapadaeng) to
sixth aquifers (Phaya Thai). The seventh and eighth aquifers
are used mainly for industrial water supply.
Groundwater withdrawal and subsidence
Records indicate that the deep-well pumping in 1954 was
only about 8360 m3 /day, but this increased to 371 000 m3 /
day in 1974 and to some 1.4 million m3 in 1983. Strict
groundwater control measures made this withdrawal drop
between 1983 and 1987, but pumping amounts have begun
rising again since 1988. As a result of this deep-well
pumping and extraction of groundwater, by 1974 the water
level in the Nakornluang aquifer had declined by 30 m. This
had increased to some 46 m by 1979 (Ramnarong, 1983).
After the control measures on groundwater pumping were
imposed in 1983, the piezometric level began to rise in
almost all areas. The piezometric drawdown at the Second
Bangkok International Airport (SBIA) Site as of 1994–1995
during the final studies related to the use of surcharge with
PVD as the most suitable ground improvement technique is
shown in Fig. 3. In this figure, the piezometric drawdown as
measured in 1973 is also shown. In the Bangkok Plain, the
piezometric drawdown has gradually increased over the
years in the upper clay layer.
Studies related to Bangkok subsidence due to deep-well
pumping started as early as 1968 (Cox, 1968; Paveenchana,
1970; Brand and Paveenchana, 1971; Brand and Balasubramaniam, 1976). However, the most comprehensive study was
under the leadership of Professor Prinya Nutalaya at the Asian
Institute of Technology (AIT, 1978a, 1978b, 1981; Premchitt,
1981). In these studies, the ultimate settlement was considered
in three parts: due to the compression of the aquifers, the soft
clay, and the stiff clay. The studies reported in AIT research
reports (AIT, 1978a, 1978b) also included a mathematical
model for simulation of the phenomenon of land subsidence.
These pioneering works revealed that 40% of the subsidence is
due to compression in the upper 50 m of soils, and the rest is
due to the soils below. Also, at that time, the maximum
subsidence was of the order of 0.05–0.10 m/year.
However, after the control measures for groundwater
pumping, the subsidence rate is claimed to have reduced,
and in 1988–1990 the rate was 0.03–0.05 m/year. It seems
that the subsidence bowl shifts in the Bangkok Plain from
location to location depending on the pattern of the extent of
groundwater withdrawal.
Test embankment with sand drains
on Bangkok–Siracha Highway
Eide (1977) reported the results of a test section on the
Bangkok–Siracha Highway as measured in 1966. The
ground condition along the route was considered to be very
soft. Sand drains of 0.2 m diameter were installed by the
displacement method. They were placed in a triangular
pattern at 2 m spacing. The observed settlement during a
two-year period after the construction is shown in Fig. 4.
Sand drains increased the rate of settlement, but not to a
sufficient degree. The most negative aspect quoted by Eide
(1977) was that, even though the sand drain accelerated the
151
�Balasubramaniam et al.
J
F
M
A
M
1966
J
J
A
S
O
N
D
J
F
M
A
M
J
8m
1967
J
A
S
15 m
Cross-sections
O
N
el. 3·5 el. 2·2
0
Settlement: cm
20
Soft
clay
Sand drains
40
60
80
100
120
D
8m
el. 1·3
4m
5m
9m
13 m
Stiff clay
No drain
s
4 m drain
s
6 m dra
ins
9 m dra
ins
13 m dra
ins
140
Fig. 4. Observed settlements on test section with sand drains at Bangkok–Siracha Highway (after Eide, 1977)
consolidation in the first 18 months, at the end of this period
the rate of settlement was still as much as 0.03 m/month,
which was considered to be high. Possibly because of the
low factor of safety, a substantial part of the total settlement
was due to continuous undrained creep without volumetric
strain, when the stress states were close to failure.
Test embankment with sand wicks at
the Royal Thai Navy (RTN)
dockyard, Pom Prachul, Thailand
Test embankment and soil profile
The performance of sand drains (sand wick type) at the
Naval Dockyard site, Pom Prachul, was investigated in 1975
by constructing an instrumented test embankment. The test
site is situated at the mouth of the Chao Phraya River in Samut
Prakarn province, approximately 20 km south of Bangkok city.
The embankment, which was built in two stages, was 90 m
long, 33 m wide, 2.35 m high, and consisted of three sections: a
section with no drains, a section with 2.5 m spacing, and a
section with drains at 1.5 m spacing (as shown in Figs 5(a) and
5(b)). The sand drains consisted of small diameter (0.05 m),
sand wicks and were installed to a depth of 17 m by the
displacement method. These sand wicks were constructed at
the site by pouring sand inside a permeable membrane. First a
closed-end steel casing, 75 mm internal diameter, was driven
into the ground; the sand wick was lowered into the casing,
which was then withdrawn. A total of 166 piezometers were
installed below the test fill area and outside it. Surface and
subsurface settlement points were installed to monitor the
settlement along the centreline and the edges of the test
embankment. Three hydrostatic profile gauges were installed,
one along each central cross-section of a test section. Also, 11
magnetic movement plates were used to monitor lateral
displacements along the gauge. Three inclinometer casings
were installed along the centreline of each test section. The
typical soil profile at the site is shown in Fig. 5(c).
Pore pressure measurements below the test
embankment
The loading pattern for the three test sections and the pore
pressure observations are shown in Fig. 6(a). Before con152
structing the test embankment a sand blanket of 0.35 m was
placed, and this corresponded to a surcharge pressure of
5.5 kN/m2 . Then the first stage of loading was carried out in
25 days with a fill height of 1.1 m and a surcharge pressure
of 19 kN/m2 . Thus at the end of the first stage of loading the
surcharge pressure was 24.5 kN/m2 . After a waiting period
of 60 days, the embankment was raised to 2.35 m (inclusive
of the 0.35 m sand blanket). The second-stage loading was
for a period of 1 month, and the observations were
continued for a total period of 10 months.
Piezometers P41, P27 and P13 located at 7.5 m depth in the
three sections indicated a consistent rise during the loading
phase and a drop in values during the waiting period and
under the time observed after the full surcharge. These piezometers measured the absolute values of the pore pressures,
and thus included the original groundwater pressure before
loading. As shown in Fig. 6(a), the static groundwater pressure
was observed from the observation well with hydrostatic
assumptions and no drawdown. The dummy piezometers
installed at a location far away from the test embankment and
without the influence of the sand wick and the surcharge gave
the static water pressure inclusive of any possible drawdown
due to deep-well pumping. At this site the piezometric drawdown starts only at a depth below 7.5 m, and so the
hydrostatic water pressures indicated by the observation well
and the dummy piezometers located at 7.5 m depth are more
or less coincident, indicating very small drawdown. Fig. 6(b)
illustrates the piezometric drawdown profile at this site.
All 166 piezometers were indicating consistent values of
pore pressure. However, the active piezometers installed at
depths of 10–15 m indicated that the piezometric drawdown
below the embankment is more or less erased by the sand
drain, which has recharged the drawdown area back to its
hydrostatic conditions. Thus at deeper depths the absolute
values of the piezometer readings under the embankments will
be a sum of the static water pressure without any drawdown
and the excess pore pressure induced by the surcharge loading.
In order to clarify the situation, additional piezometers were
installed along the centreline of the longitudinal section of the
test embankment from the northern edge corresponding to the
closely spaced sand drain section and also along the edge of the
eastern boundary of the test embankment (as shown in Figs 7a
and 7b). These figures indicate that at the edge of the
embankment, both in the north direction along the longitudinal
centreline and in the east direction along the centreline of the
�Deep-well pumping in the Bangkok Plain
18·0
33·8
CL
CL
CL
10·0
10·0
12·5
12·5
15·0
15·0
27·5
25·0
37·5
Sand drain spacing 1·5 m
Sand drain spacing 2·5 m
No sand drains
Legend: settlement gauges
Surface settlement
Depth 2·5 m ü Subsurface
Depth 5·0 m ý settlement
Depth 7·5 m þ points
Inclinometer
Hydrostatic profile
gauge with magnetic
plates
Piezometer
Depth 05 m
Depth .10
Depth 10·0 m
(a)
3·0 1·8
8·0
1·5
15·0
1·5 4·0 1·8 3·0
Second stage
First stage
0·35 Sand blanket
Permeable
membrane
0·005 Sand drains
el. 3·6
el. 2·7
el. 1·6
el. 1·25
Soft clay
17
Stiff clay
(b)
0
Water content Bulk unit Undrained shear Sensitivity
Cone
Atterberg limits: weight:
strength: kPa (vane tests) resistance: kPa
%
kN/m3
0
50 100 15015 18 10 20 30
3 4 5
500 1000 1500
Slightly weathered,
light brown clay
Depth below surface: m
Very soft, grey clay
5
10
Average from
12 Dutch cone tests
and standard deviation
Soft, grey clay with
pockets and seams
of sandy silt and
pockets of shell
fragments
Soft to medium soft,
dark grey clay with
silt seams and
shell fragments
Soft to medium soft,
greenish-grey clay with
loarge shell fragments
15
Medium soft, light
greenish grey clay with
numerous shell
fragments
Natural water
content
Liquid limit
Stiff yellowish-grey clay
Plastic limit
UU - tests
with ó3 5 óvo
Average strength
from 12 vane tests and
standard deviation
(c)
Fig. 5. RTN Dockyard site: (a) plan of test embankment; (b) elevation of test embankment (all dimensions in metres); (c) general properties of Pom Prachul
clay
north–south direction, there was no drawdown at 14 m
depths. In both directions the full drawdown was realised only
at distances of about 15–20 m away from the edges of the
embankment. This would indicate that having the three
sections side by side without any space in between them was a
grave mistake in planning the overall testing programme.
Ideally speaking, the three sections should be separated from
each other, with substantial allowance for the zone of influence
of the drains in recharging the drawdown area below the
embankment. This was observed in the final planning of the
test embankment with PVDs at the Second Bangkok International Airport (SBIA) site in the 1994–1995 studies. The three
test embankments at the SBIA site were separated from each
other, with substantial space between them.
Measured and computed settlements at
dockyard site
Settlement records from 47 active settlement plates have
been studied, and typical cases are plotted in Fig. 8. In this
153
�Balasubramaniam et al.
Days
Vertical stress: kN/m2
0
100
200
300
Start first stage
40
P41
30
20
Sand
drain
spacing
1·5 m
10
P13
P27
Sand
drain
spacing
2·5 m
Start second stage
No
sand
drain
0
Pore pressure: kN/m2
120
Depth 7.5 m
Dummy piezometer
Observation well
P13
P27
P41
100
Observation
well
80
Dummy
piezometer
60
0
100
0
Days
(a)
200
Pore pressure: kPa
50
100
300
150
0
Depth: m
24
28
Hydrostatic
pressure
Piezometric pressure
(24 May 1977)
212
Piezometric pressure
(20 October 1976)
216
(b)
Fig. 6. RTN Dockyard site: (a) typical piezometer readings; (b) variation of piezometric pressures with depth
figure the surface settlement at the centreline of the three test
sections is plotted with respect to time. Also shown in this
figure is the loading pattern with time in terms of the
surcharge stress (vertical stress increment). These settlement
records are in accordance with the pore pressure dissipation,
154
shown in Fig. 6(a). The section with closer drain spacing
showed higher settlements than the one with wider spacing
and the one with no drain. It has already been discussed that
the wider-spaced drain section was interfering with the nodrain section. Thus substantial lateral drainage would have
�Deep-well pumping in the Bangkok Plain
Pore pressure: kN/m2
140
0
Hydrostatic pressure
120
160
East
24
Drawdown
28
East
100
0
Pore pressure: kN/m2
40
80
120
212
80
Sand
drain
spacing
1·5 m
0
Sand
drain
spacing
2·5 m
5
No
sand
drain
Piezometer depth 14·0 m
East direction
10
15
Distance from embankment edge: m
20
216
25
(a)
Pore pressure: kN/m2
140
0
Hydrostatic pressure
120
0
Pore pressure: kN/m2
40
80
120
160
24
Drawdown
28
100
North
212
80
Sand
drain
spacing
1·5 m
0
Sand
drain
spacing
2·5 m
No
sand
drain
Piezometer depth 14·0 m
East direction
10
20
30
Distance from embankment edge: m
216
40
(b)
Fig. 7. Piezometric pressure against distance from edge of embankment at RTN Dockyard site: (a) east direction; (b) north direction
taken place in the no-drain section, owing to the influence of
the nearby adjoining drain section with wider spacing.
Using the elastic theory for increment in stresses below
the test sections and the undrained modulus from CK0 U
triaxial tests, immediate settlements were computed, and are
plotted in Fig. 9. It can be seen that very little immediate
settlement occurs below a depth of 11 m. The immediate
surface settlements under the first-stage loading and the
second-stage loading were computed to be 36 mm and
115 mm respectively. The total primary consolidation settlement under the embankment loading was calculated using
the stress–strain curves from oedometer tests. Fig. 10 shows
the variation of the primary consolidation settlement with
depth. In Fig. 10 the consolidation settlements were computed from six series of consolidation tests performed with
the Lever Arm Consolidometer, Anteus Consolidometer and
Bishop Consolidometer. In series SC seven tests were
conducted from 1 to 16 m with 24 h load increment duration
and load increment ratio of one. A similar series of tests was
conducted in the Anteus Consolidometer as Test Series AC.
The Bishop Consolidometer was used in test series BC, and
the load increment duration and ratio were similar to series
SC and AC. In test series SI, small load increments were
used in the Lever Arm Consolidometer to determine the
accurate determination of the preconsolidation pressure. The
measured settlements were in the drained section with 1.5 m
drain spacing. These data indicate that, even in the 1.5 m
drained section, the primary consolidation was not yet
completed.
From the observed settlement reading, the compression of
each 2.5 m layer within the no sand drain area and the two
sand drain areas was calculated and plotted against time.
This is shown in Fig. 11, and it can be seen that, for the top
5.0 m, the rate of settlement is faster for the 1.5 m spaced
sand drain area. However, below 5.0 m depth, no significant
improvement is noted with the use of sand drains.
The time rate of settlement was calculated according to
one-dimensional consolidation theory. The settlement of
2.5 m thick layers corresponding to the location of settlement
measuring points was considered. The maximum drainage
155
�Balasubramaniam et al.
Days
Vertical stress: kN/m2
0
100
200
300
Start first stage
40
S16
30
20
Sand
drain
spacing
1·5 m
10
S4
S10
Sand
drain
spacing
2·5 m
Start second stage
No
sand
drain
0
0
Settlement: cm
220
240
260
Surface settlement
S4
S10
280
S16
0
50
100
150
Days
200
250
300
Fig. 8. Typical settlement point readings at RTN Dockyard site
0
0
Settlement: cm
10
20
30
22
24
Depth: m
26
28
210
212
214
Stage I loading
Stage II loading
Fig. 9. Immediate settlement below embankment at RTN Dockyard site
156
path was taken as the effective radius of the sand drain
installation pattern. The sand drain installation follows a
rectangular pattern, and the effective diameters for the 1.5 m
spaced and 2.5 m spaced areas are 1.7 m and 2.83 m
respectively. The solutions derived by Schiffman (1958, 1960)
were used in calculating the degrees of consolidation. As a
first approximation, it was assumed that these solutions
were applicable, although the directions of settlement and
drainage were not the same.
Figure 12 shows a plot of settlement against time for the
2.5 m thick layers of soil in the 1.5 m spaced drain area. Also
plotted in the diagram are the settlements calculated as
explained above for different assumed values of cv . The
immediate settlement as calculated before has been added.
From the figures, it can be seen that for the top 2.5 m layer
of soil the observed settlements were very much greater than
those calculated during the first stage of loading. The greater
rate of settlement in the field may be due to the presence of
root holes (or fissures, etc.) near the surface, which form
shorter drainage paths to accelerate the consolidation process. However, after the second stage of loading, the
settlement curve, obtained using a cv value of 20 3
10 4 cm2 /s, was close to the observed value. Fig. 13 shows
the results for the 2.5 m spaced sand drain area. For the
layer between 2.5 and 5 m the computed settlement curve,
with a cv value of 20 3 10 4 cm2 /s, agreed fairly well with
the observed curve. For the layer between 5 and 7.5 m, a cv
value of 5 3 10 4 cm2 /s gave good agreement with the
measured settlements during the first stage of loading.
However, after the second-stage loading, the measured
values were very much greater than the predicted ones.
�Deep-well pumping in the Bangkok Plain
0
20
40
Settlement: cm
60
80
100
Time: days
120
0
2
4
100
Settlement: cm
8
10
12
Test series
AC
BC
SI
SC
Observed
14
Settlement: cm
6
cv 5 3 3 1024 cm2/s
Observed settlement
210
cv 5 10 3 1024 cm2/s
220
230
Depth: m
10
0
Settlement: cm
0
cv 5 20 3 1024 cm2/s
Depth 02·5 m
0
210
220
Observed settlement
cv 5 20 3 1024 cm2/s
Depth 2·55·0 m
0
cv 5 5 3 1024 cm2/s
210
220
Observed settlement
cv 5 10 3 1024 cm2/s
Depth 5·07·5 m
Fig. 12. Observed and calculated settlements (1.5 m-spaced sand drains
sections) at RTN Dockyard site
16
Time: days
Fig. 10. Consolidation settlement below embankment as calculated at RTN
Dockyard site
1
10
100
Time: days
1
10
100
Settlement: cm
0
Settlement: cm
225
25
215
Settlement: cm
225
25
215
Settlement: cm
Depth 2·55·0 m
1·5 m spacing
No drain
2·5 m spacing
0
210
Depth 5·07·5 m
No drain
1·5 m spacing
2·5 m spacing
0
25
210
215
Settlement: cm
Depth 7·510 m
2·5 m spacing
1·5 m spacing
No drain
0
25
210
215
Depth below 10 m
No drain
1·5 m spacing
2·5 m spacing
Fig. 11. Comparison of settlement–time records in sections with and
without drains at RTN Dockyard site
Settlement: cm
Depth 02·5 m
1·5 m spacing
No drain
2·5 m spacing
Settlement: cm
Settlement: cm
215
cv 5 20 3 1024 cm2/s
220
230
25
Observed settlement
210
Depth 02·5 m
0
Observed settlement
210
220
cv 5 20 3 1024 cm2/s
Depth 2·55·0 m
0
cv 5 10 3 1024 cm2/s
cv 5 5 3 1024 cm2/s
210
Observed settlement
220
Depth 5·07·5 m
Fig. 13. Observed and calculated settlements (2.5 m-spaced sand drains
sections) at RTN Dockyard site
The major lesson learnt from this trial embankment was
that the sand wick drains had recharged the zone that was
originally under piezometric drawdown. Thus for the
bottom layer of the soft clay the recharging would have
resulted in a decrease in the effective stress, and this is the
reason why the settlements were smaller below the upper
5 m, where there was no drawdown before. Also, the
recharging zone seems to extend laterally up to a distance
of about 15 m, and so the no-drain section would have been
influenced by the drained section. It would therefore have
been better to have had three separate sections spaced out
in such a manner that there was minimum interference,
and the data from each embankment truly represented a
no-drain section and the sections with the wider and
narrower spacing of drains.
157
�Balasubramaniam et al.
Test embankments at the SBIA site
applied in three stages. Although difficulties were encountered in maintaining the vacuum load as well as the groundwater lowering, the embankment surcharge was found to be
a reliable technique when compared with vacuum loading in
accelerating the consolidation with sand drains. The settlement observations are presented in Figs 14 and 15 as taken
from Moh and Woo (1987). The field trial was not successful
in the sense that: (a) there was a settlement of 0.4 m under a
sand blanket of 0.7 m after a five-month period, and (b) the
settlement across the section was remarkably asymmetric.
The observations indicate the possibility of hydraulic connections between the sand drains and the first sand layer located
at 25 m depths with a piezometric drawdown of 120 kN/m2 .
It appears that sand wicks (as used at the Naval Dockyard
site) recharged the piezometric drawdown in the clay layer,
while the large-diameter sand drains (like those used in the
airport site in 1983) tended to form hydraulic connections
with the underlying aquifer and caused additional settlements due to the piezometric drawdown.
At the SBIA site in Nong Ngu Hao, the most extensive sand
drain studies on test embankments were performed in 1983
(Moh and Woo, 1987) as part of the ground improvement
scheme for the runway pavement and other sections of the
taxiways and landside roads. Sand drains of minimum
diameter 0.26 m were installed to a depth of 14.5 m by water
jetting. The test programme included three test areas: one
with surcharge fill, a second with vacuum loading, and a
third with groundwater lowering. Test section 1 was 40 m 3
40 m in plan, and sand drains were installed at 2 m spacing
in a triangular pattern. The vacuum load was not successful,
as several leaks developed, and finally the section was
covered with a plastic shield. Test section 3 was similar to
Test section 1, except that the spacing of the drains was
increased to 2.4 m. Because of similar problems as in section
1, the loading was not successful. Test section 2 was slightly
larger than test section 1, and preloading of 60 kN/m2 was
Surcharge
loading:
kN/m2
J. 83
60
40
20
0
A.
S.
O.
N.
D.
J. 84
F.
M.
A.
M.
J.
J.
A.
S.
O.
Sand drains
installation
0
30
60
90
120
150
180
210
240
270
300
330
360
390
420
(Day)
20
SS 221
SS 202
40
Settlement: cm
60
80
N
SS 204
100
120
140
SS 221
SS 204
160
SS 202
Fig. 14. Observed settlements for test embankment with sand drains at SBIA (Moh and Woo, 1987)
Surcharge
loading:
kN/m2
J.¢ 83
60
40
20
0
0
A.
S.
O.
N.
D.
J.¢ 84
F.
M.
A.
M.
J.
J.
Settlement: cm
60
80
100
120
30
60
90
120
150
180
210
240
270
300
330
360
390
H
G
W
E
B(10·100 m)
C(21·434 m)
D(22·951 m)
E(24·515 m)
F(26·036 m)
G(27·579 m)
H(210·647 m)
S G 22
Fig. 15. Vertical settlements of soil layers for test embankment with sand drains at SBIA (Moh and Woo, 1987)
158
S.
O.
Sand drains
installation
20
40
A.
F
E
D
C
B
420
(Day)
�Deep-well pumping in the Bangkok Plain
Test embankment with PVDs at the
SBIA site
the spacing was 1.5, 1.2 and 1.0 m in the three embankments
TS1, TS2 and TS3 respectively.
From the previous trials, it become evident that the
engineers in Bangkok were rather cautious of the potential
use of vertical drains in the Bangkok Plain, and the client—
that is, the Airport Authority of Thailand—insisted that the
1994–1995 study must indicate beyond all doubt that most
of the settlement experienced in the trial embankment was
of the consolidation type, to indicate the removal of water
from the soft clay to improve its strength characteristics as
well as to ensure that there were no possible hydraulic
connections between the PVDs used and the underlying
sand stratum, which was experiencing substantial piezometric drawdown. These objectives were to be met by
estimation of the degree of consolidation, both from direct
measurement of the settlements and from observation of the
pore pressure dissipation in the field. Further, in-situ tests
were conducted with a vane apparatus to measure the insitu strength increase with the water content reduction from
the consolidation due to the use of PVDs and surcharge.
Additionally, the rate of settlement with time needed to be
plotted to indicate that the final settlement rate was comparable to that which one would consider acceptable at a rate
similar to those experienced in secondary consolidation, and
not of higher values corresponding to hydraulic connections.
The plan dimensions of the embankments were the same
as in the earlier study. The locations of the test embankments and the cross-section of embankment TS3 with PVDs
are shown in Figs 16 and 17 respectively. These embankments were fully instrumented to measure the surface and
subsurface settlements and pore pressures, lateral movements and heave. PVDs were installed to 12 m depth, and
90
Existing dyke
90
Settlement and pore pressure plots
All three test embankments performed more or less in the
same manner, and therefore detailed discussion will be
based on only one (test embankment TS3 with PVD spacing
at 1 m intervals). For this embankment the settlement profile
with depth and the pore pressure plots at various times are
shown in Figs 18 and 19. Fig. 18 shows the settlement
profiles at the end of construction (270 days), after 450 days
(June 1995) and after 660 days (February 1996).
Settlements were also independently computed from
actual pore pressure dissipation. In Fig. 19, the dotted curve
ABC represents the actual piezometric profile with drawdown as observed in September 1994, prior to the construction of the embankment. The full curve DEF corresponds to
the pore pressure profile after the full height of the
embankment was reached with a surcharge of 75 kPa, but
prior to any pore water pressure dissipation. The pore
pressure profile at the end of construction is also shown.
Similarly the pore pressure profiles in June 1995 and in
February 1996 are also shown. The final pore pressure after
the dissipation of the excess pore pressure and the recharged
hydrostatic profile is MNPQ (NPQ is the assumed final
recharged pore pressure profile, where there are no data
points). Settlements were directly computed from these pore
pressure dissipation curves.
The degrees of consolidation computed from the pore
pressure dissipations are illustrated in Fig. 20. Fig. 21
compares the degree of consolidation as computed from
settlement measurements with those estimated from the
pore pressure dissipation. In Fig. 21, the ordinate axis Up
refers to the degree of consolidation as computed from the
pore pressure dissipation, and the abscissa axis refers to the
degree of consolidation Us , as computed from the settlement
measurements. With due allowance for a small percentage
of secondary settlement and creep, the two degrees of
consolidation seem to agree well, as they are close to the 458
line. Because of limitations in the length of the paper, the
data related to the lateral movements are not presented here.
The settlement due to the lateral movements was less than
10% as estimated by the method of Loganathan et al. (1993).
The rate of settlement and the rate of lateral movement are
plotted in Figs 22 and 23, and are seen to decay with time.
Also, the plots of settlement log time plots in Fig. 24 for the
test embankments were found to be approaching a constant
Dyke
Side drain
TS1
Dyke
40
TS2
40
40
TS3
Dummy
area
Dyke
Side drain
Existing dyke
Dyke
Existing dyke
Dyke
240
Fig. 16. Site plan of test embankments TS1, TS2 and TS3 at SBIA site
3
1
4·2 m
Sand fill
Sand blanket
2·7 m
0·5 m
1·0 m
12·0 m
PVD
1·0 m
spacing
(square pattern)
40·0 m
Fig. 17. Test section TS3 showing PVDs at SBIA site
159
�Balasubramaniam et al.
0
0
TS3
June 1995
2
End of construction
Feb. 1996
24
Depth: m
4
Depth: m
6
Calculated final primary settlement
(dotted line)
8
28
212
10
EOC (end of construction)
June 1995
Feb. 1996
12
216
14
0
16
40
80
Degree of consolidation: %
Fig. 20. Degree of consolidation from measured pore pressure at SBIA site
0
20
40
60
80 100 120 140 160 180 200
Settlement: cm
shown, as they would crowd closely with the data from the
other two embankments. The final portions of the test data
for the two embankments seem to approach the secondary
consolidation part as computed from the plots of Casagrande settlement against log time. These results further
confirm that the PVDs did not cause any hydraulic connection with the lower aquifers, and the measured final
settlement is of the same order as the secondary settlement.
Fig. 18. Settlement plot of test embankment with PVD at SBIA site
slope. An attempt was made to define the 100% primary
consolidation time using plots of Casagrande-type settlement against log time. The points P and Q in Fig. 24
correspond to the 100% primary consolidation for test
sections TS3 and TS1 respectively. The data for TS2 are not
0
A
D
TS3
Increase of total stress
M
2
4
Feb. 1996
June 1995
EOC
Depth: m
6
E
8
B
10
N
12
Feb. 1996
End of construction (EOC)
21 June 1995
ABC 5 Dummy, Sept. 1994
DEF 5 Pore pressures after 75 kPa surcharge
MNPQ 5 Assumed final pore pressures
AL 5 Max. hydrostatic
14
16
0
20
40
P
C
60
80
100
Total pore pressure: kPa
Fig. 19. Pore pressure profile of test embankment with PVD at SBIA site
160
120
Q
F
120
140
L
160
�Deep-well pumping in the Bangkok Plain
100
Up - Determined from pore pressure dissipation
Us - Determined from settlement measurement
Time: days
1000
100
0
80
10 000
TS3
TS1
TS1
Settlement: cm
240
Up : %
60
40
TS3
280
2120
Q
2160
P
2200
20
Fig. 24. Settlements against log-time plot for embankments TS1 and TS3 at
SBIA site
TS1
TS2
TS3
0
0
20
40
Us: %
60
80
100
Fig. 21. Degree of consolidation computed from pore pressure dissipation
and settlement measurements at SBIA site
Finally, the increase in shear strength with time after
consolidation in the field was measured with the vane
apparatus, and is plotted in Fig. 25.
20
Conclusions
Full-scale test embankments were constructed at three
sites in the Bangkok Plain to explore the feasibility of using
surcharge with vertical drains as a means of ground improvement in the underlying soft clay. The aquifer system
Rate of settlement: cm/month
16
12
0
8
10
Vane shear strength: kPa
20
30
40
50
0
4
25
1
0
0·16
0·12
0·08
Inverse time: 1/month
0·04
May 1995
24
0
Fig. 22. Rate of settlement against inverse time plot at SBIA site
March 1996
Depth: m
Rate of lateral displacement: mm/month
40
30
28
Before construction
(average)
20
212
Measured
Feb 1994
10
Aug 1994
Nov 1994
May 1995
0
0·16
0·12
0·08
Inverse time: 1/month
0·04
0
Fig. 23. Rate of lateral movement against inverse time plot at SBIA site
216
Mar 1996
Fig. 25. Field vane shear strength as measured in embankment TS3 at SBIA
site
161
�Balasubramaniam et al.
below the Bangkok Plain is undoubtedly very complex
(eight interconnected and leaky aquifers are identified,
ranging in depth from 20 m to 530 m) and the thickness of
the sedimentary deposit varies from 550 m to 2000 m.
Extensive deep-well pumping has caused very large piezometric drawdown, and there is continuous surface subsidence. From the data gathered, the following conclusions
can be reached:
(a) The test embankment studied by Eide (1977) was on
very soft clay: the use of 0.2 m sand drains would have
disturbed the underlying very soft clay, and substantial
undrained creep would have influenced the settlement
rate. Also, no indication was given as to the effect of
subsidence due to groundwater withdrawal.
(b) The study in 1975–1977, related to the test embankment
at the Royal Thai Navy Dockyard in Pom Prachul,
Bangkok, had three distinct sections, one with closer
sand wick spacing of 1.5 m, one with wider spacing of
2.5 m, and one with no drains. Pore pressure measurements below the test embankment and in its neighbourhood indicated that the sand wicks had recharged the
zone of piezometric drawdown below a depth of 7.5 m,
and also had a recharging influence to a distance of 15–
20 m from the edges of the drained section. This
resulted in the no drains section having a substantial
degree of drainage. Also, the surcharge used in the test
embankment was not sufficiently higher than the preconsolidation pressure of the soft clay at this site.
(c) The 1983 test embankments at the SBIA site indicated
that the method of vacuum drainage was not successful,
because of several leaks, and because of the difficulty of
maintaining the vacuum pressure continuously for a
long time. Also, the test embankment with vertical
drains indicated possible hydraulic connections with the
underlying sand aquifer.
(d) The 1994–1995 studies conducted at the SBIA site on
test embankments with surcharge and PVDs were found
to be most successful as the ground improvement
technique to strengthen the engineering properties of
the soft clay with the removal of water by consolidation
settlement. The settlements computed from pore pressure dissipation agreed with those computed from the
direct settlement measurements, as well as the strength
increase observed with time as the consolidation of the
soft clay progressed with time. The lateral movements
(though not discussed here) were found to contribute
less than 10% of the total vertical settlement. The rates
of settlement decay and lateral movement decay were
also analysed to confirm that the primary consolidation
phase had indeed completed during the preloading
period.
Acknowledgements
The work presented in this paper relates to the research
work conducted by the first author over a period of 27 years
at the Asian Institute of Technology as sponsored research
projects and graduate thesis research work. The close collaboration that the first author enjoyed, with several discussions
with the late Ove Eide of the Norwegian Geotechnical
Institute, and with former colleagues Dr Za-Chieh Moh, Dr
E. W. Brand and Professor Prinya Nutalya, is gratefully
acknowledged. The Royal Thai Navy and the Airport
162
View publication stats
Authority of Thailand are thanked for engaging the first
author and his team in carrying out the elaborate full-scale
field tests and the interpretation of the data presented in this
paper. The first author is also most grateful to the large
number of Masters students and research associates at AIT,
who helped him in carrying out the work presented in this
paper for a 27-year period.
References
AIT (1978a) Investigation of Land Subsidence Caused by Deep-well
pumping in Bangkok Area. Asian Institute of Technology, Bangkok, GTE Internal Research Report (Phase I Progress Report).
AIT (1978b) Investigation of Land Subsidence Caused by Deep-well
pumping in Bangkok Area. Asian Institute of Technology, Bangkok, GTE Internal Research Report (Phase I Final Report).
AIT (1981) Investigation of Land Subsidence Caused by Deep-well
pumping in the Bangkok Area. Asian Institute of Technology,
Bangkok, Internal Research Report.
Brand E. E. and Paveenachana T. (1971) Deep-well pumping and
subsidence in the Bangkok area. Proceedings of the 4th Asian
Regional Conference on Soil Mechanics and Foundation Engineering,
Bangkok, 1, 1–7.
Brand E. W. and Balasubramaniam A. S. (1976) Soil compressibility and land subsidence in Bangkok. Proceedings of the
International Symposium on Land Subsidence, Anaheim, CA, pp.
365–374.
Cox J. B. (1968) A Review of the Engineering Characteristics of the Recent
Marine Clays in Southeast Asia. Asian Institute of Technology,
Bangkok, Thailand, Research Report No. 6.
Eide O. (1968) Geotechnical Engineering Problems with Soft Bangkok
Clay on the Nakhon Sawan Highway Project. Norwegian Geotechnical Institute, Oslo, Publication No. 78.
Eide O. (1977) Exploration, sampling and insitu testing of soft clay
in the Bangkok area. Proceedings of the International Symposium
on Soft Clay, Bangkok, pp. 122–137.
Loganathan N., Balasubramanaim A. S. and Bergado D. T.
(1993) Deformation analysis of embankments. Journal of Geotechnical Engineering, ASCE, 119, No. 8, 1185–1206.
Moh Z. C. and Woo S. M. (1987) Preconsolidation of Bangkok clay by
non-displacement sand drains and surcharge. Proceedings of the
9th Southeast Asian Geotechnical Conference, Bangkok, 1, 287–296.
Moh Z. C., Nelson J. D. and Brand E. W. (1969) Strength and
deformation behaviour of Bangkok clay, Proceedings of the 7th
International Conference on Soil Mechanics and Foundation Engineering, Mexico City, 1, 287–295.
Muktabhant C., Teerawong P. and Tengamnuay V. (1967)
Engineering properties of Bangkok subsoils. Proceedings of the
Southeast Asian Conference on Soil Engineering, Bangkok, 1, 1–7.
Paveenchana T. (1970) The Effect of Deep-well pumping on Land
Subsidence in Bangkok Area. MEng thesis, Asian Institute of
Technology, Bangkok, Thailand.
Premchitt J. (1981) A technique in using integrodifferential equation for model simulation of multiaquifer systems. Water
Resources Research, 17, No. 1, 184–193.
Ramnarong V. (1983) Environmental impacts of heavy groundwater development in Bangkok, Thailand. Proceedings of the
International Conference on Groundwater and Management, Sydney,
Vol. 2, pp. 345–350.
Ramnarong V. and Buapeng S. (1991) Mitigation of groundwater
crisis and land subsidence in Bangkok. Journal of Thai Geoscience.
2, 125–137.
Schiffman R. L. (1958) Consolidation of soil under time dependent
loading and varying permeability, Proceedings of the Highways
Research Board, No. 27, 584–617.
Schiffman R. L. (1960) Field application of soil consolidation, time
dependent loading and varying permeability. Highways Research
Board Bulletin, No. 248.
Discussion contributions on this paper should reach the
editor by 1 February 2006
�
 Dennes Bergado