688-692
Br. J. Cancer (1989), 60,
60, 688-692
Br. J. Cancer (1989),
()
C
The Macmillan Press Ltd, 1989
The
Macmillan
Press
Effect of hormonal manipulation and doxorubicin administration on cell
cycle kinetics of human breast cancer cells
M. Bontenbal, A.M. Sieuwerts, J.G.M. Klijn, H.A. Peters, H.L.J.M. Krijnen, P. Sonneveld' &
J.A. Foekens
Divison of Endocrine Oncology (Biochemistry and Endocrinology), The Dr Daniel den Hoed Cancer Centre, PO Box 5201, 3008
AE Rotterdam, The Netherlands; and 'Department of Haematology, University Hospital Rotterdam, Dijkzigt, Dr Molewaterplein
40, 3015 GD Rotterdam, The Netherlands.
Summary Dual-parameter flow cytometry, following bromodeoxyuridine (iL dUrd) incorporation and propidium iodide (P1) uptake into DNA, was used to study the effects of oestradiol and/or insulin on cell cycle
kinetics of human breast cancer cells in vitro. After a lag-period of 6-12 h, an )ptimum in the percentage of
S-phase cells was reached between 18 and 24 h after hormone administration. A 1 h pulse of oestradiol was as
effective as the continuous presence of oestradiol in pushing the cells from quiescent growing cultures into the
cell cycle. A I h pulse of insulin was less effective than continuous administration. The addition of doxorubicin
resulted in an accumulation of the cells in the late S/G2M-phases. It is concluded that dual-parameter flow
cytometry allows accurate assessment of the effects of hormones and chemotherapy on the cell cycle. Therefore
this method is very suitable for studying the interaction of hormones and chemotherapy on cell growth.
Slowly proliferating tumours like breast cancer are in general
less sensitive to the lethal effects of cytotoxic drugs than
rapidly proliferating malignancies. One of the explanations
for this relative insensitivity can be kinetic resistance
(Osborne, 1981). Growth stimulation of slowly growing
breast tumour cells in vitro, followed by cell cycle active
chemotherapy, results in an augmented cytoxic effect of the
chemotherapeutic drug (Weichselbaum et al., 1978; Clarke et
al., 1985; Hug et al., 1986; Bontenbal et al., 1988). This
recruitment concept has been clinically applied with diverse
results (Allegra, 1983; Lippman et al., 1984; Paridaens et al.,
1987; Conte et al., 1987; Lipton et al., 1987). However, little
is known with respect to optimal conditions for selection and
scheduling of growth stimuli and cytostatics. Studies using
cell cultures may provide valuable information for designing
future treatment protocols in line with the recruitment principle. These studies require an accurate method to determine
the number of cells in the distinct phases of the cell cycle, the
duration of the cell cycle and the effects of growth stimuli
and chemotherapeutic agents thereon. A commonly used
method to establish the DNA distribution in cells involves
the uptake of propidium iodide (PI). A major disadvantge of
this rapid and reproducible method is that advanced
mathematical models are needed to estimate approximately
the percentages of the cells in the separate phases of the cell
cycle. Moreover, after partial synchronisation of cells by
growth arrest and subsequent stimulation, the amount of
cells appearing in the early S-phase will remain undetected
when using models based on a Gaussian distribution of cells.
These disadvantages are circumvented by a dual-parameter
flow cytometric method involving BrdUrd-incorporation and
PI-uptake (Gray et al., 1986). We have studied recruitment of
growth-delayed MCF-7 human breast cancer cells into the
cell cycle after oestradiol and/or insulin administration, and
the cytokinetic effects of doxorubicin administration thereon.
Materials and methods
Cell culture
The MCF-7 cell line was obtained from E.G. & G. Mason
Research Institute (Worcester, MA, USA) in its 219th passage. Cells were grown in a humidified atmosphere of 5%
CO2 in air at 37°C in complete growth medium (RPMI-1640
Correspondence: M. Bontenbal.
Received 2 February 1989; and in revised form 21 June 1989.
medium containing 5 tLg ml-1 phenol red, supplemented with
10% heat-inactivated (30 min at 56°C) fetal calf serum
(FCS), 100 Uml-' penicillin, 100 igml-1 streptomycin, 50
pgml-' gentamycin and 10 sgml1' porcine insulin). For
experiments, logarithmically growing cell cultures were trypsinised and seeded in T25-flasks at a density of 0.5 x 10⁶ cells
per flask, in experimental medium, i.e. RPMI-1640 medium,
without phenol red and insulin, supplemented with
antibiotics and 4.5% steroid hormone depleted FCS
(obtained by treatment twice with 0.5% charcoal, 0.05%
dextran T-70 (w/v) for 45 min at 50°C, and an intermediate
2 h incubation at 37°C with 2 U ml' of sulphatase). Cells
were precultured for 2 days. Experimental medium without
additions (control), or supplemented with 0.03, 0.5 or 1.0 nM
oestradiol (Merck, Darmstadt, FRG), 1.7 IlM porcine insulin
(Organon BV, Oss, The Netherlands), or the combination of
1 nM oestradiol and 1.7IM insulin, was added to the cell
cultures. Medium was renewed every day unless indicated
otherwise in the legends to the figures. In experiments studying the effects of doxorubicin (Adriablastina; Farmitalia,
Milan, Italy), medium containing 0.2 yg ml-' doxorubicin +
1 nM oestradiol was added for 6 h to the cultures, which had
been pretreated for 15 h with medium containing 1 nM oestradiol, i.e. the stimulated cultures. In the control groups the
same procedure was used but without oestradiol addition.
After two washes after doxorubicin incubation, the cells were
allowed to continue growth in complete growth medium.
Medium was renewed every 48 h.
Cell harvest
Thirty minutes before harvesting, BrdUrd (Serva, Heidelberg,
FRG) was added to the monolayer cultures (final concentration of 10 ^lM) and incubated at 37°C in 5% CO2 in air. Cells
were washed twice with phosphate buffered saline (PBS) and
were harvested by a 5 min incubation at 37°C with 0.5 ml
trypsin/EDTA) 0.05/0.02%; Biochrom, Berlin) in 2 ml PBS,
and addition of 1 ml trypsin inhibitor (0.1 mg ml-'; Sigma,
St Louis, MO, USA) in PBS. An aliquot of the cell suspension was collected for cell count using a haemacytometer,
and the remainder of the cells were pelleted at 100g for
5 min, resuspended in 100 gsl PBS, fixed for 30 min at 0°C
with 2 ml 70% ethanol (- 20°C), and stored at
20°C
before preparation for analysis by flow cytometry.
-
Flow cytometry
Labelling and staining procedure (anti-BrdUrd FITC/
PI) Fixed cells were pelleted for 5 min at 100 g, incubated
�CELL CYCLE KINETICS OF BREAST CANCER CELLS
with 2 ml of 4 M HCI for 20 min at 18°C, and after centrifugation the nuclei were incubated for O min at 0°C, in
0.5 ml 0.1 M phospate buffer (pH 4.5), containing 0.1
mg ml' pepsin (Sigma, St Louis, MO, USA). The nuclei
were pelleted and washed with 2 ml 0.1 M borate buffer (pH
8.5). Following centrifugation the nuclei were incubated for
30 min at 0°C with a 1:20 dilution of Anti-BrdU-FITCconjugated (Becton & Dickinson, Mountain View, USA) in a
final volume of 100 yl PBS containing 0.25% Tween-20, and
5% bovine serum albumin (BSA), spun down after addition
of 2 ml 0.5% Tween-20 in PBS, and incubated for 10 mini at
0'C in 2 ml PBS containing 0.25% Tween-20 and 10 fig ml-'
PI. Pelleted nuclei were resuspended in 0.5-1.0 ml PBS containing 0.5% Tween-20 and were analysed by flow cytometry.
Measurement of FITC- and PI-fluorescence
The FITC- and PI-fluorescence of individual nuclei were
measured using a Becton and Dickinson (Sunnyvale, CA,
USA) fluorescence-activated cell sorter (FACS 440). In the
FACS 440 system the nuclei traversed the light beam of a
Spectra-Physics 5-W Argon laser tuned at 488 nm, 0.4 W.
Emitted light passed a 560 nm dichroic beam splitter. Excitation and emission wavelengths of FITC and PI were 494/517
and 540/625 nm, respectively. Green (FITC) fluorescence was
measured through a 530/30-nm band-pass filter and red (PI)
fluorescence through a KV 550 cut-off filter. Emitted light
was registered at a photomultiplier. Signals were amplified
linearly. The instrument was calibrated with 1.0 and 2.83 jtm
diameter fluorescent standard beads (Polysciences Inc., Warrington, PA, USA). Cell debris was excluded from analysis by
elevating the threshold of the red fluorescence. The flow rate
was set at 500-1000 nuclei s'. For each sample at least 104
cells were analysed.
Data analysis was performed using a Hewlett Packard 68B
system. PI-fluorescence was recorded as a histogram of
fluorescence intensity. From this histogram the percentage of
nuclei in the different phases of the cell cycle was estimated
with graphical methods and a fitting method (SFIT) using
mean fluorescence (Dean, 1987). Cell cycle distribution after
labeling with anti-BrdUrd FITC and PI was performed using
the windowing technique. Windows were set around the
regions of GOG,/S/G2M-phase cells in the dot plots (Dean,
1987).
Results
The cell cycle distribution of MCF-7 cells in culture was
established by analysis of DNA distribution using PI-uptake
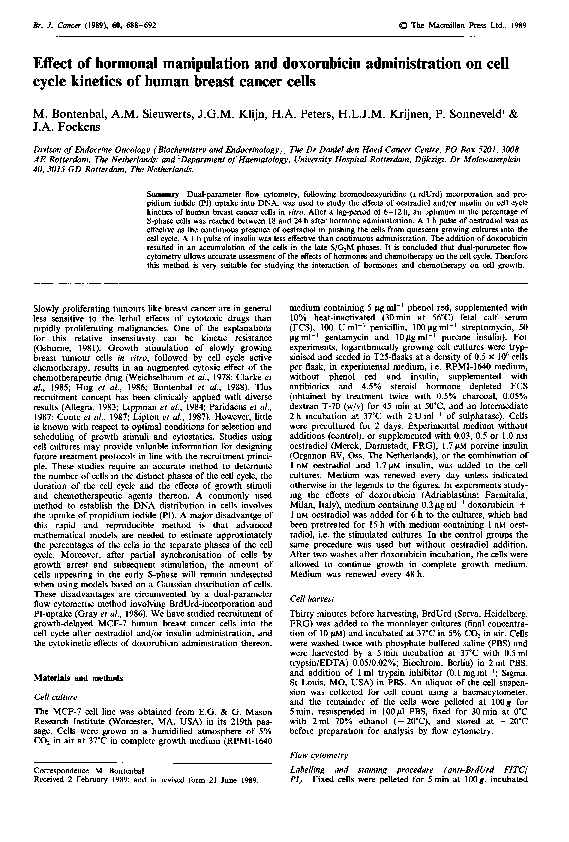
and by dual-parameter flow cytometry. The histogram obtained
after PI-uptake in nuclei of MCF-7 cells 12 h after a 1 h pulse
with 30 pM oestradiol is shown in Figure la. The CV of the
GOG,-peak was 4.5%. By dual-parameter flow cytometry it is
shown that of the total amount of cells present in the S-phase
(35%), a high proportion is actually in the early S-phase (Figure
lb), cells which were not detected when only PI-uptake was
used. Analysis of the DNA histogram (Figure la) by graphical
and a 'simple' fitted method to assess the percentage of S-phase
cells resulted in an underestimation of the amount of cells in
S-phase. Depending on the methods used (Dean, 1987),
16- 29% of the cells were observed in S-phase. Even
sophisticated mathematical programs will result in an
underestimation of the amount of S-phase cells, because these
cells are hidden under the GOG,-peak. Moreover, by analysis of
DNA histograms obtained with PI-fluorescence only, no
discrimination can be made between cells which are arrested in
the S-phase and cells which are actively synthesising DNA. For
reasons mentioned above, the PI-method is not appropriate to
study accurately changes in cell cycle kinetics resulting from
perturbation with cell cycle active cytotoxic agents. We have
therefore applied the method of dual-parameter flow cytometry
with PI and Anti-BrdUrd FITC to study cell cycle kinetics of
MCF-7 breast cancer cells and the effects of growth-stimulating
hormones and doxorubicin thereon.
689
GoG,
0)
.0
E
=
0
.CD
cc
Red fluorescence (DNA content)
h
a1)
c
0
-0.
'a)
Ea)
U1)
(1)0
'I)
01)
0
Red fluorescence (DNA content)
Figure 1 Cell cycle distribution of MCF-7 cells. Cells were
harvested 12 h after a 1 h pulse with 30 pM oestradiol. a, Histogram of DNA, propidium iodide (PI) uptake, indicated by red
fluorescence only. b, Dual-parameter flow cytometry with PI(x
axis) and anti-BrdUrd FITC fluorescence (y axis). Cells in the
marked area represent cells actively synthesising DNA, i.e. cells
in S-phase. (White spot below the marked area on the left side
represents GOG,-phase cells, and the white spot on the right side
represents G2M-phase cells.) The GOG,-peak in histogram a corresponds with the left white spot in b plus the cells in early
S-phase lying in-line above this white spot.
Growth of MCF-7 cells which were seeded and maintained in
medium deprived of steroid hormones was remarkably
decreased. The amount of cells in the S-phase of the cell cycle
declines from 30-40% at the time of seeding to approximately
10-15% at the start of the experiment, i.e. time point zero.
Figure 2 shows by dot plots the wave of cells going into S-phase
after oestradiol administration. Figure 3a shows the kinetics of
accumulation of cells in the S-phase as a result of stimulation
(for up to 26 h) with 1 nM oestradiol, 1.7 ftM insulin and the
combination of both hormones. After a lag period of about
6-12 h (as also concluded from additional experiments, data
not shown), the percentage of cells in the S-phase augments
rapidly with an optimum between 18 and 24 h after addition of
hormones. Stimulation with insulin mimics the pattern obtained
by oestradiol treatment, whereas the combination of both
hormones shows a minor (9%) but significant (Wilcoxon,
2P< 0.05) additional effect. However, this small additional
effect regarding the percentage of cells in S-phase after 24 h did
not result in an increase of cell number after 72 h. The maximal
increase in the percentage of cells in the S-phase occurred 24 h
after start of stimulation. A decline in the percentage of S-phase
cells was observed after 24 h. In subsequent experiments we
observed that this decline occurred irrespective of a medium
change 2 h after reaching maximal stimulation. In cultures
treated with oestradiol for 1 h (data not shown) or 26 h (Figure
3a), followed by incubation in the absence of oestradiol, a
�690
M. BONTENBAL et al.
-
E2
E2
6h
12 h
0)
0
C-)
18 h
0
m
D
m
24 h
c
30 h
36 h
PI
fluorescence
Figure 2 Cell cycle distribution of MCF-7 cells, measured by dual-parameter flow cytometry 6-36 h after start of stimulation with
1 nM oestradiol (E2) compared to controls. The left column shows a clear increase in cells in S-phase, especially 18 -24 h after
oestradiol administration. For detailed information see: the method section and the legend to Figure 1.
-
second wave of S-phase cells, starting after 36 h from time point
zero, was observed. This second wave was not observed after
preincubation with insulin only. Figure 3b shows the growth
curves. Twenty-four hours after hormone addition the amount
ofcells per flask appeared identical in both the stimulated and in
the control groups. This implies that the increase in the
percentage of cells in S-phase during this time period is due to
recruitment of cells of these quiescent growing cultures into the
cell cycle, and not to an increase in cell number due to a
subpopulation of rapidly proliferating cells. The pattern (as
shown in Figure 3a for 1 nM oestradiol) and extent of
stimulation were identical for lower dosages of oestradiol (0.03
and 0.5 nM used (data not shown). In addition, a short 1 h pulse
of 1 nM oestradiol resulted in a similar stimulatory effect after
the pulse compared to the continous presence of oestradiol (at
21 h, 60 vs 60%, and at 30 h, 38 vs 36% cells in S-phase). In
contrast a 1 h pulse of insulin was not as effective as the
continous administration (Table I).
In separate experiments the effects of doxorubicin were
studied. The presence of doxorubicin during the last 6 h of a
21 h incubation with or without 1 nM oestradiol did not affect
the amount of S-phase cells at 21 h (Table II). However, after
the subsequent addition of complete growth medium at 21 h, the
S-phase cells. in the doxorubicin treated cultures completely
accumulated in the late S- and G2M-phases, measured 2 (Figure
4) and 5 days (Table II) later. After 5 days 59% of the oestradiol
stimulated cells were accrued in the late S/G2M-phases and 34%
of the cells in the unstimulated controls. The accumulation of
doxorubicin treated cells in the late S/G2M-phases of the cell
cycle has also been described for lymphoblasts (Krishan & Frei,
1976).
�CELL CYCLE KINETICS OF BREAST CANCER CELLS
a
&I A
6u
Discussion
-
Kinetic resistance can be one of the explanations why slowly
growing tumours like breast cancer fail to respond to cytotoxic
therapy (Osborne, 1981). Preclinical research has shown that
growth of breast tumours can be accelerated by several
hormones and growth factors. Theoretically this growth
stimulation can be used to recruit quiescent cells into the cell
cycle, rendering them more vulnerable to the letal effects of
concomitant cytotoxic drugs. In vitro studies indicated that the
combination of growth stimulation and cytotoxic therapy can
lead to an enhanced cell kill in breast cancer (Weichselbaum et
al., 1978; Clarke et al., 1985; Hug et al., 1986; Bontenbal et al.,
1988). Several clinical studies already make use of this concept
of recruitment. Most of the studies report a higher complete
remission rate and/or a longer survival (Allegra, 1983;
Lippman et al., 1984; Paridaens et al., 1987; Conte et al., 1987).
Little is known, however, about the optimal duration, scheduling and dosages of this hormono-chemotherapy, and about the
effect of this combined modality on cell cycle kinetics.
In order to establish the magnitude of cytokinetic resistance
in the treatment of breast cancer and to investigate optimal
conditions to overcome this phenomenon, accurate
measurement of changes in cell cycle kinetics due to therapy
must be available. DNA histograms obtained with
PI-fluorescence are widely used for the study of cell cycle
kinetics. In this study we have shown that using this method the
amount of (semi-) synchronised cells which appear in the early
S-phase of the cell cycle after growth stimulation is
underestimated when graphical or simple fitting methods are
used to establish the amount of S-phase cells. When there is a
non-Gaussian distribution of cells in the S-phase, only very
sophisticated mathematical methods can predict with some
accuracy the amount of S-phase cells from the histogram.
50*
cn
40-
co
/iA'
Ch*L 30-
L
14'
C.'_
C)
=
0
I~~~~
2010
0 669
T
is-,
.
.
w
.
* }
I
1
4
I
0
VCD
x
a)
691
3
/111,
o 2-
.,-l
0
0)
E0 1E
z
.-
Ni
.
-48 -24
U
it
.
0
|
w
6 12 18 24 30 36
I
48
72
Time after hormone addition (h)
Figure 3 Effects of oestradiol lnM (E2
). insulin
1.7 jLM (Ins - - ), or the combination (E2 + Ins
.
) on
the increase of S-phase cells (a), and growth of MCF-7 cell
). Medium was
cultures (b), compared to controls (
renewed daily, and hormones were present from time 0 up to
26 h. Data for both a and b are plotted as means ± s.d. of
triplicate incubations.
a
Dox 6 h
oestra dioI
oestradiol
ID
m
b
2 days
later
PI
fIluorescence
Figure 4 Effects of a 6 h incubation with doxorubicin on MCF-7 cells in S-phase (a) administered for the latter 6 h of a 21 h
stimulation period with oestradiol (left) compared to control (right), measured immediately after doxorubicin incubation. b shows
accumulation of cells (white spot on the right in the figures) in the late S/G2M-phases 2 days after this 6 h incubation with
doxorubicin.
�692
M. BONTENBAL et al.
Table I Effect of time of exposure to oestradiol or insulin on percentage of
cells in S-phase
Cells in S-phase (%)
Continuous stimulation
I h pulse
a; 30 h
Additions
at 21 h
at 30 h
at 21 h
14 1
14
1
15 2
Control
16
1
60 ± 1
36 ± 1
60 ±4
38 + 2
Oestradiol (I nM)
21 ±1
42 ± 7
29 1
18 ± 1
Insulin(1.7 gM)
MCF-7 cells were stimulated with hormones for 1 h or continuously for 21 or 30 h, and
were harvested at 21 or 30 h after start ofhormone addition. Percentage ofcells in S-phase
was measured by dual-parameter flow cytometry. Data are the means ± s.d. of duplicate
incubations.
Table II Effect of doxorubicin incubation on the cell cycle distribution
of MCF-7 cells
Cells actively synthesising DNA (%)
At the end of
Additions
dox incubation
5 days later
25 ± 1
57 ± 1
25 ± 2
27 1
15 ± I
6 ± I
(34% late S/G2M)
Oestradiol + doxorubicin
57 ± 1
3 ± 1
(59% late S/G2M)
MCF-7 cells were incubated with and without oestradiol (I nM) for
21 h, and with and without doxorubicin (0.2 iLg ml-') for the last 6 h of
this period. Cell cycle distribution was assessed at the end of doxorubicin incubation and 5 days later. Data are the means ± s.d of
duplicate incubations.
Control
Oestradiol (1 nM)
Control + doxorubicin
Moreover, DNA histograms do not discriminate between cells
arrested in S-phase and cells actively synthesising DNA.
Dual-parameter flow cytometry can overcome these problems
by a sharp discrimination between the cells in the separate
phases of the cell cycle. With the method of BrdUrd
incorporation followed by anti-BrdUrd FITC incubation, cells
exhibiting green fluorescence are cells in S-phase actively
synthesising DNA. This method allows us: (i) to define the time
period required for cells to appear in the early S-phase after
growth-stimulation; (ii) to assess small differences in the
maximal percentages of cells in the S-phase after different
treatment modalities; (iii) to establish kinetic changes after
cytotoxic treatment; and (iv) to investigate changes in the
duration of the different phases of the cell cycle after
hormonal-chemotherapeutic perturbation. In this study we
have shown that a 6 h incubation period with doxorubicin
(0.2 1tg ml1') does not affect the percentage ofcells in S-phase at
the end of the doxorubicin incubation period. Recruitment of
quiescent growing MCF-7 cells into the cell cycle was not
blocked in these first 6 h. However, after 2 and 5 days all cells in
S-phase have accumulated into the late S/G2M-phases in both
oestrogen-stimulated and control groups. In addition hardly
any cells were synthesising DNA at these timepoints, indicating
the absence of cells going from GOG1- to S-phase. This suggests
that doxorubicin in this concentration and for this incubation
period blocks MCF-7 cells, not only in the late S/G2M-phases,
but also in the GOGI-phase of the cell cycle. In view of the fact
that cells in the G2M-phase are most sensitive to radiotherapy
(Hall, 1978), treatment of cancer patients with doxorubicin
followed by radiotherapy might be of clinical value. In
conclusion, dual-parameter flow cytometry is a reliable method
to investigate cytokinetic changes in perturbed cells. The
method can be of help in designing the optimal timespan,
dosages and combinations of growth factors and
chemotherapeutic drugs, resulting in an optimal cytotoxic effect
in the recruitment concept, with respect to the management of
breast cancer.
We thank Mrs J. van der Meij-van der Vlis for her secretarial help and
the department of photography for preparing the prints. This study is
supported through grant RRTI 87-11 by the Netherlands Cancer
Foundation (KWF).
References
ALLEGRA, J.C. (1983). Methotrexate and 5-fluorouracil following
tamoxifen and premarin in advanced breast cancer. Semin Oncol.,
10, suppl. 2, 23.
KRISHAN, A. & FREI, E. (1976). Effect of adriamycin on the cell
BONTENBAL, M., SONNEVELD, P., FOEKENS, J.A. & KLIJN, J.G.M.
LIPPMAN, M.E., CASSIDY, J. WESLEY, M. & YOUNG, R.C. (1984). A
(1988). Oestradiol enhances doxorubicin uptake and cytotoxicity
in human breast cancer cells. Eur. J. Cancer Clin. Oncol., 24,
1409.
CLARKE, S.K., VANDERBERG,, H.W., KENNEDY, D.J. & MURPHY,
R.F. (1985). Estrogen receptor status and the response of human
breast cancer cell lines to a combination of methotrexate and
17p-oestradiol. Br J. Cancer., 51, 365.
CONTE, P.F., PRONZATO, P., RUBAGOTTI, A. & 9 others (1987).
Conventional versus cytokinetic polychemotherapy with estrogenic recruitment in metastatic breast cancer: results of a randomized cooperative trial. J. Clin. Oncol., 5, 339.
DEAN, P.N. (1987). Data analysis in cell kinetics research. In Techniques in Cell Cycle Analysis, Gray, J.W. & Darzynkiewicz, A. (eds)
p.207. Humana Press: Clifton, New Jersey.
GRAY, J.W., DOLBEARE, F., PALLAVICINI, M.G., BEISKER, W. &
WALMAN, F. (1986). Cell cycle analysis using flow cytometry. Int.
J. Radiat. Biol., 49, 237.
HALL, E.J. (1978). Radiosensitivity and cell age in the mitotic cycle.
In Radiobiology for the Radiologist, II, Hall, E.J. (eds) p.l1.
Harper & Row: Philadelphia.
HUG, V., JOHNSTON, D., FINDERS, M. & HORTOBAGYI, G. (1986).
Use of growth-stimulatory hormones to improve the in vitro
therapeutic index of doxorubicin for human breast cancer.
Cancer Res., 46, 147.
View publication stats
cycle traverse of cultured human lymphoblasts. Cancer Res., 36,
143.
randomized attempt to increase the efficacy of cytotoxic
chemotherapy in metastatic breast cancer by hormonal synchronization. J. Clin. Oncol., 2, 28.
LIPTON, A., SANTEN, R.J., HARVEY, H.A. & 8 others (1987). A
randomized trial of aminogluthetimide ± estrogen before
chemotherapy in advanced breast cancer. Am. J. Clin. Oncol., 10,
65.
OSBORNE, C.K. (1981). Combined chemo-hormonal therapy in breast
cancer: a hypothesis. Breast Cancer Res. Treat., 1, 121.
PARIDAENS, R.J., KISS, R., DE LAUNOIT, Y. & 5 others (1985).
Chemotherapy with estrogenic recruitment in breast cancer. In
Hormonal Manipulation of Cancer: Peptides, Growth Factors and
New (Anti) Steroidal Agents, EORTC Monograph Series, vol.18,
Klijn, J.G.M., Paridaens, R.J. & Foekens, J.A. (eds) p.477.
Raven Press: New York.
WEICHSELBAUM, R.R., HELLMAN, S., PIRO, A.J., NOVE, J.J. & LIT-
TLE, J.B. (1978). Proliferation kinetics of a human breast cancer
line in vitro following treatment with 17p-estradiol and I-P-Darabinofuranosylcytosine. Cancer Res., 38, 2339.
�
 Marcel Bontenbal