Advances in Transportation Studies: an international Journal
1
2
3
4
Modeling non-fatal road crash injuries for Pakistan using aggregate
data
5
6
7
8
9
10
11
12
13
14
15
16
17
18
19
20
21
22
23
24
25
26
27
28
29
30
31
32
33
34
35
36
37
38
39
F. Subhana, H. Zhoub, S. Zhaoc, M. M. Naeemd, M. Sulaimane
a
Faculty of Management & Economics, Dalian University of Technology, Dalian, China.
fsubhan@mail.dlut.edu.cn
b
School of Transportation and Logistics, Dalian University of Technology, Dalian, China. hzhou@dlut.edu.cn
c
School of Transportation and Logistics, Dalian University of Technology, Dalian, China. szhao@dlut.edu.cn
d
Department of Civil Engineering, Iqra National University, Peshawar, Pakistan. majid@inu.edu.cn
e
Department of Civil Engineering, University of Engineering and Technology, Peshawar, Pakistan.
Muhammadsulaiman909@gmail.com
Abstract
Road crash injuries have emerged as a major health problem and have posed serious social and economic
challenges around the globe. Traffic safety can be improved only through adequate safety measures if the
underlying factors are well understood. Factors affecting crashes in developing countries, like Pakistan, are less
studied in the literature. Also, the road crash injuries data reporting and recording systems in these countries are
not well established. As such, this study by using the data from multiple sources including World Health
Organization (WHO), International Road Federation (IRF) and World Bank (WB) compares the reported nonfatal road crash injuries of Pakistan using two different approaches. First, the road crash injury rates were
compared with different groups of countries around the globe using two different indicators: (1) injuries per
hundred thousand population and (2) injuries per thousand registered vehicles. Results indicated lower road crash
injury rates Pakistan relative to other countries. Using the same indicators as response variables, linear regression
models were estimated using Ordinary Least Square (OLS) regression. The total number of registered vehicles,
maximum speed on rural roads, enforcement level of the seatbelt law, income level, and safety audit of new roads
were found as significant explanatory variables. The average values of these variables were compared with those
in the country. Finally, using the number of injuries as the response variables, count data models were developed
and the number of road crash injuries for Pakistan were estimated and compared with the reported number of
road crash injuries. The estimated road crash injuries were 4.5 times higher than the number of reported injuries.
Keywords – Non-fatal Road Crash Injuries, Injury Rate, OLS Models, Count Data Models
40
-1-
�Advances in Transportation Studies: an international Journal
41
42
43
44
45
46
47
48
49
50
51
52
53
54
55
56
57
58
59
60
61
62
63
64
65
66
67
68
1. Introduction
Annually, approximately 1.35 million fatalities and 20 to 50 million non-fatal injuries worldwide
occur due to road traffic crashes, which pose a serious social and economic challenges globally [1, 2].
It is anticipated that the numbers of road crashes will continue to increase in the next decade or so. If
such a situation is not properly addressed, road crash injuries will be the seventh leading cause of
mortality by the year 2030. Road crash injuries are also the primary and the 8th leading cause of
mortality for youngsters aged between 15 to 29 years and for people of all ages, respectively [1, 2].
Also, the deaths resulting from road crash injuries constitute 2.5% of the total mortality due to all
causes around the globe [1]. Therefore, the implementation of effective countermeasures to improve
road traffic safety around the globe is extremely necessary and urgent. Special concerns should be
given to low and middle-income countries. The rate of mortality due to road crash injuries in lowincome countries is three times higher than in high income countries [1]. Figure 1, based on the data
from World Health Organization’s Global Status Report on Road Safety-2018 [1], shows the
proportion of population, registered vehicles, and road crash fatalities in high, middle, and lowincome countries. The figure depicts that both the population and number of registered vehicles are
less in low-income countries compared to high-income countries, but, the rate of road crash fatalities
is higher in low than in high-income countries. The ratio of the number of registered vehicles in low
and middle-income countries is around 0.016, but the ratio of road crash fatalities between these
countries is 0.163. Also, the ratio of road crash fatalities between low and high-income countries
(1.857) is higher than their ratio of the number of registered vehicles (0.025). Similarly, the ratio of
the number of registered vehicles between middle and high-income countries (1.475) is lower than the
ratio of the number of road crash fatalities (11.428). Also, there has been no reduction in the number
of road traffic deaths in any low-income country since 2013 [1]. It is roughly estimated that the lowincome countries experience a loss of 1% of their gross national product (GNP) owing to road crash
injuries (both fatal and non-fatal), while in middle and high-income countries, the costs are 1.5% and
2% of the GNP, respectively. The possible reason for these low figures in low and middle-income
countries can be the under-reported data provided by these countries [3].
-2-
�Advances in Transportation Studies: an international Journal
Population %
Vehicles %
1
9 15
40
59
76
69
Road Crash Fatalities %
13 7
Middleincome
Low-income
80
70
71
72
73
74
75
76
77
78
79
80
81
82
83
84
85
86
87
88
89
High-income
Figure 1. Proportion of population, road traffic deaths, and registered motor vehicles by country income category
for the year 2016 [1]
As a developing country, Pakistan has the sixth largest population of around 207.774 million in
the world [4-6]. In the recent past years, the country’s economy has grown at a very slow pace and
road infrastructure has been moderately improved. The total road length has increased from 2, 51, 661
km in the year 2002 to 2, 64, 212 km in year 2015 [5]. However, the motorized vehicle population has
substantially grown from 5.3 million in the year 2002 to 11 million in year 2012 comprised of all
vehicle types [5, 6]. Motorcycles, passenger cars, buses and trucks have been approximately increased
by 110%, 150%, 30%, and 45%, respectively [6, 7]. The mushroom growth of motorization and the
increase of vulnerable road users are the reasons for the higher number of road traffic crashes (RTC)
in Pakistan. Figure 2 shows the change in gross national income (GNI), total road length, and
motorization in the country with time. The GNI [8] and road infrastructure [9] show slow and
moderate increasing trends, respectively. The number of registered vehicles shows a much higher
increasing trend compared to road infrastructure and GNI up to the year 2009 [6, 7, 9], but a
substantial increase afterwards [4]. The figure shows that number of road crashes and respective
outcomes do not show a clear pattern of increase with the increase in GNI, road infrastructure, and
registered vehicles.
-3-
�Advances in Transportation Studies: an international Journal
20000
VKT (100 Millions)
18000
16000
GNI (US$)
14000
Road Crashes
12000
10000
Fatal Injuries
8000
6000
Non-fatal Injuries
4000
2000
Vehicles (1000)
0
Road Length (100 Km)
90
91
92
93
94
95
96
97
98
99
100
101
102
103
104
105
106
107
108
109
110
Figure 2. Increase in Motorization, Road Length, GNI, VKT, and Road Crashes with Time [5, 8-10]
Road traffic crashes and injuries cause devastating effects on the country’s economy, resulting in a
loss of approximately 6.48 million USD annually (1 USD = 154.4 PKR) [10]. In Pakistan, road traffic
crashes are the second, fifth and eleventh leading causes for disability, overall healthy-life-year losses
and premature fatality, respectively [11, 12]. Hyder et al. found that annually only 37 individuals per
10,000 registered vehicles face road crash injuries (RCIs) [13]. Ghaffar et al. found that each year
approximately 1,500 RCIs occur per 100,000 populations [14]. Similarly, a study concluded that
around 1700 out of 100,000 individuals experience RCIs annually in the country [15]. Furthermore,
Shamim et al. found that the annual RCI rate is 184.3 per 100,000 populations [16]. While recent data
suggested that the total number of RCI could be four to ten times higher than the officially reported
figures [17]. The country’s policy-makers need immediate attention as these RCIs among all other
injury categories result in more handicaps [15]. Besides, the country is facing an issue of crash data
reporting as estimates of road crash injuries are not consistent according to the previous studies. For
example, the National Road Safety Secretariat (NRSS) reported 2 million RCI, while the Social
Indicator of Pakistan reported only 11,415 RCI for the year 2006 [5, 18]. The Global Status Report on
Road Safety-2009 by World Health Organization (WHO) reported 12,990 road crash injuries in
Pakistan for the year 2007 [17]. Similarly, Subhan et al. using aggregate data of 73 countries with
vital registration records found that 655,171 individuals sustained RCI in the year 2016 [19]. While in
-4-
�Advances in Transportation Studies: an international Journal
111
112
113
114
115
116
117
118
119
120
121
122
123
124
125
126
127
128
129
130
131
the same year, the Social Indicator of Pakistan reported only 11,544 RCI based on police records [5].
Figure 2 shows that the road crashes and injuries (both fatal and non-fatal) have decreased with the
increase in motorization and road length which seems contradictory to the previous research findings.
The inconsistency of reported and estimated number of injuries by previous studies and different
national and international organizations is an indication of the limitation of road crashes and injuries
data reporting systems in the country. Past studies have revealed that the system of road crash data
collection of Pakistan based on police-reporting has serious limitations as police only collects the data
which meet their legal requirements [13].
Prior to the application of any road safety strategies or measures, the authenticity of the reported
data and the causes behind the road crashes and their outcomes must be thoroughly investigated.
Previous studies considered a few contributing factors of the crashes and estimated the crashes
nationally or locally. This paper aims to compare the road crash injury rates of Pakistan with different
groups of countries and with the overall countries around the globe, and statistically explore the
factors that influence the occurrence of road crash injuries. The reported road crash injury rates of
Pakistan were compared with other countries around the world. The Ordinary Least Square (OLS)
regression was used to explore the relationship between non-fatal RCI and explanatory variables. The
values of the variables found significant in the models were averaged for 73 countries and compared
with those in Pakistan. The number of non-fatal RCI for Pakistan were estimated using count data
models (Poisson and Negative-binomial models) and compared with those reported by World Health
Organization’s Global Stats Report on Road Safety -2007.
132
2. Literature review
133
2.1 Modeling and analysis methodologies
134
135
136
137
138
139
140
141
142
143
144
145
146
147
148
149
150
Many studies in the past used count data models for determining road crash frequencies and the
corresponding factors. El-Basyouny and Sayed [20] used the a single count data model (poissonlognormal) to explore the factors responsible for road traffic crashes in different corridors. Caliendo,
Guida and Parisi [21] estimated different count data models (poisson, negative binomial, and negative
multinomial) for accident occurrence on multilane roads. Similarly, Anastosopolous and Mannering
[22] used random-parameters count models (random-parameters negative binomial regression) to
determine the road crash frequencies.
To determine the severity road crash injuries, some studies used probabilistic aggregate and
disaggregate models in the past. Savolainen and Mannering [23] used probabilistic models (nested
logit and standard multinomial logit models) and Moore et al. [24] used mixed logit models to
determine the severity road crash injuries among motorcyclists. Similarly, Chen and Chen [25] used
mixed logit models to examine the difference between single-vehicle and multi-vehicle crashes. In
addition, Abay [26] used disaggregate models (standard fixed-parameters ordered logit, the random
parameters ordered logit, multinomial and mixed logit) to examine the factors associated with road
crash injury severity.
Some studies used non-linear regression for the purpose of estimating the number road traffic
crashes and their respective outcomes. As such, Dogan and ANgüngör [27] applied non-linear
-5-
�Advances in Transportation Studies: an international Journal
151
152
153
154
155
156
157
158
159
160
161
162
163
164
165
166
167
168
169
170
171
172
173
regression and artificial neural network (ANN) models to estimate the number of road traffic crashes,
fatalities, and injuries.
Many studies used the accident and injury rates as continuous variables. As such, Anastasopoulos,
Tarko, and Mannering [28] used Tobit analysis by using accident rates as a continuous variable
(number of accidents per 100 million vehicle miles travelled) to study accident rates on Indiana
interstate highways. Some studies used linear regression analysis for the estimation and prediction of
the outcomes of road traffic crashes and to examine their association with the explanatory factors. For
example, Zargar et al. [29] used linear regression analysis to examine the factors associated with road
crash injuries (RCIs). Haque [30] used regression analyses to investigate the effectiveness of the
traffic legislations. Rakha et al. [31] used linear regression models for predicting road traffic crashes.
Agyemang [32] used linear regression model to examine the relationship between road traffic crashes
and population. Similarly, Zlatoper [33], Desai and Patel [34], and Cai, Zhu and Yan [35] used linear
regression modesl to examine the relationship between road crash fatalities and different explanatory
variables. Bener et al. [36] used both the regression and Smeed equations to estimate the number of
fatalities. Ahmed et al. [37] used Ordinary Least Squares regression (OLS) model to estimate the
annual road crash fatalities for Pakistan using the aggregate data for Asian countries. The number of
fatalities per hundred thousand populations was used as the response variable (continuous variable).
These studies highlighted the importance of linear regression analysis for the association of road crash
injuries (both fatal and non-fatal) with certain explanatory variables. It is concluded from the above
studies that the road crash injury rate is a continuous variable and can be associated with the
explanatory variables using linear regression analysis.
174
175
176
177
178
179
180
181
182
183
184
185
186
187
188
189
190
191
Road crash rates are significantly affected by roadway geometrics [24, 28], pavement
characteristics [22], pavement surface conditions [21], and technical design of road infrastructure
[41]. In addition, the frequency of road traffic crashes and injury severity is significantly related to
the road segment length, AADT, crosswalks density, business land use, un-signalized intersection
density, number of lanes between signals [20, 21], traffic light indicators, driver behaviour, and
vehicle and environmental characteristics [25]. Similarly, the road crash fatality rates in a country are
significantly affected by population density, the number of registered vehicles, licensed drivers, and
traffic fines, total road length, and economic conditions [35, 38, 39]. Also, the road crash injury
severity is affected by traffic violations, collision type, traffic environment [22], and operating speed
[40]. The road crash fatality rates in a country are significantly affected by population, the number of
registered vehicles, total road length, population density, and economic conditions [38, 39].
According to World Health Organization’s world report on road traffic injury prevention [3], the
increase in motorization and vulnerable road users is the primary cause of road crash injuries (RCI).
Also, the increased urbanization, low traffic safety awareness, negligence in the implementation of
traffic rules, vehicular overloading, bad road conditions, violations of road safety law, and low vehicle
maintenance standards are responsible for the increased RCI. The road user characteristics and
behavior, with traffic violation and negligence of safety devices (helmet and seat belt), alcohol
consumption, road and vehicle type, and crash location increase the RCI rates [11, 23, 29, 42-44].
2.2 Factors associated with road crashes and injuries
-6-
�Advances in Transportation Studies: an international Journal
192
193
194
195
196
197
198
199
In Pakistan, the lack of driver’s training and driving experience, bad condition of roads, cell phone
usage while driving, use of intoxicants, vehicular over loading, governmental mismanagement,
inferior geometrics and signage, poorly designed pedestrian facilities, careless driving, drivers falling
asleep at the wheel, burst tires, and brake failures are the major factors responsible for road crashes
[45, 46]. Similarly, according to Ahmed et al. [37], the road density, indicator for lead road safety
agency, vehicle child restraint law, and the maximum speed on rural and urban roads significantly
affect the RCF rate.
200
3. Methodology
201
3.1 International comparison of RCI rates
202
203
204
205
206
207
208
209
210
211
212
213
214
215
216
217
218
219
220
221
222
A comparison of road crash injuries (RCI) in Pakistan with that of other countries was conducted,
utilizing data sources including World Health Organization (WHO), International Road Federation
(IRF) and World Bank (WB) [17, 47, 48]. The countries were divided into different income groups
based on Gross National Income (GNI) defined by World Bank. The data on population, total number
of RCI, and registered vehicles for the year 2007 were acquired from WHO’s Global Status Report on
Road Safety – 2009 [17]. The reason for using the data from WHO – 2009 Global Status Report on
Safety on Road Safety was that none of the recent reports contain the data on non-fatal RCI. The
Injuries per hundred thousand population (IPHTP) and injuries per thousand registered vehicles
(IPTRV) were computed as the normalized measures of relative road safety. Table 1 shows the road
crash injury rates and Pakistan’s ranking in regard to these RCIs among different groups of countries,
including South Asian countries (SAARC – South Asian Association for Regional Cooperation),
Asian countries, low-income countries, developing countries and in general, all the countries of the
world. The ranking is based on descending order of road crash injury rates. Among the SAARC
countries, Pakistan has the lowest road crash injury rates based on both IPHTP and IPTRV. Table 1
also shows that Pakistan is ranked the second and seventh safest country among Asian countries based
on IPHTP and IPTRV, respectively. In low income countries, Pakistan is again ranked as the fourth
and third last country based on IPHTP an IPTRV, respectively. Similarly, Pakistan is ranked as the
third safest country among all the countries.
Table 1. Pakistan’s Ranking among other Countries in Regard to Non-fatal RCI Rates
Country Group
Pakistan
SAARC Countries
Asian Countries
Low-income Countries
Developing Countries
World
IPHTP
IPTRV
7.93
97.34
219.59
59.99
164.33
123.64
2.46
70.95
53.03
45.35
24.80
10.34
223
224
-7-
Pakistan’s Ranking
IPHTP
IPTRV
7/7
37/38
38/41
116/120
163/166
7/7
32/38
39/41
113/120
163/166
�Advances in Transportation Studies: an international Journal
225
226
227
228
229
230
231
232
233
234
235
236
237
238
239
240
241
242
243
Based on these results, it is evident that Pakistan has reasonable road crash injury rates, as
compared to other countries in the world. It indicates that Pakistan’s road safety is in a good state.
However, this may not be the true situation. On the contrary, it points out the issue of road crash data
reporting in Pakistan. A comparison between different categories of countries based on average
annual injuries was carried out that revealed high RCI rates for countries of high-income level, while
lower RCI were noted for countries of low, middle-income, and Asian countries. Pakistan’s RCI rate
as illustrated before in previous paragraphs does not evoke concern or worry. However, a country
with a high population and a road infrastructure that suffers from blatant deterioration such as
Pakistan cannot truly and fully match with the estimable outcomes pointed out by the figures. These
results can also put the authenticity of the data in question. Hyder Ghaffar and Masood [13] using
police recorded data found that police records only accounted for 14.3% of road traffic crashes.
Similarly, Razzak et al. [49] used the surveillance system and concluded from their study that police
records represented only 2-3% of RCI. According to Kayani, Fleiter and King [50], lack of police
training, improper allocation of resources, departmental corruption, and inadequate data reporting and
recording system are the main reasons of under-reporting of road crashes in the country. Furthermore,
the definitions of road crash and injury used in Pakistan do not conform to international standards
[51].
244
245
246
247
248
249
250
251
252
253
254
255
256
257
258
259
260
261
262
263
264
265
266
To explore a relationship between road crash injury rates and influential factors, the data including
socio-economic factors, national road safety policies and level of enforcement of traffic laws were
obtained from WHO data sources for 73 countries having vital registration records. These countries
were defined as the countries with vital registration records by the WHO’s Global Status Report on
Road Safety – 2009 because they provided more than 85% of the data in the questionnaire used by the
WHO for data collection [17]. The data of these countries was also used by the WHO’s Global Status
Report as a reference in estimating the negative binomial model to estimate the data for the rest of the
countries. They consisted of 35 European, 21 American, 15 Asian and 2 African countries. They were
further divided into three groups based on Gross National Income (GNI) defined by World Bank.
Group one consists of only one country with low-income level (GNI up to 935 USD), group two
includes thirty-five countries with middle-income level (GNI between 936 – 11,455 USD) and group
three entails thirty-seven countries with high-income level (GNI at least 11,456 USD) [48]. The data
on total number of road crash injuries, GNI, and registered vehicles for the year 2007 were acquired
from WHO’s Global Status Report on Road Safety – 2009 [17]. Similarly, the data on national road
safety policies and level of enforcement of traffic laws including the effectiveness of overall
enforcement of speed limits, information on vital registration records, audits of existing and new
roads, funding of lead road safety agency, the speed limits on rural and urban roads along with their
level of enforcement, national standards laws on drink-driving, seatbelt, motorbike helmet, and
vehicle child restraint along with their enforcement levels from a scale of 0 – 10 (lowest to highest
level), national policy for transportation investment, and national policy for promoting cycling and
walking were also retrieved from the WHO report for the year 2007. Furthermore, the data on road
density of these countries for the year 2007 were retrieved from International Road Federation’s
database [47]. Table 2 presents the summary statistics of the variables used in the study.
3.2 OLS model estimation
-8-
�Advances in Transportation Studies: an international Journal
267
268
Table 2. Summary Statistics of Variables
Variable
Mean
SD
Max.
Min.
269
Injuries Per Hundred Thousand Population (IPHTP)
339.77 259.06 1523.24
Injuries Per Thousand Registered Vehicles (IPTRV)
10.21
9.27
62.16
Population (hundred thousand)
26.00
48.33
305.83
Number of Registered Vehicles ( ten thousand)
1258.81 325.54 25140.23
Road Density (km/square km of area)
1.09
1.32
7.04
Maximum Speed on Rural Roads (km/h)
78.70
15.89
110.00
Maximum Speed on Urban Roads (km/h)
54.41
10.36
100.00
Gross National Income (1000 US$)
19.94
18.01
76.45
National Speed Limits in Kilometres (1- Yes, 0 - No)
1.00
1.00
1.00
Enforcement level of Speed Limits on a scale of 0-10
5.64
1.72
8.00
National Drink-Driving Law (1 – Yes, 0 - No)
1.00
0.00
1.00
Enforcement Level of Drink-Driving Law on a Scale of 0-10
5.82
2.16
10.00
National Seatbelt Law (1- Yes, 0 - No)
1.00
0.00
1.00
Enforcement Level of Seatbelt Law on a scale of 0-10
6.47
1.92
9.00
National Motorbike Helmet Law (1 – Yes, 0 - No)
0.99
0.12
1.00
Enforcement Level of Motorbike Law on a Scale of 0-10
6.59
2.36
10.00
National Vehicle Child Restraint Law (1 – Yes, 0 - No)
0.79
0.40
1.00
Enforcement Level of Vehicle Child Restraint Law on a Scale of 0-10
4.34
3.05
9.00
Mandatory Installation of Seatbelt in Newly Manufactured Vehicles
(1
0.44
0.50
1.00
- Yes, 0 – No)
National Road Safety Strategy (1 – Yes, 0 - No)
0.90
0.29
1.00
National Policy for Promoting Walking (1 – Yes, 0 - No)
0.59
0.49
1.00
National Policy for Transportation Investment (1 if policy exists, 0
0.72
0.45
1.00
otherwise)
Indicator variable for Safety Audit of New Roads (1 if audit exists, 0
0.59
0.50
1.00
otherwise)
Indicator variable for Safety Audit of Existing Roads (1 if audit exists, 0
0.68
0.46
1.00
otherwise)
Income Level (Low - 1, Middle – 2, High - 3)
Low
Middle
01 a
35 a
Note: a Frequency of each level of income
270
271
272
273
274
275
276
277
278
The road crash injury rates offer a normalized measure of road safety. Exposure-based response
variables such as number of injuries per hundred thousand vehicle kilometers travelled are more
appropriate for estimating statistical models that use data from different countries with varying
motorization levels. Since collecting reliable data on vehicle kilometers travelled is difficult especially
in countries with not well established data reporting system, population based response variables can
act as suitable surrogates for exposure to potential road crash situation. These response variables
include the number of injuries per hundred thousand population (IPHTP), the number of injuries per
hundred thousand registered vehicles (IPTRV), and the number of injuries per hundred thousand
-9-
30.01
0.91
0.12
2.4
0.03
40.00
32.00
0.59
0.00
0.00
1.00
1.00
1.00
0.00
0.00
0.00
0.00
0.00
0.00
0.00
0.00
0.00
0.00
0.00
High
37 a
�Advances in Transportation Studies: an international Journal
279
280
281
282
283
284
285
286
287
288
289
290
291
kilometers of road network. The population based response variables are more appropriate to use in
statistical models that use data from different countries for the same analysis year or against the past
years. These values relatively are somehow static as they do not change radically over short periods of
time [52, 53].
The present study used injuries per hundred thousand population (IPHTP) and injuries per
thousand registered vehicles (IPTRV) as response variables for the cause-effect models. The number
of injuries per hundred thousand populations does not depend upon vehicle usage or the total amount
of travel. The number of injuries per thousand registered vehicles may partially reflect usage. These
normalized measures of relative road safety are useful in quantifying overall risk on a comparative
basis. The natural logarithm of the response variables was used in order to get positive outputs from
the models. The independent variables along with their description are presented in Table 2. The
model form is as follows:
))
∑
)
(1)
292
293
294
295
296
297
298
299
300
where, ln(y(i)) is the natural logarithm of the injury rate; β0 and βi’s are the model coefficients; xi
represents the set of independent variables associated with road crash injuries; ε i is the error term. All
the available explanatory variables in Table 2 were tried for models estimation. The models were
estimated using step-wise OLS linear regression that develops the least squares regression equation in
steps, adding one independent variable at a time and evaluating whether existing variables should
remain or be removed. Due to high correlation among certain explanatory variables, the results of
some variables were not intuitive, and so those variables were removed from the final models.
301
4. Results
302
303
304
305
306
307
308
309
310
311
312
313
314
The detailed model results are shown in Tables 3 and 4. The coefficient of determination (R 2) was
low for both the models and is 0.185 and 0.254, respectively and thus do not show a good fit for a
highly varied data collected for 73 countries. However, the variables are found to be significant. Thus,
the developed models helped to explore the factors associated with road crash injuries but could not
be used for prediction [54-56].
The correlation between the independent variables was checked thorough the variance inflation
factor (VIF) which quantifies the severity of multi-collinearity in an ordinary least squares regression
analysis. It provides an index that measures how much the variance of an estimated regression
coefficient (the square of the estimate's standard deviation) is increased because of collinearity. The
VIF of all the independent variables were in the acceptable range (VIF < 10, no severe collinearity).
Also, the Durbin-Watson Statistic less than 4 indicated no sign of auto-correlation of the residuals.
As shown in Table 3, the number of registered vehicles is significantly associated with IPHTP
(correlation coefficient (r) = 0.318). All else being equal, the higher the number of registered vehicles
- 10 -
�Advances in Transportation Studies: an international Journal
315
316
317
318
319
320
321
322
323
324
325
326
327
328
329
330
331
332
333
334
335
336
337
338
339
340
341
342
343
344
345
346
347
in a country, the higher the expected injuries per hundred thousand population. This finding is
reasonable as the higher number of registered vehicles represents a higher exposure to road crash
injuries [3].
The maximum allowable speed on rural roads is found to be positively associated with IPHTP (r =
0.291), indicating that high speeds pose higher risks of road crash injuries. This finding is quite
intuitive and consistent with past research [17]. The RCI rate is expected to be higher in countries that
have high speed limits for their highway networks compared to countries with comparatively lower
speed limits. Over speeding has been identified as the most important risk factor influencing road
crash risk and injury severity [57-59]. Past research has also revealed that higher speed limits are
associated with higher road crash severity [60, 61]. The allowable speed limits are mostly higher on
rural roads which make the curves and intersections dangerous. Also, the marked speed differences
between various vehicle classes increase the risk of road crashes on these roads. Additionally, rural
roads have a much lower rate of traffic law enforcements and the drivers are more pertinent to have
higher speeds as the chances of being caught and get a ticket are very less. All countries, particularly
the low and middle-income countries with poor condition of road infrastructure, need to have
adequate legislation that ensure lower speed limits on their highway networks and allow authorities to
manage speed limits in their jurisdiction [59]. Although, most countries have enacted national speed
limit laws but their enforcement is equally essential for reducing road crash risk and injury severity.
Enforcement of speed limit laws needs to be given increasing emphasis in low and middle-income
countries that have high RCI rates.
Enforcement level of seatbelt law refers to the effectiveness of enforcement on a scale of 0 -10 (0 not at all effective, 10 - highly effective). Effectiveness of overall enforcement level of seatbelt law is
negatively related with the IPHTP. This finding is intuitive as well. Strict enforcement level of
seatbelt law results in lesser RCI as seat belts reduce the likelihood of being injured during a road
traffic crash [62]. It is a well-established fact that vehicle occupants not wearing seatbelts are at
increased risk of injury and fatality in the event of a road crash, therefore any resources dedicated for
enforcement shall benefit the community by lowering the number of injuries and fatalities. Mandatory
seatbelt legislation is highly effective in promoting seat-belt wearing and is a cost-effective means of
reducing road crash injuries and fatalities, especially in rapidly motorizing low and middle income
countries [63]. The use of seat belts requires multi-sectoral action beyond appropriate legislation
including publicity along with the provision of in-vehicle seat belt reminders, which has shown to be
highly effective [64].
348
- 11 -
�Advances in Transportation Studies: an international Journal
349
350
Table 3. Model Estimation Results (IPHTP)
Variable
Coeff.
Constant
4.644
Std.Err. t-stats P-value
0.417
RV (Number of Registered Vehicles in
6.455E-03 0.000
Millions)
MAXSR (Maximum Speed on Rural Roads)
0.012
0.005
High-SBLENF (High Enforcement of Seatbelt
-0.324
0.178
Law)
2
R
Adjusted R2
Durbin-Watson
Number of observations
VIF
95 % CI
LB UB
11.131
0.000
3.812 5.476
2.480
0.016
1.098 0.000 0.000
2.238
0.028
-1.815
0.074
1.115 0.001 0.023
1.063
0.032
0.679
0.185
0.149
2.311
73
351
352
353
354
355
356
357
358
359
360
361
362
363
364
365
Table 4. Model Estimation Results (IPTRV)
Std.Err. t-stats P-value VIF
95 % CI
LB
UB
Variable
Coeff.
Constant
2.983
0.250
11.948
0.000
2.485 3.481
High-ILVL (High Income Level)
AVE-SBLENF (Average Enforcement Level
of Seatbelt Law)
High- SBLENF (High Enforcement Level of
Seatbelt Law)
SANR (Safety Audit New Roads)
R2
Adjusted R2
Durbin-Watson
Number of observations
-0.672
0.179
-3.753
0.000
1.106 -1.029 -0.315
-0.509
0.242
-2.102
0.039
2.018 -0.991 -0.026
-0.518
0.262
-1.976
0.052
2.052 -1.042 0.005
-0.350
0.176
-1.989 0.051
0.254
0.210
2.173
73
1.034 -0.701 0.001
The model results in Table 4 revealed that income level was inversely related to the response
variable and significant at 95% confidence level. The higher the level of income in a country, the
lower the IPTRV. There is a strong association between the risk of fatality in a road crash and the
income level of a country. The risk in high-income countries is 10 times less than that of low-income
countries [1]. A high-income country can ascertain the existence of effective road safety policies,
well-maintained road infrastructure and pavement condition, signalized at-grade intersections,
alternatives for congestion control, advanced public transport system, superb vehicle conditions, and
educated drivers and pedestrians.
The model results also revealed that countries with effective safety audits for their roads have
lower road crash injuries. The road safety audit aims at identifying the potential safety problems
- 12 -
�Advances in Transportation Studies: an international Journal
366
367
368
369
370
371
372
during the planning and design of new roads. It helps in identifying potential safety hazards and
highlights road crash prone locations [65]. When safety is taken into consideration during the
planning, design and operation of roads, substantial contributions can be made to reducing RCF and
RCI [1]. Road safety inspections can provide mechanisms to identify failings in infrastructure that are
responsible for affecting likelihood of road crashes and the severity of resulting injuries [1], and thus
helps to eliminate the road safety deficiencies in the country.
373
5. Comparison of models significant variables means with Pakistan
374
375
376
377
378
379
380
381
382
383
384
385
386
387
388
389
390
391
392
393
394
395
396
397
398
399
400
401
402
403
404
405
406
A comparison of average values of significant variables in both the models for the 73 countries
with those of Pakistan is presented in Table 5. The data for the years 2010, 2013, and 2016 were
collected from the WHO’ Global Status Reports on Road Safety for the years 2013, 2015, and 2018
respectively. The mean of the enforcement level of seatbelt law for the countries under observation
has increased since 2007. According to World Health Organization’s Global Status Report on Road
Safety-2018 [1], 105 countries have seatbelt laws that align with best practice. Since 2014, seven
countries have made changes to their seatbelt legislation of which five countries have laws that meet
best practice. The net increase of these countries accounts for an additional 113 million people
covered by best practice seatbelt laws. Of the 161 countries with national seatbelt laws, 105countries
representing 71% of the world’s population have adopted the best practice of mandating the use of
seat belts by both front and rear occupants [1]. Statistical analyses show that a significant increase in
seat belt usage rates among both drivers and passengers for both genders resulted from the
accompanying media and enforcement campaigns [66].
The enforcement level of seatbelt law in Pakistan was much lower than the mean level for the
countries under observation in the study year. The enforcement level of seatbelt law remained
unchanged up to the year 2013 and has been increased in the year 2016 but is still lower than the
mean of the countries with vital registration records. The Road Safety Audit for New Roads was not
present in the country in 2007 but was present in most of the countries (average value greater than
half). Road infrastructure is strongly associated to road crash injuries during road crashes. Improving
road infrastructure is critical in the improvement of overall road safety [67]. One hundred forty-seven
countries carry out road safety audits for new roads while 114 countries reported doing safety
assessments on existing roads around the globe [1]. The aim of carrying out road safety audits is to
create a safe road environment instead of placing the main responsibility on road users who likely fail
to deal with intrinsic dangers of the road. The country’s rural roads have higher speed limits than most
of the other countries. In the past few years, the speed limit has drastically increased from 95 km/h to
110 km/h [1, 2, 59]. The country’s income level was lower than the mean of the income levels for the
countries under observation. Only the number of registered vehicles which is positively associated
with the RCI rate was lower than the mean of the other countries. The number of registered vehicles
has also increased from the mean of the countries under observation in the year 2016. The comparison
of the means of these factors with those in Pakistan depicts the data reporting issues.
Table 6 shows the average values of the significant variables in the models without the outliers.
The outlier is a data-point that lies outside the overall pattern in a distribution of a dataset. The
outliers were identified using the interquartile range (IQR) method i.e., 1.5 IQR. This method states
- 13 -
�Advances in Transportation Studies: an international Journal
407
408
409
410
411
412
413
414
415
416
417
418
419
420
421
422
423
424
425
426
427
428
429
430
431
432
that a data-point is an outlier if it is more than 1.5 times the IQR above the third quartile (> Q 3 +
1.5*IQR). Similarly, a data-point less than the 1.5 times the IQR below the first quartile (< Q1 1.5*IQR) is also identified as an outlier. Each variable in the data was investigated using this method.
The data-points that were identified as outliers were removed from the dataset and the means were
recalculated and compared with the values of Pakistan. Only the number of registered vehicles and the
maximum speed limit on rural roads had outliers. The income level, enforcement level of seatbelt law,
and the safety audit of new roads did not contain any outliers. In addition, the injuries per hundred
thousand population and the injuries per thousand registered vehicles (the dependent variables) also
had outliers. The removal of the outliers significantly reduced the means and variances of the
variables. The comparison in Table 6 shows that Pakistan again has low RCI rates than the mean RCI
rates of the countries under consideration. The number of registered vehicles in Pakistan is higher
than the mean number of registered vehicles in 73 countries. Also, the maximum speed limit on rural
roads was higher than the average of the speed limits for the countries under observation.
A comparison of average values of significant variables in both the models for low-income
countries with those of Pakistan is presented in Table 7. The number of registered vehicles and the
maximum speed limit on rural roads in Pakistan are higher than the mean of the low-income
countries. The enforcement level of seatbelt law is higher than the mean of the low-income countries
in the year 2016. The comparison with Asian countries (Table 8) shows that Pakistan again has higher
number of registered vehicles and maximum speed limits on rural roads. Also, the enforcement level
of seatbelt laws is lower than the mean of the enforcement levels for the Asian countries. Similarly,
Table 9 shows the comparison of the mean values of the models significant variables for developing
countries with those of Pakistan. The number of registered vehicles and maximum speed on rural
roads are higher in Pakistan. The enforcement level of seatbelt is again lower than the mean of the
enforcement levels for the developing countries before 2016. The enforcement level of seatbelt law is
recently doubled in the country and is higher than the mean of the developing countries.
433
- 14 -
�Advances in Transportation Studies: an international Journal
434
435
436
Table 5. Comparison of Models Significant Variables Means of Countries having Vital Registration Records with
Pakistan
2007
2010
2013
2016
Variable
X1
Pakistan
X1
Pakistan
X2
Pakistan
X3
Pakistan
1258.80
1374.13
1546.55
1661.20
528.71
785.30
908.04
1835.25
(3255.42)
(3382.13)
(3608.55)
(3801.97)
Max Speed on Rural
78.70
89.92
89.31
91.10
95
110
110
110
Roads
(15.89)
(14.31)
(14.73)
(14.83)
2.49
2.53
2.63
2.97
Income Level
1.00
2.00
2.00
2.00
(0.53)
(0.53)
(0.49)
(3.34)
Enforcement Level of
6.47
6.45
7.06
6.70
3.00
3.00
3.00
6.00
Seatbelt Law
(1.92)
(1.87)
(1.53)
(1.49)
Safety Audit of New
0.59
0.833
0.884
0.84
0.00
1.00
1.00
1.00
Roads
(0.50)
(0.37)
(0.32)
(0.37)
Note: Standard Deviations in brackets; X1 denotes mean of 73 countries; X2 denotes mean of 70 countries; X3
denotes mean of 69 countries; RV denotes number of registered vehicles in unit of ten thousands
RV
437
438
439
440
441
442
Table 6. Comparison of Models Significant Variables Means of Countries having Vital Registration Records with
Pakistan (Outliers Excluded)
2007
2010
2013
2016
Variable
X1
443
444
Pakistan
X1
Pakistan
X2
Pakistan
X3
Pakistan
312.67
IPHTP
7.93
(201.07)
9.08
IPTRV
2.46
(6.13)
484.24
562.79
682.89
765.93
RV
528.71
785.30
908.04
1835.25
(675.53)
(784.16)
(969.66)
(1060.19)
Max Speed on Rural 78.70
90.58
89.95
91.55
95
110
110
110
Roads (km/h)
(15.89)
(13.41)
(13.89)
(11.55)
2.49
2.53
2.63
2.97
Income Level
1.00
2.00
2.00
2.00
(0.53)
(0.53)
(0.49)
(3.34)
Enforcement Level of
6.47
6.45
7.06
6.70
3.00
3.00
3.00
6.00
Seatbelt Law
(1.92)
(1.87)
(1.53)
(1.49)
Safety Audit of New
0.59
0.833
0.884
0.84
0.00
1.00
1.00
1.00
Roads
(0.50)
(0.37)
(0.32)
(0.37)
Note: Standard Deviations in brackets; X1 denotes mean of 73 countries; X2 denotes mean of 70 countries; X3
denotes mean of 69 countries; RV denotes number of registered vehicles in unit of ten thousands
445
- 15 -
�Advances in Transportation Studies: an international Journal
446
447
Table 7. Comparison of Models Significant Variables Means of Low-income Countries with Pakistan
2007
2010
2013
2016
Variable
X
Pakistan
X
Pakistan
X
Pakistan
X
Pakistan
304.02
417.27
657.02
1032.21
528.71
785.30
908.04
1835.25
(1191.79)
(1886.40)
(2670.34)
(3762.39)
Max Speed on Rural Roads 72.87
93.00
92.65
95
110
110
110
(km/h)
(19.35)
(13.43)
(12.25)
Enforcement Level of
2.85
4.41
5.29
5.07
3.00
3.00
3.00
6.00
Seatbelt Law
(2.86)
(2.53)
(2.34)
(2.12)
Safety Audit of New
0.63
0.76
0.79
0.86
0.00
1.00
1.00
1.00
Roads
(0.49)
(0.43)
(0.41)
(0.35)
Note: Standard Deviations in brackets; X denotes mean of 40 countries; RV denotes number of registered
vehicles in unit of ten thousands
RV
448
449
450
451
452
Table 8. Comparison of Models Significant Variables Means of Asian Countries with Pakistan
2007
2010
2013
2016
Variable
X
Pakistan
X
X
Pakistan
X
Pakistan
1242.11
2161.74
2069.85
3147.85
528.71
785.30
908.04
1835.25
(2811.14)
(3826.51)
(4794.19)
(6875.62)
Max Speed on Rural 75.22
90.71
90.19
95
110
110
110
Roads (km/h)
(20.36)
(16.35)
(14.63)
1.98
0.50
2.16
2.19
Income Level
1.00
2.00
2.00
2.00
(0.71)
(0.66)
(0.65)
(0.55)
Enforcement Level of
4.76
2.08
5.97
6.30
3.00
3.00
3.00
6.00
Seatbelt Law
(2.83)
(2.47)
(2.28)
(2.03)
Safety Audit of New
0.59
0.22
0.86
0.98
0.00
1.00
1.00
1.00
Roads
(0.50)
(0.70)
(0.35)
(0.15)
Note: Standard Deviations in brackets; X denotes mean of 46 countries; RV denotes number of registered
vehicles in unit of ten thousands
RV
453
454
Pakistan
455
456
- 16 -
�Advances in Transportation Studies: an international Journal
457
458
Table 9. Comparison of Models Significant Variables Means of Developing Countries with Pakistan
2007
2010
2013
2016
Variable
X
Pakistan
X
Pakistan
X
Pakistan
X
Pakistan
547.92
773.1
957.98
1488.91
528.71
785.30
908.04
1835.25
(1703.64)
(2462.82)
(3117.79)
(4591.83)
Max Speed on Rural 73.74
89.83
89.34
95
110
110
110
Roads (km/h)
(18.85)
(15.26)
(15.67)
1.69
1.79
1.86
1.88
Income Level
1.00
2.00
2.00
2.00
(0.51)
(0.49)
(0.53)
(0.52)
Enforcement Level of
4.63
5.42
5.97
5.81
3.00
3.00
3.00
6.00
Seatbelt Law
(2.90)
(2.33)
(2.13)
(1.99)
Safety Audit of New
0.60
0.81
0.81
0.86
0.00
1.00
1.00
1.00
Roads
(0.49)
(0.58)
(0.39)
(0.35)
Note: Standard Deviations in brackets; X denotes mean of 120 countries; RV denotes number of registered
vehicles in unit of ten thousands
RV
459
460
461
462
6. Estimation of Non-fatal Road Crash Injuries
463
6.1 Modeling RCI counts
464
465
466
467
468
469
The number of road crashes and their outcomes (injuries and fatalities) are commonly estimated
using count data models because the number of crashes and the resulting injuries (fatal and non-fatal)
is a non-negative integer. The number of RCI (count data) is generally modeled and estimated with a
Poisson regression or its derivatives including the negative binomial and zero-inflated models [68].
For the basic Poisson model, the probability P(ni) of a RCI is
470
471
472
473
474
475
476
477
478
479
480
481
)
)
(2)
where i is the Poisson parameter, which is the expected number of RCI, E[ni]. Poisson regression
specifies the Poisson parameter i (the expected number of RCI) as a function of explanatory
variables by typically using a log-linear function:
) or, equivalently LN( i) = βXi
(3)
where Xi represents the set of explanatory variables and β’s are model coefficients [68].
However, a Poisson model may not always be appropriate because its distribution assumes the
mean and variance to be equal (E[ni] = VAR[ni]). The data under analysis are said to be overdispersed (E[ni] < VAR[ni]) or under-dispersed (E[ni] > VAR[ni]) if the equality of mean variance
- 17 -
�Advances in Transportation Studies: an international Journal
482
483
484
485
486
does not hold. This will result in incorrect standard errors of the estimated parameters and ultimately
incorrect inferences could be drawn. In order to account for the inequality of the mean and variance,
the negative binomial model is derived by rewriting
)
(4)
487
488
489
490
491
492
493
494
495
496
497
498
499
500
501
502
503
504
505
506
507
508
where EXP(ɛi) represents a gamma-distributed error term with a mean and variance of 1 and α,
respectively. The addition of the error term (EXP(ɛi)) which is gamma-distributed with a mean and
variance of 1 and α, respectively, allows the variance and mean to differ as VAR[ni] = E[ni][1 +
αE[ni]] = E[ni] + αE[ni]2.
The Poisson regression is a restricted model of the negative binomial regression as α approaches 0.
Thus, if α is significantly different from 0, the negative binomial is appropriate, and the Poisson
model otherwise [68].
To describe the relative magnitude between the dependent and explanatory variables based on
parameter estimates, marginal effects can be estimated. In the case of the number of RCI, marginal
effects give the change in the number of RCI with a unit change in any explanatory variable, x, and
are simply calculated as the partial derivative, ∂ i/∂x, where i is defined as in Equations (3) and (4)
for Poisson and negative binomial models, respectively.
The number of RCIs in a country depend on certain characteristics such as population, number of
registered vehicles, road density, maximum allowable speeds on their road sections, and the existence
and enforcement of traffic laws. Thus, the objective of statistical modeling is to estimate the expected
number of RCIs in a given region (country) as a function of its characteristics. In other words, it is
assumed that there exists a “systematic”, i.e. causal, component in the number of RCIs and
“explanatory variables” may account for this non-random component. This implies defining a
“regression model” where the explanatory variables (and possibly combinations thereof) act as
“covariates”.
509
6.2 Selecting the regression model
510
511
512
513
514
Given the data set of the number of RCI and explanatory variables, the first step was to check the
presence of “over-dispersion”, to discriminate between the two count data models (Poisson and NB
models). On the basis of the ML estimates βˆ of the β regression coefficients under the Poisson model,
the null hypothesis that α= 0 against α > 0 can be tested by the statistic:
515
516
517
518
519
520
∑
∑
)
⁄
(5)
which is asymptotically distributed as a standard Normal random variable [69]. Large positive
values of Z indicate over-dispersion, whereas large negative values indicate under-dispersion.
Once the model type was chosen, a stepwise forward procedure based on the Generalized
Likelihood Ratio Test (GLRT) was used to decide which explanatory variables should be included in
- 18 -
�Advances in Transportation Studies: an international Journal
521
522
523
524
525
526
527
528
the regression model. It is recognized that the effect of variables that affect the probability of road
crash occurrence can be effectively represented by multiplicative terms, whereas the effect of
variables that act as point hazards can be effectively represented by additive terms [70, 71]. Thus, the
regression model should have both a multiplicative and an additive portion in general. For the
multiplicative component, the exponential choice appears to be a natural one as it ensures that the
expected number of RCI is always positive. Therefore, the log-linear regression model λi(xi; β) = exp
(∑
) was assumed for the expected number of RCI.
529
6.3 Total RCI counts
530
531
532
533
534
535
536
537
538
539
540
541
542
543
544
545
546
547
548
549
550
The Poisson model was estimated at first using the stepwise procedure based on GLRT. The data
set consisted of the total number of non-fatal RCI reported for each country. The candidate set of
explanatory variables was the same as used in the estimation of OLS regression models (Table 2). The
residual deviance which is the difference between the deviance of the estimated model and the
maximum deviance of the ideal model where the predicted and observed values are identical was used
to perform the goodness of fit of the overall model. The large residual difference and therefore the
significance of the goodness of fit indicated that the model does not fit the data well. The test for
over-dispersion was performed and the value of the Z statistic (Equation (5)) was calculated at
convergence of the stepwise procedure. Since Z = 2.8873 (p = 0.0019), there was a clear evidence that
over-dispersion was present and, consequently the NB model was estimated.
For both the regression models, different combinations of the explanatory variables were tested
and in the final models, population, the number of registered vehicles, the square of the road density,
the enforcement level of motorbike helmet law (high-enforcement), and the safety audit of new roads
were significant explanatory variables at the 1% level. Also, the estimated coefficients have the
expected signs for both the models. The number of RCIs increases with the increase in the population
and the number of registered vehicles. In contrast, the number of these RCIs decreases with the square
of road density, the enforcement level of motorbike helmet law, and the safety audit of new roads.
Tables 10 and 11 respectively show the parameter estimates at convergence of the stepwise procedure
for both the Poisson and NB models.
- 19 -
�Advances in Transportation Studies: an international Journal
551
552
Table 10. Model Estimation Results (Poisson)
Variable
Coeff.
Constant
11.172
Std.Err.
POPM (Population in Millions) 7.151E-05
RVM (Number of Registered
0.016
Vehicles in Millions)
RDENSQUARE (Square of Road
-4.638E-03
Density)
High-HLENF (High Enforcement
-0.8156
level of Motorbike Helmet Law)
SANR (Safety Audit New Roads) -0.6608
Restricted
Log
Likelihood
(constant only)
Log Likelihood at Convergence
Chi-square (p-value)
AIC
BIC
Z-stats P-value VIF
95 % CI
LB
UB
5.277E-04 21170.7
0.000
3.691
5.328
9.314E-07
0.000 1.101 0.000
0.000
3.111E-06 5077.71
0.000 1.116 0.002
0.023
3.607E-05 -128.59
0.000 1.125 -0.772 -0.061
1.046E-03 -779.38
0.000
7.427E-04 -889.83
0.000 1.059 0.014
553
- 20 -
76.78
-24164272 (df=1)
-9368658 (df=6)
29591227 (0.000)
18737328
18737347
0.258
�Advances in Transportation Studies: an international Journal
554
555
Table 11. Model Estimation Results (Negative-Binomial)
Z-stats P-value VIF
95 % CI
LB
UB
Variable
Coeff.
Std.Err.
Constant
9.925
0.187
53.117
0.000
3.691
5.328
POPM (Population in Millions)
RVM (Number of Registered
Vehicles in Millions)
RDENSQUARE (Square of
Road Density)
High-HLENF
(High
Enforcement level of Motorbike
Helmet Law)
SANR (Safety Audit New
Roads)
Restricted
Log
Likelihood
(constant only)
Log Likelihood at Convergence
Chi-square (p-value)
AIC
BIC
Theta (Std. Err)
0.004
0.001
4.332
0.000 1.101 0.000
0.000
0.075
0.005
14.535
0.000 1.116 0.002
0.023
-0.034
0.009
-3.608
0.000 1.125 -0.772 -0.061
-0.391
0.235
-1.670
0.1
-0.630
0.215
-2.928
0.001
1.059 0.014
0.258
-1882.031
-1806.728 (df=7)
150.61 (000)
3627.457
3649.156
1.1671 (0.0528)
556
557
558
559
560
Using the NB model (Table 11), 58,655 RCI were estimated for Pakistan. The estimated number
of RCI was much higher (approximately 4.5 times) compared to the reported annual RCI of 12,990 [5,
17].
561
7. Discussion
562
563
564
565
566
567
568
569
570
571
572
573
574
In Pakistan, inappropriate training and corruption of police and the absence of devotion to national
road safety are the main reasons of inadequate data reporting and recording systems [50]. Under such
serious inadequate crash data reporting systems, it is difficult to explore the factors associated with
road crash injuries at the national level and the country cannot provide appropriate policy
interventions.
The enforcement level of seat belt law remained lower till the year 2013. The enforcement level
has been doubled in the year 2016 and is higher than the mean of the low-income and developing
countries but is lower than the mean of the Asian countries and the countries with vital registration
records. This highlights that the safety agencies are not active enough to efficiently enforce their laws.
The enforcement of seatbelt law only applies to the vehicle driver and not to all the occupants of the
vehicle. Also, the use of seat belt is only limited to specific roads and vehicles. The highest rate of
seat belt is only on motorways (53%) and the lowest rate is on the rural roads (5%). The lowest rate of
seat belt usage is due to the unawareness of traffic laws and usefulness of its use, forgetfulness, and
- 21 -
�Advances in Transportation Studies: an international Journal
575
576
577
578
579
580
581
582
583
584
585
586
587
588
589
590
591
careless attitude of drivers and traffic wardens in the country [72]. Also, the country has failed to
evaluate the national seatbelt wearing rate which reveals the fact of unsatisfactory enforcement and
ignoring its importance in the road safety [17, 73]. The Road Safety Audit for New Roads was not
present in the country in the year 2007, but has been formed since 2010. Road Safety Audit is highly
significant in the overall road safety and making long-term road safety policies and interventions for
improvement. Having a policy, clear roles & responsibility and proper road safety audit management
is vital in ensuring adequate road safety [74].The country’s rural roads have higher speed limits than
most of the other countries. In the past few years, it has been drastically increase from 95 km/h to 110
km/h [1, 2, 59]. A general principle is that a 1% increase in the mean speed increases the risk of
fatality and serious injury by 4% and 3%, respectively, during a road crash [57]. On the contrary, a
5% reduction in average speed can reduce the number of fatalities by 30% [75]. Similarly, small
reductions in speed also influence the thresholds for death and serious injury risk in different crash
scenarios [1]. Also, the number of registered vehicles has been doubled since 2013 which also shows
the increase in exposure to road crashes. Road crash injuries are expected to decrease by a strict
enforcement of seatbelt laws, reduction of speed limits, and the existence of effective road safety
audits.
592
8. Conclusion
593
594
595
596
597
598
599
600
601
602
603
604
605
606
607
608
609
610
611
612
613
614
615
RCI have turned up as a moral challenge for the society. Consistent information regarding the total
number of RCI and the factors contributing to high RCI rate is the primary step for initiating adequate
countermeasures.
This study collected the aggregate data on non-fatal RCIs from the WHO’s Global Status Report
on Road Safety-2009 and compared the RCI rates based on two normalized measures for road safety.
The study also collected the data of 73 countries having vital registration records, and estimated the
OLS models that helped explore the factors associated with the RCI rates. The models present a
reliable tool for exploring the factors affecting RCIs, especially in countries having inadequate road
crash data reporting and recording systems. RCIs were estimated using count data models (Poisson
and Negative-Binomial models). The estimated RCIs were found to be much higher than the reported
data. The importance of road crash data reporting and recording systems at the country level is also
highlighted by comparing the means of the significant variables for the countries under observation
with those in Pakistan.
The findings provide an insight for applicable legislation and reasonable investment in road safety
for reducing the RCI rate. Based on the findings, RCIs are expected to decrease by a strict
enforcement of seatbelt laws, reduction of allowable speed limits, and the existence of effective road
safety audits. Furthermore, an extensive road crash data reporting and recording system is suggested
for Pakistan and other developing countries.
This study also has some limitation. The present research used data from the World Health
Organization’s Global Status Report on Road Safety -2009 which was limited to police-reported road
crash injuries. The WHO provides no data on non-fatal road crash injuries at the country level except
the WHO-2009 report. So, this study used only the available data. The data from the WHO has certain
limitations due to non-standardized measures used for the level of enforcement of traffic laws and the
- 22 -
�Advances in Transportation Studies: an international Journal
616
617
618
619
620
road safety definitions. Data that are more detailed than police records would open up additional
analysis possibilities and allow more precise model estimation. Furthermore, future research should
focus on the effectiveness of the levels of traffic law enforcement and the behavior of the road users
towards these traffic laws along with their evaluation.
- 23 -
�Advances in Transportation Studies: an international Journal
621
Notes:
622
Conflict of interest
623
624
The authors have no conflict of interest regarding this study.
625
Acknowledgments
626
627
628
629
630
The authors would like to thank Dr. Yasir Ali for his feedback on the paper. The authors also
acknowledge the World Health Organization (WHO) for publishing such useful book and the
aggregate data regarding the situation of road safety around the globe.
631
632
633
This research did not receive any specific grant from funding agencies in the public, commercial,
or not-for-profit sectors.
Funding
- 24 -
�Advances in Transportation Studies: an international Journal
634
635
636
637
638
639
640
641
642
643
644
645
646
647
648
649
650
651
652
653
654
655
656
657
658
659
660
661
662
663
664
665
666
667
668
669
670
671
672
673
674
675
676
677
678
References
1.
2.
3.
4.
5.
6.
7.
8.
9.
10.
11.
12.
13.
14.
15.
16.
17.
18.
19.
20.
World Health Organization (2019). Global status report on road safety (2018). Geneva (Switzerland):
WHO.
World Health Organization (2015). Global status report on road safety 2015. World Health
Organization.
Peden, M. (2004). World report on road traffic injury prevention, World Health Organization, Geneva.
SIP (2020). Social Indicator of Pakistan. Pakistan Bureau of Statistics, Islamabad: Government of
Pakistan, Statistics Division. (http://www.pbs.gov.pk/content/population-census. Accessed 20 January
2020). Accessed: 20 January 2020.
SIP (2016). Social Indicator of Pakistan. Pakistan Bureau of Statistics, Islamabad: Government of
Pakistan, Statistics Division.
Shoaib, M. (2013). Pakistan Economic Survey 2012–13. Ministry of Finance, Government of Pakistan,
2013.
National Transport Research Center. (2003). Accidents in Pakistan - a Review. Islamabad: Government
of Pakistan, Ministry of Communication. 2003.
Pakistan, Pakistan - GNI per capita GNI per capita, Atlas method (current US$). 2018.
(https://www.indexmundi.com/facts/pakistan/gni-per-capita. Accessed 15 May 2020).
National Transport Research Center. (2011). Road and Road Transport Statistics. Islamabad:
Government of Pakistan, Ministry of Communication. 2011.
Ahmed, A. (2007). National Road Safety Plan 2007-2012. Islamabad: National Road Safety
Secretariat, Ministry of Communications, 2007a.
Hyder, A.A., Amach, O.H., Garg, N., Labinjo, M.T. (2006). Estimating the burden of road traffic
injuries among children and adolescents in urban South Asia. Health Policy, 77, pp. 129–139.
Hyder, A.A., Morrow, R.H. (2000). Applying burden of disease methods in developing countries: a
case study from Pakistan. American Journal of Public Health, 90(8), pp. 1235–1240.
Hyder, A.A., Ghaffar, A., Masood, T.I. (2000). Motor vehicle crashes in Pakistan: the emerging
Epidemic. Injury Prevention, 6, pp. 199–202.
Ghaffar, A., Hyder, A.A., Masud, T.I. (2004). The burden of road traffic injuries in developing
countries: the first national survey of Pakistan. Public Health, 118(3), pp. 211-217.
Fatmi, Z., Hadden, W.C., Razzak, J.A., Qureshi, H.I., Hyder, A.A., Pappas, G. (2007). Incidence,
patterns and severity of reported unintentional injuries in Pakistan for persons five years and older:
results of the National Health Survey of Pakistan 1990-94. BMC Public Health, 7(1), pp. 152.
Shamim, S., Razzak, J.A., Jooma, R., Khan, U. (2011). Initial results of Pakistan's first road traffic
injury surveillance project. International Journal of Injury Control and Safety Promotion, 18(3), pp.
213-217.
World Health Organization. (2009). Global status report on road safety: Time for action, Geneva:
World Health Organization.
Ahmed, A. (2007). Road Safety in Pakistan. National Road Safety Secretariat, Islamabad, 2007b: pp.
142.
Subhan, F., Kanwal, H., Sulaiman, M., Naeem, M.M., Shafiq, M.M.I., Sajjad, U., Ajwad, A., Aqdas,
A. (2017). National Road Crash Injuries – An Estimation and Comparison with Previous National
Studies. The Nucleus, 54(4), pp. 210-213.
El-Basyouny, K., Sayed, T. (2009). Accident prediction models with random corridor parameters.
Accident Analysis & Prevention, 41(5), pp. 1118-1123.
- 25 -
�Advances in Transportation Studies: an international Journal
679
680
681
682
683
684
685
686
687
688
689
690
691
692
693
694
695
696
697
698
699
700
701
702
703
704
705
706
707
708
709
710
711
712
713
714
715
716
717
718
719
720
721
722
723
724
21.
22.
23.
24.
25.
26.
27.
28.
29.
30.
31.
32.
33.
34.
35.
36.
37.
38.
39.
40.
Caliendo, C., Guida, M., Parisi, A. (2007). A crash-prediction model for multilane roads. Accident
Analysis & Prevention, 39(4), pp. 657-670.
Anastasopoulos, P.C., Mannering, F.L. (2009). A note on modeling vehicle accident frequencies with
random-parameters count models. Accident Analysis & Prevention, 41(1), pp. 153-159.
Savolainen, P., Mannering, F. (2007). Probabilistic models of motorcyclists’ injury severities in singleand multi-vehicle crashes. Accident Analysis & Prevention, 39(5), pp. 955-963.
Moore, D.N., Schneider, IV W.H., Savolainen, P.T., Farzaneh, M. (2011). Mixed logit analysis of
bicyclist injury severity resulting from motor vehicle crashes at intersection and non-intersection
locations. Accident Analysis & Prevention, 43(3), pp. 621-630.
Chen, F., Chen, S. (2011). Injury severities of truck drivers in single-and multi-vehicle accidents on
rural highways. Accident Analysis & Prevention, 43(5), pp. 1677-1688.
Abay, K.A. (2013). Examining pedestrian-injury severity using alternative disaggregate models.
Research in Transportation Economics, 43(1), pp. 123-136.
Doğan, A.A.E., ANgüngör, A.P. (2008). Estimating road accidents of Turkey based on regression
analysis and artificial neural network approach. Advances in transportation studies, 16, pp. 11-22.
Anastasopoulos, P.C., Tarko, A.P., Mannering, F.L. (2008). Tobit analysis of vehicle accident rates on
interstate highways. Accident Analysis & Prevention, 40(2), pp. 768-775.
Zargar, M., Roudsari, B.S., Shadman, M., Kaviani, A., Tarighi, P. (2003). Pediatric transport related
injuries in Tehran: the necessity of implementation of injury prevention protocols. Injury, 34(11), pp.
820-824.
Haque, M.O. (2011). Road casualty in Brunei Darussalam: country commentary. Advances in
transportation studies, (25).
Rakha, H., Arafeh M., Abdel-Salam, A.G., Guo F.F., Flintsch, A.M. (2010). Linear regression crash
prediction models: issues and proposed solutions. Efficient Transportation and Pavement Systems:
Characterization, Mechanisms, Simulation and Modeling, pp. 241-256.
Agyemang, B. (2013). Regression Analysis of Road Traffic Accidents and Population Growth in
Ghana. International journal of business and social research, 3(10), pp. 41-47.
Zlatoper, T.J. (1984). Regression analysis of time series data on motor vehicle deaths in the United
States. Journal of Transport Economics and Policy, pp. 263-274.
Desai, M.M., Patel, A.K. (2011). Road accidents study based on regression model: a case study of
Ahmedabad City. In National Conference On Recent Trends In Engeneering & Technology, pp. 1-8.
Cai, H., Zhu, D., Yan, L. (2015). Using multi-regression to analyze and predict road traffic safety level
in China. In 2015 International Conference on Transportation Information and Safety (ICTIS), pp. 363369 IEEE.
Bener, A., Yousif, A., Al-Malki, M.A., El-Jack, I., Bener, M. (2011). Is road traffic fatalities affected
by economic growth and urbanization development? Advances in transportation studies, 23, pp. 89-96.
Ahmed, A., Khan, B.A., Khurshid, M.B., Khan, M.B., Waheed, A. (2016). Estimating national road
crash fatalities using aggregate data. International Journal of Injury Control and Safety Promotion,
23(3), pp. 249-254.
Bener, A., Crundall, D. (2005). Road traffic accidents in the United Arab Emirates compared to
Western countries. in Advances in Transportation Studies, Section A 6. Citeseer.
Bener, A., Bener, O.F. (2007). Mobile phone use while driving and risk of road traffic injury: applying
the Lorenz Curve and associated Gini Index. Advances in Transportation Studies, 13, pp. 77-82.
Harnen, S., Umar, R. R., Wong, S. V., Hashim, W. W. (2006). Motorcycle accident prediction model
for junctions on urban roads in Malaysia. Advances in Transportation Studies, an International Journal
Section A, 8.
- 26 -
�Advances in Transportation Studies: an international Journal
725
726
727
728
729
730
731
732
733
734
735
736
737
738
739
740
741
742
743
744
745
746
747
748
749
750
751
752
753
754
755
756
757
758
759
760
761
762
763
764
765
766
767
768
769
770
41.
42.
43.
44.
45.
46.
47.
48.
49.
50.
51.
52.
53.
54.
55.
56.
57.
58.
59.
60.
61.
Belwal, R., Belwal, S., Quraini, A.A. (2015). Road Traffic Accidents (RTAs) and road safety in Oman:
an analysis of people's perception towards the causes. Advances in Transportation Studies, 37.
Burgut, H.R., Bener, A., Sidahmed, H., Albuz, R., Sanya, R., Khan, W.A. (2010). Risk factors
contributing to road traffic crashes in a fast-developing country: the neglected health problem. Turkish
Journal of Trauma and Emergency Surgery, 16(6), pp. 497-502.
Schmucker, U., Dandona, R., Kumar, G.A., Dandona, L. (2011). Crashes involving motorised
rickshaws in urban India: Characteristics and injury patterns. Injury, 42(1), pp. 104-111.
Afukaar, F.K., Antwi, P., Ofosu-Amaah, S. (2003). Pattern of road traffic injuries in Ghana:
implications for control, Injury Control and Safety Promotion, 10(1-2), pp. 69-76.
Shah., S.A.R., and Khattak, A. (2013). Road traffic accident analysis of motorways in Pakistan.
International Journal of Engineering, 2(11), pp. 2340-2354.
Khan, A.M., Tehreem, A. (2012). Causes of road accidents in Pakistan. Journal of Asian Development
Studies, 1(1), pp. 22-29.
Gonzalez, C., Perez, ME. (2012). IRF World Road Statistics 2012: Data 2005-2012. World Road
Statistics, 2012.
WB (2007). International Bank for Reconstruction and Development/The World Bank, World
Development Indicators, Washington DC.
Razzak, J.A., Shamim, M.S., Mehmood, A., Hussain, S.A., Ali, M.S., Jooma, R. (2012). A successful
model of Road Traffic Injury surveillance in a developing country: process and lessons learnt. BMC
Public Health, 12, pp. 357.
Kayani, A., Fleiter J.J., King, M.J. (2013). Under-reporting of road crashes in Pakistan and the role of
fate. Traffic Injury Prevention, 15(1), pp. 34-39.
Khoso, A. K., Ekman, D. S., Bhatti, J. A. (2011). Comparison of Highway Crash Reporting in Pakistan
With the World Health Organization Injury Surveillance Guidelines. Traffic Injury Prevention, 12(3),
pp. 279-282.
Bester, C.J. (2001). Explaining national road fatalities. Accident Analysis & Prevention, 33(5), pp. 663672.
Roess, R.P., Prassas, E.S., W.R. McShane, W.R. (2004). Traffic engineering. Pearson/Prentice Hall.
Andersson, H. (2007). Willingness to pay for road safety and estimates of the risk of death: evidence
from a Swedish contingent valuation study. Accident Analysis & Prevention, 39(4), pp. 853-865.
Svensson, M. Johansson, M.V. (2010). Willingness to pay for private and public road safety in stated
preference studies: why the difference? Accident Analysis & Prevention, 42(4), pp. 1205-1212.
Persson, U., Norinder, A., Hjalte, K., Gralén, K. (2001). The value of a statistical life in transport:
findings from a new contingent valuation study in Sweden. Journal of Risk and Uncertainty,. 23(2), pp.
121-134.
Finch, D. J., Kompfner, P., Lockwood, C. R., Maycock, G. (1994). Speed, speed limits and accidents.
Safety Resource Centre.
Moradi, A., Motevalian, S. A., Mirkoohi, M., McKay, M. P., Rahimi-Movaghar, V. (2013). Exceeding
the speed limit: prevalence and determinants in Iran. International journal of injury control and safety
promotion, 20(4), pp. 307-312.
World Health Organization (2013). Global status report on road safety: Supporting a decade of action,
World Health Organization, Geneva, Switzerland.
Malyshkina, N.V., Mannering, F. (2008). Effect of increases in speed limits on severities of injuries in
accidents. Transportation research record, 2083(1), pp. 122-127.
Eustace, D., Almutairi, O.E., Hovey, P.W. (2016). Modeling factors contributing to injury and fatality
of run-off-road crashes in Ohio. Advances in Transportation Studies, Section B, 40.
- 27 -
�Advances in Transportation Studies: an international Journal
771
772
773
774
775
776
777
778
779
780
781
782
783
784
785
786
787
788
789
790
791
792
793
794
795
796
797
798
799
800
801
802
803
62.
63.
64.
65.
66.
67.
68.
69.
70.
71.
72.
73.
74.
75.
Elvik, R., Høye, A., Vaa, T., & Sørensen, M. (2009). Driver Training and Regulation of Professional
Drivers', The Handbook of Road Safety Measures. Emerald Group Publishing Limited.
Stevenson, M., Yu, J., Hendrie, D., Li, L. P., Ivers, R., Zhou, Y., Su, S., Norton, R. (2008). Reducing
the burden of road traffic injury: translating high-income country interventions to middle-income and
low-income countries. Injury prevention, 14(5), pp. 284-289.
Farmer, C.M., Wells, J.K. (2010). Effect of enhanced seat belt reminders on driver fatality risk. Journal
of safety research, 41(1): pp. 53-57.
Eric, H., Frank, W. (1999). Road Safety Audit Guidelines. Fredericton, New Brunswick: University of
New Brunswick.
Vasudevan, V., Nambisan, S.S., Singh, A.K., Pearl, T. (2009). Effectiveness of media and enforcement
campaigns in increasing seat belt usage rates in a state with a secondary seat belt law. Traffic injury
prevention, 10(4), pp. 330-339.
Turner, B., Breen, J., Howard, E. (2015). Road safety manual: a manual for practitioners and decision
makers on implementing safe system infrastructure.
Washington, S., Karlaftis, M.G, Mannering, F.L. (2003). Statistical and Econometric Methods for
Transportation Data Analysis. Chapman & Hall/CRC New York.
Dean, C., Lawless, J.F. (1989). Tests for detecting overdispersion in Poisson regression models.
Journal of the American Statistical Association, 84(406), pp. 467-472.
Hauer, E. (2004). Statistical road safety modeling. Transportation Research Record, 1897(1), pp. 8187.
Hauer, E., Council, F.M., Mohammedshah, Y. (2004). Safety models for urban four-lane undivided
road segments. Transportation research record, 1897(1), pp. 96-105.
Klair. A. A., Arfan. M. (2014). Use of seat belt and enforcement of seat belt laws in Pakistan. Traffic
Injury Prevention, 15(7), pp. 706-710.
Bhatti, J.A., Ahmed, A. (2014). Evaluating performance of a Lead Road Safety Agency (LRSA) in a
low-income country: A case study from Pakistan. International Journal of Injury Control and Safety
Promotion, 21(2), pp. 136–143.
Mansor, S. A., Saman, M. A., Razman, T. T., & Masnel, H. (2019, April). Road safety audit–what we
have learnt? in IOP Conference Series: Materials Science and Engineering. (Vol. 512, No. 1, p.
012023). IOP Publishing.
World Health Organization. (2017). Managing speed (No. WHO/NMH/NVI/17.7). World Health
Organization.
- 28 -
�
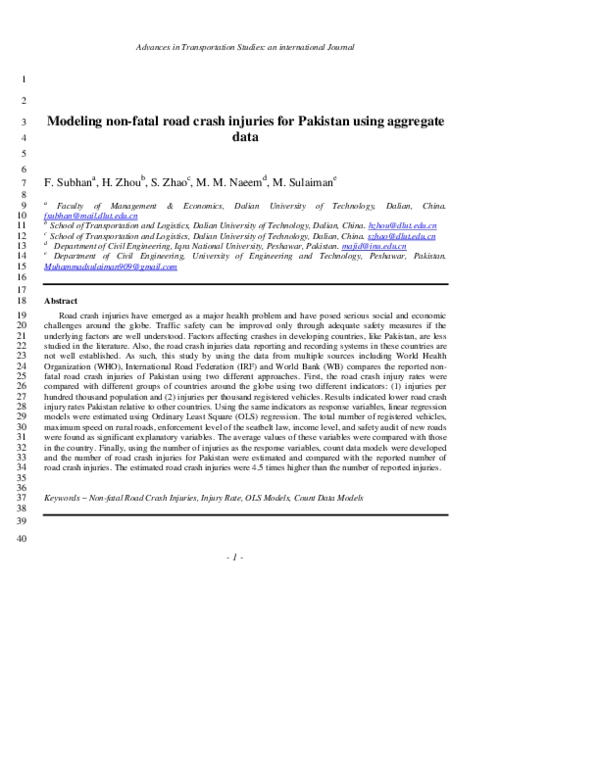
 Fazle Subhan