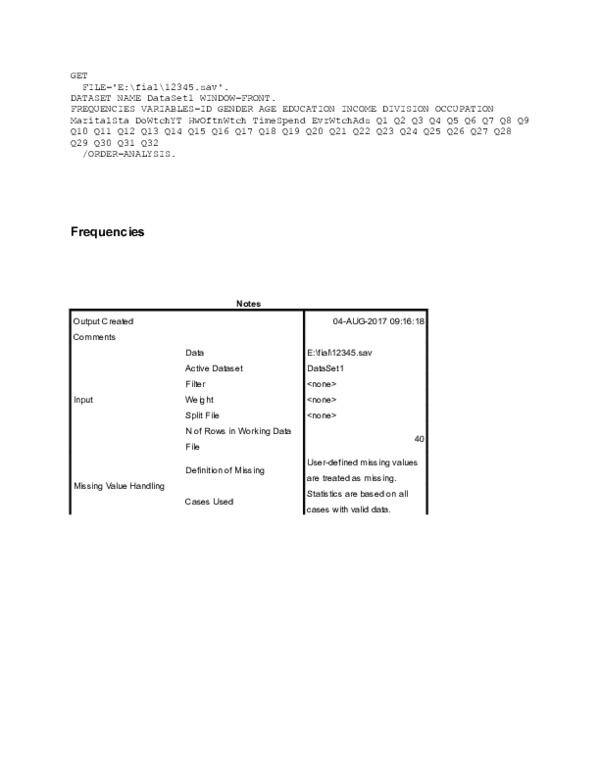
GET
FILE='E:\fial\12345.sav'.
DATASET NAME DataSet1 WINDOW=FRONT.
FREQUENCIES VARIABLES=ID GENDER AGE EDUCATION INCOME DIVISION OCCUPATION MaritalSta DoWtchYT HwOftnWtch TimeSpend EvrWtchAds Q1 Q2 Q3 Q4 Q5 Q6 Q7 Q8 Q9 Q10 Q11 Q12 Q13 Q14 Q15 Q16 Q17 Q18 Q19 Q20 Q21 Q22 Q23 Q24 Q25 Q26 Q27 Q28 Q29 Q30 Q31 Q32
/ORDER=ANALYSIS.
Frequencies
Notes
Output Created
04-AUG-2017 09:16:18
Comments
Input
Data
E:\fial\12345.sav
Active Dataset
DataSet1
Filter
<none>
Weight
<none>
Split File
<none>
N of Rows in Working Data File
40
Missing Value Handling
Definition of Missing
User-defined missing values are treated as missing.
Cases Used
Statistics are based on all cases with valid data.
Syntax
FREQUENCIES VARIABLES=ID GENDER AGE EDUCATION INCOME DIVISION OCCUPATION MaritalSta DoWtchYT HwOftnWtch TimeSpend EvrWtchAds Q1 Q2 Q3 Q4 Q5 Q6 Q7 Q8 Q9 Q10 Q11 Q12 Q13 Q14 Q15 Q16 Q17 Q18 Q19 Q20 Q21 Q22 Q23 Q24 Q25 Q26 Q27 Q28 Q29 Q30 Q31 Q32
/ORDER=ANALYSIS.
Resources
Processor Time
00:00:00.02
Elapsed Time
00:00:00.02
[DataSet1] E:\fial\12345.sav
Statistics
ID
GENDER OF THE RESPONDENT
AGE OF THE RESPONDENT
LEVEL OF EDUCATION
LEVEL OF INCOME
N
Valid
40
40
40
40
40
Missing
0
0
0
0
0
Statistics
DIVISION OF ORIGIN
OCCUPATION OF THE RESPONDENT
MARITAL STATUS OF THE RESPONDENT
DO YOU WATCH YOUTUBE?
HOW OFTEN DO YOU WATCH YOUTUBE?
N
Valid
40
40
40
40
40
Missing
0
0
0
0
0
Statistics
HOW MUCH TIME DO YOU SPEND ON YOUTUBE?
DO YOU EVER WATCH ADVERTISEMENT ON YOUTUBE?
VIDEO QUALITY IS THE MAIN REASON FOR VIEWER SATISFACTION
Viewers always looking for Quality of videos to be satisfied.
Viewers Like more, when the video Quality is good.
N
Valid
40
40
40
40
40
Missing
0
0
0
0
0
Statistics
Viewers satisfaction comes from HD video quality.
Relevant advertisement leads the viewers towards satisfaction
Viewers satisfied more when the advertisement of video is relevant.
Viewers want to see Relevant Advertisement in video on YouTube
Viewers satisfaction varies when the ad is related to their needs.
N
Valid
40
40
40
40
40
Missing
0
0
0
0
0
Statistics
The video should be credible to the viewers in order to be satisfied.
Viewers are interested to those videos which seems Authentic/Real To them
Trustable Contents/Ads usually get MORE Response from viewers than fake videos.
Viewers do not skip the ad when the contents/ads are trustable.
Advertisement with Good Sound Quality is mostly Preferred by Viewers.
N
Valid
40
40
40
40
40
Missing
0
0
0
0
0
Statistics
Good Sound Quality of Ads leads to Higher Satisfaction to Viewers.
Viewers usually remember those ads, which sound quality is good.
Good content but with poor sound quality is so annoying to the viewers.
Advertisement with SHORT time Frame Are Usually Preferred by Viewers
Advertisement with LONG time Frame Are Usually Preferred by Viewers
N
Valid
40
40
40
40
40
Missing
0
0
0
0
0
Statistics
Viewers Can be Satisfied with Any Time Frame Scheduled in a video
Long time frame contents/ads mostly skipped by the viewers.
Satisfaction is dependent on GENDER of the viewer.
Satisfaction in Ads Can be Varied based on viewers AGE.
Occupation of the ad viewers is an important factor to determine satisfaction.
N
Valid
40
40
40
40
40
Missing
0
0
0
0
0
Statistics
Satisfaction in ad can be varied based on viewers marital status.
The Content of Ad should be INTERESTING to satisfy a viewer.
The Viewers mostly prefer those ads which seems interesting to them.
Interesting Ads usually are mostly remembered by viewers.
Interesting advertisements of an item move viewers to observe more distant ads of the specific item.
N
Valid
40
40
40
40
40
Missing
0
0
0
0
0
Statistics
The Advertisement is only successful when viewers are satisfied
Satisfied viewers usually retain, refer & replay the ads more than a viewer who is NOT Satisfied.
Overall, in order get an effective YouTube ad campaign marketer needs to prioritize viewer’s satisfaction.
Viewers satisfaction depends on the overall content, quality, and the product.
N
Valid
40
40
40
40
Missing
0
0
0
0
Frequency Table
ID
Frequency
Percent
Valid Percent
Cumulative Percent
Valid
1.00
1
2.5
2.5
2.5
2.00
1
2.5
2.5
5.0
3.00
1
2.5
2.5
7.5
4.00
1
2.5
2.5
10.0
5.00
1
2.5
2.5
12.5
6.00
1
2.5
2.5
15.0
7.00
1
2.5
2.5
17.5
8.00
1
2.5
2.5
20.0
9.00
1
2.5
2.5
22.5
10.00
1
2.5
2.5
25.0
11.00
1
2.5
2.5
27.5
12.00
1
2.5
2.5
30.0
13.00
1
2.5
2.5
32.5
14.00
1
2.5
2.5
35.0
15.00
1
2.5
2.5
37.5
16.00
1
2.5
2.5
40.0
17.00
1
2.5
2.5
42.5
18.00
1
2.5
2.5
45.0
19.00
1
2.5
2.5
47.5
20.00
1
2.5
2.5
50.0
21.00
1
2.5
2.5
52.5
22.00
1
2.5
2.5
55.0
23.00
1
2.5
2.5
57.5
24.00
1
2.5
2.5
60.0
25.00
1
2.5
2.5
62.5
26.00
1
2.5
2.5
65.0
27.00
1
2.5
2.5
67.5
28.00
1
2.5
2.5
70.0
29.00
1
2.5
2.5
72.5
30.00
1
2.5
2.5
75.0
31.00
1
2.5
2.5
77.5
32.00
1
2.5
2.5
80.0
ID
Frequency
Percent
Valid Percent
Cumulative Percent
Valid
33.00
1
2.5
2.5
82.5
34.00
1
2.5
2.5
85.0
35.00
1
2.5
2.5
87.5
36.00
1
2.5
2.5
90.0
37.00
1
2.5
2.5
92.5
38.00
1
2.5
2.5
95.0
39.00
1
2.5
2.5
97.5
40.00
1
2.5
2.5
100.0
Total
40
100.0
100.0
GENDER OF THE RESPONDENT
Frequency
Percent
Valid Percent
Cumulative Percent
Valid
MALE
23
57.5
57.5
57.5
FEMALE
17
42.5
42.5
100.0
Total
40
100.0
100.0
AGE OF THE RESPONDENT
Frequency
Percent
Valid Percent
Cumulative Percent
Valid
13-18
9
22.5
22.5
22.5
19-35
21
52.5
52.5
75.0
36-50
6
15.0
15.0
90.0
51-65
3
7.5
7.5
97.5
65 & above
1
2.5
2.5
100.0
Total
40
100.0
100.0
LEVEL OF EDUCATION
Frequency
Percent
Valid Percent
Cumulative Percent
Valid
Secondary school
8
20.0
20.0
20.0
Bachelor
18
45.0
45.0
65.0
Master's degree
11
27.5
27.5
92.5
Others
3
7.5
7.5
100.0
Total
40
100.0
100.0
LEVEL OF INCOME
Frequency
Percent
Valid Percent
Cumulative Percent
Valid
below 20K
20
50.0
50.0
50.0
20K-50K
6
15.0
15.0
65.0
50K-80K
7
17.5
17.5
82.5
80K-120K
4
10.0
10.0
92.5
120K & above
3
7.5
7.5
100.0
Total
40
100.0
100.0
DIVISION OF ORIGIN
Frequency
Percent
Valid Percent
Cumulative Percent
Valid
Dhaka
18
45.0
45.0
45.0
Chittagong
8
20.0
20.0
65.0
Rajshahi
6
15.0
15.0
80.0
Sylhet
2
5.0
5.0
85.0
Khullna
1
2.5
2.5
87.5
Rangpur
3
7.5
7.5
95.0
Mymensingh
2
5.0
5.0
100.0
Total
40
100.0
100.0
OCCUPATION OF THE RESPONDENT
Frequency
Percent
Valid Percent
Cumulative Percent
Valid
Student
23
57.5
57.5
57.5
Business
2
5.0
5.0
62.5
Service holder
10
25.0
25.0
87.5
Home maker
2
5.0
5.0
92.5
Self employed
1
2.5
2.5
95.0
Others
2
5.0
5.0
100.0
Total
40
100.0
100.0
MARITAL STATUS OF THE RESPONDENT
Frequency
Percent
Valid Percent
Cumulative Percent
Valid
Married
15
37.5
37.5
37.5
Unmarried
25
62.5
62.5
100.0
Total
40
100.0
100.0
DO YOU WATCH YOUTUBE?
Frequency
Percent
Valid Percent
Cumulative Percent
Valid
Yes
40
100.0
100.0
100.0
HOW OFTEN DO YOU WATCH YOUTUBE?
Frequency
Percent
Valid Percent
Cumulative Percent
Valid
Never
1
2.5
2.5
2.5
Rarely
2
5.0
5.0
7.5
Sometimes
9
22.5
22.5
30.0
Frequently
28
70.0
70.0
100.0
Total
40
100.0
100.0
HOW MUCH TIME DO YOU SPEND ON YOUTUBE?
Frequency
Percent
Valid Percent
Cumulative Percent
Valid
1 hour per day
16
40.0
40.0
40.0
2-4 hours per day
16
40.0
40.0
80.0
4-6 hours per day
2
5.0
5.0
85.0
Above
6
15.0
15.0
100.0
Total
40
100.0
100.0
DO YOU EVER WATCH ADVERTISEMENT ON YOUTUBE?
Frequency
Percent
Valid Percent
Cumulative Percent
Valid
Yes
40
100.0
100.0
100.0
VIDEO QUALITY IS THE MAIN REASON FOR VIEWER SATISFACTION
Frequency
Percent
Valid Percent
Cumulative Percent
Valid
Disagree
5
12.5
12.5
12.5
Neutral
6
15.0
15.0
27.5
Agree
17
42.5
42.5
70.0
Strongly agree
12
30.0
30.0
100.0
Total
40
100.0
100.0
Viewers always looking for Quality of videos to be satisfied.
Frequency
Percent
Valid Percent
Cumulative Percent
Valid
Strongly disagree
1
2.5
2.5
2.5
Disagree
2
5.0
5.0
7.5
Neutral
6
15.0
15.0
22.5
Agree
19
47.5
47.5
70.0
Strongly agree
12
30.0
30.0
100.0
Total
40
100.0
100.0
Viewers Like more, when the video Quality is good.
Frequency
Percent
Valid Percent
Cumulative Percent
Valid
Disagree
4
10.0
10.0
10.0
Neutral
5
12.5
12.5
22.5
Agree
14
35.0
35.0
57.5
Strongly agree
17
42.5
42.5
100.0
Total
40
100.0
100.0
Viewers satisfaction comes from HD video quality.
Frequency
Percent
Valid Percent
Cumulative Percent
Valid
Strongly disagree
1
2.5
2.5
2.5
Disagree
1
2.5
2.5
5.0
Neutral
12
30.0
30.0
35.0
Agree
14
35.0
35.0
70.0
Strongly agree
12
30.0
30.0
100.0
Total
40
100.0
100.0
Relevant advertisement leads the viewers towards satisfaction
Frequency
Percent
Valid Percent
Cumulative Percent
Valid
Disagree
6
15.0
15.0
15.0
Neutral
15
37.5
37.5
52.5
Agree
12
30.0
30.0
82.5
Strongly agree
7
17.5
17.5
100.0
Total
40
100.0
100.0
Viewers satisfied more when the advertisement of video is relevant.
Frequency
Percent
Valid Percent
Cumulative Percent
Valid
Strongly disagree
3
7.5
7.5
7.5
Disagree
3
7.5
7.5
15.0
Neutral
16
40.0
40.0
55.0
Agree
12
30.0
30.0
85.0
Strongly agree
6
15.0
15.0
100.0
Total
40
100.0
100.0
Viewers want to see Relevant Advertisement in video on YouTube
Frequency
Percent
Valid Percent
Cumulative Percent
Valid
Strongly disagree
5
12.5
12.5
12.5
Disagree
5
12.5
12.5
25.0
Neutral
11
27.5
27.5
52.5
Agree
13
32.5
32.5
85.0
Strongly agree
6
15.0
15.0
100.0
Total
40
100.0
100.0
Viewers satisfaction varies when the ad is related to their needs.
Frequency
Percent
Valid Percent
Cumulative Percent
Valid
Strongly disagree
2
5.0
5.0
5.0
Disagree
2
5.0
5.0
10.0
Neutral
3
7.5
7.5
17.5
Agree
24
60.0
60.0
77.5
Strongly agree
9
22.5
22.5
100.0
Total
40
100.0
100.0
The video should be credible to the viewers in order to be satisfied.
Frequency
Percent
Valid Percent
Cumulative Percent
Valid
Strongly disagree
1
2.5
2.5
2.5
Disagree
2
5.0
5.0
7.5
Neutral
11
27.5
27.5
35.0
Agree
17
42.5
42.5
77.5
Strongly agree
9
22.5
22.5
100.0
Total
40
100.0
100.0
Viewers are interested to those videos which seems Authentic/Real To them
Frequency
Percent
Valid Percent
Cumulative Percent
Valid
Disagree
2
5.0
5.0
5.0
Neutral
9
22.5
22.5
27.5
Agree
18
45.0
45.0
72.5
Strongly agree
11
27.5
27.5
100.0
Total
40
100.0
100.0
Trustable Contents/Ads usually get MORE Response from viewers than fake videos.
Frequency
Percent
Valid Percent
Cumulative Percent
Valid
Strongly disagree
1
2.5
2.5
2.5
Disagree
1
2.5
2.5
5.0
Neutral
8
20.0
20.0
25.0
Agree
17
42.5
42.5
67.5
Strongly agree
13
32.5
32.5
100.0
Total
40
100.0
100.0
Viewers do not skip the ad when the contents/ads are trustable.
Frequency
Percent
Valid Percent
Cumulative Percent
Valid
Strongly disagree
4
10.0
10.0
10.0
Disagree
4
10.0
10.0
20.0
Neutral
14
35.0
35.0
55.0
Agree
13
32.5
32.5
87.5
Strongly agree
5
12.5
12.5
100.0
Total
40
100.0
100.0
Advertisement with Good Sound Quality is mostly Preferred by Viewers.
Frequency
Percent
Valid Percent
Cumulative Percent
Valid
Strongly disagree
1
2.5
2.5
2.5
Disagree
1
2.5
2.5
5.0
Neutral
10
25.0
25.0
30.0
Agree
12
30.0
30.0
60.0
Strongly agree
16
40.0
40.0
100.0
Total
40
100.0
100.0
Good Sound Quality of Ads leads to Higher Satisfaction to Viewers.
Frequency
Percent
Valid Percent
Cumulative Percent
Valid
Strongly disagree
1
2.5
2.5
2.5
Disagree
6
15.0
15.0
17.5
Neutral
9
22.5
22.5
40.0
Agree
16
40.0
40.0
80.0
Strongly agree
8
20.0
20.0
100.0
Total
40
100.0
100.0
Viewers usually remember those ads, which sound quality is good.
Frequency
Percent
Valid Percent
Cumulative Percent
Valid
Strongly disagree
1
2.5
2.5
2.5
Disagree
3
7.5
7.5
10.0
Neutral
15
37.5
37.5
47.5
Agree
14
35.0
35.0
82.5
Strongly agree
7
17.5
17.5
100.0
Total
40
100.0
100.0
Good content but with poor sound quality is so annoying to the viewers.
Frequency
Percent
Valid Percent
Cumulative Percent
Valid
Strongly disagree
4
10.0
10.0
10.0
Neutral
6
15.0
15.0
25.0
Agree
20
50.0
50.0
75.0
Strongly agree
10
25.0
25.0
100.0
Total
40
100.0
100.0
Advertisement with SHORT time Frame Are Usually Preferred by Viewers
Frequency
Percent
Valid Percent
Cumulative Percent
Valid
Strongly disagree
1
2.5
2.5
2.5
Disagree
1
2.5
2.5
5.0
Neutral
1
2.5
2.5
7.5
Agree
16
40.0
40.0
47.5
Strongly agree
21
52.5
52.5
100.0
Total
40
100.0
100.0
Advertisement with LONG time Frame Are Usually Preferred by Viewers
Frequency
Percent
Valid Percent
Cumulative Percent
Valid
Strongly disagree
23
57.5
57.5
57.5
Disagree
9
22.5
22.5
80.0
Neutral
7
17.5
17.5
97.5
Agree
1
2.5
2.5
100.0
Total
40
100.0
100.0
Viewers Can be Satisfied with Any Time Frame Scheduled in a video
Frequency
Percent
Valid Percent
Cumulative Percent
Valid
Strongly disagree
9
22.5
22.5
22.5
Disagree
11
27.5
27.5
50.0
Neutral
16
40.0
40.0
90.0
Agree
4
10.0
10.0
100.0
Total
40
100.0
100.0
Long time frame contents/ads mostly skipped by the viewers.
Frequency
Percent
Valid Percent
Cumulative Percent
Valid
Disagree
2
5.0
5.0
5.0
Neutral
3
7.5
7.5
12.5
Agree
17
42.5
42.5
55.0
Strongly agree
18
45.0
45.0
100.0
Total
40
100.0
100.0
Satisfaction is dependent on GENDER of the viewer.
Frequency
Percent
Valid Percent
Cumulative Percent
Valid
Strongly disagree
3
7.5
7.5
7.5
Disagree
4
10.0
10.0
17.5
Neutral
22
55.0
55.0
72.5
Agree
6
15.0
15.0
87.5
Strongly agree
5
12.5
12.5
100.0
Total
40
100.0
100.0
Satisfaction in Ads Can be Varied based on viewers AGE.
Frequency
Percent
Valid Percent
Cumulative Percent
Valid
Strongly disagree
3
7.5
7.5
7.5
Neutral
9
22.5
22.5
30.0
Agree
22
55.0
55.0
85.0
Strongly agree
6
15.0
15.0
100.0
Total
40
100.0
100.0
Occupation of the ad viewers is an important factor to determine satisfaction.
Frequency
Percent
Valid Percent
Cumulative Percent
Valid
Strongly disagree
1
2.5
2.5
2.5
Disagree
1
2.5
2.5
5.0
Neutral
16
40.0
40.0
45.0
Agree
17
42.5
42.5
87.5
Strongly agree
5
12.5
12.5
100.0
Total
40
100.0
100.0
Satisfaction in ad can be varied based on viewers marital status.
Frequency
Percent
Valid Percent
Cumulative Percent
Valid
Strongly disagree
4
10.0
10.0
10.0
Disagree
9
22.5
22.5
32.5
Neutral
14
35.0
35.0
67.5
Agree
11
27.5
27.5
95.0
Strongly agree
2
5.0
5.0
100.0
Total
40
100.0
100.0
The Content of Ad should be INTERESTING to satisfy a viewer.
Frequency
Percent
Valid Percent
Cumulative Percent
Valid
Neutral
3
7.5
7.5
7.5
Agree
17
42.5
42.5
50.0
Strongly agree
20
50.0
50.0
100.0
Total
40
100.0
100.0
The Viewers mostly prefer those ads which seems interesting to them.
Frequency
Percent
Valid Percent
Cumulative Percent
Valid
Strongly disagree
1
2.5
2.5
2.5
Neutral
6
15.0
15.0
17.5
Agree
19
47.5
47.5
65.0
Strongly agree
14
35.0
35.0
100.0
Total
40
100.0
100.0
Interesting Ads usually are mostly remembered by viewers.
Frequency
Percent
Valid Percent
Cumulative Percent
Valid
Disagree
2
5.0
5.0
5.0
Neutral
5
12.5
12.5
17.5
Agree
19
47.5
47.5
65.0
Strongly agree
14
35.0
35.0
100.0
Total
40
100.0
100.0
Interesting advertisements of an item move viewers to observe more distant ads of the specific item.
Frequency
Percent
Valid Percent
Cumulative Percent
Valid
Strongly disagree
1
2.5
2.5
2.5
Disagree
1
2.5
2.5
5.0
Neutral
14
35.0
35.0
40.0
Agree
19
47.5
47.5
87.5
Strongly agree
5
12.5
12.5
100.0
Total
40
100.0
100.0
The Advertisement is only successful when viewers are satisfied
Frequency
Percent
Valid Percent
Cumulative Percent
Valid
Strongly disagree
1
2.5
2.5
2.5
Neutral
7
17.5
17.5
20.0
Agree
18
45.0
45.0
65.0
Strongly agree
14
35.0
35.0
100.0
Total
40
100.0
100.0
Satisfied viewers usually retain, refer & replay the ads more than a viewer who is NOT Satisfied.
Frequency
Percent
Valid Percent
Cumulative Percent
Valid
Strongly disagree
2
5.0
5.0
5.0
Disagree
3
7.5
7.5
12.5
Neutral
19
47.5
47.5
60.0
Agree
11
27.5
27.5
87.5
Strongly agree
5
12.5
12.5
100.0
Total
40
100.0
100.0
Overall, in order get an effective YouTube ad campaign marketer needs to prioritize viewer’s satisfaction.
Frequency
Percent
Valid Percent
Cumulative Percent
Valid
Disagree
2
5.0
5.0
5.0
Neutral
5
12.5
12.5
17.5
Agree
24
60.0
60.0
77.5
Strongly agree
9
22.5
22.5
100.0
Total
40
100.0
100.0
Viewers satisfaction depends on the overall content, quality, and the product.
Frequency
Percent
Valid Percent
Cumulative Percent
Valid
Neutral
2
5.0
5.0
5.0
Agree
17
42.5
42.5
47.5
Strongly agree
21
52.5
52.5
100.0
Total
40
100.0
100.0
 Râ Ýh Àñ