PANSHARPENING OF MASTCAM IMAGES
C. Kwan, B. Budavari, M. Dao, B. Ayhan
J. F. Bell
Applied Research LLC
Arizona State University
ABSTRACT
This paper summarizes a new investigation of applying
advanced pansharpening algorithms to enhance the images
of the left imager in the Mastcam onboard the Curiosity
rover, which landed on Mars in 2012. The various
instruments on the rover have already made great
contributions in the understanding of Mars. The goal of our
research is to generate both high spatial and high spectral
image cube by using the left and right Mastcam imagers.
Eleven algorithms have been investigated using five
objective performance metrics. Subjective evaluations have
also been conducted. The image enhancement results are
encouraging.
Index Terms— Mastcam,
pansharpening, image enhancement
image
registration,
1. INTRODUCTION
The Curiosity rover has several instruments that can help
characterize the Mars surface. The APXS [1] can analyze
rock samples and extract compositions of rocks; the LIBS
[2] can collect spectral features from the vaporized fumes
and deduce the rock compositions at a distance of 7 m; and
Mastcam imagers [3] can perform surface characterization
from 1 km away.
There are two Mastcam multispectral imagers, separated
by 24.2 cm [3]. Specifically, the left Mastcam (34 mm focal
length) has three times the field of view of the right
Mastcam (100 mm focal length). That is, the right imager
has 3 times higher resolution than that of the left. Each
camera has 9 bands with 6 overlapping bands. For stereo
image formation and image fusion (merging of the left and
right bands to form a 12-band image cube), the current
practice is to downsample the right images to the resolution
of the left, avoiding artifacts due to Bayer pattern and also
lossy JPEG compression. This practice is certainly practical,
but may limit the full potential of Mastcams. First, although
downsampling of the right images can preserve the spectral
integrity and avoid certain artifacts of the image data, the
process will throw away some high spatial resolution pixels
in the right bands. Second, the current stereo images have
lower resolution, which may degrade the augmented reality
or virtual reality experience of science fans. If better
978-1-5090-4951-6/17/$31.00 ©2017 IEEE
demosaicing/debayering and compression algorithms are
available in the future, one may want to apply some
advanced pansharpening algorithms to the left bands so that
one can have 12 bands of high resolution image cube for
stereo vision and image fusion. In recent years, significant
advances have been made in image super-resolution and new
and high performance pansharpening algorithms have been
proposed regularly. In light of the above development, a
natural research question is: can we keep the 9 high
resolution bands in the right imager and improve the
resolution of all the bands in the left imager while
maintaining the spectral integrity of the left bands? If the
answer is positive, this may motivate researchers to develop
high performance demosaicing algorithms and also adopt
more advanced compression algorithms such as X264 in
future planetary missions. Moreover, both the user
experience of using high resolution stereo images, as well as
the surface characterization performance using 12-band of
high resolution images, will be greatly enhanced.
In this paper we attempt to answer the above question
by applying some recent pansharpening algorithms to the
Mastcam data. Preliminary results using actual Mastcam
images are encouraging. Objective and subjective studies
show that it is indeed possible to enhance the spatial
resolution of left bands while maintaining the spectral
integrity of the left bands.
2. MASTCAM
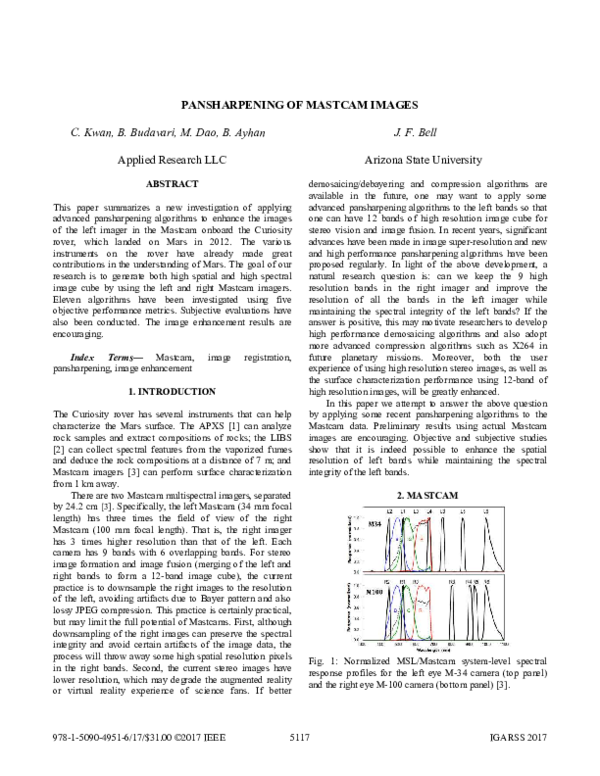
Fig. 1: Normalized MSL/Mastcam system-level spectral
response profiles for the left eye M-34 camera (top panel)
and the right eye M-100 camera (bottom panel) [3].
5117
IGARSS 2017
�Mastcam imager information is shown in Fig. 1. There are 6
overlapping bands and 3 non-overlapping bands (L3, L4 and
L5 from the left camera and R3, R4, and R5 from the right
camera). More details can be found in [3].
that can be adapted to the Mastcam data and has great
potential in significantly enhancing the resolution of left
bands. The basic idea is to utilize the right bands to enhance
the left bands.
Low spatial
resolution
right bands
3. KEY ALGORITHMS
3.1. Image Registration
Since the left image is of lower resolution, its resolution
needs to be enhanced before its 3 non-overlapping bands can
be merged together with the 9 high resolution bands in the
right camera. Before we can perform image enhancement,
the first step is to align the left and right image to subpixel
accuracy; otherwise misalignment errors may propagate to
the image enhancement process.
A two-step image alignment approach was developed
[4] and the signal flow is shown in Fig. 2. The first step of
the two-step image alignment approach is using RANSAC
(Random Sample Consensus) technique [19] for an initial
image alignment. In this first step, we use the two RGB
stereo images from the left and right Mastcams. First, SURF
features [20] and SIFT features [21] are extracted from the
two stereo images. These features are then matched within
the image pair. This is followed by applying RANSAC to
estimate the geometric transformation. Assuming the right
camera image is the reference image, the left camera image
content is then projected into a new image that is aligned
with the reference image using the geometric transformation.
The second step of the two-step alignment approach
uses this aligned image with RANSAC and the left camera
image as inputs and applies the Diffeomorphic Registration
[4] technique. Diffeomorphic Registration is formulated as a
constrained optimization problem, which is solved with a
step-then-correct strategy [4]. This second step reduces the
registration errors to subpixel levels so that pansharpening
can be performed.
High spatial
resolution
right bands
LR R
HR R
LR L
HR L
Low spatial
resolution
left bands
Pansharpened high
spatial resolution
left bands
Fig. 3. System flow of color mapping. LR denotes low
resolution; HR denotes high resolution; LR R denotes the set
of low resolution right pixels; LR L denotes the set of low
resolution left pixels; HR L denotes high resolution left
pixels.
Our idea [5] is called color mapping, which is the
mapping of a right pixel c( i , j ) at location (i,j) with M bands
to a left pixel X ( i , j ) with N bands at the same location. This
mapping is based on a transformation matrix T, i.e.
X ( i , j ) = T c( i , j )
(1)
N ×M
where T ∈ R . Fig. 3 shows the system flow. Given a high
resolution (HR) right image cube and a low resolution (LR)
left image cube, our goal is to generate a HR left image
cube. One advantage of our algorithm is that the Bayering
and JPEG artifacts will not be amplified, as we do not
require bicubic interpolation of the left images in our
algorithm. To get the transformation matrix, we simulate a
low resolution right image cube by down-sampling the HR
right image cube. We then use the LR right image cube and
the LR left image cube to train the T. Once T is obtained, it
can then be used for generating the HR left image pixel by
pixel.
Details of our algorithm can be found in [5][6][24].
Remark 1: HCM
A variant of the color mapping is to introduce a white band
and some low resolution left bands into the vector c( i , j ) .
That is,
ch = [c(1), …, c(M), h(k1), h(k2), ..., h(kt), 1]T
(2)
where [h(k1), h(k2),…, h(kt)] are extracted from the low
resolution left image cube. kt is the number of selected
bands.
Fig. 2. Block diagram of the two-step image alignment
approach.
3.2. Proposed Hybrid Color Mapping (HCM)
A simple approach to increasing the resolution of the left
images is to use bicubic interpolation [18]. However, it was
shown that bicubic interpolation is coarse and does not yield
satisfactory performance in both objective and subjective
evaluations [5] [6]. We developed a new algorithm in [5]
Remark 2: Local HCM
We further enhance our method by applying color mapping
patch by patch. A patch of size p × p is a sub-image in the
original image. The patches do not overlap. In this way,
spatial correlation can be exploited. As a result, the mapping
will be even more accurate. In addition, since the task is split
5118
�into many small tasks, the process can be easily parallelized
and hence is suitable for real-time processing.
3.3. Other Pansharpening Algorithms
There are two recent survey papers [7][8] summarizing the
state-of-the-art pansharpening algorithms in the literature.
The following 10 algorithms were selected in our studies:
Smoothing Filter-based Intensity Modulation (SFIM) [9],
Modulation Transfer Function Generalized Laplacian
Pyramid (MTF-GLP) [10], MTF-GLP with High Pass
Modulation (MTF-GLP-HPM) [11], Gram Schmidt (GS)
[12], GS Adaptive (GSA) [13], Principal Component
Analysis (PCA) [14], Guided Filter PCA (GFPCA) [15],
Hysure [16], and partial replaced adaptive component
substitution (PRACS) [17]. The bicubic interpolation
method [18] is also included in our study.
Although bicubic is faster than HCM, it is not considered as
a pansharpening method, as it does not use any of the right
bands. If we exclude bicubic, then HCM yielded the best
performance in all categories. Fig. 4 shows the CC of
different methods. CC is a measure of spectral integrity of
pansharpening. It can be seen that our HCM method
performs well across almost all the bands.
Table 1: Comparison of HCM with other algorithms.
HCM
SFIM
MTF-GLP
MTF-GLP-HPM
GS
GSA
PCA
GFPCA
Hysure
PRACS
Bicubic
3.4. Performance Metrics
We used the following 5 performance metrics in our studies:
Root Mean Squared Error (RMSE) [7], Cross Correlation
(CC) [7], Spectral Angle Mapper (SAM) [7], Erreur relative
globale adimensionnelle de synthèse (ERGAS) [7], and
computational time. Moreover, subjective evaluation has
been carried out for those non-overlapping left bands that do
not have ground truth images.
4. COMPARATIVE STUDIES
4.1. Data
The Mastcam dataset downloaded from the Planetary Data
System (PDS) resource contains a total of more than
500,000 images collected at different times and locations.
Since left and right Mastcams are independently controlled
and do not always collect data simultaneously, we have to
perform extensive pre-processing, which exhaustively
screens through all images to only select pairs of image sets
that consist of images of all available spectral bands in both
left and right Mastcam cameras. After preprocessing and
cleaning up the image sets, we can construct a total of 133
LR-pairs.
4.2. Performance of Pansharpening with Known Ground
Truth
For illustration purpose, we show the full details of the
pansharpening results of using one pair of Mastcam images
collected on sol 150 in our comparative studies. In HCM, a
patch size of 151 was used and only the 6 overlapping bands
in the right Mastcam were used. In addition, we performed
two iterations of the HCM algorithm to further improve its
performance. Similarly, for all the other pansharpening
algorithms, the pan band was created by taking the mean of
the 6 overlapping right bands.
Table 1 shows the 5 metrics. The RMSE, CC, SAM,
and ERGAS were generated by using the right high
resolution bands as the ground truth. It can be seen that
HCM performed the best in all categories, except time.
RMSE
0.0287
0.0368
0.0351
0.035
0.0333
0.0316
0.0311
0.0346
0.0312
0.0336
0.0406
CC
0.9693
0.9192
0.9308
0.9314
0.9403
0.9521
0.9529
0.9306
0.9563
0.9409
0.8902
SAM
2.3201
2.7123
2.6969
2.6931
2.631
2.6197
2.6242
2.5592
2.6617
2.7438
2.8083
ERGAS
1.4723
1.9276
1.8221
1.8153
1.7294
1.6075
1.6072
1.809
1.5971
1.7281
2.1489
Time
1.0661
1.7446
1.2508
1.3785
1.1254
1.2033
1.2436
1.4508
483.08
6.6205
0.0688
Fig. 4: Comparison of CC between HCM and all methods.
4.3 Performance of Image Fusion without Reference
The 3 non-overlapping bands in the left imager do not have
ground truth data. In [8], a metric known as Quality with No
Reference (QNR) was described. However, QNR requires
the pan to be overlapped with the other bands. Recently, a
new blind image quality assessment tool has been developed
[23]. We plan to apply that to this application in the future.
Here, we performed subjective evaluations by displaying the
pansharpened images. Fig. 5 shows the false color images by
forming RGB images using the pansharpened images from
L5, L3, and L4 bands. It can be seen that Hysure and HCM
can give very good visual appearance. If one zooms in, one
will notice that there are color distortions in GSA, GS, and
other methods whereas Hysure and HCM show almost no
observable color distortion.
5. CONCLUSIONS
The application of recently developed pansharpening
algorithms to enhance the left Mastcam images has been
summarized in this paper. Using both objective and
5119
�subjective performance metrics, preliminary results showed
that image quality can be improved tremendously. One
future direction is to develop a metric that can assess the
pansharpening performance without reference. Another
direction is to assess the performance gain by using the
fused image cube formed by combining the HR right bands
with the enhanced left bands in some pixel clustering and
anomaly detection applications [22]. A third one is to utilize
point spread function (PSF) to further enhance the resolution
of the left images.
HCM
SFIM
MTF-GLP
GS
GSA
PCA
Hysure
PRACS
bicubic
MTF-GLP-HPM
GFPCA
Fig. 5. Subjective evaluation of different pansharpening
algorithms. False color images are shown here.
6. REFERENCES
[1] B. Ayhan, C. Kwan, and S. Vance, “On the Use of a Linear
Spectral Unmixing Technique for Concentration Estimation of
APXS Spectrum,” J. Multidisciplinary Engineering Science
and Technology, Volume 2, Issue 9, September, 2015.
[2] W. Wang, S. Li, H. Qi, B. Ayhan, C. Kwan, and S. Vance,
“Revisiting the Preprocessing Procedures for Elemental
Concentration Estimation based on CHEMCAM LIBS on
MARS Rover,” 6th Workshop on Hyperspectral Image and
Signal Processing: Evolution in Remote Sensing (WHISPERS),
Lausanne, Switzerland, June 24-27, 2014.
[3] J. Bell et al., “The Mars Science Laboratory Curiosity Rover
Mast Camera (Mastcam) Instruments: Pre-Flight and In-Flight
Calibration, Validation, and Data Archiving,” submitted to the
AGU journal Earth and Space Science, 23 September 2016.
[4] B. Ayhan, M. Dao, C. Kwan, H. Chen, J. F. Bell, and R. Kidd,
“A Novel Image Alignment Approach for Mastcam Imagers of
Mars Rover with Application to Rover Guidance,” submitted
to IEEE Journal of Selected Topics in Applied Earth
Observations and Remote Sensing, April, 2017.
[5] J. Zhou, C. Kwan, and B. Budavari, “Hyperspectral Image
Super-Resolution: A Hybrid Color Mapping Approach,” SPIE
Journal of Applied Remote Sensing, September, 2016.
[6] C. Kwan, J. H. Choi, S. Chan, J. Zhou, and B. Budavari,
“Resolution Enhancement for Hyperspectral Images: A SuperResolution and Fusion Approach,” Int. Conf. Acoustics,
Speech, and Signal Processing, March, 2017.
[7] L. Loncan, et al., “Hyperspectral Pansharpening: A Review,”
IEEE Geoscience and remote sensing magazine, 9/2015.
[8] G. Vivone, et al., “A Critical Comparison Among
Pansharpening Algorithms,” IEEE Trans. Geoscience and
Remote Sensing, Vol. 53, No. 5, May 2015.
[9] J. G. Liu, “Smoothing filter based intensity modulation: A
spectral preserve image fusion technique for improving spatial
details,” Int. J. Remote Sens., vol. 21, no. 18, Dec. 2000.
[10] B. Aiazzi, et al., “MTF-tailored multiscale fusion of highresolution MS and pan imagery,” Photogramm. Eng. Remote
Sens., vol. 72, no. 5, pp. 591–596, May 2006.
[11] G. Vivone, et al., “Contrast and error-based fusion schemes
for multispectral image pansharpening,” IEEE Trans. Geosci.
Remote Sensing Lett., vol. 11, no. 5, pp. 930–934, May 2014.
[12] C. Laben and B. Brower, “Process for enhancing the spatial
resolution of multispectral imagery using pan-sharpening,”
U.S. Patent 6 011 875, Jan. 4, 2000.
[13] B. Aiazzi, et al., “Improving component substitution
pansharpening through multivariate regression of MS+pan
data,” IEEE Trans. Geosci. Remote Sensing, vol. 45, no. 10,
pp. 3230–3239, Oct. 2007.
[14] P. S. Chavez, et al., “Comparison of three different methods
to merge multiresolution and multispectral data: Landsat TM
and SPOT panchromatic,” Photogramm. Eng. Remote Sens.,
vol. 57, no. 3, pp. 295–303, Mar. 1991.
[15] W. Liao, et al., “Processing of multiresolution thermal
hyperspectral and digital color data: Outcome of the 2014
IEEE GRSS data fusion contest,” IEEE J. Select. Top. Appl.
Earth Observ. Remote Sensing, vol. 8, no. 6, May 2015.
[16] M. Simões, et al., “A convex formulation for hyperspectral
image superresolution via subspace-based regularization,”
IEEE Trans. Geosci. Remote Sensing, 2015.
[17] J. Choi, et al., “A new adaptive component-substitution based
satellite image fusion by using partial replacement,” IEEE
Trans. Geosci. Remote Sens., vol. 49, no. 1, Jan. 2011.
[18] R. Keys, “Cubic convolution interpolation for digital image
processing,” IEEE Transactions on Acoustics, Speech, and
Signal Processing, vol. 29, no. 6, pp. 1153–1160, Dec. 1981.
[19] R. Hartley and A. Zisserman, Multiple View Geometry in
Computer Vision, Cambridge University Press, 2003.
[20] H. Bay, et al., “SURF: Speeded Up Robust Features,”
Computer Vision and Image Understanding (CVIU).Vol. 110,
No. 3, pp. 346–359, 2008.
[21] D. G. Lowe, “Object recognition from local scale-invariant
features.” IEEE International Conference on Computer
Vision, vol. 2, pp. 1150-1157, 1999.
[22] J. Zhou, C. Kwan, B. Ayhan, and M. Eismann, “A Novel
Cluster Kernel RX Algorithm for Anomaly and Change
Detection Using Hyperspectral Images,” IEEE Trans.
Geoscience and Remote Sensing, Vol.54, Nov. 2016.
[23] C. Kwan, B. Budavari, A. Bovik, and G. Marchisio, “On
Pansharpening and Blind Quality Assessment of
Pansharpened WorldView-3 Images,” submitted to IEEE
Geoscience and Remote Sensing Letters, May, 2017.
[24] C. Kwan, B. Budavari, and G. Feng, “An Alternative
Approach to Fusing MODIS and Landsat Images for Forward
Prediction,” submitted to IEEE Geoscience and Remote
Sensing Letters, March 2017.
5120
�
 CHIMAN KWAN