Biophysical Journal Volume 68 May 1995 2062-2072
2062
Photocycle of Halorhodopsin from Halobacterium salinarium
Gyorgy Varo,* Laszlo Zimanyi,* Xiaolei
Fan,* Li Sun,t
Richard
Needleman,* and Janos K. Lanyi*
*Department of Physiology and Biophysics, University of California, Irvine, Irvine, California 92717, and tDepartment of Biochemistry,
Wayne State University School of Medicine, Detroit, Michigan 48201 USA
ABSTRACT The light-driven chloride pump, halorhodopsin, is a mixture containing all-trans and 1 3-cis retinal chromophores
under both light and dark-adapted conditions and can exist in chloride-free and chloride-binding forms. To describe the photochemical cycle of the all-trans, chloride-binding state that is associated with the transport, and thereby initiate study of the
chloride translocation mechanism, one must first dissect the contributions of these species to the measured spectral changes.
We resolved the multiple photochemical reactions by determining flash-induced difference spectra and photocycle kinetics in
halorhodopsin-containing membranes prepared from Halobacterium salinarium, with light- and dark-adapted samples at various
chloride concentrations. The high expression of cloned halorhodopsin made it possible to do these measurements with unfractionated cell envelope membranes in which the chromophore is photostable not only in the presence of NaCI but also in
the Na2SO4 solution used for reference. Careful examination of the flash-induced changes at selected wavelengths allowed
separating the spectral changes into components and assigning them to the individual photocycles. According to the results,
a substantial revision of the photocycle model for H. salinarium halorhodopsin, and its dependence on chloride, is required. The
K X L X L2
N
HR, where HR, K, L,
cycle of the all-trans chloride-binding form is described by the scheme, HR-hv
and N designate halorhodopsin and its photointermediates. Unlike the earlier models, this is very similar to the photoreaction
of bacteriorhodopsin when deprotonation of the Schiff base is prevented (e.g., at low pH or in the D85N mutant). Also unlike
in the earlier models, no step in this photocycle was noticeably affected when the chloride concentration was varied between
20 mM and 2 M in an attempt to identify a chloride-binding reaction.
--
INTRODUCTION
The halorhodopsins are small retinal proteins in the cytoplasmic membrane of halobacteria (Lanyi, 1986b, 1990;
Oesterhelt et al., 1992). The amino acid sequence of the different variants from various halobacterial species (Blanck
and Oesterhelt, 1987; Lanyi et al., 1990a; Otomo et al., 1992)
and the overall three-dimensional structure of the Halobacterium salinarium halorhodopsin (Havelka et al., 1993) bear
great similarity to the proton pump, bacteriorhodopsin. As in
the other retinal protein, illumination causes isomerization of
the retinal chromophore from all-trans, 15-anti to 13-cis,
15-anti, but the ensuing sequence of thermal reactions, evidenced by changes in its absorbance in the visible and the
infrared (the photocycle), are accompanied by the inward
translocation of a chloride ion (Schobert and Lanyi, 1982)
rather than the outward transport of a proton. Thus, halorhodopsin functions as a light-driven electrogenic pump for
chloride ions.
Lack of an aspartate residue equivalent to D85, the proton
acceptor to the retinal Schiff base in bacteriorhodopsin, is
consistent with the fact that under physiological conditions
photoexcitation of halorhodopsin does not lead to deproto-
Receivedfor publication 17 November 1994 and in finalform 18 February
1995.
Address reprint requests to Dr. Janos K. Lanyi, Department of Physiology
and Biophysics, University of California, Irvine, Irvine, CA 92717. Tel.:
714-824-7150; Fax: 714-824-8540; E-mail: lbrown2@orion.oac.uci.edu.
Permanent address of G. Vdr6 and present address of L. Zimanyi: Institute
of Biophysics, Biological Research Center of the Hungarian Academy of
Sciences, H-6701 Szeged, Hungary.
C) 1995 by the Biophysical Society
0006-3495/95/05/2062/11 $2.00
nation of the Schiff base. The intermediate states in this photocycle reflect instead only the changing configurational
states of the retinal (Maeda et al., 1985; Diller et al., 1987;
Rothschild et al., 1988; Ames et al., 1992), the transient binding of chloride to an arginine residue (Braiman et al., 1994;
Walter and Braiman, 1994), and probably the changing influence of the protein on the chromophore as a chloride ion
is moved from one membrane surface to the other. To understand how the chloride is transported, one must describe
these light-initiated changes and understand their origins.
There have been numerous attempts to describe the photocycle of halorhodopsin from H. salinarium (Tsuda et al.,
1982; Hazemoto et al., 1983; Bogomolni, 1984; Hegemann
et al., 1985; Oesterhelt et al., 1985; Lanyi and Vodyanoy,
1986; Tittor et al., 1987; Rothschild et al., 1988; Zimanyi et
al., 1989a; Zimanyi and Lanyi, 1989a; Spencer and Dewey,
1990; Ames et al., 1992), and it appeared that in the presence
of chloride it contained intermediate states more or less
equivalent in their absorption spectra in the visible and the
infrared and in the sequence of their rise and decay to K (or
KL), L, and 0 of the bacteriorhodopsin photocycle. They
were termed, respectively HRK (HRK) or HR6w, HRL or
HR520, and HRo or HR.. Many of the details of the halorhodopsin photocycle have been unclear or contradictory,
however. In one report, the rise of the HR520 state was chloride dependent, suggesting that its formation depends on
chloride binding (Tittor et al., 1987), but another study did
not find such an effect (Zimanyi and Lanyi, 1989a). The
amplitudes of HR520 (HRL) and HRw (HRO) varied reciprocally with chloride concentration in a way that suggested
a chloride-dependent back-reaction in an HRL X HRo equilibrium (Oesterhelt et al., 1985; Lanyi and Vodyanoy, 1986;
�VAr6 et al.
Halorhodopsin
Tittor et al., 1987; Zimanyi and Lanyi, 1989a; Ames et al.,
1992). This would indicate release of chloride in the forward
reaction, i.e., at the HRLto HRo step of the photocycle. However, the intermediates that arose thermally upon warming
illuminated halorhodopsin from cryogenic temperatures did
not include the HRo state (Zimanyi and Lanyi, 1989b). Finally, the rate constant of the decay of HRo to the initial HR
state was reported to increase with chloride concentration in
one study (Ames et al., 1992) but not in the others.
Given the fact that this is a transport system for chloride,
it was expected that the photochemical reaction cycle would
be different in the absence of chloride. Maintaining constant
ionic strength would have been best with sulfate, an apparently noninteracting anion (Ogurusu et al., 1982; Schobert
and Lanyi, 1986), but the purified and detergent-solubilized
chromophore was photolabile under these conditions. Nitrate
was less effective in eliciting the chloride-type photocycle,
consistent with the poorer transport of this anion (Zimanyi
and Lanyi, 1989a; Duschl et al., 1990), and it was used instead as the reference to the experiments with chloride. Indeed, in nitrate solutions of low concentration, an abbreviated cycle different from that in chloride was found,
containing only a K (or KL) and an 0-like state (Lanyi and
Vodyanoy, 1986; Tittor et al., 1987; Zimanyi and Lanyi,
1989a).
Describing the halorhodopsin photocycle is made very difficult by the fact that, like monomeric bacteriorhodopsin (Casadio et al., 1980), both light-adapted and dark-adapted
samples are mixtures of all-trans, 15-anti and 13-cis (15-syn,
assuming analogy with bacteriorhodopsin) retinal-containing chromophores (Maeda et al., 1985; Lanyi, 1986a;
Oesterhelt et al., 1986; Fodor et al., 1987; Pande et al., 1989).
In the dark-adapted samples the two isomeric forms are in
thermal equilibrium. Sustained illumination increases the alltrans retinal content of the samples, and the samples return
to the dark-adapted state in the absence of illumination over
tens of hours at room temperature (Hazemoto et al., 1984;
Lanyi, 1984; Kamo et al., 1985; Zimanyi and Lanyi, 1987).
Both kinds of chromophores undergo photoreactions of their
own. In bacteriorhodopsin, the photocycles of all-trans and
13-cis initial states are quite different from one another
(Dencher et al., 1976; Kalisky et al., 1977; Lozier et al., 1978;
Harbison et al., 1984; Hofrichter et al., 1989; Gergely et al.,
1994), and under most conditions only the photocycle of the
all-trans state is associated with transport (Fahr and Bamberg, 1982). This is true also for halorhodopsin (Lanyi,
1986a). All photocycle schemes suggested for halorhodopsin
have been assumed to apply to the all-trans initial state,
which is naturally of greater interest. The possibility of contributions from the 13-cis photocycle to the observed spectroscopic changes have been so far neglected. We know from
studies of dark-adapted bacteriorhodopsin that when the 13cis chromophore is present, its photocycle is evident in the
observed absorption changes (Hofrichter et al., 1989;
Gergely et al., 1994). Furthermore, the observed differences
of the photocycles in the presence and absence of chloride
(e.g., in nitrate) imply that at less than saturating concen-
2063
trations of chloride the observed transient absorbance
changes will have originated from both chloride-Winding and
chloride-free proteins. Attributing them to a single photocycle would be erroneous. In view of these complications, we
have undertaken a reexamination of the halorhodopsin photocycle, utilizing the methods of spectroscopy and data
analysis developed in the last years for our studies of the
bacteriorhodopsin photocycle (Lanyi, 1992, 1993).
The results we report here require a fundamental revision
of the photocycle of all-trans halorhodopsin from H. salinarium, and how it is affected by chloride. If the assumption
is made that the photocycles of the various forms of halorhodopsin are independent of one another, all, or at least a
large part, of what was earlier termed the HR. or HRo intermediate must arise in the 13-cis cycle rather than in the
all-trans cycle. Additionally, at less than saturating chloride
concentrations, what was thought to be HRo might have been
at least in part the red-shifted intermediate of the photocycle
of the chloride-free protein. If a red-shifted state arises at the
end of the photocycle of the chloride-binding all-trans form
of the protein, it does not accumulate in amounts detectable
by our measurements. The all-trans photocycle in the presence
of chloride is
Li
X L2
X
now
N
-*
described
by
the
scheme,
HR-` --*
KX
HR, i.e., it resembles the photocycle of
bacteriorhodopsin under conditions in which the Schiff base
of this protein does not deprotonate, such as at pH < 3 (Mowery et al., 1979; Kobayashi et al., 1983; Var6 and Lanyi,
1989), or in the D85N (Stern et al., 1989; Otto et al., 1990;
Thorgeirsson et al., 1991; Kataoka et al., 1994) and D212N
(Needleman et al., 1991) mutants. Although the fraction of
the halorhodopsin that enters this cycle depends on the concentration of chloride, suggesting previous binding of the
anion to a site that influences the photoreaction, no step in
the reaction sequence was affected by chloride at concentrations between 20 mM and 2 M. The absorption band of the
unphotolyzed chromophore showed distinct chloridedependent changes, as expected if chloride bound to the protein. However, the apparent KD for eliciting the chloride-type
photocycle was considerably different from the binding constant calculated from these spectral changes.
MATERIALS AND METHODS
Halorhodopsin-containing membranes were prepared from Halobacterium
salinarium (formerly halobium) strain L33, which was transformed with an
independently replicating vector to be described elsewhere, that contains the
bop promoter followed by the hop structural gene, including its presequence,
and the novobiocin resistance gene for selection. After inoculating from a
novobiocin-containing (1 jig/ml) culture (volume ratio 1/50), growth at
40°C in medium lacking novobiocin with shaking for 3-4 days was followed
by centrifugation, washing of the cells in 25% NaCl, and dialysis against
40 volumes of water in the presence of DNAse I. The lysed cells were
centrifuged at 30,000 rpm for 1 h, washed with 0.1 or 0.2 M NaCl, and the
resulting membrane fragments were collected in a discontinuous sucrose
gradient containing 0.1 or 0.2 M NaCl, as described for purple membranes
(Oesterhelt and Stoeckenius, 1974). Because unphysiologically low salt
concentration was used to disrupt the halophilic cells, the preparation contained membrane fragments rather than closed vesicles. The absorbance
ratio at 280 and 580 nm was approximately 4, indicating that approximately
one-half of the
protein in these membranes was halorhodopsin. A small
�2064
Biophysical Journal
Volume 68 May 1995
extent of contamination with
cytochrome that has an absorption band at
approximately 415 nm (see legends to Figs. 4-7) was tolerated. The membrane fragments collected from the gradients were stored without removing
the sucrose at -70°C and centrifuged, washed, and resuspended in the buffer
of choice before use, similarly to purple membranes. Solubilized halorhodopsin was prepared as described earlier (Duschl et al., 1988).
Flash excitation with a frequency-doubled Ne-Yag laser and measurement of absorption changes with an intensified diode array and at single
wavelengths were as previously described (Zimanyi et al., 1989a; Var6 and
Lanyi, 1991a; Zimanyi and Lanyi, 1993), except that in the latter measurements a photomultiplier with extended sensitivity in the red was used. Some
of the noise in the time-resolved difference spectra was removed by singular
value decomposition (SVD) (Golub and Kahan, 1995). In some cases, the
rate constants of the photocycle reactions were obtained by comparing the
measured single-wavelength absorbance changes with simulations of a program that generates single-wavelength kinetics for any photocycle model,
given the extinction coefficients of the intermediates. The dark- or lightadapted states of the samples during the spectroscopic measurements were
ensured by the use of a step-pump that replaced the contents of the cuvette
after each flash with a fresh sample from a reservoir (Gergely et al., 1994)
containing either previously dark-adapted or continuously illuminated (with
white light) halorhodopsin-containing membranes. All experiments were
performed in the presence of 50 mM 2-(2-morpholino)ethane sulfonic acid
(MES), pH 6.0, in addition to the other salts present as specified. The total
350 450 550 650 750 350 450 550 650 750 350 450 550 650 750
wavelength (nm)
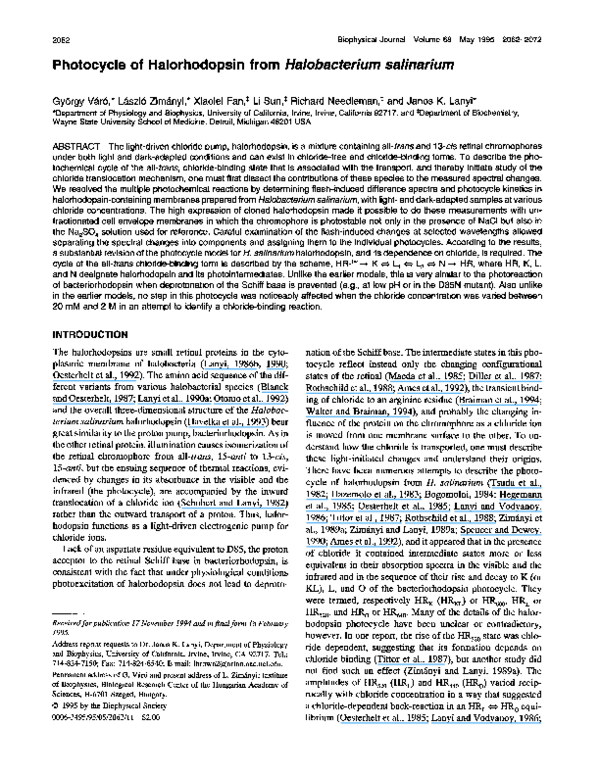
FIGURE 1 Measured difference spectra for halorhodopsin-containing
membrane fragments under three conditions. The spectra were measured at
the indicated delay times after photoexcitation, with optical multichannel
spectroscopy. (A) and (B) 2 M NaCl. (C) 1 M Na2SO42 (A) Dark-adapted
sample. (B) and (C) Light-adapted samples. In sulfate the spectra of darkadapted and light-adapted samples were superimposable. The halorhodopsin
concentration was 15 ,uM in each case.
cation concentration of the salts added was 2 M. The temperature was regulated at 22°C throughout.
RESULTS
Resolving the flash-induced spectral changes of
the different initial states of halorhodopsin
In a heterogeneous system, such as halorhodopsin, extracting
the many time constants and amplitudes by global fitting of
spectral data is not a promising strategy for separating the
multiple photocycles that contribute to the absorption
changes. Instead, we created conditions in which one or another of the photocycles dominated and attempted to calculate the spectra and kinetics associated with each of the postulated initial states.
One of the principal questions was what conditions should
be used for the reference chloride-free state for the comparisons with the chloride-binding state. The halorhodopsincontaining membrane fragments used in this study were
nearly equivalent to the purple membranes that contain only
bacteriorhodopsin and lipids, although, unlike the latter, they
showed no two-dimensional crystalline structure. Although
not immobilized by a lattice, the halorhodopsin chromophore
in these membranes was much more stable than the earlier
purified preparations in detergent micelles, particularly when
illuminated in the absence of chloride or nitrate. The latter
condition could be obtained therefore in the presence of sulfate, an anion that does not interact significantly with halorhodopsin (Schobert et al., 1986; Schobert and Lanyi, 1986),
at concentrations sufficient to maintain a constant amount of
cation up to several molar. With these preparations we could
thus compare the spectral changes that occur upon photoexcitation in NaCl and in Na2SO4 (at a constant 2 M [Na+])
and in the initially dark-adapted and light-adapted states. Fig.
1 shows difference spectra at a few selected delay times after
flash excitation for dark-adapted halorhodopsin in 2 M NaCl
(panel A), light-adapted halorhodopsin in 2 M NaCl (panel
B), and for halorhodopsin in 1 M Na2SO4 in which light
adaptation had no detectable effect on the spectra (panel C).
Fig. 1, A and B, demonstrates that, as in bacteriorhodopsinn,
the photocycles of the two components present, containing
(
all-trans and 13-cis retinal, are greatly different.
he main
difference is that, in the light-adapted samples, when the ratio
of these is shifted toward all-trans (Hazemoto et al., 1984;
Lanyi, 1984; Kamo et al., 1985; ZimaMnyi and Lanyi, 1987)
the amplitude of the red-shifted state(s) in the spectra is decreased and that of the blue-shifted state(s) is increased.
In bacteriorhodopsin, the light-adapted state contains
100% all-trans retinal, which had simplified the description
of its photocycle. In halorhodopsin, the light-adapted state
contains significant amounts of 13-cis retinal (Hazemoto et
al., 1984; Lanyi, 1984; Kamo et al., 1985; Zimanyi and Lanyi, 1987). Resolution of the measured difference spectra in
Fig. 1, A and B, into the contributions of the all-trans and
13-cis forms would require knowing not only the ratio of the
retinal isomers in the dark- and light-adapted states, but also
the relative extinctions of the two forms at the wavelength
of the flash and the relative quantum yields for the two photocycles. The all-trans retinal content, determined in these
samples by retinal extraction, is 48% when dark adapted and
79% when light adapted (Varo, Sasaki, Maeda, Needleman,
and Lanyi, manuscript in preparation). We used a different
approach instead. We noted that, by fortunate coincidence,
at wavelengths above c680 nm, the amplitudes of the difference spectra after e100 ,us were virtually the same in
dark-adapted and light-adapted samples (see inset to Fig. 2).
Thhis means that, because the large differences in the spectra
at lower wavelengths indicate large differences in the alltranso13-cis ratio, at >680 nm, the individual amplitudes of
the difference spectra for the two forms must be essentially
the same. In the case of the 13-cis cycle, this is apparently
a result mostly of red-shift of the spectra of the intermediates
�0.008
-
E
C0.006
E o oo -9
9
_
5 9700~60
6
io
750
C0)(UU0)
8o
daklight-adap
te
nX1
2065
Halorhodopsin
VcAr6 et al.
0.002 -0.0
Me
-1
o
-2.9
(e)
ted
-2.7
-2.5
-2.3
-2.l
-1'.9
-1.7
-1.5
-1.3
-1.1
tiore (s)
log
ark-ad ap
ted
FIGURE 2 Time dependence of absorbance change at 690 nm after photoexcitation of light-adapted and dark-adapted samples in 2 M NaCI. Inset,
difference spectra (as in Fig. 1, A and B) at 1.5 ms (solid lines) and 4 ms
(broken lines). The two spectra with larger amplitudes are from lightadapted and those with smaller amplitudes are from dark-adapted samples.
The arrow indicates the position of 690 nm.
and, in the all-trans cycle, to broadening of the spectra (see
below). The kinetics of the absorption change at a suitable
wavelength in this region, e.g., 690 nm, could be fitted with
the same two exponential components in the light-adapted
and the dark-adapted states (the measured traces in the body
of Fig. 2 are the solid lines, and the fits are the dashed lines).
Their time constants were 8 and 14 ms, whereas the fractional
amplitudes were 0.47 0.04 and 0.53 0.04 in the darkadapted state and 0.84 ho0.07 and 0.16 0.02 in the lightadapted state. The 8- and 14-ms components thus appear to
correspond to the decay process in the all-trans and the 13-cis
cycles, respectively. Because the individual amplitudes of
the changes in the all-trans and 13-cis cycles are the same,
the resolved amplitudes of the two kinetic components give
directly the fractions of halorhodopsin that pass through the
two photocycles. It turs out that they correspond reasonably
closely to the isomeric ratios (Vatro, Sasaki, Maeda, Needleman, and Lanyi, manuscript in preparation).
According to this analysis, the contribution of the all-trans
cycle to the difference spectra in Fig. 1, A and B, is 0.47 when
dark adaptendai 0.84 when light adapted. The all-trans retinal contents of dark-adapted and light-adapted halorhodopsin in the somewhat comparable cell envelope vesicles were
reported to be 24 and 61%, respectively (Lanyi, 1986a). If
the photocycles are independent of one another (the consequences of the alternative, that the photocycles share intermediate(s), will be examined in a separate study), each pair
of measured difference spectra, sp(DA) and sp(LA) in Figs.
1A and B. is described by the equations:
sp(DA) =a X sp(all-trans) + (1 -a) X sp(13-cis) (1)
sp(LA) =b X sp(all-trans) + (1 -b) X sp(13-cis), (2)
where a and b are the fractional contributions of all-trans
form in the dark-adapted and light-adapted states, respectively. Solving for sp(all-trans) and sp(13-cis) produced the
difference spectra in Fig. 3, A and B. They constitute the
spectral changes of the all-trans and 13-cis forms in the presence of chloride.
Such a resolution of the all-trans and 13-cis photocycles
is the key to solving the photoreaction of halorhodopsin, and
we took pains to make certain that it was valid. Because the
relaxation times of 8 and 14 ms in the two cycles are not
greatly different from one another, making the biexponential
fit (Fig. 2) and the calculation of a and b difficult, it was
reassuring that the calculated spectra were fairly tolerant to
inaccuracies in the time constants. For example, changing
and fixing the relaxation times at the best fits ± 15% changed
the calculated values of a and b by only -2% and altered the
calculated spectra to negligible extents. A general criterion
of successfully separating two independent reaction sequences is that the number of time constants in the two resolved sequences be minimized. SVD analysis (see below)
showed that forcing a and b to be significantly different from
the values given above resulted in nonnegligible amplitudes
for the 8-ms time constant in what was calculated to be the
13-cis photocycle and the 14-ms time constant in the resulting all-trans cycle.
The measured spectra in Fig. 1 C, which do not change
upon light adaptation, refer to the changes in the absence of
chloride. It is not clear why only one photocycle is seen under
the latter condition, as both isomeric forms of the retinal are
present also in the absence of chloride (Lanyi, 1986a). We
anticipate that time-resolved infrared spectroscopy of these
photoproducts will address the possibility that the quantum
yield of one of the two isomeric forms might be much smaller
than the other.
The spectral analysis of the photocycle in 2 M NaCl was
carried out with purified dark-adapted and light-adapted
halorhodopsin in octylglucoside-cholate micelles (Duschl et
B
A
0
0)
0~~~~~~~~~~00
350
450
550
650
750
350
450
550
650
750
wavelength (nm)
FIGURE 3 Calculated difference spectra for the resolved all-trans (A)
and 13-cis (B) photocycles in 2 M NaCI. The delay times are the same as
in Fig. 1.
�2066
Volume 68 May 1995
Biophysical Journal
al., 1988) as well (not shown). Estimation of the relative
contributions of the all-trans and 13-cis photocycles to the
difference spectra was hindered by the fact that the time
constants of the final decay at 690 nm (as in Fig. 2) were not
sufficiently different in the two cycles to treat the decay as
a biexponential process. However, difference spectra for the
pure all-trans and 13-cis cycles very similar to those in Fig.
3 were obtained from calculations based on 47% contribution
of the all-trans cycle to the dark-adapted spectra (i.e., as in
the membrane fragments) and 60% contribution to the lightadapted spectra (i.e., somewhat less than in the membrane
fragments). A 60% all-trans content in the light-adapted state
is similar to what was determined earlier by retinal extraction
of detergent-solubilized halorhodopsin (Maeda et al., 1985)
and halorhodopsin-containing proteoliposomes (Zimanyi
and Lanyi, 1987). It is consistent also with the observation
that detergent solubilization decreases the amount of alltrans retinal in light-adapted bacteriorhodopsin (Casadio et
al., 1980).
Kinetic models for the three halorhodopsin
photocycles
We note that, according to Fig. 3 in chloride-containing
samples, most, although not all, of the absorption increase in
the red region originates from the 13-cis component, whereas
all of the increase in the blue originates from the all-trans.
The spectra assigned to the photocycle of the 13-cis form
resemble those in the photocycle of 13-cis bacteriorhodopsin
and show only absorbance increase (Gergely et al., 1994).
The changes in the absence of chloride also consist of increases in the red region (Fig. 1 C), but these appear to have
originated from a red-shift of the maximum rather than solely
from an amplitude increase.
The number of independent spectral components in each
of the three sets of data (31 spectra/set) were first estimated
from SVD (Golub and Kahan, 1995). In the set for the alltrans photocycle, only the first two basis spectra (u columns)
and their time dependencies (v columns) were significantly
above noise. This is indicated also by the fact that the pairwise products of the correlations of the first three u and v
columns were 0.93, 0.60, and -0.05, respectively. Although
a rank of two would suggest that two intermediates are
present, there were three well separated time constants in the
kinetics, indicating that there should be one more. Indeed,
with two spectra, the decay of the first putative intermediate
was followed by its rise, giving an unlikely kinetic scheme.
In the data set for the 13-cis photocycle, the SVD analysis
suggested also two intermediates, the products of the correlations of the first three being 0.95, 0.51, and -0.1. The
kinetics in this case contained only two time constants. In the
set for the photocycle in sulfate, the products of the correlations were 0.93 and 0.39 and suggested that if there is a
second intermediate it cannot be clearly distinguished with
available signal/noise.
Given these constraints, we calculated the spectra of the
three presumed intermediates of the all-trans cycle of the
chloride-binding form of halorhodopsin from time-resolved
difference spectra, such as in Fig. 3 A. The search for these
spectra was based on the criteria of not allowing negative
absorption, and limits on the amplitude and half-width of the
resulting spectra, much as before for bacteriorhodopsin
(Varo and Lanyi, 1991a; Zimanyi and Lanyi, 1993). The
estimated spectra, shown in Fig. 4 A, are labeled K, L, and
N in analogy with the intermediates of the photocycle of
bacteriorhodopsin under conditions in which no M intermediate accumulates. When, for the sake of simplicity, we refer
to a K state, it is the one earlier described as KL (Zimanyi
et al., 1989a,b; Zimanyi and Lanyi, 1989a) in analogy with
a proposed late K substate in the bacteriorhodopsin photocycle (Shichida et al., 1983). Although it can be argued that
using the designations for the bacteriorhodopsin photointermediates for halorhodopsin is misleading because their
equivalency has not yet been demonstrated, the alternative
terminology that utilizes the absorption maxima is also confusing because the calculated spectra and absorption maxima
of the intermediates varies considerably among different
a
0
C
0O)
.fl
16
wavelength, nm
a
0
LI)
8
log time (s)
FIGURE 4 Calculated spectra of all-trans halorhodopsin and its photointermediates (A) and the kinetics of its photocycle (B) in 2 M NaCl. The
spectrum of unphotolyzed halorhodopsin is shown in A with broken line, that
of the K intermediate with dashed line. The small band at 415 nm is from
the cytochrome content of the membrane fragments. Symbols in B: 0, K
intermediate; *, L intermediate; A, N intermediate; A, HR (i.e., 1 minus the
sum of the concentrations of all intermediates). The solid lines in B represent
the best fit of the model K X Li L2 N - HR, with the rate constants
listed in Table 1.
�Halorhodopsin
VcAr6 et al.
publications. The spectra for K and N differ primarily in
amplitude, consistent with the fact that SVD analysis distinguished only two spectral components (see above). The
spectrum of N is broader than the others, and its red-edge
accounts for the persistence of a small absorption increase
above 650 nm in the millisecond time range despite the decay
of the K intermediate (Fig. 3 A).
The measured difference spectra were decomposed into
mixtures of the K minus HR, L minus HR, and N minus HR
spectra. The fractional concentrations of these components
are shown as functions of delay time in Fig. 4 B (symbols).
The points labeled as HR (1 minus the sum of all components) are reasonably close to the zero line until the beginning
of the recovery of the initial state at -1 ms, indicating that
the calculated spectra do describe the components that make
up all of the data despite the fact that their proportions change
with time. This is a stringent criterion for the validity of the
calculated spectra (Zimanyi and Lanyi, 1993). However, we
recognize that small uncertainties in the spectra may produce
uncertainties in the kinetics.
The
simplest
kinetic scheme would be K
<
L
<
N
--
HR.
However, this scheme introduced a contradiction. As shown
in Fig. 4 B, the initial equilibration of K with L at a few
microseconds resulted in a 1:1 mixture of K and L, but in the
equilibration of K, L, and N that followed it at a few hundred
microseconds, the [K]/[L] ratio decreased to approximately
1/2. The x of the fit of this scheme (not shown) was 0.14.
The same kind of paradox, but for the L and M intermediates,
turned up in the bacteriorhodopsin photocycle (Varo and
Lanyi, 1991a,b; Zimanyi et al., 1992; Zimanyi and Lanyi,
1993), and its solution was the introduction of two M substates connected by a unidirectional reaction. Two sequential
L substates will solve the problem in halorhodopsin also, but
in this system the K intermediate persists until the recovery
of the initial state, and thus the reaction between the putative
L substates will not be unidirectional. The lines in Fig. 4 B
represent the best fit of the scheme K : L1 X L2 X N
HR with the rate constants given in Table 1 (column for 2.0
M NaCl). The x2 of this fit was substantially improved at
0.012. The rate constants of the L2 4 N equilibration are not
defined by the data, beyond the requirement that the forward
constant be greater than 2 X 10⁷ s-1 and the reverse be greater
than 1.3 X 10⁷ s-' and that [N]/[L2] at equilibrium be 1.50.
--
2067
The model with sequential L substates is not the only option. Three other models based
on
K
X
L1
X N
--
HR, with
cul-de-sac leading to equilibration of L2 with either K, L1,
or N gave equivalent x2 values, between 0.011 and 0.013.
Similarly, the sequence K X L1 * L2 - > HR plus L2 X= N
gave an equally satisfactory fit. Identification of the correct
model among these (and others that are more complex) will
have to be on the basis of additional information, such as
the altered photocycles of site-specific mutants in the case
of bacteriorhodopsin. In the meantime, we suggest that the
K * Li
L2 < N -> HR sequence will serve as a reasonable working model for the all-trans photocycle.
Analogous treatment of the spectra for the 13-cis cycle,
such as in Fig. 3 B, produced the spectra and kinetics in Fig.
5, A and B (symbols). The detected intermediates termed
CIS-1 and CIS-2 have spectra similar to those of the 13-cis
bacteriorhodopsin photocycle (Gergely et al., 1994). The kinetics are simple and can be described with the scheme CIS-1
X CIS-2 -> HR (lines in Fig. 5 B). This kinetic scheme is
mathematically equivalent to two parallel photoreactions or
one photoreaction with two branches, one containing CIS-1
and the other CIS-2, and we cannot distinguish between the
first model and these. A branched scheme was suggested to
reflect the crossover of the 13-cis photocycle of bacteriorhodopsin to the all-trans, i.e., the phenomenon of light adaptation (Gergely et al., 1994).
Fig. 6, A and B (symbols), show the calculated spectra and
kinetics for the halorhodopsin photocycle in Na2SO4. Within
error, only one spectrally distinct intermediate results, which
is shifted considerably further to the red than either intermediate in the 13-cis cycle of the chloride-binding form. It
arises faster than 100 ns and decays with either a single exponential (solid line in Fig. 6 B) or two exponentials of not
very different time constants (dashed line). The latter treatment would suggest two parallel processes.
a
Chloride-dependent spectral changes in
unphotolyzed halorhodopsin
The difference of the photochemical cycles measured in
chloride and sulfate (Fig. 1) indicates that chloride affects
the photoreaction. The simplest way this could happen
would be the binding of chloride to the unphotolyzed
TABLE 1 Rate constants of best fit for the photocycle of all-trans halorhodopsin at various chloride concentrations
Chloride concentration (M)
Reaction
0.020
0.050
0.100
1.3 X 10⁶
1.3 x 10⁶
1.3 x 10⁶
Li
1.0 x 10⁶
1.0 x 10⁶
1.1 x 10⁶
Li K
1.4 X 10⁴
1.4 X 10⁴
1.4 x 10⁴
Li L2
0.9 X 14
0.9 X 10⁴
0.9 X 10⁴
-2- L1
.-2 x 10⁷
2
2 x 10⁷
.2 x 107
L2 N
N L.1.3 X 107
.1.3 X 107
.1.3 X 107
N
HR
3.3 X 10²
3.3 X 10²
5.0 x 10²
Rate constants are in s-1.
The fits required that the ratio of ku,2 N to kN _2be 1.5.
K->
0.200
1.3 X 10⁶
1.3 X 10⁶
1.4 x 10⁴
0.9 X 10⁴
.2 x 107
.1.3 X 107
2.8 x 10²
0.500
1.000
2.000
1.3 X 10⁶
1.3 x 10⁶
1.4 x 10⁴
0.9 X 10⁴
1.3 X 10⁶
1.3 X 10⁶
1.4 x 10⁴
0.9 X 10⁴
.2 X 107
.1.3 x 107
.2 X 107
.1.3 X 107
.2 X 107
.1.3 X 107
2.8 X 10²
2.8 X 10²
2.8 X 10²
1.3 X 10⁶
1.3 X 10⁶
1.4 X 10⁴
0.9 X 10⁴
�Volume 68 May 1995
Biophysical Journal
2068
'U 0.8350
450
550
650
750
wavelength, nm
350
i0.61
450
550
wavelength (nm)
650
750
S0.41.0
ZE
0.2
0.8>
0
B. kinetics
i
061
Cl
S
V~~~~~~aeegh
/~~HR
,nm
-0 ... ...........
.
*
0.2Binetics
-7
-5
-3
-1
log time (s)
FIGURE
kinetics of its photocycle
(B) in 2 M NaCl.
The spectrum of unphotolyzed halorhodopsin is shown in A with broken
line, that of the CIS-1 intermediate with dashed line. The small band
at 415 nm is from the cytochrome content of the membrane fragments.
Symbols in B:
0, CIS-1 intermediate;
0, CIS-2 intermediate;
A\,
HR
(i.e., 1 minus the sum of the concentrations of the two intermediates).
The solid lines in B represent the best fit of the model CIS-1
-*HR, with the rate constants (in
01.6x10⁵XandkCIS-2HR
s-1), kcIs l,CIS-2
=C12x102-
= 2.6 X
X
-1
FIGURE 6 Calculated spectra of halorhodopsin and its photointermediates (A) and the kinetics of its photocycle (B) in 1 M Na2SO4. The spectrum
of unphotolyzed halorhodopsin is shown in A with broken line. The small
band at 415 nm is from the cytochrome content of the membrane fragments.
0, the single intermediate detected. Solid line, exponential decay with r =
396 ps; broken line, biexponential decay with;1 = 308 ,us and 1T2 = 3.8
ins.
CIS-2
spectral shifts in chloride versus nitrate in visible spectra
(Ogurusu et al., 1982, 1984; Lanyi and Schobert, 1983;
Schobert et al., 1983; Steiner et al., 1984) and in vibrational spectra (Maeda et al., 1985; Rothschild et al., 1988;
Pande et al., 1989) and broadening of the 35C1 NMR line
(Falke et al., 1984). Because the chromophore was fairly
stable in the membrane fragments used here even in the
absence of chloride, we could determine spectral changes
in chloride versus sulfate with accuracy. Fig. 7 A shows
that removing chloride caused a considerable decrease in
the amplitude of the absorption band, an increase in its
width, and a moderate blue-shift of its maximum (from
These changes were reversible upon add-
ing chloride. The amplitude change, plotted as a fraction
of the amplitude increase at 2 M NaCl (i.e., at presumed
saturation) as a function of chloride concentration gives
an apparent KD
-3
10~, kc15.2 CIS-
protein. Such binding had been postulated on the basis of
580 to 570 nm).
-5
log time (s)
Calculated spectra of 13-cis halorhodopsin and its pho-
tointermediates (A) and the
-7
of 20 mM (Fig. 7 B, open circles). The
shift of the maximum appears to be a separate effect, but
its concentration dependence could not be determined.
The chloride dependence of the amplitude of the photocycles associated with chloride, described above, was
also determined. Three wavelengths were selected that
best distinguish the absorbance changes of the chloridebinding protein from those of the chloride-free form. The
absorbance changes of the photocycle in sulfate exhibit
a zero crossover point at 611 nm (see below), and any
changes at this wavelength at various chloride concentrations will have necessarily originated from the
chloride-binding form only, thus describing its dependence on [C1-]. At 590 and 660 nm, part of the absorbance
changes originate from the chloride-free form, but when
the amplitudes are rescaled to zero in 1 M sulfate and one
in 2 M NaCl, the fractional values at intermediate chloride
concentrations also describe the dependence on [Cl]. Fig.
7 B contains plots of these three measured parameters
versus [Cl]. The apparent KD for the photocycle amplitude
is 80 mM, i.e., significantly higher than the KD for the
chloride-dependent spectral change of the unphotolyzed
chromophore. A similar conclusion was made from spectral measurements with lipid-reconstituted halorhodopsin
(Zimanyi and Lanyi, unpublished experiments).
�2069
Halorhodopsin
Vcaro et al.
0
0.008-
c
O 0.004-
non0eM
0.2-
8
0-
X -0.004 -0.008 0
350
450
550
wavelengt, nm
650
750
O-
)
B
0.8
AA
0.40
/
.
0.2
0 spectrum
0 590 nm
6m
^ *~~~~~ 660 nm
-4
o
-0.01 -
8
-0.02-
5
-0.03-
0)
C
-3
-2
-1
log [chloride] (M).
0
FIGURE 7 Chloride dependence of the spectral shape of unphotolyzed
halorhodopsin (A) and amplitudes of absorbance changes after photoexcitation at three different wavelengths (B). In A, spectra of matched samples
(light-adapted halorhodopsin-containing membranes) are shown in mixtures
of NaCl and Na2SO4 (total Na+ concentration, 2 M). The small band at 415
nm is from the cytochrome content ofthe membrane fragments. In B, various
chloride-dependent parameters are plotted versus the chloride concentration. The chloride-dependent changes were normalized to a scale between
zero in sulfate and one in 2 M chloride. 0, amplitude change in A; 0,
maximal amplitude change after photoexcitation when measured at 590 nm;
A, maximal amplitude change after photoexcitation when measured at 611
nm; A, maximal amplitude change after photoexcitation when measured at
660 nm.
The all-trans photocycle of the chloride-bound
form of halorhodopsin at different chloride
concentrations
It had been shown before that, as in bacteriorhodopsin, it is
the photocycle of the all-trans isomeric form of halorhodopsin, containing the distinct blue-shifted intermediate described here as L, that results in transport of chloride (Lanyi
et al., 1990b). Inasmuch as this photocycle originates from
the chloride-binding form of the protein, its overall amplitude indeed increases with chloride concentration (Fig. 7 B).
If there is additionally a chloride-dependent rate constant in
this cycle, its presence will reveal the release or uptake of
chloride after the photoexcitation. We have examined therefore the rate constants in the model for the all-trans photocycle at chloride concentrations between 20 mM and 2 M.
For this study we used single wavelength spectroscopy
and, at each chloride concentration, measured the absorbance
.0
CU
rs
lb
.
-0.041
-7
-5
-3
log time (s)
obl
f%
J
nm
-1
FIGURE 8 Traces of absorbance change at 500 nm (A) and 611 nm (B)
after photoexcitation of light-adapted halorhodopsin (15 ,uM) in 2 M NaCl.
changes of a dark-adapted and a light-adapted sample. It was
assumed that the photocycles of the chloride-binding and
chloride-free forms are independent. Fig. 8, A and B, show
traces of the time dependence of absorbance change at 500
and 611 nm, respectively, for a light-adapted sample at various chloride concentrations. At 611 nm, there is no contribution from the photocycle of the chloride-free form and,
within error, only the amplitude of the traces is dependent on
chloride. Thus, none of the time constants of the photocycle
evident at 611 nm are dependent on chloride (compare below). At this wavelength, however, both all-trans and 13-cis
photocycles contribute. As in both light-adapted and darkadapted samples it was only the amplitude of the traces that
was dependent on chloride, the fractional contribution of the
all-trans cycle must be independent of the chloride concentration. At 500 nm, the photocycle of the chloride-free protein contributes a negative signal, whereas the cycles of the
chloride-binding forms make a positive contribution. The
amplitudes of the traces at 611 nm could be used, therefore,
to extract from the data at 500 nm the contribution of the
chloride-binding protein. Comparing traces for light-adapted
and dark-adapted samples, in turn, allowed the calculation of
the changes due only to the all-trans photocycle, as in the
case of the time-resolved spectra above. Fig. 9 shows traces
for the all-trans cycle in 1 M NaCl calculated in this way at
500, 630, and 611 nm. Global fitting of the kinetic scheme
K X Li X L2 X N -> HR to such triple traces at various
chloride concentrations yielded the set of rate constants given
�Biophysical Joumal
2070
630 nm
0
-0
-0.02-
611 nm
-0.04
-3
-5
-7
1
log time (s)
FIGURE 9 Calculated absorbance changes in the photocycle of the alltrans chloride-binding protein at 500, 630, and 611 nm in 1 M NaCl plus
0.5 M Na2SO4. The solid lines represent the best fit of the model K X L, <
L2
N
--
HR, with the
rate constants listed in Table 1.
in Table 1. The five fully determined rate constants are chloride independent within error. As far as we can tell, the two
less determined rate constants in the L2 X# N equilibrium are
also unaffected by chloride.
DISCUSSION
We have resolved the multiple photocycles that originate
from the isomeric and chloride-binding heterogeneity of
halorhodopsin, with the only assumption that the observed
transient absorption changes originate from independent
photochemical reactions. The objective was to describe the
photochemical cycle associated with the transport of chloride. Given the facts that the light-adapted chromophore contains significant amounts of 13-cis retinal, and the timeresolved absorption changes are greatly affected by light
adaptation, there can be no doubt that a contribution of the
13-cis photocycle is present in the measured absorption
changes and must be removed when describing the photoreaction of the all-trans chromophore. For this reason the
photocycle of the 13-cis chromophore was also described. In
the absence of chloride, only one photocycle was detected.
It is different from the two cycles of the chloride-binding
form. We needed to describe it to extract the photocycle of
the chloride-binding form at subsaturating concentrations of
chloride. With this approach the transient absorption changes
of light- and dark-adapted samples at different chloride concentrations could be represented as various linear combinations of three photocycles with unchanging kinetic parameters, within measurement error, consistent with the assumed
absence of cross-reactions.
The results demonstrate that the photochemical changes of
the all-trans chromophore in the chloride-binding protein
greatly resemble those of bacteriorhodopsin under conditions
in which the Schiff base is prevented from deprotonating.
This seems reasonable in view of the similarity of halorhodopsin and bacteriorhodopsin and the lack of a proton ac-
Volume 68 May 1995
ceptor to the Schiff base in the former protein. The photocycle is described by the scheme HR-h1 --- K X L1 X L' *
N -* HR. The two L substates may play the same role in the
chloride transport as the two M substates in the proton transport in bacteriorhodopsin (Varo and Lanyi, 1991b; Kataoka
et al., 1994). If they do, the internal translocation of chloride
occurs during the lifetime of the L states. None of the intermediates that accumulate absorb as far to the red of the
main band of halorhodopsin as the previously identified
HR. or 0 state. Although the existence of such an intermediate cannot be rigorously excluded, it seems now that all
or most of it originates in the 13-cis photocycle and the photocycle of the chloride-free form. Placing the detected redshifted intermediate in the all-trans photocycle was due to
artifact. It was based on the observation of absorption rise in
the red region and concurrent absorption decrease in the blue
region, in the several-millisecond time domain. The postulated slow chloride-dependent equilibration of a blue-shifted
and red-shifted intermediate seemed to identify chloride release of likely relevance in the transport. However, we find
that these changes originate from the fact that the L to N
conversion in the all-trans cycle removes depletion, masking
the more slowly decaying red-shifted intermediate of the 13cis cycle. Indeed, particularly when viewed on a logarithmic
time scale, the amplitude of this rise in the red region relative
to the increased absorbance level (from the 13-cis cycle)
becomes smaller and smaller when the measuring light is set
to longer and longer wavelengths. This is partly evident from
the smallness of the amplitude of the rising phase at 690 nm
in Fig. 2. Above 700 nm, little or no absorption rise in the
millisecond time domain, over the level established at much
shorter times, was seen (not shown). On repeating these experiments with solubilized halorhodopsin, we found a similar
wavelength dependence of the millisecond kinetics (not
shown).
The absorption changes upon chloride binding to the unphotolyzed protein are more complex than previously
thought. When the chloride-free reference state of the protein
is sulfate, chloride causes an increase of the extinction of the
main band, narrowing of the band-width, and an approximately 10-nm red-shift of the maximum (Fig. 7 A). This is
similar to the effect of chloride on the width of the absorption
band of D212N bacteriorhodopsin (Brown and Lanyi, unpublished experiments), i.e., in a mutant in which chloride
binding might be also the consequence of the net positive
charge of the extracellular protein domain. However, the redshift of the maximum is inconsistent with binding of the
chloride near the Schiff base, as pointed out before from the
direction of the chloride-dependent shift of the resonance
Raman C = N stretching band (Pande et al., 1989). The
apparent KD for the absorption amplitude change is significantly different than that for the amplitude of the photocycle
associated with the chloride-binding forms of the protein
(Fig. 7 B). A possible explanation would be that the chloride
that affects the photocycle amplitude is bound subsequent to
rather than before the photoexcitation. However, this binding
would have had to occur well before 100 ns because the first
�Var6 et al.
Halorhodopsin
intermediate detected in the absence of chloride is considerably different from that detected in the presence of chloride
(compare Figs. 4 A, 5 A, and 6 A). This seems unlikely. The
alternative explanation is that there are more than one chloride binding site, with different effects on the spectrum of the
unphotolyzed chromophore and its photoreaction. The apparent binding constant we now find for the chloride effect
on the photoreaction is similar to the KD for freely exchanging chloride determined from 35C1 NMR line broadening
(Falke et al., 1984), for which previously no equivalent was
found with spectroscopy in the visible. Interestingly, adding
chloride to halorhodopsin from Natronobacteriumpharaonis
causes blue-shift rather than red-shift of the absorption maximum, although qualitatively the same chloride-dependent
changes are found in the photocycle (Scharf and Engelhard,
1994) as in H. salinarium.
To our disappointment, the all-trans photocycle, which
must be associated with chloride transport, does not contain
any chloride-dependent rate constants that might serve as
clues to where chloride is taken up or released (Table 1). We
regard the relationship of this photochemical cycle to the
mechanism of chloride transport therefore as a still entirely
open question. It will be understood only by identifying the
partial chloride transfer reactions with site-specific mutations studied with vibrational spectroscopy in addition to
spectroscopy in the visible, analogously to the way the
mechanism of proton transport is being uncovered in bacteriorhodopsin.
This work was funded by grants from the National Institutes of Health (GM
29498 to J.K.L.), the National Science Foundation and the U.S. Army Research Office (MCB-9202209 and DAAL03-92-G-0406 to R.N.), and the
National Scientific Research Fund of Hungary (OTKA T5073 to G.V., L.Z.,
and J.K.L.).
REFERENCES
Ames, J. B., J. Raap, J. Lugtenburg, and R. A. Mathies. 1992. Resonance
Raman study of halorhodopsin photocycle kinetics, chromophore structure, and chloride-pumping mechanism. Biochemistry. 31:12546-12554.
Blanck, A., and D. Oesterhelt. 1987. The halorhodopsin gene. II. Sequence,
primary structure of halorhodopsin, and comparison with bacteriorhodopsin. EMBO. J. 6:265-273.
Bogomolni, R. A. 1984. Photochemical reactions of halorhodopsin and slow
rhodopsin. In Information and Energy Transduction in Biological Membranes. A. Bolis, H. Helmreich, and H. Passow, editors. Alan R. Liss, New
York. 5-12.
Braiman, M. S., T. J. Walter, and D. M. Briercheck. 1994. Infrared spectroscopic detection of light-induced change in chloride-arginine interaction in halorhodopsin. Biochemistry. 33:1629-1635.
Casadio, R., H. Gutowitz, P. C. Mowery, M. Taylor, and W. Stoeckenius.
1980. Light-dark adaptation of bacteriorhodopsin in Triton-treated purple
membrane. Biochim. Biophys. Acta. 590:13-23.
Dencher, N. A., C. N. Rafferty, and W. Sperling. 1976. 13-cis and trans
bacteriorhodopsin: photochemistry and dark equilibrium. Ber. Kernforschungsanlage Juelich. 1347:1-42.
Diller, R., M. Stockburger, D. Oesterhelt, and J. Tittor. 1987. Resonance
Raman study of intermediates of the halorhodopsin photocycle. FEBS
Lett. 217:297-304.
Duschl, A., J. K. Lanyi, and L. Zimanyi. 1990. Properties and photochemistry of a halorhodopsin from the haloalkalophile, Natronobacterium
pharaonis. J. Bsio. C,hem. 265:1261-1l267.
2071
Duschl, A., M. A. McCloskey, and J. K. Lanyi. 1988. Reconstitution of
halorhodopsin: properties of halorhodopsin-containing proteoliposomes.
J. Bio. Chem. 263:17016-17022.
Fahr, A., and E. Bamberg. 1982. Photocurrents of dark-adapted bacteriorhodopsin on black lipid membranes. FEBS Lett. 140:251-253.
Falke, J. J., S. I. Chan, M. Steiner, D. Oesterhelt, P. Towner, and J. K. Lanyi.
1984. Halide binding by the purified halorhodopsin chromoprotein. II.
New chloride binding sites revealed by 35C1 NMR. J. Bio. Chem. 259:
2185-2189.
Fodor, S. P., R. A. Bogomolni, and R. A. Mathies. 1987. Structure of the
retinal chromophore in the hRL intermediate of halorhodopsin from resonance Raman spectroscopy. Biochemistry. 26:6775-6778.
Gergely, C., C. Ganea, and G. Var6. 1994. Combined optical and photoelectric study of the photocycle of 13-cis bacteriorhodopsin. Biophys. J.
67:855-861.
Golub, G., and W. Kahan. 1995. Calculating the singular values and pseudoinverse of a matrix. SIAM J. Num. Anal. 2:205-224.
Harbison, G. S., S. 0. Smith, J. A. Pardoen, C. Winkel, J. Lugtenburg, J.
Herzfeld, R. A. Mathies, and R. G. Griffin. 1984. Dark-adapted bacteriorhodopsin contains 13-cis, 15-syn and all-trans, 15-anti retinal Schiff
bases. Proc. Natl. Acad. Sci. USA. 81:1706-1709.
Havelka, W. A., R. Henderson, J. A. W. Heymann, and D. Oesterhelt. 1993.
Projection structure of halorhodopsin from Halobacterium halobium at 6
A resolution obtained by electron cryo-microscopy. J. MoL BioL 234:
837-846.
Hazemoto, N., N. Kamo, Y. Terayama, Y. Kobatake, and M. Tsuda. 1983.
Photochemistry of two rhodopsinlike pigments in bacteriorhodopsin-free
mutant of Halobacterium halobium. Biophys. J. 44:59-64.
Hazemoto, N., N. Kamo, and Y. Kobatake. 1984. Suggestion of existence
of two forms of halorhodopsin in alkaline solution. Biochem. Biophys.
Res. Commun. 118:502-507.
Hegemann, P., D. Oesterhelt, and M. Steiner. 1985. The photocycle of the
chloride pump halorhodopsin. I. Azide catalyzed deprotonation of the
chromophore is a side reaction of photocycle intermediates inactivating
the pump. EMBO J. 4:2347-2350.
Hofrichter, J., E. R. Henry, and R. H. Lozier. 1989. Photocycles of bacteriorhodopsin in light- and dark-adapted purple membrane studied by
time-resolved absorption spectroscopy. Biophys. J. 56:693-706.
Kalisky, O., C. R. Goldschmidt and M. Ottolenghi. 1977. On the photocycle
and light adaptation of dark-adapted bacteriorhodopsin. Biophys. J. 19:
185-189.
Kamo, N., N. Hazemoto, Y. Kobatake, and Y. Mukohata. 1985. Light and
dark adaptation of halorhodopsin. Arch. Biochem. Biophys. 238:90-96.
Kataoka, M., H. Kamikubo, F. Tokunaga, L. S. Brown, Y. Yamazaki, A.
Maeda, M. Sheves, R. Needleman, and J. K. Lanyi. 1994. Energy coupling in an ion pump: the reprotonation switch of bacteriorhodopsin.
J. Mol. Biol. 243:621-638.
Kobayashi, T., H. Ohtani, J.-I. Iwai, A. Ikegami, and H. Uchiki. 1983. Effect
of pH on the photoreaction cycles of bacteriorhodopsin. FEBS Lett. 162:
197-200.
Lanyi, J. K. 1984. Light-dependent trans to cis isomerization of the retinal
in halorhodopsin. FEBS Lett. 175:337-342.
Lanyi, J. K. 1986a. Photochromism of halorhodopsin: cis/trans isomerization of the retinal around the 13-14 double bond. J. Biol. Chem. 261:
14025-14030.
Lanyi, J. K. 1986b. Halorhodopsin: a light-driven chloride pump. Annu. Rev.
Biophys. Biophys. Chem. 15:11-28.
Lanyi, J. K. 1990. Halorhodopsin: a light-driven electrogenic chloride transport system. Physiol. Rev. 70:319-330.
Lanyi, J. K. 1992. Proton transfer and energy coupling in the bacteriorhodopsin photocycle. J. Bioenerg. Biomembr. 24:169-179.
Lanyi, J. K. 1993. Proton translocation mechanism and energetics in the
light-driven pump bacteriorhodopsin. Biochim. Biophys. Acta Bioenerg.
1183:241-261.
Lanyi, J. K., A. Duschl, G. W. Hatfield, K. M. May, and D. Oesterhelt.
1990a. The primary structure of a halorhodopsin from Natronobacterium
pharaonis: structural, functional and evolutionary implications for bacterial rhodopsins and halorhodopsins. J. Biol. Chem. 265:1253-1260.
Lanyi, J. K., A. Duschl, G. Var6, and L. Zimanyi. 1990b. Anion binding to
the chloride pump, halorhodopsin, and its implications for the transport
mechanism. FEBS Lett. 265:1-6.
�2072
Biophysical Journal
Lanyi, J. K., and B. Schobert. 1983. Effects of chloride and pH on the
chromophore and photocycling of halorhodopsin. Biochemistry.
22:2763-2769.
Lanyi, J. K., and V. Vodyanoy. 1986. Flash spectroscopic studies of the
kinetics of the halorhodopsin photocycle. Biochemistry. 25:1465-1470.
Lozier, R. H., W. Niederberger, M. Ottolenghi, G. Sivorinovsky, and W.
Stoeckenius. 1978. On the photocycles of light- and dark-adapted bacteriorhodopsin. In Energetics and Structure of Halophilic Microorganisms. S. R. Caplan, and M. Ginzburg, editors. Elsevier/North Holland,
Amsterdam. 123-139.
Maeda, A., T. Ogurusu, T. Yoshizawa, and T. Kitagawa. 1985. Resonance
Raman study on binding of chloride to the chromophore of halorhodopsin.
Biochemistry. 24:2517-2521.
Mowery, P. C., R. H. Lozier, Q. Chae, Y. W. Tseng, M. Taylor, and W.
Stoeckenius. 1979. Effect of acid pH on the absorption spectra and photoreactions of bacteriorhodopsin. Biochemistry. 18:4100-4107.
Needleman, R., M. Chang, B. Ni, G. Var6, J. Fomes, S. H. White, and J.
K. Lanyi. 1991. Properties of asp212-asn bacteriorhodopsin suggest that
asp212 and asp85 both participate in a counterion and proton acceptor
complex near the Schiff base. J. Biol. Chem. 266:11478-11484.
Oesterhelt, D., P. Hegemann, P. Tavan, and K. Schulten. 1986. Trans-cis
isomerization of retinal and a mechanism for ion translocation in halorhodopsin. Eur. Biophys. J. 14:123-129.
Oesterhelt, D., P. Hegemann, and J. Tittor. 1985. The photocycle of the
chloride pump halorhodopsin. II. Quantum yields and a kinetic model.
EMBO J. 4:2351-2356.
Oesterhelt, D., and W. Stoeckenius. 1974. Isolation of the cell membrane
of Halobacterium halobium and its fractionation into red and purple membrane. Methods Enzymol. 31:667-678.
Oesterhelt, D., J. Tittor, and E. Bamberg. 1992. A unifying concept for ion
translocation by retinal proteins. J. Bioenerg. Biomembr. 24:181-191.
Ogurusu, T., A. Maeda, N. Sasaki, and T. Yoshizawa. 1982. Effects of
chloride on the absorption spectrum and photoreactions of halorhodopsin.
Biochim. Biophys. Acta. 682:446-451.
Ogurusu, T., A. Maeda, and T. Yoshizawa. 1984. Absorption spectral properties of purified halorhodopsin. J. Biochem. 95:1073-1082.
Otomo, J., H. Tomioka, and H. Sasabe. 1992. Properties and the primary
structure of a new halorhodopsin from halobacterial strain mex. Biochim.
Biophys. Acta Biomembr. 1112:7-13.
Otto, H., T. Marti, M. Holz, T. Mogi, L. J. Stem, F. Engel, H. G. Khorana,
and M. P. Heyn. 1990. Substitution of amino acids Asp-85, Asp-212, and
Arg-82 in bacteriorhodopsin affects the proton release phase of the pump
and the pK of the Schiff base. Proc. Natl. Acad. Sci. USA. 87:1018-1022.
Pande, C., J. K. Lanyi, and R. H. Callender. 1989. Effects of various anions
on the Raman spectrum of halorhodopsin. Biophys. J. 55:425-431.
Rothschild, K. J., 0. Bousche, M. S. Braiman, C. A. Hasselbacher, and J.
L. Spudich. 1988. Fourier transform infrared study of the halorhodopsin
chloride pump. Biochemistry. 27:2420-2424.
Scharf, B., and M. Engelhard. 1994. Blue halorhodopsin from Natronobacterium pharaonis: wavelength regulation by anions. Biochemistry. 33:
6387-6393.
Schobert, B., and J. K. Lanyi. 1982. Halorhodopsin is a light-driven chloride
pump. J. Biol. Chem. 257:10306-10313.
Schobert, B., and J. K. Lanyi. 1986. Electrostatic interaction between anions
bound to site I and the Schiff-base of halorhodopsin. Biochemistry. 25:
4163-4167.
Schobert, B., J. K. Lanyi, and E. J. J. Cragoe. 1983. Evidence for a halide
binding site in halorhodopsin. J. Biol. Chem. 258:15158-15164.
Schobert, B., J. K. Lanyi, and D. Oesterhelt. 1986. Effects of anion binding
on the deprotonation reactions of halorhodopsin. J. Biol. Chem. 261:
2690-2696.
Volume 68 May 1995
Shichida, Y., S. Matuoka, Y. Hidaka, and T. Yoshizawa. 1983. Absorption
spectra of intermediates of bacteriorhodopsin measured by laser photolysis at room temperatures. Biochim. Biophys. Acta. 723:240-246.
Spencer, D. B., and T. G. Dewey. 1990. Activation parameters for the halorhodopsin photocycle: a phase lifetime spectroscopic study of the 520- and
640-nanometer intermediates. Biochemistry. 29:3140-3145.
Steiner, M., D. Oesterhelt, M. Ariki, and J. K. Lanyi. 1984. Halide binding
by the purified halorhodopsin chromoprotein. I. Effects on the chromophore. J. Biol. Chem. 259:2179-2184.
Stem, L. J., P. L. Ahl, T. Marti, T. Mogi, M. Dufiach, S. Berkovitz, K. J.
Rothschild, and H. G. Khorana. 1989. Substitution of membraneembedded aspartic acids in bacteriorhodopsin causes specific changes in
different steps of the photochemical cycle. Biochemistry.
28:10035-10042.
Thorgeirsson, T. E., S. J. Milder, L. J. W. Miercke, M. C. Betlach, R. F.
Shand, R. M. Stroud, and D. S. Kliger. 1991. Effects of Asp-96->Asn,
Asp-85---Asn, and Arg-82--Gln single-site substitutions on the photocycle of bacteriorhodopsin. Biochemistry. 30:9133-9142.
Tittor, J., D. Oesterhelt, R. Maurer, H. Desel, and R. Uhl. 1987. The photochemical cycle of halorhodopsin: absolute spectra of intermediates obtained by flash photolysis and fast difference spectra measurements. Biophys. J. 52:999-1006.
Tsuda, M., N. Hazemoto, M. Kondo, N. Kamo, Y. Kobatake, and Y. Terayama. 1982. Two photocycles in Halobacterium halobium that lacks
bacteriorhodopsin. Biochem. Biophys. Res. Commun. 108:970-976.
Var6, G., and J. K. Lanyi. 1989. Photoreactions of bacteriorhodopsin at acid
pH. Biophys. J. 56:1143-1151.
Vir6, G., and J. K. Lanyi. 1991a. Kinetic and spectroscopic evidence for
an irreversible step between deprotonation and reprotonation of the Schiff
base in the bacteriorhodopsin photocycle. Biochemistry. 30:5008-5015.
Var6, G., and J. K. Lanyi. 1991b. Thermodynamics and energy coupling in
the bacteriorhodopsin photocycle. Biochemistry. 30:5016-5022.
Walter, T. J., and M. S. Braiman. 1994. Anion-protein interactions during
halorhodopsin pumping: halide binding at the protonated Schiff base.
Biochemistry. 33:1724-1733.
Zimanyi, L., Y. Cao, M. Chang, B. Ni, R. Needleman, and J. K. Lanyi. 1992.
The two consecutive M substates in the photocycle of bacteriorhodopsin
are affected specifically by the D85N and D96N residue replacements.
Photochem. Photobiol. 56:1049-1055.
Zimanyi, L., L. Keszthelyi, and J. K. Lanyi. 1989a. Transient spectroscopy
of bacterial rhodopsins with optical multichannel analyser. I. Comparison
of the photocycles of bacteriorhodopsin and halorhodopsin. Biochemistry.
28:5165-5172.
Zimanyi, L., and J. K. Lanyi. 1987. Iso-halorhodopsin: a stable 9-cis retinalcontaining photoproduct of halorhodopsin. Biophys. J. 52:1007-1013.
Zimanyi, L., and J. K. Lanyi. 1989a. Transient spectroscopy of bacterial
rhodopsins with optical multichannel analyzer. II. Effects of anions on the
halorhodopsin photocycle. Biochemistry. 28:5172-5178.
Zimanyi, L., and J. K. Lanyi. 1989b. Low temperature photoreactions of
halorhodopsin. II. Description of the photocycle and its intermediates.
Biochemistry. 28:1662-1666.
Zimanyi, L., and J. K. Lanyi. 1993. Deriving the intermediate spectra and
photocycle kinetics from time-resolved difference spectra of bacteriorhodopsin: the simpler case of the recombinant D96N protein. Biophys. J.
64:240-251.
Zimanyi, L., P. Ormos, and J. K. Lanyi. 1989b. Low temperature photoreactions of halorhodopsin. I. Detection of conformational substates of the
chromophore. Biochemistry. 28:1656-1661.
�
 Janos Lanyi