PRL 98, 026807 (2007)
PHYSICAL REVIEW LETTERS
week ending
12 JANUARY 2007
Dimensional Crossover in Quantum Networks: From Macroscopic to Mesoscopic Physics
Félicien Schopfer,1,* François Mallet,1 Dominique Mailly,2 Christophe Texier,3,4 Gilles Montambaux,4
Christopher Bäuerle,1 and Laurent Saminadayar1,5,6
1
Institut Néel, CNRS, 25 avenue des Martyrs, BP 166, 38042 Grenoble Cedex 09, France
Laboratoire de Photonique et Nanostructures, route de Nozay, 91460 Marcoussis, France
3
Laboratoire de Physique Théorique et Modèles Statistiques, Université Paris-Sud, CNRS, UMR 8626, F-91405 Orsay Cedex, France
4
Laboratoire de Physique des Solides, Université Paris-Sud, CNRS, UMR 8502, F-91405 Orsay Cedex, France
5
Université Joseph Fourier, BP 53, 38041 Grenoble Cedex 09, France
6
Institut Universitaire de France, 103 boulevard Saint-Michel, 75005 Paris, France
(Received 23 March 2006; published 12 January 2007)
2
We report on magnetoconductance measurements of metallic networks of various sizes ranging from 10
to 106 plaquettes, with an anisotropic aspect ratio. Both Altshuler-Aronov-Spivak h=2e periodic
oscillations and Aharonov-Bohm h=e periodic oscillations are observed for all networks. For large
samples, the amplitude of both oscillations results from the incoherent superposition of contributions of
phase coherent regions. When the transverse size becomes smaller than the phase coherent length L� , one
enters a new regime which is phase coherent (mesoscopic) along one direction and macroscopic along the
other, leading to a new size dependence of the quantum oscillations.
DOI: 10.1103/PhysRevLett.98.026807
PACS numbers: 73.23.�b, 73.20.Fz, 75.20.Hr
Quantum interference effects lie at the heart of mesoscopic physics. It is well known that they govern both
thermodynamic as well as electronic transport properties
of quantum conductors. One of the most spectacular manifestations of such quantum interferences is the AharonovBohm effect [1] in a mesoscopic ring whose perimeter is of
the order of the phase coherence length L� : when applying
a magnetic flux through the ring, the conductance oscillates
with a periodicity �0 � h=e, the flux quantum, h being the
Planck constant and e the charge of the electron [2]. Such a
magnetoconductance oscillation is a direct consequence of
the coupling of the electron charge to the vector potential,
and is thus the most direct evidence of the quantum nature
of the conduction in mesoscopic systems [3].
An important point is the understanding of how such
quantum effects disappear when going from mesoscopic to
macroscopic conductors. If one considers a line of N
mesoscopic metallic rings, the Aharonov-Bohm (AB) conp����
ductance oscillations �GAB =G vanish to zero as 1= N .
This has been beautifully demonstrated by studying lines
of silver rings with N varying from 1 to 30 [4].
On the other hand, there exist magnetoconductance
oscillations which do survive such an ensemble averaging,
since they are due to interferences between time reversed
trajectories. These oscillations �GAAS , known as
Altshuler-Aronov-Spivak (AAS) oscillations, have a period �0 =2 [5,6]. The robustness of these oscillations towards ensemble averaging, as opposed to the AB
oscillations was also experimentally demonstrated in
Ref. [4]. The relative amplitude �GAAS =G was found to
be independent of N. This robustness has also been demonstrated in large two-dimensional metallic networks of
different topologies [7,8]. It must be stressed that all these
experiments have been carried out in a regime where the
0031-9007=07=98(2)=026807(4)
phase coherence length L� is much smaller than the system
size. In this context, one deals with the simple case of an
ensemble averaging consisting in a summation of uncorrelated contributions from phase coherent regions.
A crucial question is to know what happens to the
ensemble averaging when the system size decreases and
becomes of the order of or smaller than the phase coherence length L� . In this Letter, we report on the size
dependence of the amplitudes of both Aharonov-Bohm
and Altshuler-Aronov-Spivak magnetoconductance oscillations in silver networks of anisotropic aspect ratio. We
show that the amplitude of both AB and AAS oscillations
exhibit an unexpected dependence with N when the smallest dimension of the network becomes smaller than the
phase coherence length: in this case, the network can be
considered as a fully coherent object (mesoscopic) in one
direction, whereas it is macroscopic in the other.
Samples are fabricated on a silicon substrate using electron beam lithography on polymethyl-methacrylate resist.
Silver is deposited from a 99.9999% purity source using an
electron gun evaporator and lift-off technique without any
additional adherence layer. All samples have been evaporated in a single run to ensure that the sample characteristics (elastic mean free path le and phase coherence length
L� ) are similar. Two different topologies have been studied
in this work: the square lattice and the so-called T 3 lattice
[9]. The wires forming the networks are 60 nm wide, 50 nm
thick, and 640 nm (690 nm) long for the square (T 3 )
lattice. The size of the plaquettes (square or diamond) is
chosen such that the magnetic field corresponding to one
flux quantum �0 per plaquette is B � 100 G. All networks
with number of plaquettes N varying from 10 to 106 have
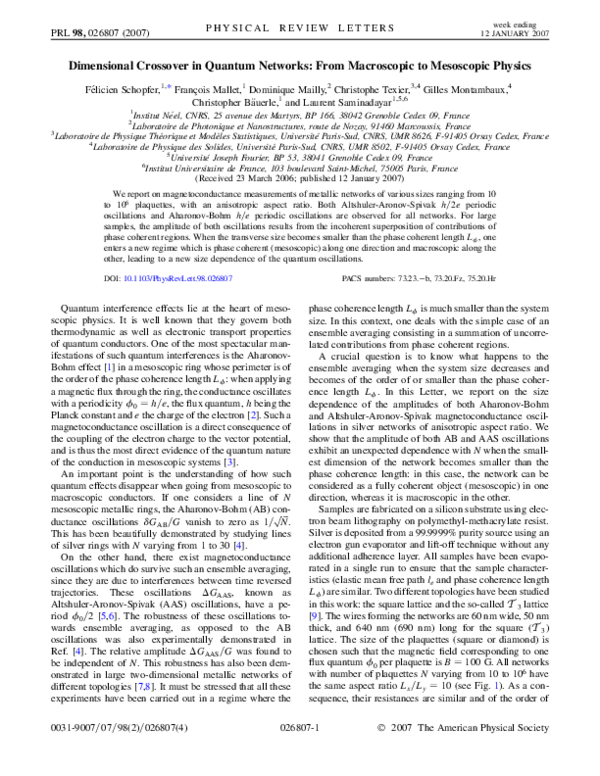
the same aspect ratio Lx =Ly � 10 (see Fig. 1). As a consequence, their resistances are similar and of the order of
026807-1
2007 The American Physical Society
�PRL 98, 026807 (2007)
PHYSICAL REVIEW LETTERS
FIG. 1. Scanning electron micrograph of several samples of
various sizes; the two contacts are visible for the small sample.
100 �. Measurements have been performed at 400 mK;
this allows one to stay in the linear regime with a relatively
high current ( � 4 nA) and optimizes the signal to noise
ratio without heating the electrons. At this temperature, the
phase coherence length, determined from standard weak
localization measurements on a 120 nm wide wire fabricated on the same wafer, is about L� ’ 6 �m, the diffusion
constant D ’ 105 cm2 s�1 , and the thermal length LT �
p������������������
@D=kB T ’ 0:45 �m [10].
In Fig. 2 we show typical data for the magnetoresistance
of a square network with 3000 plaquettes. At low field
[Fig. 2(a)], oscillations with a period B � 50 G, corresponding to �0 =2 per plaquette, are identified as the
AAS oscillations. At fields typically higher than the field
which suppresses weak localization, we observe a different
type of oscillations. These oscillations have a periodicity of
B � 100 G, corresponding to �0 ; these are AB oscillations. In order to emphasize the different periodicity of
these magnetoconductance oscillations, we display their
Fourier spectra in Figs. 2(c) (low field) and 2(d) (high
field): in the high field regime, the main peak clearly
appears at 0:01 G�1 , whereas in the low field regime, it
appears at 0:02 G�1 . To our knowledge, this is the first
time that both AAS and AB oscillations are observed on
such large samples.
We now concentrate on the variation of the amplitude of
the AB as well as AAS oscillations versus the number of
plaquettes N. To measure the AB oscillations we sweep the
magnetic field from 7000 to 13 000 G, whereas for the
AAS oscillations we cover a field range of �1200 G. To
extract precisely the amplitude of the AB oscillations, we
take the Fourier transform over 20 periods after subtraction
of a smooth background to remove low frequency fluctuations. We also measure the background noise by repeating
the measurement exactly in the same conditions but at
fixed magnetic field, and taking again the Fourier trans-
week ending
12 JANUARY 2007
FIG. 2 (color online). Magnetoresistance of a square network
containing 3000 plaquettes: (a) low field data; (b) high field data;
(c),(d) Fourier (FFT) amplitudes of (a),(b), respectively. Data are
taken at 400 mK.
form. The amplitude of the AB signal is then obtained from
the Fourier spectrum after subtraction of the background
spectrum integrated over the same frequency range, in a
similar way used for persistent current measurements [11].
This procedure is only necessary for very large networks
(typically larger than 105 plaquettes) since for smaller
networks the noise is negligible. For the determination of
the AAS amplitude such a procedure is not necessary, as
the background noise is always negligible. However, the
second harmonic (�0 =2) of the AB oscillations has the
same frequency as the first harmonic (�0 =2) of the AAS
oscillations. For small networks (typically N � 100) this
contribution cannot be neglected. In order to extract the
AAS signal, we therefore determine first the amplitude of
the second harmonic of the AB oscillations at high field
and then subtract this amplitude from the first harmonic of
the oscillations measured at low field [12].
In Fig. 3 we display the amplitude of magnetoconductance oscillations (AAS and AB) extracted from the
Fourier spectra as a function of the number N of plaquettes.
For large networks (N * 300), the pamplitude
of the AB
����
oscillations clearly decreases as 1= N , whereas the amplitude of the AAS oscillations are independent of the
number of plaquettes as naively expected. More surprising
is the behavior observed for small networks: when they
contain typically less than N ’ 300 plaquettes, pthe
���� amplitude of the AB oscillations varies faster than 1= N . At the
same time the AAS amplitude now depends on N (Fig. 3).
In the following, we will show that this new behavior
results from a dimensional crossover when the transverse
size of the network becomes smaller than the phase coherence length: one then enters a new regime where the
transport properties are effectively one dimensional on
the two-dimensional network.
026807-2
�week ending
12 JANUARY 2007
PHYSICAL REVIEW LETTERS
PRL 98, 026807 (2007)
which is the key relation from which we now discuss our
results, bearing in mind that temperature, and thus LT and
L� are fixed parameters.
Let us first consider large networks with both dimensions larger than the phase coherence length: Lx , Ly
L� . Since interfering time reversed trajectories extend over
a typical size L� , they do not feel the boundaries of the
system and therefore �� is size independent. Therefore the
AAS amplitude varies as �gAAS / Ly =Lx , and since this
ratio is constant, this amplitude is independent of N:
�gAAS / N 0 :
FIG. 3 (color online). AAS amplitude �gAAS and AB amplitude �gAB as a function of the number N of plaquettes for
different networks of various sizes Lx � Ly / N, for two topologies, square (squares) and T 3 (diamonds) [17].
Let us first recall general considerations on the magnetoconductivity oscillations: on one hand, the AAS oscillations are the Fourier harmonics of the weak localization
correction h���B�i to the average conductivity [5]. On the
other hand, the amplitude of the AB oscillations can be
obtained from the correlation function of the conductivity
h���B����B0 �i. The expressions of these two quantities
are indeed related [13–16]. In the limit where the thermal
length LT is smaller than L� , this yields
��2AB �
e2 4�L2T
��AAS ;
h 3 Vol
�g2AB �
2�L2T
�gAAS ;
3L2x
In this regime we also see from Eq. (2) that �g2AB / Ly =L3x ,
which leads to
�gAB / N �1=2 :
(2)
(4)
This is exactly what is observed for large networks: when
the number of plaquettes is larger than ’ 300, electrons
diffuse on what they feel as a two-dimensional network.
For smaller networks, the transverse dimension Ly eventually becomes smaller than the phase coherence length:
we enter a regime where the network becomes transversally coherent whereas it remains longitudinally incoherent: Ly
L�
Lx . In this case, we have the usual quasi1D scaling ��AAS / L� =Ly . Therefore we find �gAAS /
1=Lx and �g2AB / 1=L3x , which leads to
(1)
where ��AB and ��AAS are, respectively, the first harmonics of the AB and AAS oscillations and Vol the volume of
the sample. In this formula, the temperature dependence
originates from the conductivity correlation function
which probes a finite energy scale of width kB T [3,16].
The key feature is the proportionality between ��2AB and
��AAS . Indeed, both quantities can be written in terms of
the coherent part of the return probability to the origin for a
diffusive particle. Consequently, both must probe in the
same way the influence of the geometry [16].
We consider a network of dimensions Lx � Ly (see
Fig. 1). It is important to keep in mind that experiments
presented here are performed on several networks of different sizes, but of constant aspect ratio Lx =Ly � 10. The
length and width of the networks thus
p���� scale with the
number of plaquettes N as Lx / Ly / N .
The dimensionless conductance g � G=�2e2 =h� of the
network is then related to the conductivity by Ohm’s law
g / �Ly =Lx . Combined with Eq. (1) and given that Vol /
Lx Ly , this yields for the amplitudes of the conductance
oscillations �gAAS and �gAB :
(3)
�gAAS / N �1=2 ;
(5)
�gAB / N �3=4 :
(6)
This is precisely what is observed for small networks in
Fig. 3.
It remains now to check whether the position of the
crossover observed on Fig. 3 agrees with our estimate of
the phase coherence length. The crossover occurs for a size
N ’ 300 corresponding to Ly ’ 3:8 �m. This length has to
be compared with the coherence length L� ’ 6 �m measured at T � 400 mK. This comparison, which cannot be
more than qualitative, supports our analysis.
To summarize, the dimensional crossover observed for
the scaling of the AB oscillations corresponds to the different scaling Ly =L3x ! L� =L3x of the variance of the conductance fluctuations, with N / Lx Ly . At this point, it is
useful to compare these dependences with the case of a 1D
chain where the number N of rings scales linearly with the
length Lx of the chain, so that �g2AB / 1=L3x / 1=N 3 and
�gAAS / 1=N. Since the conductance g scales as 1=N, this
yields for thep����relative fluctuations �gAAS =g / N 0 and
�gAB =g / 1= N as was observed experimentally [4].
An interesting way of checking our analysis comes from
Eq. (2): we can see that the ratio �g2AB =�gAAS / L2T =L2x is
proportional to 1=N and more importantly is independent
of L� . This fundamental relation between �g2AB and �gAAS
026807-3
�PRL 98, 026807 (2007)
PHYSICAL REVIEW LETTERS
FIG. 4 (color online). �gAAS =��gAB �2 as a function of the
number of plaquettes N for square networks (squares) and
diamonds networks (diamonds).
is clearly shown on Fig. 4, where we have plotted the ratio
�g2AB =�gAAS as a function of the number of plaquettes N:
one sees that it follows perfectly the predicted 1=N behavior, with no dimensional crossover. This is a definitive
check of our interpretation of the experimental data in
terms of dimensional crossover.
In conclusion, we have measured both Aharonov-Bohm
�0 periodic oscillations and Altshuler-Aronov-Spivak
�0 =2 periodic oscillations in metallic networks containing
10 to 106 plaquettes. Ensemble averaging can lead to
different size dependences for small and large networks.
The crossover takes place when the width of the network is
of the order of the phase coherence length; this behavior
does correspond to a dimensional crossover between effectively one- and two-dimensional networks. In this new
one-dimensional regime we observed, we have shown that
the amplitude of the AB oscillations varies as N �3=4 and
the AAS oscillations as N �1=2 , a behavior which has never
been observed until now. Moreover, we have been able to
probe experimentally the fundamental relation between
AB and AAS magnetoconductance oscillations due to their
common physical origin.
We are indebted to the Quantronics group for the use of
its evaporator and silver source. It is our pleasure to acknowledge H. Bouchiat, B. Douçot, L. P. Lévy, and J. Vidal
for fruitful discussions. This work has been supported by
the French Ministry of Science, Grants No. 02 2 0222 and
No. NN/02 2 0112, and the European Commission FP6
NMP-3 Project No. 505457-1 ‘‘Ultra-1D.’’
week ending
12 JANUARY 2007
*Present address: Laboratoire National de Métrologie et
d’Essais, 29 avenue Roger Hennequin, 78197 Trappes,
France.
[1] Y. Aharonov and D. Bohm, Phys. Rev. 115, 485 (1959).
[2] Y. Gefen, Y. Imry, and M. Ya. Azbel, Phys. Rev. Lett. 52,
129 (1984); M. Büttiker, Y. Imry, and M. Ya. Azbel, Phys.
Rev. A 30, 1982 (1984).
[3] S. Washburn and R. A. Webb, Adv. Phys. 35, 375 (1986).
[4] C. P. Umbach, C. Van Haesendonck, R. B. Laibowitz,
S. Washburn, and R. A. Webb, Phys. Rev. Lett. 56, 386
(1986).
[5] B. L. Altshuler, A. G. Aronov, and B. Z. Spivak, Pis’ma
Zh. Eksp. Teor. Fiz. 33, 101 (1981) [JETP Lett. 33, 94
(1981)].
[6] D. Yu. Sharvin and Yu. V. Sharvin, Pis’ma Zh. Eksp. Teor.
Fiz. 34, 285 (1981) [JETP Lett. 34, 272 ( 1981)].
[7] B. Pannetier, J. Chaussy, R. Rammal, and P. Gandit, Phys.
Rev. Lett. 53, 718 (1984); B. Douçot and R. Rammal,
Phys. Rev. Lett. 55, 1148 (1985).
[8] G. J. Dolan, J. C. Licini, and D. J. Bishop, Phys. Rev. Lett.
56, 1493 (1986).
[9] J. Vidal, R. Mosseri, and B. Douçot, Phys. Rev. Lett. 81,
5888 (1998); C. Naud, G. Faini, and D. Mailly, Phys. Rev.
Lett. 86, 5104 (2001).
[10] F. Mallet, F. Schopfer, D. Mailly, C. Texier, G.
Montambaux, C. Bäuerle, and L. Saminadayar (to be
published).
[11] W. Rabaud, L. Saminadayar, D. Mailly, K. Hasselbach,
A. Benoı̂t, and B. Etienne, Phys. Rev. Lett. 86, 3124
(2001).
[12] The relative phase (0 or �) between the AAS oscillations
and the second harmonic of the AB oscillations, however,
is determined at low field (typically at the field which
suppresses weak localization) such that any phase shift
due to the applied magnetic field is negligible.
[13] I. L. Aleiner and Ya. M. Blanter, Phys. Rev. B 65, 115317
(2002).
[14] T. Ludwig and A. D. Mirlin, Phys. Rev. B 69, 193306
(2004).
[15] C. Texier and G. Montambaux, Phys. Rev. B 72, 115327
(2005).
[16] E. Akkermans and G. Montambaux, Mesoscopic Physics
of Electrons and Photons (Cambridge University Press,
Cambridge, UK, 2007).
[17] Note that the amplitudes of these magnetoconductance
oscillations depend also on the lattice topology: the harmonics content depends on winding properties which are
network dependent; see [7,8] and M. Pascaud and G.
Montambaux, Phys. Rev. Lett. 82, 4512 (1999). To account for this topological effect, we have scaled the AAS
and
p
�������AB amplitudes for the T 3 lattice by factors 1.5 and
1:5, respectively.
026807-4
�
 chris bauerle
 Laurent Saminadayar