,.
zyxwv
1996 J. Pharm. Pharmacol.
phaml. Pharmacol. 1996, 48: 965-967
October 3, 1995
ACCePted February 6, 1996
Trifluoperazine is More Effective than Chlorpromazine in
Releasing Oxygen from Haemoglobin and Myoglobin
zyxwvutsr
zyxwvutsr
zyxwv
zyxwv
JAYA BHATTACHARYYA, MAITREE BHATTACHARYYA", A B H A Y S A N K A R CHAKRABORTI, U T P A L CHAUDHURI A N D
RAMENDRA KUMAR PODDAR
Department of Biophysics, Molecular Biology & Genetics, University of Calcutta, 92, Acharyya Prafulla Chandra
Road, Calcutta 700 009, India
zyxwvutsrqponmlkjihgfedcbaZYXWVUTSRQPONMLKJIHGFEDCBA
Abstract
~~
The extent of oxygen release from two heme proteins, haemoglobin and myoglobin have been studied in the
presence of trifluoperazine and chlorpromazine (5-1 000 pM).
At a molar ratio (drug :protein) of 1.5, the release of oxygen from haemoglobin was 4 and 15% in the
presence of chlorpromazine and trifluoperazine respectively, while from myoglobin the corresponding values
were 20 and 40%.
The findings were attributed to the greater extent of local conformational change around tryptophan moieties
of each of the proteins induced by trifluoperazine.
'
';
zyxwvutsrq
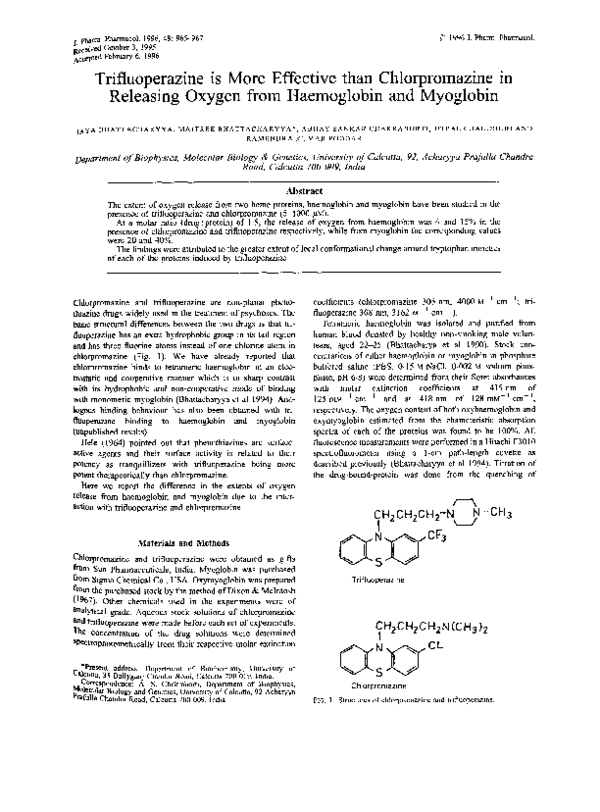
chlorpromazine and trifluoperazine are non-planar phenothiazine drugs widely used in the treatment of psychoses. The
basic structural differences between the two drugs is that trifluoperazine has an extra hydrophobic group in its tail region
and has three fluorine atoms instead of one chlorine atom in
chlorpromazine (Fig. 1). We have already reported that
chlorpromazine binds to tetrameric haemoglobin in an electrostatic and cooperative manner which is in sharp contrast
with its hydrophobic and non-cooperative mode of binding
with monomeric myoglobin (Bhattacharyya et al 1994). Analogous binding behaviour has also been obtained with trifluoperazine binding to haemoglobin and myoglobin
(unpublished results).
Hele (I 964) pointed out that phenothiazines are surfaceactive agents and their surface activity is related to their
potency as tranquillizers with trifluoperazine being more
Potent therapeutically than chlorpromazine.
Here we report the difference in the extents of oxygen
release from haemoglobin and myoglobin due to the interaction with trifluoperazine and chlorpromazine.
Materials and Methods
Chlorprornazine and trifluoperazine were obtained as gifts
from Sun Pharmaceuticals, India. Myoglobin was purchased
fromSigma Chemical CO., USA. Oxymyoglobin was prepared
fromthe purchased stock by the method of Dixon & McIntosh
(1967). Other chemicals used in the experiments were of
wlfiical grade. Aqueous stock solutions of chlorpromazine
a d bifluoperazine were made before each set of experiments.
The concentration of the drug solutions were determined
SPectrophotometrically from their respective molar extinction
*hesent address: Department of Biochemistry, University of
Calcutta, 35 Ballygunj Circular Road, Calcutta 700 019, India.
Correspondence: A. S. Chakraborti, Department of Biophysics,
Molecular Biology and Genetics, University of Calcutta, 92 Acharyya
h f u l l a Chandra Road, Calcutta 700 009, India.
coefficients (chlorpromazine 305 nm, 4000 M - cmtrifluoperazine 308 nm, 3162 M - ' Cm-I).
Tetrameric haemoglobin was isolated and purified from
human blood donated by healthy non-smoking male volunteers, aged 22-25 (Bhattacharya et al 1990). Stock concentrations of either haemoglobin or myoglobin in phosphate
buffered saline (PBS, 0.15 M NaCI, 0.002 M sodium phosphate, pH 6.8) were determined from their Soret absorbances
with molar extinction coefficients at 415 nm of
125 mM-l cm-' and at 418 nm of 128 mM-l cm-I,
respectively. The oxygen content of both oxyhaemoglobin and
oxymyoglobin estimated from the characteristic absorption
spectra of each of the proteins was found to be 100%. All
fluorescence measurements were performed in a Hitachi F3010
spectrofluorometer using a 1-cm path-length cuvette as
described previously (Bhattacharyya et al 1994). Titration of
the drug-bound-protein was done from the quenching of
n
OWF3
zyxwvu
\
/
Trifluoperazine
Chlorpromazine
FIG. 1 Structures of chlorpromazine and trifluoperazine
�966
zyxwvutsrqpo
zyxwvutsrq
zyx
zyxwvuts
zyxwvutsrq
JAYA BHATTACHARWA ET AL
protein fluorescence at 332 nm when excited at 285 nm by
successive addition of the drug from a stock solution to
3 mL 8 pM protein.
Oxygen release from haemoglobin and myoglobin was
measured in a Gilson 5/6 oxygraph machine. The change in
partial pressure due to released oxygen in the haemoglobin or
myoglobin solution in a stoppered cell was detected by the
membrane-covered oxygen electrode fitted with the cell. The
output signal was recorded in the oxygraph chart as a function
of time. PBS alone showed no change in the output signal even
after 30 min stirring. The amount of free dissolved oxygen in
PBS was taken to be 250 nmol mL-' (West 1985). Calibration of the oxygraph chart in terms of the nmol oxygen release
was from the change in the output signal due to the total
depletion of free oxygen from 2 mL buffer when 0.1 g sodium
metabisulphite was added. No oxygen was found to be released
from tetrameric oxyhaemoglobin or monomeric oxymyoglobin
in 0.15 M NaCl, pH 6.8 in the absence of the drug. The temperature during the experiment was maintained at 27°C. Each
data point in Figs 3 and 4 represents the mean of five individual experiments and test of significance of the data corresponding to each ratio was by means of a t-test.
haemoglobin-chlorpromazine and myoglobin-chlorpromaine,
respectively.
Fig. 3 shows the release of oxygen from oxyhaemoglobin
and oxymyoglobin as a function of molar ratio of drug:
protein, and shows that the percentage of oxygen release from
both haemoglobin and myoglobin after a fixed interval of time
(2 min) increases with the increase in the stoichiometric ratio
of drug :protein. Since the amount of drug is higher at a higher
ratio, the extent of saturation of the drug-protein binding is
greater at higher ratio. Dependence of the release of oxygen on
the ratio suggests that oxygen release is related to the extent of
saturation of the drug-bound proteins. From Fig. 3 it is evident
that at the same ratio, trifluoperazine is more efficient with
respect to extent of oxygen release from either protein. For
example, at a molar ratio of drug :protein of 1.5, the release of
oxygen from oxyhaemoglobin was 4 and 15% in the presence
of chlorpromazine and trifluoperazine, respectively, while for
oxymyoglobin, the corresponding values were 20 and 4Wh.
The percentage of oxygen release from haemoglobin due to
drug binding was cooperative.
Fig. 4 shows the emission spectra of the complexes. The
change in Em,, was measured with respect to the emission
maximum of untreated haemoglobin or myoglobin. Addition
of either drug led to an increase in the wavelength of the
emission maximum (red shift) of both proteins as a function of
the increase in the added drug concentrations. Therefore,
concomitant with the drug-protein interactions, a change in the
conformation of these two proteins always occurs in such a
way that the tryptophan moieties of the protein molecules are
more exposed to the polar region. We have already shown that
tryptophan residues are in or near the possible binding sites for
haemoglobin and myoglobin interacting with chlorpromazine
(Bhattacharyya et al 1994) and trifluoperazine (unpublished
results). It is evident from Fig. 4 that upon binding of the
phenothiazine, haemoglobin exhibits greater cooperativity in
zyxwvutsrq
Results and Discussion
Fig. 2 is the representative plot in the oxygraph chart for the
release of oxygen from a fixed concentration of haemoglobin
(200 p ~ due
) to the gradual addition of trifluoperazine. The
rate was high immediately after the addition of the drug followed by a relatively slower rate. Similar patterns of oxygen
release were also observed for haemoglobin-chlorpromazine,
myoglobin-chlorpromazine and myoglobin-trifluoperazine.
However, the rate of oxygen release was greater for haemoglobin-trifluoperazine and myoglobin-trifluoperazine than for
c
.a
-00
160
I
Drug: protein ratio
J
I
oow
10
20
Time in minutes
'i0
FIG.2. Gilson 5 / 6 oxygraph chart of the release of oxygen from 2 mL
haemoglobin (200 PM, monomer basis) solution in 0.1 5 M phosphatebuffered saline, pH 6.8, when trifluoperazine at different final concentration was added at different times (arrows).
zyxw
FIG. 3. Release of oxygen from oxyhaemoglobin or oxymyoglobin as a
function of molar ratio of drug :protein. Percent release of oxygen was
estimated from nmol oxygen released from 2 mL oxyhaemoglobin
(monomer basis) or oxymyoglobin in phosphate-buffered saline
(0.002 M phosphate, 0.15 M NaC1, pH 6.8) in the presence of the
drug in the oxygraph. Before addition of drug both haemoglobin and
myoglobin in the oxygraph cell were taken to be 100% oxygenated.
The drug :protein ratio was varied either by varying the drug concentration for a fixed concentration of the protein or by changing the
protein concentration for a fixed drug concentration. 0 Haemoglobinchlorpromazine; 0 haemoglobin-trifluoperazine; A myoglobin-chlorpromazine; A myoglobin-trifluoperine.
�zyxwvutsrqponmlkjihgfedzyxw
cbaZYXWVU
zyxwv
zyxwvutsrq
zy
TRIFLUOPERAZINE AND RELEASE OF OXYGEN FROM HAEMOGLOBIN AND MYOGLOBIN
2o
I
about only local conformational change around tryptophan
moieties in the proteins as well as leading to the release of
oxygen from the proteins. These drug-induced effects are
probably related, as trifluoperazine is more effective than
chlorpromazine in causing both effects. The structural differences between chlorpromazine and trifluoperazine may be
responsible for the observed drug-induced effects. However,
the oxygen release from haemoglobin and myoglobin by
phenothiazines that we have reported here might be an adverse
effect which should therefore be given due consideration in
prescribing or administering phenothiazines.
P
Drug concn
967
zyxwvuts
zyxwvuts
UM)
Acknowledgements
We thank the University Grants Commission for providing a
Senior Research Fellowship to Miss Jaya Bhattacharyya and to
the Council of Scientific and Industrial Research for awarding
a Research Associateship to Dr Maitree Bhattacharyya. Thanks
are also due to Dr Subhankar Ray for the use of the Gilson 5/6
oxygraph machine.
zyxwvuts
FIG.4. Change in emission maximum wavelength of haemoglobin or
myoglobin in the presence of the drug. The change in emission
maximum wavelength was measured with respect to the emission
maximum of the corresponding protein in the absence of the drug.
(0)Haemoglobin-chlorpromazine;0 haemoglobin-trifluoperazine; A
myoglobin-chlorpromaine; A myoglobin-trifluoperazine.
References
the conformational change than does myoglobin. Here it is
worthwhile to mention that both drugs bind to haemoglobin in
a cooperative manner in comparison with the binding to
myoglobin which is non-cooperative (Bhattacharyya et a1
1994). It is also clear that trifluoperazine-induced conformational change of either protein is greater than that of the
chlorpromazine-induced change. It has also been found from
the circular dichroism spectra that the secondary structural
organization of both proteins as estimated by the a-helix
content (75% -helix) does not alter appreciably in the presence
of the drug (data not shown).
Thus interaction of phenothiazine drugs, chlorpromazine
and trifluoperazine, with haemoglobin and myoglobin bring
Bhattacharyya, J., Bhattacharyya, M., Chakraborty, A. S., Chaudhuri,
U., Poddar, R. K. (1994) Interaction of chlorpromazine with
myoglobin and hemoglobin - a comparative study. Biochem. Pharmacol. 47: 204!&2053
Bhattacharyya, M., Chaudhuri, U., Poddar, R. K. (1990) Studies on the
interaction of chlorpromazine with haemoglobin. Int. J. Biol.
Macromol. 12: 297-300
Dixon, H., Mclntosh, R. (1967) Reduction of methemoglobin in
hemoglobin samples using gel-filtration for continuous removal of
reaction products. Nature 213: 39WOO
Hele, P. (1964) The binding of polyphosphates by phenothiazines and
related compounds: a possible relationship to clinical potency as
tranquilisers. Biochem. Pharmacol. 13: 1261-1262
West, J. B. (1985) Best & Taylor’s Physiological Basis of Medical
Practices 1 Ith edn. Williams & Wilkins, p. 564
�
 Abhay Chakraborti