Research Paper
Visual sensory processing deficits in patients with
bipolar disorder revealed through high-density
electrical mapping
Sherlyn Yeap, MRCPsych; Simon P. Kelly, PhD ; Richard B. Reilly, PhD;
Jogin H. Thakore, MD, PhD; John J. Foxe, PhD
Yeap, Kelly, Reilly, Thakore, Foxe — The Cognitive Neurophysiology Laboratory, St. Vincent’s Hospital, Richmond Road,
Fairview, Dublin, Republic of Ireland; Kelly, Foxe — The Cognitive Neurophysiology Laboratory, Nathan S. Kline Institute for
Psychiatric Research, Program in Cognitive Neuroscience and Schizophrenia, Orangeburg, NY; Reilly — School of Engineering and School of Medicine, Trinity College, University of Dublin, Dublin, Republic of Ireland; Foxe — Program in Cognitive
Neuroscience, Departments of Psychology and Biology, City College of the City University of New York, New York, NY
Background: Etiological commonalities are apparent between bipolar disorder and schizophrenia. For example, it is becoming clear that
both populations show similar electrophysiological deficits in the auditory domain. Recent studies have also shown robust visual sensory
processing deficits in patients with schizophrenia using the event-related potential technique, but this has not been formally tested in those
with bipolar disorder. Our goal here was to assess whether early visual sensory processing in patients with bipolar disorder, as indexed by
decreased amplitude of the P1 component of the visual evoked potential (VEP), would show a similar deficit to that seen in those with
schizophrenia. Since the P1 deficit has already been established as an endophenotype in schizophrenia, a finding of commonality between disorders would raise the possibility that it represents a measure of common genetic liability. Methods: We visually presented
isolated-check stimuli to euthymic patients with a diagnosis of bipolar disorder and age-matched healthy controls within a simple go/no-go
task and recorded VEPs using high-density (72-channel) electroencephalography. Results: The P1 VEP amplitude was substantially reduced in patients with bipolar disorder, with an effect size of f = 0.56 (large according to Cohen’s criteria). Limitations: Our sample size
was relatively small and as such, did not allow for an examination of potential relations between the physiologic measures and clinical
measures. Conclusion: This reduction in P1 amplitude among patients with bipolar disorder represents a dysfunction in early visual processing that is highly similar to that found repeatedly in patients with schizophrenia and their healthy first-degree relatives. Since the P1
deficit has been related to susceptibility genes for schizophrenia, our results raise the possibility that the deficit may in fact be more
broadly related to the development of psychosis and that it merits further investigation as a candidate endophenotype for bipolar disorder.
Introduction
There is mounting evidence that at least partial common genetic liability exists between schizophrenia and bipolar disorder1–3 and that the 2 disorders may be more closely related
than was previously believed. Not only do bipolar disorder
and schizophrenia cosegregate in families, there is now evidence that they also share common genetic loci (see Bramon
and Sham,1 Table 1). The borders between these illnesses are
increasingly blurred, and current psychiatric nosology, dividing the 2 into entirely separate, categorically distinct entities,
may need some reconsideration. With overlapping symp-
toms, presentations of either disorder can often be challenging for clinicians to differentiate. Establishing both common
and separable neurobiological markers is one means by
which we can begin to understand the commonalities between these 2 disorders and what distinguishes them.
Efforts along these lines have already established that
evoked potential measures of auditory function such as P50
suppression, P300 and prepulse inhibition can potentially
be used as endophenotypes in both schizophrenia and bipolar disorder.4 Although it is increasingly clear that some of
these auditory deficits are common in both populations,5,6 to
our knowledge, potential visual dysfunction has yet to be
Correspondence to: Professor J.J. Foxe, Director, Program in Cognitive Neuroscience, Department of Psychology, City College of
the City University of New York, 138th St. and Convent Ave., New York, NY 10031; fax 845 398-6545; foxe@nki.rfmh.org
J Psychiatry Neurosci 2009;34(6):459-64.
Submitted Jul. 27, 2008; Revised Sept. 8, 2008; Jul. 7, Aug. 3, 10, 2009; Accepted Aug. 25, 2009.
© 2009 Canadian Medical Association
J Psychiatry Neurosci 2009;34(6)
459
�Yeap et al.
assessed in patients with bipolar disorder. In a series of studies, our group has employed visual evoked potentials to investigate early sensory processing in patients with schizophrenia, and we have consistently found a reduction in
amplitude of the extrastriate-generated P1 component,7–11 a
finding that has been replicated by many others12,13 (see Yeap
and colleagues,14 Table 1). This deficit is not only found in patients with chronic schizophrenia, but also in their firstdegree unaffected relatives,15 and more recently this deficit
was also found in patients with first-episode schizophrenia at
the initial onset of psychosis.16 Its presence in first-degree unaffected relatives in particular suggests that the P1 deficit
may serve as a genetic marker for schizophrenia and that it
may constitute a risk factor for the development of psychosis.
We have also related the P1 deficit to a specific risk haplotype
for schizophrenia on the dysbindin gene, which has been associated with increased risk for schizophrenia in numerous
independent samples,17 further underlining its capacity as an
endophenotypic marker for the disease.
Given that certain auditory processing deficits have been
found to be common across both schizophrenia and bipolar
disorder and given the demonstrated power of electrophysiological indices in inferring genetic liability, the question of
whether the visual P1 deficit marks a common genetic risk
factor for both disorders is one of clear and immediate priority. A logical first step is to determine whether the visual P1
deficit is present in patients with diagnoses of bipolar disorder. We address this directly in the present study by employing the same paradigm and methods in a group of patients
with bipolar disorder as those used in our previous studies of
patients with schizophrenia and their relatives.
Methods
Participants
Our study population included patients from St. Vincent’s
Psychiatric Hospital in Fairview, Dublin, Ireland, who met
DSM-IV criteria for bipolar disorder. We used the Young Mania Rating Scale18 and the Hamilton Depression Rating Scale19
to assess the level of severity of their current illnesses. We recruited controls from the local community and hospital staff,
and they were paid for volunteering. We assessed handedness in both groups using the Edinburgh Handedness Inventory.20 Controls self-reported any psychiatric illness or symptoms as well as medication use based on criteria from the
nonpatient version of the Structured Clinical Interview for
DSM-III-R.21 The ethics committee at St. Vincent’s Hospital
approved all procedures, and all participants provided written informed consent after the details of the study were fully
explained to them and before participating in the study.
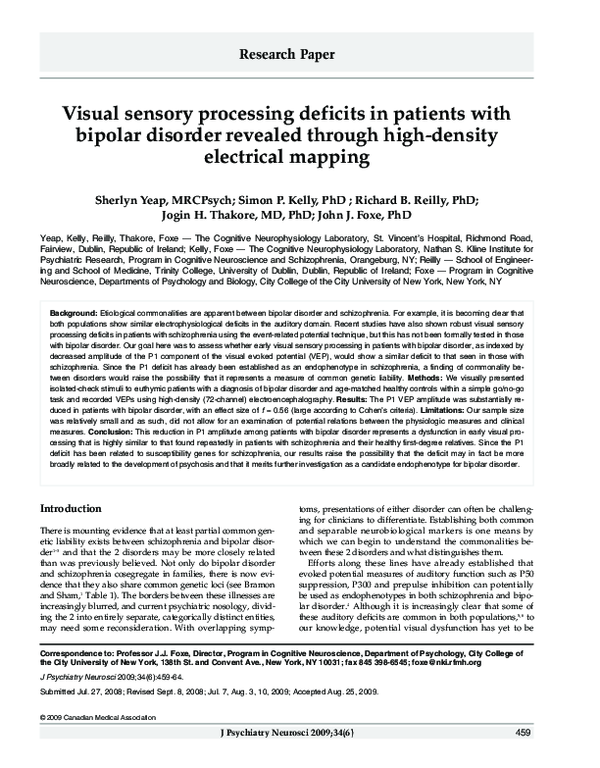
1.8°). The line drawings of the animals were interleaved between the check images. We chose a different animal pair for
each block from a possible 22 animals. On average, participants completed 13.5 (10–15) blocks, each lasting 3 minutes.
We presented stimuli centrally on a cathode ray tube computer monitor in random order, with the monitor located
160 cm directly in front of the seated participant.
The timing of stimulus presentation was such that each image appeared for 60 ms with a variable interstimulus interval
between 740 and 1540 ms (randomly in steps of 200 ms) during which there was a blank white screen. The target animal
was displayed at the start of the task, and we asked participants to respond each time this animal was presented by
pressing a button with their right thumb. We asked them to respond only to target animals and to withhold responses to any
other animal presented. The target and nontarget animals appeared with equal probability, ensuring that an observer could
not rely on the exogenous alerting nature of any noncheck
stimulus. Furthermore, we made the task of discrimination difficult by pairing similar-looking animals (e.g., a hippopotamus
and an elephant; Fig. 1). The use of this task ensured that participants were actively observing the stimuli. We analyzed
only event-related potentials to the standard check stimuli.
Electrophysiological recording and analysis
We acquired continuous electroencephalographic (EEG) data
through the ActiveTwo Biosemi (Biosemi) electrode system
from 72 scalp electrodes, digitized at 512 Hz with an open
pass-band from direct current to 150 Hz. We filtered data
with a 0-phase shift 45 Hz low-pass filter (24 dB/octave) and
re-referenced them to the nasion after acquisition. No highpass filter was applied.
We analyzed the data using Brain Electric Source Analysis
version 5.08 software (www.besa.de). Using a time-window
from 200 ms prestimulus to 500 ms poststimulus, we extracted
epochs and baseline-corrected them relative to the interval –80
to 20 milliseconds. Then we subjected epochs to an artifact
A
B
Stimuli and experimental design
In each experimental block, we presented participants with
about 100 isolated-check images (grey on a white background, 4° × 4° visual angle, 64% contrast) and 40 line drawings of 2 kinds of animals (on a white background, 2.4° ×
460
Fig. 1: The centrally presented visual stimuli used in the task. (A)
We derived event-related potential waveforms for the isolatedcheck nontarget stimulus, (B) whereas target discrimination was
based on infrequently presented animal line drawings.
J Psychiatry Neurosci 2009;34(6)
�Visual sensory processing deficits in patients with bipolar disorder
criterion of ±120 µV applied across all channels to reject trials
with excessive electromyography or other noise transients. We
also visually inspected the vertical and horizontal electrooculograms for blinks and large eye movements. Accepted
trials were averaged for the isolated check stimuli only.
As our primary dependent measure, guided by our previous work in schizophrenia populations, we defined an estimate of P1 amplitude as the area under the curve (v. the 0 µV
baseline) in the interval 80–100 ms, spanning the P1 component and chosen based on grand average waveforms collapsed across groups. We then submitted these integrated
amplitude measures to a mixed-design analysis of variance
(ANOVA) using SPSS software (SPSS Inc.) with the betweensubject factor of group (patients v. controls) and withinsubject factors of region (left, midline, right) and electrode
(O1, PO7, PO3; Oz, POz, Pz; O2, PO4, PO8). These regions
covered the left lateral occipital, midline dorsal and right lateral occipital visual scalp regions, respectively.
Following our primary analysis of P1 amplitude, it was of
interest to further investigate spatiotemporal properties of
any potential differences among groups using the statistical
cluster plot method. This procedure has been used effectively
in post-hoc analyses to fully explore complex data sets and
generate pointed follow-up hypotheses.22 Point-wise 2-tailed
t tests (here between controls and patients with bipolar disorder) are calculated at each time point for all electrodes, and a
colour map is subsequently generated marking time points
on each electrode for which the t value exceeds that corresponding to a p value of 0.05. Here we plot positive and negative t values in separate colour scales (green and gold), to
distinguish differences in opposite directions. All nonsignificant points are represented as white.
disorders. Regarding the EEG data, patients and controls did
not differ significantly (p = 0.42) in terms of hit rate (mean
percentage of correct responses 91.1%, SD 7.7% among
patients v. 94.2%, SD 10.4% among controls).
Our results show the P1 peak latency occurring between 80
and 100 ms, as is entirely typical for stimulation of this type
(Fig. 2A). An ANOVA (2 groups × 3 regions × 3 electrodes) on
P1 amplitude showed a significant main effect of group
(F1,22 = 7.25, p = 0.010), driven by the fact that the amplitude of
the P1 was significantly smaller in patients with bipolar disorder. There was also a main effect of region (F2,44 = 26.36,
p = 0.010) but no interaction of group with region. The main
effect of region simply indicates that the P1 was of greater amplitude over the lateral regions than over the central region,
and the lack of a region × group interaction indicates that
there was no difference in topographies between groups.
There was no main effect of electrode (F2,44 = 1.28, p = 0.28), nor
was there a group × electrode interaction (F2,44 = 0.65, p = 0.49).
Using results from this ANOVA, we calculated an effect size
of f = 0.54 for the main effect of group, which is a large effect
size (i.e., > 0.35) according to Cohen’s criterion.23 In keeping
with previous studies in patients with schizophrenia,14–16 we
observed the distribution of the P1 component to be bilateral
over the parieto-occipital scalp (Fig. 2B). The statistical cluster
map (Fig. 2C) illustrates the group difference at posterior electrode sites within the time range of the P1. Differences between groups are also evident during the N1 processing period (about 150 ms) and during a later positive component
occurring at about 300 ms. As the focus of the present study
was on the P1 component, these latter effects will not be further
discussed here but may be the subject of future investigations.
Discussion
Results
In this study, we found that the amplitude of the P1 component of the visual evoked potential was significantly reduced
Participants
Our sample included 12 patients with bipolar disorder
(6 women and 6 men) aged 19 to 63 years (mean 47.8, standard deviation [SD] 12.0 yr). All 12 patients met DSM-IV criteria for bipolar disorder, and all but 2 were outpatients.
Also, all 12 patients were in remission and euthymic at the
time of testing. The patients’ demographic and clinical characteristics are outlined in Table 1. All patients were medicated, with medications comprising combinations of mood
stabilizers and typical and atypical antipsychotics. Note that
we have repeatedly found no correlation between the P1
measure and antipsychotic dose in studies where our samples were large enough to adequately assess this issue.8,14 The
control group comprised 12 paid volunteers (5 women and
7 men) aged 21–64 years, (mean 46.0, SD 12.7 yr). The mean
age of patients and controls did not differ significantly
(p = 0.72). All but 2 participants from each group were righthanded, as assessed using the Edinburgh Handedness Inventory. 20 All participants reported normal or corrected-tonormal vision. Controls were medication-free and free of any
psychiatric illness or symptoms and reported no history of alcohol or substance abuse and no family history of psychiatric
Table 1: Characteristics of outpatients of St. Vincent’s Psychiatric
Hospital, Dublin, Ireland, with bipolar disorder
Patient
no.
1
2†
3
4
5
6
7
8†
9†
10
11
12
Average
Sex
Test score
Age,
Bipolar Age at Duration,
No.
yr YMRS HAMD I or II onset, yr
yr
admissions*
M
M
M
M
M
M
F
F
F
F
F
F
57
33
53
49
59
43
53
46
19
63
49
50
47.8
3
0
5
14
3
2
6
0
9
0
2
0
3.7
3
0
5
4
8
6
3
2
2
0
10
1
3.7
I
II
I
I
I
I
I
II
II
I
I
I
I=9
II = 3
14
13
33
26
30
21
16
18
17
18
15.5
14
19.6
43
20
20
23
29
23
37
28
2
45
33.5
36
28.3
> 20
1
1
> 20
4
10
> 20
3
1
5
1
> 20
19
F = female; HAMD = Hamilton Depression Rating Scale; M = male; YMRS = Young
Mania Rating Scale.18
*Number of acute admissions, not necessarily of a psychotic nature.
†Denotes patients who have never had any psychotic episodes.
J Psychiatry Neurosci 2009;34(6)
461
�Yeap et al.
in patients with bipolar disorder. This amplitude reduction
was highly similar to deficits that we have previously described in patients with schizophrenia using an identical paradigm,15 which suggests that visual sensory processing deficits
are common to both conditions. Since a weight of evidence
suggests that the P1 deficit is endophenotypic for schizophrenia, it will be important in future investigations to establish
whether this marker of visual dysfunction indexes shared genetic liability between schizophrenia and bipolar disorder.
These findings for visual processing build on work by
other groups in auditory sensory processing that has demonstrated common deficits in a number of auditory evoked potential components known to be endophenotypic for schizophrenia. For example, significantly diminished auditory P50
sensory gating24 and latency prolongation and amplitude reduction of the auditory evoked P30025 have been reported,
suggesting a disturbance of the temporoparietal generators of
these components in patients with bipolar disorder similar to
that typically seen in those with schizophrenia. Delayed auditory P300 latency has also been found in euthymic patients
with bipolar disorder,26 and it has been shown that unaffected
relatives of such patients also exhibit significantly delayed
P300 latency — though not amplitude deficits — over the
central parietal scalp.27 In contrast, however, abnormal mismatch negativity (MMN) generation, a highly robust finding
in patients with chronic schizophrenia, does not appear to be
present in patients with bipolar disorder.28 Although this latter finding might appear to cast doubt on the extent of overlap between these 2 disorders in terms of their underlying
neurophysiology, these results are actually quite consistent
with some recent findings regarding the endophenotype of
MMN in patients with schizophrenia.29,30 Magno and colleagues29 showed that although chronic schizophrenia patients did indeed show MMN deficits, as had been found by
many others previously,31,32 their first-degree biological relatives showed no such deficit, nor did a group of first-episode
patients. Other groups33–35 also found no evidence of MMN
impairment in first-episode patients. Taken together, the implication of these studies is that the greatest part of the MMN
deficit in patients with schizophrenia results from the active
expression of the disease state itself rather than the underlying genetic risk for the disorder. As such, it is perhaps not
surprising that MMN does not appear to be affected in patients with bipolar disorder.
Increasingly, evidence from family36 and twin studies37
suggests that a strong overlap exists in familial susceptibility
to schizophrenia and bipolar disorder. The heritability of the
2 disorders is not only significant, but also strikingly similar.1 Nonetheless, despite the evidence for similar patterns of
brain electrophysiology, there is also clear evidence that
A
B
10
10
5
5
0
0
–5
–5
100 200 300 400 500
0
10
10
5
5
0
0
–5
100 200 300 400 500
Controls
100 200 300 400 500
0
10
100 200 300 400 500
10
5
Controls
Patients
0
5
0
–5
–5
0
0
100 200 300 400 500
Differences
FP
AF
F
–5
0
Patients
C
100 200 300 400 500
Time, ms
Scalp region
Amplitude, µV
0
3
p < 0.05
2
FC
1
C
0
CP
–1
P
PO
O
–2
–3
p < 0.05
0
100
200
300
400
500
Time, ms
Fig. 2: (A) An overview of the event-related potential waveforms across the scalp with 6 representative channels over the time interval of
–100 ms to 500 ms. The P1 component (about 90 ms) is strongest over the posterior sites where contrasting responses to the isolated-check
stimuli are best observed for the 2 groups. (B) Topographic maps showing the voltage distribution on the scalp at 90 ms. There is a bilateral
parieto-occipital distribution of the P1 amplitude evident in both the bipolar and control groups. A difference map is plotted in the right panel.
(C) A statistical cluster plot is shown to illustrate all time points and scalp sites at which the event-related potential differed significantly between groups on the basis of 2-tailed t tests at an α level of 0.05. White denotes nonsignificance. Positive t values are displayed in green and
negative t values are displayed in gold. The 72-channel electrode array is arranged on this plot with the most posterior electrodes displayed at
the bottom and the most anterior at the top. This leads to the following progression: occipital (O), parieto-occipital (PO), parietal (P), centroparietal (CP), central (C), frontocentral (FC), frontal (F) and anteriofrontal (AF).
462
J Psychiatry Neurosci 2009;34(6)
�Visual sensory processing deficits in patients with bipolar disorder
important distinctions exist between the 2 psychotic illnesses. For example, magnetic resonance imaging studies
have confirmed brain volumetric changes in patients with
schizophrenia but not in those with bipolar disorder; only
those with schizophrenia showed increased lateral and third
ventricles and reduced hippocampus volumes.38 Again, the
question may be raised whether these differences are more
attributable to disease progression as opposed to shared
genetic liability. Salisbury and colleagues6 found a unilateral
abnormality in the P300 in the left temporal lobe in patients
with schizophrenia, whereas their patients with bipolar disorder showed more anterior frontal abnormalities. Other
(potential) endophenotypic measures like the auditory P50
ratios and the frequency of leading saccades during smooth
pursuit eye movements have been used to good effect to distinguish between patients with schizophrenia and those
with bipolar disorder.2
In summary, our study provides evidence that a commonly observed visual processing deficit in patients with
schizophrenia is also apparent in patients with bipolar disorder. That this deficit has been shown to be endophenotypic
for schizophrenia highlights the possibility that its presence
in patients with bipolar disorder may result from shared underlying genetic liability for psychotic disorders. It is
provocative that this deficit has been linked to a specific risk
haplotype for schizophrenia on the dysbindin gene,17 since a
number of recent studies now point to an association between specific dysbindin gene variants and bipolar disorder.39–41 An obvious next step will be to test for this deficit in
healthy first-degree biological relatives of patients with bipolar disorder to confirm whether the visual P1 deficit also represents an endophenotype for this disorder.
Acknowledgements: This work was supported in part by a grant
from the National Institute of Mental Health (MH65350) to Professor
John Foxe. Dr. Yeap was supported by a fellowship from the Irish
Health Research Board. The authors thank the Chief Executive Officer at St. Vincent’s Hospital, Mr. Edward Byrne and the Director of
Nursing, Mrs. Phil Burke, for their support of the Cognitive Neurophysiology Laboratory (CNL). Thanks also to Mícheál Mac an tSionnaigh and Máire Nic an tSionnaigh for their essential help in establishing and maintaining the CNL facilities at St. Vincent’s.
Competing interests: None declared for Drs. Kelly, Thakore and
Foxe. Dr. Yeap has received speaker fees and travel assistance from
the Irish Health Research Board. Dr. Reilly has received travel assistance from Unilever.
Contributors: Dr. Foxe designed the study. Drs. Yeap and Thakore
acquired the data, which Drs. Yeap, Kelly, Reilly and Foxe analyzed.
Drs. Yeap, Kelly and Foxe wrote the article, which all authors reviewed and approved for publication.
3.
Murray RM, Sham P, Van Os J, et al. A developmental model for
similarities and dissimilarities between schizophrenia and bipolar
disorder. Schizophr Res 2004;71:405-16.
4.
Hall MH, Rijsdijk F, Kalidindi S, et al. Genetic overlap between
bipolar illness and event-related potentials. Psychol Med 2007;37:
667-78.
5.
Muir WJ, St Clair DM, Blackwood DH. Long-latency auditory
event-related potentials in schizophrenia and in bipolar and
unipolar affective disorder. Psychol Med 1991;21:867-79.
6.
Salisbury DF, Shenton ME, McCarley RW. P300 topography differs
in schizophrenia and manic psychosis. Biol Psychiatry 1999;45:
98-106.
7.
Lalor EC, Yeap S, Reilly RB, et al. Dissecting the cellular contributions to early visual sensory processing deficits in schizophrenia
using the VESPA evoked response. Schizophr Res 2008;98:256-64.
8.
Foxe JJ, Murray MM, Javitt DC. Filling-in in schizophrenia: a highdensity electrical mapping and source-analysis investigation of illusory contour processing. Cereb Cortex 2005;15:1914-27.
9.
Foxe JJ, Doniger GM, Javitt DC. Early visual processing deficits in
schizophrenia: impaired P1 generation revealed by high-density
electrical mapping. Neuroreport 2001;12:3815-20.
10.
Butler PD, Hoptman MJ, Nierenberg J, et al. Visual white matter
integrity in schizophrenia. Am J Psychiatry 2006;163:2011-3.
11.
Doniger GM, Foxe JJ, Murray MM, et al. Impaired visual object
recognition and dorsal/ventral stream interaction in schizophrenia.
Arch Gen Psychiatry 2002;59:1011-20.
12.
Spencer KM, Nestor PG, Niznikiewicz MA, et al. Abnormal neural
synchrony in schizophrenia. J Neurosci 2003;23:7407-11.
13.
Haenschel C, Bittner RA, Haertling F, et al. Contribution of impaired early-stage visual processing to working memory dysfunction in adolescents with schizophrenia: a study with event-related
potentials and functional magnetic resonance imaging. Arch Gen
Psychiatry 2007;64:1229-40.
14.
Yeap S, Kelly SP, Sehatpour P, et al. Visual sensory processing
deficits in schizophrenia and their relationship to disease state. Eur
Arch Psychiatry Clin Neurosci 2008;258:305-16.
15.
Yeap S, Kelly SP, Sehatpour P, et al. Early visual sensory deficits as
endophenotypes for schizophrenia: high-density electrical mapping
in clinically unaffected first-degree relatives. Arch Gen Psychiatry
2006;63:1180-8.
16.
Yeap S, Kelly SP, Thakore JH, et al. Visual sensory processing
deficits in first-episode patients with schizophrenia. Schizophr Res
2008;102:340-3.
17.
Donohoe G, Morris DW, De Sanctis P, et al. Early visual processing deficits in dysbindin-associated schizophrenia. Biol Psychiatry
2008;63:484-9.
18.
Young RC, Biggs JT, Ziegler VE, et al. A rating scale for mania: reliability, validity and sensitivity. Br J Psychiatry 1978;133:429-35.
19.
Hamilton M. A rating scale for depression. J Neurol Neurosurg
Psychiatry 1960;23:56-62.
References
1.
2.
20.
Bramon E, Sham PC. The common genetic liability between schizophrenia and bipolar disorder: a review. Curr Psychiatry Rep 2001;3:
332-7.
Oldfield RC. The assessment and analysis of handedness: the Edinburgh inventory. Neuropsychologia 1971;9:97-113.
21.
Martin LF, Hall MH, Ross RG, et al. Physiology of schizophrenia,
bipolar disorder, and schizoaffective disorder. Am J Psychiatry 2007;
164:1900-6.
Spitzer RL, Williams JB, Gibbon M, et al. The Structured Clinical
Interview for DSM-III-R (SCID). I: History, rationale, and description. Arch Gen Psychiatry 1992;49:624-9.
22.
Molholm S, Ritter W, Murray MM, et al. Multisensory auditory
J Psychiatry Neurosci 2009;34(6)
463
�Yeap et al.
visual interactions during early sensory processing in humans: a
high-density electrical mapping study. Brain Res Cogn Brain Res
2002;14:115-28.
32.
Umbricht D, Krljes S. Mismatch negativity in schizophrenia: a
meta-analysis. Schizophr Res 2005;76:1-23.
33.
Salisbury DF, Shenton ME, Griggs CB, et al. Mismatch negativity
in chronic schizophrenia and first-episode schizophrenia. Arch Gen
Psychiatry 2002;59:686-94.
23.
Cohen J. Statistical power analysis for the behavioral sciences. Hillsdale
(NJ): Lawrence Erlbaum Associates Publishers; 1988.
24.
Schulze KK, Hall MH, McDonald C, et al. P50 auditory evoked potential suppression in bipolar disorder patients with psychotic features and their unaffected relatives. Biol Psychiatry 2007;62:121-8.
34.
Salisbury DF, Kuroki N, Kasai K, et al. Progressive and interrelated functional and structural evidence of post-onset brain reduction in schizophrenia. Arch Gen Psychiatry 2007;64:521-9.
25.
O’Donnell BF, Vohs JL, Hetrick WP, et al. Auditory event-related
potential abnormalities in bipolar disorder and schizophrenia. Int J
Psychophysiol 2004;53:45-55.
35.
Umbricht DS, Bates JA, Lieberman JA, et al. Electrophysiological
indices of automatic and controlled auditory information processing in first-episode, recent-onset and chronic schizophrenia. Biol
Psychiatry 2006;59:762-72.
26.
El-Badri SM, Ashton CH, Moore PB, et al. Electrophysiological and
cognitive function in young euthymic patients with bipolar affective disorder. Bipolar Disord 2001;3:79-87.
36.
Kendler KS, Gardner CO. The risk for psychiatric disorders in relatives of schizophrenic and control probands: a comparison of three
independent studies. Psychol Med 1997;27:411-9.
Schulze KK, Hall MH, McDonald C, et al. Auditory P300 in patients with bipolar disorder and their unaffected relatives. Bipolar
Disord 2008;10:377-86.
37.
Cardno AG, Marshall EJ, Coid B, et al. Heritability estimates for
psychotic disorders: the Maudsley twin psychosis series. Arch Gen
Psychiatry 1999;56:162-8.
Hall MH, Rijsdijk F, Picchioni M, et al. Substantial shared genetic
influences on schizophrenia and event-related potentials. Am J
Psychiatry 2007;164:804-12.
38.
McDonald C, Marshall N, Sham PC, et al. Regional brain morphometry in patients with schizophrenia or bipolar disorder and
their unaffected relatives. Am J Psychiatry 2006;163:478-87.
39.
Fallin MD, Lasseter VK, Avramopoulos D, et al. Bipolar I disorder
and schizophrenia: a 440-single-nucleotide polymorphism screen
of 64 candidate genes among Ashkenazi Jewish case-parent trios.
Am J Hum Genet 2005;77:918-36.
40.
Joo EJ, Lee KY, Jeong SH, et al. Dysbindin gene variants are associated with bipolar I disorder in a Korean population. Neurosci Lett
2007;418:272-5.
41.
Pae CU, Serretti A, Mandelli L, et al. Effect of 5-haplotype of dysbindin gene (DTNBP1) polymorphisms for the susceptibility to bipolar I disorder. Am J Med Genet B Neuropsychiatr Genet 2007;144B:701-3.
27.
28.
29.
Magno E, Yeap S, Thakore JH, et al. Are auditory-evoked frequency and duration mismatch negativity deficits endophenotypic
for schizophrenia? High-density electrical mapping in clinically
unaffected first-degree relatives and first-episode and chronic
schizophrenia. Biol Psychiatry 2008;64:385-91.
30.
Bramon E, Rabe-Hesketh S, Sham P, et al. Meta-analysis of the P300
and P50 waveforms in schizophrenia. Schizophr Res 2004;70:315-29.
31.
Javitt DC, Grochowski S, Shelley AM, et al. Impaired mismatch
negativity (MMN) generation in schizophrenia as a function of
stimulus deviance, probability, and interstimulus/interdeviant interval. Electroencephalogr Clin Neurophysiol 1998;108:143-53.
Change of address
We require 6 to 8 weeks’ notice to ensure
uninterrupted service. Please send your current
mailing label, new address and the effective
date of change to:
464
CMA Member Service Centre
1870 Alta Vista Dr.
Ottawa ON K1G 6R7
tel 888 855-2555 or
613 731-8610 x2307
fax 613 236-8864
cmamsc@cma.ca
J Psychiatry Neurosci 2009;34(6)
�
 Richard Reilly