STRATEGIC TAX COLLECTION AND FISCAL
DECENTRALISATION: THE CASE OF RUSSIA
ALEXANDER LIBMAN
LARS P. FELD
CESIFO WORKING PAPER NO. 2031
CATEGORY 1: PUBLIC FINANCE
JUNE 2007
An electronic version of the paper may be downloaded
• from the SSRN website:
www.SSRN.com
• from the RePEc website:
www.RePEc.org
• from the CESifo website:
www.CESifo-group.de
T
T
�CESifo Working Paper No. 2031
STRATEGIC TAX COLLECTION AND FISCAL
DECENTRALISATION: THE CASE OF RUSSIA
Abstract
In a centralized federation, where tax rates and taxation rules are set by the federal government, manipulating the thoroughness of tax auditing and the effectiveness of tax collection
could be attractive for regional authorities because of a variety of reasons. These range from
tax competition to principal-agent problems, state capture and benefits of fiscal equalisation.
In this paper we discuss strategic tax auditing and collection from the perspective of fiscal
federalism and test for strategic tax collection empirically using data of the Russian Federation. Russia’s regional authorities in the 1990s have always been suspect of tax auditing manipulations in their favour. However, in the 2000s increasing bargaining power of the centre
seems to induce tax collection bodies in the regions to manipulate tax auditing in favour of the
federation. We find partial evidence in favour of both of these hypotheses.
JEL Code: H26, H77.
Keywords: fiscal federalism, tax arrears, transition economies.
Alexander Libman
University of Mannheim
Center for Doctoral Studies in Economics
68131 Mannheim
Germany
libman@rambler.ru
Lars P. Feld
University of Heidelberg
Alfred-Weber-Institute
Chair of Public Economics
Grabengasse 14
69117 Heidelberg
Germany
lars.feld@awi.uni-heidelberg.de
This version: June 5, 2007. First Version: December 24, 2006.
We thank Mikhail Golovnin, Oleg Ryhtikov, Ekaterina Klyusheva and Daria Ushkalova
(Institute of Economics RAS), Vladimir Popov (New Economic School) and Vladimir
Klimanov (Institute for Public Finance) for help by collecting data for the research. We are
also grateful to Daniel Treisman for comments on the sources of data. The paper was
presented at the First World Meeting of the Public Choice Societies in Amsterdam in March
2007. The authors thank the discussant and the participants, in particular Stefan Voigt, for
helpful suggestions. All mistakes remain our own.
�–2–
1. Introduction
In centralized federations with administrative powers of the sub-federal jurisdictions
(administrative federalism), where the federal government sets the tax rates, tax base definitions and the rules of tax collection, tax auditing often remains the only instrument available
for regions to design their own tax policy. Indeed, there is some (so far mostly anecdotal) evidence for several federations, that different regions have different degrees of thoroughness in
enforcing tax laws. In Germany, rich and poor states (Länder) are supposedly less severe in
their tax auditing activity to compete for mobile taxpayers (Baretti, Huber and Lichtblau,
2002; Stöwhase and Traxler, 2005). In Belgium, the Flemish region has also been repeatedly
accused of being relatively lax in its tax auditing (Cremer and Gahvari, 2000). Occasionally
regional governments even provide different support to local businesses to avoid federal taxation and legislation (Cai and Treisman, 2004). And, naturally, this issue becomes more important in the developing and transformation economies, since a deficit of the rule of law provides additional opportunities for regional governments and enterprises.
There are several reasons for regional governments to reduce their efforts in tax auditing and collection. In a tax competition framework enforcement policy acts as an instrument
to attract mobile capital, if direct changes of tax rates are impossible. In a way, regions compete by “sheltering” firms from federal taxation or other interventions (Cai and Treisman,
2004; Sonin, 2005). This activity becomes especially important, if the degree of state capture
at the regional level is higher than at the level of the federation, and influential firms seek protection of the regional authorities from the (uncontrolled) centre (Treisman, 1999). From the
perspective of vertical fiscal relations, if benefits from federal grants exceed potential losses
from lower tax collection and fiscal transfers depend upon deficits of regional budgets, a bad
standing in tax collection could be attractive for regional governments (Stöwhase and Traxler,
2005). Finally, federal government could also be interested in reducing its tax collection effort. In this case different tax auditing policies in different regions act as an instrument of spatial redistribution or business subsidizing, if direct grants or transfers are politically undesirable (Ponomareva and Zhuravskaya, 2004). The central question then becomes who is effectively controlling tax authorities in the regions.
Moreover, strategic tax auditing and collection could be applied as a way of de-facto
fiscal decentralisation, measured by distribution of tax revenue between the federation and the
states. As auditing effort is often not directly observable, it could create a principal-agent
problem. There is no reason to believe, that regions (if they control tax auditing activities) are
equally thorough to enforce tax laws, when a larger share of the tax revenue collected is attri-
�–3–
buted to the federal government, as compared to taxes, which mostly benefit regional budgets.
It is thus possible to hypothesize that tax arrears would mostly accumulate on expense of the
federation, i.e. taxes with a higher regional share are more actively collected than those which
are mostly attributed to the centre. On the contrary, the federation can also be interested in the
“hidden” re-centralisation through strategic tax collection. In this paper we test these hypotheses empirically using data of the Russian Federation. To our knowledge, the paper is one of
the first attempts of empirical investigation of the strategic tax collection hypothesis.
There are several factors, which make Russia an interesting case for the studies of
strategic tax collection. First, during the 1990s, tax collection in Russia experienced a significant decline; the situation improved in the 2000s under the new administration, but the share
of shadow economy still remains significant. Therefore selective application of tax collection
instruments seems to be a reasonable assumption for the behaviour of tax authorities in this
environment (as compared to countries with high tax morale). Second, Russian regions are
suspect of manipulating the tax collection throughout the 1990s: both because of a de-iure
highly centralized federal structure, but de-facto increasing unilateral devolution. Third,
changes of tax collection behaviour from Yeltsin to Putin offer an important “natural experiment”, which can be used to understand how shifts of relative bargaining power between the
centre and the regions affects tax auditing and collection behaviour. However, the “shadow
side” of the advantages are potential difficulties by modelling Russian federalism econometrically. On the one hand, Russia has been an extremely asymmetric country both in terms of
political, economic and fiscal structure. It suggests potential impact of outliers on the estimation results. On the other hand, transition from Yeltsin to Putin can also pose certain modelling problems, for example the timing of changes. We develop a four-stage estimation strategies in order to account for these difficulties.
Our paper is complementary to Treisman (1999, 2003), who also discusses the influence of decentralisation on tax arrears; but unlike Treisman, we attempt to find out, how the
strategic tax auditing policy changed during the evolution of Russian federalism in the 1990s
and 2000s. Our data set covers the period between 1995 and 2003, and therefore does not only
include the first term of Yeltsin’s presidency, but also his second term and a significant part
of Putin’s first term. To our knowledge, this paper is thus also one of the first attempts to apply tools of empirical research to explicitly studying the changes in Russian fiscal federalism
under Putin in the 2000s. We also use an alternative logic of explanation: Treisman’s assumption is that different shares of regions in total tax collection make them more or less lax in tax
auditing activity, i.e. fiscal decentralisation is an exogenous variable, influencing political de-
�–4–
cisions on tax collection effort. In this paper we argue, that differences in tax revenue distribution across the federation result from different tax auditing activity, or that fiscal decentralisation is an endogenous process caused by strategic tax policy.
The paper is organized as follows: the next section provides a brief overview of Russian federalism and the reasons for strategic tax auditing in this institutional setting. The third
section presents our main hypotheses and discusses the theoretical background for the study.
The fourth section describes the methodology and data. The fifth section presents our findings
for all four steps of analysis (annual cross-sections, panel data, TSLS and median regressions)
and discusses their potential implications. The last section concludes.
2. Strategic tax collection and Russian fiscal federalism
The development of Russian federalism in the 1990s was characterized by the interrelation of two different aspects of its structure: high formal centralisation and high economic,
political and fiscal asymmetry both inherited from the historical development and resulting
from transition, in particular from the process of unilateral devolution and bilateral bargaining
between the federation and the regions. Formal centralisation reduces the toolbox of legal instruments available for the regions to design their tax policy; high asymmetry increases demand for region-specific policies (due to both economic conditions and heterogeneous preferences of the elites and the population) and also (potentially) creates differences in the bargaining power of individual regions vis-à-vis the federation and (more important) individual federal agencies and their regional branches. Under these conditions strategic tax collection and
auditing become both possible and desirable at least for several regions.
In the early 1990s, the share of taxes attributed to the federal centre was set individually for every region and all issues of inter-budgetary relations were determined by negotiations between regions and the centre. However, since 1994 Russian regions have been very
limited in their tax authorities. The exclusive list of taxes is set by the federal parliament, and
all taxes are collected by the unified federal tax service, although tax revenue is split between
federal, regional and municipal budgets. Taxes in Russia are either joint taxes or, even if they
are completely attributed to the region, the tax rate is still within the authority of the centre.
The distribution of tax revenue between the federal centre and the regions is prescribed by the
federal legislation (or by the individual decisions of the federal government in case of the socalled “regulating taxes”). For some taxes, regions were entitled to change the regional rate of
taxation (even reducing it to zero), but only within the scale set by the federation and for taxes
set by the federation.
�–5–
This de-iure highly centralized federal order was implemented in an extremely heterogeneous country. Different regions of Russia are characterized by different resource endowments and industrial capacities, different population structure and different access to transportation infrastructure and markets. Moreover, Russian regions often differ significantly in
terms of their political system and organisation of decision making from the point of view of
both informal rules and partly formal institutions. During the 1990s this heterogeneity was
supplemented by a strong political asymmetry, resulting from the effort of Russian regions to
achieve greater autonomy. Partly this activity took place within the framework of direct bilateral bargaining between federal and regional governments, leading to the establishment of
formal power-sharing treaties, which are often referred to as basic elements of an asymmetric
federation (Filippov, Ordeshook and Shvetsova, 2004, Chapter 4). On the other hand, federal
law (acts of the parliament and also presidential decrees) was also used to give additional authorities to regions. More important from the point of view of this paper is the unilateral activity of regions leading to devolution. Its most prominent forms included “the war of laws” (introduction of regional legislation running contrary to the federal one) or tax withholding.
Finally, Russia has also been characterized be enormous de-facto asymmetry in tax
revenue distribution. In the period between 1994 and 2004 the share of taxes received by the
centre from different regions varied from practically zero (Sakha in 1994 and 1995) to more
than 95% (Kalmykia in 2005). Figure 1 presents the distribution of Russian regions according
to their share in the tax revenue from their territory. An obvious reason for the heterogeneity
are differences in composition of tax base or political privileges. However, these factors only
partly account for the observed asymmetries. Surprisingly, the “notorious” forms of unilateral
devolution mentioned above also do not seem to explain the asymmetric structure in the tax
collection. Although the significant differences between the federal and the local regulation
existed until the early 2000s (Chang, 2005), the possibilities for tax withholdings went down
relatively quickly. While in 1993 about 30 regions declared tax-withholding plans, not a single one really implemented them. In 1996 St. Petersburg was the only region withholding
20% of the land tax revenue. Institutional factors like development of the federal tax service
contributed much to this change: as Lavrov (2005) puts it, since 1994 regions did not pay
taxes to the centre, it is the centre, which provides funding to the regions. There were only
seldom attempts of open “budgetary separatism” in the 1990s. After the crisis of 1998 several
regions announced potential tax withholding, and the parliament of Kalmykia (one of the national republics in the Southern part of Russia) decided to stop payments to the federal
budget, but quick and severe actions of the federations (e.g. the Ministry of Finance stopped
�–6–
funding federal programs on the Kalmykian territory) resulted in abolition of this regulation.
Moreover, the major advantages obtained by the regions by the bilateral treaties were of nonfiscal nature – control over oil and gas exploration in Tatarstan and Bashkortostan and for
diamond industry in Sakha. The first two treaties with Tatarstan and Bashkortostan allowed
these republics to receive all excises and rental payments for the natural resources instead of
federal centre. However, Sakha, the third region, which was only able to enforce the special
privileged regime to use part of the federal taxes collected on its territory for funding of federal program, i.e. a limitation was put rather on the expenditure than the revenue side of the
budget. Later treaties either did not include any fiscal arrangements, or were mostly based on
the Sakha scheme (if they included any fiscal aspect at all).
60%
% of the total number of regions
50%
40%
30%
20%
10%
0%
< 30%
30-40%
40-50%
50-60%
60-70%
> 70%
Share of the regional government in the overall tax revenue from its territory
1994
1995
1996
1997
1998
1999
2000
2001
2002
2003
2004
Figure 1: Distribution of regions according to the region’s share in total taxes collected.
Sources: Goskomstat, Ministry of Finance, Federal Tax Service, Federal Treasury, Freinkman, Treisman and Titov, 1999
Therefore it is reasonable to look for alternative instruments able to establish a link between economic heterogeneity and political asymmetry to fiscal asymmetry. Since direct tax
withholding was impossible, regional governments applied alternative instruments of unilateral devolution in order to establish complete control over their local economies. During the
1990s regions often captured “their” local tax administrations (that were officially part of the
Federal Tax Service), e.g. because of personal relations, absent federal financing and territo-
�–7–
rial rotation (Enikopolov, Zhuravskaya and Guriev, 2000). Moreover, about fifteen regions
introduced monetary surrogates, which were used also to protect local enterprises from federal
taxation (Genkin, 2000, Gaddy and Ickes, 2002). These informal institutional features, combined with general accumulation of tax arrears in the economy, could make the strategic tax
auditing an attractive solution for Russian regions.
In fact, the role of political and institutional factors in accumulation of tax arrears was
demonstrated by a number of empirical studies. The research of Treisman (2003) covers the
period of 1994-1997 and is mostly based on region-level data. According to his results, regions with larger enterprises tend to have higher tax arrears, the election of a Communist governor is positively correlated with tax debt, and territories in which the share of regional government increased most in the previous year had lower growth of tax arrears. Ponomareva and
Zhuravskaya (2004) apply a micro-level approach based on individual data on tax arrears of
about one thousand firms in 1997 and 1998 and find higher federal tax arrears (controlling for
liquidity) for regions with a stronger bargaining position against the centre, with higher support of governors in the last elections and with higher tensions in relations between governors
and the centre. Treisman (1999) also presents a study of 42 enterprises in 1994-1997 and finds
that in regions with a lower share of the federation in total tax revenue in the previous year
companies pay higher taxes as share of reported pre-tax income. Slinko, Yakovlev and Zhuravskaya (2005) study a set of Russian regions in 1996-2000 and argue that state capture is
associated with an increase of federal tax arrears, but does not have any significant influence
on regional tax arrears. Finally, Yakovlev (2006) presents some anecdotal evidence of tax auditing as tool in horizontal tax competition and Plekhanov (2006) shows for a sample of 79
regions in 1998-1999 that protecting enterprises from taxation seemed to be an important instrument to attract mobile capital.
While centralized federal structure and economic and political asymmetry created demand for strategic tax collection policies, the third “ingredient” simplifying the use of strategic tax management in form of accumulating tax arrears has been increasing tax evasion in the
Russian economy in the first ten years of transition as a result of liquidity deficit and mutual
arrears networks of the early 1990s, of low tax morale and of a legitimacy deficit of the state
as well as inefficient enforcement (see e.g. Varese, 1997; Yakovlev, 1999; Polterovich, 2001
or Wintrobe, 2001). In 2002-2003 the share of the shadow economy accounted for 48.7% of
Russian GDP (Schneider, 2005). A detailed discussion of the reasons for tax evasion is beyond the scope of this paper though it is important to notice, that this environment enlarges
the options for strategically manipulating tax collection.
�–8–
However, the ability of regions to manipulate tax arrears went down under the new
administration of Vladimir Putin. One of the first acts of the new president was to regain control over the federal political structures in regions (what was called “strengthening the vertical
of power”): in 2000 seven new federal districts were established, where presidential representatives (mostly with a background in the military or security service) obtained the right to
oversee the selection and placement of personnel in local branches of federal authorities
(Ross, 2003). Furthermore, regional governors lost a significant part of their influence because of institutional changes (like the reform of the upper chamber of the Russian parliament, the Federal Council, or the right of the president to remove a governor from his office;
see Hyde, 2001) accompanied by a strong public support for the new president. After 2000, a
consolidation of government (with increasing pressure of tax authorities and state-loyal decisions of courts), internationalisation of Russian businesses requiring an increase in transparency (Yakovlev, 2005) and advancements in tax reform (Jones, Luong and Weinthal, 2004)
seem to have made evasion less attractive. Moreover, the tax burden was weakened by the
introduction of the flat tax on personal income. Although empirical studies on its effect are
inconclusive (Ivanova, Keen and Klemm, 2005), it appears that it mainly affected tax revenue
because it has facilitated tax collection and thus reduced the extent of tax evasion. After a
permanent increase of tax arrears as a share of GDP or household tax revenue, this indicator
seems to go down since 1999 (Figure 2).
50%
45%
40%
35%
30%
25%
20%
15%
10%
5%
0%
1996
1997
Tax arrears / GDP
1998
1999
2000
2001
2002
2003
2004
Tax arrears / Tax revenue of consolidated budget
Figure 2: Tax arrears in the Russian Federation (as of December 31 of respective year)
Source: Goskomstat
All these factors seem to reduce the willingness and the ability to manipulate taxation
in favour of the regions. Nevertheless, even in 2003-2004, tax evasion exceeded 40% of taxes
�–9–
paid when considering the so-called “spacemen schemes” (which include the creation of a
short-life firm) of an average firm only (Mironov, 2006). Meanwhile the degree of asymmetry
between regions in tax distribution remained significant: Magadan was able to get about 98%
in 2003 of the whole tax revenue and may be compared with the most “secessionist” republics
of the early 1990s. Indeed, the standard deviation of shares of tax collection de-facto attributed to regional budgets increased significantly in the last five years (Figure 3).
15%
14%
13%
12%
11%
10%
9%
8%
1994 1995 1996 1997 1998 1999 2000 2001 2002 2003 2004
.
Figure 3: Standard deviation of the region’s share in the tax revenue from its territory
Sources: Goskomstat, Ministry of Finance, Federal Tax Service, Federal Treasury; Freinkman, Treisman and Titov (1999)
Hence, under Putin all three elements of the “strategic tax collection environment” (heterogeneity of regions, centralized federation and tax avoidance) still exist or become even more
pronounced. There are, however, obvious changes in the bargaining power of the federation
and regions. One could thus expect that the strategic tax collection behaviour changes. The
next section presents some simple theoretical considerations, which could be useful to derive
the main hypotheses for empirical research.
3. Theoretical framework and main hypotheses
In order to formulate the empirical hypotheses we consider a simple principal-agent
framework, where local tax authority (agent) acts on behalf of two principals: the federal government and the local government (as both gain from tax collection). The results of the
agent’s activity depend upon his effort and the environmental characteristics. Agent’s utility
is derived from potential benefits provided by the principals (e.g. direct (formal and informal
payments), non-monetary benefits, career advancements etc.). Obviously, negative benefits
�– 10 –
(punishments) are possible. On the other hand, agent’s activity is constrained by his resources,
which could be used for tax collecting effort. This assumption is plausible given the high tax
avoidance in Russia, which indicates, that tax service (given its resources) is unable to collect
the total taxes due anyway. We assume that the resources for tax collection are exogenous.
Moreover, the agent can choose between allocating effort in collection of “federal” or “regional” taxes (or taxes with a higher share of the federal government or the regional government). However, this allocation decision is only partly observable (but still observable to a
certain extend) by the principals, whose monitoring capacity is unequal. Hence, the principals
cannot completely distinguish between the results of the agent’s activity caused by environmental characteristics or by allocation of his effort. Each principal maximises his own tax
revenue regardless of the revenue of the other principal. The agent’s benefit depends upon the
principal’s assessment of the agent’s effort for collecting taxes attributed to this principal regardless of total tax collecting effort.
In a decentralized environment, like that of the development of Russian federalism
under Yeltsin, the regional government has a double advantage over the federation: first, it
has better instruments to observe both effort and environmental conditions and, second, it has
a relative advantage in bargaining power (which has been extensively discussed in the previous section). Hence, the benefits from the regional government are higher, than those provided by the federal government (and the potential punishments also exceed those of the federation). First, regional government can effectively “protect” the agent from potential federal
punishment and second, its resources for punishment and benefits for the agent exceed those
of the federation. Moreover, the agent’s ability to “cheat” of the agent is higher with respect
to the federation, than with respect to the region. Then it is more likely that the agent directs
his effort in a way to better satisfy the requirements of the local principal than of the federal
one. Assume further, that different agents in different regions face different tax collection
constraints (because of the economic heterogeneity of regions); however, the federal centre is
“equally weak” vis-à-vis different regions.
Since the tax revenue potentially originating from the tax base generated by the economy is not fully collected by the tax authorities, enterprises form tax arrears (both formally
claimed by the tax collection service and successfully “hidden” from the state). Then, strategic tax collection influences the distribution of tax arrears: tax arrears are larger for taxes,
which are less thoroughly collected (given similar tax bases). From this point of view one can
claim, that under conditions described above tax arrears for regional taxes are smaller, than
those for federal taxes. If the tax arrears accumulate on costs of the federal taxes, the ratio of
�– 11 –
federal taxes to total tax collection goes down (since both the numerator and the denominator
are equally affected), resulting in effective fiscal decentralisation (as defined above). Other
things being equal, regions with higher tax arrears should therefore achieve higher fiscal decentralisation, leading to the following hypothesis:
Hypothesis 1: In the 1990s (under Yeltsin’s presidency) regions with higher
tax arrears are more likely to exhibit ceteris paribus higher fiscal decentralisation in terms of tax revenue attributed to the federal centre.
Obviously, bargaining power of the federal centre also varies differently in different centreregion relations. Hence, for the aims of empirical analysis one has to control for potential political variables influencing the ability and the willingness of the regions to bargain with the
federation in order to establish the ceteris paribus condition.
The reform of Russian federalism under Putin (including changing institutional design
of the federation and changes of informal rules of the game in the federal relations) shifts the
bargaining power balance to the federation and increases its monitoring abilities. Hence, the
incentives for the agent are reversed: it can derive higher utility (from benefits and avoiding
punishments) from directing tax collection effort into federal taxes. Note, that there are no
changes of agent’s or principals’ utility functions in this setting: we assume only changes of
monitoring capacity and bargaining power. The shifts of strategic tax collection behaviour
result from the actions of the agent, facing constraints of limited ability to collect taxes in
general, while the principal’s action has only an indirect impact (from bargaining over “protecting” the agent from the punishment by another principal). Hence, we claim, that an important factor for the manipulation of tax arrears under Putin can be the initiative of regional tax
authorities seeking promotion and demonstrating their loyalty.
Unfortunately, there is no empirical evidence with respect to personnel changes in the
regional tax authorities. However, there is some anecdotal evidence from other regional
branches of federal law enforcing agencies, that the federal government started an active personnel restructuring since 2001 in order to ensure higher loyalty of regional authorities to the
federation and to break the informal connections between local governments and local
branches of federal agencies. For example, in 2001 the Federal Ministry of Internal Affairs
(which is also responsible for the police in Russia) changed the heads of its regional branches
in 7 regions; in 2002 it were 13 regions, in 2003 25 regions and in 2004 22 regions. Most successors of the heads of regional police offices were not appointed from the regional staff, like
it used to be the case in the 1990s; mostly they came from other regions or from the federal
bodies of the Ministry (Voronov, 2005). It is likely, that other local branches of federal minis-
�– 12 –
tries expected similar changes (which were only partly reported by the press). But even if
there were no direct changes in the tax collection service since 2000, the very experience of
other ministries and services could have a strong impact on the behaviour of regional authorities. The logic is exactly reverse to Hypothesis 1: tax arrears are mostly accumulated on costs
of regional governments; in the ratio of federal tax revenue to total tax revenue the increase of
tax arrears does affect the denominator much stronger, than the numerator, and the associated
hypothesis is:
Hypothesis 2: In the 2000s (under Putin’s presidency) regions with higher
tax arrears are more likely to exhibit ceteris paribus lower fiscal decentralisation in terms of tax revenue attributed to the federal centre.
However, the principal-agent framework presented above does not provide any arguments regarding strategic tax collection under increasing centralisation, typical for Putin’s
presidency. On the contrary, since the influence of regional authorities went down, there seem
to be no reasons for continuing strategic tax collection; the federal government, regaining
control over regional tax authorities, could implement its aims through formal legislation (and
indeed, the tax reforms since 2000 partly aimed to increase the share of tax collection attributed to the federal government). An alternative point of view is offered by the discussion of
the semi-authoritarian regime in Russia, mostly originating from political sciences. The main
idea of the approach is to differentiate between the “classical” authoritarianism, where the
central government is able to enforce its objectives vis-à-vis other political groups through
direct pressure, and the “hybrid regime”, or “semi-authoritarianism”, where the central government enforces its aims through indirect or hidden channels, imitating the “formal” democratic framework of developed countries (Olcott and Ottaway, 1999; Levitsky and Way, 2002;
Furman, 2007). Technically, one assumes the additional constraints for the federation to
change the institutional environment in its favour (similar to the typical way to model behaviour of non-democratic regimes presented e.g. in Acemoglu and Robinson (2006) – “revolutionary constraint”, or Wintrobe (1990) – minimal value of power function for the tinpot).
This “imitation” results from a variety of reasons. First, unlike “classical” authoritarian regimes, semi-authoritarian governments have a vested interest in the integration in the
international community and hence, in complying with the rules of democratic societies (at
least formally). Second, it can follow from a relatively weak power concentration (as compared to the “classical” authoritarianism”), which makes the use of “indirect channels of control” inevitable. Anyway, formal redistribution of tax revenue between the centre and the regions could be politically undesirable after certain thresholds are passed; so, the federal centre
�– 13 –
may also be interested in strategic tax auditing as a “hidden” instrument to ensure the re-centralisation goals while formally complying with the “rules of conduct” established for democratic federations in the international community. Hence, the semi-authoritarian approach also
provides some background for Hypothesis 2.
4. Methodology and data
Due to the formulation of the hypotheses, and also because of limited ability to observe tax collection effort, we focus on tax arrears. An advantage of the Russian dataset is that
there are data available on tax arrears for most of the regions and at least from 1995 onwards
as reported by the federal statistical authority. We estimate the influence of tax arrears (as independent variable and proxy for tax collection effort) on distribution of tax revenue between
the centre and the region, controlling for alternative factors. From Hypotheses 1 and 2 we expect a positive sign of tax arrears in the regressions with fiscal decentralisation as dependent
variable in the Yeltsin’s period and a negative sign in the Putin period.
The indicator of tax arrears used in this paper is reported on a regular basis by the
Russian statistical authority (Goskomstat) and includes (1) tax obligations, which are claimed
by the tax authorities, but were not paid by the taxpayer (nedoimka), (2) restructured tax liabilities (e.g. when the payment of taxes was officially delayed), (3) tax liabilities not collected
in due time because of the bankruptcy of the taxpayer, (4) tax liabilities, currently under collection by the court executives (bailiffs) and (5) liabilities from stopped tax collection activities. This measure has certain advantages and disadvantages. It is not an indicator of the shadow economy and therefore does not measure the overall economic activity, which is “ignored” (consciously or not) by the tax authorities. It can also be influenced by events like bankruptcy of large taxpayers or “wrong” claims of tax authorities, which could be later suspended
by the court. But even in the last case it is a good proxy for the activity of tax authorities to
collect taxes they claim from a tax base they know about. Therefore, it clearly separates from
cases of lack of information, when tax authority is objectively unaware of a potential tax base.
Hence, it rather accounts for strategic tax collection than for tax auditing.
We include a variety of control variable accounting for economic differences among
the regions. By including controls we, first, capture other factors leading to asymmetries between regions in the tax split between the regional and the federal budget. Mostly, they cover
economic asymmetries or differences in tax base endowments. Their major effect is that they
influence the ability of regions to collect different types of taxes. Under equal rules for distribution of tax revenue from a region, great disproportions in the structure of tax revenue effec-
�– 14 –
tively allow regional governments to have a different share in the tax revenue of their territory. Mostly we take variables, which are the most similar to the tax bases as set in legislation.
We try to control for income tax (average income per capita), corporate property tax (value of
tangible assets), profit tax (net profits of all enterprises), sales tax (retail trade revenue) and
taxes and payments from natural resources (share of oil and gas extracted in the region to total
extraction of oil and gas in the Russian Federation).
Another group of controls represents formal factors leading to differences in tax sharing. From this point of view we include a dummy for Tatarstan and Bashkortostan. As mentioned above, these two regions were the first to enter the direct bilateral bargaining with the
federal centre in the early 1990s and to sign separate power-sharing agreements, which allowed these republics to receive all excises and rental payments for the natural resources instead of federal centre. Therefore it is reasonable to assume, that these two regions have a significantly different share of taxes attributed to their budgets.
Finally, we include control variables representing political bargaining power and preferences of the regional elite vis-à-vis the federal centre. Naturally, these factors are partly captured by the tax arrears structure. It has also been demonstrated by previous empirical studies
cited above, that political bargaining power plays a role. However, even if the only direct
channel of influencing the distribution of tax revenue for the regions others than Tatarstan and
Bashkortostan are not available, they still have an opportunity to bargain with the federal centre in order to set taxes split in a particular way, which favours particular jurisdictions given
their endowment with the tax base. Therefore bargaining over the policy regarding the whole
federation becomes an instrument of selective support of different regions. There is at least
anecdotal evidence that strategically acting governments influence the federal decisions on the
distribution of overall taxes (for the whole Russian Federation) to their advantage (see e.g.
Petkov and Shklyar, 1999). On the other hand, preferences account for a desire of regional
elites to invest more heavily in the bargaining process. From this point of view we estimate all
regressions with and without political variables, in order to check the stability of results
(however, only regressions with political variables are reported).
Political variables, generally speaking, include two main groups: differences in bargaining power and in political preferences. The following bargaining factors are considered:
1. Economic potential of the region: territory, population, average income per capita
and share of oil and gas extraction in the region (due to importance of these resources for
Russia). The variables of economic potential represent both political bargaining power and
differences in tax structure and therefore have a double role in the inference of our results.
�– 15 –
2. Formal status of the region. The formal structure of the federation was inherited
from Soviet times and, unlike the absolute majority of federations with a unified regional unit,
includes territorial units of three major types: republics, administrative units (oblast, federal
city or krai1) and autonomous okrugs. National republics are often argued to enjoy special
privileges as compared to other units of the federation (Filippov and Shvetsova, 1999); that is
why we include a dummy for republics in our regressions.
3. The ability of the region to secede (which is higher for border regions, for regions
with higher distance from the capital and for regions with lower share of ethnically Russian
Federation). We include two variables to capture this effect: a dummy for border regions and
the geographical distance between regional capitals and Moscow.
4. Over- (or under-)representation of the region in the Russian parliament. Since 1993
the Russian parliament consists of two chambers: the Council of Federation, which includes
one representative of the region’s legislature and one representative of the region’s governor
administration2, and the State Duma, which consists of 450 deputies, 225 elected by a system
of proportional representation and 225 elected in single member districts. Under significant
disproportions among Russian regions it could be expected, that the mal-apportionment
should be huge in the Council3, but also the composition of State Duma districts could be different from the structure of population (for influence of mal-apportionment on political decisions see Samuels and Snyder, 2001).
5. Power concentration within the office of the regional governor or president and conflict potential with the centre. The most common way to measure the power is to discuss the
electoral statistics (share of governor in the latest elections or years in office). The conflict
potential with the centre is often measured by the partisan status of the governor (e.g. Communist governors in the 1990s or support of pro-presidential parties Our House Russia, Unity
and Unified Russia in the elections of 1995, 1999 and 2003). Other indicators and expert opinion could be applied. They all are questionable to a certain extent: in Russia cheating and administrative manipulation of elections make their results less meaningful for analysis. The
1
Yevreiskaia autonomous oblast has similar status, although formally belongs to national units of the Federation.
2
The way of composition of the Council of Federation changed twice: the first Council in 1993 was elected by
popular vote (the Senate model), since 1995 the Council included all regional governors and all presidents of
regional legislatures, and since 2002 it includes one representative appointed by the regional governor and
one representative elected by the regional legislature. According to some estimates, inhabitants of Moscow
formed the absolute majority of the first and the third Council.
�– 16 –
Communist governors used to establish excellent contacts with the centre after their elections
and expert opinion is always subjective. Nevertheless, in this paper we reduce the variety of
possible indicators to the power index of Jarocinska (2004), partly including other indicators
discussed above.
6. Dependence upon federal transfers. The issue of transfers is interesting, as it represents a trade-off for the regions: to pay more taxes and (probably) to receive higher compensation in form of transfers or to pay little taxes and loose a claim for financial support from
the centre. In a real world setting with asymmetric information it is possible that a region uses
both strategies or switches from one strategy to another. Regions with a relatively high bargaining power can succeed in both strategies. We include the share of fiscal transfers in total
expenditures of regional governments to account for this effect. Obviously, the timing of
events should represent an important feature from this point of view: if transfers are distributed before tax collection effort is made, there should be no effect on tax collection. However,
from the empirical point of view this issue seems to be relatively intransparent. Governments
collect taxes throughout the year (partly on quarterly basis), and hence, there is no clear “timing” vis-à-vis transfer decision. Moreover, the relations between regional and federal governments could be analysed as a repeated game, where expectations should play an important
role.
The simplest way to measure the heterogeneity in political preferences is to consider
the ethnic composition of a region (share of non-Russian population), as well as other sociodemographic indicators. In this study we included the urbanisation indicator, which proved to
be significant in other empirical papers on endogenous centralisation.4 Moreover, there are
significant differences in the democratisation level in different regions of Russia, which also
account for heterogeneity of preferences (but also for peculiarities of regional political process). We use the Carnegie Endowment index of democratisation, which covers all regions in
our analysis, as well as varies over time. Some bargaining indicators (like average income per
capita) also may be considered as a proxy for heterogeneous preferences. A detailed description of all variables and the summary statistics are provided in Appendix A.
As mentioned above, economic and political asymmetry of the Russian federalism and
the transition from Yeltsin to Putin during the period of observation create a series of econo-
3
For Council of Federation representatives of subordinate jurisdictions entitled to own representation in the
parliament (like autonomous okrugs) are counted together with other representatives of this jurisdiction. This
assumption is simplified and does not reflect the multitude of conflicts between regional administrations.
4
Although this indicator may also represent a higher bargaining power of metropolitan arrears.
�– 17 –
metric problems. Therefore we use a four-stage research strategy. First, in order to get a general “impression” on the specifics of the data, we estimate individual annual cross section regressions by OLS. An advantage of the Russian Federation as a case study of the evolution of
federalism is that the high number of regions (until 2005 the Russian Federation included 88
regions) renders this approach statistically feasible. As dependent variable we use the share of
the regional government from total tax revenue of the respective year. As indicator of strategic tax collection and auditing we apply tax arrears per unit of gross regional product.5 In
order to deal with outliers, this indicator is squared. Already at this stage, as well as in case of
panel data regressions, we perform a simple outlier control as an additional robustness analysis to achieve the normal distribution of residuals in order to make correct inference in a small
sample.
Second, we address the problem of unobserved heterogeneity (both region-specific
and time-specific) and run panel-data regressions. We estimate both pooled cross-sections and
one way and two way fixed effects regressions (time and cross-section). Regional fixed effects are helpful, as they account for all possible forms of uncovered heterogeneity among regions, which seems to be very strong given extremely asymmetric spatial structure of the
Russian economy and political structure of the Russian federalism; pooled cross-sections and
one way time series fixed effects allow the direct inclusion of institutional variables (which
often do not vary over time) in our research. Pooled OLS includes a dummy for all years
when Vladimir Putin was in office, so that one can directly observe the changes through transition of power. In order to account for both hypotheses, the reported pooled data regressions
include two tax arrears indicators: under Yeltsin and under Putin. Both are equal to tax arrears
per unit of GRP for the periods of administration of respective president and zero otherwise.
Third, we address the potential endogeneity bias due to the reverse causality problem
(fiscal decentralisation is likely to influence tax collection behaviour). There are theoretical
reasons, which make reverse causality questionable. Nevertheless, we estimate TSLS panel
data regressions (once again, pooled data, one way and two way fixed effects) and lagged regressions in order to deal with this problem.
Fourth, as mentioned above, the asymmetric character of Russian federalism is likely
to cause problems of outliers. The previous steps already included outlier control based on
normality of residuals. In the fourth stage, however, we explicitly address this issue by both
5
A certain disadvantage of this proxy for tax collection effort is that we had to exclude nine regions of the
Russian Federation (the so-called “autonomous okrugs”, which are officially both members of the federation
�– 18 –
estimating OLS and FE after elimination of observations with very large values of tax arrears
and estimating least absolute deviation (median) regressions with bootstrapped standard errors, which are known to be more robust to samples with significant outliers.
Our analysis covers the period of 9 years (1995-2003), which includes practically the
whole history of the Russian federalism – from the period of “regional feudalism” in the mid
1990s to the current “vertical of power” under president Putin. The analysis covers all regions
of the Russian Federation excluding nine autonomous okrugs6 and the Chechen Republic,
where no reliable data are present. In order to form separate variables for the Yeltsin and
Putin tax arrears (as considered above) and the dummy for the Putin’s presidency we count
the year 2000 as the first year when Putin has already been in office. Indeed, Putin became
acting president on 31 December 1999. The first shift in the structure of federalism was in
May 2000, as the president appointed his representatives to the newly established “federal districts” in order to control local governors. Moreover, the year 2000 was associated with a
rapid change of informal rules of the game; combined with expectations of further centralisation by regional officials, one could expect the changes in strategic tax collection behaviour
already in 2000. On the other hand, since the rise of Putin to power was extremely quick and
completely unexpected for both population and local elites (in fact, in 1999 most influential
governors counted on the alternative candidate, former prime minister Yevgeniy Primakov),
one should not expect any changes in tax collection due to shifts in expectations in 1999, and
hence, it is reasonable to attribute this year to the “Yeltsin period”.
5. Results
5.1. Annual cross-sections
As mentioned above, we start with individual cross-section regressions for the years
1995-2003 (Table 1). The Jarque-Bera test for all regressions (with the exception of 2003) is
significant, such that the hypothesis of normal distribution of residuals must be rejected. This
requires us to test on the robustness of the regression results to outliers. The results generally
do not change after this procedure, except for some (mostly marginally significant) variables.
Robust regressions and lists of outliers are reported in Appendix B.
and parts of other larger regions), where GRP data are available only until 2000, for the aims of consistency
of annual cross-sections.
6
One autonomous okrug (Chukotka) is not part of another member of the Federation; therefore Goskomstat
provides statistical data for this region in full scale, and it could be included in our research.
�– 19 –
The results reported in Table 1 are partly consistent with our expectations: we find that
the republics of Tatarstan and Bashkortostan have a significantly lower share of taxes attributed to the centre than the rest of the members of the Federation until 2000 (when the centralisation effort of Vladimir Putin started). Other results are however less robust throughout
the history of the Russian Federation. For the early 2000s, we find a significant positive influence of the share of fiscal transfers, of urbanisation and the share of Russians in the region on
the proportion of taxes received by the region. The first result is very interesting from the perspective of an interaction between bargaining power and interests for tax revenue and transfers. Some regions seem to be able to receive both: a higher share of tax revenue and higher
fiscal transfers.
We do not find any significant impact of the tax manipulation in the Russian Federation until 2000. Since 2000 we find strongly significant evidence of influence of tax arrears on
the distribution of taxes, and the sign of the coefficient is negative. These results are robust to
the exclusion of outliers. On the basis of cross section regressions, we do thus not find evidence, that regions manipulate tax arrears in their favour. On the contrary, regional tax authorities, subordinated to the federal centre, manipulated tax arrears to the advantage of the
federation in the early 2000s. The annual cross section analysis therefore does not confirm
Hypothesis 1, though it confirms Hypothesis 2.
The set of outliers changes from year to year and allows some interesting conclusions
(Appendix B, Table B1). The number of outliers increased in the late 1990s-early 2000 and
then went down again. This indicates an unstable situation in the Russian Federation in the
“transition period” from Yeltsin to Putin, when regions partly carried out “atypical” economic
policies, which cannot be captured by our modelling. Most outliers did not fit the general pattern for the Russian Federation exactly in the years, when these regions were more active in
carrying out the “tax haven strategy” (Ingushetia in the early 1990s, Mordovia in the early
2000s), i.e. used legal possibilities provided by the presidential decrees or loopholes in the
legislation to create a more favourable tax regime for companies incorporated in this jurisdictions (partly only for specific large taxpayers associated with influential multiregional business groups or privileged companies owned by the representatives of the regional elite). Unfortunately, absence of transparent and consequent information makes an ex ante control for
this strategy in empirical research practically impossible.
�– 20 –
Table 1: Regressions for individual annual cross-sections, 1995-2003, dependent variable:
revenue attributed to regional government
Variable
1995
1996
1997
1998
1999
2000
2001
Tax structure
0.246
0.131
0.025
0.062
0.085
0.043
0.113*
Average income
per capita
(0.154)
(0.107)
(0.093)
(0.069)
(0.054)
(0.034)
(0.064)
0.346
0.117
0.211
0.193
-0.409
-0.033
0.690*
Oil & gas share
Retail trade
Net profit
Capital funds
Legal factors
Dummy Tatarstan
and Bashkortostan
Tax arrears
squared
Political variables
Territory
Population
Dummy border
region
Distance from
Moscow
Dummy republic
Overrepresentation
in Federal Council
Overrepresentation
in State Duma
Power (Jarocinska)
Fiscal transfers
Share of Russians
Democratisation
Urbanisation
Constant
share of tax
2002
2003
0.002
(0.022)
-0.490
(0.642)
-0.001
(0.001)
0.002
(0.001)
0.015
(0.177)
(0.382)
-0.002
(0.003)
0.003
(0.009)
-1.971*
(1.093)
(0.231)
0.001
(0.002)
-0.017**
(0.007)
-0.279
(0.303)
(0.308)
0.001
(0.002)
-0.010**
(0.005)
0.069
(0.448)
(0.295)
0.001
(0.002)
0.002
(0.003)
-0.597
(0.430)
(0.295)
-0.001
(0.001)
-0.001
(0.002)
-0.528
(0.320)
(0.511)
-0.002
(0.001)
0.001
(0.001)
-0.044
(0.250)
(0.536)
-0.001
(0.001)
0.001
(0.002)
-0.111
(0.179)
-0.011
(0.023)
-0.316
(0.821)
-0.001
(0.001)
0.002
(0.002)
-0.068
(0.204)
0.208***
(0.069)
-3.562
(4.68)
0.289***
(0.078)
0.073
(2.188)
0.131*
(0.073)
-0.581
(1.896)
0.287***
(0.069)
-0.850
(1.580)
0.342***
(0.076)
-1.969
(2.080)
0.203**
(0.100)
-1.993***
(0.608)
0.027
(0.113)
-1.054**
(0.443)
-0.091
(0.078)
-0.174***
(0.059)
-0.054
(0.064)
-0.258***
(0.058)
0.071***
(0.025)
0.051*
(0.029)
0.006
(0.019)
0.009
(0.005)
0.092*
(0.048)
-0.009
(0.022)
-0.012
(0.046)
-0.017
(0.013)
0.213
(0.192)
0.162
(0.154)
0.001
(0.002)
0.028
(0.998)
0.479
(0.254)
0.013
(0.028)
0.023
(0.020)
0.007
(0.021)
0.005
(0.004)
0.070
(0.053)
0.006
(0.023)
-0.012
(0.051)
-0.013
(0.014)
-0.042
(0.159)
0.168
(0.160)
0.002
(0.002)
0.441
(1.103)
0.417
(0.250)
0.031
(0.037)
-0.003
(0.027)
0.023
(0.023)
0.002
(0.007)
0.073
(0.055)
0.029
(0.023)
-0.070
(0.056)
-0.017
(0.018)
-0.119
(0.149)
0.183
(0.149)
-0.002
(0.003)
2.383
(1.679)
0.520
(0.203)
0.030
(0.033)
0.024
(0.031)
0.032
(0.022)
0.005
(0.005)
0.018
(0.053)
-0.007
(0.024)
0.011
(0.059)
0.005
(0.017)
-0.025
(0.113)
-0.001
(0.123)
-0.001
(0.003)
1.872
(2.281)
0.529
(0.18)
0.025
(0.042)
0.043*
(0.025)
0.016
(0.021)
-0.007
(0.007)
0.066
(0.053)
-0.008
(0.025)
0.018
(0.062)
-0.013
(0.017)
0.196
(0.134)
0.257*
(0.139)
-0.002
(0.003)
2.934
(2.283)
0.187
(0.214)
-0.010
(0.051)
0.005
(0.024)
0.036
(0.030)
0.001
(0.006)
0.050
(0.088)
-0.027
(0.034)
0.056
(0.080)
-0.015
(0.022)
0.165
(0.128)
0.135
(0.167)
-0.0022
(0.004)
1.970
(2.351)
0.313
(0.220)
0.016
(0.031)
0.029
(0.0244)
0.015
(0.027)
0.007
(0.007)
0.152
(0.097)
-0.004
(0.025)
-0.025
(0.060)
-0.003
(0.020)
0.2940*
(0.151)
0.286
(0.172)
-0.003
(0.004)
3.115*
(1.684)
-0.049
(0.268)
0.043
(0.027)
0.021
(0.03)
0.032
(0.029)
0.009
(0.006)
0.141
(0.094)
-0.006
(0.028)
0.001
(0.065)
0.004
(0.021)
0.255
(0.153)
0.263*
(0.132)
-0.002
(0.004)
3.435*
(1.859)
0.017
(0.286)
0.027
(0.033)
0.023
(0.035)
0.018
(0.031)
0.012*
(0.0070)
0.086
(0.066)
-0.015
(0.024)
0.017
(0.063)
0.001
(0.019)
0.342**
(0.168)
0.285**
(0.108)
-0.002
(0.003)
2.514
(1.880)
0.088
(0.280)
R2
0.540
0.439
0.364
0.434
0.504
0.405
0.433
0.434
0.522
F-test
14.9***
14.6***
17.3*** 131.1*** 121.8*** 21.9***
41.4*** 726.4*** 32.6***
No. obs.
79
79
79
79
79
79
79
79
79
Jarque-Bera
486.4*** 396.1*** 22.51*** 6.735**
8.673** 17.56*** 80.79*** 38.31***
3.419
Notes: Numbers in parenthesis are robust Huber/White standard errors; *** significant at 1% level; ** significant at 5% level; * significant at 10% level. Significant results are marked bold.
�– 21 –
5.2. Panel data
The results of the panel data analysis (Table 2) corroborate the results of annual crosssections. The pooled cross-sections (both with and without year dummies) indicate a highly
significant negative sign of tax arrears under Putin, which holds after the exclusion of outliers
with large residuals (which is also necessary due to the results of the Jarque-Bera test) as Table B2 in Appendix B demonstrates. Tax arrears for the Yeltsin period have the positive sign
predicted by Hypothesis 1, but are, however, insignificant. Generally speaking, controlling for
outliers with large residuals does not change these results; moreover, tax arrears for the Yeltsin period hold their sign after the exclusion of outliers and even become significant. In both
one-way regional fixed effects and two-way fixed effects regressions both tax arrears variables have the sign predicted by our analysis, but are partly insignificant; after exclusion of
outliers tax arrears for Yeltsin also become significant.
Further results partly follow the predicted pattern: higher bargaining potential and/or
higher heterogeneity as compared to the Russian average lead to higher decentralisation. As
expected, dummy Tatarstan and Bashkortostan has a positive sign and is significant in all
specifications. The dummy republic is significant and has a positive sign in the majority of
regressions, representing a higher bargaining power of republics and/or path dependence effects. Dummy border region is also almost always significant and positive, indicating higher
bargaining power of potential secessionist territories (or relative underdevelopment of the region requiring special treatment). Territory is highly significant and positive, supporting the
idea, that territory was used as a bargaining argument in Russia. Urbanisation is significant
and positive, but its effect does not always hold after exclusion of outliers (probably because
of the exclusion of Altai Republic, which has been identified as outlier in the majority of regressions and has an extraordinarily low urbanisation ratio).
However, we do not find any significant influence of the index of power on tax distribution (the result is sensitive to the specification of the model because of multicollinearity
problems, inevitable for an artificially constructed index). It is possible to interpret this result
as indicating a very low transparency of tax relations between the Russian regions and the
federation. A surprising result is, that regions with a higher share of Russian population were
associated with a higher share of taxes remaining in the region (as already noted, this effect
was probably achieved through the significance and the sign of the coefficient in the early
2000s). To a certain extent it contradicts the common wisdom that the national republics were
more secessionist and interested in decentralisation than Russian regions. Indeed, the dummy
�– 22 –
republic already captured potential secessionist tensions. However, the result is still unexpected.
There are several explanations for this. First, regions may be more interested in federal
transfers than in taxes. It is true for both more powerful regions (which gain from redistribution on the federal level) and heterogeneous poor regions with large populations. Indeed, the
model estimates a significant positive effect of fiscal transfers on tax distribution in favour of
regions, but it does not hold after exclusion of outliers, so, the correct inference of the t-values
is impossible. Second, the treatment of the city of Moscow with a relatively low share of tax
revenue attributed to its government and excellent indicators may influence the regressions.
However, Moscow is not an outlier (from the point of view of residuals), and so should not
influence the robustness of regressions. Third, it is possible, that higher power and higher heterogeneity cause an opposite effect: the federal government is even more likely to put pressure on these regions. For example, a possible interpretation of the results is that the centralisation pressure from the centre in the early 2000s was higher for national, than for Russian
regions (as the latter were perceived as a larger threat for the unity of Russia). The federal
centre seems to be more active in suppressing wealthy regions than poor territories still depending on tax transfers. This policy could include both specific measures for individual territories, but also a general design of the tax system. The dummy for the Putin’s office period is
highly significant and negative for all models: it shows once again the centralisation trend in
Russian federalism under the current president. The tax structure variables were mostly insignificant, thus supporting the extremely high importance of political factors for tax assignment,
which seems to be present in the 2000s.
In order to check the robustness of the results we exclude all political variables (given
their relatively “vague” nature, causing the threat of measurement errors) and control the restricted regressions for the normality of residuals. Generally, this analysis does not change our
results. The dummy for Tatarstan and Bashkortostan has a positive and significant coefficient
in all regressions until 2000, and tax arrears have a negative significant and robust coefficient
from 2000. In 2003 this dummy becomes even significantly negative, probably supporting our
logic of “oppressing” of potentially separatist regions (already discussed in the previous section). The results of panel data regressions also did not change. Coefficients for both tax arrears variables also remain significant in basic regression and hold their sign after controlling
for outliers. In the one way regional fixed effect regression the coefficients for tax arrears are
(as previously) insignificant, but still hold the (predicted) sign. In the two way FE specification tax arrears under Putin even become significant.
�– 23 –
Table 2: Panel data regressions (OLS), 1995-2003, dependent variable: share of tax revenue attributed to
regions
Tax structure
Average income per
capita
Oil & gas share
Retail trade
Net profit
Capital funds
Legal factors
Dummy Tatarstan and
Bashkortostan
Political variables
Territory
Population
Dummy border region
Distance from Moscow
Dummy republic
Overrepresentation in
Federal Council
Overrepresentation in
State Duma
Power (Jarocinska)
Fiscal transfers
Share of Russians
Democratisation
Urbanisation
Dummy Putin
Arrears (Yeltsin)
Arrears (Putin)
Constant
Region fixed effects
Time fixed effects
R2
F-test
No. obs.
Jarque-Bera
(1)
OLS
(2)
OLS
(3)
OLS
(4)
OLS
-0.007
(0.011)
0.033
(0.037)
-0.000
(0.000)
0.001**
(0.000)
-0.085***
(0.024)
0.010*
(0.006)
4.605
(4.581)
0.000
(0.000)
-0.000
(0.000)
-0.071***
(0.023)
0.002
(0.008)
0.001
(0.045)
-0.000
(0.000)
0.000
(0.000)
-0.061**
(0.027)
0.003
(0.009)
6.416
(4.901)
0.000
(0.000)
0.000
(0.000)
-0.093***
(0.022)
0.158***
(0.044)
-
0.159***
(0.043)
-
0.047***
(0.011)
-0.007
(0.006)
0.027***
(0.010)
0.008***
(0.002)
0.077**
(0.031)
-0.006
(0.009)
0.005
(0.022)
-0.012
(0.007)
0.112*
(0.061)
0.177**
(0.070)
-0.001
(0.001)
2.456***
(0.78)
0.260
(1.178)
-0.252***
(0.040)
0.101***
(0.035)
-0.051***
(0.019)
0.046
(0.043)
0.085
(0.050)
-0.001
(0.002)
2.147
(5.858)
-0.098***
(0.013)
0.355
(0.666)
-0.060
(0.042)
0.256
(0.414)
Yes
No
0.043***
(0.012)
-0.009
(0.006)
0.027**
(0.011)
0.008***
(0.002)
0.076**
(0.031)
-0.007
(0.009)
0.005
(0.023)
-0.012
(0.008)
0.120**
(0.057)
0.177**
(0.070)
-0.001
(0.001)
2.248***
(0.768)
-0.090***
(0.018)
0.438
(1.043)
-0.237***
(0.033)
0.390
(0.108)
No
No
0.067**
(0.030)
-0.046**
(0.018)
0.036
(0.042)
0.101**
(0.049)
-0.000
(0.002)
-0.427
(5.832)
0.064
(0.699)
-0.066
(0.042)
1.281
(0.673)
Yes
Yes
0.002
39.98***
711
315***
0.378
25.42***
711
261.9***
0.001
177.07***
711
507.03***
0.371
(0.108)
No
Yes
0.442
27.16***
711
340.7***
Notes: Numbers in parenthesis are robust Newey/West standard errors for first-order autocorrelation; *** significant at 1% level; ** significant at 5% level; * significant at 10% level. Coefficients for time and region fixed
effects are not reported. For FE (region) estimator overall R2 is reported.
�– 24 –
5.3. Endogeneity problem and instrumental variables estimation
The next problem potentially causing biased estimates in our research is endogeneity.
It is not clear, whether the bargaining and economic power of the region depend upon the tax
distribution or (as it is assumed by the empirical model) vice versa. Theoretically, there are
some reasons to believe that this problem is less relevant for Russia. First, economic policies
of Russian regions have been mostly inefficient, and their economic success is mostly limited
to agglomeration effects or natural resources. Ahrend (2005) finds significant effects of fiscal
policy on economic performance, which, however, vanishes in the TSLS regressions. There is
some evidence from principal component analysis that fiscal policy can be important for regional economic development reported by Mau and Yanovsky (2002). Second, since our paper deals with asymmetric distribution of tax revenue and not with differences in overall tax
revenue, even effective tax policy does not necessarily lead to biased results. There is no consistent point of view in the theory on whether the federal centre or the regions carry out more
efficient economic policies; and in Russia with its huge variety of individual models both
variants could theoretically be present. Therefore it is difficult to establish a clear backward
causal link between tax distribution and economic asymmetry. Nevertheless, Desai et al.
(2005) show, that there is a positive relation between some specific indicators of economic
performance of the regions and the retention of taxes.
In order to control for potential endogeneity we use two procedures. First, we estimate
all regressions with all lagged variables (where distribution of tax revenue in year t is explained by all variables of the year t-1). These estimations are also helpful, since the tax collection of the current year is partly calculated on the basis of revenues of the past year, which
can be captured by our additional analysis. The results for tax arrears are robust for all cross
section regressions, with the exception of that for 2000 when tax arrears become insignificant.
Moreover, the results of panel data regressions hold for all political and legal variables, but
the impact of tax arrears changes. In the second specification both tax arrears are negative, but
only the Yeltsin tax arrears are significant and stable. In the third specification both tax arrears variables have a negative sign, but only the tax arrears under Putin are significant and
robust. There are no changes in other specifications.
�– 25 –
Table 3: Panel data regressions (TSLS), 1995-2003, dependent variable: share of tax revenue attributed to
regions
(5)
(6)
(7)
(8)
(9)
(10)
(11)
(12)
TSLS
TSLS
TSLS
TSLS
TSLS
TSLS
TSLS
TSLS
Tax structure
0.007
-0.007
-0.001
0.011
0.018
0.019**
0.015**
0.014**
Average income
per capita
(0.008)
(0.007)
(0.014)
(0.018)
(0.01)
(0.009)
(0.006)
(0.006)
0.037
0.018
2.087
0.679
0.031
0.049
2.957
1.083
Oil & gas share
Retail trade
Net profit
Capital funds
Legal factors
Dummy Tatarstan
and Bashkortostan
Political variables
Territory
Population
Dummy border
region
Distance from
Moscow
Dummy republic
Overrepresentation
in Federal Council
Overrepresentation
in State Duma
Power (Jarocinska)
Fiscal transfers
Share of Russians
Democratisation
Urbanisation
Dummy Putin
Arrears (Yeltsin)
Arrears (Putin)
Constant
(0.046)
-0.056*
(0.031)
(0.053)
-0.106***
(0.027)
(4.247)
-0.066***
(0.015)
(5.245)
-0.089**
(0.037)
(0.046)
-0.104***
(0.038)
(0.044)
-0.124***
(0.032)
(5.190)
-0.086***
(0.023)
(4.537)
-0.092***
(0.035)
0.238***
(0.059)
0.127***
(0.047)
-
-
0.077
(0.067)
0.133***
(0.042)
-
-
0.053***
(0.014)
-0.015**
(0.006)
0.036***
(0.011)
0.006**
(0.002)
0.074***
(0.025)
-0.020*
(0.010)
0.032
(0.028)
0.261***
(0.073)
0.235***
(0.056)
3.618***
(1.204)
-5.946
(6.909)
1.200
(1.279)
0.007
(0.139)
0.035***
(0.012)
-0.014**
(0.006)
0.031**
(0.012)
0.007***
(0.003)
0.079***
(0.025)
-0.021
(0.015)
0.029
(0.040)
0.166***
(0.048)
0.202***
(0.056)
0.535
(1.073)
12.376*
(6.509)
-8.239
(5.071)
0.331
(0.089)
0.133***
(0.035)
-0.039**
(0.019)
0.064
(0.043)
-0.010
(0.063)
7.083
(12.788)
5.471*
(3.316)
-0.265
(0.383)
-0.019
(0.848)
0.103
(0.073)
-0.042*
(0.021)
0.070
(0.051)
-0.004
(0.055)
8.954
(10.984)
4.635
(4.342)
-4.714
(10.983)
-0.100
(0.651)
0.019
(0.030)
-0.009
(0.007)
0.019
(0.024)
0.009***
(0.003)
0.072***
(0.026)
-0.003
(0.011)
-0.012
(0.027)
-0.021
(0.131)
0.117
(0.094)
-0.628
(2.694)
9.988**
(4.823)
-2.284
(2.402)
0.516
(0.271)
0.032***
(0.013)
-0.014*
(0.007)
0.029**
(0.012)
0.008***
(0.003)
0.079***
(0.025)
-0.024
(0.018)
0.042
(0.044)
0.134***
(0.056)
0.191***
(0.056)
0.777
(1.110)
9.706**
(4.318)
-10.594**
(5.281)
0.312
(0.083)
0.047
(0.040)
-0.035
(0.024)
0.018
(0.043)
0.133**
(0.061)
-2.544
(8.737)
6.873
(5.603)
0.050
(0.242)
0.722
(0.577)
0.049
(0.040)
-0.036
(0.03)
0.032
(0.065)
0.099*
(0.052)
4.247
(10.46)
6.578
(7.500)
-2.202
(8.858)
0.283
(0.693)
Region fixed effects
No
No
Yes
Yes
No
No
Yes
Yes
Time fixed effects
Yes
Yes
No
No
No
No
Yes
Yes
Kalmykia incl.
Yes
No
Yes
No
Yes
No
Yes
No
R2
0.083
0.194
0.002
0.005
0.132
0.139
0.000
0.002
F-test
16.00***
21.76***
18.66***
18.80***
16.95***
19.64***
23.91***
22.51***
No. obs.
711
702
711
702
711
702
711
702
Hansen J
2.490
2.207
0.008
0.059
8.338**
4.576
0.009
0.083
Notes: Numbers in parenthesis are robust Huber/White standard errors; *** significant at 1% level; ** significant at 5% level; * significant at 10% level. For FE (region) estimator overall R2 is reported. Instruments are
retail trade, net profits, democratisation and power.
�– 26 –
The second approach is based on the instrumental variables estimator. We use retail
sales, net profits, democratisation and power as instruments for both tax arrears under Putin
and under Yeltsin. Unfortunately the quality of instruments is much better for the last ones,
than for the first ones. We estimate instrumental variables regressions using TSLS without
time or cross section fixed effects, as well as with one way and two way fixed effects (Table
3). In the first case, as well as in the one way regional FE specification both tax arrears variables still hold their sign predicted by the hypotheses (though in the first specification Hansen
J test is significant, indicating a potential over-identification problem). However, unlike the
previous results, we obtain significant estimates for the Yeltsin period and insignificant results for the Putin period. Hence, there are reasons to believe, that the latter could be driven
by the endogeneity problem. The instrumental variables approach supports our first hypothesis, while giving no evidence for the second one. In the two way fixed effects and the one way
time FE both indicators of tax arrears are insignificant.
5.4. Outliers and median regressions
High heterogeneity and political asymmetry suggest, that outliers can have a significant impact on the regression results. In particular, this outcome seems to be plausible for the
Putin period, since the standard deviation of both fiscal decentralisation indicator (Figure 3
above) and tax arrears (Figure 4) increased significantly. The latter trend can be attributed to
increases of tax arrears in a small group of regions, especially in Kalmykia, where tax arrears
exceeded the size of its GRP or were nearly equal to it. Kalmykia did not show up as outlier
in the previous analysis based on large error terms; however, extreme size of the variable for
this observation can still influence the outcomes of the analysis.
Generally speaking, the situation in Kalmykia confirms the explanation presented
above. During the 1990s this region functioned as a kind of “internal tax haven”: extremely
loyal policies of the local tax authorities combined with the reduction of a region’s share in
tax rates and privileged treatment of companies with the majority of operations outside the
region made it attractive for a huge variety of firms, including several large oil giants, which
used Kalmykia for their transfer pricing design. On the other hand, the region had one of the
strongest authoritarian regimes in post-Soviet Russia, even compatible to that of post-Soviet
Central Asian republics (see e.g. Gel’man, 1999). The government of the Republic dominated
its economic structure. Kalmykia used to be not only one of the strongest, but also one of the
most eccentric regimes, often directly opposing the federal government or declaring its region
an “independent state” within the Russian Federation. That is why after Putin’s rise to power
�– 27 –
Kalmykian president Iliumdzinov had to have more fears than his counterparts in other Russian regions. Kalmykia was also partly subject to business-government struggles of the mid2000s, associated with tax auditing of the largest Russian oil companies like Yukos or Sibneft, previously using the Kalmykian offshore. The problem of outliers requires careful
econometric modelling.
16%
14%
12%
10%
8%
6%
4%
2%
0%
1995
1996
1997
1998
Mean
1999
2000
Median
2001
2002
2003
Std. Dev.
Figure 4: Statistics for tax arrears per unit of GRP
Source: Goskomstat
As mentioned above, we use outlier-robust median regressions to check our results.
We estimate all four specifications with the median regression (moreover, pooled crosssections are estimated with and without Putin dummy); in order to account for heteroscedasticity and non-normality of residuals bootstrapped standard errors are used. The results are
reported in Table 4. Generally, median regressions also confirm Hypothesis 1. The Putin tax
arrears have the correct sign, but are insignificant.
�– 28 –
Table 4: Median regressions, 1995-2003, dependent variable: share of tax revenue attributed to regions
Tax structure
Average income per
capita
Oil & gas share
Retail trade
Net profit
Capital funds
Legal factors
Dummy Tatarstan and
Bashkortostan
Political variables
Territory
Population
Dummy border region
Distance from Moscow
Dummy republic
Overrepresentation in
Federal Council
Overrepresentation in
State Duma
Power (Jarocinska)
Fiscal transfers
Share of Russians
Democratisation
Urbanisation
Arrears (Yeltsin)
Arrears (Putin)
Dummy Putin
Constant
Region fixed effects
Time fixed effects
Pseudo R2
No. obs.
(13)
Median
(14)
Median
(15)
Median
(16)
Median
(17)
Median
-0.012
(0.012)
0.038
(0.042)
0.000
(0.000)
0.000
(0.000)
-0.060*
(0.034)
-0.019***
(0.007)
-4.186
(6.889)
0.000
(0.000)
-0.000
(0.000)
-0.022
(0.035)
-0.028***
(0.006)
0.013
(0.060)
0.000
(0.000)
0.000
(0.000)
-0.017
(0.031)
-0.002
(0.009)
0.003
(0.081)
0.000
(0.000)
0.000
(0.000)
-0.038
(0.046)
-0.002
(0.009)
-4.182
(6.634)
0.000
(0.000)
0.000
(0.000)
-0.065**
(0.031)
0.164***
(0.040)
-
0.134***
(0.034)
0.143***
(0.034)
-
0.029**
(0.016)
-0.007
(0.006)
0.0206***
(0.008)
0.008***
(0.002)
0.067
(0.022)
0.001
(0.009)
-0.004
(0.022)
-0.004
(0.007)
0.077*
(0.040)
0.167***
(0.042)
-0.001
(0.001)
0.625
(0.495)
1.310
(0.822)
-0.233
(0.554)
0.495
(0.074)
No
Yes
0.313
711
0.059
(0.050)
0.028
(0.037)
-0.092
(0.063)
0.003
(0.055)
-0.006***
(0.002)
-1.259
(7.829)
2.984***
(0.735)
-0.030
(0.720)
0.777
(0.528)
Yes
No
0.438
711
0.031
(0.013)
-0.011**
(0.005)
0.019**
(0.008)
0.008***
(0.002)
0.052**
(0.025)
0.011
(0.008)
-0.024
(0.012)
-0.008
(0.007)
-0.000
(0.041)
0.103*
(0.055)
-0.001
(0.001)
0.917*
(0.501)
2.089***
(0.482)
-0.341
(0.817)
0.566
(0.086)
No
No
0.232
711
0.033***
(0.012)
-0.005
(0.006)
0.024***
(0.009)
0.006***
(0.002)
0.056***
(0.022)
0.007
(0.009)
-0.020
(0.020)
-0.008
(0.007)
0.049
(0.041)
0.125***
(0.046)
-0.001
(0.001)
0.541
(0.459)
1.392**
(0.544)
-0.242
(0.584)
-0.075***
(0.016)
0.547
(0.077)
No
No
0.258
711
-0.005
(0.037)
-0.009
(0.029)
-0.057
(0.058)
0.054
(0.042)
-0.002
(0.002)
0.551
(5.765)
1.471**
(0.675)
-0.016
(0.280)
0.664
(0.404)
Yes
Yes
0.556
711
Notes: Bootstrapped standard errors in parenthesis (bootstrapts n = 1000). *** significant at 1% level; ** significant at 5% level; * significant at 10% level.
�– 29 –
Moreover, we estimate all specifications after exclusion of Kalmykia in order to see,
whether the outliers drive our results (see also Appendix C). Table 5 summarizes the estimations after exclusion of Kalmykia. Most estimation methods (OLS, TSLS and median) and
most specifications yield significant and positive sign of the tax arrears under Yeltsin, as predicted by our hypothesis. This result is relatively robust even if it is not significant. The results of Putin tax arrears are (as expected) much less robust: nevertheless, in TSLS and most
median regressions we obtain the predicted sign, although only in one case also significant
results.
Table 5: Sign and significance of the coefficient tax arrears on exclusion of Kalmykia
Model
Basic
specification (see
Appendix
C) A
Restricted
regressions
(without
political
variables)A
Lagged
variables A
2000
+
Annual cross-sections
2001
2002
2003
-***
+**
-
+
-
+***
-
-
-**
-
(1)
+***
(Yeltsin),
+**
(Putin)
Panel data
(2)
(3)
+***
+***
(Yeltsin),
(Yeltsin),
+***
(Putin)
(Putin)
(4)
+***
(Yeltsin),
+***
(Putin)
+**
(Yeltsin),
(Putin)
+***
(Yeltsin),
+***
(Putin)
+
(Yeltsin),
(Putin)
+***
(Yeltsin),
(Putin)
+***
-***
+
(Yeltsin),
(Yeltsin),
(Yeltsin),
(Yeltsin),
-**
-***
-***
(Putin)
(Putin)
(Putin)
(Putin)
(13)
(14)
(15)
(17)
Median
+**
+**
+***
+**
regres(Yeltsin),
(Yeltsin),
(Yeltsin),
(Yeltsin),
sions
+
+
(Putin)
(Putin)
(Putin)
(Putin)
(6)
(8)
(10)
(12)
TSLS (see
+*
+
+**
+
Table 3)
(Yeltsin),
(Yeltsin),
(Yeltsin),
(Yeltsin),
-**
(Putin)
(Putin)
(Putin)
(Putin)
Note: A Kalmykia and other outliers necessary to obtain non-significant Jarque-Bera test are excluded. For the
basic specifications outliers are reported in Appendix B.
6. Conclusion
The aim of this paper is to test, whether the strategic manipulations of tax arrears
could be used in a principal-agent setting with a central government, that does not have sufficient information and monitoring capacities of the regional influence on tax collection, and
regions, which are able to focus their tax auditing and collection effort on taxes mostly benefiting their budgets. Moreover, we have tested, whether federations in semi-authoritarian re-
�– 30 –
gimes have an incentive to manipulate tax collection in their favour. In order to conduct these
tests, we analyse the case of the Russian Federation.
Generally speaking, our results partly confirm the intuition behind this paper: there is
evidence that tax arrears are used strategically to manipulate distribution of taxes between the
federation and the regions. Our four-stage estimation strategy, however, yields heterogeneous
results. The annual cross-sections and panel data specifications mostly provide evidence in
favour of the second hypothesis: the federal government was likely to use its power for tax
arrears manipulation when it became strong, but regional authorities did not use this instrument at the point of their strength. The results change, however, if we control for endogeneity
through TSLS: these specifications mostly yield evidence in favour of the first hypothesis,
suggesting use of strategic tax collection by regions under Yeltsin in order to achieve de-facto
decentralisation.
Given high political and economic asymmetry of the Russian federalism, we also estimate the regressions after exclusion of outliers and by using median regressions. We indeed
find evidence, that our results obtained at previous stages of analysis were partly driven by a
small number of regions with extraordinary high levels of per capita tax arrears. Nevertheless,
most specifications and estimation methods yield evidence in favour of the first hypothesis.
TSLS and median regressions also mostly provide hypothesis-consistent sign of the tax arrears under Putin; however, the results are by far less robust and often insignificant.
References
Acemoglu, Daron, and James A. Robinson (2006): Economic Origins of Dictatorship and
Democracy. Cambridge University Press
Ahrend, Rudiger (2005): Speed of Reform, Initial Conditions or Political Orientation? Explaining Russian Regions Economic Performance. Post-Communist Economies 17:289317
Baretti, Christian, Bernd Huber and Karl Lichtblau (2002): A Tax on Tax Revenue: The Incentive Effects of Equalizing Transfers: Evidence from Germany. International Tax and
Public Finance 9: 631 – 649.
Cai, Hongbin, and Daniel Treisman (2004): State Corroding Federalism. Journal of Public
Economics 88:819-843
Chang, Duckjoon (2005): Federalism at Bay: Putin’s Political Reforms and Federal-Regional
Relations in Russia. Paper presented at SES-COE Seminar Russian Studies Dialogue: A
Korea-Japan Perspective, May 16
�– 31 –
Cremer, Helmuth, and Firouz Gahvari (2000): Tax Evasion, Fiscal Competition and Economic Integration. European Economic Review 44:1633-1657
Desai, Raj M., Freinkman, Lev, and Itzhak Goldberg (2005): Fiscal Federalism in Rentier Regions: Evidence from Russia. Journal of Comparative Economics 33: 814-834
Enikopolov, Ruben, Zhuravskaya, Ekaterina, and Sergei Guriev (2002): Rossiiskiy Federalism: Scenarii Razvitiya. Mimeo
Filippov, Mikhail, and Olga Shvetsova (1999): Asymmetric Bilateral Bargaining in the New
Russian Federation: A Path-Dependence Explanation. Communist and Post-Communist
Studies 32:61-76
Filippov, Mikhail, Ordeshook, Peter C., and Olga Shvetsova (2004): Designing Federalism: A
Theory of Self-Sustainable Federal Institutions, Cambridge, Cambridge University Press
Freinkman, Lev, Treisman, Daniel, and Stepan Titov (1999): Subnational Budgeting in Russia. World Bank Technical Paper No.452
Furman, Dmitrii (2007): Obshee i Osobennoe v Politicheskom Razvitii Postsovetskikh Gosudarstv, in: Ryabov, Andrei, and Maria Lipman (eds.): Puti Rossiiskogo Postkommunisma.
Moscow: Carnegie Centre and R.Elinin Publishing House.
Gaddy, Clifford, and Barry Ickes (2002): Russia’s Virtual Economy, Washington D.C.,
Brookings Institution Press
Gel’man, Vladimir (1999): Regime Transition, Uncertainty and Prospects for Democratisation: The Politics pf Russia’s Regions in a Comparative Perspective. Europe-Asia Studies
51:939-956
Genkin, Artem (2000): Denezhnye Surrogaty v Rossiiskoi Ekonomike. Moscow, Alpina
Hyde, Matthew (2001): Putin’s Federal Reforms and their Implications for Presidential Power
in Russia. Europe-Asia Studies 53:719-743
Ivanova, Anna, Keen, Michael, and Alexander Klemm (2005): The Russian Flat Tax Reform.
Economic Policy 20:397-444
Jarocinska, Elena (2004): Determinants of Intergovernmental Transfers in Russia: Political
Factors versus Objective Criteria. Mimeo
Jones Luong, Pauline, and Erika Weinthal (2004): Contra Coercion: Russian Tax Reform,
Exogenous Shocks, and Negotiated Institutional Change. American Political Science Review 98: 139-152
Lavrov, Alexei (2005): Budzhetnaya Reforma v Rossii: Ot Upravlenia Zatratami k Upravleniu Resultatami. Moscow
�– 32 –
Levitsky, Steven, and Lucan A. Way (2002): The Rise of Competitive Authoritarianism’,
Journal of Democracy 13:51-65
Mau, Vladimir, and Konstantin Yanovsky (2002): Political and Legal Factors of Economic
Growth in Russian Regions. Post-Communist Economies 14:321-339
Mironov, Maxim (2006): Economics of Spacemen: Estimation of Tax Evasion in Russia.
Mimeo
Olcott, Martha Brill, and Marina Ottaway (1999): Challenge of Semi-Authoritarianism. Carnegie Paper No. 7
Petkov, Radoslav K., and Natan M. Shklyar (1999): Russian Regions after the Crisis: Coping
with Economic Troubles Governors Reap Political Revards. Demokratizatsiya 7:527-543
Plekhanov, Alexander (2006): Can Federalism Be Both State Corroding and Market Preserving? Empirical Evidence from Russia. Mimeo
Polterovich Victor (2001): Institutional Traps, in Klein L.R., Pomer M. (eds.): The New Russia: Economic Transition Reconsidered, Stanford, Stanford University Press
Ponomareva, Maria, and Ekaterina Zhuravskaya (2004): Federal Tax Arrears in Russia: Liquidity Problems, Federal Redistribution or Regional Resistance. Economics of Transition 12:373-398
Ross, Cameron (2003): Putin’s Federal Reforms and the Consolidation of Federalism in Russia: One Step Forward, Two Steps Back! Communist and Post-Communist Studies 36:2947
Samuels, David, and Richard Snyder (2001): The Value of a Vote: Malapportionment in
Comparative Perspective. British Journal of Political Science 31:651-671
Schneider, Friedrich (2005): Shadow Economies in 145 Countries all over the World: Estimation Results over the Period 1999 to 2003. Mimeo
Slinko, Irina, Yakovlev, Evgeny, and Ekaterina Zhuravskaya (2005): Laws for Sale: Evidence
from Russia. American Law and Economics Review 7:284-318
Sonin, Konstantin (2005): Provincial Protectionism. Mimeo
Stöwhase, Sven, and Christian Traxler (2005): Tax Evasion and Auditing in a Federal Economy. International Tax and Public Finance 12:515-531
Treisman, Daniel S. (1999): Decentralization, Tax Evasion, and the Underground Economy:
A Model with Evidence from Russia. Economics and Politics 11:145-169
Treisman, Daniel S. (2003): Fiscal Pathologies and Federal Politics: Understanding Tax Arrears in Russia’s Regions, in: McLaren, J. (ed.), Institutional Elements of Tax Design and
Reform, Washington D.C., World Bank
�– 33 –
Varese, Federico (1997): The Transition to the Market and Corruption in Post-Socialist Russia. Political Studies 45:579-596
Voronov, Vladimir (2005): Mentologiya Dvadtsat’ Pervogo Veka. Novoe Vremya, August 7
Wintrobe, Ronald (1990): The Tinpot and the Totalitarian: An Economic Theory of Dictatorship. American Political Science Review 84:849-872
Wintrobe, Ronald (2001): Tax Evasion and Trust. Mimeo
Yakovlev, Andrei (1999): Black Cash Tax Evasion in Russia: Its Forms, Incentives and Consequences at Firm Level. BOFIT Discussion Paper No. 3
Yakovlev, Andrei (2005): Evolutsyiya Strategiy Vzaimodeystviya Biznesa i Vlasti v Rossiyskoy Ekonomike. Rossiyskiy Zhurnal Menerzhmenta 3: 27-52
Yakovlev, Andrei (2006): Agenty Modernisatsii. Moscow: HSE Press
�– 34 –
Appendix A: Data
Table A1: Descriptive statistics
Variable
Average income per capita
Capital funds
Democratisation
Distance from Moscow
Dummy border region
Dummy Putin
Dummy republic
Dummy Tatarstan and Bashkortostan
Fiscal transfers
Net profit
Oil and gas share
Overrepresentation in the Federal Council
Overrepresentation in the State Duma
Population
Power
Retail trade
Share of Russians
Share of the region in the total taxes collected on
its territory
Tax arrears squared
Tax arrears squared (Putin)
Tax arrears squared (Yeltsin)
Territory
Urbanisation
Obs.
711
711
711
711
711
711
711
711
711
711
711
711
711
711
711
711
711
Mean Std. Dev.
1.80
1.79
0.22
0.32
28.44 6.25
2.37
2.73
0.43
0.50
0.44
0.50
0.25
0.44
0.03
0.16
0.25
0.19
8.25 39.04
0.01
0.09
2.05
2.94
1.21
1.05
1.83
1.52
6.99
0.70
26.17 78.64
0.77
0.24
711
711
711
711
711
711
0.60
0.01
0.01
0.00
0.22
0.07
0.13
0.08
0.08
0.01
0.47
0.01
Min
0.12
0.00
14.00
0.00
0.00
0.00
0.00
0.00
0.00
-78.59
0.00
0.16
0.49
0.05
5.70
0.10
0.01
Max
16.83
3.78
45.00
11.88
1.00
1.00
1.00
1.00
0.98
705.80
0.79
31.15
12.32
10.39
8.50
1178.97
0.97
0.07
0.00
0.00
0.00
0.00
0.02
1.00
1.74
1.74
0.06
3.10
0.10
�– 35 –
Table A2: Description of variables
Name
Average income
per capita
Capital funds
Democratisation
Distance from
Moscow
Dummy border
region
Dummy Putin
Dummy republic
Dummy Tatarstan
and Bashkortostan
Net profit
Oil & gas share
Overrepresentation
in the Federal
Council
Overrepresentation
in the State Duma
Population
Power
Retail trade
Share of fiscal
transfers
Description
Average income per capita of the region,
thousands of RUR7
Value of tangible assets of all enterprises, bln.
RUR
Index of democratisation of the region, estimated by the experts of the Carnegie Centre
in Moscow. The higher value of index represents a higher democratisation level
Distance between the capital of the region and
Moscow, thousands of km, 0 for Moscow and
Moscow oblast, identical for St. Petersburg
and St. Petersburg oblast
1 if the region has a border to any state outside the Russian Federation, 0 otherwise
1 if Putin was president or acting president, 0
otherwise
1 if the region has the status of a republic, 0
otherwise
1 for Tatarstan or Bashkortostan, 0 otherwise
Net profit (profit – loss) of all region’s organisations, bln. RUR
(Share of oil extraction in the region in the
total oil extraction in Russia + Share of the
gas extraction in the region to the total gas
extraction in Russia) / 2
Share of seats of the region in the Federal
Council (including seats of subordinate
autonomous okrugs) / Share of region in Russian population
Share of seats of the region in the State Duma
(calculated on 225 deputies basis) / Share of
region in Russian population
Population of the region, mln. people
Index of power of regional governors, based
on data like years in office, share on regional
elections, control of parliament etc. The
higher value of index represents a higher influence of regional governor.
Total retail trade revenue (current prices), bln.
RUR
Fiscal transfers from other governments / Total expenditures of the region’s consolidated
budget
Period
1995-2003
Source
Goskomstat8
1995-2003
Goskomstat
1995-2003
Carnegie Centre and Independent Institute for
Social Policy
1995-2003
Goskomstat
1995-2003
Own estimation
1995-2003
Own estimation
1995-2003
Own estimation
1995-2003
Own estimation
1995-2003
Goskomstat
1995-2003
Goskomstat
1995-2003
Goskomstat, own estimation
1995-2003
Goskomstat, State Duma,
own estimation
1995-2003
1995-2000
(applied for
all years)
Goskomstat
Jarocinska, 2004
1995-2003
Goskomstat
1995-2003
Until 1997: Freinkman,
Treisman and Titov, 1999
Since 1998: Ministry of
Finance9
7
In 1998 the Russian rubl was denominated; therefore all indicators for previous years were divided by 1000.
8
All Goskomstat (Russian statistical authority) data are published in the Regions of Russia database.
9
The budget data are provided by the Institute of Public Finance, Centre for Fiscal Policy (Moscow)
(www.fpcenter.ru) databank and by the databank Russian Budget supported by the Moscow State University
(www.budgetrf.ru).
�– 36 –
Name
Share of region in
the total taxes collected on its territory
Description
Tax revenue of the consolidated regional
budget executed / Total tax collection on the
territory of the region
Period
1995-2003
Share of Russians
Share of ethnic Russians in the region’s population
Tax arrears
squared
Territory
(Total tax arrears / GRP)^2
2002
(applied for
all years)
1995-2003
Urbanisation
Territory of the region, mln. sq.km, 0 for
Moscow and St. Petersburg
Share of urban population
Source
Until 1997: Freinkman,
Treisman and Titov, 1999
Since 1998: Ministry of
Finance (for budget data),
State Tax Service and
Goskomstat (for tax collection data)
Russia’s Census, 2002
1995-2003
State Tax Service and
Goskomstat
Goskomstat
1995-2003
Goskomstat
�– 37 –
Table A3: Correlation matrix
1
Share of the region in the total taxes collected on its territory
1
2
3
4
5
6
7
8
9
10
11
12
13
14
15
16
17
18
19
20
21
22
23
1.00
Average income per capita
2
-0.25 1.00
Oil and gas share
3
-0.05 0.18 1.00
Retail trade
4
-0.21 0.63 0.05 1.00
Net profit
5
-0.17 0.59 0.30 0.87 1.00
Capital funds
6
-0.23 0.63 0.51 0.71 0.76 1.00
-0.21 0.00 -0.01 -0.03 -0.02 -0.04 1.00
Tax arrears squared
7
Dummy Tatarstan and Bashkortostan
8
0.12 -0.01 0.03 0.03 0.06 0.12 0.00 1.00
Territory
9
0.15 0.22 0.29 -0.01 0.11 0.19 -0.01 -0.04 1.00
Population
10 -0.16 0.24 0.12 0.62 0.48 0.65 -0.06 0.22 -0.01 1.00
Dummy border region
11
0.12 -0.03 0.12 -0.09 -0.05 -0.02 -0.06 0.02 -0.06 -0.08 1.00
Distance from Moscow
12
0.26 0.16 -0.02 -0.12 -0.08 -0.12 0.01 -0.07 0.43 -0.27 0.22 1.00
Dummy republic
13
0.02 -0.11 -0.05 -0.12 -0.07 -0.18 0.10 0.28 0.03 -0.27 -0.04 0.00 1.00
Overrepresentation in the Federal Council
14
0.01 0.19 -0.03 -0.14 -0.09 -0.24 0.10 -0.09 0.12 -0.43 0.07 0.49 0.11 1.00
Overrepresentation in the State Duma
15 -0.03 0.23 -0.03 -0.06 -0.04 -0.13 0.09 -0.05 0.11 -0.24 0.04 0.43 -0.02 0.96 1.00
Power
16 -0.03 0.23 0.22 0.13 0.17 0.26 0.02 0.14 0.41 0.17 -0.13 0.29 0.10 0.16 0.18 1.00
Fiscal transfers
17
0.03 -0.06 -0.15 -0.19 -0.19 -0.34 0.02 -0.13 -0.10 -0.49 0.21 0.28 0.39 0.41 0.29 -0.19 1.00
0.06 0.06 -0.04 0.08 0.03 0.11 -0.11 -0.27 -0.07 0.20 -0.09 -0.08 -0.83 -0.25 -0.16 -0.19 -0.48 1.00
Share of Russians
18
Democratisation
19 -0.08 0.18 0.06 0.15 0.12 0.29 -0.09 -0.20 0.07 0.34 -0.21 -0.15 -0.37 -0.31 -0.22 0.18 -0.52 0.48 1.00
Urbanisation
20
Dummy Putin
21 -0.37 0.61 0.00 0.19 0.15 0.24 0.06 0.00 0.00 -0.01 0.00 0.00 0.00 0.02 0.02 0.00 0.18 0.00 0.08 0.01 1.00
Tax arrears squared (Putin)
22 -0.23 0.03 -0.01 -0.02 -0.01 -0.03 1.00 -0.01 -0.02 -0.07 -0.05 0.00 0.10 0.09 0.07 0.01 0.03 -0.11 -0.08 -0.11 0.11 1.00
Tax arrears squared (Yeltsin)
23
0.09 0.32 0.07 0.31 0.23 0.34 -0.10 0.00 0.08 0.41 -0.15 0.06 -0.50 -0.19 -0.08 0.23 -0.56 0.50 0.55 1.00
0.22 -0.25 0.03 -0.10 -0.08 -0.08 0.04 0.09 0.03 0.00 -0.06 0.08 0.00 0.14 0.16 0.11 -0.08 -0.03 -0.11 0.09 -0.50 -0.05 1.00
�– 38 –
Appendix B: Robust regressions (after exclusion of outliers)10
Table B1: Regressions for individual annual cross-sections, 1995-2003, dependent variable: share of tax revenue
attributed to regional government
Variable
Tax structure
Average income
per capita
Oil & gas share
Retail trade
Net profit
Capital funds
Legal factors
Dummy Tatarstan
and Bashkortostan
Tax arrears
squared
Political var.
Territory
Population
Dummy border
region
Distance from
Moscow
Dummy republic
Overrepresentation in Federal
Council
Overrepresentation in State
Duma
Power (Jarocinska)
Fiscal transfers
Share of Russians
Democratisation
Urbanisation
Constant
R2
F-test
No. obs. (without
outliers)
Jarque-Bera
(without outliers)
Outliers
1995
1996
1997
1998
1999
2000
2001
2002
2003
0.082
(0.087)
0.513
(0.331)
0.001
(0.002)
-0.002
(0.008)
-1.268
(0.870)
0.040
(0.066)
0.315
(0.208)
0.001
(0.002)
-0.016**
(0.006)
-0.195
(0.278)
-0.046
(0.080)
-0.010
(0.261)
0.002
(0.002)
-0.010**
(0.005)
0.369
(0.38)
0.030
(0.038)
-0.164
(0.180)
-0.002
(0.001)
-0.001
(0.002)
0.263
(0.258)
0.063
(0.045)
0.158
(0.291)
-0.001
(0.001)
-0.001
(0.002)
-0.375
(0.318)
0.077*
(0.044)
-0.546
(0.376)
-0.002*
(0.001)
0.001
(0.001)
0.130
(0.168)
0.002
(0.018)
0.025
(0.423)
0.000
(0.001)
-0.001
(0.001)
0.052
(0.127)
-0.027
(0.019)
-0.319
(0.735)
-0.000
(0.001)
0.001
(0.002)
0.015
(0.177)
0.002
(0.022)
-0.490
(0.642)
-0.001
(0.001)
0.002
(0.001)
0.015
(0.177)
0.158***
(0.051)
-5.143
(3.310)
0.227***
(0.052)
-0.539
(2.053)
0.069
(0.057)
-0.635
(1.567)
0.195***
(0.042)
1.235*
(0.618)
0.287***
(0.069)
-3.134
(1.985)
0.171**
(0.078)
-2.381***
(0.697)
0.031
(0.067)
-1.393***
(0.222)
-0.157***
(0.058)
-0.238***
(0.043)
-0.054
(0.064)
-0.258***
(0.058)
0.071***
(0.022)
0.026
(0.020)
0.017
(0.011)
0.010***
(0.004)
0.047*
(0.028)
0.006
0.023
(0.023)
0.011
(0.015)
0.015
(0.015)
0.004
(0.003)
0.027
(0.038)
0.016
0.032
(0.032)
-0.029
(0.023)
0.019
(0.020)
0.000
(0.006)
0.049
(0.048)
0.028
0.009
(0.023)
-0.031*
(0.019)
0.020
(0.015)
0.004
(0.003)
0.037
(0.039)
-0.012
0.036
(0.038)
0.030
(0.022)
0.019
(0.020)
-0.006
(0.006)
0.038
(0.053)
-0.003
-0.032
(0.040)
-0.003
(0.021)
0.004
(0.022)
0.001
(0.005)
0.150***
(0.054)
-0.017
0.051**
(0.020)
0.008
(0.015)
0.031
(0.020)
0.002
(0.004)
0.112**
(0.048)
0.011
0.045*
(0.026)
0.010
(0.027)
0.036
(0.026)
0.007
(0.006)
0.209***
(0.071)
0.004
0.027
(0.033)
0.023
(0.035)
0.018
(0.031)
0.012*
(0.007)
0.086
(0.066)
-0.015
(0.014)
-0.028
(0.016)
-0.024
(0.023)
-0.055
(0.017)
0.039
(0.024)
0.018
(0.024)
0.052
(0.016)
-0.051
(0.023)
-0.018
(0.024)
0.017
(0.032)
-0.020*
(0.010)
0.026
(0.069)
-0.015
(0.055)
0.000
(0.002)
-0.010
(0.925)
0.751
(0.105)
0.719
32.66***
78
(0.041)
-0.016
(0.012)
-0.147*
(0.082)
0.013
(0.073)
0.001
(0.002)
0.995
(0.843)
0.643
(0.119)
0.557
28.55***
78
(0.058)
-0.009
(0.016)
-0.065
(0.118)
0.072
(0.091)
-0.004
(0.003)
2.606
(1.767)
0.639
(0.169)
0.402
29.59***
77
(0.046)
0.013
(0.013)
0.099*
(0.058)
0.019
(0.060)
0.000
(0.002)
-1.904*
(1.065)
0.609
(0.129)
0.740
738.01***
75
(0.060)
-0.013
(0.017)
0.135
(0.102)
0.129
(0.098)
-0.004
(0.003)
3.807*
(2.126)
0.346
(0.181)
0.512
31.38***
78
(0.060)
-0.009
(0.017)
0.167
(0.114)
0.306*
(0.126)
-0.003
(0.002)
0.121
(1.359)
0.257
(0.194)
0.562
41.83
76
(0.044)
0.009
(0.015)
0.272***
(0.085)
0.159*
(0.082)
-0.003
(0.002)
3.216**
(1.238)
0.054
(0.162)
0.698
50.72***
73
(0.058)
0.006
(0.019)
0.111
(0.120)
0.334***
(0.105)
-0.005*
(0.003)
2.670*
(1.573)
0.169
(0.240)
0.581
291.38***
77
(0.063)
0.001
(0.019)
0.342**
(0.168)
0.285**
(0.108)
-0.002
(0.003)
2.514
(1.880)
0.088
(0.280)
0.522
32.64***
79
0.613
1.793
0.375
1.349
4.392
0.903
1.322
0.54
3.419
Ingushetia,
Kalmykia
Altai (rep.),
Ingushetia,
Kalmykia
Vologda
Altai (rep.),
Omsk,
Mordovia
KabardinoBalkaria
Khakassia,
Ingushetia,
Lipetsk,
Magadan,
Mordovia.
Ingushetia
Ingushetia
Ingushetia
Notes: see table 1.
10
Outliers are excluded until Jarque Bera test becomes insignificant
Magadan,
Mordovia
�– 39 –
Table B2: Panel data regressions (OLS), 1995-2003, dependent variable: share of tax revenue attributed to regions
(1)
(2)
(3)
(4)
OLS
OLS
OLS
OLS
Tax structure
0.005
-0.003
-0.020***
-0.010**
Average income per
capita
(0.004)
(0.006)
(0.006)
(0.005)
0.023
3.355
-0.010
1.338
Oil & gas share
Retail trade
Net profit
Capital funds
Legal factors
Dummy Tatarstan
and Bashkortostan
Political variables
Territory
Population
Dummy border region
Distance from Moscow
Dummy republic
Overrepresentation
in Federal Council
Overrepresentation
in State Duma
Power (Jarocinska)
Fiscal transfers
Share of Russians
Democratisation
Urbanisation
Dummy Putin
Arrears (Yeltsin)
Arrears (Putin)
Constant
Region fixed effects
Time fixed effects
R2
(0.025)
0.000*
(0.000)
0.000
(0.000)
-0.036***
(0.019)
(4.360)
0.000
(0.000)
-0.000
(0.000)
-0.062***
(0.021)
(0.034)
0.000
(0.000)
0.000
(0.000)
-0.027
(0.022)
(4.150)
0.000
(0.000)
0.000
(0.000)
-0.075***
(0.017)
0.129***
(0.033)
-
0.120***
(0.033)
-
0.037***
(0.007)
-0.013***
(0.004)
0.027***
(0.007)
0.007***
(0.002)
0.082***
(0.018)
-0.004
(0.007)
0.006
(0.019)
-0.002
(0.006)
0.058*
(0.032)
0.152***
(0.032)
-0.001
(0.001)
0.379
(0.408)
1.896***
(0.499)
-0.283***
(0.035)
0.485
(0.056)
0.081***
(0.021)
-0.050***
(0.017)
0.048
(0.042)
-0.005
(0.032)
-0.002
(0.002)
5.166
(4.041)
-0.077***
(0.009)
1.238**
(0.536)
-0.037
(0.034)
0.131
(0.287)
Yes
No
0.035***
(0.007)
-0.012***
(0.005)
0.030***
(0.008)
0.006***
(0.002)
0.081***
(0.019)
-0.002
(0.007)
0.002
(0.019)
-0.007
(0.006)
0.051*
(0.031)
0.145***
(0.035)
-0.000
(0.001)
0.611
(0.456)
-0.061***
(0.011)
1.927***
(0.409)
-0.272***
(0.021)
0.501
(0.061)
No
No
0.055***
(0.019)
-0.040***
(0.016)
0.030
(0.038)
0.019
(0.028)
-0.001
(0.001)
2.189
(3.303)
1.347**
(0.522)
-0.018
(0.021)
-0.223
(0.383)
Yes
Yes
No
Yes
0.635
36.07***
665
0.022
0.539
0.001
F-test
46.74***
44.37***
70.71***
No. obs. (without
692
665
681
outliers)
Jarque-Bera
3.098
0.853
2.237
3.872
(without outliers)
Notes: see table 2.
Outliers (regression (1)): Altai (Rep.) (1997, 1998, 1999, 2000, 2001); Chukotka (1998); Dagestan (1995); Ingushetia (1995; 1996; 1997; 1999; 2000; 2001); Kabardino-Balkaria (2001); Kalmykia (1996; 1997; 1998; 1999;
�– 40 –
2000; 2001); Karelia (2002); Khakassia (2001; 2002); Lipetsk (2000; 2001; 2002); Magadan (2000; 2001; 2002;
2003); Mordovia (2000; 2001; 2002; 2003); Omsk (2000; 2002); Riazan (2001); Sakha (1995); Tatarstan (2003);
Tomsk (2003); Tyva (1995; 1996; 1997; 2001; 2002); Vologda (1998).
Outliers (regression (2)): Altai (Rep.) (1995; 1996; 1999; 2000); Amur (2003); Ingushetia (2002; 2003); Kalmykia (1995); Magadan (2002; 2003); Mordovia (1995; 1998; 2000; 2001; 2002); Omsk (2000; 2002); Sakha
(1995).
Outliers (regression (3)): Altai (Rep.) (1998; 1999; 2000; 2001; 2002); Amur (2003); Chukotka (1998, 2002);
Cheliabinsk (1999); Chita (2003); Dagestan (1995; 1998); Ingushetia (1995; 1996; 1997; 1999; 2000; 2001);
Kabardino-Balkaria (2001); Kalmykia (1997; 1998; 1999; 2000; 2001); Khakassia (2001; 2002); Lipetsk (2000;
2002; 2003); Magadan (2000; 2002; 2003); Mordovia (2000; 2001; 2002); Novosibirsk (2001); Omsk (2000;
2002); Riazan (2001); Sakha (1995); Tomsk (1999); Tyva (2002; 2003); Vologda (1998).
Outliers (regression (4)): Altai (Rep.) (1995; 1996; 1999; 2000; 2003); Amur (2003); Ingushetia (1998; 2002;
2003); Kabardino-Balkaria (2001; 2003); Kalmykia (1995; 1996); Khakassia (2001); Lipetsk (1995); Magadan
(2001; 2002; 2003); Mordovia (1995; 1998; 2000; 2001; 2002; 2003); Northern Ossetia (2003); Omsk (2000;
2002); Sakha (1995); Tatarstan (2002; 2003)
�– 41 –
Appendix C: Robust regressions (after exclusion of outliers and Kalmykia)11
Table C1: Regressions for individual annual cross-sections, 1995-2003, dependent variable: share of tax revenue
attributed to regional government
Variable
1995
1996
1997
1998
1999
2000
2001
2002
Tax structure
0.067
0.021
-0.046
0.030
0.055
0.061
0.004
-0.025
Average income
per capita
(0.085)
(0.062)
(0.080)
(0.038)
(0.036)
(0.042)
(0.016)
(0.020)
0.429
0.239
-0.010
-0.164
0.073
-0.452
0.132
-0.218
Oil & gas share
Retail trade
Net profit
Capital funds
Legal factors
Dummy Tatarstan
and Bashkortostan
Tax arrears
squared
Political variables
Territory
Population
Dummy border
region
Distance from
Moscow
Dummy republic
Overrepresentation
in Federal Council
Overrepresentation
in State Duma
Power (Jarocinska)
Fiscal transfers
Share of Russians
Democratisation
Urbanisation
Constant
R2
(0.314)
0.001
(0.002)
-0.000
(0.007)
-1.107
(0.830)
(0.195)
0.001
(0.002)
-0.016**
(0.006)
-0.040
(0.246)
(0.261)
0.002
(0.002)
-0.010**
(0.005)
0.369
(0.381)
(0.1804)
-0.002
(0.001)
-0.001
(0.002)
0.262
(0.258)
(0.263)
-0.001
(0.001)
0.000
(0.002)
-0.381
(0.279)
(0.386)
-0.002
(0.001)
0.002
(0.001)
0.006
(0.186)
(0.442)
0.001
(0.001)
-0.003
(0.001)
0.166
(0.139)
(0.714)
0.000
(0.001)
0.000
(0.002)
0.042
(0.173)
0.004
(0.022)
-0.499
(0.646)
-0.001
(0.001)
0.002
(0.001)
0.013
(0.178)
0.145***
(0.052)
-4.157
(3.190)
0.199***
(0.047)
0.056
(1.942)
0.069
(0.057)
-0.635
(1.567)
0.195***
(0.042)
1.235*
(0.618)
0.250***
(0.064)
-0.596
(1.815)
0.187**
(0.086)
1.828
(1.799)
0.075
(0.048)
-7.236***
(2.460)
-0.155***
(0.056)
-4.144
(2.787)
-0.059
(0.063)
0.620**
(0.240)
0.070***
(0.023)
0.021
(0.020)
0.012
(0.010)
0.009**
(0.004)
0.048*
(0.028)
0.005
(0.014)
-0.026
(0.032)
-0.019*
(0.010)
0.058
(0.065)
-0.015
(0.054)
-0.000
(0.002)
-0.071
(0.952)
0.766
(0.103)
0.018
(0.021)
0.002
(0.013)
0.008
(0.014)
0.004
(0.003)
0.030
(0.039)
0.017
(0.016)
-0.023
(0.042)
-0.014
(0.013)
-0.117*
(0.070)
0.0072
(0.067)
0.000
(0.002)
0.788
(0.856)
0.669
(0.114)
0.032
(0.032)
-0.029
(0.023)
0.019
(0.020)
0.000
(0.006)
0.049
(0.048)
0.028
(0.023)
-0.055
(0.058)
-0.009
(0.016)
-0.065
(0.118)
0.072
(0.091)
-0.004
(0.003)
2.606
(1.767)
0.639
(0.169)
0.009
(0.023)
-0.031*
(0.019)
0.020
(0.015)
0.004
(0.003)
0.037
(0.039)
-0.012
(0.017)
0.039
(0.046)
0.013
(0.013)
0.099*
(0.058)
0.019
(0.060)
0.000
(0.002)
-1.904*
(1.065)
0.609
(0.129)
0.029
(0.034)
0.019
(0.021)
0.019
(0.019)
-0.004
(0.006)
0.034
(0.051)
-0.006
(0.022)
0.014
(0.056)
-0.012
(0.016)
0.100
(0.093)
0.103
(0.089)
-0.004
(0.003)
2.813
(2.759)
0.435
(0.168)
-0.035
(0.037)
-0.005
(0.021)
0.003
(0.021)
0.007
(0.005)
0.159***
(0.052)
-0.024
(0.022)
0.048
(0.056)
-0.001
(0.018)
0.136
(0.110)
0.326***
(0.117)
-0.000
(0.002)
-1.715
(1.326)
0.262
(0.193)
0.056
(0.022)
-0.004
(0.015)
0.021
(0.019)
0.002
(0.004)
0.124***
(0.043)
0.011
(0.016)
-0.037
(0.041)
0.005
(0.015)
0.292***
(0.078)
0.185**
(0.073)
-0.004*
(0.002)
3.991***
(1.093)
0.048
(0.159)
0.043
(0.027)
0.003
(0.026)
0.029
(0.0273)
0.007
(0.006)
0.212***
(0.070)
0.004
(0.023)
-0.011
(0.058)
0.002
(0.019)
0.111
(0.118)
0.331***
(0.101)
-0.008**
(0.003)
3.279**
(1.501)
0.205
(0.231)
0.025
(0.032)
0.030
(0.034)
0.015
(0.031)
0.011
(0.007)
0.084
(0.067)
-0.007
(0.023)
-0.004
(0.061)
-0.004
(0.018)
0.337**
(0.166)
0.270**
(0.107)
-0.002
(0.003)
2.569
(1.852)
0.119
(0.274)
0.589
22.06***
77
0.402
29.59***
77
0.740
738.01***
75
0.482
35.64***
77
0.512
62.86***
75
0.640
32.75***
72
0.508
20.52***
76
0.453
48.70***
78
0.744
F-test
28.90***
No. obs.
77
Notes: see table 1.
11
2003
Outliers are listed in Appendix B
�– 42 –
Table C2: Panel data regressions (OLS), 1995-2003, dependent variable: share of tax revenue attributed to regional government
(1)
(2)
(3)
(4)
OLS
OLS
OLS
OLS
Tax structure
0.005
-0.004
-0.020***
-0.011
Average income per
capita
(0.004)
(0.006)
(0.006)
(0.006)**
0.022
2.810
-0.010
1.319
Oil & gas share
Retail trade
Net profit
Capital funds
Legal factors
Dummy Tatarstan
and Bashkortostan
Political variables
Territory
Population
Dummy border region
Distance from Moscow
Dummy republic
Overrepresentation
in Federal Council
Overrepresentation
in State Duma
Power (Jarocinska)
Fiscal transfers
Share of Russians
Democratisation
Urbanisation
Dummy Putin
Arrears (Yeltsin)
Arrears (Putin)
Constant
Region fixed effects
Time fixed effects
R2
F-test
No. obs.
Notes: see table 2.
(0.025)
0.000*
(0.000)
0.000
(0.000)
-0.035*
(0.018)
(4.268)
0.000
(0.000)
-0.000
(0.000)
-0.063***
(0.021)
(0.035)
0.000
(0.000)
0.000
(0.000)
-0.024
(0.022)
(4.108)
0.000
(0.000)
0.000
(0.000)
-0.073***
(0.017)
0.128***
(0.033)
-
0.116***
(0.033)
-
0.037***
(0.007)
-0.013***
(0.004)
0.026***
(0.007)
0.007***
(0.002)
0.082***
(0.018)
-0.003
(0.007)
0.002
(0.018)
-0.002
(0.006)
0.059*
(0.032)
0.150***
(0.032)
-0.001
(0.001)
0.307
(0.412)
1.969***
(0.502)
0.493**
(0.249)
0.491
(0.056)
0.088***
(0.022)
-0.051***
(0.017)
0.050
(0.042)
-0.025
(0.030)
-0.001
(0.002)
7.102*
(3.812)
-0.078***
(0.009)
1.711***
(0.503)
0.836***
(0.223)
-0.025
(0.271)
Yes
No
0.035***
(0.007)
-0.013***
(0.005)
0.028***
(0.008)
0.006***
(0.002)
0.082***
(0.019)
-0.002
(0.007)
0.004
(0.019)
-0.006
(0.006)
0.051*
(0.031)
0.143***
(0.035)
-0.001
(0.001)
0.586
(0.470)
-0.059***
(0.013)
1.870***
(0.413)
-0.602
(1.078)
0.506
(0.061)
No
No
0.057***
(0.019)
-0.039**
(0.016)
0.028
(0.038)
0.012
(0.028)
-0.001
(0.001)
2.533
(3.357)
1.635***
(0.573)
0.636***
(0.180)
1.069
(0.270)
Yes
Yes
0.010
30.87***
684
0.514
29.81***
661
0.001
41.27***
674
No
Yes
0.618
32.38***
662
�CESifo Working Paper Series
(for full list see www.cesifo-group.de)
T
T
___________________________________________________________________________
1964 Steven Brakman and Charles van Marrewijk, It’s a Big World After All, April 2007
1965 Mauro Ghinamo, Paolo M. Panteghini and Federico Revelli, FDI Determination and
Corporate Tax Competition in a Volatile World, April 2007
1966 Inés Macho-Stadler and David Pérez-Castrillo, Optimal Monitoring to Implement Clean
Technologies when Pollution is Random, April 2007
1967 Thomas Eichner and Ruediger Pethig, Efficient CO2 Emissions Control with National
Emissions Taxes and International Emissions Trading, April 2007
1968 Michela Redoano, Does Centralization Affect the Number and Size of Lobbies?, April
2007
1969 Christian Gollier, Intergenerational Risk-Sharing and Risk-Taking of a Pension Fund,
April 2007
1970 Swapan K. Bhattacharya and Biswa N. Bhattacharyay, Gains and Losses of India-China
Trade Cooperation – a Gravity Model Impact Analysis, April 2007
1971 Gerhard Illing, Financial Stability and Monetary Policy – A Framework, April 2007
1972 Rainald Borck and Matthias Wrede, Commuting Subsidies with two Transport Modes,
April 2007
1973 Frederick van der Ploeg, Prudent Budgetary Policy: Political Economy of Precautionary
Taxation, April 2007
1974 Ben J. Heijdra and Ward E. Romp, Retirement, Pensions, and Ageing, April 2007
1975 Scott Alan Carson, Health during Industrialization: Evidence from the 19th Century
Pennsylvania State Prison System, April 2007
1976 Andreas Haufler and Ian Wooton, Competition for Firms in an Oligopolistic Industry:
Do Firms or Countries Have to Pay?, April 2007
1977 Eckhard Janeba, Exports, Unemployment and the Welfare State, April 2007
1978 Gernot Doppelhofer and Melvyn Weeks, Jointness of Growth Determinants, April 2007
1979 Edith Sand and Assaf Razin, The Role of Immigration in Sustaining the Social Security
System: A Political Economy Approach, April 2007
1980 Marco Pagano and Giovanni Immordino, Optimal Regulation of Auditing, May 2007
�1981 Ludger Woessmann, Fundamental Determinants of School Efficiency and Equity:
German States as a Microcosm for OECD Countries, May 2007
1982 Bas Jacobs, Real Options and Human Capital Investment, May 2007
1983 Steinar Holden and Fredrik Wulfsberg, Are Real Wages Rigid Downwards?, May 2007
1984 Cheng Hsiao, M. Hashem Pesaran and Andreas Pick, Diagnostic Tests of Cross Section
Independence for Nonlinear Panel Data Models, May 2007
1985 Luis Otávio Façanha and Marcelo Resende, Hierarchical Structure in Brazilian
Industrial Firms: An Econometric Study, May 2007
1986 Ondřej Schneider, The EU Budget Dispute – A Blessing in Disguise?, May2007
1987 Sascha O. Becker and Ludger Woessmann, Was Weber Wrong? A Human Capital
Theory of Protestant Economic History, May 2007
1988 Erkki Koskela and Rune Stenbacka, Equilibrium Unemployment with Outsourcing and
Wage Solidarity under Labour Market Imperfections, May 2007
1989 Guglielmo Maria Caporale, Juncal Cunado and Luis A. Gil-Alana, Deterministic versus
Stochastic Seasonal Fractional Integration and Structural Breaks, May 2007
1990 Cláudia Costa Storti and Paul De Grauwe, Globalization and the Price Decline of Illicit
Drugs, May 2007
1991 Thomas Eichner and Ruediger Pethig, Pricing the Ecosystem and Taxing Ecosystem
Services: A General Equilibrium Approach, May 2007
1992 Wladimir Raymond, Pierre Mohnen, Franz Palm and Sybrand Schim van der Loeff, The
Behavior of the Maximum Likelihood Estimator of Dynamic Panel Data Sample
Selection Models, May 2007
1993 Fahad Khalil, Jacques Lawarrée and Sungho Yun, Bribery vs. Extortion: Allowing the
Lesser of two Evils, May 2007
1994 Thorvaldur Gylfason, The International Economics of Natural Resources and Growth,
May 2007
1995 Catherine Roux and Thomas von Ungern-Sternberg, Leniency Programs in a
Multimarket Setting: Amnesty Plus and Penalty Plus, May 2007
1996 J. Atsu Amegashie, Bazoumana Ouattara and Eric Strobl, Moral Hazard and the
Composition of Transfers: Theory with an Application to Foreign Aid, May 2007
1997 Wolfgang Buchholz and Wolfgang Peters, Equal Sacrifice and Fair Burden Sharing in a
Public Goods Economy, May 2007
�1998 Robert S. Chirinko and Debdulal Mallick, The Fisher/Cobb-Douglas Paradox, Factor
Shares, and Cointegration, May 2007
1999 Petra M. Geraats, Political Pressures and Monetary Mystique, May 2007
2000 Hartmut Egger and Udo Kreickemeier, Firm Heterogeneity and the Labour Market
Effects of Trade Liberalisation, May 2007
2001 Andreas Freytag and Friedrich Schneider, Monetary Commitment, Institutional
Constraints and Inflation: Empirical Evidence for OECD Countries since the 1970s,
May 2007
2002 Niclas Berggren, Henrik Jordahl and Panu Poutvaara, The Looks of a Winner: Beauty,
Gender, and Electoral Success, May 2007
2003 Tomer Blumkin, Yoram Margalioth and Efraim Sadka, Incorporating Affirmative
Action into the Welfare State, May 2007
2004 Harrie A. A. Verbon, Migrating Football Players, Transfer Fees and Migration Controls,
May 2007
2005 Helmuth Cremer, Jean-Marie Lozachmeur and Pierre Pestieau, Income Taxation of
Couples and the Tax Unit Choice, May 2007
2006 Michele Moretto and Paolo M. Panteghini, Preemption, Start-Up Decisions and the
Firms’ Capital Structure, May 2007
2007 Andreas Schäfer and Thomas M. Steger, Macroeconomic Consequences of
Distributional Conflicts, May 2007
2008 Mikael Priks, Judiciaries in Corrupt Societies, June 2007
2009 Steinar Holden and Fredrik Wulfsberg, Downward Nominal Wage Rigidity in the
OECD, June 2007
2010 Emmanuel Dhyne, Catherine Fuss, Hashem Pesaran and Patrick Sevestre, Lumpy Price
Adjustments: A Microeconometric Analysis, June 2007
2011 Paul Belleflamme and Eric Toulemonde, Negative Intra-Group Externalities in TwoSided Markets, June 2007
2012 Carlos Alós-Ferrer, Georg Kirchsteiger and Markus Walzl, On the Evolution of Market
Institutions: The Platform Design Paradox, June 2007
2013 Axel Dreher and Martin Gassebner, Greasing the Wheels of Entrepreneurship? The
Impact of Regulations and Corruption on Firm Entry, June 2007
2014 Dominique Demougin and Claude Fluet, Rules of Proof, Courts, and Incentives, June
2007
�2015 Stefan Lachenmaier and Horst Rottmann, Effects of Innovation on Employment: A
Dynamic Panel Analysis, June 2007
2016 Torsten Persson and Guido Tabellini, The Growth Effect of Democracy: Is it
Heterogenous and how can it be Estimated?, June 2007
2017 Lorenz Blume, Jens Müller, Stefan Voigt and Carsten Wolf, The Economic Effects of
Constitutions: Replicating – and Extending – Persson and Tabellini, June 2007
2018 Hartmut Egger and Gabriel Felbermayr, Endogenous Skill Formation and the Source
Country Effects of International Labor Market Integration, June 2007
2019 Bruno Frey, Overprotected Politicians, June 2007
2020 Jan Thomas Martini, Rainer Niemann and Dirk Simons, Transfer Pricing or Formula
Apportionment? Tax-Induced Distortions of Multinationals’ Investment and Production
Decisions, June 2007
2021 Andreas Bühn, Alexander Karmann and Friedrich Schneider, Size and Development of
the Shadow Economy and of Do-it-yourself Activities in Germany, June 2007
2022 Michael Rauscher and Edward B. Barbier, Biodiversity and Geography, June 2007
2023 Gunther Schnabl, Exchange Rate Volatility and Growth in Emerging Europe and East
Asia, June 2007
2024 Erkki Koskela and Ronnie Schöb, Tax Progression under Collective Wage Bargaining
and Individual Effort Determination, June 2007
2025 Jay Pil Choi and Marcel Thum, The Economics of Politically Connected Firms, June
2007
2026 Jukka Pirttilä and Roope Uusitalo, Leaky Bucket in the Real World: Estimating
Inequality Aversion Using Survey Data, June 2007
2027 Ruslan Lukach, Peter M. Kort and Joseph Plasmans, Strategic R&D with Knowledge
Spillovers and Endogenous Time to Complete, June 2007
2028 Jarko Fidrmuc, Neil Foster and Johann Scharler, Labour Market Rigidities, Financial
Integration and International Risk Sharing in the OECD, June 2007
2029 Bernardina Algieri and Thierry Bracke, Patterns of Current Account Adjustment –
Insights from Past Experience, June 2007
2030 Robert Dur and Hein Roelfsema, Social Exchange and Common Agency in
Organizations, June 2007
2031 Alexander Libman and Lars P. Feld, Strategic Tax Collection and Fiscal
Decentralisation: The Case of Russia, June 2007
�
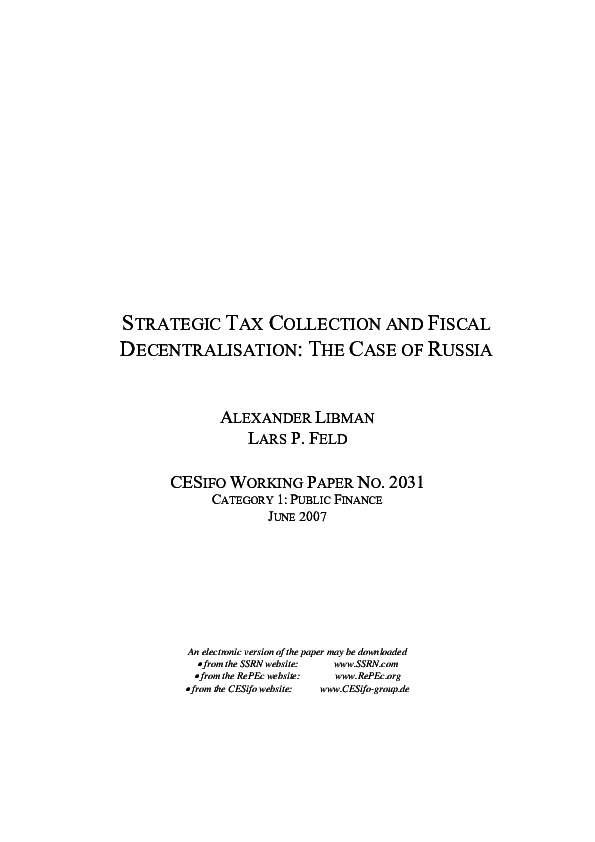
 Lars Feld