ICUC9 - 9th International Conference on Urban Climate jointly with 12th Symposium on the Urban Environment
Influence of urban climate on perception responses in
soundwalks: case study Aachen
Margret Sibylle Engel1,2, Janina Fels1, Christoph Schneider2
1 Institute of Technical Acoustics, Medical Acoustics Group, RWTH Aachen University, Germany;
margret.engel@akustik.rwth-aachen.de
2 Department of Geography, RWTH Aachen University, Germany
PICTURE
dated : 15 June 2015
1. Introduction
This study presents results collected during the field work of the Urban Future Outline project - UFO (2015), a
research project funded by the Excellence Initiative of the German federal and state governments in order to
establish a platform for research on urban spaces. It is part of HumTec Project House (2015) and is divided into
four distinct areas, namely: Urban Turn (U-Turn), Future Mobility (FuMob), Future Energy (FuEne), Future
Ecosystem (FuEco). The last one focuses on studies of combined stresses like heat, noise and particulate matter.
The results presented in this paper are included in the context studied by FuEco sub-project. On the acoustical
area various strategies for obtaining data related to environmental stress factors were adopted, such as sound
monitoring, noise mapping, sound perception interviews, soundwalks and the consultation with governmental
agencies to compare results.
In recent years, based on socio-environmental and environmental health studies, as well as on urban planning,
the scientific community has rethought the assessment of noise and its effects on quality of life. It is suggested to
take into account all of the sound in an environment in its complexity, ambivalence, meaning and context
considering the conditions and purposes of its production and perception (NWIP ISO 12913-2:2014).
Consequently, it has been found that studies on soundscape and landscape, as both are based on perception by
people follow a comparable experimental setup. The perceptual construct (soundscape) is related to physical
phenomena (acoustic environment) (ISO/DIS 12913-1: 2014).
The definition of soundscape, according to ISO/DIS 12913-1 (2014) reads as follows: „Acoustic environment as
perceived or experienced and/or understood by a person or people, in context“. The context may influence
soundscape through the auditory sensation, the interpretation of auditory sensation, and the responses to the
acoustic environment. One of the factors that influence the acoustic environment is weather.
The perception of the context includes a set of perceptions, such as the auditory, visual, sensory, and weather
conditions. For this reason the present study aims to investigate the influence of urban climate on the perception
of the environment in the visual, auditory, climatic and cultural aspects.
2. Methodology
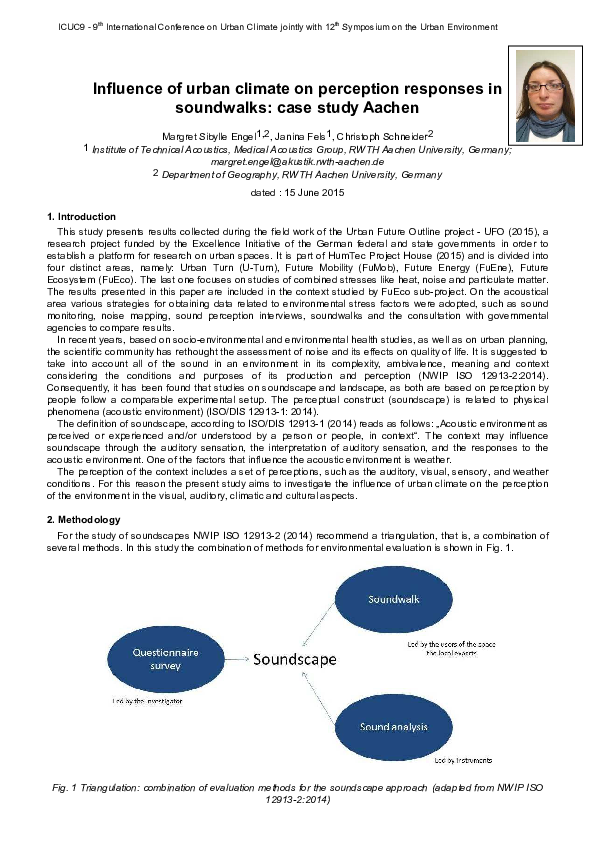
For the study of soundscapes NWIP ISO 12913-2 (2014) recommend a triangulation, that is, a combination of
several methods. In this study the combination of methods for environmental evaluation is shown in Fig. 1.
Fig. 1 Triangulation: combination of evaluation methods for the soundscape approach (adapted from NWIP ISO
12913-2:2014)
�ICUC9 - 9th International Conference on Urban Climate jointly with 12th Symposium on the Urban Environment
According to Schafer (1969), soundwalking is an empirical method to evaluate a soundscape and its
components in several locations. Semidor (2006) suggested the use of binaural microphone system plugged into
a DAT recorder. This equipment allows the collection of sound data that will be evaluated in conjunction with the
subjective data collected through questionnaires or sound perception interviews.
In the present study, the triangulation method for evaluating the soundscape consisted of conducting
soundwalks, in which participants evaluated the environmental perception of a particular area in Aachen,
Germany by filling in a questionnaire. At the same time, the weather conditions (i.e., temperature, wind speed and
relative humidity) were monitored, as well as the acoustic conditions.
2.1 Study Area
The study was conducted in the region of Aachen at the central area called Elisenbrunnen. The area count with
four monitoring points, comprising a small park (Elisengarten, points E and F), a playground area (Point A), as
well as an area of cafés with bus stops nearby (point B).
Fig. 2 Study area
�ICUC9 - 9th International Conference on Urban Climate jointly with 12th Symposium on the Urban Environment
In the present study the coordinators of the soundwalk scheduled that the participants had to evaluate three
consecutive points. In the Elisenbrunnen area it was possible to run 24 routes, with three evaluation points, as
follows: route 1 (points A-B-E), route 2 (points A-B-F), and so forth.
In this study, 44 participants attended the soundwalks. 43.2% persons were female and 53.8% male; and 50%
of participants have aged between 17 and 21 years, 36.4% between 22-30 years and 13.6% fall within the age
group 31-40 years.
Fifteen of 24 possible routes were used. A total of 132 responses on the perceptual ratings were collected and
evaluated.
2.2 Instrumentation
For the soundwalks the research team had at its disposal equipment for sound monitoring and weather
conditions. For sound monitoring we used a set Sennheiser KE-4 capsule omnidirectional microphone, KE-3
binaural microphones and a Zoom-H6 multitrack recording device that monitored a sampling rate of 44.1 kHz
during the entire time span. The microphone calibration was performed with a B&K 4231 calibrator.
To monitor the weather conditions we used a Humidy and Temperature Sensor Testo 625 and an Anemometer
Windmaster 2 Pro.
The acoustical and weather monitoring had the same duration as the time required for evaluation of the
monitoring locations with the aid of environmental awareness questionnaires. The time for each individual rating
ranged between 3 and 13 minutes.
2.3 Questionnaire Design
In the soundwalks we used a semi-structured questionnaire with open and closed questions. The questionnaire
was divided into three parts: 1) demographic information and weather perception; 2) landscape perception,
acoustical perception and economic factors; 3) expectations regarding environmental noise in an urban area.
Results from parts 1) and 2) are reported in this paper.
The content addressed followed the recommendations of Jennings & Cain (2013) for conducting a survey of the
information items that comprise a landscape, as well as of the factors that influence it in a positive or negative
way, like the interventions through architectural projects. Other issues addressed were as follows: how the
participant felt about the place, if he possessed analytic hearing thanks to the identification of the sound sources,
and what was his opinion of such sources.
For this study, nationality was used as demographic information. This type of data was in nominal scale.
The weather conditions were surveyed in closed format on six items, each rated on an ordinal scale of six
levels (i.e., for the question “How would you generally describe the weather today?” the answers options were:
very bad, bad, rather bad, rather good, good and very good).They aimed to examine how the informant felt about
each weather parameter raised: temperature, sun heat, humidity, wind speed, wind speed comfort, and weather in
general.
Each participant provided one response on each variable in the first part of the questionnaire for the
demographic and weather condition perception questions. This study only used one acoustical and one landscape
perception question item. These two items were again rated on a six-level ordinal scale (i.e., for the question
“What do you think of the current location?” the answers options were: very uncomfortable, uncomfortable, rather
uncomfortable, rather comfortable, comfortable and very comfortable). The acoustical question was about
background noise in the place. And, the landscape question was about what the participant thought of the current
location. As those questions were in the second part of the questionnaire, the sample consisted of 132 responses
from 44 participants providing responses at three evaluation points.
Statistical analysis was performed using IBM SPSS Statistics 22. The following statistical analyses were
2
performed: Spearman Correlation Coefficient (ρ) and Pearson Chi-squared (χ ) for scale and ordinal data as well
as Cramer’s V association measure between ordinal and nominal variables. The a priori value of α for null
hypothesis significance testing was chosen at 0.05.
3. Results and Discussion
The association of the monitored weather conditions and perceived weather conditions were analyzed using the
Spearman correlation coefficient. The analysis was first performed on the complete sample, and then again on
two sub-samples split based on individual responses of negative perception (i.e., from “rather uncomfortable” to
“very uncomfortable”) and positive perception (i.e., from “rather comfortable” to “very comfortable”). In the total
132 responses, 62 responses were rated negative and 70 responses rated positive. Only the significant results
are reported in Tab.1.
�ICUC9 - 9th International Conference on Urban Climate jointly with 12th Symposium on the Urban Environment
Tab. 1 Spearman Correlations (ρ) results from weather measurement vs weather perception
Max Temperature
Min
Temperature
Avg Wind
Speed
Avg
Humidity
How would you generally describe
the weather today?
.535***
.492***
.502***
-.451**
-.370***
How do you feel about the
temperature today?
.342*
.388**
.358*
-
-.315***
What do you think of the current
location?
-
.277***
.182*
-.223**
-
How do you feel about the
background noise in this place?
-
.268**
-
-.197***
-
Subsample with
Negative
Perceptions
How do you feel about the
background noise in this place?
.253*
-
.329**
-
-
How do you feel about the
background noise in this place?
-
.317**
.257*
-
-
Complete Sample
Avg Temperature
Subsample with
Positive
Perceptions
Sample Perception Item
Legend: (-) not significant; (red) negative correlation, (<0.4) weak correlation; (>0.4 to <0.5) moderate correlation; (> 0.5) strong
correlation, (*) p<.05, (**) p<.01, (***) p<.001.
For the analysis on the complete sample, there exist a trend of positive correlation between temperature and
perceived comfort in general weather condition, temperature, location preference, and background noise. There
are strong correlations between “How would you generally describe the weather today?” and the average and
minimum temperatures. All other correlations are moderate or weak.
Almost all correlations are positive only few negative correlations occurred, such as:
“How would you generally describe the weather today?” vs wind speed,
“What do you think of the current location?” vs wind speed,
“How do you feel about the background noise in this place?” vs wind speed,
“How would you generally describe the weather today?” vs average humidity and
“How do you feel about the temperature today? vs average humidity.
The results suggest that when wind speed and average humidity are increasing, the perceptual response tends
to increase discomfort.
For the analyses on the split subsamples, the following results were observed:
1. On the negative perception subsample there are positive weak correlations between “How do you feel
about the background noise in this place?” and average as well as minimum temperatures. It means
that when the minimum and average temperatures increased, the comfort related to the background
noise increased also.
2. On the positive perception subsample there are positive weak correlation between “How do you feel
about the background noise in this place?” and maximum as well as minimum temperatures. It means
that when the minimum and maximum temperatures increased, the discomfort related to the
background noise increased also.
As the results have shown an ambiguous response, further analysis will be realized to understand better this
issue.
The same coefficient was calculated to analyze the main weather perception parameter vs individual weather
perception parameters.
There is only one negative correlation between the subjective feeling regarding wind speed (comfort) and the
wind speed perception with ρ = -.301 (p = .047). Strong correlations are noted between “How do you feel about
the heat of the sun today?” and “How would you generally describe the weather today?” with ρ = .533 (p=.002), or
“How do you feel about the temperature today?” with ρ = .503 (p = 0.000). So the perception of “warming sun” is
positively associated with general weather perception and temperature perception. Other strong correlations
occurred between “How do you feel about the background noise in this place?” and “What do you think of the
current location?” with ρ = .576 (p = 0.000). It means that the place perception depends on the background noise
of this place. There is a moderate correlation between “How do you feel about the temperature today?” and “How
would you generally describe the weather today?” with ρ = .460 (p = .002). And there is a weak correlation
�ICUC9 - 9th International Conference on Urban Climate jointly with 12th Symposium on the Urban Environment
between “How do you feel about the humidity in the air today?” and “How would you generally describe the
weather today?” with ρ = .300 (p = .048).
Tab.2 compares the dominance of each individual measured weather metrics in the prediction of each
perceived weather condition. For the description of the weather there are a greater association between the
perceived parameter and the following sequence of measured parameters: maximum and minimum
temperatures, average humidity, average temperature and wind speed. For perceived temperature the
importance of the measured parameters are the following: humidity average, temperature average, wind speed,
minimum and maximum temperatures. Measured wind speed is not significant for the wind speed description, but
humidity average and temperature (average, maximum and minimum) are significant. Wind speed (comfort) has
greater association with humidity average, temperature (maximum, minimum and average) and wind speed.
2
Tab. 2 Chi-squared (χ ) results of perceived and measured weather conditions
General (N=44)
Variable 1 (perceived)
Variable 2 (measured)
How would you describe the weather today?
How do you feel about the temperature today?
What is the wind speed today?
How do you feel about the wind speed today? (comfort)
Chi2
df
Sig.
Temperature Avg
52.963
36
0.034
Temperature Max
56.935
36
0.015
Temperature Min
56.935
36
0.015
Humidity Avg
56.935
39
0.032
Wind Speed
34.748
21
0.030
Temperature Avg
50.004
24
0.001
Temperature Max
40.004
24
0.021
Temperature Min
42.711
24
0.011
Humidity Avg
50.830
26
0.002
Wind Speed
47.443
14
0.000
Temperature Avg
77.147
48
0.005
Temperature Max
73.944
48
0.009
Temperature Min
72.111
48
0.014
Humidity Avg
77.611
52
0.012
Temperature Avg
114.027
48
0.000
Temperature Max
114.799
48
0.000
Temperature Min
90.912
48
0.000
Humidity Avg
115.662
52
0.000
Wind Speed
44.102
28
0.027
Legend: (-) not significant.
Location and background noise perception at each measurement point were compared with the weather
measurements and the results are shown in Tab. 3.
2
Tab. 3 Chi-squared (χ ) results from location and background noise perception vs weather data at each
measurement point
Variable 1
(perceived)
What do you think about the
current location?
How do you feel about the
background noise in this
place?
Point A (N=40)
Point B (N=34)
Point E (N=43)
Variable 2
(measured)
Chi2
df
Sig.
Chi2
df
Sig.
Chi2
df
Sig.
Temperature Avg
60.244
33
0.003
-
-
-
-
-
-
Temperature Max
60.244
33
0.003
-
-
-
-
-
-
Temperature Min
59.144
30
0.001
-
-
-
-
-
-
Humidity Avg
Temperature Avg
Temperature Max
Temperature Min
Humidity Avg
Wind Speed
60.244
-
33
-
0.003
-
38.518
38.518
38.518
38.518
18
18
18
18
0.003
0.003
0.003
0.003
61.986
60.137
61.896
61.896
-
36
33
36
36
-
0.005
0.003
0.005
0.005
-
Legend: (-) not significant.
Point F has no significant values between measured weather conditions and location perception, as well as
background noise perception.
2
Measured minimum temperature, at point A, is the parameter that has lower χ value on the perception about
2
the current location, with 59.144; and maximum temperature, at point E, has lower χ value on the perception of
background noise, with 60.137.
The weather perception has also influence from demographic and cultural background, specifically nationality,
as shown in Tab. 4. The sample was composed by 34 Germans, three Chileans, two Brazilians, one Syrian, one
�ICUC9 - 9th International Conference on Urban Climate jointly with 12th Symposium on the Urban Environment
South Korean, one Finnish, one Croatian and one Chinese. Cramer’s V analysis shows a distinct association
between the nationality of participant and the general description of the weather, as well as perception of wind
speed (comfort).
Tab. 4 Cramer’s V between demographics and weather perception
Variable 1
Variable 2
General
Chi2
df
Sig.
Cramer’s V
Sig.
How do you generally describe the weather today?
Nationality
34.980
21
0.028
0.515
0.028
How do you feel about the wind speed today? (comfort)
Nationality
61.766
28
0.000
0.592
0.000
Legend: For Cramer’s V (<0.4) weak correlation; (>0.4 to <0.5) moderate correlation; (> 0.5) strong correlation.
4. Conclusion
This study reported the influence of the urban climate on environmental perception through soundwalks. It can
be concluded that:
1. The perception of wind speed is negatively correlated with general perceived weather condition, overall
preference of current location, and background noise.
2. It was observed that when humidity average decreased, weather and temperature description were better
ranked.
3. When (average and minimum) temperature increases, participants tend to perceive the general weather
condition much more positively.
4. When participants related positive responses to sun feeling than perceived weather and temperature had
also positive responses. And this type of correlation was strong.
5. When the background noise was perceived positively, the overall location perception also tends to be
positive.
6. The wind feeling (comfort) depends on temperature (average, maximum and minimum) and humidity
average more than wind speed at all.
7. Weather perception has also influence from demographic and cultural background, like nationality.
Acknowledgment
The authors thank the Coordenação de Aperfeiçoamento de Pessoal de Nível Superior / Programa Ciências
sem Fronteiras (CAPES – Brazil’s National Coordination of Personal Improvement on Superior Level / Science
Without Borders Program), the Deutscher Akademischer Austauschdienst (DAAD – German Academic Exchange
Service) and the Excellence Initiative of the German federal and state governments for financing scholarships,
equipment and software programs used in this research. The authors are also indebted to Michael Vorländer,
Guido Irineu Engel, Zhao (Ellen) Peng, Martin Guski, Fanyu Meng, Samira Mohamady, Jonas Stienen, Bastian
Paas, Isabell Maras, Teresa Schmidt, Stanimira Markova, Lars Schneider and Rolf Kaldenbach for their technical
support rendered during this research.
References
Urban Future Outine (UFO), 2015: <http://www.humtec.rwth-aachen.de/index.php?article_id=881&clang=1>
Project House Humtec, 2015: <http://www.humtec.rwth-aachen.de/index.php?article_id=1&clang=1>
International Standard – ISO/DIS 12913-1, 2014: Acoustics – Soundscape – Part 1: Definition and conceptual framework.
Genève, Switzerland.
International Standard – NWIP/ISO 12913-2(3), 2014: Acoustics – Soundscape – Part 2(3): Methods and measurements in
soundscape studies (Draft). Genève, Switzerland.
Jenninngs, P., Cain, R., 2013: A framework for improving urban soundscapes. Applied Acoustics, 74, 293-299.
Schafer, R.M, 1969: The new soundscape. Scarborough, Ont and New York, US: Berandol Music and Associated Music
Publishers.
Semidor, C., 2006: Listening to the city with the soundwalk method. Acta Acustica united with Acustica, 96 (6), 959-964.
�
 Margret Engel
 Christoph Schneider