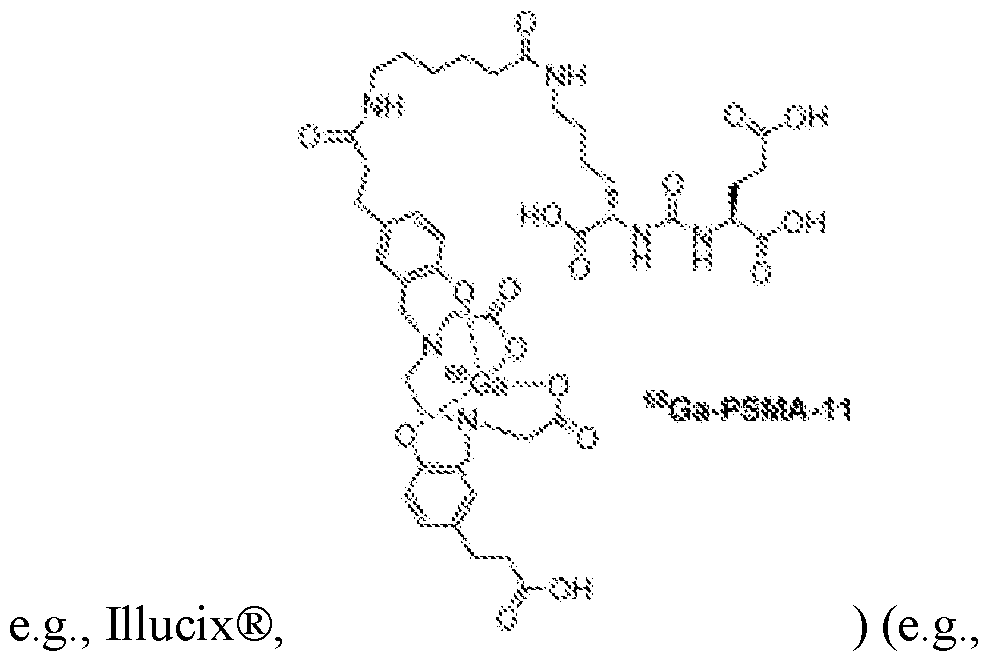
Attorney Docket No.2010358-0329 SYSTEMS AND METHODS FOR AUTOMATED CANCER STAGING AND RISK PREDICTION CROSS-REFERENCE TO RELATED APPLICATIONS [0001] This application claims priority to and benefit from U.S. Provisional Application 63/654,279, filed May 31, 2024, U.S. Non-Provisional Application No. 18/667,972, filed May 17, 2024, U.S. Provisional Application 63/606,794, filed December 6, 2023, and U.S. Provisional Application No.63/540,339, filed September 25, 2023, the content of each of which is incorporated by reference herein in their entirety. This application also claims priority to and benefit from U.S. Application No.18/667,945, filed May 17, 2024 and U.S. Provisional Application No.63/606,824, filed December 6, 2023, the content of which is hereby incorporated by reference in its entirety. This application is related to U.S. Provisional Application No.63/350,211, filed June 8, 2022, U.S. Provisional Application No.63/458,031, filed on April 7, 2023, U.S. Provisional Application No. 63/461,486, filed on April 24, 2023, and U.S. Patent Application No.18/207,246, filed on June 8, 2023, the contents of each of which are hereby incorporated by reference in their entirety. This application is also related to U.S. Patent Application No.16/734,609, filed January 6, 2020, and U.S. Patent Application No.17/762,796, filed March 23, 2022, the contents of each which are hereby incorporated by reference in their entirety. FIELD [0002] This invention relates generally to systems and methods for creation, analysis, and/or presentation of medical image data. More particularly, in certain embodiments, the invention relates to systems and methods for automated analysis of medical images to identify and/or characterize cancerous lesions and/or prognosis or risk for a subject. BACKGROUND [0003] Prostate-specific membrane antigen (PSMA)-targeted positron emission tomography (PET) has recently been used for staging of patients with prostate cancer. In particular, the PSMA binding agents
68Ga-PSMA-11 (gallium (
68Ga) gozetotide, e.g., Illucix®) and [
18F]DCFPyL (piflufolastat F 18, e.g., PYLARIFY®) were approved by the - 1 - 12297548v2
Attorney Docket No.2010358-0329 U.S. Food and Drug Administration in 2020 and 2021, respectively, and there is a growing body of evidence that supports integration of PSMA-PET into clinical guidelines. [0004] Existing reporting guidelines, and approaches for risk assessment provide frameworks that can guide physicians in their assessment(s) and supply them with a standardized format in which to report their results. Still, assessments made, even within a framework supplied by clinical guidelines, involve time-consuming and error prone manual evaluation of images and leave room for subjective judgement calls that limit reproducibility and leave the door open for human error, inter-operator variability, and the like. [0005] For example, patterns of PSMA expression in the prostate can be characterized from PSMA-PET images using a scoring system referred to as a PRIMARY score, described, for example, in Ceci et al., “The EANM Standardized Reporting Guidelines v1.0 for PSMA- PET,” Eur J Nucl Med Mol Imaging 2021; 48: 1626-38, Seifert et al., “Second Version of the Prostate Cancer Molecular Imaging Standardized Evaluation Framework Including Response Evaluation for Clinical Trials (PROMISE V2),” European Urology 83 (2023) pp.405-412, and Emmet et al., “The PRIMARY Score: Using Intraprostatic 68Ga-PSMA PET/CT Patterns to Optimize Prostate Cancer Diagnosis,” The Journal of Nuclear Medicine 63 (2022) pp.1644-1650, the texts of which are incorporated herein by reference in their entireties. [0006] The PRIMARY score system takes into account uptake locations within the prostate, the peak standardized uptake value (SUV) of uptake regions of interest, the SUV value of the liver and aorta, and the shape of uptakes, and assigns a numerical grade from 1-5, where 1 indicates least intense cancer and 5 indicates most intense cancer. Staging via the PRIMARY score system offers utility across a range of indications including, for example, the staging of high-risk patients, identification and/or prediction of cancer recurrence, estimation of risk of metastases, tracking of disease progression, evaluation of suitability for radioligand therapy, and assessment of efficacy of treatment. [0007] There is a need for systems and methods for more reproducible and standardized reporting of PSMA-PET staging results to support wider integration of PSMA- PET into clinical guidelines. - 2 - 12297548v2
Attorney Docket No.2010358-0329 SUMMARY [0008] Presented herein are systems and methods for accurate and automated cancer staging and/or risk prediction. In certain embodiments, cancer staging and/or risk prediction technologies of the present disclosure utilize machine learning techniques to, for example, accurately identify image features indicative of cancerous lesions, such as hotspots resulting from high-levels of radiopharmaceutical uptake in tumors. Additionally or alternatively, in certain embodiments, systems and methods of the present disclosure include machine learning techniques that generate predictions of how a disease will evolve, such as whether cancer that appears localized has already, or will eventually, metastasize. [0009] For example, in certain embodiments, automated cancer staging technologies presented herein include systems and methods for the automated determination of a prostate cancer staging score (e.g., a PRIMARY score) for a subject. In certain embodiments, the systems and methods employ a machine learning model (e.g., one or more convolutional neural networks, CNNs) to analyze three-dimensional (3D) images obtained via both a functional imaging modality and an anatomical imaging modality. In addition to identifying regions of PSMA binding agent uptake (hotspots), the techniques described herein are able to accurately and automatically associate specific prostate zones to each hotspot and use this information in the determination of the staging score. [0010] Examples of the functional imaging modality include PET, SPECT (single- photon emission computerized tomography), and MRI (magnetic resonance imaging). Examples of the anatomical imaging modality includes computed tomography (CT), X-ray, and MRI. In particular embodiments, a PSMA binding agent is administered to the subject prior to obtaining the functional image (e.g., a 3D PSMA-PET image is obtained). The CT image is used to locate the prostate and/or other organs (e.g., liver and aorta) within the PSMA-PET image, and techniques described herein are used to identify uptake regions (hotspots) and, for each uptake region, identify one or more corresponding prostate zones (e.g., central, fibromuscular, peripheral, transition, and/or ureter zones). The identified and localized hotspots are then used to determine the prostate cancer staging score (e.g., the PRIMARY score) in an automated, reproducible way. [0011] Additionally or alternatively, in certain embodiments the present disclosure provides systems and methods for predicting presence and/or risk of metastases in a subject, based on medical image data that reflects presence of localized disease. In particular, among - 3 - 12297548v2
Attorney Docket No.2010358-0329 other things, metastatic disease prediction technologies of the present disclosure leverage artificial neural networks (ANNs) to analyze image data that is associated with and reflects presence of localized disease, such as images of regions about a single primary tumor and/or one or more lesions confined to a single tissue region or organ, where cancer was first detected. Among other things, technologies described herein make use of the insight that, while such images of localized disease may not include conventional or express hallmarks of metastatic disease, such as presence of hotspots dispersed outside the primary organ and/or tumor, they nonetheless may reflect patterns, features, such as particular intensity patterns and/or hotspot features, etc. that are indicative of (e.g., correlate with) presence and/or risk of metastases. While such patterns and their relationship / implications for whether a particular subject has or will develop metastatic disease may escape conventional image analysis methods and/or review by human professionals, such as physicians, radiologists, and the like, ANN technologies of the present disclosure can be trained and used to generate predictions of whether a subject has or will develop metastases – i.e., one or more cancerous lesions outside of a primary tumor and/or site (e.g., organ or tissue region) where cancer was originally detected. [0012] In one aspect, the invention is directed to a method for automated determination of a prostate cancer staging score for a subject, the method comprising: (a) receiving, by a processor of a computing device, a 3D functional image of the subject (e.g., a 3D PET, SPECT, or MRI scan); (b) determining, by the processor, a prostate volume within the 3D functional image, said prostate volume identifying a region of the 3D functional image corresponding to a prostate of the subject; (c) localizing (e.g., detecting and/or segmenting), by the processor, one or more uptake regions within the 3D functional image, each determined to represent a lesion or potential lesion within the prostate of the subject or a vicinity thereof; (d) determining, by the processor, for each particular uptake region of the one or more uptake regions: (i) values of one or more uptake region intensity metrics, each corresponding to a measure of intensity within and/or characteristic of the particular uptake region [e.g., SUVmax, SUVmean, SUVpeak, etc.; e.g., a lesion index (e.g., a PSMA expression score)]; and (ii) a set of assigned prostate zones identifying, for the particular uptake region, one or more spatial zones (e.g., sub-regions) within or about the prostate of the subject which the particular uptake region is associated with (e.g., within which at least a portion of a lesion or potential lesion represented by the particular uptake region is determined to be likely to be located; e.g., from which radiopharmaceutical uptake and - 4 - 12297548v2
Attorney Docket No.2010358-0329 radiation therefrom is determined to have produced the particular uptake region in the 3D functional image); and (e) determining, by the processor, the prostate cancer staging score based at least in part on (i) the values of the one or more intensity metrics and (ii) the set of assigned prostate zones determined for the one or more uptake regions. [0013] In certain embodiments, the set of assigned prostate zones identified for each of the one or more uptake regions is selected from a set of possible prostate zones, said set of possible prostate zones comprising one or more of (A), (B), and (C) as follows: (A) a central zone surrounding ejaculatory ducts and comprising about 25% of a prostate total mass, (B) a transition zone comprising a portion of the prostate surrounding a urethra, and (C) a peripheral zone situated toward a back of the prostate and comprising a majority of prostate tissue. [0014] In certain embodiments, the set of possible prostate zones further comprises a fibromuscular zone and/or a ureter zone. [0015] In certain embodiments, the one or more uptake regions are hotspots. [0016] In certain embodiments, the 3D functional image is a three-dimensional (3D) positron emission tomography (PET) image of the subject obtained following administration to the subject of a radiopharmaceutical comprising a prostate-specific membrane antigen (PSMA) binding agent. [0017] In certain embodiments, the PSMA binding agent comprises [
18F]DCFPyL. [0018] In certain embodiments, the PSMA binding agent comprises
68Ga-PSMA-11. [0019] In certain embodiments, the one or more uptake region intensity metrics comprise a peak uptake region intensity. [0020] In certain embodiments, the method comprises determining, by the processor, for each particular uptake region of the one or more uptake regions, a corresponding uptake classification label indicative of whether the particular uptake region is focal or diffuse and, at step (e) using the uptake classification labels determined for the one or more uptake regions to determine the prostate cancer staging score. [0021] In certain embodiments, determining the set of assigned prostate zones for each particular uptake region of the one or more uptake regions comprises, (i) sorting a list of prostate zones in descending order starting from a zone in which a peak of the particular - 5 - 12297548v2
Attorney Docket No.2010358-0329 uptake region is located and ending in a zone with a least number voxels of the uptake region, and (ii) identifying whether the uptake region extends outside the prostate. [0022] In certain embodiments, the method comprises localizing, by the processor, within the 3D functional image, a liver volume and/or an aorta volume; and determining, by the processor, one or more liver reference intensities for a liver and/or one or more aorta reference intensities for an aorta, each corresponding to a measure of intensity within and/or characteristic of uptake in the liver volume and/or the aorta volume, respectively. [0023] In certain embodiments, the method comprises determining a lesion index value based on (i) the one or more uptake region intensity metrics and (ii) the one or more uptake intensity metrics for the liver and/or the one or more uptake intensity metrics for the aorta. [0024] In certain embodiments, the method comprises, at step (b): using one or more machine learning module(s) implementing convolutional neural networks (CNNs) to segment a 3D anatomical image (e.g., a CT, X-ray, or MRI image) and generate a 3D segmentation map that identifies a 3D boundary of a prostate representation within the 3D anatomical image; and transferring the 3D segmentation map to the 3D functional image to localize the prostate volume therein. [0025] In certain embodiments, the method comprises, at step (c), localizing the one or more uptake regions within the 3D functional image using one or more machine learning module(s). [0026] In another aspect, the invention is directed to a system for automated determination of a prostate cancer staging score for a subject, the system comprising: a processor of a computing device; and memory having instructions stored thereon, wherein the memory, when executed by the processor, causes the processor to: (a) receive a 3D functional image of the subject (e.g., a 3D PET, SPECT, or MRI scan); (b) determine a prostate volume within the functional image, said prostate volume identifying a region of the 3D functional image corresponding to a prostate of the subject; (c) localize (e.g., detect and/or segment) one or more uptake regions within the 3D functional image, each determined to represent a lesion or potential lesion within the prostate of the subject or a vicinity thereof; (d) determine, for each particular uptake region of the one or more uptake regions: (i) values of one or more uptake region intensity metrics, each corresponding to a measure of intensity within and/or characteristic of the particular uptake region [e.g., SUVmax, SUVmean, SUVpeak, etc.; e.g., - 6 - 12297548v2
Attorney Docket No.2010358-0329 a lesion index (e.g., a PSMA expression score)]; and (ii) a set of assigned prostate zones identifying, for the particular uptake region, one or more spatial zones (e.g., sub-regions) within or about the prostate of the subject which the particular uptake region is associated with (e.g., within which at least a portion of a lesion or potential lesion represented by the particular uptake region is determined to be likely to be located; e.g., from which radiopharmaceutical uptake and radiation therefrom is determined to have produced the particular uptake region in the 3D functional image); and (e) determine the prostate cancer staging score based at least in part on (i) the values of the one or more intensity metrics and (ii) the set of assigned prostate zones determined for the one or more uptake regions. [0027] In certain embodiments, the set of assigned prostate zones identified for each of the one or more uptake regions is selected from a set of possible prostate zones, said set of possible prostate zones comprising one or more of (A), (B), and (C) as follows: (A) a central zone surrounding ejaculatory ducts and comprising about 25% of a prostate total mass, (B) a transition zone comprising a portion of the prostate surrounding a urethra, and (C) a peripheral zone situated toward a back of the prostate and comprising a majority of prostate tissue. [0028] In certain embodiments, the set of possible prostate zones further comprises a fibromuscular zone and/or a ureter zone. [0029] In certain embodiments, the one or more uptake regions are hotspots. [0030] In certain embodiments, the 3D functional image is a three-dimensional (3D) positron emission tomography (PET) image of the subject obtained following administration to the subject of a radiopharmaceutical comprising a prostate-specific membrane antigen (PSMA) binding agent. [0031] In certain embodiments, the instructions cause the processor to, at step (b): use one or more machine learning module(s), implementing convolutional neural networks (CNNs), to segment a 3D anatomical image (e.g., a CT, X-ray, or MRI image) and generate a 3D segmentation map that identifies a 3D boundary of a prostate representation within the 3D anatomical image; and transfer the 3D segmentation map to the 3D functional image to localize the prostate volume therein. [0032] In another aspect, the invention is directed to a method for automated determination of a prostate cancer staging score (e.g., a PRIMARY score) for a subject, the method comprising: (a) receiving, by a processor of a computing device, a first image of the - 7 - 12297548v2
Attorney Docket No.2010358-0329 subject obtained using a functional imaging modality (e.g., a 3D PET, SPECT, or MRI scan) and a second image of the subject obtained using an anatomical imaging modality (e.g., a CT, X-ray, or MRI image) {e.g., receiving a combined 3D PET/CT image (e.g., a PSMA-PET/CT image) that comprises the first image and the second image}; (b) converting, by the processor, the first image into an SUV image whose intensity values correspond to standardized uptake values (SUV), thereby obtaining an SUV-converted first image; (c) localizing, by the processor, volumes of interest (VOIs) in the second image corresponding to one or more organs of the subject (e.g., a prostate, a liver, and an aorta) (e.g., using the second image to obtain one or more organ segmentation masks corresponding to one or more organs of the subject) and determining corresponding organ volumes in the SUV-converted first image (e.g., regions in the SUV-converted first image corresponding to the prostate, the liver, and/or the aorta); (d) localizing, by the processor, in the SUV-converted first image, one or more uptake regions (e.g., hotspots) corresponding to lesions (or potential lesions) in the prostate of the subject and determining, by the processor, values of an SUV uptake metric (e.g., and/or peak intensity value and/or peak intensity location) for each of the one or more uptake regions (e.g., and, optionally, determining, by the processor, whether each said uptake region is focal or diffuse), thereby determining one or more values of the SUV uptake metric; (e) for each of the one or more uptake regions, identifying, by the processor, one or more prostate zones (e.g., central, fibromuscular, peripheral, transition, and/or ureter zones) corresponding to said uptake region (e.g., by fitting a 3D prostate clinical model to the prostate segmentation mask); (f) determining, by the processor, a PSMA expression score using the SUV-converted first image (e.g., comparing a highest uptake peak within the prostate with aorta and/or liver SUV mean values); and (g) determining, by the processor, the prostate cancer staging score (e.g., the PRIMARY score) based at least on (i) the one or more values of the SUV uptake metric, (ii) the prostate zones identified for each of the one or more uptake regions (e.g., and, optionally, the determination of whether each said uptake region is focal or diffuse), and (iii) the PSMA expression score. [0033] In certain embodiments, the first image is a three-dimensional (3D) positron emission tomography (PET) image of the subject obtained following administration to the subject of a radiopharmaceutical comprising a prostate-specific membrane antigen (PSMA) binding agent. - 8 - 12297548v2
Attorney Docket No.2010358-0329 [0034] In certain embodiments, the PSMA binding agent comprises [
18F]DCFPyL (piflufolastat F 18,
wherein the method comprises receiving a combined 3D PSMA-PET/CT image that comprises the first image and the second image). [0035] In certain embodiments, the PSMA binding agent comprises
68Ga-PSMA-11 (gallium (
68Ga) gozetotide,

wherein the method comprises receiving a combined 3D PSMA-PET/CT image that comprises the first image and the second image). [0036] In certain embodiments, the SUV value determined for each of the one or more uptake regions at step (d) is a peak SUV value. [0037] In certain embodiments, the method comprises, determining, by the processor, for each particular uptake region of the one or more uptake regions, a corresponding uptake classification label indicative of whether the particular uptake region is focal or diffuse and, at step (g) using the uptake classification labels determined for the one or more uptake regions to determine the prostate cancer staging score. [0038] In certain embodiments, the one or more prostate zones identified for each of the one or more uptake regions are selected from a (e.g., static, finite) set of (e.g., 10 or fewer, e.g., 5 or fewer) possible prostate zones (e.g., as in an enumerated data type) (e.g., wherein the set of possible prostate zones comprises a central zone, a transition zone, and a peripheral zone; e.g., wherein the set of possible prostate zones comprises a central zone, a transition zone, and a peripheral zone, a fibromuscular zone, and an ureter zone). - 9 - 12297548v2
Attorney Docket No.2010358-0329 [0039] In certain embodiments, identifying the one or more prostate zones (e.g., central, fibromuscular, peripheral, transition, and/or ureter zones) corresponding to each of the one or more uptake regions in the SUV-converted first image comprises, for each uptake region, (i) sorting a list of prostate zones in descending order starting from a zone in which the hotspot peak is located (e.g., location of intensity peak for the uptake region) and ending in a zone with a least number of hotspot voxels, and (ii) identify whether the uptake region extends outside the prostate. [0040] In certain embodiments, the method comprises: localizing, by the processor, within the SUV-converted first image, a liver volume (e.g., corresponding to a liver within the subject) and/or an aorta volume (e.g., corresponding to an aorta, or portion thereof, within the subject) [e.g., the liver volume and/or aorta volume within the SUV-first image corresponding to (e.g., having been localized by mapping, to the SUV-converted first image,) a liver segmentation mask and/or an aorta segmentation mask determined from the second image); and determining, by the processor, a liver reference SUV value and/or an aorta reference SUV value based on SUV values of voxels of the SUV-converted first image within the liver volume and/or the aorta volume, respectively. [0041] In certain embodiments, the method comprises determining the PSMA expression score based on (i) the one or more values of the SUV uptake metric and (ii) the liver reference SUV value and/or the aorta reference SUV value. [0042] In certain embodiments, the method comprises, at step (c), localizing the VOIs in the second image using one or more machine learning module(s) [e.g., one or more convolutional neural networks (CNNs)]. [0043] In certain embodiments, the method comprises, at step (d), localizing the one or more uptake regions in the SUV-converted first image using one or more machine learning module(s) (e.g., one or more CNNs). [0044] In another aspect, the invention is directed to a method for automated determination of a prostate cancer staging score (e.g., a PRIMARY score) for a subject, the method comprising: (a) receiving, by a processor of a computing device, data comprising a first image of the subject obtained using a functional imaging modality (e.g., a 3D PET, SPECT, or MRI scan) and a second image of the subject obtained using an anatomical imaging modality (e.g., a CT, X-ray, or MRI image) {e.g., receiving a combined 3D PET/CT image (e.g., a PSMA-PET/CT image) that comprises the first image and the second image}; - 10 - 12297548v2
Attorney Docket No.2010358-0329 (b) using the received data to localize, by the processor, one or more uptake regions (e.g., hotspots) in the first image (e.g., an SUV-converted first image) corresponding to lesions (or potential lesions) in the prostate and to identify one or more prostate zones (e.g., central, fibromuscular, peripheral, transition, and/or ureter zones) corresponding to each said uptake region (e.g., by fitting a 3D prostate clinical model to the prostate segmentation mask); and (c) determining, by the processor, the prostate cancer staging score (e.g., the PRIMARY score) based at least on the localized one or more uptake regions and their identified prostate zones. [0045] In certain embodiments, the first image is a three-dimensional (3D) positron emission tomography (PET) image of the subject obtained following administration to the subject of a radiopharmaceutical comprising a prostate-specific membrane antigen (PSMA) binding agent. [0046] In certain embodiments, the PSMA binding agent comprises [18F]DCFPyL (piflufolastat F 18,

wherein the method comprises receiving a combined 3D PSMA-PET/CT image that comprises the first image and the second image). [0047] In certain embodiments, the PSMA binding agent comprises 68Ga-PSMA-11 (gallium (68Ga) gozetotide,
wherein the method comprises receiving a combined 3D PSMA-PET/CT image that comprises the first image and the second image). - 11 - 12297548v2
Attorney Docket No.2010358-0329 [0048] In certain embodiments, the method comprises, at step (b), localizing the one or more uptake regions in the first image using one or more machine learning module(s) (e.g., one or more CNNs). [0049] In another aspect, the invention is directed to a system for automated determination of a prostate cancer staging score (e.g., a PRIMARY score) for a subject, the system comprising: a processor of a computing device; and memory having instructions stored thereon, wherein the memory, when executed by the processor, causes the processor to: (a) receive a first image of the subject obtained using a functional imaging modality (e.g., a 3D PET, SPECT, or MRI scan) and a second image of the subject obtained using an anatomical imaging modality (e.g., a CT, X-ray, or MRI image) {e.g., receiving a combined 3D PET/CT image (e.g., a PSMA-PET/CT image) that comprises the first image and the second image}; (b) convert the first image into an SUV image whose intensity values correspond to standardized uptake values (SUV), thereby obtaining an SUV-converted first image; (c) localize volumes of interest (VOIs) in the second image corresponding to one or more organs of the subject (e.g., a prostate, a liver, and an aorta) (e.g., using the second image to obtain one or more organ segmentation masks corresponding to one or more organs of the subject) and determining corresponding organ volumes in the SUV-converted first image (e.g., regions in the SUV-converted first image corresponding to the prostate, the liver, and/or the aorta); (d) localize, in the SUV-converted first image, one or more uptake regions (e.g., hotspots) corresponding to lesions (or potential lesions) in the prostate of the subject and determining, by the processor, values of an SUV uptake metric (e.g., and/or peak intensity value and/or peak intensity location) for each of the one or more uptake regions (e.g., and, optionally, determining, by the processor, whether each said uptake region is focal or diffuse), thereby determining one or more values of the SUV uptake metric; (e) for each of the one or more uptake regions, identify one or more prostate zones (e.g., central, fibromuscular, peripheral, transition, and/or ureter zones) corresponding to said uptake region (e.g., by fitting a 3D prostate clinical model to the prostate segmentation mask); (f) determine a PSMA expression score using the SUV-converted first image (e.g., comparing a highest uptake peak within the prostate with aorta and/or liver SUV mean values); and (g) determine the prostate cancer staging score (e.g., the PRIMARY score) based at least on (i) the one or more values of the SUV uptake metric, (ii) the prostate zones identified for each of the one or more uptake regions (e.g., and, optionally, the determination of whether each said uptake region is focal or diffuse), and (iii) the PSMA expression score. - 12 - 12297548v2
Attorney Docket No.2010358-0329 [0050] In another aspect, the invention is directed to a system for automated determination of a prostate cancer staging score (e.g., a PRIMARY score) for a subject, the system comprising: a processor of a computing device; and memory having instructions stored thereon, wherein the memory, when executed by the processor, causes the processor to: (a) receive data comprising a first image of the subject obtained using a functional imaging modality (e.g., a 3D PET, SPECT, or MRI scan) and a second image of the subject obtained using an anatomical imaging modality (e.g., a CT, X-ray, or MRI image) {e.g., receiving a combined 3D PET/CT image (e.g., a PSMA-PET/CT image) that comprises the first image and the second image};(b) use the received data to localize one or more uptake regions (e.g., hotspots) in the first image (e.g., an SUV-converted first image) corresponding to lesions (or potential lesions) in the prostate and to identify one or more prostate zones (e.g., central, fibromuscular, peripheral, transition, and/or ureter zones) corresponding to each said uptake region (e.g., by fitting a 3D prostate clinical model to the prostate segmentation mask); and (c) determine the prostate cancer staging score (e.g., the PRIMARY score) based at least on the localized one or more uptake regions and their identified prostate zones. [0051] In another aspect, the invention is directed to a method for automatically processing one or more medical images of a subject and using the processed image(s) to automatically predict a presence and/or a risk of metastases, the method comprising: (a) receiving, by a processor of a computing device, one or more medical images of a prostate of the subject, wherein the one or more medical image(s) comprise a 3D functional image acquired following administration to the subject of an imaging agent; (b) automatically identifying, by the processor, within the 3D functional image, a prostate volume corresponding to the prostate of the subject; (c) automatically identifying, by the processor, one or more hotspots within the prostate volume, (e.g., said one or more hotspots corresponding to localized regions of high intensity relative to their surroundings and representing lesions or potential lesions within the subject); and (d) predicting, by the processor, using a neural network, (i) a presence of metastases in the subject, and/or (ii) a risk of metastases in the subject, said predicting based at least in part on the automatically identified prostate volume and the automatically identified one or more hotspot(s) within the prostate volume, wherein the neural network receives at least two channels of input, the at least two channels of input comprising: (A) a prostate intensity channel comprising intensities of voxels located within the prostate volume [e.g., a cuboid image region comprising a segmented prostate volume (e.g., and a small buffer about the segmented prostate, e.g., - 13 - 12297548v2
Attorney Docket No.2010358-0329 approximately 1, 5, 10, 25 voxels; e.g., approximately 1 mm, 2 mm, 5 mm, 10 mm)]; and (B) a hotspot mask channel comprising a mask identifying the one or more hotspots [e.g., the hotspot mask channel comprising a hotspot mask/map cropped (e.g., intersected with) a cuboid region of a same size as the prostate intensity channel]. [0052] In certain embodiments, the one or more medical images comprise a 3D anatomical image (e.g., a CT image) and a 3D functional image (e.g., a PET image). [0053] In certain embodiments, the one or more medical images comprise a PET image and/or a PET/CT image [e.g., obtained following administration to a subject of an imaging agent comprising PSMA binding agent (e.g., PyL)]. [0054] In certain embodiments, the one or more medical images are obtained within six (6) months or less (e.g., three months or less) from an initial diagnosis and/or pathological assessment. [0055] In certain embodiments, the one or more medical images are obtained prior to treatment. [0056] In certain embodiments, the one or more medical images are localized around the prostate volume [e.g., comprising a pelvic region (e.g., having been acquired at a single bed position); e.g., and wherein the one or more medical images are or comprise one or more SPECT and/or SPECT/CT images (e.g., having been obtained following administration to the subject of a PSMA binding agent)]. [0057] In certain embodiments, the one or more medical images comprise a 3D anatomical image co-aligned with the 3D functional image, and wherein step (b) comprises identifying an anatomical volume of interest (VOI) representing a prostate within the 3D anatomical image and using the anatomical VOI to identify the prostate volume within the functional image. [0058] In certain embodiments, the method comprises using a first machine learning model (e.g., an anatomical segmentation model) to (i) identify the prostate volume within the 3D functional image and/or (ii) identify the anatomical VOI within the 3D anatomical image. [0059] In certain embodiments, the method comprises using a second machine learning model to automatically identify the one or more hotspots. [0060] In certain embodiments, the neural network does not receive, as input, intensities of voxels located outside the prostate volume of the image(s) [e.g., outside a - 14 - 12297548v2
Attorney Docket No.2010358-0329 cuboid image region comprising a segmented prostate volume (e.g., and a small buffer about the segmented prostate, e.g., approximately 1, 5, 10, 25 voxels; e.g., approximately 1 mm, 2 mm, 5 mm, 10 mm)]. [0061] In certain embodiments, the neural network generates, as output, a likelihood value representing a likelihood (e.g., as determined by the neural network) that a subject has or will develop metastases [e.g., a risk that the subject has synchronous metastases, and/or a risk that the subject will develop metachronous metastases (e.g., six months or more following a time at which the one or more medical images were obtained; e.g., following curative intent therapy (e.g., surgery, chemotherapy, radiation, or combinations thereof))]. [0062] In certain embodiments, step (d) comprises using one or more measured features (e.g., PSA score, pathologic grade, percent positive cores, uptake peak value) (e.g., as input, alongside neural network output, to a classifier) to predict presence and/or risk of metastases in the subject. [0063] In certain embodiments, step (d) comprises using one or more computed features (e.g., a PRIMARY score, and/or a PSMA expression score) (e.g., as input, alongside neural network output, to a classifier) to predict presence and/or risk of metastases in the subject [0064] In certain embodiments, the one or more medical images are or comprise one or more 3D functional images acquired following administration to a subject of an imaging agent. [0065] In certain embodiments, the imaging agent is or comprises a PSMA binding agent (e.g., PyL; e.g., PSMA-11). [0066] In certain embodiments, the medical images do not include any graphical representation(s) of metastases outside the prostate volume [e.g., no representations of suspect regions (e.g., graphical representations of potential lesions (e.g., hotspots)) outside of the prostate volume]. [0067] In certain embodiments, the method comprises, at step (d), predicting a risk of metastases (e.g., a risk that the subject will develop metachronous metastases). [0068] In certain embodiments, the method comprises, at step (d), predicting a presence of metastases (e.g., predicting a presence of synchronous metastases). - 15 - 12297548v2
Attorney Docket No.2010358-0329 [0069] In certain embodiments, the neural network is a trained neural network, having been trained [e.g., to generate, as output, a metastases score representing the prediction of (i) the presence of metastases (e.g., the presence of synchronous metastases) in the subject and/or (ii) the risk of metastases (e.g., the risk of metachronous metastases)] using a plurality of example images each obtained from a particular patient and comprising a graphical representation of suspect regions within a prostate region of the particular subject, said plurality of example images comprising: (A) a plurality of positive example images obtained for subjects known to have (e.g., synchronous) metastases; and (B) a plurality of negative example images obtained for subjects having localized disease (e.g., without metastases). [0070] In certain embodiments, the plurality of positive example images are images obtained for subjects having synchronous metastases and wherein step (d) comprises using the neural network to predict the risk of metastases (e.g., metachronous metastases) for the subject. [0071] In certain embodiments, the subject is or has been determined to have localized prostate cancer, with observable lesions {e.g., as determined via pathological assessment; e.g., as determined based on analysis of the one or more medical images [e.g., and identification of one or more suspect regions meeting one or more criteria (e.g., having a minimum size, intensity, etc.)]} confined to a primary tumor volume comprising (e.g., and/or about) the prostate of the subject [e.g., comprising the prostate and a surrounding buffer/margin (e.g., approximately 1, 5, 10, 25 voxels; e.g., approximately 1 mm, 2 mm, 5 mm, 10 mm)] and wherein step (d) comprises predicting, as the risk of metastases, a likelihood that the subject will develop one or more observable lesions outside the primary tumor volume (e.g., outside the prostate and/or its surrounding buffer/margin) (e.g., thereby generating a quantitative prediction of risk that the localized disease will develop into metastatic disease). [0072] In certain embodiments, step (c) comprises automatically identifying the one or more hotspot(s) within the prostate volume (e.g., and/or the surrounding buffer/margin), but not identifying any hotspot(s) outside of the prostate volume and/or a surrounding buffer/margin. [0073] In certain embodiments, no hotspot(s) are identified outside of the prostate volume (e.g., and/or a surrounding buffer/margin thereof). - 16 - 12297548v2
Attorney Docket No.2010358-0329 [0074] In certain embodiments, step (d) comprises generating, by the neural network, (e.g., as the likelihood that the subject will develop one or more observable lesions outside the primary tumor volume) a likelihood value representing a risk that lesions will spread outside the primary tumor region (e.g., outside the prostate), within a particular period of time [e.g., within 6 months (synchronous metastasis) or e.g., after greater than 6 months (metachronous metastasis)]. [0075] In certain embodiments, step (d) comprises predicting a risk that the subject will develop metachronous metastases. [0076] In certain embodiments, the method comprises, at step (d), predicting a presence of metastases in or involving local lymph in the subject. [0077] In certain embodiments, the method comprises, at step (d) predicting a risk of metastases in or involving local lymph for the subject. [0078] In certain embodiments, the method comprises, at step (d), predicting a presence of metastases of one or more molecular imaging TNM (miTNM) lesion type classes in the subject. [0079] In certain embodiments, the method comprises predicting a presence of distant lymph node metastases (miMa) in the subject. [0080] In certain embodiments, the method comprises predicting a presence of one or more particular sub-classes of distant lymph node metastases (miMa) in the subject, said sub- classes of distant lymph metastases (miMa) selected from the group consisting of retroperitoneal (RP), supradiaphragmatic (SD), and other extrapelvic (OE). [0081] In certain embodiments, the method comprises, at step (d), predicting a risk of metastases of one or more molecular imaging TNM (miTNM) lesion type classes for the subject. [0082] In certain embodiments, the method comprises predicting a risk of distant lymph node metastases (miMa) for the subject. [0083] In certain embodiments, the method comprises predicting a risk of one or more particular sub-classes of distant lymph node metastases (miMa) for the subject, said sub-classes of distant lymph metastases (miMa) selected from the group consisting of retroperitoneal (RP), supradiaphragmatic (SD), and other extrapelvic (OE). - 17 - 12297548v2
Attorney Docket No.2010358-0329 [0084] In another aspect, the invention is directed to a system for automatically processing one or more medical images (e.g., 3D images) of a subject and using the processed image(s) to automatically predict a presence and/or a risk of metastases (e.g., to automatically predict whether localized disease has developed or will develop into metastatic cancer), the system comprising: a processor of a computing device; and memory having instructions stored thereon, wherein the instructions, when executed by the processor, cause the processor to: (a) automatically identify, within a 3D functional image acquired following administration to the subject or an imaging agent, a prostate volume corresponding to a prostate of the subject; (b) automatically identify one or more hotspots within the prostate volume, (e.g., said one or more hotspots corresponding to localized regions of high intensity relative to their surroundings and representing lesions or potential lesions within the subject); and (c) predict, using a neural network, (i) a presence of metastases in the subject, and/or (ii) a risk of metastases in the subject, said predicting based at least in part on the automatically identified prostate volume and the automatically identified one or more hotspots within the prostate volume, wherein the neural network receives at least two channels of input, the at least two channels of input comprising: (A) a prostate intensity channel comprising intensities of voxels located within the prostate volume; and (B) a hotspot mask channel comprising a mask identifying the one or more hotspots. [0085] In another aspect, the invention is directed to a method for automatically processing medical images of a subject presenting with localized prostate cancer and using the processed image(s) to automatically predict a risk that the subject will develop metastases, the method comprising: (a) receiving, by a processor of a computing device, a medical image of the subject, comprising a graphical representation of a prostate of the subject; (b) automatically identifying, by the processor, within the medical image, a prostate volume corresponding to a prostate of the subject; (c) automatically identifying, by the processor, one or more hotspots within the prostate volume (e.g., said one or more hotspots corresponding to localized regions of high intensity relative to their surroundings and representing lesions or potential lesions within the subject); and (d) predicting, by the processor, using a neural network, a risk of metastases in the subject based at least in part on the prostate volume and the automatically identified one or more hotspots within the prostate volume, wherein the neural network is a trained neural network, having been trained using a plurality of example images each obtained from a particular individual and comprising a graphical representation of hotspots within a prostate region of the particular subject, said - 18 - 12297548v2
Attorney Docket No.2010358-0329 plurality of example images comprising: (A) a plurality of positive example images obtained for individuals having synchronous metastases; and (B) a plurality of negative example images obtained for individuals having localized disease. [0086] In certain embodiments, the subject is or has been determined to have localized prostate cancer, with observable lesions confined to a primary tumor volume comprising and/or about the prostate of the subject and wherein step (d) comprises predicting, as the risk of metastases, a likelihood that the subject will develop one or more observable lesions outside the primary tumor volume. [0087] In certain embodiments, step (c) comprises automatically identifying the one or more hotspot(s) within the prostate volume, but not identifying any hotspot(s) outside of the prostate volume and/or a surrounding buffer/margin. [0088] In certain embodiments, no hotspot(s) are identified outside of the prostate volume. [0089] In certain embodiments, step (d) comprises generating, by the neural network, a likelihood value representing a risk that lesions will spread outside the prostate region within a particular period of time. [0090] In certain embodiments, the neural network receives at least two channels of input, the at least two channels of input comprising: (A) a prostate intensity channel comprising intensities of voxels located within the prostate volume of the image(s) corresponding to the prostate; and (B) a hotspot mask channel comprising a mask identifying the one or more hotspot(s). [0091] In another aspect, the invention is directed to a system for automatically processing medical images of a subject presenting with localized prostate cancer and using the processed image(s) to automatically predict a risk that the subject will develop metastases, the system comprising: a processor of a computing device; and memory having instructions stored thereon, wherein the instructions, when executed by the processor, cause the processor to: (a) receiving, by a processor of a computing device, a medical image of the subject, comprising a graphical representation of a prostate of the subject; (b) automatically identifying, by the processor, within the medical image, a prostate volume corresponding to a prostate of the subject; (c) automatically identifying, by the processor, one or more hotspots within the prostate volume, said one or more hotspots corresponding to localized regions of high intensity relative to their surroundings and representing lesions or potential lesions - 19 - 12297548v2
Attorney Docket No.2010358-0329 within the subject; and (d) predicting, by the processor, using a neural network, a risk of metastases in the subject based at least in part on the prostate volume and the automatically identified one or more hotspots within the prostate volume, wherein the neural network is a trained neural network, having been trained using a plurality of example images each obtained from a particular individual and comprising a graphical representation of hotspots within a prostate region of the particular subject, said plurality of example images comprising: (A) a plurality of positive example images obtained for individuals having synchronous metastases; and (B) a plurality of negative example images obtained for individuals having localized disease. [0092] In another aspect, the invention is directed to a method for automatically processing one or more medical images (e.g., 3D images) of a subject and using the processed image(s) to automatically predict presence and/or risk of metastases (e.g., to automatically predict whether localized disease has developed or will develop into metastatic cancer), the method comprising: (a) receiving, by a processor of a computing device, one or more medical images of a primary tumor region of the subject {e.g., a PET/CT image obtained with a PSMA targeted imaging agent, e.g., [F18]DCFPyL (PyL)}; (b) automatically identifying, by the processor, a volume of the image(s) corresponding the primary tumor region within the subject (e.g., segmenting a volume representing the primary tumor region); (c) automatically identifying, by the processor, one or more suspect regions (e.g., hotspots) within the volume corresponding to the primary tumor region; and (d) predicting, by the processor, using a neural network (e.g., a convolutional neural network) (e.g., wherein both the automatically identified primary tumor volume and the automatically identified hotspots are used as inputs of the neural network), (i) a presence of metastases in the subject (e.g., the presence of synchronous metastases) (e.g., predicting whether localized disease has developed into metastatic cancer), and/or (ii) a risk of metastases (e.g., the risk of metachronous metastases) (e.g., predicting whether localized disease will develop into metastatic cancer). [0093] In certain embodiments, the primary tumor region is or comprises one or more organs of the subject (e.g., one or both breasts of the subject; e.g., a colon of the subject; e.g., an esophagus of the subject; e.g., one or both lungs of the subject; e.g., one or both ovaries of the subject; e.g., a pancreas of the subject). [0094] In certain embodiments, the method comprises, at step (d), predicting a presence of metastases in or involving local lymph in the subject. - 20 - 12297548v2
Attorney Docket No.2010358-0329 [0095] In certain embodiments, the method comprises, at step (d) predicting a risk of metastases in or involving local lymph for the subject. [0096] In certain embodiments, the method comprises, at step (d), predicting presence of metastases of one or more molecular imaging TNM (miTNM) lesion type classes. [0097] In certain embodiments, the method comprises predicting presence of distant lymph node metastases (miMa) in the subject. [0098] In certain embodiments, the method comprises predicting presence of one or more particular sub-classes of distant lymph node metastases (miMa) in the subject, said sub- classes of distant lymph node metastases (miMa) selected from the group consisting of retroperitoneal (RP), supradiaphragmatic (SD), and other extrapelvic (OE). [0099] In certain embodiments, the method comprises, at step (d), predicting risk of metastases of one or more molecular imaging TNM (miTNM) lesion type classes for the subject. [0100] In certain embodiments, the method comprises predicting risk of distant lymph node metastases (miMa) for the subject. [0101] In certain embodiments, the method comprises predicting risk of one or more particular sub-classes of distant lymph node metastases (miMa) for the subject, said sub- classes of distant lymph node metastases (miMa) selected from the group consisting of retroperitoneal (RP), supradiaphragmatic (SD), and other extrapelvic (OE). [0102] In another aspect, the invention is directed to a system for automatically processing one or more medical images (e.g., 3D images) of a subject and using the processed image(s) to automatically predict presence and/or risk of metastases (e.g., to automatically predict whether localized disease has developed or will develop into metastatic cancer), the system comprising: a processor of a computing device; and memory having instructions stored thereon, wherein the instructions, when executed by the processor, cause the processor to: (a) receive one or more medical images of a primary tumor region of the subject {e.g., a PET/CT image obtained with a PSMA targeted imaging agent, e.g., [F18]DCFPyL (PyL)}; (b) automatically identify a volume of the image(s) corresponding the primary tumor region within the subject (e.g., segmenting a volume representing the primary tumor region); (c) automatically identify one or more suspect regions (e.g., hotspots) within volume corresponding to the primary tumor region; and (d) predict, using a neural network - 21 - 12297548v2
Attorney Docket No.2010358-0329 (e.g., a convolutional neural network) (e.g., wherein both the automatically identified primary tumor volume and the automatically identified hotspots are used as inputs of the neural network), (i) presence of metastases in the subject (e.g., predicting whether localized disease has developed into metastatic cancer), and/or (ii) a risk of metastases (e.g., predicting whether localized disease will develop into metastatic cancer). [0103] In certain embodiments, the primary tumor region is or comprises one or more organs of the subject (e.g., one or both breasts of the subject; e.g., a colon of the subject; e.g., an esophagus of the subject; e.g., one or both lungs of the subject; e.g., one or both ovaries of the subject; e.g., a pancreas of the subject). [0104] In certain embodiments, at step (d), the instructions cause the processor to predict a presence of metastases in or involving local lymph in the subject. [0105] In certain embodiments, at step (d), the instructions cause the processor to predict a risk of metastases in or involving local lymph for the subject. [0106] In certain embodiments, at step (d), the instructions cause the processor to predict presence of metastases of one or more molecular imaging TNM (miTNM) lesion type classes. [0107] In certain embodiments, the instructions cause the processor to predict presence of distant lymph node metastases (miMa) in the subject. [0108] In certain embodiments, the instructions cause the processor to predict presence of one or more particular sub-classes of distant lymph node metastases (miMa) in the subject, said sub-classes of distant lymph node metastases (miMa) selected from the group consisting of retroperitoneal (RP), supradiaphragmatic (SD), and other extrapelvic (OE). [0109] In certain embodiments, at step (d), the instructions cause the processor to predict risk of metastases of one or more molecular imaging TNM (miTNM) lesion type classes for the subject. [0110] In certain embodiments, the instructions cause the processor to predict risk of distant lymph node metastases (miMa) for the subject. [0111] In certain embodiments, the instructions cause the processor to predict risk of one or more particular sub-classes of distant lymph node metastases (miMa) for the subject, - 22 - 12297548v2
Attorney Docket No.2010358-0329 said sub-classes of distant lymph node metastases (miMa) selected from the group consisting of retroperitoneal (RP), supradiaphragmatic (SD), and other extrapelvic (OE). [0112] In another aspect, the invention is directed to a method for automatically processing one or more medical images (e.g., 3D images) of a subject and using the processed image(s) to automatically predict a presence and/or a risk of metastases (e.g., to automatically predict whether a localized disease has developed or will develop into metastatic cancer), the method comprising: (a) receiving, by a processor of a computing device, one or more medical images of a prostate of the subject {e.g., a PET/CT image obtained with a PSMA targeted imaging agent, e.g., [F18]DCFPyL (PyL)}; (b) automatically identifying, by the processor, a prostate volume of the image(s) corresponding to the prostate of the subject (e.g., segmenting the prostate); (c) automatically identifying, by the processor, one or more suspect regions (e.g., hotspots) within the prostate volume; and (d) predicting, by the processor, using a neural network (e.g., a convolutional neural network) (e.g., wherein both the automatically identified prostate volume and the automatically identified hotspots are used as inputs of the neural network), (i) a presence of metastases in the subject (e.g., predicting whether localized disease has developed into metastatic cancer), and/or (ii) a risk of metastases in the subject (e.g., predicting whether localized disease will develop into metastatic cancer), said predicting based at least in part on the automatically identified prostate and the automatically identified one or more suspect regions. [0113] In another aspect, the invention is directed to a system for automatically processing one or more medical images (e.g., 3D images) of a subject and using the processed image(s) to automatically predict a presence and/or a risk of metastases (e.g., to automatically predict whether a localized disease has developed or will develop into metastatic cancer), the system comprising: a processor of a computing device; and memory having instructions stored thereon, wherein the instructions, when executed by the processor, cause the processor to: (a) automatically identify a prostate volume of one or more medical image(s) {e.g., a PET/CT image obtained with a PSMA targeted imaging agent, e.g., [F18]DCFPyL (PyL)}, said automatically identified prostate volume corresponding to a prostate of a subject (e.g., segmenting the prostate); (b) automatically identify one or more suspect regions (e.g., hotspots) within the prostate; and (c) predict, using a neural network (e.g., a convolutional neural network) (e.g., wherein both the automatically identified prostate volume and the automatically identified hotspots are used as inputs of the neural network), (i) a presence of metastases in the subject (e.g., predicting whether localized disease has - 23 - 12297548v2
Attorney Docket No.2010358-0329 developed into metastatic cancer), and/or (ii) a risk of metastases in the subject (e.g., predicting whether localized disease will develop into metastatic cancer), said predicting based at least in part on the automatically identified prostate volume and the automatically identified one or more suspect regions. [0114] Features of embodiments described with respect to one aspect of the invention may be applied with respect to another aspect of the invention. BRIEF DESCRIPTION OF THE DRAWING [0115] The foregoing and other objects, aspects, features, and advantages of the present disclosure will become more apparent and better understood by referring to the following description taken in conjunction with the accompanying drawing, in which: [0116] FIG.1 is an image cube (e.g., a set of PET images) showing a prostate, cropped from a full-size PET image, and indicating a number of slices in every dimension, according to an illustrative embodiment. [0117] FIG.2 is a set of three images showing corresponding slices of a CT image, a PET image, and a PET/CT fusion, obtained from a 3D PET/CT scan, according to an illustrative embodiment. [0118] FIG.3 is a diagram illustrating an example process for segmenting an anatomical image and identifying anatomical boundaries in a co-aligned functional image, according to an illustrative embodiment. [0119] FIG.4A is a diagram illustrating an example process for segmenting and classifying hotspots, according to an illustrative embodiment. [0120] FIG.4B is a screenshot of a graphical user interface showing segmented anatomical regions corresponding to arms and a skull of a subject, according to an illustrative embodiment. [0121] FIG.4C is a block flow diagram of an example process for detecting hotspots in a high uptake organ, according to an illustrative embodiment. [0122] FIG.5A is a schematic showing an approach for computing lesion index values, according to an illustrative embodiment. - 24 - 12297548v2
Attorney Docket No.2010358-0329 [0123] FIG.5B is a schematic showing another approach for computing lesion index values, according to an illustrative embodiment. [0124] FIG.6 is a block flow diagram of an example process for automated determination of a prostate cancer staging score, according to an illustrative embodiment. [0125] FIG.7A is a block flow diagram of an example process for determining a machine-learning based metastases prediction via analysis of one or more medical images, according to an illustrative embodiment. [0126] FIG.7B is a block flow diagram illustrating inputs and outputs of a neural network for generating metastases predictions based on image data input channels, according to an illustrative embodiment. [0127] FIG.7C is a block flow diagram illustrating inputs and outputs of a fused model that combines neural network-based analysis of image data with measured and computed subject attributes, such as clinicopathological data, via a classifier to generate metastases predictions, according to an illustrative embodiment. [0128] FIG.8A is a block flow diagram of an example process for determining a machine-learning based metastases prediction via analysis of one or more medical images of localized prostate cancer, according to an illustrative embodiment. [0129] FIG.8B is a block flow diagram illustrating inputs and outputs of a neural network for generating metastases predictions based on prostate image data input channels, according to an illustrative embodiment. [0130] FIG.8C is a block flow diagram illustrating inputs and outputs of a fused model that combines neural network-based analysis of prostate image data with measured and computed patient attributes, such as clinicopathological data, via a classifier to generate metastases predictions, according to an illustrative embodiment. [0131] FIG.9 is a block diagram of an exemplary cloud computing environment, used in certain embodiments. [0132] FIG.10 is a block diagram of an example computing device and an example mobile computing device, used in certain embodiments. [0133] FIG.11 is a block flow diagram of an illustrative method for automated determination of a PRIMARY score for prostate cancer staging, according to an illustrative embodiment. - 25 - 12297548v2
Attorney Docket No.2010358-0329 [0134] FIG.12A is an example image of prostate-located uptake regions (hotspots) that is classified as “diffuse”, according to an illustrative embodiment. [0135] FIG.12B is an example image of prostate-located uptake regions (hotspots) that is classified as “focal”, according to an illustrative embodiment. [0136] FIG.13 is a graphical representation of a three-dimensional (3D) clinical prostate model used to identify one or more zones within the prostate in which each uptake region (hotspot) is located, according to an illustrative embodiment. [0137] FIG.14 is a graphical representation of the clinical prostate model fit to a prostate segmentation mask in the CT image, according to an illustrative embodiment. [0138] FIG.15 is a compilation of images depicting an example automated computation of a PRIMARY score, according to an illustrative embodiment. [0139] FIG.16 is a set of illustrative images showing input channels for a two- channel neural network model, according to an illustrative embodiment. [0140] FIG.17A is a diagram of an example CNN model architecture for performing binary classification, according to an illustrative embodiment. [0141] FIG.17B is a diagram of an example fused model combining a CNN model with patient attributes, according to an illustrative embodiment. [0142] FIG.18A is an example PET image of a prostate region, according to an illustrative embodiment. [0143] FIG.18B is an example 3D hotspot mask, according to an illustrative embodiment. [0144] FIG.18C is image showing the example PET image shown in FIG.18A overlaid with the hotspot mask shown in FIG.18B, according to an illustrative embodiment. [0145] FIG.19 is a schematic showing an example process for creation and evaluation of models for predicting metastases, according to an illustrative embodiment. [0146] FIG.20A is an image showing an attention map for an X gradient explainer computed for a CNN model that was trained on, and receives, as input, a single input channel comprising a prostate PET image, according to an illustrative embodiment. [0147] FIG.20B is an image showing the attention map of FIG.20A overlayed on an input PET image, according to an illustrative embodiment. - 26 - 12297548v2
Attorney Docket No.2010358-0329 [0148] FIG.21A is an image showing an attention map for an X gradient explainer computed for a CNN model that was trained on, and receives, as input, two input channels - one comprising a prostate PET image and a second comprising a hotspot mask, according to an illustrative embodiment. [0149] FIG.21B is an image showing a prostate PET image portion used as input to a two-input-channel CNN model, according to an illustrative embodiment. [0150] FIG.21C is an image showing a hotspot mask used as input to a two-input- channel CNN model, according to an illustrative embodiment. [0151] FIG.21D is an image showing the attention map of FIG.21A, the PET image of FIG.21B, and the hotspot mask of FIG.21C overlayed on each other, according to an illustrative embodiment. [0152] FIG.22A is a plot showing receiver operating characteristic (ROC) curves for three metastases prediction models, used in certain embodiments. [0153] FIG.22B is a plot showing precision-recall curves for three metastases prediction models, used in certain embodiments. [0154] FIG.22C is a plot showing receiver operating characteristic (ROC) curves for three metastases prediction models, used in certain embodiments. [0155] FIG.23 is a matrix table showing predictive contributions of various input features, according to an illustrative embodiment. [0156] FIG.24 is a graph showing four box and whisker plots for certain metastases prediction models, according to certain embodiments. [0157] FIG.25 is a graph showing power curves for various sample sizes, according to an illustrative embodiment. [0158] Features and advantages of the present disclosure will become more apparent from the detailed description of certain embodiments that is set forth below, particularly when taken in conjunction with the figures, in which like reference characters identify corresponding elements throughout. In the figures, like reference numbers generally indicate identical, functionally similar, and/or structurally similar elements. - 27 - 12297548v2
Attorney Docket No.2010358-0329 CERTAIN DEFINITIONS [0159] In order for the present disclosure to be more readily understood, certain terms are first defined below. Additional definitions for the following terms and other terms are set forth throughout the specification. [0160] A, an: The articles “a” and “an” are used herein to refer to one or to more than one (i.e., at least one) of the grammatical object of the article. By way of example, “an element” means one element or more than one element. Thus, in this specification and the appended claims, the singular forms “a,” “an,” and “the” include plural references unless the context clearly dictates otherwise. Thus, for example, reference to a pharmaceutical composition comprising “an agent” includes reference to two or more agents. [0161] About, approximately: As used in this application, the terms “about” and “approximately” are used as equivalents. Any numerals used in this application with or without about/approximately are meant to cover any normal fluctuations appreciated by one of ordinary skill in the relevant art. In certain embodiments, the term “approximately” or “about” refers to a range of values that fall within 25%, 20%, 19%, 18%, 17%, 16%, 15%, 14%, 13%, 12%, 11%, 10%, 9%, 8%, 7%, 6%, 5%, 4%, 3%, 2%, 1%, or less in either direction (greater than or less than) of the stated reference value unless otherwise stated or otherwise evident from the context (except where such number would exceed 100% of a possible value). [0162] First, second, etc.: It should be understood that any reference to an element herein using a designation such as "first," "second," and so forth does not limit the quantity or order of those elements, unless such limitation is explicitly stated. Rather, these designations may be used herein as a convenient method of distinguishing between two or more elements or instances of an element. Thus, a reference to first and second elements does not mean that only two elements may be employed or that the first element must precede the second element in some manner. In addition, unless stated otherwise, a set of elements may comprise one or more elements. [0163] Administering: As used herein, “administering” an agent means introducing a substance (e.g., an imaging agent) into a subject. In general, any route of administration may be utilized including, for example, parenteral (e.g., intravenous), oral, topical, subcutaneous, peritoneal, intraarterial, inhalation, vaginal, rectal, nasal, introduction into the cerebrospinal fluid, or instillation into body compartments. - 28 - 12297548v2
Attorney Docket No.2010358-0329 [0164] 3D, three-dimensional: As used herein, “3D” or “three-dimensional” with reference to an “image” means conveying information about three dimensions. A 3D image may be rendered as a dataset in three dimensions and/or may be displayed as a set of two- dimensional representations, or as a three-dimensional representation. In certain embodiments, a 3D image is represented as voxel (e.g., volumetric pixel) data. [0165] Image: As used herein, an “image” – for example, a three-dimensional (3D) image of subject, includes any visual representation, such as a photo, a video frame, streaming video, as well as any electronic, digital or mathematical analogue of a photo (e.g., a digital image), video frame, or streaming video, displayed or stored in memory (e.g., a digital image may, but need not be displayed for visual inspection). Any apparatus described herein, in certain embodiments, includes a display for displaying an image or any other result produced by the processor. Any method described herein, in certain embodiments, includes a step of displaying an image or any other result produced via the method. In certain embodiments, an image is a 3D image, conveying information that varies with position within a 3D volume. Such images may, for example, be represented digitally as a 3D matrix (e.g., a ^^^^ × ^^^^ × ^^^^ matrix) with each voxel of a 3D image represented by an element of a 3D matrix. Other representations are also contemplated and included, for example, a 3D matrix may be reshaped as a vector (e.g., a 1 × ^^^^ size vector, where K is a total number of voxels) by stitching each row or column end to end. Examples of images include, for example, medical images, such as bone-scan images (also referred to as scintigraphy images), computed tomography (CT) images, magnetic resonance images (MRIs), optical images (e.g., bright-field microscopy images, fluorescence images, reflection or transmission images, etc.), positron emission tomography (PET) images, single-photon emission tomography (SPECT) images, ultrasound images, x-ray images, and the like. In certain embodiments, a medical image is or comprises a nuclear medicine image, produced from radiation emitted from within a subject being imaged. In certain embodiments, a medical image is or comprises an anatomical image (e.g., a 3D anatomical image) conveying information regarding location and extent of anatomical structures such as internal organs, bones, soft-tissue, and blood vessels, within a subject. Examples of anatomical images include, without limitation, x-ray images, CT images, MRIs, and ultrasound images. In certain embodiments, a medical image is or comprises a functional image (e.g., a 3D functional image) conveying information relating to physiological activities within specific organs and/or tissue, such as metabolism, blood flow, regional chemical composition, absorption, etc. Examples of functional images - 29 - 12297548v2
Attorney Docket No.2010358-0329 include, without limitation, nuclear medicine images, such as PET images, SPECT images, as well as other functional imaging modalities, such as functional MRI (fMRI), which measures small changes in blood flow for use in assessing brain activity. [0166] Radionuclide: As used herein, “radionuclide” refers to a moiety comprising a radioactive isotope of at least one element. Exemplary suitable radionuclides include but are not limited to those described herein. In some embodiments, a radionuclide is one used in positron emission tomography (PET). In some embodiments, a radionuclide is one used in single-photon emission computed tomography (SPECT). In some embodiments, a non- limiting list of radionuclides includes
99mTc,
111In,
64Cu,
67Ga,
68Ga,
186Re,
188Re,
153Sm,
177Lu,
67Cu,
123I,
124I,
125I,
126I,
131I ,
11C,
13N,
15O,
18F,
153Sm,
166Ho,
177Lu,
149Pm,
90Y,
213Bi,
103Pd,
109Pd,
159Gd,
140La,
198Au,
199Au,
169Yb,
175Yb,
165Dy,
166Dy,
105Rh,
111Ag,
89Zr,
225Ac,
82Rb,
75Br,
76Br,
77Br,
80Br,
80mBr,
82Br,
83Br,
211At and
192Ir. [0167] Radiopharmaceutical: As used herein, the term “radiopharmaceutical” refers to a compound comprising a radionuclide. In certain embodiments, radiopharmaceuticals are used for diagnostic and/or therapeutic purposes. In certain embodiments, radiopharmaceuticals include small molecules that are labeled with one or more radionuclide(s), antibodies that are labeled with one or more radionuclide(s), and antigen-binding portions of antibodies that are labeled with one or more radionuclide(s). [0168] Machine learning module: Certain embodiments described herein make use of (e.g., include) software instructions that include one or more machine learning module(s), also referred to herein as artificial intelligence software. As used herein, the term “machine learning module” refers to a computer implemented process (e.g., function) that implements one or more specific machine learning algorithms in order to determine, for a given input (such as an image (e.g., a 2D image; e.g., a 3D image), dataset, and the like) one or more output values. For example, a machine learning module may receive as input a 3D image of a subject (e.g., a CT image; e.g., an MRI), and for each voxel of the image, determine a value that represents a likelihood that the voxel lies within a region of the 3D image that corresponds to a representation of a particular organ or tissue of the subject. In certain embodiments, two or more machine learning modules may be combined and implemented as a single module and/or a single software application. In certain embodiments, two or more machine learning modules may also be implemented separately, e.g., as separate software applications. A machine learning module may be software and/or hardware. For example, a machine learning module may be implemented entirely as software, or certain functions of a - 30 - 12297548v2
Attorney Docket No.2010358-0329 CNN module may be carried out via specialized hardware (e.g., via an application specific integrated circuit (ASIC)). [0169] Map: As used herein, the term “map” is understood to mean a visual display, or any data representation that may be interpreted for visual display, which contains spatially- correlated information. For example, a three-dimensional map of a given volume may include a dataset of values of a given quantity that varies in three spatial dimensions throughout the volume. A three-dimensional map may be displayed in two-dimensions (e.g., on a two-dimensional screen, or on a two-dimensional printout). [0170] Metachronous metastases: As used herein the term “metachronous metastases” refers to metastases within a patient that are not detected and/or do not appear until after a particular time interval following initial diagnosis and/or detection of cancer. [0171] Occult metastases: As used herein, the term “occult metastases” refers to metastases that are present within a patient, but not detected during initial pathological examination. In certain embodiments, for example, occult metastases may be undetectable via conventional imaging. For example, a patient may have existing metastases, but they may not yet be of a size that gives rise to observable suspect regions in CT, MRI, or nuclear medicine (e.g., as hotspots) images. [0172] Segmentation map: As used herein, the term “segmentation map” refers to a computer representation that identifies one or more 2D or 3D regions determined by segmenting an image. In certain embodiments, a segmentation map distinguishably identifies multiple different (e.g., segmented) regions, allowing them to be individually and distinguishably accessed and operated upon and/or used for operating on, for example, one or more images. [0173] Subject: As used herein, a “subject” means a human or other mammal (e.g., rodent (mouse, rat, hamster), pig, cat, dog, horse, primate, rabbit, and the like). The term “subject” is used herein interchangeably with the term “patient”. [0174] Synchronous metastases: As used herein, the term “synchronous metastases” refers to metastases within a patient that co-exist with the primary cancer tumor at a time of initial diagnosis and/or detection of cancer. In certain embodiments, an initial diagnosis and/or detection of cancer is a detection of a primary tumor and/or one or more lesions within a particular (e.g., single, isolated) organ or tissue region, such as a prostate, breast, liver, lung, colon, or rectum. - 31 - 12297548v2
Attorney Docket No.2010358-0329 [0175] Tissue: As used herein, the term “tissue” refers to bone (osseous tissue) as well as soft-tissue. [0176] Whole body: As used herein, the terms “full body” and “whole body” used (interchangeably) in the context of segmentation and other manners of identification of regions within an image of a subject refer to approaches that evaluate a majority (e.g., greater than 50%) of a graphical representation of a subject’s body in a 3D anatomical image to identify target tissue regions of interest. In certain embodiments, full body and whole-body segmentation refers to identification of target tissue regions within at least an entire torso of a subject. In certain embodiments, portions of limbs are also included, along with a head of the subject. DETAILED DESCRIPTION [0177] It is contemplated that systems, architectures, devices, methods, and processes of the claimed invention encompass variations and adaptations developed using information from the embodiments described herein. Adaptation and/or modification of the systems, architectures, devices, methods, and processes described herein may be performed, as contemplated by this description. [0178] Throughout the description, where articles, devices, systems, and architectures are described as having, including, or comprising specific components, or where processes and methods are described as having, including, or comprising specific steps, it is contemplated that, additionally, there are articles, devices, systems, and architectures of the present invention that consist essentially of, or consist of, the recited components, and that there are processes and methods according to the present invention that consist essentially of, or consist of, the recited processing steps. [0179] It should be understood that the order of steps or order for performing certain action is immaterial so long as the invention remains operable. Moreover, two or more steps or actions may be conducted simultaneously. [0180] The mention herein of any publication, for example, in the Background section, is not an admission that the publication serves as prior art with respect to any of the claims presented herein. The Background section is presented for purposes of clarity and is not meant as a description of prior art with respect to any claim. - 32 - 12297548v2
Attorney Docket No.2010358-0329 [0181] Documents are incorporated herein by reference as noted. Where there is any discrepancy in the meaning of a particular term, the meaning provided in the Definition section above is controlling. [0182] Headers are provided for the convenience of the reader – the presence and/or placement of a header is not intended to limit the scope of the subject matter described herein. [0183] As described in further detail herein, in certain embodiments, systems and methods of the present disclosure provide technologies for automated determination of prostate cancer staging scores, whereby intensity patterns of uptake regions identified within and/or about a prostate volume in a 3D functional image are used to assign a patient’s cancer a grade indicative of its malignancy. For example, as shown in FIG.1, intensity patterns in 3D functional images, such as PET images, reflect radiopharmaceutical uptake within a patient, desirably concentrated within cancerous tissue, and can display a variety of spatial patterns that can be challenging to interpret and, moreover, difficult to compare with, for example, other patients (e.g., in a cohort), reference images (e.g., to inform treatment decisions), or images taken at earlier time points (e.g., to assess disease progression and/or treatment efficacy) in an objective fashion. Accordingly, by converting complex spatial intensity patterns to a numerical grade on a scale, approaches described herein facilitate evaluation of patients for prostate cancer and can help to inform treatment decisions. [0184] Moreover, although grading schemes, such as the PRIMARY scoring technique described in Emmet et al., “The PRIMARY Score: Using Intraprostatic 68Ga- PSMA PET/CT Patterns to Optimize Prostate Cancer Diagnosis,” The Journal of Nuclear Medicine 63 (2022) pp.1644-1650, have been proposed for use by medical professionals, human reader assessments and interpretation of images, particularly those involving complex spatial intensity patterns, are time consuming and subjective – resulting in inefficiencies and inter-reader variability that limits their practical value. Accordingly, by leveraging and combining various approaches for automatically identifying anatomical regions and lesions in medical images, and quantifying their severity / uptake, technologies of the present disclosure provide automated, efficient, and robust techniques for scoring prostate cancer images in a manner can provide for improved accuracy and consistency in assessment of patients’ disease. - 33 - 12297548v2
Attorney Docket No.2010358-0329 A. Nuclear Medicine Images [0185] In certain embodiments, technologies of the present disclosure analyze nuclear medicine images may be obtained using a nuclear medicine imaging modality such as bone scan imaging (also referred to as scintigraphy), Positron Emission Tomography (PET) imaging, and Single-Photon Emission Tomography (SPECT) imaging. [0186] In certain embodiments, nuclear medicine images are obtained using imaging agents comprising radiopharmaceuticals. Nuclear medicine images may be obtained following administration of a radiopharmaceutical to a patient (e.g., a human subject), and provide information regarding the distribution of the radiopharmaceutical within the patient. [0187] Nuclear medicine imaging techniques detect radiation emitted from the radionuclides of radiopharmaceuticals to form an image. The distribution of a particular radiopharmaceutical within a patient may be influenced and/or dictated by biological mechanisms such as blood flow or perfusion, as well as by specific enzymatic or receptor binding interactions. Different radiopharmaceuticals may be designed to take advantage of different biological mechanisms and/or particular specific enzymatic or receptor binding interactions and thus, when administered to a patient, selectively concentrate within particular types of tissue and/or regions within the patient. Greater amounts of radiation are emitted from regions within the patient that have higher concentrations of radiopharmaceutical than other regions, such that these regions appear brighter in nuclear medicine images. Accordingly, intensity variations within a nuclear medicine image can be used to map the distribution of radiopharmaceutical within the patient. This mapped distribution of radiopharmaceutical within the patient can be used to, for example, infer the presence of cancerous tissue within various regions of the patient’s body. In certain embodiments, intensities of voxels of a nuclear medicine image, for example a PET image, represent standardized uptake values (SUVs) (e.g., having been calibrated for injected radiopharmaceutical dose and/or patient weight, for example as shown in Section J.i., below). [0188] For example, upon administration to a patient, technetium 99m methylenediphosphonate (
99mTc MDP) selectively accumulates within the skeletal region of the patient, in particular at sites with abnormal osteogenesis associated with malignant bone lesions. The selective concentration of radiopharmaceutical at these sites produces identifiable hotspots – localized regions of high intensity - in nuclear medicine images. Accordingly, presence of malignant bone lesions associated with metastatic prostate cancer - 34 - 12297548v2
Attorney Docket No.2010358-0329 can be inferred by identifying such hotspots within a whole-body scan of the patient. In certain embodiments, analyzing intensity variations in whole-body scans obtained following administration of
99mTc MDP to a patient, such as by detecting and evaluating features of hotspots, can be used to compute, risk indices that correlate with patient overall survival and other prognostic metrics indicative of disease state, progression, treatment efficacy, and the like. In certain embodiments, other radiopharmaceuticals can also be used in a similar fashion to
99mTc MDP. [0189] In certain embodiments, the particular radiopharmaceutical used depends on the particular nuclear medicine imaging modality used. For example, 18F sodium fluoride (NaF) also accumulates in bone lesions, similar to
99mTc MDP, but can be used with PET imaging. In certain embodiments, PET imaging may also utilize a radioactive form of the vitamin choline, which is readily absorbed by prostate cancer cells. In certain embodiments, PET imaging may be performed with [18F]Fluorodeoxyglucose, abbreviated [18F]FDG, which is an 18F labeled glucose analog. Without wishing to be bound to any particular theory, uptake of 18FFDG is believed to be a marker for glucose uptake in tissue, which is correlated with metabolism and, accordingly, may serve as a marker for cancer. [0190] In certain embodiments, radiopharmaceuticals that selectively bind to particular proteins or receptors of interest – particularly those whose expression is increased in cancerous tissue may be used. Such proteins or receptors of interest include, but are not limited to tumor antigens, such as CEA, which is expressed in colorectal carcinomas, Her2/neu, which is expressed in multiple cancers, BRCA 1 and BRCA 2, expressed in breast and ovarian cancers; and TRP-1 and -2, expressed in melanoma. [0191] For example, human prostate-specific membrane antigen (PSMA) is upregulated in prostate cancer, including metastatic disease. PSMA is expressed by virtually all prostate cancers and its expression is further increased in poorly differentiated, metastatic and hormone refractory carcinomas. Accordingly, radiopharmaceuticals that comprise PSMA binding agents (e.g., compounds that a high affinity to PSMA) labelled with one or more radionuclide(s) can be used to obtain nuclear medicine images of a patient from which the presence and/or state of prostate cancer within a variety of regions (e.g., including, but not limited to skeletal regions) of the patient can be assessed. In certain embodiments, nuclear medicine images obtained using PSMA binding agents are used to identify the presence of cancerous tissue within the prostate, when the disease is in a localized state. In certain embodiments, nuclear medicine images obtained using radiopharmaceuticals - 35 - 12297548v2
Attorney Docket No.2010358-0329 comprising PSMA binding agents are used to identify the presence of cancerous tissue within a variety of regions that include not only the prostate, but also other organs and tissue regions such as lungs, lymph nodes, and bones, as is relevant when the disease is metastatic. [0192] In particular, upon administration to a patient, radionuclide labelled PSMA binding agents selectively accumulate within cancerous tissue, based on their affinity to PSMA. In a similar manner to that described above with regard to
99mTc MDP, the selective concentration of radionuclide labelled PSMA binding agents at particular sites within the patient produces detectable hotspots in nuclear medicine images. As PSMA binding agents concentrate within a variety of cancerous tissues and regions of the body expressing PSMA, localized cancer within a prostate of the patient and/or metastatic cancer in various regions of the patient’s body can be detected, and evaluated. Various metrics that are indicative of and/or quantify severity (e.g., likely malignancy) of individual lesions, overall disease burden and risk for a patient, and the like, can be computed based on automated analysis of intensity variations in nuclear medicine images obtained following administration of a PSMA binding agent radiopharmaceutical to a patient. These disease burden and/or risk metrics may be used to stage disease and make assessments regarding patient overall survival and other prognostic metrics indicative of disease state, progression, treatment efficacy. [0193] A variety of radionuclide labelled PSMA binding agents may be used as radiopharmaceutical imaging agents for nuclear medicine imaging to detect and evaluate prostate cancer. In certain embodiments, the particular radionuclide labelled PSMA binding agent that is used depends on factors such as the particular imaging modality (e.g., PET; e.g., SPECT) and the particular regions (e.g., organs) of the patient to be imaged. For example, certain radionuclide labelled PSMA binding agents are suited for PET imaging, while others are suited for SPECT imaging. For example, certain radionuclide labelled PSMA binding agents facilitate imaging a prostate of the patient, and are used primarily when the disease is localized, while others facilitate imaging organs and regions throughout the patient’s body, and are useful for evaluating metastatic prostate cancer. [0194] Several exemplary PSMA binding agents and radionuclide labelled versions thereof are described in further detail in Section I herein, as well as in U.S. Patent Nos. 8,778,305, 8,211,401, and 8,962,799, and in U.S. Patent Publication No. US 2021/0032206 A1, the content of each of which are incorporated herein by reference in their entireties. - 36 - 12297548v2
Attorney Docket No.2010358-0329 B. Image Segmentation in Nuclear Medicine Imaging [0195] Nuclear medicine images are functional images. Functional images convey information relating to physiological activities within specific organs and/or tissue, such as metabolism, blood flow, regional chemical composition, and/or absorption. In certain embodiments, nuclear medicine images are acquired and/or analyzed in combination with anatomical images, such as computed tomography (CT) images. Anatomical images provide information regarding location and extent of anatomical structures such as internal organs, bones, soft-tissue, and blood vessels, within a subject. Examples of anatomical images include, without limitation, x-ray images, CT images, magnetic resonance images, and ultrasound images. [0196] Accordingly, in certain embodiments, anatomical images can be analyzed together with nuclear medicine images in order to provide anatomical context for the functional information that they (nuclear medicine images) convey. For example, while nuclear medicine images, such as PET and SPECT convey a three-dimensional distribution of radiopharmaceutical within a subject, adding anatomical context from an anatomical imaging modality, such as CT imaging, allows one to determine the particular organs, soft-tissue regions, bones, etc. that radiopharmaceutical has accumulated in. [0197] For example, a functional image may be aligned with an anatomical image so that locations within each image that correspond to a same physical location – and therefore correspond to each other – can be identified. For example, coordinates and/or pixels/voxels within a functional image and an anatomical image may be defined with respect to a common coordinate system, or a mapping (i.e., a functional relationship) between voxels within the anatomical image and voxels within the functional image established. In this manner, one or more voxels within an anatomical image and one or more voxels within a functional image that represent a same physical location or volume can be identified as corresponding to each other. [0198] For example, FIG.2 shows axial slices of a 3D CT image 202 and a 3D PET image 204, along with a fused image 206 in which the slice of the 3D CT image is displayed in grayscale and with the PET image is displayed as a semitransparent overlay. By virtue of the alignment between the CT and PET images, a location of a hotspot within the PET image, indicative of accumulated radiopharmaceutical and, accordingly a potential lesion, can be - 37 - 12297548v2
Attorney Docket No.2010358-0329 identified in the corresponding CT image, and viewed in anatomical context, for example, within a particular location in the pelvic region (e.g., within a prostate). [0199] In certain embodiments, the aligned pair are a composite image, such as a PET/CT or SPECT/CT. In certain embodiments, an anatomical image (e.g., a 3D anatomical image, such as a CT image) and a functional image (e.g., a 3D functional image, such as a PET or SPECT image) are acquired using separate anatomical and functional imaging modalities, respectively. In certain embodiments, an anatomical image (e.g., a 3D anatomical image, such as a CT image) and a functional image (e.g., a 3D functional image, such as a PET or SPECT image) are acquired using a single multimodality imaging system. A functional image and an anatomical image may, for example, be acquired via two scans using a single multimodal imaging system – for example first performing a CT scan and then, second, performing a PET scan – during which a subject remains in a substantially fixed position. [0200] In certain embodiments, 3D boundaries of particular tissue regions of interest can be accurately identified by analyzing 3D anatomical images. For example, automated segmentation of 3D anatomical images can be performed to segment 3D boundaries of regions such as particular organs, organ sub-regions and soft-tissue regions, as well as bone. In certain embodiments, organs such as a prostate, urinary bladder, liver, aorta (e.g., portions of an aorta, such as a thoracic aorta), a parotid gland, etc., are segmented. In certain embodiments, one or more particular bones are segmented. In certain embodiments, an overall skeleton is segmented. [0201] In certain embodiments, automated segmentation of 3D anatomical images may be performed using one or more machine learning modules that are trained to receive a 3D anatomical image and/or a portion thereof, as input, and segment one or more particular regions of interest, producing a 3D segmentation map as output. For example as described in PCT publication WO/2020/144134, entitled “Systems and Methods for Platform Agnostic Whole Body Segmentation,” and published July 16, 2020, the contents of which are incorporated herein by reference in their entirety, multiple machine learning modules implementing convolutional neural networks (CNNs) may be used to segment 3D anatomical images, such as CT images, of a whole body of a subject and thereby create a 3D segmentation map that identifies multiple target tissue regions across a subject’s body. - 38 - 12297548v2
Attorney Docket No.2010358-0329 [0202] In certain embodiments, for example to segment certain organs where functional images are believed to provide additional useful information that facilitate segmentation, a machine learning module may receive both an anatomical image and a functional image as input, for example as two different channels of input (e.g., analogous to multiple color channels in a color, RGB, image) and use these two inputs to determine an anatomical segmentation. This, multi-channel, approach is described in further detail in U.S. Patent Publication No. US 2021/0334974 A1, entitled “Systems and Methods for Deep- Learning-Based Segmentation of Composite Images,” and published October 28, 2021, the contents of which is hereby incorporated by reference in its entirety. [0203] In certain embodiments, as illustrated FIG.3, an anatomical image 304 (e.g., a 3D anatomical image, such as a CT image) and a functional image 306 (e.g., a 3D functional image, such as a PET or SPECT image) may be aligned with (e.g., co-registered to) each other, for example as in a composite image 302 such as a PET/CT image. Anatomical image 304 may be segmented 308 to create a segmentation map 310 (e.g., a 3D segmentation map) that distinguishably identifies one or more tissue regions and/or sub-regions of interest, such as one or more particular organs and/or bones. Segmentation map 310, having been created from anatomical image 304 is aligned with anatomical image 304, which, in turn, is aligned with functional image 306. Accordingly, boundaries of particular regions (e.g., segmentation masks), such as particular organs and/or bones, identified via segmentation map 310 can be transferred to and/or overlaid 312 upon functional image 306 to identify volumes within functional image 306 for purposes of classifying hotspots, and determining useful indices that serve as measures and/or predictions of cancer status, progression, and response to treatment. Segmentation maps and masks may also be displayed, for example as a graphical representation overlaid on a medical image to guide physicians and other medical practitioners. C. Lesion Detection and Characterization [0204] In certain embodiments, approaches described herein include techniques for detecting and characterizing lesions within a subject via (e.g., automated) analysis of medical images, such as nuclear medicine images. Regions of interest (ROIs) in medical images that represent potential lesions may be identified based on, for example, differences in intensity values relative to surroundings, or other characteristic features (e.g., abnormal shapes, - 39 - 12297548v2
Attorney Docket No.2010358-0329 texture, spatial frequencies, etc., depending on particular imaging modality). That is, in certain embodiments, ROIs representing potential lesion (also referred to as “suspect regions”) may appear in medical images as spatial regions having intensity values and/or patters deviating from an established baseline pattern, e.g., background intensities. In certain embodiments, suspect ROIs are uptake regions that are indicative of anomalous, e.g., increased, uptake of an imaging agent within a particular localized region within a patient. In particular, as described herein, in certain embodiments, uptake regions may be hotspots. In certain embodiments, hotspots are localized (e.g., contiguous) regions of high intensity, relative to their surroundings, within images, such as 3D functional images and may be indicative of a potential cancerous lesion present within a subject. [0205] A variety of approaches may be used for detecting, segmenting, and classifying uptake regions such as hotspots. In certain embodiments, hotspots are detected and segmented using analytical methods, such as filtering techniques including, but not limited to, a difference of Gaussians (DoG) filter and a Laplacian of Gaussians (LoG) filter. In certain embodiments, hotspots are segmented using a machine learning module that receives, as input, a 3D functional image, such as a PET image, and generates, as output a hotspot segmentation map (a “hotspot map”) that differentiates boundaries of identified hotspots from background. In certain embodiments, each segmented hotspot within a hotspot map is individually identifiable (e.g., individually labelled). In certain embodiments, a machine learning module used for segmenting hotspots may take as input, in addition to a 3D functional image, one or both of a 3D anatomical image (e.g., a CT image) and a 3D anatomical segmentation map. The 3D anatomical segmentation map may be generated via automated segmentation (e.g., as described herein) of the 3D anatomical image. [0206] In certain embodiments, segmented hotspots may be classified according to an anatomical region in which they are located. For example, in certain embodiments, locations of individual segmented hotspots within a hotspot map (representing and identifying segmented hotspots) may be compared with 3D boundaries of segmented tissue regions, such as various organs and bones, within a 3D anatomical segmentation map and labeled according to their location, e.g., based on proximity to and/or overlap with particular organs. In certain embodiments, a machine learning module may be used to classify hotspots. For example, in certain embodiments, a machine learning module may generate, as output, a hotspot map in which segmented hotspots are not only individually labeled and identifiable (e.g., distinguishable from each other), but are also labeled, for example, as corresponding to - 40 - 12297548v2
Attorney Docket No.2010358-0329 one of a bone, lymph, or prostate lesion. In certain embodiments, one or more machine learning modules may be combined with each other, as well as with analytical segmentation (e.g., thresholding) techniques to perform various tasks in parallel and in sequence to create a final labeled hotspot map. [0207] Various approaches for performing detailed segmentation of 3D anatomical images and identification of hotspots representing lesions in 3D functional images, which may be used with various approaches described herein, are described in PCT publication WO/2020/144134, entitled “Systems and Methods for Platform Agnostic Whole Body Segmentation,” and published July 16, 2020, U.S. Patent Publication No. US 2021/0334974 A1, entitled “Systems and Methods for Deep-Learning-Based Segmentation of Composite Images,” and published October 28, 2021, and PCT publication WO/2022/008374, entitled “Systems and Methods for Artificial Intelligence-Based Image Analysis for Detection and Characterization of Lesions,” and published January 13, 2022, the contents of each of which is incorporated herein in its entirety. [0208] FIG.4A shows an example process 400 for segmenting and classifying hotspots, based on an example approach described in further detail in PCT publication WO/2022/008374, entitled “Systems and Methods for Artificial Intelligence-Based Image Analysis for Detection and Characterization of Lesions,” and published January 13, 2022. The approach illustrated in FIG.3 uses two machine learning modules, each of which receives, as input, 3D functional image 406, 3D anatomical image 404, and 3D anatomical segmentation map 410. Machine learning module 412a is a binary classifier that generates a single-class hotspot map 420a, by labeling voxels as hotspot or background (not a hotspot). Machine learning module 412b performs multi-class segmentation, and generates multi-class hotspot map 420b, in which hotspots are both segmented and labeled as one of three classes – prostate, lymph, or bone. Among other things, classifying hotspots in this manner – via a machine learning module 412b (e.g., as opposed to directly comparing hotspot locations with segmented boundaries from segmentation map 410) – obviates a need to segment certain regions. For example, in certain embodiments, machine learning module 412b may classify hotspots as belonging to prostate, lymph, or bone, without a prostate region having be identified and segmented from 3D anatomical image 404 (e.g., in certain embodiments, 3D anatomical segmentation map 410 does not comprise a prostate region). In certain embodiments, hotspot maps 420a and 420b are merged, for example by transferring labels from multi-class hotspot map 420b to the hotspot segmentations identified in single-class - 41 - 12297548v2
Attorney Docket No.2010358-0329 hotspot map 420a (e.g., based on overlap). Without wishing to be bound to any particular theory, it is believed that this approach combines improved segmentation and detection of hotspots from single class machine learning module 412a with classification results from multi-class machine learning module 412b. In certain embodiments, hotspot regions identified via this final, merged, hotspot map are further refined, using an analytical technique such as an adaptive thresholding technique described in PCT publication WO/2022/008374, entitled “Systems and Methods for Artificial Intelligence-Based Image Analysis for Detection and Characterization of Lesions,” and published January 13, 2022. [0209] In certain embodiments, once detected and segmented, hotspots may be identified and assigned labels according to a particular anatomical (e.g., tissue) region in which they are located and/or a particular lesion sub-type that they are likely to represent. For example, in certain embodiments, hotspots may be assigned an anatomical location that identifies them as representing locations with a one of a set of tissue regions, such as the listed in Table 1, below. In certain embodiments, a list of tissue regions may include those in Table 1 as well as a gluteus maximus (e.g., left and right) and a gallbladder. In certain embodiments, hotspots are assigned to and/or labeled as belonging to a particular tissue region based on a machine learning classification and/or via comparison of their 3D hotspot volume’s location and/or overlap with various tissue volumes identified via masks in an anatomical segmentation map. In certain embodiments, a prostate is not segmented. For example, as described above, in certain embodiments, machine learning module 412b may classify hotspots as belonging to prostate, lymph, or bone, without a prostate region having be identified and segmented from 3D anatomical image 404. In certain embodiments, regions such as a head 432 and/or one or more arm(s) 434a, 434b of a patient, may be segmented, for example as shown in FIG.4B. In certain embodiments, one or more arm(s) comprises upper arm(s) and/or at least a portion of one or both humerus/humeri. In certain embodiments, a head comprises a skull, a mandible, a brain, a parotid gland, and cervical curve, and a cervical vertebra. In certain embodiments, segmentation processes of the present disclosure may utilize a cutoff rule to determine whether to segment a particular region based on an extent of a subject that is imaged, and/or is graphically represented in a medical image. For example, in certain embodiments, if a medical image does not cover (e.g., certain percentage of a region of interest, reach set anatomical landmarks), segmentation of a particular region (e.g., a skull, a parotid gland) is not performed, or may be performed, but discarded or flagged (e.g., as low confidence/potentially erroneous). - 42 - 12297548v2
Attorney Docket No.2010358-0329 [0210] In certain embodiments, technologies of the present disclosure provide users with tools that include segmentation procedures that utilize particular, processes for detecting and/or segmenting hotspots that are tailored to different regions (e.g., organs). For example, a user may, seek to locate hotspots in an organ with high physiological uptake, such as a liver that an approach used for (detecting and/or segmenting hotspots within) other organs may struggle with. Accordingly, a tailored approach for detecting and/or segmenting hotspots in high uptake organs may be used. [0211] In certain embodiments, a hotspot segmentation procedure for organ with high physiological uptake may include one or both of: (1) detecting hotspots by applying a model (e.g., statistical, machine-learning) to determine and remove (e.g., filter out) intensities corresponding to normal, background, uptake within the organ; and (2) segmenting hotspots by applying a model (e.g., statistical, machine-learning) to identify and delineate 3D hotspot volume boundaries using the organ boundaries (e.g., which may be identified via one or more segmentation masks determined via approaches described herein, for example, in Section B above) and/or determined local background intensity value associated with and representing normal background uptake within the organ (e.g., by detecting abnormally high intensity peaks). [0212] FIG.4C shows an example process 510 for detecting hotspots in a high uptake organ according to various embodiments described herein. A 3D functional image may be received and/or accessed 452, for example retrieved from memory, either locally or on a PACS server, cloud, etc. A segmentation mask identifying a high uptake organ within the 3D functional image may be received and/or accessed as well 454. A segmentation mask, for example, may be produced from a medical image by automated image processing, manual selection and delineation by a user (e.g., a radiologist), or combinations thereof. For example, various approaches for automated segmentation of anatomical organs and tissue regions, described herein in Section B, may be used to determine a segmentation mask. Using organ boundaries of the high uptake organ from the segmentation mask, a local background intensity within the high uptake organ can be determined 456 from the 3D functional image. Using the determined local background intensity, 3D hotspot volumes within the 3D functional image corresponding to the high uptake organ may be determined 458. Hotspots may be further rendered and displayed 460, for example, as graphical shapes overlaid on medical images. - 43 - 12297548v2
Attorney Docket No.2010358-0329 [0213] In certain embodiments, a local background intensity value associated with background uptake in a high-uptake organ comprises is determined as a mean and/or a standard deviation of the uptake value in the organ. In certain embodiments, a local background intensity value is determined by fitting a multi-component mixture model to intensities of voxels within a VOI corresponding to the high uptake organ. For example, a mean and a standard deviation of local background intensity in an organ is determined by fitting a two component Gaussian Mixture model to the organ intensity values. For example, a two component Gaussian mixture model may have the following form:

where μ
i is the mean, σ
i is the standard deviation and w
i is the weight of the i
th component and G is the Gaussian function. In certain embodiments, a mean (μ) and a standard deviation (σ) of a component with the largest weight, w
i, (e.g., a major mode) is chosen as an estimate of a mean and a standard deviation, respectively, of local background intensity corresponding to normal background uptake within the organ. A smaller component may be assumed to encapsulate abnormally low uptake (e.g., due to misalignment between a medical image and organ segmentation, and/or due to the cysts in the organ causing abnormally low uptake). [0214] In certain embodiments, sub-regions within the high-uptake organ that represent locations of potential hotspots are detected by thresholding organ intensity values and selecting regions with intensities above a detection threshold detection value. In certain embodiments, a detection threshold detection value is determined based on (e.g., as a function of) the local background intensity value, for example based on a mean and standard deviation of a major mode determined via fitting a multi-component mixture model as described herein (e.g., as th = μ +4σ). In certain embodiments, an initial set of preliminary sub-regions are detected, and filtered via one or more selection criteria. One or more selection criteria may include (1) a degree of overlap (e.g., absolute volume, volumetric percentage) between a given one of the one or more preliminary sub-regions and a region (e.g., 3D volume of interest) of the 3D functional image corresponding to the high-uptake organ ; (2) a degree of overlap (e.g., absolute volume, volumetric percentage) between a given one of the one or more preliminary sub-regions and a region (e.g., a 3D volume) of the 3D functional image corresponding to at least one other organ or tissue region [e.g., a neighboring organ, an organ with high physiological uptake, an organ known to “bleed over” - 44 - 12297548v2
Attorney Docket No.2010358-0329 (e.g., distort uptake values of a neighboring organ due to a misalignment between a functional image and a segmentation mask) into the high uptake organ, e.g., kidney]; (3 a minimum (e.g., hotspot) volume (e.g., a minimum number of voxels; e.g., a minimum corresponding physical volume) [e.g., such that only preliminary sub-regions having volumes greater than or equal to the minimum (e.g., hotspot) volume are selected] [e.g., wherein the minimum hotspot volume is at least 2 (e.g., 1, 5, 10) voxels] (e.g., to avoid noise induced hotspots). [0215] In certain embodiments, hotspots are segmented by sub-dividing a VOI within the functional image corresponding to the high uptake organ into one or more sub-segments, for example using a watershed algorithm. Intensities within the VOI may be smoothed prior to sub-dividing it and peaks detected and used as basins in the watershed algorithm. Smoothing may avoid detecting noise as peaks. These determined sub-segments may then be compared with the detected sub-regions representing potential hotspots, to identify, for each preliminary sub-region, a subsegment that it overlaps with. A 3D hotspot volume corresponding to a particular sub-region (e.g., a j
th sub-region and corresponding hotspot volume) may be segmented using an individual segmentation threshold value (ts
j), determined based on (e.g., as a maximum of) the detection threshold value and a measure of intensity within the particular sub-region (e.g., a particular percentage, e.g., 60%, of the SUV max). For example, for a j
th sub-region and corresponding 3D hotspot volume to be segmented, a corresponding individual segmentation threshold may be determined via, ^^^^ ^^^
^^
^^^ = max� ^^^^ + 4 ^^^^, 0.6 ⋅ ^^^^ ^^^^ ^^^^ ^^^^ ^^^^ ^^^^
^^^^� In certain embodiments, a 3D hotspot volume is segmented using a flood fill algorithm originating in the SUVmax of the detected hotspot, including values that are above the threshold ts
j, and are located in the subsegment(s) that the original sub-region (that represents the detected hotspot) overlaps with (e.g., the hotspot segmentation is not allowed to spread into subsegments that were not previously overlapped when the hotspot was detected). Table 1: Certain Tissue Regions (*Prostate may, optionally, be segmented if present – may be absent if patient has, e.g., undergone radical prostatectomy, or may not segmented in any case, in certain embodiments).
- 45 - 12297548v2
Attorney Docket No.2010358-0329

[0216] In certain embodiments, additionally or alternatively, hotspots may be classified as belonging to one or more lesion sub-types. In certain embodiments, lesion sub- type classifications may be made by comparing hotspot locations with classes of anatomical regions. For example, in certain embodiments a miTNM classification scheme may be used, where hotspots are labeled as belonging to one of three classes – miT, miN, or miM – based on whether they represent lesions located within a prostate (miT), pelvic lymph node (miN), or distant metastases (miM). In certain embodiments, a five-class version of the miTNM scheme may be used, with distant metastases further divided into three sub classes – miMb for bone metastases, miMa for lymph metastases, and miMc for other soft tissue metastases. [0217] For example, in certain embodiments, hotspots located within a prostate are labeled as belonging to class “T” or “miT”, e.g., representing local tumor. In certain embodiments, hotspots located outside a prostate, but within a pelvic region are labeled as class “N” or “miN”. In certain embodiments, for example as described in U.S. Application No.17/959,357, filed October 4, 2022, entitled “Systems and Methods for Automated - 46 - 12297548v2
Attorney Docket No.2010358-0329 Identification and Classification of Lesions in Local Lymph and Distant Metastases,” published as U.S.2023/0115732 A1 on April 13, 2023, the content of which is incorporated herein by reference in its entirety, a pelvic atlas may be registered to identify boundaries of a pelvic region and/or various sub-regions therein, for purposes of identifying pelvic lymph node lesions. A pelvic atlas may, for example, include boundaries of a pelvic region and/or a planar reference (e.g., a plane passing through an aorta-bifurcation) which hotspot locations can be compared to (e.g., such that hotspots located outside the pelvic region and/or above the planar reference passing through an aorta bifurcation are labeled as “M” or “miM” – e.g., distant metastases). In certain embodiments, distant metastases may be classified as lymph (miMa), bone (miMb), or visceral (miMc) based on a comparison of hotspot locations with an anatomical segmentation map. For example, hotspots located within one or more bones (e.g., and outside a pelvic region) may be labeled as distant metastases, hotspots located within one or more segmented organs or a subset of organs (e.g., brain, lung, liver, spleen, kidneys) may be labeled as visceral (miMc) distant metastases, and remaining hotspots located outside a pelvic region labeled as distant lymph metastases (miMa). [0218] Additionally or alternatively, in certain embodiments, hotspots may be assigned an miTNM class based on a determination that they are located within a particular anatomical region, for example based on a table such as Table 2, where each column corresponds to a particular miTNM label (first row indicating the particular miTNM class) and includes, in rows two and below, particular anatomical regions associated with each miTNM class. In certain embodiments, a hotspot can be assigned as being located within a particular tissue region listed in Table 2 based on a comparison of the hotspot’s location with an anatomical segmentation map, allowing for an automated miTNM class assignment. Table 2. An Example List of Tissue Regions Corresponding to Five Classes in a Lesion Anatomical Labeling Approach.

- 47 - 12297548v2
Attorney Docket No.2010358-0329

[0219] In certain embodiments, hotspots may be further classified in terms of their anatomical location and/or lesion sub-type. For example, in certain embodiments, hotspots identified as located in pelvic lymph (miN) may be identified as belonging to a particular pelvic lymph node sub-region, such as one of a left/right internal iliac, a left or right external iliac, a left or right common iliac, a left or right obturator, a presacral region, or other pelvic region. In certain embodiments, distant lymph node metastases (miMa) may be classified as retroperitoneal (RP), supradiaphragmatic (SD), or other extrapelvic (OE). Approaches for regional (miN) and distant (miMa) lymph metastases classifications may include registration of pelvic atlas images and/or identification of various whole body landmarks, which are described in further detail in U.S. Application No.17/959,357, filed October 4, 2022, entitled “Systems and Methods for Automated Identification and Classification of Lesions in Local Lymph and Distant Metastases,” published as U.S.2023/0115732 A1 on April 13, 2023, the content of which is incorporated herein by reference in its entirety. D. Hotspot and Uptake Region Quantification Metrics [0220] In certain embodiments, detected – e.g., identified and segmented – uptake regions, such as hotspots, may be characterized via various individual quantification metrics. In particular, for a particular individual uptake region, such as a hotspot, uptake region quantification metrics can be used to quantify a measure of size (e.g., 3D volume) and/or - 48 - 12297548v2
Attorney Docket No.2010358-0329 intensity of the particular uptake region in a manner that is indicative of a size and/or level of radiopharmaceutical uptake within the (e.g., potential) underlying physical lesion that the particular uptake region (e.g., hotspot) represents. Accordingly, individual uptake region quantification metrics may convey, for example to a physician or radiologist, a likelihood that an uptake region (e.g., hotspot) appearing in an image represents a true underlying physical lesion and/or convey a likelihood or level of malignancy thereof (e.g., allowing to differentiate between benign and malignant lesions). [0221] In certain embodiments, image segmentation, lesion detection, and characterization techniques as described herein are used to determine, for each of one or more medical images, a corresponding set of one or more uptake regions, such as a hotspot set. For example, as described herein, image segmentation techniques may be used to determine, for each hotspot detected in a particular image, a particular 3D volume – a 3D hotspot volume – representing and/or indicative of a volume (e.g., 3D location and extent) of a potential underlying physical lesion within the subject. Each uptake region, in turn, comprises a set of image voxels, each having a particular intensity value. [0222] Once determined, a set of uptake regions may be used to compute one or more quantification metrics for each individual uptake region. Individual uptake region quantification metrics (e.g., hotspot quantification metrics) may be computed according to various methods and formulae described herein, for example below. In the description below, the variable L is used to refer to a set of uptake regions detected with a particular image, with L = {1, 2, …, l, …, N
L} representing a set of N
L (i.e., N
L being the number of uptake regions, such as hotspots) uptake regions detected within an image and the variable l indexing the l
th uptake region. As described herein, each uptake region corresponds to a particular 3D volume within an image, with R
l denoting the volume of the l
th uptake region. [0223] Uptake region quantification metrics may be presented to a user via a GUI and/or a (e.g., automatically or semi-automatically) generated report. As described in further detail herein, individual uptake region quantification metrics may include uptake region intensity metrics (e.g., hotspot intensity metrics) and uptake region volume metrics (e.g., hotspot volume metrics) (e.g., lesion volume) that quantify an intensity and size, respectively of a particular uptake region (such as a particular hotspot) and/or underlying lesion it represents. Uptake region intensity and size may, in turn, be indicative of a level of radiopharmaceutical uptake within, and size of, respectively, an underlying physical lesion within the subject. - 49 - 12297548v2
Attorney Docket No.2010358-0329 D.i. Uptake Region Intensity Metrics [0224] In certain embodiments, an uptake quantification metric is or comprises an uptake region (e.g., hotspot) intensity metric or uptake (e.g., hotspot) intensity metric that quantifies an intensity of an individual uptake region, such as a 3D hotspot volume. Uptake intensity metrics may be computed based on individual voxel intensities within identified uptake regions. For example, for a particular uptake region, a value of an uptake intensity metric may be computed as a function of at least a portion (e.g., a particular subset, e.g., all) of that hotspot’s voxel intensities. Uptake intensity metrics may include, without limitation, metrics such as a maximum uptake intensity, a mean uptake intensity, and peak uptake intensity, and the like. As with voxel intensities in nuclear medicine images, in certain embodiments uptake intensity metrics may represent (e.g., be in units of) SUV values. [0225] In certain embodiments, a value of a particular uptake intensity metric is computed, for a subject uptake region, based on (e.g., as a function of) that subject uptake region’s voxel intensities alone, e.g., and not based on intensities of other image voxels outside the subject uptake region. [0226] For example, an uptake intensity metric may be a maximum uptake intensity (e.g., SUV), or “SUV-max,” computed as a maximum voxel intensity (e.g., SUV or uptake) within an uptake region (e.g., within a 3D hotspot volume). In certain embodiments, a maximum uptake intensity may be computed according to equations (1a), (1b), or (1c), below.
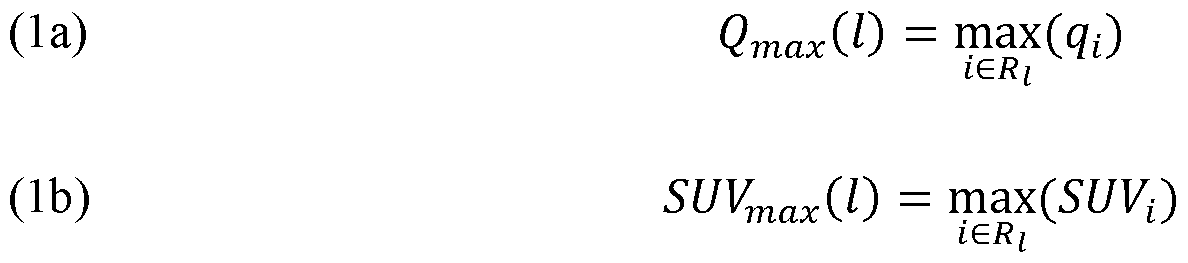
(1c) ^^^^ ^^^^ ^^^^ = max ( ^^^^ ^^^^ ^^^^ ^^^^ ^^^^ ^^^^ ^^^^ ^^^^ ^^^^ ^^^^ ^^^^ ^^^^ ^^^^ ∈ ^^^^ ^^^^ ^^^^ ^^^^ ^^^^ ^^^^ ^^^^ ^^^^ ^^^^ ^^^^ ^^^^ ^^^^) where, in equations (1a) and (1b) l represents a particular (e.g., l
th) uptake region, as described above, qi is the intensity of voxel i and ^^^^ ∈ ^^^^
^^^^ is the set of voxels within the particular uptake region, R
l. In equation (1b), SUV
i indicates a particular unit – standardized uptake value (SUV) – of voxel intensity, as described herein. - 50 - 12297548v2
Attorney Docket No.2010358-0329 [0227] In certain embodiments, an uptake intensity metric may be a mean uptake region intensity (e.g., SUV), or “SUV-mean,” and may be computed as a mean over all voxel intensities (e.g., SUV or uptake) within an uptake region. In certain embodiments, a mean uptake region intensity may be computed according to equations (2a), (2b), or (2c) below.
where n
l is the number of individual voxels within a particular uptake region (e.g., a 3D hotspot volume). [0228] In certain embodiments, an uptake region intensity metric may be a peak uptake region intensity (e.g., SUV), or “SUV-peak,” and may be computed as a mean over intensities of the voxels (e.g., SUV or uptake) whose midpoints are located within a (e.g., pre-defined) particular distance (e.g., within 5 mm) of the midpoint of the uptake region voxel where the maximum intensity (e.g., SUV-max) is located within an uptake region , and, accordingly, may be computed according to equations (3a)-(3c) below. (3a)
(3b)
(3c)
- 51 - 12297548v2
Attorney Docket No.2010358-0329 where ^^^^: ^^^^ ^^^^ ^^^^ ^^^^( ^^^^
^^^^ ^^^^ ^^^^, ^^^^) ≤ ^^^^ is the set of (uptake region) voxels having a mid-point within a distance, d, from voxel i
max, which is the maximum intensity voxel within the uptake region (e.g., Q
max(l) = q
i-max). D.ii. Lesion Index Metrics [0229] In certain embodiments, an uptake region intensity metric is individual lesion index value that maps an intensity of voxels within a particular 3D hotspot volume to a value on a standardized scale. Such lesion index values are described in further detail in PCT/EP2020/050132, filed January 6, 2020, and PCT/EP2021/068337, filed July 2, 2021, the content of each of which is hereby incorporated by reference in its entirety. Calculation of lesion index values may include calculation of reference intensity values within particular reference tissue regions, such as an aorta portion (also referred to as blood pool) and/or a liver. [0230] For example, in one particular implementation, a first, blood-pool, reference intensity value is determined based on a measure of intensity (e.g., a mean SUV) within an aorta region and a second, liver, reference intensity value is determined based on a measure of intensity (e.g., a mean SUV) within a liver region. As described in further detail, for example in PCT/EP2021/068337, filed July 2, 2021, the content of which is incorporated herein by reference in its entirety, calculation of reference intensities may include approaches such as identifying reference volumes (e.g., an aorta or portion thereof; e.g., a liver volume) within a functional image, such as a PET or SPECT image, eroding and/or dilating certain reference volumes, e.g., to avoid include voxels on the edge of a reference volume, and selecting subsets of reference voxel intensities, based on modeling approaches, e.g., to account for anomalous tissue features, such as cysts and lesions, within a liver. In certain embodiments, a third reference intensity value may be determined, either as a multiple (e.g., twice) of a liver reference intensity value, or based on an intensity of another reference tissue region, such as a parotid gland. [0231] In certain embodiments, uptake region intensities may be compared with one or more reference intensity values to determine a lesion index as a value on a standardized scale, which facilitates comparison across different images. For example, FIGs.5A and 5B illustrate approaches for assigning uptake regions a lesion index value ranging from 0 to 3. In the approach shown in FIGs.5A and 5B, a blood-pool (aorta) intensity value is assigned a - 52 - 12297548v2
Attorney Docket No.2010358-0329 lesion index of 1, a liver intensity value is assigned a lesion 2, and a value of twice the liver intensity is assigned a lesion index of 3. A lesion index for a particular uptake region can be determined by first computing a value of an initial uptake region intensity metric for the particular uptake region, such as a mean uptake region intensity (e.g., Q
mean(l) or SUV
mean) and comparing the value of the initial uptake region intensity metric with the reference intensity values. For example, the value of the initial hotspot intensity metric may fall within one of four ranges – [0, SUV
blood], (SUV
blood, SUV
liver], (SUV
liver, 2 x SUV
liver], and greater than 2xSUV
liver (e.g., (2xSUV
liver, ∞)). In certain embodiments, an uptake region may be assigned a lesion index value based on a step function, e.g., as shown in FIG.5A. In certain embodiments, as shown in FIG.5B a lesion index value can then be computed for the particular uptake region based on (i) the value of the initial uptake region intensity metric and (ii) a linear interpolation according to the particular range in which the value of the initial uptake region intensity metric falls, as illustrated in FIG.5B, where the filled and open dots on the horizontal (SUV) and vertical (LI) axes illustrate example values of initial hotspot intensity metrics and resultant lesion index values, respectively. In certain embodiments, if SUV references for either liver or aorta cannot be calculated, or if the aorta value is higher than the liver value, the lesion index will not be calculated and will be displayed as ‘-‘. [0232] A lesion index value according to the mapping scheme described above and illustrated in FIG.5B may, for example, be computed as shown in equation (4), below.

where f
1 f
2 and f
3 are linear interpolations between the respective spans in equation (4). D.iii. Uptake Region / Lesion Volume [0233] In certain embodiments, an uptake region quantification metric may be a volume metric, such as a lesion volume, Q
vol, which provides a measure of size (e.g., volume) of an underlying physical lesion that an uptake region represents. A lesion volume may, in certain embodiments, computed as shown in equations (5a) and (5b), below. - 53 - 12297548v2
Attorney Docket No.2010358-0329 (
5a)
(
5b) ^^^^ ^^^^ ^^^^ ^^^^ ( ^^^^ ) = ^^^^ × ^^^^ ^^^^ where in equation (5a), v
i is a volume of an i
th voxel, and equation (5b) assumes a uniform voxel volume, v, and as before n
l is a number of voxels in a particular hotspot volume, l. In certain embodiments, a voxel volume is computed as ^^^^ = ^^^^ ^^^^ × ^^^^ ^^^^ × ^^^^ ^^^^, where δx, ^^^^ ^^^^, and ^^^^ ^^^^ are grid spacing (e.g., in millimeters, mm) in x, y, and z. In certain embodiments, a lesion volume has units of milliliters (ml). E. Automated Evaluation of Cancer Staging Scores [0234] Turning to FIG.6, in certain embodiments, various approaches for localizing 3D volumes of interest (VOIs) within images, e.g., corresponding to particular organs, and identifying and characterizing uptake regions (e.g., hotspots) corresponding to potential lesions, e.g., including, but not limited to, those described herein, may be used to determine cancer staging scores in an automated fashion. For example, in certain embodiments, in an exemplary process 600 for automatically determining a prostate cancer staging score may utilize, and receive, a 3D functional image 602, such as a PET or SPECT image of a subject. A prostate volume, that corresponds to a prostate within the subject, may be determined (e.g., identified) 604 within the 3D functional image 602. A prostate volume within a 3D functional image may, for example, be determined using various anatomical segmentation techniques described herein, for example by segmenting a 3D anatomical image, such as a CT image, that is co-aligned with the 3D functional image to determine a segmentation mask representing a region of the CT image determined to correspond to the prostate. The segmentation mask can then be mapped to the 3D functional image to identify, as the prostate volume, a corresponding region within the 3D functional image. [0235] In certain embodiments, uptake regions that represent underlying physical lesions within the subject are localized 606 within the 3D functional image. As described herein, uptake regions may be hotspots, and may be localized – e.g., detected and/or segmented – using various techniques, such as machine learning based techniques, as described herein. In certain embodiments, localized uptake regions are limited to those - 54 - 12297548v2
Attorney Docket No.2010358-0329 determined represent underlying physical lesions and/or radiopharmaceutical uptake within the subject’s prostate and/or its vicinity. These prostate uptake regions may be identified as those having volumes that overlap, e.g., at least in part, with, and/or are entirely within, the prostate volume. [0236] In certain embodiments, for values of uptake region intensity metric(s) are determined for each localized (e.g., prostate) uptake region 608. For example, for each uptake region intensity metric, a value of a maximum, mean, median, peak, etc., intensity metric may be determined, e.g., as described herein. In certain embodiments, uptake region intensity metrics determined for each uptake region include values of lesion indices, determined, for example, using reference intensity values, such as those of a liver and/or aorta region, for example as described herein. In certain embodiments, for example where a radiopharmaceutical used to obtain the 3D functional image is or comprises a PSMA binding agent, a lesion index may be referred to as a PSMA expression score. [0237] In certain embodiments, a spatial location of each uptake region is analyzed and compared with one or more prostate zones 610, and a set of assigned prostate zones determined, to reflect a spatial location and/or distribution of intensities within the uptake region. For example, a prostate may be divided into 4 zones according to their biological function. For example, a prostate and its immediate vicinity may be subdivided into a central zone (CZ) (e.g., a zone that surrounds the ejaculatory ducts and comprises about 25% of a prostate’s total mass), a transitional zone (TZ) (e.g., a part of the prostate that surrounds the urethra), and a peripheral zone (PZ) (e.g., a zone situated toward a back of the gland, where a majority of the glandular tissue sits. In certain embodiments, other zones, such as a fibromuscular zone (FZ) (e.g., anterior zone), may be used as well. In certain embodiments, a FZ may be challenging to identify on a CT image, and not included in a model. In certain embodiments, a ureter zone (UZ) may also be included. A reference model, e.g., an atlas image, with boundaries of the particular prostate zones may be aligned to the 3D functional image, and a spatial extent of each uptake region compared with the so aligned reference model, to determine which of the various prostate zones the uptake region is located within and/or overlaps with. An uptake region may be associated with a set of assigned zones that it overlaps with, for example a single zone or multiple zones. [0238] In certain embodiments, once determined, the values of the uptake region intensity metric(s) and the prostate zone assignments may be used to determine a prostate cancer staging score 612. - 55 - 12297548v2
Attorney Docket No.2010358-0329 F. Neural Network-Based Prediction of Metastases [0239] In certain embodiments, the present disclosure provides systems and methods for predicting presence and/or risk of metastases in a subject, based on medical image data that reflects presence of localized disease. In particular, among other things, metastatic disease prediction technologies of the present disclosure leverage artificial neural networks (ANNs) to analyze image data that is associated with and reflects presence of localized disease, such as images of regions about a single primary tumor and/or one or more lesions confined to a single tissue region or organ, where cancer was first detected. Among other things, technologies described herein make use of the insight that, while such images of localized disease may not include conventional or express hallmarks of metastatic disease, such as presence of hotspots dispersed outside the primary organ and/or tumor, they nonetheless may reflect patterns, features, such as particular intensity patterns and/or hotspot features, etc. that are indicative of (e.g., correlate with) presence and/or risk of metastases. While such patterns and their relationship / implications for whether a particular patient has or will develop metastatic disease may escape conventional image analysis methods and/or review by human professionals, such as physicians, radiologists, and the like, ANN technologies of the present disclosure can be trained and used to generate predictions of whether a patient has or will develop metastases – i.e., one or more cancerous lesions outside of a primary tumor and/or site (e.g., organ or tissue region) where cancer was originally detected. [0240] Approaches for leveraging machine learning technologies to analyze nuclear medicine images of localized disease in order to predict presence and/or risk of a particular disease state, such as whether a patient has or will develop metastases are described, for example, in U.S. Patent Application No.16/734,609, filed January 6, 2020, and U.S. Patent Application No.17/762,796, filed March 23, 2022 the contents of each of which are incorporated herein in their entirety. The present disclosure extends and improves upon these techniques by incorporating the insight that performance of machine learning techniques can be improved by incorporating an additional channel of input that corresponds to a hotspot mask, identifying automatically segmented hotspot volumes. As described and demonstrated in further detail herein, this additional channel of input improves the machine learning algorithm’s ability to identify and focus its attention on important regions in images, allowing it to generate accurate predictions on limited training data. - 56 - 12297548v2
Attorney Docket No.2010358-0329 [0241] Accordingly, as shown in FIGs.7A and 7B, technologies of the present disclosure include processes, such as example process, 700, whereby one or more medical image(s) are received or otherwise obtained 702, by a processor, such as a cloud-based or local image storage and analysis system. In certain embodiments, one or more medical images are or comprise anatomical and functional images, such as co-aligned anatomical and functional image pairs or composite images, comprising an anatomical and functional image acquired at a substantially same time and/or of a substantially same portion of a subject. As described in further detail herein, anatomical images may include images such as computed tomography (CT) images, magnetic resonance images (MRIs), while functional images may include nuclear medicine images, such as positron emission tomography (PET) and single photon emission computed tomography (SPECT) images. [0242] Medical images 102 may be analyzed to identify target volume(s) 704 comprising representations of primary tumor regions that are associated with localized disease, as well as to detect suspect regions 706 – portions of images that are determined likely to represent underlying physical lesions within a patient. Such suspect regions may be determined automatically or semi-automatically, for example by a software program, computer-aided analysis technique, such as a machine learning model or other computer- implemented process, with or without interaction and/or review by an operator. [0243] As shown in FIG.7B, in certain embodiments, voxels of medical images within an extracted target volume 754 as well as an identification of detected suspect regions 756 are fed as two channels of input into a neural network 758, which generates, as output, a metastasis prediction 708, 760. A metastasis prediction may be a score or classification. For example, a metastasis score may quantify a likelihood of a patient having or at risk of developing metastases. A metastasis classification may be a binary classification, such as a 0 or 1 value, indicative of whether the patient is likely to have or develop metastatic disease or not. In certain embodiments, as shown in FIG.7C, neural network determined predictions (e.g., likelihood values) may be combined with patient attributes, such as clinicopathological measurements and/or computed features via a classifier 764 to create a fused model that leverages multiple data sources and types to predict 766 presence and/or risk of metastases (e.g., synchronous metastases) with high accuracy. [0244] In certain embodiments, metastases predictions may represent predictions of whether a subject has or likely will develop metastases. In certain embodiments, metastases predictions may reflect whether a subject has or likely will develop metastases within a - 57 - 12297548v2
Attorney Docket No.2010358-0329 particular time-period, e.g., following a date one when the one or more medical images were acquired and/or after initial diagnosis. For example, a metastasis prediction may represent a prediction of whether a subject has or will develop synchronous metastases – i.e., metastases that may already present in the subject (e.g., but not necessarily having been detected) – or metastases that will appear (e.g., and be detectable) within less than a year (e.g., less than six months). In this manner, among other things, approaches of the present disclosure can predict whether or not a given patient is at risk of harboring occult (e.g., undetectable via imaging) metastatic disease that can be manifested by metastatic progression subsequent to curative intent therapy. [0245] Among other things, metastases predictions may be displayed and/or otherwise provided for use in a decision support system 710, to, for example, assist physicians in disease staging, counseling, and treatment course determinations. [0246] As described in further detail herein, nuclear medicine images acquired using prostate specific membrane antigen (PSMA) targeting agents, such as [18F]DCFPyL (PyL
TM) are of particular interest to prostate cancer staging and diagnosis. [F18]DCFPyL (PyL) is a PSMA targeted imaging agent shown to have greater accuracy, specificity, and sensitivity than conventional imaging in the detection of metastatic disease and it has been established for initial staging. While a primary use of PSMA PET/CT has been to improved staging accuracy, the present disclosure recognizes that there may be untapped data contained within these PET/CT scans that can be used for meaningful prognostic evaluation, namely, to provide added insights into disease biology, including the presence of co-existing metastatic disease. [0247] Among other things, while prostate cancers may, e.g., initially, be localized, certain localized prostate cancers pose a high risk of metastatic progression to lethal disease, while others are at lower risk of such progression, and are less aggressive. While more aggressive disease may warrant an aggressive initial treatment approach, prostate cancers that do not pose a high risk of metastatic progression may be better treated (e.g., particularly in view of potential quality of life reducing side effects from aggressive treatment) via a more targeted and/or less aggressive approach. Accordingly, accurate prognostic information at a time of diagnosis can improve the ability of physicians and their patients to select and achieve better courses of action. Currently, at the clinical stage, serum Prostate Specific Antigen (PSA), Gleason Grade, and percent positive cores are typically used to assess risk of metastatic progression, and may be combined with transcriptomic data. Typically, however, - 58 - 12297548v2
Attorney Docket No.2010358-0329 current approaches utilize imaging scans only to determine stage (e.g., metastatic or not, and number of lesions). Technologies of the present disclosure allow for expanded use of imaging data, in particular, in fulfilling a need for accurate prognostic information early on, allowing for prediction of metastatic disease risk and its use in improving patient outcomes. [0248] Moreover, in certain embodiments, metastases risk prediction technologies described herein may leverage the insights that machine learning models that are trained on certain types of, e.g., more plentiful, data, can be used to generate predictions about disease prediction that for which exact examples can be more time consuming and/or challenging to obtain, resulting in insufficient data. For example, as demonstrated herein, it is possible to train a machine learning model on images for patients with synchronous metastases – i.e., for which metastases already have been observed, or will be observed within a very short time frame, and then, once the model is a trained, a new image, of a new patient, can be received and evaluated (by the model) to generate a metastasis score/prediction. Even if this new patient presents with localized disease (e.g., no lesion spread outside a localized primary tumor region) in the near term, the generated metastases score can be used as an accurate predictor of a risk that the patient will develop metastases well into the future, for example, after curative therapy. [0249] From a practical standpoint, training a machine learning model on images of patients with synchronous metastases is advantageous since it is generally known whether a patient has synchronous metastases or not when they are imaged or shortly thereafter (e.g., since six (6) months is a short timeframe). That is, some of the images themselves might have metastases showing up in them, and for the ones that might not, it will be apparent quickly (e.g., within six months) if the patient does or doesn’t get synchronous metastases. Accordingly, medical images labeled as corresponding to patients with synchronous metastases or not are a relatively abundant dataset. On the other hand, for metachronous metastases / metastases that will develop in the future, to obtain directly corresponding data, one would need to take an image of a patient that presents with localized disease, wait until they are treated, then watch them for a relatively long period of time (e.g., years), to determine if their cancer spreads (metastasizes), and then, finally, label the images accordingly (i.e., label medical images according to whether each patient’s cancer metastasized or not, several years later). [0250] To address this challenge, among other things, as Example 3 described herein, uses a small dataset (e.g., not enough to directly train a neural network model, but enough to - 59 - 12297548v2
Attorney Docket No.2010358-0329 tests hypotheses) of medical images where patients initially presented with localized disease, and did not develop metastases until a significant time period later, e.g., after curative intent therapy. A model that was trained on a different dataset – of synchronous metastases images – may be used to analyze the early-stage images of patients that presented with localized disease and generate a metastases score that accurately classified patients that did or did not develop metachronous metastases. Accordingly, in certain embodiments, technologies described herein address challenges associated with limited data availability, allowing for machine learning models trained on certain images of synchronous metastases to then be used, at inference stages, to predict whether a subject will develop metachronous metastases. [0251] While described herein with particular emphasis on and/or relevance to prostate cancer, metastases prediction technologies of the present disclosure may be utilized for other types of cancer, such breast cancer, colorectal cancer, esophageal cancer, lung cancer, ovarian cancer, pancreatic cancer, e.g., to predict, based on images of localized disease within a target volume corresponding to a primary tumor region within the subject, will metastases. For example, for a subject with breast cancer, a primary tumor region may be or comprise one or both breasts of the subject; for a subject with colorectal cancer, a primary tumor region may be or comprises a colon of the subject; for a subject with esophageal cancer, a primary tumor region may be or comprises an esophagus of the subject; for a subject with lung cancer, a primary tumor region may be or comprises one or both lungs of the subject; for a subject with ovarian cancer, a primary tumor region may be or comprises one or both ovaries of the subject; for a subject with pancreatic cancer, a primary tumor region may be or comprises a pancreas of the subject; etc. [0252] Turning to FIG.8A, in certain embodiments, image analysis technologies of the present disclosure leverage techniques for detecting, segmenting, and quantifying hotspots to improve accuracy of machine learning models in prediction of metastatic disease risk based on images of primary tumor. [0253] For example, FIG.8A shows an example process 800 for predicting metastatic disease risk for a subject presenting (e.g., having been diagnosed with) localized prostate cancer. As shown in FIG.8A, one or more medical images of the subject are obtained 802. These may be medical images acquired and/or used to arrive at an initial detection and/or diagnosis of localized disease or may have been obtained in (e.g., additional) follow up visits. In certain embodiments, one or more medical images are obtained within a particular (e.g., short) time period following initial diagnosis and/or detection, such as within a month, three - 60 - 12297548v2
Attorney Docket No.2010358-0329 months, six months, or a year. In certain embodiments, one or more medical images are obtained prior to initial treatment. For example, as described in further detail herein, medical images may be obtained and analyzed using the metastatic disease prediction technologies of the present disclosure in order to assist with determining a course of treatment, for example whether a relatively mild, targeted treatment is appropriate or if a more aggressive course is warranted at the outset, for example if a patient is determined to be at high risk for having or developing synchronous metastases. [0254] In certain embodiments, one or more medical images are or comprise anatomical images, such as CT images or MRIs. In certain embodiments, one or more medical images are or comprise functional images, such as nuclear medicine images, including, but not limited to, PET and SPECT images. In certain embodiments, one or more medical images are or comprise one or more pairs of co-aligned anatomical and functional images. In certain embodiments, one or more medical images are or comprise one or more composite or fused anatomical and functional images, for example PET/CT and/or SPECT/CT images. F.i. Input Channels and Features [0255] Medical images may be analyzed, for example as described in Sections A-D, herein, to identify (i) a volume that corresponds to or comprises a prostate of the subject 804, which is the site of primary tumor and/or localized disease in prostate cancer, and (ii) suspect regions of images likely to represent underlying (e.g., individual) lesions 806. As shown in FIG.8B, these identified regions – the prostate volume 854 and suspect regions (e.g., a hotspot mask, 856) – may then be used as or to create two channels of input for a machine learning model 858. [0256] For example, as described herein (e.g., in Section B, above), an anatomical and nuclear medicine composite image, such as a PET/CT image, may be analyzed to automatically identify a volume of interest (VOI) that corresponds to or comprises a representation of a prostate within the anatomical image. The VOI may then be mapped to the co-aligned nuclear medicine image of the composite image and used to identify a corresponding volume within the nuclear medicine image. Voxels within this corresponding nuclear medicine image volume may then be used as a first, prostate intensity, channel of input. - 61 - 12297548v2
Attorney Docket No.2010358-0329 [0257] Suspect regions can be identified by automatically detecting hotspots within the nuclear medicine image, for example, as described in Section C, above. In certain embodiments, a 3D hotspot mask that identifies volumes of hotspots within the functional image may then be used as a second, hotspot mask channel, of input to the machine learning model. F.ii Model Outputs [0258] Turning again to FIGs 8A and 8B, identified prostate volumes and suspect regions may be used to determine a metastases prediction 808, 860. As shown in FIG.8B, in certain embodiments, a machine learning model may generate, as output, a metastases score or classification 860 based (at least in part) on its received prostate intensity and hotspot mask input channels. For example, a machine learning model may generate, as a metastases score, a likelihood value (e.g., having a value ranging from 0 to 1) that represents a likelihood that a patient has or will develop metastases, for example within a particular time window (e.g., synchronous metastases). In certain embodiments, a binary classification may be determined using a generated likelihood value, for example by comparing it to a threshold value. [0259] In certain embodiments, a multi-class classification approach is used, whereby a machine learning model generates, as output, a plurality of likelihood values, representing likelihoods of particular types and/or categories of metastases, as determined by the machine learning model. [0260] In certain embodiments, metastases predictions, such as scores or classifications, may represent predictions of presence and/or risk (e.g., of future) of metastases of particular types, classifications, or in particular locations. For example, metastatic lesions may be classified in terms of their anatomical location and/or lesion sub- type. In certain embodiments, various clinically accepted staging systems may be used to classify lesions, including metastases, such as, without limitation the tumor-node-metastasis (TNM) system, the Lugano system, and the FIGO system. [0261] Metastases prediction technologies of the present disclosure may, accordingly, generate predictions indicative of likelihoods of presence and/or risk of metastases of various types, according to one or more such staging systems. For example, the TNM system is used to stage solid tumors associated with cancers such as prostate cancer, lung cancers, colon - 62 - 12297548v2
Attorney Docket No.2010358-0329 cancers, breast cancers, and bladder cancer. As described, for example in Eiber et al., “Prostate Cancer Molecular Imaging Standardized Evaluation (PROMISE): Proposed miTNM Classification for the Interpretation of PSMA-Ligand PET/CT,” J. Nucl. Med.2018; 59:469-478, the TNM system uses an alphanumeric code to classify disease based on locations and/or number of lesions, with the letter “T” used to identify primary tumor (e.g., in the organ of origin, such as bladder, breast, colon, lung, prostate), “N” identifying whether tumor has spread to local lymph nodes, and “M” identifying distant metastases, beyond nearby lymph nodes and into other regions, such as distant lymph (“Ma”), bone (“Mb”), or other regions (“Mc”). In the context of prostate cancer, lesions in local – e.g., pelvic - lymph (miN) may be identified as belonging to a particular pelvic lymph node sub-region, such as one of a left/right internal iliac, a left or right external iliac, a left or right common iliac, a left or right obturator, a presacral region, or other pelvic region. In certain embodiments, distant lymph node metastases (miMa) may be classified as retroperitoneal (RP), supradiaphragmatic (SD), or other extrapelvic (OE). [0262] In certain embodiments, for example in the context of ovarian, cervical, endometrial, and other cancers involving and/or affecting female reproductive systems, metastases may be classified according to the FIGO system (e.g., stages 0, I, indicating local tumor, stage II indicating invasion of surrounding organs or tissue, stage III indicating spread to distant nodes or other tissue within the pelvis and stage IV indicating distant metastases). For example, metastases prediction technologies described herein may generate predictions or presence and/or risk of disease associated with one or more FIGO system classifications, such as stage II disease, stage III disease, stage IV disease. F.iii Model Architectures [0263] A variety of machine learning architectures may be used in connection with the approaches described herein. In certain embodiments, machine learning models used for generating metastases predictions are neural networks (e.g., ANNs). In certain embodiments, in particular, CNNs are used. - 63 - 12297548v2
Attorney Docket No.2010358-0329 F.iv Fused Models [0264] Turning to FIG.8C, as described herein, in certain embodiments, spatial image analysis approaches using a CNN model may be combined with other patient attributes such as measured and computed clinicopathologic features to create a fused model. For example, in certain embodiments, CNN model output 860 may be used as input, together with patient attributes 862, to a classifier 864 to determine a metastases score/classification 866. [0265] Certain patient attributes, described in further detail herein (e.g., in the Examples) that may be used include, without limitation, one or more of the following: PSA, pathologic grade, percent positive cores, cores positive, Primary Score, miTNM, PSMA expression score, uptake SUV peak value, uptake prostate zone, uptake type (focal vs. diffuse), uptake extends outside prostate, aorta SUV mean, liver SUV mean, overall upstaging risk, N upstaging, M upstaging. [0266] Various classifier models may be used, including, without limitation, logistic regression models, support vector machines, decision trees (e.g., random forests, XGboost), Naïve Bayes classifiers, and the like. F.v Prognosis at Subsequent Time Points and Following Therapy [0267] In certain embodiments, metastasis prediction technologies of the present disclosure may be used to predict whether a patient has or will develop metastases. For example, in certain embodiments, a patient may initially present with localized disease, and medical images may be indicative of a finding of localized disease. [0268] For example, in certain embodiments, a medical image is indicative of localized disease if lesions appearing in the medical image are limited to (e.g., locations within) a primary tumor region. For example, a patient may initially be diagnosed with prostate cancer and medical images, such as CT, PET, PET/CT, etc. images, show representations of lesions, such as hotspots within a PET image, in a primary tumor volume – e.g., a prostate region [e.g., and/or, optionally, a volume enclosing a prostate and tissue within a vicinity of the prostate (e.g., within 1 mm, 5 mm, 10 mm, 1 cm, 2 cm, 5 cm, etc.)], but not conclusive evidence of lesions outside the primary tumor volume. For example, a PET image may not show any hotspots outside of a primary tumor region. In certain - 64 - 12297548v2
Attorney Docket No.2010358-0329 embodiments, a medical image may contain image features outside a primary tumor region, but these features may not meet criteria for concluding that they represent metastases outside a primary tumor region. For example, hotspots may appear in a PET image outside a primary tumor volume but may not be of sufficient size and/or intensity to be characterized conclusively as metastatic lesions. In certain embodiments, other criteria may be used. For example, in certain embodiments, hotspots outside of a primary tumor region may be evaluated by a machine learning model and assigned a likelihood score representing a likelihood (e.g., as determined by the machine learning model) that they are a metastatic lesion. [0269] In certain embodiments, a medical image may be indicative of localized disease based on an evaluation of a medical professional, such as a physician, radiologist, etc. Such medical images may be included in and/or associated with a signed report by a particular medical professional that comprises a conclusion of localized disease. [0270] In certain embodiments, systems and methods of the present disclosure may receive, as input, medical images indicative of localized disease and determine a metastases score as described herein. A metastases score may be indicative of presence of metastases, which may be indicative of presence of, for example, occult metastases or synchronous metastases that were not present in the medical image or missed by a diagnosing practitioner. A metastases score may be indicative that a patient will develop metachronous metastases, e.g., following treatment. [0271] In certain embodiments, machine learning models may be trained to evaluate presence of synchronous metastases and then used to generate, at inference, predictions of whether patients presenting with localized disease will develop metastases, for example, at future times such as following treatment. For example, as demonstrated in Example 3, this approach provides accurate predictions. Without wishing to be bound to any particular theory this approach is believed to be justified by the premise that most early metastatic progression events occur consequent to growth of co-existing occult metastases at the time of curative intent therapy. Among other things, this approach allows for training strategies to benefit from potentially larger amounts of data, since it makes use of images obtained at a single time point. Otherwise, training examples corresponding exactly to the desired scenario – patients presenting initially with localized disease and then developing or not developing metastases later on, following treatment, would require imaging patients at an initial visit and then waiting, potentially several years, for them to undergo therapy and subsequent follow up - 65 - 12297548v2
Attorney Docket No.2010358-0329 imaging and diagnosis in order to label images from the initial visit as positive (e.g., the patient developed metastases later on) or negative (e.g., the patient did not develop metastases later on) examples. [0272] Accordingly, in certain embodiments, a machine learning model may be trained using a dataset comprising a plurality of example images, including images of purely localized disease (localized disease example) and images showing synchronous metastases (synchronous metastases examples). While the full training example images may show synchronous metastases or not (allowing them to be immediately labeled as positive or negative examples), the machine learning model may be trained on input corresponding a primary tumor region only, thereby causing the model to learn to classify patients as positive or negative for synchronous metastases based on image data within the primary tumor region alone. Following training, the (e.g., trained machine learning) model may be provided images of patients obtained at, for example, an initial (e.g., pre-treatment) visit. For images that are indicative of localized disease, as determined via another computational approach and/or by evaluation by a medical professional, the machine learning model may generate a metastases score, as it did during training. Although during training, parameters of the machine learning model may have been refined to allow for accurate prediction of synchronous metastases, values generated during inference may be used as a risk/likelihood that a patient initially presenting only with localized disease will, at a later date, present metastases (e.g., metachronous metastases). G. Guidance for Patient Diagnosis and Treatment [0273] Turning again to FIG.8A, metastases predictions of the present disclosure may, for example, be used to provide guidance for patient diagnosis and treatment decisions, for example being displayed and/or provided as part of a decision support system 810. [0274] The approaches described herein may be used, for example, in an initial visit, prior to therapy. Therapy and/or treatment approaches may be determined based on predictions, for example more aggressive therapy. For example, a patient may present with localized disease based on evaluation of medical images obtained at an initial staging or pre- treatment visit. These initial medical images may be analyzed by approaches described herein to produce metastases scores reflecting a risk/likelihood that the patient is prone to or will eventually develop metastases, e.g., at a later time. If metastases score is high, e.g., - 66 - 12297548v2
Attorney Docket No.2010358-0329 reflecting a high likelihood of metastases, for example, a more aggressive treatment approach may be determined to be prudent and selected, e.g., to compensate for/overcome this risk. H. Computer System and Network Architecture [0275] Certain embodiments described herein make use of computer algorithms in the form of software instructions executed by a computer processor. In certain embodiments, the software instructions include a machine learning module, also referred to herein as artificial intelligence software. As used herein, a machine learning module refers to a computer implemented process (e.g., a software function) that implements one or more specific machine learning techniques, e.g., artificial neural networks (ANNs), e.g., convolutional neural networks (CNNs), e.g., recursive neural networks, e.g., recurrent neural networks such as long short-term memory (LSTM) or Bilateral long short-term memory (Bi-LSTM), random forest, decision trees, support vector machines, and the like, in order to determine, for a given input, one or more output values. [0276] In certain embodiments, machine learning modules implementing machine learning techniques are trained, for example using datasets that include categories of data described herein (e.g., CT images, MRI images, PET images, SPECT images). Such training may be used to determine various parameters of machine learning algorithms implemented by a machine learning module, such as weights associated with layers in neural networks. In certain embodiments, once a machine learning module is trained, e.g., to accomplish a specific task such as segmenting anatomical regions, segmenting and/or classifying hotspots, or determining values for prognostic, treatment response, and/or predictive metrics, values of determined parameters are fixed and the (e.g., unchanging, static) machine learning module is used to process new data (e.g., different from the training data) and accomplish its trained task without further updates to its parameters (e.g., the machine learning module does not receive feedback and/or updates). In certain embodiments, machine learning modules may receive feedback, e.g., based on user review of accuracy, and such feedback may be used as additional training data, to dynamically update the machine learning module. In certain embodiments, two or more machine learning modules may be combined and implemented as a single module and/or a single software application. In certain embodiments, two or more machine learning modules may also be implemented separately, e.g., as separate software applications. A machine learning module may be software and/or hardware. For example, a - 67 - 12297548v2
Attorney Docket No.2010358-0329 machine learning module may be implemented entirely as software, or certain functions of an ANN module may be carried out via specialized hardware (e.g., via an application specific integrated circuit (ASIC)). [0277] Turning to FIG.9, an implementation of a network environment 900 for use in providing systems, methods, and architectures as described herein is shown and described. In brief overview, referring now to FIG.9, a block diagram of an exemplary cloud computing environment 900 is shown and described. The cloud computing environment 900 may include one or more resource providers 902a, 902b, 902c (collectively, 902). Each resource provider 902 may include computing resources. In some implementations, computing resources may include any hardware and/or software used to process data. For example, computing resources may include hardware and/or software capable of executing algorithms, computer programs, and/or computer applications. In some implementations, exemplary computing resources may include application servers and/or databases with storage and retrieval capabilities. Each resource provider 902 may be connected to any other resource provider 902 in the cloud computing environment 900. In some implementations, the resource providers 902 may be connected over a computer network 908. Each resource provider 902 may be connected to one or more computing device 904a, 904b, 904c (collectively, 904), over the computer network 908. [0278] The cloud computing environment 900 may include a resource manager 906. The resource manager 906 may be connected to the resource providers 902 and the computing devices 904 over the computer network 908. In some implementations, the resource manager 906 may facilitate the provision of computing resources by one or more resource providers 902 to one or more computing devices 904. The resource manager 906 may receive a request for a computing resource from a particular computing device 904. The resource manager 906 may identify one or more resource providers 902 capable of providing the computing resource requested by the computing device 904. The resource manager 906 may select a resource provider 902 to provide the computing resource. The resource manager 906 may facilitate a connection between the resource provider 902 and a particular computing device 904. In some implementations, the resource manager 906 may establish a connection between a particular resource provider 902 and a particular computing device 904. In some implementations, the resource manager 906 may redirect a particular computing device 904 to a particular resource provider 902 with the requested computing resource. - 68 - 12297548v2
Attorney Docket No.2010358-0329 [0279] FIG.10 shows an example of a computing device 1000 and a mobile computing device 1050 that can be used to implement the techniques described in this disclosure. The computing device 1000 is intended to represent various forms of digital computers, such as laptops, desktops, workstations, personal digital assistants, servers, blade servers, mainframes, and other appropriate computers. The mobile computing device 1050 is intended to represent various forms of mobile devices, such as personal digital assistants, cellular telephones, smart-phones, and other similar computing devices. The components shown here, their connections and relationships, and their functions, are meant to be examples only, and are not meant to be limiting. [0280] The computing device 1000 includes a processor 1002, a memory 1004, a storage device 1006, a high-speed interface 1008 connecting to the memory 1004 and multiple high-speed expansion ports 1010, and a low-speed interface 1012 connecting to a low-speed expansion port 1014 and the storage device 1006. Each of the processor 1002, the memory 1004, the storage device 1006, the high-speed interface 1008, the high-speed expansion ports 1010, and the low-speed interface 1012, are interconnected using various busses, and may be mounted on a common motherboard or in other manners as appropriate. The processor 1002 can process instructions for execution within the computing device 1000, including instructions stored in the memory 1004 or on the storage device 1006 to display graphical information for a GUI on an external input/output device, such as a display 1016 coupled to the high-speed interface 1008. In other implementations, multiple processors and/or multiple buses may be used, as appropriate, along with multiple memories and types of memory. Also, multiple computing devices may be connected, with each device providing portions of the necessary operations (e.g., as a server bank, a group of blade servers, or a multi-processor system). Thus, as the term is used herein, where a plurality of functions are described as being performed by “a processor”, this encompasses embodiments wherein the plurality of functions are performed by any number of processors (one or more) of any number of computing devices (one or more). Furthermore, where a function is described as being performed by “a processor”, this encompasses embodiments wherein the function is performed by any number of processors (one or more) of any number of computing devices (one or more) (e.g., in a distributed computing system). [0281] The memory 1004 stores information within the computing device 1000. In some implementations, the memory 1004 is a volatile memory unit or units. In some implementations, the memory 1004 is a non-volatile memory unit or units. The memory - 69 - 12297548v2
Attorney Docket No.2010358-0329 1004 may also be another form of computer-readable medium, such as a magnetic or optical disk. [0282] The storage device 1006 is capable of providing mass storage for the computing device 1000. In some implementations, the storage device 1006 may be or contain a computer-readable medium, such as a floppy disk device, a hard disk device, an optical disk device, or a tape device, a flash memory or other similar solid state memory device, or an array of devices, including devices in a storage area network or other configurations. Instructions can be stored in an information carrier. The instructions, when executed by one or more processing devices (for example, processor 1002), perform one or more methods, such as those described above. The instructions can also be stored by one or more storage devices such as computer- or machine-readable mediums (for example, the memory 1004, the storage device 1006, or memory on the processor 1002). [0283] The high-speed interface 1008 manages bandwidth-intensive operations for the computing device 1000, while the low-speed interface 1012 manages lower bandwidth- intensive operations. Such allocation of functions is an example only. In some implementations, the high-speed interface 1008 is coupled to the memory 1004, the display 1016 (e.g., through a graphics processor or accelerator), and to the high-speed expansion ports 1010, which may accept various expansion cards (not shown). In the implementation, the low-speed interface 1012 is coupled to the storage device 1006 and the low-speed expansion port 1014. The low-speed expansion port 1014, which may include various communication ports (e.g., USB, Bluetooth®, Ethernet, wireless Ethernet) may be coupled to one or more input/output devices, such as a keyboard, a pointing device, a scanner, or a networking device such as a switch or router, e.g., through a network adapter. [0284] The computing device 1000 may be implemented in a number of different forms, as shown in the figure. For example, it may be implemented as a standard server 1020, or multiple times in a group of such servers. In addition, it may be implemented in a personal computer such as a laptop computer 1022. It may also be implemented as part of a rack server system 1024. Alternatively, components from the computing device 1000 may be combined with other components in a mobile device (not shown), such as a mobile computing device 1050. Each of such devices may contain one or more of the computing device 1000 and the mobile computing device 1050, and an entire system may be made up of multiple computing devices communicating with each other. - 70 - 12297548v2
Attorney Docket No.2010358-0329 [0285] The mobile computing device 1050 includes a processor 1052, a memory 1064, an input/output device such as a display 1054, a communication interface 1066, and a transceiver 1068, among other components. The mobile computing device 1050 may also be provided with a storage device, such as a micro-drive or other device, to provide additional storage. Each of the processor 1052, the memory 1064, the display 1054, the communication interface 1066, and the transceiver 1068, are interconnected using various buses, and several of the components may be mounted on a common motherboard or in other manners as appropriate. [0286] The processor 1052 can execute instructions within the mobile computing device 1050, including instructions stored in the memory 1064. The processor 1052 may be implemented as a chipset of chips that include separate and multiple analog and digital processors. The processor 1052 may provide, for example, for coordination of the other components of the mobile computing device 1050, such as control of user interfaces, applications run by the mobile computing device 1050, and wireless communication by the mobile computing device 1050. [0287] The processor 1052 may communicate with a user through a control interface 1058 and a display interface 1056 coupled to the display 1054. The display 1054 may be, for example, a TFT (Thin-Film-Transistor Liquid Crystal Display) display or an OLED (Organic Light Emitting Diode) display, or other appropriate display technology. The display interface 1056 may comprise appropriate circuitry for driving the display 1054 to present graphical and other information to a user. The control interface 1058 may receive commands from a user and convert them for submission to the processor 1052. In addition, an external interface 1062 may provide communication with the processor 1052, so as to enable near area communication of the mobile computing device 1050 with other devices. The external interface 1062 may provide, for example, for wired communication in some implementations, or for wireless communication in other implementations, and multiple interfaces may also be used. [0288] The memory 1064 stores information within the mobile computing device 1050. The memory 1064 can be implemented as one or more of a computer-readable medium or media, a volatile memory unit or units, or a non-volatile memory unit or units. An expansion memory 1074 may also be provided and connected to the mobile computing device 1050 through an expansion interface 1072, which may include, for example, a SIMM (Single In Line Memory Module) card interface. The expansion memory 1074 may provide - 71 - 12297548v2
Attorney Docket No.2010358-0329 extra storage space for the mobile computing device 1050, or may also store applications or other information for the mobile computing device 1050. Specifically, the expansion memory 1074 may include instructions to carry out or supplement the processes described above, and may include secure information also. Thus, for example, the expansion memory 1074 may be provide as a security module for the mobile computing device 1050, and may be programmed with instructions that permit secure use of the mobile computing device 1050. In addition, secure applications may be provided via the SIMM cards, along with additional information, such as placing identifying information on the SIMM card in a non-hackable manner. [0289] The memory may include, for example, flash memory and/or NVRAM memory (non-volatile random access memory), as discussed below. In some implementations, instructions are stored in an information carrier. The instructions, when executed by one or more processing devices (for example, processor 1052), perform one or more methods, such as those described above. The instructions can also be stored by one or more storage devices, such as one or more computer- or machine-readable mediums (for example, the memory 1064, the expansion memory 1074, or memory on the processor 1052). In some implementations, the instructions can be received in a propagated signal, for example, over the transceiver 1068 or the external interface 1062. [0290] The mobile computing device 1050 may communicate wirelessly through the communication interface 1066, which may include digital signal processing circuitry where necessary. The communication interface 1066 may provide for communications under various modes or protocols, such as GSM voice calls (Global System for Mobile communications), SMS (Short Message Service), EMS (Enhanced Messaging Service), or MMS messaging (Multimedia Messaging Service), CDMA (code division multiple access), TDMA (time division multiple access), PDC (Personal Digital Cellular), WCDMA (Wideband Code Division Multiple Access), CDMA2000, or GPRS (General Packet Radio Service), among others. Such communication may occur, for example, through the transceiver 1068 using a radio-frequency. In addition, short-range communication may occur, such as using a Bluetooth®, Wi-Fi™, or other such transceiver (not shown). In addition, a GPS (Global Positioning System) receiver module 1070 may provide additional navigation- and location-related wireless data to the mobile computing device 1050, which may be used as appropriate by applications running on the mobile computing device 1050. - 72 - 12297548v2
Attorney Docket No.2010358-0329 [0291] The mobile computing device 1050 may also communicate audibly using an audio codec 1060, which may receive spoken information from a user and convert it to usable digital information. The audio codec 1060 may likewise generate audible sound for a user, such as through a speaker, e.g., in a handset of the mobile computing device 1050. Such sound may include sound from voice telephone calls, may include recorded sound (e.g., voice messages, music files, etc.) and may also include sound generated by applications operating on the mobile computing device 1050. [0292] The mobile computing device 1050 may be implemented in a number of different forms, as shown in the figure. For example, it may be implemented as a cellular telephone 1080. It may also be implemented as part of a smart-phone 1082, personal digital assistant, or other similar mobile device. [0293] Various implementations of the systems and techniques described here can be realized in digital electronic circuitry, integrated circuitry, specially designed ASICs (application specific integrated circuits), computer hardware, firmware, software, and/or combinations thereof. These various implementations can include implementation in one or more computer programs that are executable and/or interpretable on a programmable system including at least one programmable processor, which may be special or general purpose, coupled to receive data and instructions from, and to transmit data and instructions to, a storage system, at least one input device, and at least one output device. [0294] Actions associated with implementing the systems may be performed by one or more programmable processors executing one or more computer programs. All or part of the systems may be implemented as special purpose logic circuitry, for example, a field programmable gate array (FPGA) or an application-specific integrated circuit (ASIC), or both. All or part of the systems may also be implemented as special purpose logic circuitry, for example, a specially designed (or configured) central processing unit (CPU), conventional central processing units (CPU) a graphics processing unit (GPU), and/or a tensor processing unit (TPU). [0295] These computer programs (also known as programs, software, software applications or code) include machine instructions for a programmable processor, and can be implemented in a high-level procedural and/or object-oriented programming language, and/or in assembly/machine language. As used herein, the terms machine-readable medium and computer-readable medium refer to any computer program product, apparatus and/or device - 73 - 12297548v2
Attorney Docket No.2010358-0329 (e.g., magnetic discs, optical disks, memory, Programmable Logic Devices (PLDs)) used to provide machine instructions and/or data to a programmable processor, including a machine- readable medium that receives machine instructions as a machine-readable signal. The term machine-readable signal refers to any signal used to provide machine instructions and/or data to a programmable processor. [0296] To provide for interaction with a user, the systems and techniques described here can be implemented on a computer having a display device (e.g., a CRT (cathode ray tube) or LCD (liquid crystal display) monitor) for displaying information to the user and a keyboard and a pointing device (e.g., a mouse or a trackball) by which the user can provide input to the computer. Other kinds of devices can be used to provide for interaction with a user as well; for example, feedback provided to the user can be any form of sensory feedback (e.g., visual feedback, auditory feedback, or tactile feedback); and input from the user can be received in any form, including acoustic, speech, or tactile input. [0297] The systems and techniques described here can be implemented in a computing system that includes a back end component (e.g., as a data server), or that includes a middleware component (e.g., an application server), or that includes a front end component (e.g., a client computer having a graphical user interface or a Web browser through which a user can interact with an implementation of the systems and techniques described here), or any combination of such back end, middleware, or front end components. The components of the system can be interconnected by any form or medium of digital data communication (e.g., a communication network). Examples of communication networks include a local area network (LAN), a wide area network (WAN), and the Internet. [0298] The computing system can include clients and servers. A client and server are generally remote from each other and typically interact through a communication network. The relationship of client and server arises by virtue of computer programs running on the respective computers and having a client-server relationship to each other. [0299] In some implementations, modules described herein can be separated, combined or incorporated into single or combined modules. The modules depicted in the figures are not intended to limit the systems described herein to the software architectures shown therein. [0300] Elements of different implementations described herein may be combined to form other implementations not specifically set forth above. Elements may be left out of the - 74 - 12297548v2
Attorney Docket No.2010358-0329 processes, computer programs, databases, etc. described herein without adversely affecting their operation. In addition, the logic flows depicted in the figures do not require the particular order shown, or sequential order, to achieve desirable results. Various separate elements may be combined into one or more individual elements to perform the functions described herein. [0301] Throughout the description, where apparatus and systems are described as having, including, or comprising specific components, or where processes and methods are described as having, including, or comprising specific steps, it is contemplated that, additionally, there are apparatus, and systems of the present invention that consist essentially of, or consist of, the recited components, and that there are processes and methods according to the present invention that consist essentially of, or consist of, the recited processing steps. [0302] It should be understood that the order of steps or order for performing certain action is immaterial so long as the invention remains operable. Moreover, two or more steps or actions may be conducted simultaneously. [0303] While the invention has been particularly shown and described with reference to specific preferred embodiments, it should be understood by those skilled in the art that various changes in form and detail may be made therein without departing from the spirit and scope of the invention as defined by the appended claims. I. Imaging Agents [0304] As described herein, a variety of radionuclide labelled PSMA binding agents may be used as radiopharmaceutical imaging agents for nuclear medicine imaging to detect and evaluate prostate cancer. In certain embodiments, certain radionuclide labelled PSMA binding agents are appropriate for PET imaging, while others are suited for SPECT imaging. I.i. PET imaging radionuclide labelled PSMA binding agents [0305] In certain embodiments, a radionuclide labelled PSMA binding agent is a radionuclide labelled PSMA binding agent appropriate for PET imaging. [0306] In certain embodiments, a radionuclide labelled PSMA binding agent comprises [18F]DCFPyL (also referred to as PyL
TM; also referred to as DCFPyL-18F): - 75 - 12297548v2
Attorney Docket No.2010358-0329
[18F]DCFPyL, or a pharmaceutically acceptable salt thereof. [0307] In certain embodiments, a radionuclide labelled PSMA binding agent comprises [18F]DCFBC:
[18F]DCFBC, or a pharmaceutically acceptable salt thereof. [0308] In certain embodiments, a radionuclide labelled PSMA binding agent comprises
68Ga-PSMA-HBED-CC (also referred to as
68Ga-PSMA-11):
6
8Ga-PSMA-HBED-CC, or a pharmaceutically acceptable salt thereof. [0309] In certain embodiments, a radionuclide labelled PSMA binding agent comprises PSMA-617: - 76 - 12297548v2
Attorney Docket No.2010358-0329
PSMA-617, or a pharmaceutically acceptable salt thereof. In certain embodiments, the radionuclide labelled PSMA binding agent comprises
68Ga-PSMA-617, which is PSMA-617 labelled with
68Ga, or a pharmaceutically acceptable salt thereof. In certain embodiments, a radionuclide labelled PSMA binding agent comprises
177Lu-PSMA-617, which is PSMA-617 labelled with
177Lu, or a pharmaceutically acceptable salt thereof. [0310] In certain embodiments, a radionuclide labelled PSMA binding agent comprises PSMA-I&T:
PSMA-I&T, or a pharmaceutically acceptable salt thereof. In certain embodiments, a radionuclide labelled PSMA binding agent comprises
68Ga-PSMA-I&T, which is PSMA-I&T labelled with
68Ga, or a pharmaceutically acceptable salt thereof. - 77 - 12297548v2
Attorney Docket No.2010358-0329 [0311] In certain embodiments, a radionuclide labelled PSMA binding agent comprises PSMA-1007:
PSMA-1007, or a pharmaceutically acceptable salt thereof. In certain embodiments, a radionuclide labelled PSMA binding agent comprises 18F-PSMA-1007, which is PSMA-1007 labelled with 18F, or a pharmaceutically acceptable salt thereof. [0312] In certain embodiments, a radionuclide labeled PSMA binding agent comprises 18F-JK-PSMA-7:
18F-JK-PSMA-7, or a pharmaceutically acceptable salt thereof. [0313] In certain embodiments, a radionuclide labeled PSMA binding agent comprises (18F) rhPSMA-7.3 (e.g., POSLUMA®, also described at https://www.posluma.com/prescribing-information.pdf): - 78 - 12297548v2
Attorney Docket No.2010358-0329
(18F) rhPSMA-7.3, or a pharmaceutically acceptable salt thereof. I.ii. SPECT imaging radionuclide labelled PSMA binding agents [0314] In certain embodiments, a radionuclide labelled PSMA binding agent is a radionuclide labelled PSMA binding agent appropriate for SPECT imaging. [0315] In certain embodiments, a radionuclide labelled PSMA binding agent comprises 1404 (also referred to as MIP-1404):
1404, - 79 - 12297548v2
Attorney Docket No.2010358-0329 or a pharmaceutically acceptable salt thereof. [0316] In certain embodiments, a radionuclide labelled PSMA binding agent comprises 1405 (also referred to as MIP-1405):
1405, or a pharmaceutically acceptable salt thereof. [0317] In certain embodiments, a radionuclide labelled PSMA binding agent comprises 1427 (also referred to as MIP-1427):
1427, or a pharmaceutically acceptable salt thereof. [0318] In certain embodiments, a radionuclide labelled PSMA binding agent comprises 1428 (also referred to as MIP-1428): - 80 - 12297548v2
Attorney Docket No.2010358-0329
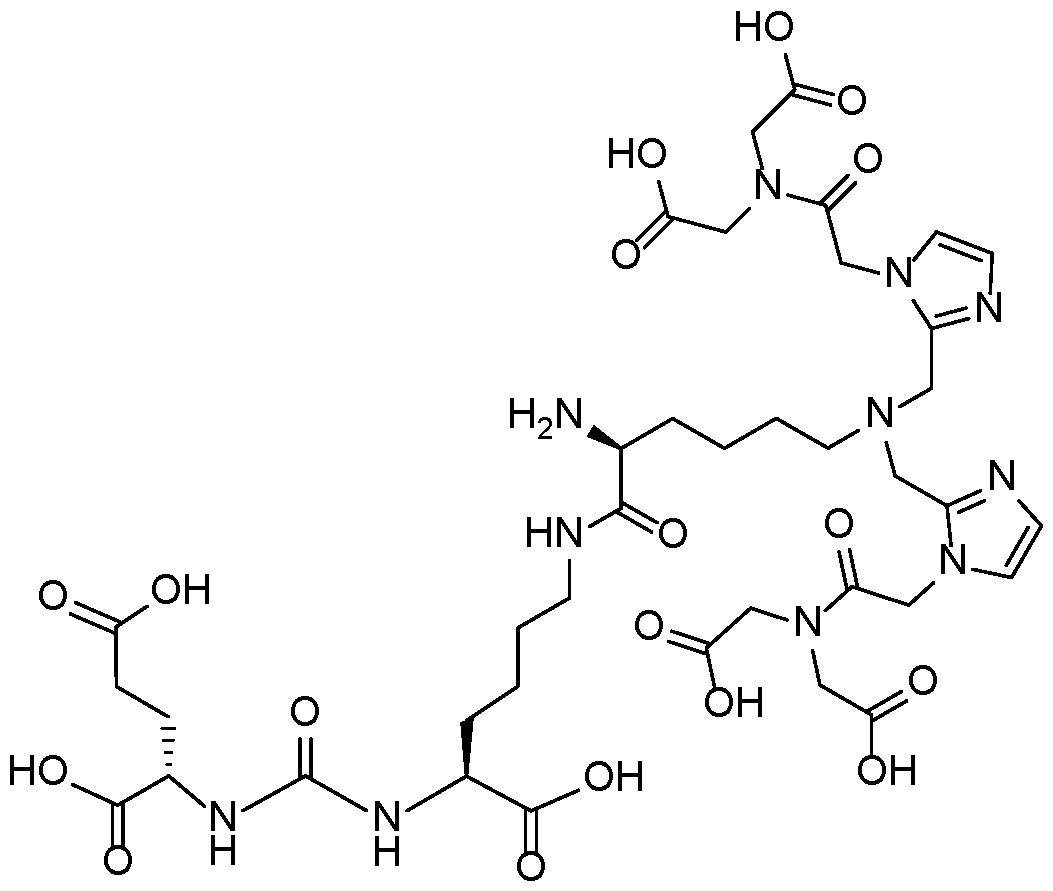
1428, or a pharmaceutically acceptable salt thereof. [0319] In certain embodiments, a PSMA binding agent is labelled with a radionuclide by chelating it to a radioisotope of a metal [e.g., a radioisotope of technetium (Tc) (e.g., technetium-99m (99mTc)); e.g., a radioisotope of rhenium (Re) (e.g., rhenium-188 (188Re); e.g., rhenium-186 (186Re)); e.g., a radioisotope of yttrium (Y) (e.g., 90Y); e.g., a radioisotope of lutetium (Lu)(e.g., 177Lu); e.g., a radioisotope of gallium (Ga) (e.g., 68Ga; e.g., 67Ga); e.g., a radioisotope of indium (e.g., 111In); e.g., a radioisotope of copper (Cu) (e.g., 67Cu)]. [0320] In certain embodiments, 1404 is labelled with a radionuclide (e.g., chelated to a radioisotope of a metal). In certain embodiments, a radionuclide labelled PSMA binding agent comprises
99mTc-MIP-1404, which is 1404 labelled with (e.g., chelated to)
99mTc: - 81 - 12297548v2
Attorney Docket No.2010358-0329
9
9mTc-MIP-1404, or a pharmaceutically acceptable salt thereof. In certain embodiments, 1404 may be chelated to other metal radioisotopes [e.g., a radioisotope of rhenium (Re) (e.g., rhenium-188 (
188Re); e.g., rhenium-186 (186Re)); e.g., a radioisotope of yttrium (Y) (e.g., 90Y); e.g., a radioisotope of lutetium (Lu)(e.g., 177Lu); e.g., a radioisotope of gallium (Ga) (e.g., 68Ga; e.g., 67Ga); e.g., a radioisotope of indium (e.g., 111In); e.g., a radioisotope of copper (Cu) (e.g., 67Cu)] to form a compound having a structure similar to the structure shown above for 99mTc-MIP-1404, with the other metal radioisotope substituted for 99mTc. [0321] In certain embodiments, 1405 is labelled with a radionuclide (e.g., chelated to a radioisotope of a metal). In certain embodiments, a radionuclide labelled PSMA binding agent comprises
99mTc-MIP-1405, which is 1405 labelled with (e.g., chelated to)
99mTc:
- 82 - 12297548v2
Attorney Docket No.2010358-0329 or a pharmaceutically acceptable salt thereof. In certain embodiments, 1405 may be chelated to other metal radioisotopes [e.g., a radioisotope of rhenium (Re) (e.g., rhenium-188 (
188Re); e.g., rhenium-186 (
186Re)); e.g., a radioisotope of yttrium (Y) (e.g.,
90Y); e.g., a radioisotope of lutetium (Lu)(e.g., 177Lu); e.g., a radioisotope of gallium (Ga) (e.g., 68Ga; e.g., 67Ga); e.g., a radioisotope of indium (e.g., 111In); e.g., a radioisotope of copper (Cu) (e.g., 67Cu)] to form a compound having a structure similar to the structure shown above for 99mTc-MIP-1405, with the other metal radioisotope substituted for 99mTc. [0322] In certain embodiments, 1427 is labelled with (e.g., chelated to) a radioisotope of a metal, to form a compound according to the formula below:
1427 chelated to a metal, or a pharmaceutically acceptable salt thereof, wherein M is a metal radioisotope [e.g., a radioisotope of technetium (Tc) (e.g., technetium-99m (
99mTc)); e.g., a radioisotope of rhenium (Re) (e.g., rhenium-188 (188Re); e.g., rhenium-186 (186Re)); e.g., a radioisotope of yttrium (Y) (e.g., 90Y); e.g., a radioisotope of lutetium (Lu)(e.g., 177Lu); e.g., a radioisotope of gallium (Ga) (e.g., 68Ga; e.g., 67Ga); e.g., a radioisotope of indium (e.g., 111In); e.g., a radioisotope of copper (Cu) (e.g., 67Cu)] with which 1427 is labelled. [0323] In certain embodiments, 1428 is labelled with (e.g., chelated to) a radioisotope of a metal, to form a compound according to the formula below: - 83 - 12297548v2
Attorney Docket No.2010358-0329
1428 chelated to a metal, or a pharmaceutically acceptable salt thereof, wherein M is a metal radioisotope [e.g., a radioisotope of technetium (Tc) (e.g., technetium-99m (
99mTc)); e.g., a radioisotope of rhenium (Re) (e.g., rhenium-188 (188Re); e.g., rhenium-186 (186Re)); e.g., a radioisotope of yttrium (Y) (e.g., 90Y); e.g., a radioisotope of lutetium (Lu)(e.g., 177Lu); e.g., a radioisotope of gallium (Ga) (e.g., 68Ga; e.g., 67Ga); e.g., a radioisotope of indium (e.g., 111In); e.g., a radioisotope of copper (Cu) (e.g., 67Cu)] with which 1428 is labelled. [0324] In certain embodiments, a radionuclide labelled PSMA binding agent comprises PSMA I&S:

PSMA I&S, or a pharmaceutically acceptable salt thereof. In certain embodiments, a radionuclide labelled PSMA binding agent comprises 99mTc-PSMA I&S, which is PSMA I&S labelled with 99mTc, or a pharmaceutically acceptable salt thereof. - 84 - 12297548v2
Attorney Docket No.2010358-0329 J. Example 1:Example Automated PRIMARY Score Determination Illustrative Embodiment [0325] The PRIMARY score staging system is a 5-grade scale. In an illustrative embodiment of the automated scoring method described below, assigning the correct score is based on PET and CT imaging. The CT scan is used to correctly localize the prostate, liver, and aorta within the scan. The PET scans are converted to Standardized Uptake Values (SUV). Further, organ segmentation masks are used to extract relative (corresponding) areas from PET images. Prostate SUV-converted PET scans are analysed by computer software in order to localize uptakes. For each uptake, the peak intensity is localized and the SUV value is measured. The uptake is classified as focal or diffuse. The 3D prostate clinical model is fit to the prostate segmentation mask and the correct prostate zone is assigned to each uptake. Based on the liver and aorta reference SUV values, the PSMA expression score is computed. Having all those data, the proper PRIMARY score is assigned based on the scoring scheme presented in Table 3 (see also Figure 2 and Table 2 in Emmett et al., showing PRIMARY scoring schemes). Table 3: PRIMARY score staging scheme, proposed in Seifert et al., European Urology 83 (2023) pp.405-412.
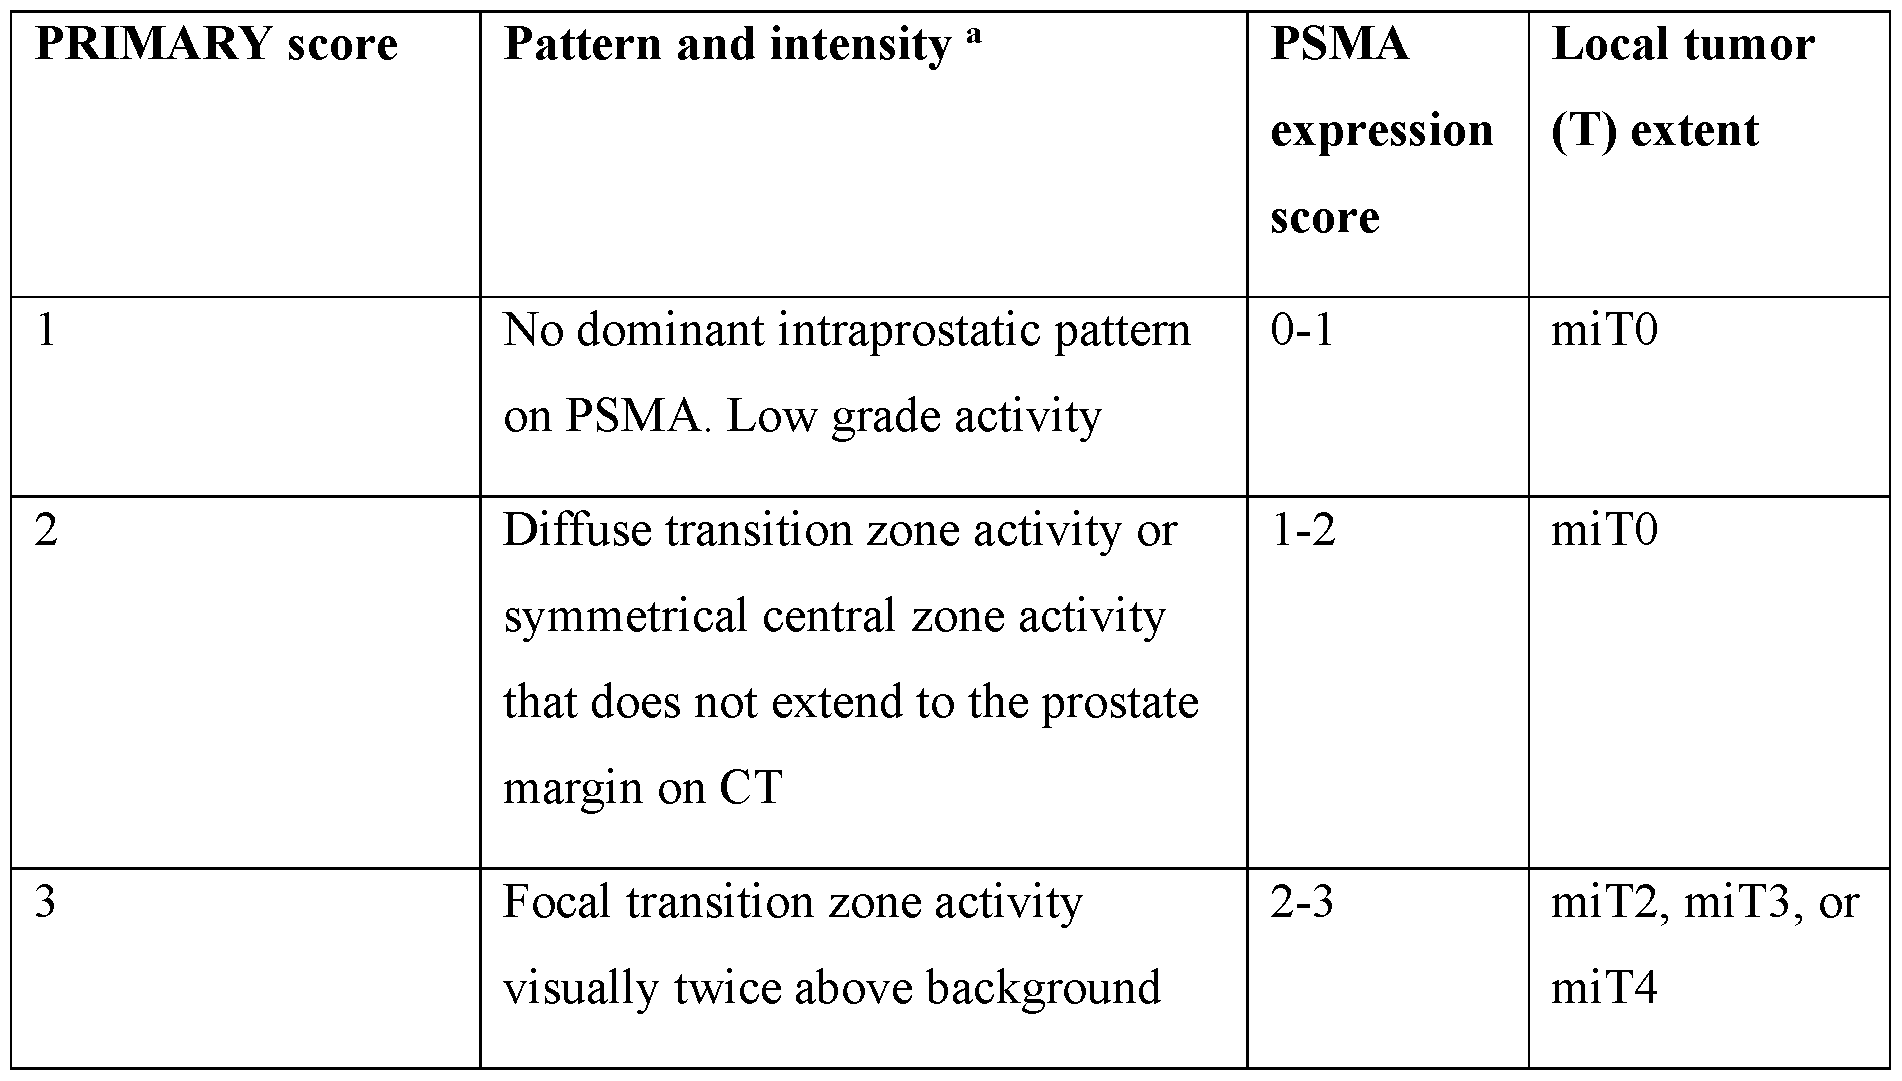
- 85 - 12297548v2
Attorney Docket No.2010358-0329

[0326] Uptakes within the prostate are localized using a hotspot detection algorithm implemented in the aPROMISE methodology described in Seifert et al. and/or Emmet et al. Hotspots below 120 µl are discarded. For each hotspot, the peak position and SUV value are found. Each peak is classified as focal or diffuse. Peaks are also assigned a list of prostate zones, through which they volumetrically expand. The list of prostate zones is sorted in descending order starting from the zone in which a hotspot peak is located and ending in the zone with the least number of hotspot voxels. Moreover, hotspots are checked whether they extend outside the prostate. All this data is then gathered for each single hotspot located within the prostate and a list of uptakes data serves as an input to the PRIMARY score function. [0327] In order for the score to be reproducible, and to standardize its determination, an automated method of its computation was devised and is presented here. In certain embodiments, this PRIMARY score computation technique uses image analysis data automatically identified via one or more CNN models. For example, one or more CNN models can be used for the identification, localization, and quantification of the one or more uptake regions (hotspots) and/or for the identification of the prostate, the zones of the prostate, and/or other organs/regions (e.g., the liver and the aorta) as they appear in the anatomical image (e.g., CT, X-ray, or MRI image) and/or as those regions are mapped to the 3D functional image (e.g., the 3D PSMA-PET image). [0328] For PRIMARY score automatic computation, a Python script was written (see illustrative pseudocode excerpt below). A schematic diagram of this illustrative method is presented in FIG.11. In this illustrative example, the input to the function is a list of uptakes (hotspots data), PSMA Expression score, and an uptake counter. The uptake counter - 86 - 12297548v2
Attorney Docket No.2010358-0329 indicates which prostate zone from the prostate zones list for a single hotspot to use for the prostate zone evaluation criteria. It is common for a single hotspot to expand through multiple prostate zones. Usually, hotspots are evaluated based on the hotspot peak location zone. However, it might happen that no score matches the peak location prostate zone. In that case, the function is recurrently called, with the indication to pick the second, third, and further prostate zones for the evaluation criteria. The score is evaluated then not on the hotspot peak location prostate zone, but on the following prostate zones through which the hotspot expands. The uptake counter is progressively increased until it is possible to assign at least one PRIMARY score to the patient. It may happen that after checking all prostate zones through which hotspots expand, it is still not possible to assign any PRIMARY score to the patient. In case all iterations fail to find the primary score, the score is assigned based on the PSMA Expression score only. If the PSMA Expression score is 0 or 1, the PRIMARY score 1 is assigned. If the PSMA Expression score is 2, the PRIMARY score of 2 is assigned. Otherwise, the PRIMARY score of 3 is assigned. [0329] Since a subject may have multiple prostate localized uptakes, it is also possible that multiple scores can be assigned to a single patient. In that case, the worst score scenario is chosen. Pseudocode: Illustrative pseudocode excerpt for automated PRIMARY score computation
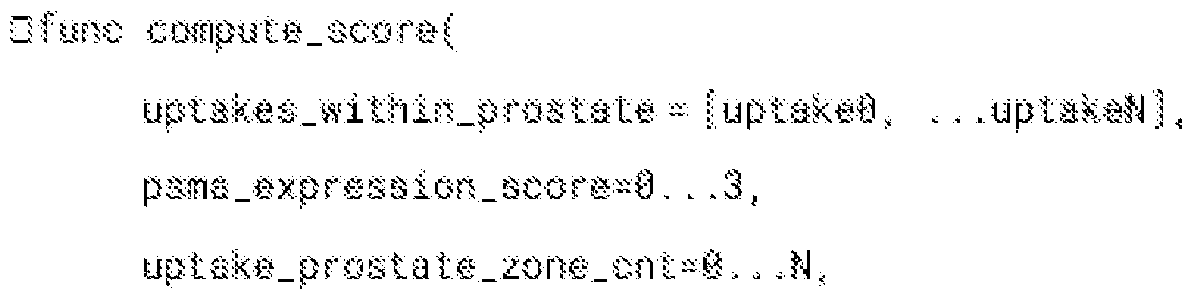
- 87 - 12297548v2
Attorney Docket No.2010358-0329
- 88 - 12297548v2
Attorney Docket No.2010358-0329
[0330] The technique requires multiple indirect pre-computed variables to correctly assign the score, among others: uptake localization within the prostate, uptake mask, uptake type classification as diffuse or focal, prostate zones (transition, peripheral, central), and PSMA expression score. Illustrative examples of the computation of those variables are presented in detail in the sections below. Table 4: Example Score Categories Used in an Automated Prostate Cancer Staging Scoring Method
J.i. Standardized Uptake Value (SUV) [0331] In certain embodiments, the PET image is converted to SUV according to the following equation: - 89 - 12297548v2
Attorney Docket No.2010358-0329
where shift, slope, and intercept are parameters computed based on the subject weight, injection dose, and other PET scan-related variables. J.ii. Uptake Peak Localization and Peak SUV Value Calculation [0332] In certain embodiments, for the purpose of extracting uptake regions, the hotspot detection algorithm implemented in aPROMISE is used. Only prostate-located hotspots (hotspots that have an intersection with the prostate segmentation mask) are taken. Hotspots are filtered by their volume. Hotspots below 120 µl are discarded. [0333] The peak position is the maximum SUV value within the hotspot and prostate area: (7) ^^^^ ^^^^ ^^^^ ^^^^ ^^^^ ^^^^ ^^^^ ^^^^
^^^^ ^^^^ ^^^^ ^^^^ = ^^^^ ^^^^ ^^^^
^^^^ ^^^^ ^^^^(ℎ ^^^^ ^^^^ ^^^^ ^^^^ ^^^^ ^^^^
^^^^ ^^^^ ^^^^ ^^^^ ∪ ^^^^ ^^^^ ^^^^ ^^^^ ^^^^ ^^^^ ^^^^ ^^^^
^^^^ ^^^^ ^^^^ ^^^^) where hotspot_mask is a Boolean mask (e.g., for a single hotspot) and prostate_mask is filled with prostate SUV values. [0334] The peak value is the mean SUV value in a close location to the peak position. The cube with a 3-voxel side is centered on the peak position. The mean value of voxels belonging to the hotspot and within the cube is computed. (
8) ^^^^ ^^^^ ^^^^ ^^^^ ^^^^ ^^^^ ^^^^ ^^^^ ^^^^ = ^^^^ ^^^^ ^^^^ ^^^^� ^^^^ ^^^^ ^^^^ ^^^^ ^^^^ ^^^^ ^^^^ ^^^^ ^^^^ ^^^^ ^^^^� ^^^^ ^^^^ ^^^^ ^^^^ ^^^^ ^^^^ ^^^^ ^^^^ ^^^^ ^^^^ ^^^^ ^^^^ − 1: ^^^^ ^^^^ ^^^^ ^^^^ ^^^^ ^^^^ ^^^^ ^^^^ ^^^^ ^^^^ ^^^^ ^^^^
J.iii Uptake Classification [0335] Each prostate-located uptake is assigned a diffuse or focal classification label. If the peak value is greater than twice the value of the prostate_SUV_mean, then the uptake is classified as focal, otherwise diffuse. - 90 - 12297548v2
Attorney Docket No.2010358-0329 [0336] FIGs.12A and 12B are example images of prostate-located uptake regions (hotspots) that are classified as “diffuse” and “focal”, respectively, according to an illustrative embodiment. J.iv Prostate Zones [0337] In order to identify the one or more prostate zones for each of the uptake regions (hotspots), a prostate clinical model is fit to the prostate in the CT image. The prostate clinical model was developed as a stl 3D model, converted to numpy array object, and loaded in Python. The 3D prostate model is presented in FIG.13. [0338] The fitting procedure is done using a prostate segmentation mask generated by the aPROMISE algorithm, an example of which is illustrated in FIG.14. The prostate model is assumed to have the correct orientation, only the scale and position are adjusted. The prostate segmentation mask size is computed, as the distance between the furthest prostate points in the x, y, and z axes. The same method is applied to the 3D prostate model size measurement. The scale is computed as the ratio of two measurements and the prostate 3D model is scaled accordingly. [0339] The position of the 3D prostate model is calculated in a very similar way, to how the scale is computed. The furthest prostate points in the x, y, and z axes are assumed to have the same coordinates in the case of the prostate segmentation mask and the 3D prostate model. [0340] As both PET and CT images are aligned together and have the same voxel size, the 3D prostate model can be directly applied to the PET image. [0341] For each hotspot, the list of prostate zones is assigned, through which the hotspot expands. The list is sorted in descending order, excluding the first element. The first element in the list is always the prostate zone, in which the uptake peak is located. All other elements are sorted in descending order based on the number of voxels within the zone. Each uptake can thus have a list of 1 to 5 elements (central, fibromuscular, peripheral, transition, and ureter zone). The fibromuscular zone and ureter zone are not included in the PRIMARY score staging system described in Emmett et al. Accordingly, if scoring is based directly on the system described in Emmett et al., in certain cases, no score may be assigned to the patient. For example, if there is only a single focal uptake in a fibromuscular zone, a - 91 - 12297548v2
Attorney Docket No.2010358-0329 PRIMARY score exactly corresponding to the 5-grade scale described would not be assigned initially. In that case, the PRIMARY score is assigned based on the expression score, according to the formula presented in the Automated Primary Score Determination section above. In certain cases, a score cannot be assigned to the patient based on the uptake peak location prostate zone. This can be the case, for example, if the uptake peak is located in the fibromuscular zone and there are no other prostate located uptakes. However, if the hotspot expands to other prostate zones, the score could be assigned by verifying the PRIMARY score conditions for the other prostate zones through which the uptake extends. In that case, the following prostate zone from the hotspots prostate zones list is taken, and treated as the main prostate zone for an uptake in a staging system. J.v PSMA Expression Score [0342] The PSMA Expression score is assigned based on the PROMISE V2 staging system proposed in Seifert et al., “Second Version of the Prostate Cancer Molecular Imaging Standardized Evaluation Framework Including Response Evaluation for Clinical Trials (PROMISE V2),” European Urology 83 (2023) pp.405-412. In the first step, the aorta SUV mean value and liver SUV mean value is computed based on the organ segmentation masks and SUV-converted PET scan. The highest uptake peak within the prostate – i.e., among all identified prostate hotspots, the PSMA expression score was computed based on the hotspot with the highest peak update. The highest peak uptake value was compared with the aorta and liver SUV mean values, and the PSMA Expression score is assigned based on the conditions presented in Table 5 below. PSMA expression score, accordingly, was determined as a lesion index in line with the approach illustrated in FIG.5A, herein (i.e., a step-wise, discrete scoring approach), but other approaches are possible, such as the lesion index scoring approach shown in FIG.5B. Table 5: PSMA Expression score staging system, based on PROMISE v2 framework.
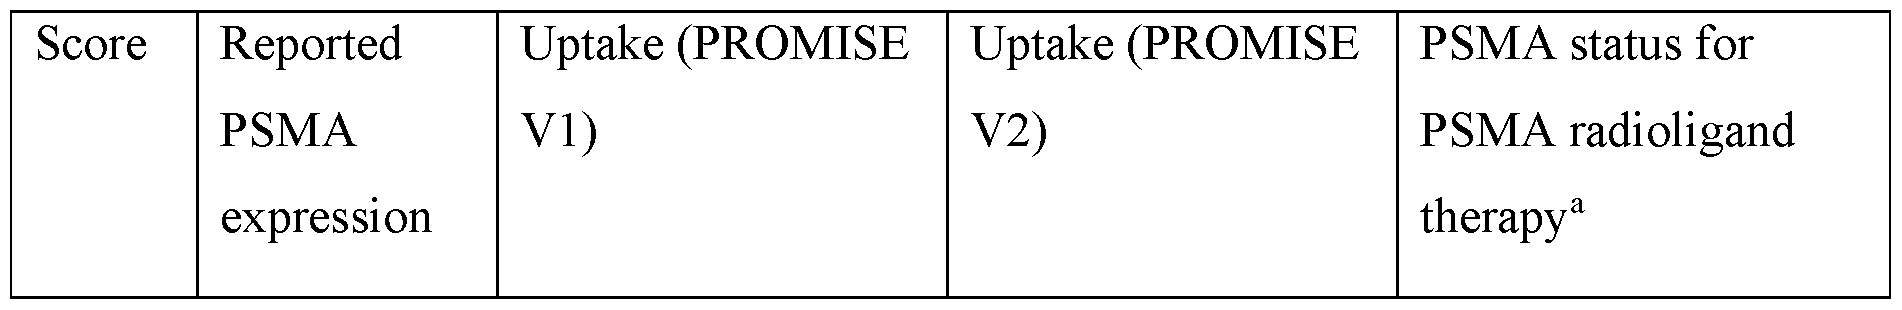
- 92 - 12297548v2
Attorney Docket No.2010358-0329

J.vi. PRIMARY Scores Assignment Example [0343] FIG.15 is a compilation of images depicting an exemplary automated computation of a PRIMARY score, according to an illustrative embodiment. Here, the patient has two prostate-located uptakes – one diffuse uptake located in the prostate transition zone, and one focal uptake located in the prostate transition zone as well. The PSMA Expression score for the patient is equal to 2. Having this information, the PRIMARY score of 2 and 3 is assigned. The algorithm takes the worst-case scenario, so the PRIMARY score of 3 is the final algorithm prediction. - 93 - 12297548v2
Attorney Docket No.2010358-0329 K. Example 2: Predicting Synchronous Metastases using a Convolutional Neural Network Model and Intraprostatic [F18]DCFPyL PSMA Imaging [0344] This example provides results of an imaging study that demonstrates use of a CNN model in conjunction with intraprostatic PSMA imaging. In particular, [F18]DCFPyL (PyL
TM) is a PSMA targeted imaging agent that provides whole-body staging of prostate cancer. This example demonstrates how image analysis of a primary tumor using machine learning techniques (e.g., deep learning algorithms) can offer additional insight into disease biology, including the presence of co-existing metastatic disease. Approaches using convolutional neural network (CNN) models using inputs from whole prostate PyL
TM images along with auto-segmented hotspots within a prostate are used to predict presence or absence of synchronous metastases and are compared against established models built from clinico- pathologic information. [0345] Ninety-two (92) U.S. Veterans with de novo prostate cancer were imaged with PyL PSMA PET/CT for initial staging (46% with metastatic disease). PyL images of the prostate were analyzed using aPROMISE, which automatically segments, localizes, and quantifies disease via analysis PSMA PET images. Segmentations of the prostate were used to map the PyL PET image of the prostate. Both an entire prostate as well as aPROMISE- determined hotspots were used as inputs for the CNN model of this example, where, according to attention map analysis, the hotspot information helps the network understand the location and extent of tumors. [0346] Image analysis machine learning model used in this example was made up of a Conv3D layer of 4 kernels, a Conv3D layer of 8 kernels, a dense layer of 64 nodes, followed by a final dense layer with 2 nodes. Model training was performed on images using 5-fold cross validation with non-overlapping validation sets. Area under ROC curve (AUC) was computed to assess performance of the model in predicting the presence of metastases and these test predictions were compared with ground truth (M1). Prediction scores from UCSF- CAPRA and UCLA PSMA risk calculator were used to comparators, e.g., for comparing CNN model performance against models built from clinicopathologic information. [0347] The best CNN model that operated on prostatic PyL images alone achieved an AUC of 0.800 for prediction of metastatic disease. For comparison, the UCSF-CAPRA score and UCLA-PSMA risk calculator (any upstaging on PET), which rely on clinicopathologic information, had AUCs of 0.729 and 0.754 in this dataset, respectively. - 94 - 12297548v2
Attorney Docket No.2010358-0329 [0348] Accordingly, a CNN based model using PyL imaging predicted synchronous metastases (mets) from intraprostatic PyL uptake patterns alone with an accuracy in this dataset that is at least comparable to published models based on clinicopathologic features (non-imaging). These results support the use of PyL CNN-based models to prognosticate metastatic progression. [0349] FIG.16 illustrates imaging channel inputs used by the CNN model of the present example. As shown in FIG.16, the CNN model received two channels of input extracted from PSMA PET/CT images. A first, hotspot, channel 1602 was a 54×14×54 cuboid volume centered on a detected prostate volume and comprising miT hotspots detected by the aPROMISE technique. A second, prostate intensity, channel 1604 was a 54×14×54 cuboid region extracted from the PET image and centered on the prostate. Accordingly, the two-channel input received by the CNN model was a 2×54×14×54 matrix. The CNN model was trained using a dataset with both positive and negative examples – i.e., images where patients were determined/known to be either positive or negative for synchronous metastases, as shown in Table 6A, below. Table 6A. Positive-negative sampling ratio.

[0350] Training, validation, and test dataset splits used are shown in Table 6B, below. Table 6B. Training, validation, and test set split.
[0351] FIG.17A shows an example CNN architecture used for analyzing the 2- channel, 3D volume image inputs and performing a binary classification. [0352] Fifty experiments were performed, and metrics such as accuracy (Acc.), AUC, f1 score, recall, and precision calculated for each. Table 6C, below, shows values of each of these metrics computed for the worst, best, and average experiment. - 95 - 12297548v2
Attorney Docket No.2010358-0329 Table 6C. Performance over 50 experiments.
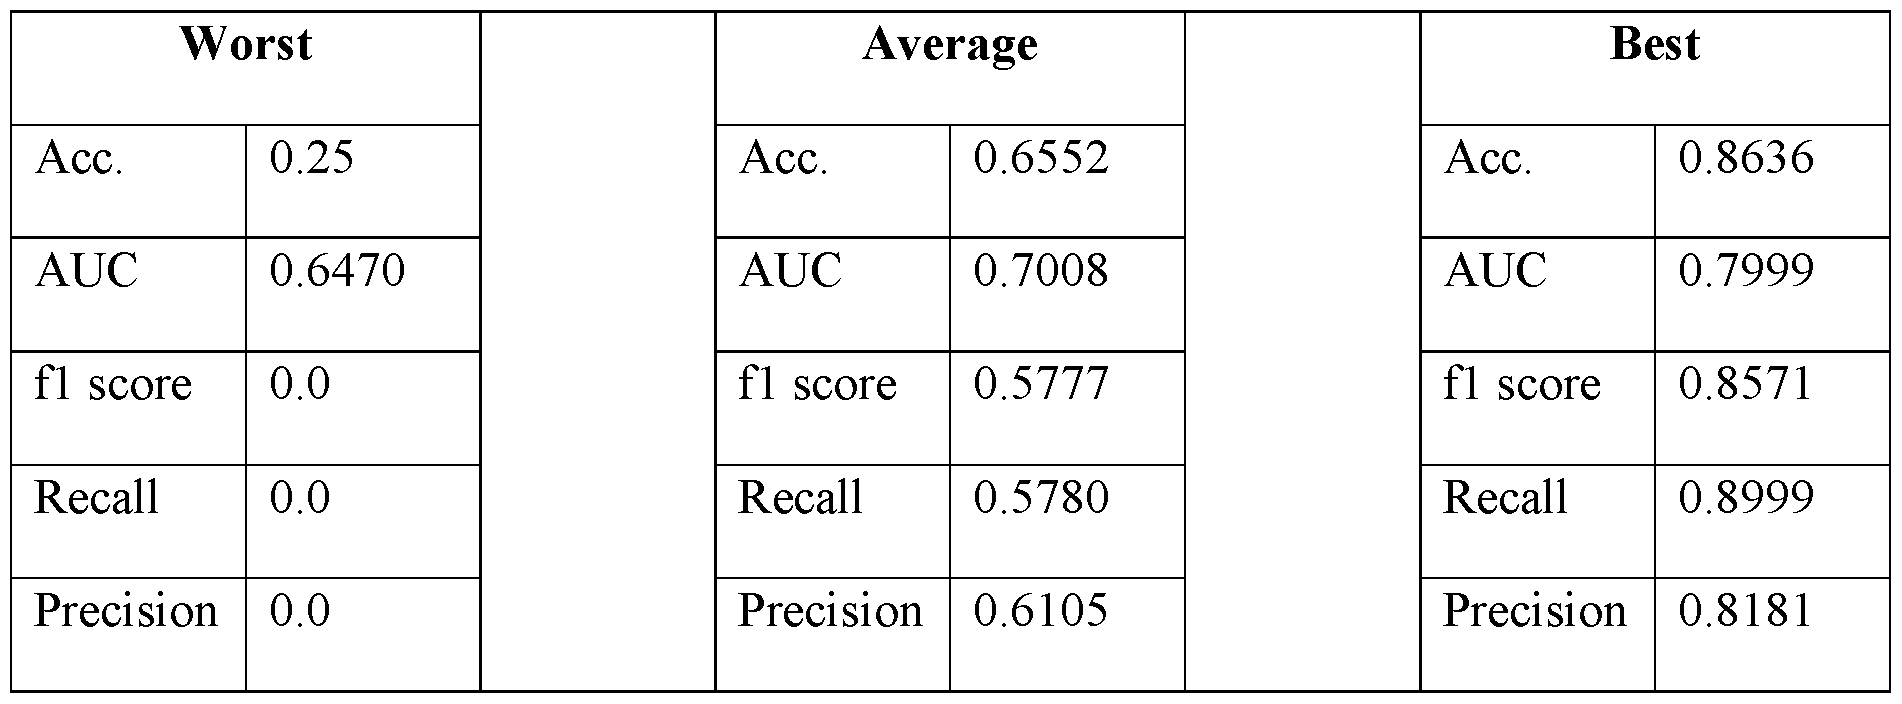
[0353] The CNN model was also used to create combined models, that generated predictions using image input as well as certain pre-defined features, such as measured clinical variables and features computed from images. This approach, using a combination of data, was found to lead to the best performing model. [0354] FIG.17B shows a schematic illustrating how a CNN model can be combined with other data inputs to create a combined model that generates predictions based on image data, as well as features such as clinical data measurements and features computed from images. As shown in FIG.17B, a CNN neural network, e.g., as shown in FIG.17A is used to analyze images and generate an output, such as a likelihood value or a binary classification. The CNN output is then fed, along with pre-defined features, into a secondary machine learning model, such as a decision tree model (e.g., a Gradient Boosting Decision Trees (GBDT) model, such as XGBoost), a support vector machine (SVM) model, or a naïve Bayes classifier. The secondary machine learning model then generates, as output, a final likelihood value and/or classification, reflecting whether a patient has synchronous metastases. [0355] Tables 7A-7F, below, provide results for several machine learning models using combinations of CNN predictions and pre-defined features. - 96 - 12297548v2
Attorney Docket No.2010358-0329 Table 7A. Clinical variable measurement model results.

Table 7B. Combined clinical variable measurement and CNN image analysis output model results.
Table 7C. Combined clinical variable measurement and CNN image analysis output model results.
- 97 - 12297548v2
Attorney Docket No.2010358-0329 Table 7D. Measured and computed features model results.
Table 7E. Measured and computed features model results.
- 98 - 12297548v2
Attorney Docket No.2010358-0329 Table 7F. Combined CNN prediction and measured and computed features model results.
L. Example 3: A convolutional neural network model using intraprostatic patterns of [F18]DCFPyL uptake in PSMA PET images for prediction of synchronous metastases [0356] This example provides additional results of and expands upon an imaging study that demonstrates use of a CNN model in conjunction with intraprostatic PSMA imaging, described in Example 2, above. [0357] In particular, [F18]DCFPyL (PyL
TM) (also referred to as Piflufolast F-18 DCFPyL) is a PSMA targeted imaging agent that provides whole-body staging of prostate cancer. This example demonstrates how image analysis of a primary tumor using machine learning techniques (e.g., deep learning algorithms) can offer additional insight into disease biology, including the presence of co-existing metastatic disease. Approaches using convolutional neural network (CNN) models using inputs from whole prostate PyL
TM PET/CT images along with automatically segmented hotspots within a prostate were used to predict presence or absence of synchronous metastases and were compared against established models built from clinicopathologic information. [0358] As described in further detail, veterans with de novo prostate cancer that had been imaged with PyL PET/CT for initial staging were included in the retrospective analysis described in this example. PyL PET/CT images of the prostate were analyzed using aPROMISE, which automatically segments, localizes, and quantifies disease on PSMA PET/CT images. Automatically segmented prostate volumes (determined via automated segmentation of CT images) were used to map PyL
TM uptake within the prostate, as reflected - 99 - 12297548v2
Attorney Docket No.2010358-0329 in the PET image channel. aPROMISE was also used to automatically detect and segment 3D hotspots representing potential cancerous lesions within a subject. Both the entire prostate, as well as aPROMISE defined hotspots were used as inputs for the CNN model. As described in further detail herein (e.g., below) an attention map analysis indicates that the hotspot information facilitates the neural network in determining locations and extents of tumors within the prostate. The CNN model architecture in this example was based on SqueezeNet v2. In order to train the CNN models and evaluate their performance, the image dataset was randomly split into training, validation, and test sets. Receiver operating characteristic (ROC) curves were generated and area under the curve (AUC) metrics were computed to assess model performance in predicting presence of metastases, and test predictions were compared with ground truth (M1). Model training was repeated 50 times (50 experiments) and the best performing experiment (e.g., trained model) was identified. For purposes of comparison with previous techniques based on evaluation of clinicopathological data, prediction scores determined using the UCSF-CAPRA scoring system and UCLA PSMA risk calculator were determined and compared with CNN model performance. [0359] Of the 90 veterans evaluated in the analysis presented in this example, 47 presented localized disease and 43 had metastatic prostate cancer. The CNN model operating on image data alone achieved a median AUC of 0.72 for prediction of metastatic disease (ICR 0.64 and 0.8). Adding clinicopathologic information to imaging data via a fused model improved the AUC to a median of 0.82. For comparison, AUCs from the UCSF-CAPRA score and UCLA-PSMA risk calculator (any upstaging on PET), which rely on clinicopathologic information, were 0.729 and 0.754 for the dataset used in this example, respectively. [0360] Accordingly, results of this example show the ability of a CNN based model to predict presence of synchronous metastases in patients intraprostatic PyL uptake patterns alone. Predictive accuracies of the CNN model for this dataset were comparable to published prediction models based on clinicopathologic features (namely, UCSF-CAPRA scoring and UCLA-PSMA risk calculator). [0361] Predictions from CNN image analysis models were also combined with other measurable imaging parameters and clinicopathologic data to develop a fused model that discriminates between prostate cancers with or without co-existing metastases with high fidelity. - 100 - 12297548v2
Attorney Docket No.2010358-0329 Materials and Methods [0362] Dataset. Ninety (90) veterans with de novo prostate cancer were imaged with PyL PSMA PET/CT for initial staging (47 with localized disease and 43 with metastatic prostate cancer). Images of the prostate were analyzed using aPROMISE, which, among other things, segments the prostate gland and localizes and segments hotspots corresponding to regions of PET images determined to represent to potential intraprostatic lesions. The segmentation of the prostate was used to map PyL PET images of the prostate. Without wishing to be bound to any particular theory, neural networks are believed to exhibit performance improvements when provided with pragmatically extracted task-specific features, particularly when dealing with a limited number of cases. Accordingly, identifications of hotspots determined via aPROMISE were provided as input alongside PET prostate-region scans to CNN models to create a two-channel CNN model that leveraged information from prostate PET intensities and detected hotspots representing potential lesions. FIG.29 shows an example system architecture, illustrating image-based inputs (PET image intensities and hotspots) to a CNN model, as well as a fused model that integrates the CNN-based image system with clinicopathologic data. FIGs.18A-18C show example model inputs, with FIG.8A showing a cuboid region surrounding a prostate in a PET image, FIG. 18B showing the same cuboid region overlaid on a 3D hotspot mask, and FIG.18C showing an overlay of FIGs.18A and 18B. Attention map analysis, described in further detail herein, indicates that the 3D hotspot mask, when used as input to a neural network, facilitated the network in identifying locations and extents of tumors. [0363] CNN model architecture. Several different Convolutional Neural Network (CNN) architectures were evaluated. Since the limited number of training samples were believed to raise a high risk of model overfitting, only models with a relatively low number of parameters were considered in this example. In particular, modified version of the ResNet18, SqueezeNetv2, MobileNet, and ShuffleNet models were evaluated. These CNN architectures were originally designed for 2D image processing and, accordingly, were modified to make them suitable for 3D image analysis by substituting their original 2D convolutional and pooling layers with 3D convolution and pooling layers. Moreover, for the SqueezNetv2 architecture, the last network layers comprising dropout, convolution with kernel size 1, ReLU activation, and average 3D Pooling layers were substituted with adaptive max pooling 3D, dropout and fully connected layers. Models were trained using a weighted binary cross entropy loss function. The top-performing model (SqueezeNetv2) underwent - 101 - 12297548v2
Attorney Docket No.2010358-0329 further optimization through grid-search hyperparameter-tuning. Optimal values for group convolution, learning rate, regularization strength, and a set of augmentations (described in the paragraph below) were determined based on initial validation. The CNN model was trained for 300 epochs and the checkpoint for the best-performing epoch on the evaluation subset was retained and selected for testing. [0364] Augmentations. To avoid overfitting, a randomly selected set of augmentations were applied to CNN inputs each epoch. In the present example, seven of the following fifteen augmentations were sampled and applied in random order: random rotation, random flip in left-right axes, random Gaussian noise, random standard deviation intensity shift, random contrast adjustment, random Gaussian smoothing, random Gaussian sharpening, random histogram shift, random Coarse shuffle, random 3D elastic distortion, random affine transformation, random Gibbs noise, random bias field, random K-space spike noise, and random Rician noise. [0365] Multimodal model. To further improve metastases prediction performance, the top-performing CNN model (SqueezeNetv2), which utilized both the prostate intensities and hotspot identification input channels, was integrated into a fused model that also utilized various patient attributes, such as features derived from images and clinicopathologic data. These patient attributes included a measured PSA value, Pathologic Grade Group, Percent Positive Cores, a peak SUV prostate-located value, PRIMARY score, and PSMA Expression score (generated by PROMISEV2). A Naïve Bayes classifier was integrated to leverage the output from the CNN model in conjunction with other variable and categorical features to formulate the conclusive prediction of synchronous metastases. These categorical and variable features were integrated with the CNN model using fused model approaches, including a logistic regression, XGboost, and Naïve Bayes, resulting in a fused model. [0366] Metrics. The dataset was split into training, validation, and test sets using stratified random sampling, in ratios of 0.5, 0.2, and 0.3 accordingly. Area under the receiver operating characteristic curve (AUC) was computed to evaluate performance of various models in predicting the presence of metastases and test predictions were compared with ground truth (M1). Training was repeated 50 times (50 experiments) and the best-performing experiment was identified. Prediction scores from UCSF-CAPRA and UCLA PSMA risk calculator were used as comparators. - 102 - 12297548v2
Attorney Docket No.2010358-0329 [0367] Explainable artificial intelligence. This example also evaluates model performance using explainable artificial intelligence (AI). All deep learning models were explained using the FoXai library. Models on clinicopathologic data were explained using the SHAP library. In this manner, the set of input features could be selected based on their contribution to final model output, as measured using explainable AI techniques. Results [0368] Among the CNN model architectures tested, the SqueezeNetv2-based model provided the best performance, with an AUC of 0.7273. Results for all model architectures evaluated are shown in Table 8A, below. A fused model, which incorporated CNN model predictions along with patient attributes (e.g., clinicopathologic data), achieved state-of-the- art results in cancer metastasis diagnoses with a 0.82 AUC median, 0.75 and 0.87 AUCs in the 1
st and 3rd quartile, respectively. Table 8A. Comparison of different CNN architecture performance. Metrics shown are a median of 50 experiments run with a stratified sampling of train, validation, and test set. Each neural network received two channels of input, a prostate volume and a hotspot mask.
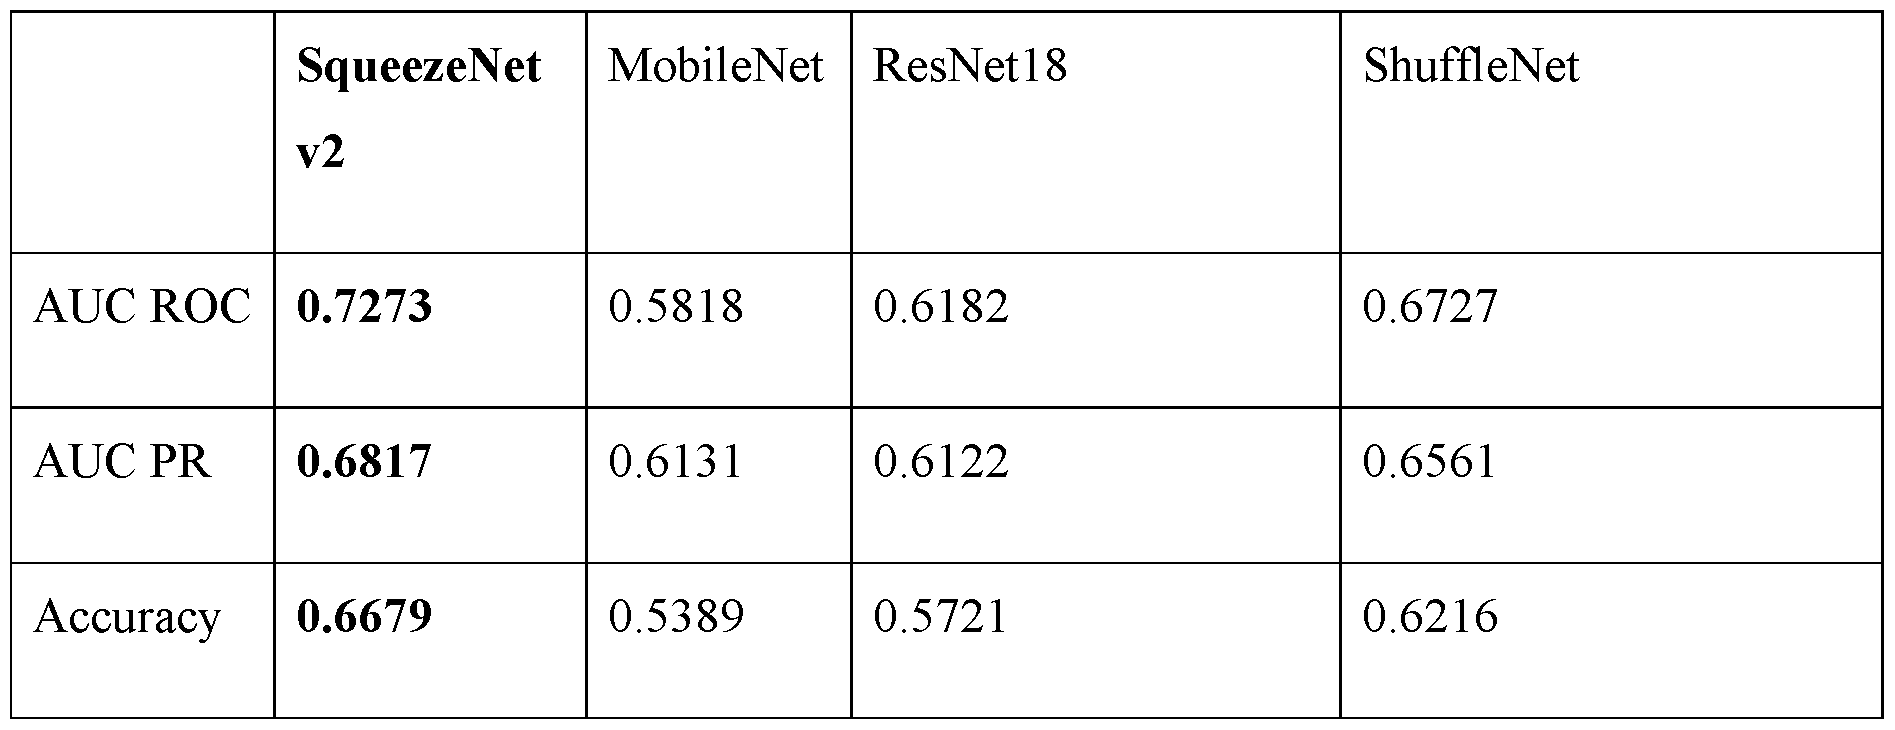
[0369] For the CNN models, incorporating hotspot identifications (e.g., a hotspot mask) as an input channel, in addition to the PyL PET prostate images, boosted model performance significantly. FIGs.20A and 20B show attention maps for an X gradient explainer determined for a SqueezeNet v2-based CNN model trained on a single input channel comprising the PET image input alone (i.e., without a second, hotspot identification, channel), computed using the FoXai library (22). FIG.20A shows attention map and FIG. 20B shows the attention map and PET image, overlaid. As shown, the attention maps - 103 - 12297548v2
Attorney Docket No.2010358-0329 indicate that the single input channel CNN model has difficulty focusing on hotspot areas. In particular, in comparison with a two-input channel CNN model, which incorporates both the PET image and hotspot identifications as input, the single channel model exhibits increased noise and reduced concentration of attention in the high intensity hotspot regions. FIGs. 21A-D show attention map analysis for a two-input channel CNN model. As with the attention maps shown in FIGs.20A and 20B, attention maps for an X gradient explainer were computed for a two-input channel CNN model using the FoXai library (22). FIG.21A shows the attention map for the CNN model alone. FIGs.21B and 21C show the PET image and hotspot mask input channels, respectively. FIG.21D shows an overlay of the two input channels and attention map (i.e., FIGs.21A-C overlaid). As shown in FIGs.21A-D, when provided with a hotspot mask, as a separate channel input to the CNN model, attention on the hotspot regions is increased. Transitioning from group convolution with a size of one to two further enhances the model’s performance. Using a same kernel for the hotspot channel and PET channel again forces the model to focus more on the hotspot areas. Additionally, it was found that a group convolution of size 2 reduces a number of parameters in the model and therefore reduces model overfitting to the training data. This is demonstrated in Table 8B, below, which shows CNN model performance for different input channels and group convolution parameter values. Table 8B. CNN model performance. Metrics shown are a median of 50 experiments, run with a stratified random sampling of train, validation, and test sets.

- 104 - 12297548v2
Attorney Docket No.2010358-0329

[0370] FIGs.22A and 22B show model performance metrics for (i) a CNN model alone, (ii) a Naïve Bayes classifier based on patient attributes (e.g., clinicopathologic data) alone, and (iii) a fused model, in which CNN model output was combined with clinicopathologic data via a Naïve Bayes classifier. FIG.22C compares CNN model and fused model performance with PRIMARY score-based predictions. As shown in FIGs.22A and 22B, the classifier model using only clinicopathologic data performed only slightly better than the CNN model alone, achieving a median AUC of 0.78 versus a median AUC of 0.72 for the CNN model alone. It appears that a combination of various patient attributes exhibits a slightly higher predictive power in comparison with the spatial, image-based input, features that are the sole input to the CNN model. To further elucidate the significance of induvial input features, CNN model output and six patient attribute features (PSA value, Pathologic Grade, Percent Positive Cores, PRIMARY score, PSMA expression score, and uptake peak value) were analyzed individually to evaluate their individual contribution to model performance. FIG.23 shows results of this analysis, performed via SHAP feature importance for Naïve Bayes, XGBoost, and logistic regression classifiers. In the figure, all features are sorted in descending order, from left to right, according to their contribution to model performance. As shown in FIG.23, viewing each feature individually, the spatial feature analysis output from the CNN model are the most valuable. In particular, CNN model output provided the highest value, displaying a median AUC of 0.72, followed by the model based on PSA value alone at 0.71. [0371] Performance of a Naïve Bayes patient attribute model (without CNN model input) and three fused models are shown in Table 8C, below. Table 8C. Fused model performance. Presented metrics are the median of 50 experiments run with a stratified sampling of train, validation, and test set. CNN input to the fused mode is a 0-1 continuous output of SquezeNetv2, with PET + hotspots model input and group convolution of 2. - 105 - 12297548v2
Attorney Docket No.2010358-0329
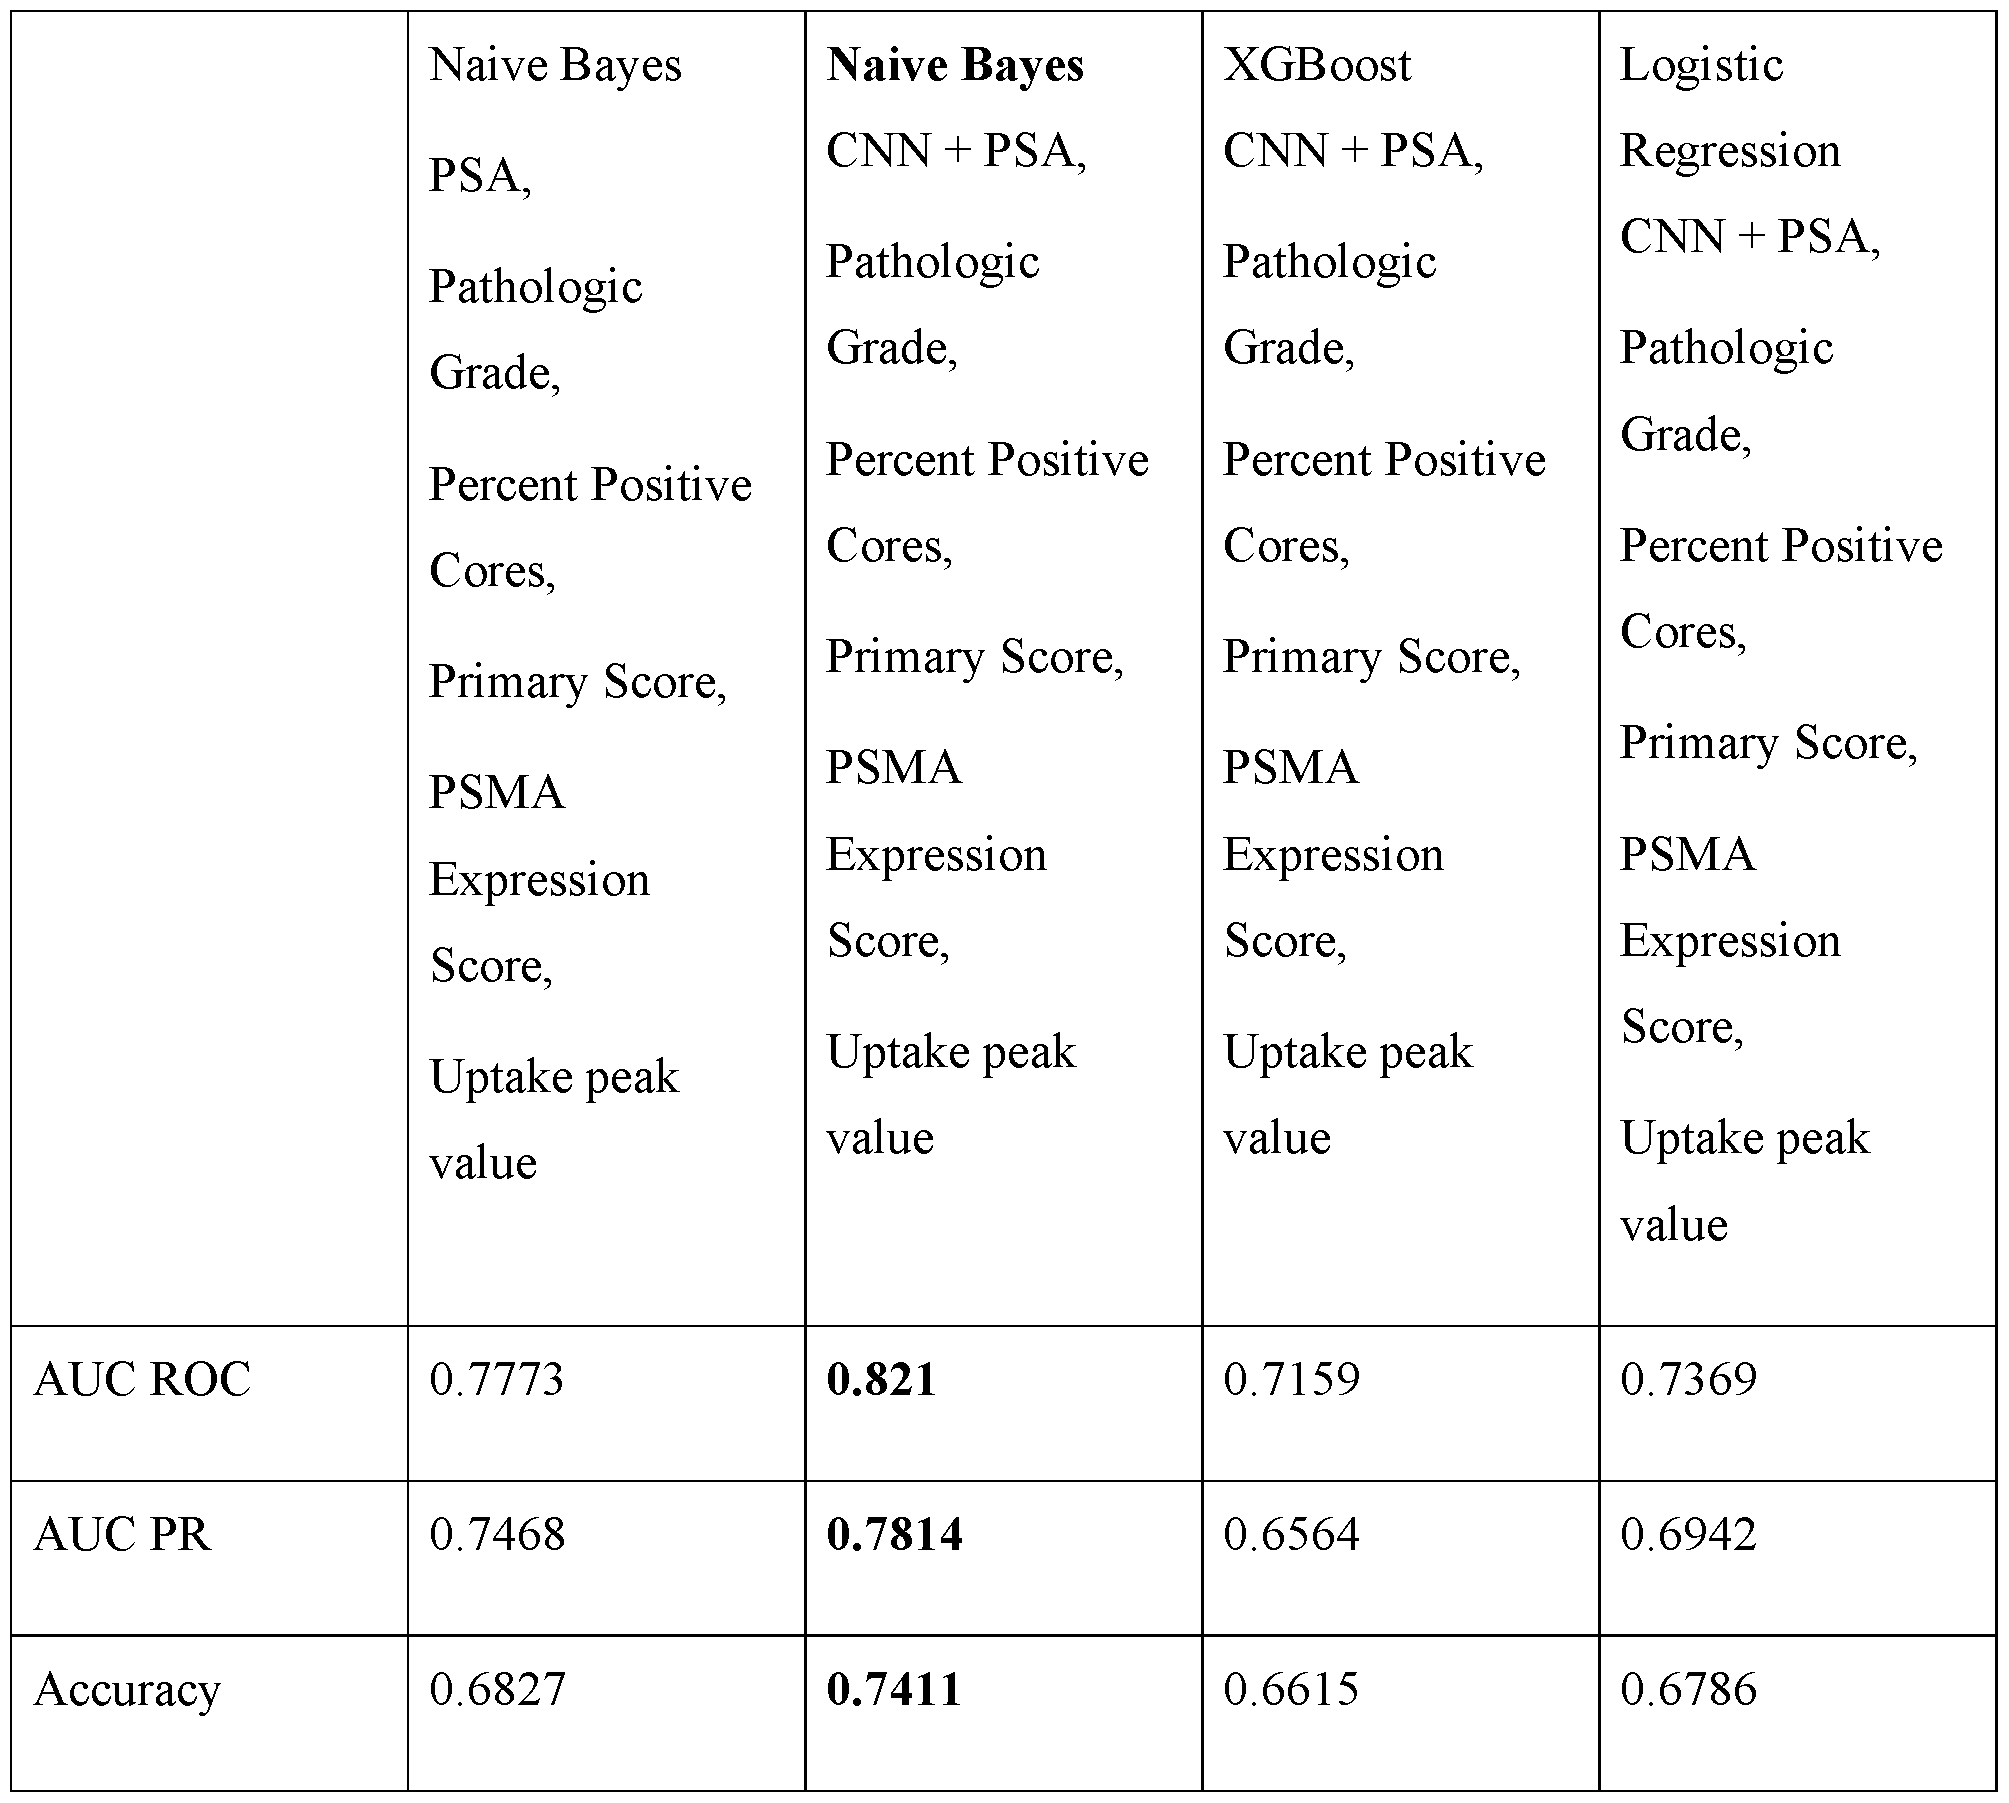
[0372] FIG.24 presents box and whisker plots for 50 experiments run for several predictive model setups, in particular, from left to right (i) CNN model (i.e., analysis of spatial image data) output alone, (ii) Naïve Bayes classifier based on patient attributes (e.g., clinicopathological data) alone (in particular, PSA score, Pathologic Grade, and Percent Positive Cores), and (iii) and (iv), two fused models, with CNN model output combined with different sets of patient attributes as shown in the figure [in particular, in (iii) CNN model output (based on prostate PET images and hotspot mask inputs) was combined with PSA score, Pathologic Grade, and Percent Positive Cores and in (iv) CNN model output (based on prostate PET images and hotspot mask inputs) was combined with PSA score, Pathologic Grade, and Percent Positive Cores, PSMA Expression score, uptake peak value and PRIMARY score]. P values for the four models shown in FIG.24 are shown in Table 8D, below. - 106 - 12297548v2
Attorney Docket No.2010358-0329 Table 8D. p-values for various models.0: spatial data-only model, 1: clinico-pathologic data-only model, 2: fused spatial and clinico-pathologic models, 3: fused model along with more patient attributes (PSMA Expression score, PRIMARY score, and peak uptake SUV value). P-values are computed using a t-test.
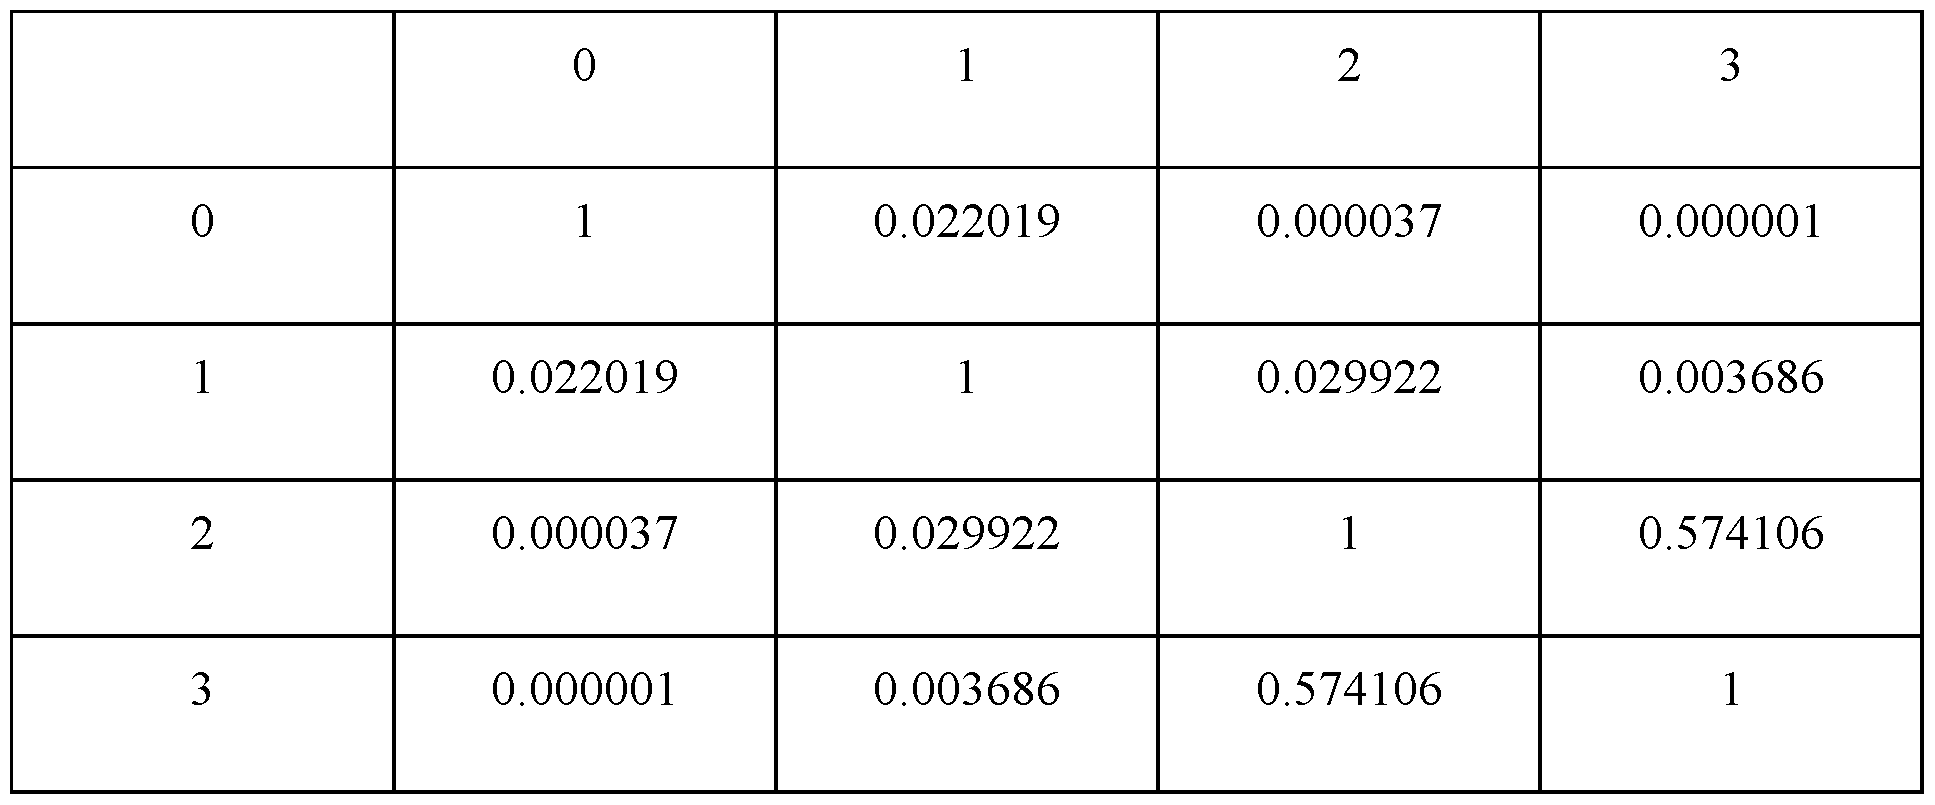
M. Example 4: AI Models Analyze PSMA PET/CT Images of Primary Tumor to Prognosticate Metastatic Progression. [0373] A subset of localized prostate cancers pose a high risk of metastatic progression to lethal disease requiring a more robust initial treatment approach, while others may follow a more indolent course where less aggressive treatment is desirable. Accurate prognostic information at the time of diagnosis, accordingly, allows patients and physicians to select a best treatment approach. In certain cases, clinicopathologic data may be used to assess the risk of metastatic progression. More recently, transcriptomic data and machine learning models that include data from digital histopathology (e.g., artera.ia) have been used to add further prognostic power. Previously, imaging scans have been used only to determine a clinical stage and assess the presence and localization of metastatic disease, but not for prognostic predictions – e.g., forecasting a likely course of disease, such as risk that disease currently presenting as localized cancer will, in the future, be found to have metastasized. [0374] This example is based on and evaluates the insight that a machine learning approach may be used to extract otherwise inaccessible prognostic information from PyL
TM PET images of primary prostate tumors. In particular, the present example demonstrates development and use of a model to prognosticate risk of metastatic progression after curative intent therapy for localized prostate cancer. - 107 - 12297548v2
Attorney Docket No.2010358-0329 [0375] Limited availability of data at multiple time points – namely, images of patients at initial visits, where no metastases were apparent followed by diagnosis of metastatic progression at subsequent time points, after curative intent therapy – however, presented an obstacle to directly training a model on this particular outcome (PSMA PET/CT imaging had been initiated in late 2018). Accordingly, instead of relying on data representing disease progression over time for training, imaging data obtained at a single time point for patients having localized and/or metastatic disease was used to train a machine learning model to predict, based on image intensities and detected hotspots within a prostate volume, whether a patient had co-existing (i.e., synchronous) metastases. Once trained, this model was then used to analyze images of patients initially presenting with localized disease and predict whether they would or would not develop metastatic progression (radiographic progression) after curative intent therapy. Without wishing to be bound to any particular theory this approach – whereby models trained to predict co-existing, synchronous metastases that were observable in PyL PET/CT images could (also) be used to predict whether metastases would develop later, following therapy – leverages the insight that most early metastatic progression events occur consequent to growth of co-existing occult metastases at the time of curative intent therapy. [0376] CNN and fused (multi-modal) models were developed and trained as described in Example 2, above, leveraging the above-described dataset of 90 veterans, who were imaged at initial staging, with imaging showing either unequivocal evidence for metastatic disease or no metastatic disease (non-metastatic N = 47; metastatic N = 43). As described herein (in Example 2, above), a CNN model was trained to predict presence of synchronous metastases using input channels of (i) prostate volume PET intensities and (ii) detected hotspots. A fused (also referred to as multimodal) model was developed by integrating clinicopathologic data with the CNN predictions via a Naïve Bayes approach, as described in Example 2 and illustrated in FIG.9. [0377] While the CNN and fused models were trained to use images of the primary tumor (i.e., within the prostate) and, in the case of the fused model, additionally clinicopathologic data, to determine whether a particular patient had (e.g., currently) synchronous metastases, the ability to predict whether a patient would have early metastatic progression after curative intent therapy is a particularly relevant and valuable clinical objective. Obtaining a sufficient amount of examples tracking metastatic progression events to train such a model directly was not possible in this case (and may be challenging in other - 108 - 12297548v2
Attorney Docket No.2010358-0329 prognostic applications), as described herein. Accordingly, the CNN and fused modes that were trained to predict for synchronous metastatic disease by evaluating the PSMA PET/CT data in the primary tumor region were evaluated for their ability to evaluate images of patients initially presenting with localized disease and discriminate between those that would and would not develop metastases following curative intent therapy. In training the model, the non-metastatic cases were purposefully selected to minimize contamination from scans of patients who had early metastatic progression events and the metastatic cases were purposefully selected to minimize the risk of false positives. [0378] In particular, the CNN and fused models was applied to a cohort of veterans (N = 23) who had no evidence of metastases at initial staging, underwent curative intent therapy (either radical prostatectomy or radiotherapy with androgen deprivation therapy), had at least four years of follow-up, and had either (1) no evidence of any progression up to four years (N = 13), or (2) unequivocal metastatic progression identified on PSMA PET/CT within four years (N = 10). The CNN model alone (with no contribution from clinicopathologic data and measurable imaging parameters) was able to discriminate between those who had a metastatic progression within 4 years versus those that did not with an AUC of 0.727, while the fused (multimodal) model was able to do so with an AUC of 0.855. Prediction scores from UCSF-CAPRA and UCLA PSMA risk calculators were also computed, for comparison purposes, with CAPRA and the UCLA PSMA risk calculator had AUCs of 0.768 and 0.702, respectively. [0379] Accordingly, this example demonstrates that machine learning models may be trained to predict presence of co-existing (e.g., synchronous) metastases, and then used, at an inference stage, to predict whether patients initially presenting with localized disease will or will not develop metastases, for example following therapy. N. Example 5: A Multi-Modality Deep Learning-Based Risk Score to Improve Prediction of Local Lymph Node Metastasis (N1) in Localized Aggressive Prostate Cancer with 18F-DCFPyL Imaging (PSMA Imaging) and Standard of Care Clinical Parameters – PyL-N1RiskScore. [0380] This example describes a prophetic study design to develop a machine learning-based score based on the metastases prediction approaches described herein to improve risk stratification of localized prostate cancer patients for likelihood of local lymph node metastatic disease (N1). - 109 - 12297548v2
Attorney Docket No.2010358-0329 [0381] In localized aggressive prostate cancer, Pelvic Lymph Node Dissection (PLND) surgery is the current standard of care for staging the disease for and assessing local lymph node involvement (N1). In absence of a more accurate imaging modality, PLND is increasingly viewed as an important, but overly invasive approach for staging of local lymph node involvement. Due to the significant side effects of surgery, clinical methods that can reduce the use of PLND and offer alternatives for staging are desired. [0382] Conventional analysis of PSMA PET/CT imaging is about 40% accurate in the detection of local lymph node metastasis, currently limiting its utility for N1 staging. However, in view of the performance of machine learning approaches, such as the CNN and/or fused models described and demonstrated herein, PSMA PET/CT imaging in combination with clinical information modeled by powerful AI algorithms can increase sensitivity to a level where it can be useful for improved and more confident stratification of patients for subsequent treatment. [0383] The present disclosure describes and demonstrates performance of prognostic models that include convolutional neural networks (CNN) trained to analyze PSMA PET image data of the primary prostate tumor to predict presence or absence of synchronous metastatic disease in patients with aggressive localized prostate cancer. Such models, for example, may be trained to predict the presence of synchronous metastases using only primary tumor data, as well inputs from the PSMA PET data in the primary tumor in combination with clinicopathologic data and measurable imaging parameters. Additionally or alternatively, as shown in Example 4, these models, once trained, may be used to accurately predict risk of future – e.g., metachronous – metastases, for example following curative intent therapy. [0384] As described herein, for example in Examples 1 to 3, above, PyL PSMA PET/CT images from patients who were treatment naïve and underwent a scan at initial staging, were used to develop a model for prediction of metastatic disease from images of localized cancer. As described in Example 3 above, models were trained and evaluated, splitting the dataset into training, validation, and test sets using stratified random sampling in ratios of 0.5, 0.2, and 0.3, respectively. Area under the receiver operating characteristic curve (AUC) analysis was performed to assess models’ performance in predicting synchronous metastases by comparison with ground truth based on imaging. Training was repeated 50 times and best-performing experiment was identified. - 110 - 12297548v2
Attorney Docket No.2010358-0329 [0385] A Convolutional Neural Network (CNN) architecture based on SqueezeNetv2 (see, e.g., Iandola et al., “SqueezeNet: AlexNet-level accuracy with 50x fewer parameters and <0.5MB model size,” 2016, available online at https://doi.org/10.48550/arXiv.1602.07360). The neural network was trained for 300 epochs and the checkpoint for the best-performing epoch on the evaluation subset was kept for subsequent testing. To avoid overfitting, a randomly selected set of augmentations was applied to the CNN input at each epoch. Seven augmentations out of 15 were sampled and applied in random order: random rotation, random flip in left-right axes, random Gaussian noise, random standard deviation intensity shift, random contrast adjustment, random Gaussian smoothing, random Gaussian sharpening, random histogram shift, random coarse shuffle, random 3D elastic distortion, random affine transformation, random Gibbs noise, random bias field, random K-space spike noise, and random Rician noise. A combined model that added clinicopathologic data (PSA, pathologic grade group, percent positive cores) and measurable imaging parameters (peak SUV prostate- located value, PRIMARY score, PSMA expression score per PROMISE-criteria) to the CNN via a Naïve Bayes approach was also developed. [0386] The CNN and multimodal models achieved AUCs of 0.72 and 0.82, respectively, for synchronous metastases prediction. [0387] The present example proposes using the above-described models - e.g., CNN alone, and/or fused models that include clinicopathological data to generate a score (e.g., a ‘PyLN1-RiskScore’) that measures likelihood of local lymph node metastases. The risk score can be formulated to stratify patient with low medium and high-risk score for probability of local lymph node metastasis (N1). The PyLN1-RiskScore will be tested against an independent data set. [0388] Development and testing of the proposed/described PyLN1-RiskScore may make use of an available independent data set from a multicenter study of the diagnostic accuracy of prostate specific membrane antigen PET/CT with 18F-DCFPyL in prostate cancer patients (OSPREY Study – NCT02981368). In particular, 252 men were enrolled and were eligible in Cohort A enrolled men with high-risk prostate cancer undergoing radical prostatectomy with pelvic lymphadenectomy. 18F-DCFPyL-positron emission tomography/computerized tomography (PSMA PET/CT) images were obtained before men went into surgery. Histopathology was obtained on all 252 men post-surgery. Three independent readers read the PSMA PET/CT to detect N1 disease. The image reading output of each reader was compared against histopathology (ground truth). - 111 - 12297548v2
Attorney Docket No.2010358-0329 [0389] Based on histopathological analysis, 62 patients were positive for N1 disease, and 190 patients were negative for nodal disease involvement. 18F-DCFPyL-positron emission tomography/computerized tomography had median sensitivity of 40.3% (28.1%— 52.5%, and specificity of 97.9% (95% CI: 94.5%—99.4%) in detecting pelvic nodal involvement, not meeting prespecified end point for sensitivity). 18F-DCFPyL-PET/CT demonstrated similar sensitivity (40.3% vs.42.6%) in detecting pelvic lymph node metastases were compared with CT or MRI. [0390] The proposed experiment/study for development of a N1 metastases prediction risk score will utilizes models (e.g., CNN and/or fused), as described herein, to generate a risk score referred to as PyLN1-RiskScore. The generated risk score will be evaluated for its success in predicting N1 disease, when used by readers. In particular, the three readers will read the OSPREY images cohort data (N = 252) on aPROMISE with and without the machine-learning-based risk score (PyLN1-RiskScore). [0391] The endpoint will be the sensitivity of readers to detect N1 disease. The study will be deemed successful if two out of the three readers demonstrate significant improvement in sensitivity in the detection of N1 disease. [0392] In the proposed study, the sample size justification and success criteria is as follows: The number of images is fixed at 252. The number of patients with N1 disease by histopathology is 62. No additional patient data will be collected prospectively. The sample size is adequate to detect an increase of at least 10% in sensitivity. [0393] If the improvement in sensitivity is approximately 10%, to 50% (or at least 6 more patients with N1 disease reported), then the sample size to detect the improvement is 47 patients with 80% power, 49 patients with 87% power, and 51 patients with 91% power, using an exact test with a 5% level of significance (alpha). Sample sizes for improvements on the order of 15% and 20% are included in the table below and illustrated in the power curves shown in FIG.25. - 112 - 12297548v2
Attorney Docket No.2010358-0329 Table 9: Sample Sizes Alternative Hypothesis: Two-Sided (H0: P = P0 vs. H1: P ≠ P0) N (Population Size): 62 Proportion Proportion Given H0 Given H1 Difference Power* n P0 P1 P1 - P0 Alpha ───────────────────────────────────────── 0.80085 47 0.4 0.50 0.10 0.05 0.82505 37 0.4 0.55 0.15 0.05 0.82474 28 0.4 0.60 0.20 0.05 0.86699 49 0.4 0.50 0.10 0.05 0.87211 39 0.4 0.55 0.15 0.05 0.87019 30 0.4 0.60 0.20 0.05 0.92550 51 0.4 0.50 0.10 0.05 0.91314 41 0.4 0.55 0.15 0.05 0.90875 32 0.4 0.60 0.20 0.05 ───────────────────────────────────────── * Power was computed using the normal approximation method. Power The probability of rejecting a false null hypothesis when the alternative hypothesis is true. n The size of the sample drawn from the population P0 The value of the population proportion under the null hypothesis. P1 The value of the population proportion under the alternative hypothesis. P1 - P0 The difference to be detected by the study. Alpha The probability of rejecting a true null hypothesis. Reject H0 If... Gives the critical value(s) for the test. . EQUIVALENTS [0394] It is to be understood that while the disclosure has been described in conjunction with the detailed description thereof, the foregoing description is intended to illustrate and not limit the scope of the claims. Other aspects, advantages, and modifications are within the scope of the claims. [0395] This written description uses examples to disclose the invention, including the best mode, and also to enable any person skilled in the art to practice the present embodiments, including making and using any devices or systems and performing any - 113 - 12297548v2
Attorney Docket No.2010358-0329 incorporated methods. The patentable scope of the present embodiments is defined by the claims, and may include other examples that occur to those skilled in the art. Such other examples are intended to be within the scope of the claims if they include structural elements that do not differ from the literal language of the claims, or if they include equivalent structural elements with insubstantial differences from the literal languages of the claims. - 114 - 12297548v2
 wherein the method comprises receiving a combined 3D PSMA-PET/CT image that comprises the first image and the second image). [0035] In certain embodiments, the PSMA binding agent comprises 68Ga-PSMA-11 (gallium (68Ga) gozetotide,
 - 45 - 12297548v2
Attorney Docket No.2010358-0329
- 45 - 12297548v2
Attorney Docket No.2010358-0329
 where nl is the number of individual voxels within a particular uptake region (e.g., a 3D hotspot volume). [0228] In certain embodiments, an uptake region intensity metric may be a peak uptake region intensity (e.g., SUV), or “SUV-peak,” and may be computed as a mean over intensities of the voxels (e.g., SUV or uptake) whose midpoints are located within a (e.g., pre-defined) particular distance (e.g., within 5 mm) of the midpoint of the uptake region voxel where the maximum intensity (e.g., SUV-max) is located within an uptake region , and, accordingly, may be computed according to equations (3a)-(3c) below. (3a)
 (3b)
(3b)
 (3c)
(3c)
 - 51 - 12297548v2
Attorney Docket No.2010358-0329 where ^^^^: ^^^^ ^^^^ ^^^^ ^^^^( ^^^^ ^^^^ ^^^^ ^^^^, ^^^^) ≤ ^^^^ is the set of (uptake region) voxels having a mid-point within a distance, d, from voxel imax, which is the maximum intensity voxel within the uptake region (e.g., Qmax(l) = qi-max). D.ii. Lesion Index Metrics [0229] In certain embodiments, an uptake region intensity metric is individual lesion index value that maps an intensity of voxels within a particular 3D hotspot volume to a value on a standardized scale. Such lesion index values are described in further detail in PCT/EP2020/050132, filed January 6, 2020, and PCT/EP2021/068337, filed July 2, 2021, the content of each of which is hereby incorporated by reference in its entirety. Calculation of lesion index values may include calculation of reference intensity values within particular reference tissue regions, such as an aorta portion (also referred to as blood pool) and/or a liver. [0230] For example, in one particular implementation, a first, blood-pool, reference intensity value is determined based on a measure of intensity (e.g., a mean SUV) within an aorta region and a second, liver, reference intensity value is determined based on a measure of intensity (e.g., a mean SUV) within a liver region. As described in further detail, for example in PCT/EP2021/068337, filed July 2, 2021, the content of which is incorporated herein by reference in its entirety, calculation of reference intensities may include approaches such as identifying reference volumes (e.g., an aorta or portion thereof; e.g., a liver volume) within a functional image, such as a PET or SPECT image, eroding and/or dilating certain reference volumes, e.g., to avoid include voxels on the edge of a reference volume, and selecting subsets of reference voxel intensities, based on modeling approaches, e.g., to account for anomalous tissue features, such as cysts and lesions, within a liver. In certain embodiments, a third reference intensity value may be determined, either as a multiple (e.g., twice) of a liver reference intensity value, or based on an intensity of another reference tissue region, such as a parotid gland. [0231] In certain embodiments, uptake region intensities may be compared with one or more reference intensity values to determine a lesion index as a value on a standardized scale, which facilitates comparison across different images. For example, FIGs.5A and 5B illustrate approaches for assigning uptake regions a lesion index value ranging from 0 to 3. In the approach shown in FIGs.5A and 5B, a blood-pool (aorta) intensity value is assigned a - 52 - 12297548v2
Attorney Docket No.2010358-0329 lesion index of 1, a liver intensity value is assigned a lesion 2, and a value of twice the liver intensity is assigned a lesion index of 3. A lesion index for a particular uptake region can be determined by first computing a value of an initial uptake region intensity metric for the particular uptake region, such as a mean uptake region intensity (e.g., Qmean(l) or SUVmean) and comparing the value of the initial uptake region intensity metric with the reference intensity values. For example, the value of the initial hotspot intensity metric may fall within one of four ranges – [0, SUVblood], (SUVblood, SUVliver], (SUVliver, 2 x SUVliver], and greater than 2xSUVliver (e.g., (2xSUVliver, ∞)). In certain embodiments, an uptake region may be assigned a lesion index value based on a step function, e.g., as shown in FIG.5A. In certain embodiments, as shown in FIG.5B a lesion index value can then be computed for the particular uptake region based on (i) the value of the initial uptake region intensity metric and (ii) a linear interpolation according to the particular range in which the value of the initial uptake region intensity metric falls, as illustrated in FIG.5B, where the filled and open dots on the horizontal (SUV) and vertical (LI) axes illustrate example values of initial hotspot intensity metrics and resultant lesion index values, respectively. In certain embodiments, if SUV references for either liver or aorta cannot be calculated, or if the aorta value is higher than the liver value, the lesion index will not be calculated and will be displayed as ‘-‘. [0232] A lesion index value according to the mapping scheme described above and illustrated in FIG.5B may, for example, be computed as shown in equation (4), below.
- 51 - 12297548v2
Attorney Docket No.2010358-0329 where ^^^^: ^^^^ ^^^^ ^^^^ ^^^^( ^^^^ ^^^^ ^^^^ ^^^^, ^^^^) ≤ ^^^^ is the set of (uptake region) voxels having a mid-point within a distance, d, from voxel imax, which is the maximum intensity voxel within the uptake region (e.g., Qmax(l) = qi-max). D.ii. Lesion Index Metrics [0229] In certain embodiments, an uptake region intensity metric is individual lesion index value that maps an intensity of voxels within a particular 3D hotspot volume to a value on a standardized scale. Such lesion index values are described in further detail in PCT/EP2020/050132, filed January 6, 2020, and PCT/EP2021/068337, filed July 2, 2021, the content of each of which is hereby incorporated by reference in its entirety. Calculation of lesion index values may include calculation of reference intensity values within particular reference tissue regions, such as an aorta portion (also referred to as blood pool) and/or a liver. [0230] For example, in one particular implementation, a first, blood-pool, reference intensity value is determined based on a measure of intensity (e.g., a mean SUV) within an aorta region and a second, liver, reference intensity value is determined based on a measure of intensity (e.g., a mean SUV) within a liver region. As described in further detail, for example in PCT/EP2021/068337, filed July 2, 2021, the content of which is incorporated herein by reference in its entirety, calculation of reference intensities may include approaches such as identifying reference volumes (e.g., an aorta or portion thereof; e.g., a liver volume) within a functional image, such as a PET or SPECT image, eroding and/or dilating certain reference volumes, e.g., to avoid include voxels on the edge of a reference volume, and selecting subsets of reference voxel intensities, based on modeling approaches, e.g., to account for anomalous tissue features, such as cysts and lesions, within a liver. In certain embodiments, a third reference intensity value may be determined, either as a multiple (e.g., twice) of a liver reference intensity value, or based on an intensity of another reference tissue region, such as a parotid gland. [0231] In certain embodiments, uptake region intensities may be compared with one or more reference intensity values to determine a lesion index as a value on a standardized scale, which facilitates comparison across different images. For example, FIGs.5A and 5B illustrate approaches for assigning uptake regions a lesion index value ranging from 0 to 3. In the approach shown in FIGs.5A and 5B, a blood-pool (aorta) intensity value is assigned a - 52 - 12297548v2
Attorney Docket No.2010358-0329 lesion index of 1, a liver intensity value is assigned a lesion 2, and a value of twice the liver intensity is assigned a lesion index of 3. A lesion index for a particular uptake region can be determined by first computing a value of an initial uptake region intensity metric for the particular uptake region, such as a mean uptake region intensity (e.g., Qmean(l) or SUVmean) and comparing the value of the initial uptake region intensity metric with the reference intensity values. For example, the value of the initial hotspot intensity metric may fall within one of four ranges – [0, SUVblood], (SUVblood, SUVliver], (SUVliver, 2 x SUVliver], and greater than 2xSUVliver (e.g., (2xSUVliver, ∞)). In certain embodiments, an uptake region may be assigned a lesion index value based on a step function, e.g., as shown in FIG.5A. In certain embodiments, as shown in FIG.5B a lesion index value can then be computed for the particular uptake region based on (i) the value of the initial uptake region intensity metric and (ii) a linear interpolation according to the particular range in which the value of the initial uptake region intensity metric falls, as illustrated in FIG.5B, where the filled and open dots on the horizontal (SUV) and vertical (LI) axes illustrate example values of initial hotspot intensity metrics and resultant lesion index values, respectively. In certain embodiments, if SUV references for either liver or aorta cannot be calculated, or if the aorta value is higher than the liver value, the lesion index will not be calculated and will be displayed as ‘-‘. [0232] A lesion index value according to the mapping scheme described above and illustrated in FIG.5B may, for example, be computed as shown in equation (4), below.
 (5b) ^^^^ ^^^^ ^^^^ ^^^^ ( ^^^^ ) = ^^^^ × ^^^^ ^^^^ where in equation (5a), vi is a volume of an ith voxel, and equation (5b) assumes a uniform voxel volume, v, and as before nl is a number of voxels in a particular hotspot volume, l. In certain embodiments, a voxel volume is computed as ^^^^ = ^^^^ ^^^^ × ^^^^ ^^^^ × ^^^^ ^^^^, where δx, ^^^^ ^^^^, and ^^^^ ^^^^ are grid spacing (e.g., in millimeters, mm) in x, y, and z. In certain embodiments, a lesion volume has units of milliliters (ml). E. Automated Evaluation of Cancer Staging Scores [0234] Turning to FIG.6, in certain embodiments, various approaches for localizing 3D volumes of interest (VOIs) within images, e.g., corresponding to particular organs, and identifying and characterizing uptake regions (e.g., hotspots) corresponding to potential lesions, e.g., including, but not limited to, those described herein, may be used to determine cancer staging scores in an automated fashion. For example, in certain embodiments, in an exemplary process 600 for automatically determining a prostate cancer staging score may utilize, and receive, a 3D functional image 602, such as a PET or SPECT image of a subject. A prostate volume, that corresponds to a prostate within the subject, may be determined (e.g., identified) 604 within the 3D functional image 602. A prostate volume within a 3D functional image may, for example, be determined using various anatomical segmentation techniques described herein, for example by segmenting a 3D anatomical image, such as a CT image, that is co-aligned with the 3D functional image to determine a segmentation mask representing a region of the CT image determined to correspond to the prostate. The segmentation mask can then be mapped to the 3D functional image to identify, as the prostate volume, a corresponding region within the 3D functional image. [0235] In certain embodiments, uptake regions that represent underlying physical lesions within the subject are localized 606 within the 3D functional image. As described herein, uptake regions may be hotspots, and may be localized – e.g., detected and/or segmented – using various techniques, such as machine learning based techniques, as described herein. In certain embodiments, localized uptake regions are limited to those - 54 - 12297548v2
Attorney Docket No.2010358-0329 determined represent underlying physical lesions and/or radiopharmaceutical uptake within the subject’s prostate and/or its vicinity. These prostate uptake regions may be identified as those having volumes that overlap, e.g., at least in part, with, and/or are entirely within, the prostate volume. [0236] In certain embodiments, for values of uptake region intensity metric(s) are determined for each localized (e.g., prostate) uptake region 608. For example, for each uptake region intensity metric, a value of a maximum, mean, median, peak, etc., intensity metric may be determined, e.g., as described herein. In certain embodiments, uptake region intensity metrics determined for each uptake region include values of lesion indices, determined, for example, using reference intensity values, such as those of a liver and/or aorta region, for example as described herein. In certain embodiments, for example where a radiopharmaceutical used to obtain the 3D functional image is or comprises a PSMA binding agent, a lesion index may be referred to as a PSMA expression score. [0237] In certain embodiments, a spatial location of each uptake region is analyzed and compared with one or more prostate zones 610, and a set of assigned prostate zones determined, to reflect a spatial location and/or distribution of intensities within the uptake region. For example, a prostate may be divided into 4 zones according to their biological function. For example, a prostate and its immediate vicinity may be subdivided into a central zone (CZ) (e.g., a zone that surrounds the ejaculatory ducts and comprises about 25% of a prostate’s total mass), a transitional zone (TZ) (e.g., a part of the prostate that surrounds the urethra), and a peripheral zone (PZ) (e.g., a zone situated toward a back of the gland, where a majority of the glandular tissue sits. In certain embodiments, other zones, such as a fibromuscular zone (FZ) (e.g., anterior zone), may be used as well. In certain embodiments, a FZ may be challenging to identify on a CT image, and not included in a model. In certain embodiments, a ureter zone (UZ) may also be included. A reference model, e.g., an atlas image, with boundaries of the particular prostate zones may be aligned to the 3D functional image, and a spatial extent of each uptake region compared with the so aligned reference model, to determine which of the various prostate zones the uptake region is located within and/or overlaps with. An uptake region may be associated with a set of assigned zones that it overlaps with, for example a single zone or multiple zones. [0238] In certain embodiments, once determined, the values of the uptake region intensity metric(s) and the prostate zone assignments may be used to determine a prostate cancer staging score 612. - 55 - 12297548v2
Attorney Docket No.2010358-0329 F. Neural Network-Based Prediction of Metastases [0239] In certain embodiments, the present disclosure provides systems and methods for predicting presence and/or risk of metastases in a subject, based on medical image data that reflects presence of localized disease. In particular, among other things, metastatic disease prediction technologies of the present disclosure leverage artificial neural networks (ANNs) to analyze image data that is associated with and reflects presence of localized disease, such as images of regions about a single primary tumor and/or one or more lesions confined to a single tissue region or organ, where cancer was first detected. Among other things, technologies described herein make use of the insight that, while such images of localized disease may not include conventional or express hallmarks of metastatic disease, such as presence of hotspots dispersed outside the primary organ and/or tumor, they nonetheless may reflect patterns, features, such as particular intensity patterns and/or hotspot features, etc. that are indicative of (e.g., correlate with) presence and/or risk of metastases. While such patterns and their relationship / implications for whether a particular patient has or will develop metastatic disease may escape conventional image analysis methods and/or review by human professionals, such as physicians, radiologists, and the like, ANN technologies of the present disclosure can be trained and used to generate predictions of whether a patient has or will develop metastases – i.e., one or more cancerous lesions outside of a primary tumor and/or site (e.g., organ or tissue region) where cancer was originally detected. [0240] Approaches for leveraging machine learning technologies to analyze nuclear medicine images of localized disease in order to predict presence and/or risk of a particular disease state, such as whether a patient has or will develop metastases are described, for example, in U.S. Patent Application No.16/734,609, filed January 6, 2020, and U.S. Patent Application No.17/762,796, filed March 23, 2022 the contents of each of which are incorporated herein in their entirety. The present disclosure extends and improves upon these techniques by incorporating the insight that performance of machine learning techniques can be improved by incorporating an additional channel of input that corresponds to a hotspot mask, identifying automatically segmented hotspot volumes. As described and demonstrated in further detail herein, this additional channel of input improves the machine learning algorithm’s ability to identify and focus its attention on important regions in images, allowing it to generate accurate predictions on limited training data. - 56 - 12297548v2
Attorney Docket No.2010358-0329 [0241] Accordingly, as shown in FIGs.7A and 7B, technologies of the present disclosure include processes, such as example process, 700, whereby one or more medical image(s) are received or otherwise obtained 702, by a processor, such as a cloud-based or local image storage and analysis system. In certain embodiments, one or more medical images are or comprise anatomical and functional images, such as co-aligned anatomical and functional image pairs or composite images, comprising an anatomical and functional image acquired at a substantially same time and/or of a substantially same portion of a subject. As described in further detail herein, anatomical images may include images such as computed tomography (CT) images, magnetic resonance images (MRIs), while functional images may include nuclear medicine images, such as positron emission tomography (PET) and single photon emission computed tomography (SPECT) images. [0242] Medical images 102 may be analyzed to identify target volume(s) 704 comprising representations of primary tumor regions that are associated with localized disease, as well as to detect suspect regions 706 – portions of images that are determined likely to represent underlying physical lesions within a patient. Such suspect regions may be determined automatically or semi-automatically, for example by a software program, computer-aided analysis technique, such as a machine learning model or other computer- implemented process, with or without interaction and/or review by an operator. [0243] As shown in FIG.7B, in certain embodiments, voxels of medical images within an extracted target volume 754 as well as an identification of detected suspect regions 756 are fed as two channels of input into a neural network 758, which generates, as output, a metastasis prediction 708, 760. A metastasis prediction may be a score or classification. For example, a metastasis score may quantify a likelihood of a patient having or at risk of developing metastases. A metastasis classification may be a binary classification, such as a 0 or 1 value, indicative of whether the patient is likely to have or develop metastatic disease or not. In certain embodiments, as shown in FIG.7C, neural network determined predictions (e.g., likelihood values) may be combined with patient attributes, such as clinicopathological measurements and/or computed features via a classifier 764 to create a fused model that leverages multiple data sources and types to predict 766 presence and/or risk of metastases (e.g., synchronous metastases) with high accuracy. [0244] In certain embodiments, metastases predictions may represent predictions of whether a subject has or likely will develop metastases. In certain embodiments, metastases predictions may reflect whether a subject has or likely will develop metastases within a - 57 - 12297548v2
Attorney Docket No.2010358-0329 particular time-period, e.g., following a date one when the one or more medical images were acquired and/or after initial diagnosis. For example, a metastasis prediction may represent a prediction of whether a subject has or will develop synchronous metastases – i.e., metastases that may already present in the subject (e.g., but not necessarily having been detected) – or metastases that will appear (e.g., and be detectable) within less than a year (e.g., less than six months). In this manner, among other things, approaches of the present disclosure can predict whether or not a given patient is at risk of harboring occult (e.g., undetectable via imaging) metastatic disease that can be manifested by metastatic progression subsequent to curative intent therapy. [0245] Among other things, metastases predictions may be displayed and/or otherwise provided for use in a decision support system 710, to, for example, assist physicians in disease staging, counseling, and treatment course determinations. [0246] As described in further detail herein, nuclear medicine images acquired using prostate specific membrane antigen (PSMA) targeting agents, such as [18F]DCFPyL (PyLTM) are of particular interest to prostate cancer staging and diagnosis. [F18]DCFPyL (PyL) is a PSMA targeted imaging agent shown to have greater accuracy, specificity, and sensitivity than conventional imaging in the detection of metastatic disease and it has been established for initial staging. While a primary use of PSMA PET/CT has been to improved staging accuracy, the present disclosure recognizes that there may be untapped data contained within these PET/CT scans that can be used for meaningful prognostic evaluation, namely, to provide added insights into disease biology, including the presence of co-existing metastatic disease. [0247] Among other things, while prostate cancers may, e.g., initially, be localized, certain localized prostate cancers pose a high risk of metastatic progression to lethal disease, while others are at lower risk of such progression, and are less aggressive. While more aggressive disease may warrant an aggressive initial treatment approach, prostate cancers that do not pose a high risk of metastatic progression may be better treated (e.g., particularly in view of potential quality of life reducing side effects from aggressive treatment) via a more targeted and/or less aggressive approach. Accordingly, accurate prognostic information at a time of diagnosis can improve the ability of physicians and their patients to select and achieve better courses of action. Currently, at the clinical stage, serum Prostate Specific Antigen (PSA), Gleason Grade, and percent positive cores are typically used to assess risk of metastatic progression, and may be combined with transcriptomic data. Typically, however, - 58 - 12297548v2
Attorney Docket No.2010358-0329 current approaches utilize imaging scans only to determine stage (e.g., metastatic or not, and number of lesions). Technologies of the present disclosure allow for expanded use of imaging data, in particular, in fulfilling a need for accurate prognostic information early on, allowing for prediction of metastatic disease risk and its use in improving patient outcomes. [0248] Moreover, in certain embodiments, metastases risk prediction technologies described herein may leverage the insights that machine learning models that are trained on certain types of, e.g., more plentiful, data, can be used to generate predictions about disease prediction that for which exact examples can be more time consuming and/or challenging to obtain, resulting in insufficient data. For example, as demonstrated herein, it is possible to train a machine learning model on images for patients with synchronous metastases – i.e., for which metastases already have been observed, or will be observed within a very short time frame, and then, once the model is a trained, a new image, of a new patient, can be received and evaluated (by the model) to generate a metastasis score/prediction. Even if this new patient presents with localized disease (e.g., no lesion spread outside a localized primary tumor region) in the near term, the generated metastases score can be used as an accurate predictor of a risk that the patient will develop metastases well into the future, for example, after curative therapy. [0249] From a practical standpoint, training a machine learning model on images of patients with synchronous metastases is advantageous since it is generally known whether a patient has synchronous metastases or not when they are imaged or shortly thereafter (e.g., since six (6) months is a short timeframe). That is, some of the images themselves might have metastases showing up in them, and for the ones that might not, it will be apparent quickly (e.g., within six months) if the patient does or doesn’t get synchronous metastases. Accordingly, medical images labeled as corresponding to patients with synchronous metastases or not are a relatively abundant dataset. On the other hand, for metachronous metastases / metastases that will develop in the future, to obtain directly corresponding data, one would need to take an image of a patient that presents with localized disease, wait until they are treated, then watch them for a relatively long period of time (e.g., years), to determine if their cancer spreads (metastasizes), and then, finally, label the images accordingly (i.e., label medical images according to whether each patient’s cancer metastasized or not, several years later). [0250] To address this challenge, among other things, as Example 3 described herein, uses a small dataset (e.g., not enough to directly train a neural network model, but enough to - 59 - 12297548v2
Attorney Docket No.2010358-0329 tests hypotheses) of medical images where patients initially presented with localized disease, and did not develop metastases until a significant time period later, e.g., after curative intent therapy. A model that was trained on a different dataset – of synchronous metastases images – may be used to analyze the early-stage images of patients that presented with localized disease and generate a metastases score that accurately classified patients that did or did not develop metachronous metastases. Accordingly, in certain embodiments, technologies described herein address challenges associated with limited data availability, allowing for machine learning models trained on certain images of synchronous metastases to then be used, at inference stages, to predict whether a subject will develop metachronous metastases. [0251] While described herein with particular emphasis on and/or relevance to prostate cancer, metastases prediction technologies of the present disclosure may be utilized for other types of cancer, such breast cancer, colorectal cancer, esophageal cancer, lung cancer, ovarian cancer, pancreatic cancer, e.g., to predict, based on images of localized disease within a target volume corresponding to a primary tumor region within the subject, will metastases. For example, for a subject with breast cancer, a primary tumor region may be or comprise one or both breasts of the subject; for a subject with colorectal cancer, a primary tumor region may be or comprises a colon of the subject; for a subject with esophageal cancer, a primary tumor region may be or comprises an esophagus of the subject; for a subject with lung cancer, a primary tumor region may be or comprises one or both lungs of the subject; for a subject with ovarian cancer, a primary tumor region may be or comprises one or both ovaries of the subject; for a subject with pancreatic cancer, a primary tumor region may be or comprises a pancreas of the subject; etc. [0252] Turning to FIG.8A, in certain embodiments, image analysis technologies of the present disclosure leverage techniques for detecting, segmenting, and quantifying hotspots to improve accuracy of machine learning models in prediction of metastatic disease risk based on images of primary tumor. [0253] For example, FIG.8A shows an example process 800 for predicting metastatic disease risk for a subject presenting (e.g., having been diagnosed with) localized prostate cancer. As shown in FIG.8A, one or more medical images of the subject are obtained 802. These may be medical images acquired and/or used to arrive at an initial detection and/or diagnosis of localized disease or may have been obtained in (e.g., additional) follow up visits. In certain embodiments, one or more medical images are obtained within a particular (e.g., short) time period following initial diagnosis and/or detection, such as within a month, three - 60 - 12297548v2
Attorney Docket No.2010358-0329 months, six months, or a year. In certain embodiments, one or more medical images are obtained prior to initial treatment. For example, as described in further detail herein, medical images may be obtained and analyzed using the metastatic disease prediction technologies of the present disclosure in order to assist with determining a course of treatment, for example whether a relatively mild, targeted treatment is appropriate or if a more aggressive course is warranted at the outset, for example if a patient is determined to be at high risk for having or developing synchronous metastases. [0254] In certain embodiments, one or more medical images are or comprise anatomical images, such as CT images or MRIs. In certain embodiments, one or more medical images are or comprise functional images, such as nuclear medicine images, including, but not limited to, PET and SPECT images. In certain embodiments, one or more medical images are or comprise one or more pairs of co-aligned anatomical and functional images. In certain embodiments, one or more medical images are or comprise one or more composite or fused anatomical and functional images, for example PET/CT and/or SPECT/CT images. F.i. Input Channels and Features [0255] Medical images may be analyzed, for example as described in Sections A-D, herein, to identify (i) a volume that corresponds to or comprises a prostate of the subject 804, which is the site of primary tumor and/or localized disease in prostate cancer, and (ii) suspect regions of images likely to represent underlying (e.g., individual) lesions 806. As shown in FIG.8B, these identified regions – the prostate volume 854 and suspect regions (e.g., a hotspot mask, 856) – may then be used as or to create two channels of input for a machine learning model 858. [0256] For example, as described herein (e.g., in Section B, above), an anatomical and nuclear medicine composite image, such as a PET/CT image, may be analyzed to automatically identify a volume of interest (VOI) that corresponds to or comprises a representation of a prostate within the anatomical image. The VOI may then be mapped to the co-aligned nuclear medicine image of the composite image and used to identify a corresponding volume within the nuclear medicine image. Voxels within this corresponding nuclear medicine image volume may then be used as a first, prostate intensity, channel of input. - 61 - 12297548v2
Attorney Docket No.2010358-0329 [0257] Suspect regions can be identified by automatically detecting hotspots within the nuclear medicine image, for example, as described in Section C, above. In certain embodiments, a 3D hotspot mask that identifies volumes of hotspots within the functional image may then be used as a second, hotspot mask channel, of input to the machine learning model. F.ii Model Outputs [0258] Turning again to FIGs 8A and 8B, identified prostate volumes and suspect regions may be used to determine a metastases prediction 808, 860. As shown in FIG.8B, in certain embodiments, a machine learning model may generate, as output, a metastases score or classification 860 based (at least in part) on its received prostate intensity and hotspot mask input channels. For example, a machine learning model may generate, as a metastases score, a likelihood value (e.g., having a value ranging from 0 to 1) that represents a likelihood that a patient has or will develop metastases, for example within a particular time window (e.g., synchronous metastases). In certain embodiments, a binary classification may be determined using a generated likelihood value, for example by comparing it to a threshold value. [0259] In certain embodiments, a multi-class classification approach is used, whereby a machine learning model generates, as output, a plurality of likelihood values, representing likelihoods of particular types and/or categories of metastases, as determined by the machine learning model. [0260] In certain embodiments, metastases predictions, such as scores or classifications, may represent predictions of presence and/or risk (e.g., of future) of metastases of particular types, classifications, or in particular locations. For example, metastatic lesions may be classified in terms of their anatomical location and/or lesion sub- type. In certain embodiments, various clinically accepted staging systems may be used to classify lesions, including metastases, such as, without limitation the tumor-node-metastasis (TNM) system, the Lugano system, and the FIGO system. [0261] Metastases prediction technologies of the present disclosure may, accordingly, generate predictions indicative of likelihoods of presence and/or risk of metastases of various types, according to one or more such staging systems. For example, the TNM system is used to stage solid tumors associated with cancers such as prostate cancer, lung cancers, colon - 62 - 12297548v2
Attorney Docket No.2010358-0329 cancers, breast cancers, and bladder cancer. As described, for example in Eiber et al., “Prostate Cancer Molecular Imaging Standardized Evaluation (PROMISE): Proposed miTNM Classification for the Interpretation of PSMA-Ligand PET/CT,” J. Nucl. Med.2018; 59:469-478, the TNM system uses an alphanumeric code to classify disease based on locations and/or number of lesions, with the letter “T” used to identify primary tumor (e.g., in the organ of origin, such as bladder, breast, colon, lung, prostate), “N” identifying whether tumor has spread to local lymph nodes, and “M” identifying distant metastases, beyond nearby lymph nodes and into other regions, such as distant lymph (“Ma”), bone (“Mb”), or other regions (“Mc”). In the context of prostate cancer, lesions in local – e.g., pelvic - lymph (miN) may be identified as belonging to a particular pelvic lymph node sub-region, such as one of a left/right internal iliac, a left or right external iliac, a left or right common iliac, a left or right obturator, a presacral region, or other pelvic region. In certain embodiments, distant lymph node metastases (miMa) may be classified as retroperitoneal (RP), supradiaphragmatic (SD), or other extrapelvic (OE). [0262] In certain embodiments, for example in the context of ovarian, cervical, endometrial, and other cancers involving and/or affecting female reproductive systems, metastases may be classified according to the FIGO system (e.g., stages 0, I, indicating local tumor, stage II indicating invasion of surrounding organs or tissue, stage III indicating spread to distant nodes or other tissue within the pelvis and stage IV indicating distant metastases). For example, metastases prediction technologies described herein may generate predictions or presence and/or risk of disease associated with one or more FIGO system classifications, such as stage II disease, stage III disease, stage IV disease. F.iii Model Architectures [0263] A variety of machine learning architectures may be used in connection with the approaches described herein. In certain embodiments, machine learning models used for generating metastases predictions are neural networks (e.g., ANNs). In certain embodiments, in particular, CNNs are used. - 63 - 12297548v2
Attorney Docket No.2010358-0329 F.iv Fused Models [0264] Turning to FIG.8C, as described herein, in certain embodiments, spatial image analysis approaches using a CNN model may be combined with other patient attributes such as measured and computed clinicopathologic features to create a fused model. For example, in certain embodiments, CNN model output 860 may be used as input, together with patient attributes 862, to a classifier 864 to determine a metastases score/classification 866. [0265] Certain patient attributes, described in further detail herein (e.g., in the Examples) that may be used include, without limitation, one or more of the following: PSA, pathologic grade, percent positive cores, cores positive, Primary Score, miTNM, PSMA expression score, uptake SUV peak value, uptake prostate zone, uptake type (focal vs. diffuse), uptake extends outside prostate, aorta SUV mean, liver SUV mean, overall upstaging risk, N upstaging, M upstaging. [0266] Various classifier models may be used, including, without limitation, logistic regression models, support vector machines, decision trees (e.g., random forests, XGboost), Naïve Bayes classifiers, and the like. F.v Prognosis at Subsequent Time Points and Following Therapy [0267] In certain embodiments, metastasis prediction technologies of the present disclosure may be used to predict whether a patient has or will develop metastases. For example, in certain embodiments, a patient may initially present with localized disease, and medical images may be indicative of a finding of localized disease. [0268] For example, in certain embodiments, a medical image is indicative of localized disease if lesions appearing in the medical image are limited to (e.g., locations within) a primary tumor region. For example, a patient may initially be diagnosed with prostate cancer and medical images, such as CT, PET, PET/CT, etc. images, show representations of lesions, such as hotspots within a PET image, in a primary tumor volume – e.g., a prostate region [e.g., and/or, optionally, a volume enclosing a prostate and tissue within a vicinity of the prostate (e.g., within 1 mm, 5 mm, 10 mm, 1 cm, 2 cm, 5 cm, etc.)], but not conclusive evidence of lesions outside the primary tumor volume. For example, a PET image may not show any hotspots outside of a primary tumor region. In certain - 64 - 12297548v2
Attorney Docket No.2010358-0329 embodiments, a medical image may contain image features outside a primary tumor region, but these features may not meet criteria for concluding that they represent metastases outside a primary tumor region. For example, hotspots may appear in a PET image outside a primary tumor volume but may not be of sufficient size and/or intensity to be characterized conclusively as metastatic lesions. In certain embodiments, other criteria may be used. For example, in certain embodiments, hotspots outside of a primary tumor region may be evaluated by a machine learning model and assigned a likelihood score representing a likelihood (e.g., as determined by the machine learning model) that they are a metastatic lesion. [0269] In certain embodiments, a medical image may be indicative of localized disease based on an evaluation of a medical professional, such as a physician, radiologist, etc. Such medical images may be included in and/or associated with a signed report by a particular medical professional that comprises a conclusion of localized disease. [0270] In certain embodiments, systems and methods of the present disclosure may receive, as input, medical images indicative of localized disease and determine a metastases score as described herein. A metastases score may be indicative of presence of metastases, which may be indicative of presence of, for example, occult metastases or synchronous metastases that were not present in the medical image or missed by a diagnosing practitioner. A metastases score may be indicative that a patient will develop metachronous metastases, e.g., following treatment. [0271] In certain embodiments, machine learning models may be trained to evaluate presence of synchronous metastases and then used to generate, at inference, predictions of whether patients presenting with localized disease will develop metastases, for example, at future times such as following treatment. For example, as demonstrated in Example 3, this approach provides accurate predictions. Without wishing to be bound to any particular theory this approach is believed to be justified by the premise that most early metastatic progression events occur consequent to growth of co-existing occult metastases at the time of curative intent therapy. Among other things, this approach allows for training strategies to benefit from potentially larger amounts of data, since it makes use of images obtained at a single time point. Otherwise, training examples corresponding exactly to the desired scenario – patients presenting initially with localized disease and then developing or not developing metastases later on, following treatment, would require imaging patients at an initial visit and then waiting, potentially several years, for them to undergo therapy and subsequent follow up - 65 - 12297548v2
Attorney Docket No.2010358-0329 imaging and diagnosis in order to label images from the initial visit as positive (e.g., the patient developed metastases later on) or negative (e.g., the patient did not develop metastases later on) examples. [0272] Accordingly, in certain embodiments, a machine learning model may be trained using a dataset comprising a plurality of example images, including images of purely localized disease (localized disease example) and images showing synchronous metastases (synchronous metastases examples). While the full training example images may show synchronous metastases or not (allowing them to be immediately labeled as positive or negative examples), the machine learning model may be trained on input corresponding a primary tumor region only, thereby causing the model to learn to classify patients as positive or negative for synchronous metastases based on image data within the primary tumor region alone. Following training, the (e.g., trained machine learning) model may be provided images of patients obtained at, for example, an initial (e.g., pre-treatment) visit. For images that are indicative of localized disease, as determined via another computational approach and/or by evaluation by a medical professional, the machine learning model may generate a metastases score, as it did during training. Although during training, parameters of the machine learning model may have been refined to allow for accurate prediction of synchronous metastases, values generated during inference may be used as a risk/likelihood that a patient initially presenting only with localized disease will, at a later date, present metastases (e.g., metachronous metastases). G. Guidance for Patient Diagnosis and Treatment [0273] Turning again to FIG.8A, metastases predictions of the present disclosure may, for example, be used to provide guidance for patient diagnosis and treatment decisions, for example being displayed and/or provided as part of a decision support system 810. [0274] The approaches described herein may be used, for example, in an initial visit, prior to therapy. Therapy and/or treatment approaches may be determined based on predictions, for example more aggressive therapy. For example, a patient may present with localized disease based on evaluation of medical images obtained at an initial staging or pre- treatment visit. These initial medical images may be analyzed by approaches described herein to produce metastases scores reflecting a risk/likelihood that the patient is prone to or will eventually develop metastases, e.g., at a later time. If metastases score is high, e.g., - 66 - 12297548v2
Attorney Docket No.2010358-0329 reflecting a high likelihood of metastases, for example, a more aggressive treatment approach may be determined to be prudent and selected, e.g., to compensate for/overcome this risk. H. Computer System and Network Architecture [0275] Certain embodiments described herein make use of computer algorithms in the form of software instructions executed by a computer processor. In certain embodiments, the software instructions include a machine learning module, also referred to herein as artificial intelligence software. As used herein, a machine learning module refers to a computer implemented process (e.g., a software function) that implements one or more specific machine learning techniques, e.g., artificial neural networks (ANNs), e.g., convolutional neural networks (CNNs), e.g., recursive neural networks, e.g., recurrent neural networks such as long short-term memory (LSTM) or Bilateral long short-term memory (Bi-LSTM), random forest, decision trees, support vector machines, and the like, in order to determine, for a given input, one or more output values. [0276] In certain embodiments, machine learning modules implementing machine learning techniques are trained, for example using datasets that include categories of data described herein (e.g., CT images, MRI images, PET images, SPECT images). Such training may be used to determine various parameters of machine learning algorithms implemented by a machine learning module, such as weights associated with layers in neural networks. In certain embodiments, once a machine learning module is trained, e.g., to accomplish a specific task such as segmenting anatomical regions, segmenting and/or classifying hotspots, or determining values for prognostic, treatment response, and/or predictive metrics, values of determined parameters are fixed and the (e.g., unchanging, static) machine learning module is used to process new data (e.g., different from the training data) and accomplish its trained task without further updates to its parameters (e.g., the machine learning module does not receive feedback and/or updates). In certain embodiments, machine learning modules may receive feedback, e.g., based on user review of accuracy, and such feedback may be used as additional training data, to dynamically update the machine learning module. In certain embodiments, two or more machine learning modules may be combined and implemented as a single module and/or a single software application. In certain embodiments, two or more machine learning modules may also be implemented separately, e.g., as separate software applications. A machine learning module may be software and/or hardware. For example, a - 67 - 12297548v2
Attorney Docket No.2010358-0329 machine learning module may be implemented entirely as software, or certain functions of an ANN module may be carried out via specialized hardware (e.g., via an application specific integrated circuit (ASIC)). [0277] Turning to FIG.9, an implementation of a network environment 900 for use in providing systems, methods, and architectures as described herein is shown and described. In brief overview, referring now to FIG.9, a block diagram of an exemplary cloud computing environment 900 is shown and described. The cloud computing environment 900 may include one or more resource providers 902a, 902b, 902c (collectively, 902). Each resource provider 902 may include computing resources. In some implementations, computing resources may include any hardware and/or software used to process data. For example, computing resources may include hardware and/or software capable of executing algorithms, computer programs, and/or computer applications. In some implementations, exemplary computing resources may include application servers and/or databases with storage and retrieval capabilities. Each resource provider 902 may be connected to any other resource provider 902 in the cloud computing environment 900. In some implementations, the resource providers 902 may be connected over a computer network 908. Each resource provider 902 may be connected to one or more computing device 904a, 904b, 904c (collectively, 904), over the computer network 908. [0278] The cloud computing environment 900 may include a resource manager 906. The resource manager 906 may be connected to the resource providers 902 and the computing devices 904 over the computer network 908. In some implementations, the resource manager 906 may facilitate the provision of computing resources by one or more resource providers 902 to one or more computing devices 904. The resource manager 906 may receive a request for a computing resource from a particular computing device 904. The resource manager 906 may identify one or more resource providers 902 capable of providing the computing resource requested by the computing device 904. The resource manager 906 may select a resource provider 902 to provide the computing resource. The resource manager 906 may facilitate a connection between the resource provider 902 and a particular computing device 904. In some implementations, the resource manager 906 may establish a connection between a particular resource provider 902 and a particular computing device 904. In some implementations, the resource manager 906 may redirect a particular computing device 904 to a particular resource provider 902 with the requested computing resource. - 68 - 12297548v2
Attorney Docket No.2010358-0329 [0279] FIG.10 shows an example of a computing device 1000 and a mobile computing device 1050 that can be used to implement the techniques described in this disclosure. The computing device 1000 is intended to represent various forms of digital computers, such as laptops, desktops, workstations, personal digital assistants, servers, blade servers, mainframes, and other appropriate computers. The mobile computing device 1050 is intended to represent various forms of mobile devices, such as personal digital assistants, cellular telephones, smart-phones, and other similar computing devices. The components shown here, their connections and relationships, and their functions, are meant to be examples only, and are not meant to be limiting. [0280] The computing device 1000 includes a processor 1002, a memory 1004, a storage device 1006, a high-speed interface 1008 connecting to the memory 1004 and multiple high-speed expansion ports 1010, and a low-speed interface 1012 connecting to a low-speed expansion port 1014 and the storage device 1006. Each of the processor 1002, the memory 1004, the storage device 1006, the high-speed interface 1008, the high-speed expansion ports 1010, and the low-speed interface 1012, are interconnected using various busses, and may be mounted on a common motherboard or in other manners as appropriate. The processor 1002 can process instructions for execution within the computing device 1000, including instructions stored in the memory 1004 or on the storage device 1006 to display graphical information for a GUI on an external input/output device, such as a display 1016 coupled to the high-speed interface 1008. In other implementations, multiple processors and/or multiple buses may be used, as appropriate, along with multiple memories and types of memory. Also, multiple computing devices may be connected, with each device providing portions of the necessary operations (e.g., as a server bank, a group of blade servers, or a multi-processor system). Thus, as the term is used herein, where a plurality of functions are described as being performed by “a processor”, this encompasses embodiments wherein the plurality of functions are performed by any number of processors (one or more) of any number of computing devices (one or more). Furthermore, where a function is described as being performed by “a processor”, this encompasses embodiments wherein the function is performed by any number of processors (one or more) of any number of computing devices (one or more) (e.g., in a distributed computing system). [0281] The memory 1004 stores information within the computing device 1000. In some implementations, the memory 1004 is a volatile memory unit or units. In some implementations, the memory 1004 is a non-volatile memory unit or units. The memory - 69 - 12297548v2
Attorney Docket No.2010358-0329 1004 may also be another form of computer-readable medium, such as a magnetic or optical disk. [0282] The storage device 1006 is capable of providing mass storage for the computing device 1000. In some implementations, the storage device 1006 may be or contain a computer-readable medium, such as a floppy disk device, a hard disk device, an optical disk device, or a tape device, a flash memory or other similar solid state memory device, or an array of devices, including devices in a storage area network or other configurations. Instructions can be stored in an information carrier. The instructions, when executed by one or more processing devices (for example, processor 1002), perform one or more methods, such as those described above. The instructions can also be stored by one or more storage devices such as computer- or machine-readable mediums (for example, the memory 1004, the storage device 1006, or memory on the processor 1002). [0283] The high-speed interface 1008 manages bandwidth-intensive operations for the computing device 1000, while the low-speed interface 1012 manages lower bandwidth- intensive operations. Such allocation of functions is an example only. In some implementations, the high-speed interface 1008 is coupled to the memory 1004, the display 1016 (e.g., through a graphics processor or accelerator), and to the high-speed expansion ports 1010, which may accept various expansion cards (not shown). In the implementation, the low-speed interface 1012 is coupled to the storage device 1006 and the low-speed expansion port 1014. The low-speed expansion port 1014, which may include various communication ports (e.g., USB, Bluetooth®, Ethernet, wireless Ethernet) may be coupled to one or more input/output devices, such as a keyboard, a pointing device, a scanner, or a networking device such as a switch or router, e.g., through a network adapter. [0284] The computing device 1000 may be implemented in a number of different forms, as shown in the figure. For example, it may be implemented as a standard server 1020, or multiple times in a group of such servers. In addition, it may be implemented in a personal computer such as a laptop computer 1022. It may also be implemented as part of a rack server system 1024. Alternatively, components from the computing device 1000 may be combined with other components in a mobile device (not shown), such as a mobile computing device 1050. Each of such devices may contain one or more of the computing device 1000 and the mobile computing device 1050, and an entire system may be made up of multiple computing devices communicating with each other. - 70 - 12297548v2
Attorney Docket No.2010358-0329 [0285] The mobile computing device 1050 includes a processor 1052, a memory 1064, an input/output device such as a display 1054, a communication interface 1066, and a transceiver 1068, among other components. The mobile computing device 1050 may also be provided with a storage device, such as a micro-drive or other device, to provide additional storage. Each of the processor 1052, the memory 1064, the display 1054, the communication interface 1066, and the transceiver 1068, are interconnected using various buses, and several of the components may be mounted on a common motherboard or in other manners as appropriate. [0286] The processor 1052 can execute instructions within the mobile computing device 1050, including instructions stored in the memory 1064. The processor 1052 may be implemented as a chipset of chips that include separate and multiple analog and digital processors. The processor 1052 may provide, for example, for coordination of the other components of the mobile computing device 1050, such as control of user interfaces, applications run by the mobile computing device 1050, and wireless communication by the mobile computing device 1050. [0287] The processor 1052 may communicate with a user through a control interface 1058 and a display interface 1056 coupled to the display 1054. The display 1054 may be, for example, a TFT (Thin-Film-Transistor Liquid Crystal Display) display or an OLED (Organic Light Emitting Diode) display, or other appropriate display technology. The display interface 1056 may comprise appropriate circuitry for driving the display 1054 to present graphical and other information to a user. The control interface 1058 may receive commands from a user and convert them for submission to the processor 1052. In addition, an external interface 1062 may provide communication with the processor 1052, so as to enable near area communication of the mobile computing device 1050 with other devices. The external interface 1062 may provide, for example, for wired communication in some implementations, or for wireless communication in other implementations, and multiple interfaces may also be used. [0288] The memory 1064 stores information within the mobile computing device 1050. The memory 1064 can be implemented as one or more of a computer-readable medium or media, a volatile memory unit or units, or a non-volatile memory unit or units. An expansion memory 1074 may also be provided and connected to the mobile computing device 1050 through an expansion interface 1072, which may include, for example, a SIMM (Single In Line Memory Module) card interface. The expansion memory 1074 may provide - 71 - 12297548v2
Attorney Docket No.2010358-0329 extra storage space for the mobile computing device 1050, or may also store applications or other information for the mobile computing device 1050. Specifically, the expansion memory 1074 may include instructions to carry out or supplement the processes described above, and may include secure information also. Thus, for example, the expansion memory 1074 may be provide as a security module for the mobile computing device 1050, and may be programmed with instructions that permit secure use of the mobile computing device 1050. In addition, secure applications may be provided via the SIMM cards, along with additional information, such as placing identifying information on the SIMM card in a non-hackable manner. [0289] The memory may include, for example, flash memory and/or NVRAM memory (non-volatile random access memory), as discussed below. In some implementations, instructions are stored in an information carrier. The instructions, when executed by one or more processing devices (for example, processor 1052), perform one or more methods, such as those described above. The instructions can also be stored by one or more storage devices, such as one or more computer- or machine-readable mediums (for example, the memory 1064, the expansion memory 1074, or memory on the processor 1052). In some implementations, the instructions can be received in a propagated signal, for example, over the transceiver 1068 or the external interface 1062. [0290] The mobile computing device 1050 may communicate wirelessly through the communication interface 1066, which may include digital signal processing circuitry where necessary. The communication interface 1066 may provide for communications under various modes or protocols, such as GSM voice calls (Global System for Mobile communications), SMS (Short Message Service), EMS (Enhanced Messaging Service), or MMS messaging (Multimedia Messaging Service), CDMA (code division multiple access), TDMA (time division multiple access), PDC (Personal Digital Cellular), WCDMA (Wideband Code Division Multiple Access), CDMA2000, or GPRS (General Packet Radio Service), among others. Such communication may occur, for example, through the transceiver 1068 using a radio-frequency. In addition, short-range communication may occur, such as using a Bluetooth®, Wi-Fi™, or other such transceiver (not shown). In addition, a GPS (Global Positioning System) receiver module 1070 may provide additional navigation- and location-related wireless data to the mobile computing device 1050, which may be used as appropriate by applications running on the mobile computing device 1050. - 72 - 12297548v2
Attorney Docket No.2010358-0329 [0291] The mobile computing device 1050 may also communicate audibly using an audio codec 1060, which may receive spoken information from a user and convert it to usable digital information. The audio codec 1060 may likewise generate audible sound for a user, such as through a speaker, e.g., in a handset of the mobile computing device 1050. Such sound may include sound from voice telephone calls, may include recorded sound (e.g., voice messages, music files, etc.) and may also include sound generated by applications operating on the mobile computing device 1050. [0292] The mobile computing device 1050 may be implemented in a number of different forms, as shown in the figure. For example, it may be implemented as a cellular telephone 1080. It may also be implemented as part of a smart-phone 1082, personal digital assistant, or other similar mobile device. [0293] Various implementations of the systems and techniques described here can be realized in digital electronic circuitry, integrated circuitry, specially designed ASICs (application specific integrated circuits), computer hardware, firmware, software, and/or combinations thereof. These various implementations can include implementation in one or more computer programs that are executable and/or interpretable on a programmable system including at least one programmable processor, which may be special or general purpose, coupled to receive data and instructions from, and to transmit data and instructions to, a storage system, at least one input device, and at least one output device. [0294] Actions associated with implementing the systems may be performed by one or more programmable processors executing one or more computer programs. All or part of the systems may be implemented as special purpose logic circuitry, for example, a field programmable gate array (FPGA) or an application-specific integrated circuit (ASIC), or both. All or part of the systems may also be implemented as special purpose logic circuitry, for example, a specially designed (or configured) central processing unit (CPU), conventional central processing units (CPU) a graphics processing unit (GPU), and/or a tensor processing unit (TPU). [0295] These computer programs (also known as programs, software, software applications or code) include machine instructions for a programmable processor, and can be implemented in a high-level procedural and/or object-oriented programming language, and/or in assembly/machine language. As used herein, the terms machine-readable medium and computer-readable medium refer to any computer program product, apparatus and/or device - 73 - 12297548v2
Attorney Docket No.2010358-0329 (e.g., magnetic discs, optical disks, memory, Programmable Logic Devices (PLDs)) used to provide machine instructions and/or data to a programmable processor, including a machine- readable medium that receives machine instructions as a machine-readable signal. The term machine-readable signal refers to any signal used to provide machine instructions and/or data to a programmable processor. [0296] To provide for interaction with a user, the systems and techniques described here can be implemented on a computer having a display device (e.g., a CRT (cathode ray tube) or LCD (liquid crystal display) monitor) for displaying information to the user and a keyboard and a pointing device (e.g., a mouse or a trackball) by which the user can provide input to the computer. Other kinds of devices can be used to provide for interaction with a user as well; for example, feedback provided to the user can be any form of sensory feedback (e.g., visual feedback, auditory feedback, or tactile feedback); and input from the user can be received in any form, including acoustic, speech, or tactile input. [0297] The systems and techniques described here can be implemented in a computing system that includes a back end component (e.g., as a data server), or that includes a middleware component (e.g., an application server), or that includes a front end component (e.g., a client computer having a graphical user interface or a Web browser through which a user can interact with an implementation of the systems and techniques described here), or any combination of such back end, middleware, or front end components. The components of the system can be interconnected by any form or medium of digital data communication (e.g., a communication network). Examples of communication networks include a local area network (LAN), a wide area network (WAN), and the Internet. [0298] The computing system can include clients and servers. A client and server are generally remote from each other and typically interact through a communication network. The relationship of client and server arises by virtue of computer programs running on the respective computers and having a client-server relationship to each other. [0299] In some implementations, modules described herein can be separated, combined or incorporated into single or combined modules. The modules depicted in the figures are not intended to limit the systems described herein to the software architectures shown therein. [0300] Elements of different implementations described herein may be combined to form other implementations not specifically set forth above. Elements may be left out of the - 74 - 12297548v2
Attorney Docket No.2010358-0329 processes, computer programs, databases, etc. described herein without adversely affecting their operation. In addition, the logic flows depicted in the figures do not require the particular order shown, or sequential order, to achieve desirable results. Various separate elements may be combined into one or more individual elements to perform the functions described herein. [0301] Throughout the description, where apparatus and systems are described as having, including, or comprising specific components, or where processes and methods are described as having, including, or comprising specific steps, it is contemplated that, additionally, there are apparatus, and systems of the present invention that consist essentially of, or consist of, the recited components, and that there are processes and methods according to the present invention that consist essentially of, or consist of, the recited processing steps. [0302] It should be understood that the order of steps or order for performing certain action is immaterial so long as the invention remains operable. Moreover, two or more steps or actions may be conducted simultaneously. [0303] While the invention has been particularly shown and described with reference to specific preferred embodiments, it should be understood by those skilled in the art that various changes in form and detail may be made therein without departing from the spirit and scope of the invention as defined by the appended claims. I. Imaging Agents [0304] As described herein, a variety of radionuclide labelled PSMA binding agents may be used as radiopharmaceutical imaging agents for nuclear medicine imaging to detect and evaluate prostate cancer. In certain embodiments, certain radionuclide labelled PSMA binding agents are appropriate for PET imaging, while others are suited for SPECT imaging. I.i. PET imaging radionuclide labelled PSMA binding agents [0305] In certain embodiments, a radionuclide labelled PSMA binding agent is a radionuclide labelled PSMA binding agent appropriate for PET imaging. [0306] In certain embodiments, a radionuclide labelled PSMA binding agent comprises [18F]DCFPyL (also referred to as PyLTM; also referred to as DCFPyL-18F): - 75 - 12297548v2
Attorney Docket No.2010358-0329
(5b) ^^^^ ^^^^ ^^^^ ^^^^ ( ^^^^ ) = ^^^^ × ^^^^ ^^^^ where in equation (5a), vi is a volume of an ith voxel, and equation (5b) assumes a uniform voxel volume, v, and as before nl is a number of voxels in a particular hotspot volume, l. In certain embodiments, a voxel volume is computed as ^^^^ = ^^^^ ^^^^ × ^^^^ ^^^^ × ^^^^ ^^^^, where δx, ^^^^ ^^^^, and ^^^^ ^^^^ are grid spacing (e.g., in millimeters, mm) in x, y, and z. In certain embodiments, a lesion volume has units of milliliters (ml). E. Automated Evaluation of Cancer Staging Scores [0234] Turning to FIG.6, in certain embodiments, various approaches for localizing 3D volumes of interest (VOIs) within images, e.g., corresponding to particular organs, and identifying and characterizing uptake regions (e.g., hotspots) corresponding to potential lesions, e.g., including, but not limited to, those described herein, may be used to determine cancer staging scores in an automated fashion. For example, in certain embodiments, in an exemplary process 600 for automatically determining a prostate cancer staging score may utilize, and receive, a 3D functional image 602, such as a PET or SPECT image of a subject. A prostate volume, that corresponds to a prostate within the subject, may be determined (e.g., identified) 604 within the 3D functional image 602. A prostate volume within a 3D functional image may, for example, be determined using various anatomical segmentation techniques described herein, for example by segmenting a 3D anatomical image, such as a CT image, that is co-aligned with the 3D functional image to determine a segmentation mask representing a region of the CT image determined to correspond to the prostate. The segmentation mask can then be mapped to the 3D functional image to identify, as the prostate volume, a corresponding region within the 3D functional image. [0235] In certain embodiments, uptake regions that represent underlying physical lesions within the subject are localized 606 within the 3D functional image. As described herein, uptake regions may be hotspots, and may be localized – e.g., detected and/or segmented – using various techniques, such as machine learning based techniques, as described herein. In certain embodiments, localized uptake regions are limited to those - 54 - 12297548v2
Attorney Docket No.2010358-0329 determined represent underlying physical lesions and/or radiopharmaceutical uptake within the subject’s prostate and/or its vicinity. These prostate uptake regions may be identified as those having volumes that overlap, e.g., at least in part, with, and/or are entirely within, the prostate volume. [0236] In certain embodiments, for values of uptake region intensity metric(s) are determined for each localized (e.g., prostate) uptake region 608. For example, for each uptake region intensity metric, a value of a maximum, mean, median, peak, etc., intensity metric may be determined, e.g., as described herein. In certain embodiments, uptake region intensity metrics determined for each uptake region include values of lesion indices, determined, for example, using reference intensity values, such as those of a liver and/or aorta region, for example as described herein. In certain embodiments, for example where a radiopharmaceutical used to obtain the 3D functional image is or comprises a PSMA binding agent, a lesion index may be referred to as a PSMA expression score. [0237] In certain embodiments, a spatial location of each uptake region is analyzed and compared with one or more prostate zones 610, and a set of assigned prostate zones determined, to reflect a spatial location and/or distribution of intensities within the uptake region. For example, a prostate may be divided into 4 zones according to their biological function. For example, a prostate and its immediate vicinity may be subdivided into a central zone (CZ) (e.g., a zone that surrounds the ejaculatory ducts and comprises about 25% of a prostate’s total mass), a transitional zone (TZ) (e.g., a part of the prostate that surrounds the urethra), and a peripheral zone (PZ) (e.g., a zone situated toward a back of the gland, where a majority of the glandular tissue sits. In certain embodiments, other zones, such as a fibromuscular zone (FZ) (e.g., anterior zone), may be used as well. In certain embodiments, a FZ may be challenging to identify on a CT image, and not included in a model. In certain embodiments, a ureter zone (UZ) may also be included. A reference model, e.g., an atlas image, with boundaries of the particular prostate zones may be aligned to the 3D functional image, and a spatial extent of each uptake region compared with the so aligned reference model, to determine which of the various prostate zones the uptake region is located within and/or overlaps with. An uptake region may be associated with a set of assigned zones that it overlaps with, for example a single zone or multiple zones. [0238] In certain embodiments, once determined, the values of the uptake region intensity metric(s) and the prostate zone assignments may be used to determine a prostate cancer staging score 612. - 55 - 12297548v2
Attorney Docket No.2010358-0329 F. Neural Network-Based Prediction of Metastases [0239] In certain embodiments, the present disclosure provides systems and methods for predicting presence and/or risk of metastases in a subject, based on medical image data that reflects presence of localized disease. In particular, among other things, metastatic disease prediction technologies of the present disclosure leverage artificial neural networks (ANNs) to analyze image data that is associated with and reflects presence of localized disease, such as images of regions about a single primary tumor and/or one or more lesions confined to a single tissue region or organ, where cancer was first detected. Among other things, technologies described herein make use of the insight that, while such images of localized disease may not include conventional or express hallmarks of metastatic disease, such as presence of hotspots dispersed outside the primary organ and/or tumor, they nonetheless may reflect patterns, features, such as particular intensity patterns and/or hotspot features, etc. that are indicative of (e.g., correlate with) presence and/or risk of metastases. While such patterns and their relationship / implications for whether a particular patient has or will develop metastatic disease may escape conventional image analysis methods and/or review by human professionals, such as physicians, radiologists, and the like, ANN technologies of the present disclosure can be trained and used to generate predictions of whether a patient has or will develop metastases – i.e., one or more cancerous lesions outside of a primary tumor and/or site (e.g., organ or tissue region) where cancer was originally detected. [0240] Approaches for leveraging machine learning technologies to analyze nuclear medicine images of localized disease in order to predict presence and/or risk of a particular disease state, such as whether a patient has or will develop metastases are described, for example, in U.S. Patent Application No.16/734,609, filed January 6, 2020, and U.S. Patent Application No.17/762,796, filed March 23, 2022 the contents of each of which are incorporated herein in their entirety. The present disclosure extends and improves upon these techniques by incorporating the insight that performance of machine learning techniques can be improved by incorporating an additional channel of input that corresponds to a hotspot mask, identifying automatically segmented hotspot volumes. As described and demonstrated in further detail herein, this additional channel of input improves the machine learning algorithm’s ability to identify and focus its attention on important regions in images, allowing it to generate accurate predictions on limited training data. - 56 - 12297548v2
Attorney Docket No.2010358-0329 [0241] Accordingly, as shown in FIGs.7A and 7B, technologies of the present disclosure include processes, such as example process, 700, whereby one or more medical image(s) are received or otherwise obtained 702, by a processor, such as a cloud-based or local image storage and analysis system. In certain embodiments, one or more medical images are or comprise anatomical and functional images, such as co-aligned anatomical and functional image pairs or composite images, comprising an anatomical and functional image acquired at a substantially same time and/or of a substantially same portion of a subject. As described in further detail herein, anatomical images may include images such as computed tomography (CT) images, magnetic resonance images (MRIs), while functional images may include nuclear medicine images, such as positron emission tomography (PET) and single photon emission computed tomography (SPECT) images. [0242] Medical images 102 may be analyzed to identify target volume(s) 704 comprising representations of primary tumor regions that are associated with localized disease, as well as to detect suspect regions 706 – portions of images that are determined likely to represent underlying physical lesions within a patient. Such suspect regions may be determined automatically or semi-automatically, for example by a software program, computer-aided analysis technique, such as a machine learning model or other computer- implemented process, with or without interaction and/or review by an operator. [0243] As shown in FIG.7B, in certain embodiments, voxels of medical images within an extracted target volume 754 as well as an identification of detected suspect regions 756 are fed as two channels of input into a neural network 758, which generates, as output, a metastasis prediction 708, 760. A metastasis prediction may be a score or classification. For example, a metastasis score may quantify a likelihood of a patient having or at risk of developing metastases. A metastasis classification may be a binary classification, such as a 0 or 1 value, indicative of whether the patient is likely to have or develop metastatic disease or not. In certain embodiments, as shown in FIG.7C, neural network determined predictions (e.g., likelihood values) may be combined with patient attributes, such as clinicopathological measurements and/or computed features via a classifier 764 to create a fused model that leverages multiple data sources and types to predict 766 presence and/or risk of metastases (e.g., synchronous metastases) with high accuracy. [0244] In certain embodiments, metastases predictions may represent predictions of whether a subject has or likely will develop metastases. In certain embodiments, metastases predictions may reflect whether a subject has or likely will develop metastases within a - 57 - 12297548v2
Attorney Docket No.2010358-0329 particular time-period, e.g., following a date one when the one or more medical images were acquired and/or after initial diagnosis. For example, a metastasis prediction may represent a prediction of whether a subject has or will develop synchronous metastases – i.e., metastases that may already present in the subject (e.g., but not necessarily having been detected) – or metastases that will appear (e.g., and be detectable) within less than a year (e.g., less than six months). In this manner, among other things, approaches of the present disclosure can predict whether or not a given patient is at risk of harboring occult (e.g., undetectable via imaging) metastatic disease that can be manifested by metastatic progression subsequent to curative intent therapy. [0245] Among other things, metastases predictions may be displayed and/or otherwise provided for use in a decision support system 710, to, for example, assist physicians in disease staging, counseling, and treatment course determinations. [0246] As described in further detail herein, nuclear medicine images acquired using prostate specific membrane antigen (PSMA) targeting agents, such as [18F]DCFPyL (PyLTM) are of particular interest to prostate cancer staging and diagnosis. [F18]DCFPyL (PyL) is a PSMA targeted imaging agent shown to have greater accuracy, specificity, and sensitivity than conventional imaging in the detection of metastatic disease and it has been established for initial staging. While a primary use of PSMA PET/CT has been to improved staging accuracy, the present disclosure recognizes that there may be untapped data contained within these PET/CT scans that can be used for meaningful prognostic evaluation, namely, to provide added insights into disease biology, including the presence of co-existing metastatic disease. [0247] Among other things, while prostate cancers may, e.g., initially, be localized, certain localized prostate cancers pose a high risk of metastatic progression to lethal disease, while others are at lower risk of such progression, and are less aggressive. While more aggressive disease may warrant an aggressive initial treatment approach, prostate cancers that do not pose a high risk of metastatic progression may be better treated (e.g., particularly in view of potential quality of life reducing side effects from aggressive treatment) via a more targeted and/or less aggressive approach. Accordingly, accurate prognostic information at a time of diagnosis can improve the ability of physicians and their patients to select and achieve better courses of action. Currently, at the clinical stage, serum Prostate Specific Antigen (PSA), Gleason Grade, and percent positive cores are typically used to assess risk of metastatic progression, and may be combined with transcriptomic data. Typically, however, - 58 - 12297548v2
Attorney Docket No.2010358-0329 current approaches utilize imaging scans only to determine stage (e.g., metastatic or not, and number of lesions). Technologies of the present disclosure allow for expanded use of imaging data, in particular, in fulfilling a need for accurate prognostic information early on, allowing for prediction of metastatic disease risk and its use in improving patient outcomes. [0248] Moreover, in certain embodiments, metastases risk prediction technologies described herein may leverage the insights that machine learning models that are trained on certain types of, e.g., more plentiful, data, can be used to generate predictions about disease prediction that for which exact examples can be more time consuming and/or challenging to obtain, resulting in insufficient data. For example, as demonstrated herein, it is possible to train a machine learning model on images for patients with synchronous metastases – i.e., for which metastases already have been observed, or will be observed within a very short time frame, and then, once the model is a trained, a new image, of a new patient, can be received and evaluated (by the model) to generate a metastasis score/prediction. Even if this new patient presents with localized disease (e.g., no lesion spread outside a localized primary tumor region) in the near term, the generated metastases score can be used as an accurate predictor of a risk that the patient will develop metastases well into the future, for example, after curative therapy. [0249] From a practical standpoint, training a machine learning model on images of patients with synchronous metastases is advantageous since it is generally known whether a patient has synchronous metastases or not when they are imaged or shortly thereafter (e.g., since six (6) months is a short timeframe). That is, some of the images themselves might have metastases showing up in them, and for the ones that might not, it will be apparent quickly (e.g., within six months) if the patient does or doesn’t get synchronous metastases. Accordingly, medical images labeled as corresponding to patients with synchronous metastases or not are a relatively abundant dataset. On the other hand, for metachronous metastases / metastases that will develop in the future, to obtain directly corresponding data, one would need to take an image of a patient that presents with localized disease, wait until they are treated, then watch them for a relatively long period of time (e.g., years), to determine if their cancer spreads (metastasizes), and then, finally, label the images accordingly (i.e., label medical images according to whether each patient’s cancer metastasized or not, several years later). [0250] To address this challenge, among other things, as Example 3 described herein, uses a small dataset (e.g., not enough to directly train a neural network model, but enough to - 59 - 12297548v2
Attorney Docket No.2010358-0329 tests hypotheses) of medical images where patients initially presented with localized disease, and did not develop metastases until a significant time period later, e.g., after curative intent therapy. A model that was trained on a different dataset – of synchronous metastases images – may be used to analyze the early-stage images of patients that presented with localized disease and generate a metastases score that accurately classified patients that did or did not develop metachronous metastases. Accordingly, in certain embodiments, technologies described herein address challenges associated with limited data availability, allowing for machine learning models trained on certain images of synchronous metastases to then be used, at inference stages, to predict whether a subject will develop metachronous metastases. [0251] While described herein with particular emphasis on and/or relevance to prostate cancer, metastases prediction technologies of the present disclosure may be utilized for other types of cancer, such breast cancer, colorectal cancer, esophageal cancer, lung cancer, ovarian cancer, pancreatic cancer, e.g., to predict, based on images of localized disease within a target volume corresponding to a primary tumor region within the subject, will metastases. For example, for a subject with breast cancer, a primary tumor region may be or comprise one or both breasts of the subject; for a subject with colorectal cancer, a primary tumor region may be or comprises a colon of the subject; for a subject with esophageal cancer, a primary tumor region may be or comprises an esophagus of the subject; for a subject with lung cancer, a primary tumor region may be or comprises one or both lungs of the subject; for a subject with ovarian cancer, a primary tumor region may be or comprises one or both ovaries of the subject; for a subject with pancreatic cancer, a primary tumor region may be or comprises a pancreas of the subject; etc. [0252] Turning to FIG.8A, in certain embodiments, image analysis technologies of the present disclosure leverage techniques for detecting, segmenting, and quantifying hotspots to improve accuracy of machine learning models in prediction of metastatic disease risk based on images of primary tumor. [0253] For example, FIG.8A shows an example process 800 for predicting metastatic disease risk for a subject presenting (e.g., having been diagnosed with) localized prostate cancer. As shown in FIG.8A, one or more medical images of the subject are obtained 802. These may be medical images acquired and/or used to arrive at an initial detection and/or diagnosis of localized disease or may have been obtained in (e.g., additional) follow up visits. In certain embodiments, one or more medical images are obtained within a particular (e.g., short) time period following initial diagnosis and/or detection, such as within a month, three - 60 - 12297548v2
Attorney Docket No.2010358-0329 months, six months, or a year. In certain embodiments, one or more medical images are obtained prior to initial treatment. For example, as described in further detail herein, medical images may be obtained and analyzed using the metastatic disease prediction technologies of the present disclosure in order to assist with determining a course of treatment, for example whether a relatively mild, targeted treatment is appropriate or if a more aggressive course is warranted at the outset, for example if a patient is determined to be at high risk for having or developing synchronous metastases. [0254] In certain embodiments, one or more medical images are or comprise anatomical images, such as CT images or MRIs. In certain embodiments, one or more medical images are or comprise functional images, such as nuclear medicine images, including, but not limited to, PET and SPECT images. In certain embodiments, one or more medical images are or comprise one or more pairs of co-aligned anatomical and functional images. In certain embodiments, one or more medical images are or comprise one or more composite or fused anatomical and functional images, for example PET/CT and/or SPECT/CT images. F.i. Input Channels and Features [0255] Medical images may be analyzed, for example as described in Sections A-D, herein, to identify (i) a volume that corresponds to or comprises a prostate of the subject 804, which is the site of primary tumor and/or localized disease in prostate cancer, and (ii) suspect regions of images likely to represent underlying (e.g., individual) lesions 806. As shown in FIG.8B, these identified regions – the prostate volume 854 and suspect regions (e.g., a hotspot mask, 856) – may then be used as or to create two channels of input for a machine learning model 858. [0256] For example, as described herein (e.g., in Section B, above), an anatomical and nuclear medicine composite image, such as a PET/CT image, may be analyzed to automatically identify a volume of interest (VOI) that corresponds to or comprises a representation of a prostate within the anatomical image. The VOI may then be mapped to the co-aligned nuclear medicine image of the composite image and used to identify a corresponding volume within the nuclear medicine image. Voxels within this corresponding nuclear medicine image volume may then be used as a first, prostate intensity, channel of input. - 61 - 12297548v2
Attorney Docket No.2010358-0329 [0257] Suspect regions can be identified by automatically detecting hotspots within the nuclear medicine image, for example, as described in Section C, above. In certain embodiments, a 3D hotspot mask that identifies volumes of hotspots within the functional image may then be used as a second, hotspot mask channel, of input to the machine learning model. F.ii Model Outputs [0258] Turning again to FIGs 8A and 8B, identified prostate volumes and suspect regions may be used to determine a metastases prediction 808, 860. As shown in FIG.8B, in certain embodiments, a machine learning model may generate, as output, a metastases score or classification 860 based (at least in part) on its received prostate intensity and hotspot mask input channels. For example, a machine learning model may generate, as a metastases score, a likelihood value (e.g., having a value ranging from 0 to 1) that represents a likelihood that a patient has or will develop metastases, for example within a particular time window (e.g., synchronous metastases). In certain embodiments, a binary classification may be determined using a generated likelihood value, for example by comparing it to a threshold value. [0259] In certain embodiments, a multi-class classification approach is used, whereby a machine learning model generates, as output, a plurality of likelihood values, representing likelihoods of particular types and/or categories of metastases, as determined by the machine learning model. [0260] In certain embodiments, metastases predictions, such as scores or classifications, may represent predictions of presence and/or risk (e.g., of future) of metastases of particular types, classifications, or in particular locations. For example, metastatic lesions may be classified in terms of their anatomical location and/or lesion sub- type. In certain embodiments, various clinically accepted staging systems may be used to classify lesions, including metastases, such as, without limitation the tumor-node-metastasis (TNM) system, the Lugano system, and the FIGO system. [0261] Metastases prediction technologies of the present disclosure may, accordingly, generate predictions indicative of likelihoods of presence and/or risk of metastases of various types, according to one or more such staging systems. For example, the TNM system is used to stage solid tumors associated with cancers such as prostate cancer, lung cancers, colon - 62 - 12297548v2
Attorney Docket No.2010358-0329 cancers, breast cancers, and bladder cancer. As described, for example in Eiber et al., “Prostate Cancer Molecular Imaging Standardized Evaluation (PROMISE): Proposed miTNM Classification for the Interpretation of PSMA-Ligand PET/CT,” J. Nucl. Med.2018; 59:469-478, the TNM system uses an alphanumeric code to classify disease based on locations and/or number of lesions, with the letter “T” used to identify primary tumor (e.g., in the organ of origin, such as bladder, breast, colon, lung, prostate), “N” identifying whether tumor has spread to local lymph nodes, and “M” identifying distant metastases, beyond nearby lymph nodes and into other regions, such as distant lymph (“Ma”), bone (“Mb”), or other regions (“Mc”). In the context of prostate cancer, lesions in local – e.g., pelvic - lymph (miN) may be identified as belonging to a particular pelvic lymph node sub-region, such as one of a left/right internal iliac, a left or right external iliac, a left or right common iliac, a left or right obturator, a presacral region, or other pelvic region. In certain embodiments, distant lymph node metastases (miMa) may be classified as retroperitoneal (RP), supradiaphragmatic (SD), or other extrapelvic (OE). [0262] In certain embodiments, for example in the context of ovarian, cervical, endometrial, and other cancers involving and/or affecting female reproductive systems, metastases may be classified according to the FIGO system (e.g., stages 0, I, indicating local tumor, stage II indicating invasion of surrounding organs or tissue, stage III indicating spread to distant nodes or other tissue within the pelvis and stage IV indicating distant metastases). For example, metastases prediction technologies described herein may generate predictions or presence and/or risk of disease associated with one or more FIGO system classifications, such as stage II disease, stage III disease, stage IV disease. F.iii Model Architectures [0263] A variety of machine learning architectures may be used in connection with the approaches described herein. In certain embodiments, machine learning models used for generating metastases predictions are neural networks (e.g., ANNs). In certain embodiments, in particular, CNNs are used. - 63 - 12297548v2
Attorney Docket No.2010358-0329 F.iv Fused Models [0264] Turning to FIG.8C, as described herein, in certain embodiments, spatial image analysis approaches using a CNN model may be combined with other patient attributes such as measured and computed clinicopathologic features to create a fused model. For example, in certain embodiments, CNN model output 860 may be used as input, together with patient attributes 862, to a classifier 864 to determine a metastases score/classification 866. [0265] Certain patient attributes, described in further detail herein (e.g., in the Examples) that may be used include, without limitation, one or more of the following: PSA, pathologic grade, percent positive cores, cores positive, Primary Score, miTNM, PSMA expression score, uptake SUV peak value, uptake prostate zone, uptake type (focal vs. diffuse), uptake extends outside prostate, aorta SUV mean, liver SUV mean, overall upstaging risk, N upstaging, M upstaging. [0266] Various classifier models may be used, including, without limitation, logistic regression models, support vector machines, decision trees (e.g., random forests, XGboost), Naïve Bayes classifiers, and the like. F.v Prognosis at Subsequent Time Points and Following Therapy [0267] In certain embodiments, metastasis prediction technologies of the present disclosure may be used to predict whether a patient has or will develop metastases. For example, in certain embodiments, a patient may initially present with localized disease, and medical images may be indicative of a finding of localized disease. [0268] For example, in certain embodiments, a medical image is indicative of localized disease if lesions appearing in the medical image are limited to (e.g., locations within) a primary tumor region. For example, a patient may initially be diagnosed with prostate cancer and medical images, such as CT, PET, PET/CT, etc. images, show representations of lesions, such as hotspots within a PET image, in a primary tumor volume – e.g., a prostate region [e.g., and/or, optionally, a volume enclosing a prostate and tissue within a vicinity of the prostate (e.g., within 1 mm, 5 mm, 10 mm, 1 cm, 2 cm, 5 cm, etc.)], but not conclusive evidence of lesions outside the primary tumor volume. For example, a PET image may not show any hotspots outside of a primary tumor region. In certain - 64 - 12297548v2
Attorney Docket No.2010358-0329 embodiments, a medical image may contain image features outside a primary tumor region, but these features may not meet criteria for concluding that they represent metastases outside a primary tumor region. For example, hotspots may appear in a PET image outside a primary tumor volume but may not be of sufficient size and/or intensity to be characterized conclusively as metastatic lesions. In certain embodiments, other criteria may be used. For example, in certain embodiments, hotspots outside of a primary tumor region may be evaluated by a machine learning model and assigned a likelihood score representing a likelihood (e.g., as determined by the machine learning model) that they are a metastatic lesion. [0269] In certain embodiments, a medical image may be indicative of localized disease based on an evaluation of a medical professional, such as a physician, radiologist, etc. Such medical images may be included in and/or associated with a signed report by a particular medical professional that comprises a conclusion of localized disease. [0270] In certain embodiments, systems and methods of the present disclosure may receive, as input, medical images indicative of localized disease and determine a metastases score as described herein. A metastases score may be indicative of presence of metastases, which may be indicative of presence of, for example, occult metastases or synchronous metastases that were not present in the medical image or missed by a diagnosing practitioner. A metastases score may be indicative that a patient will develop metachronous metastases, e.g., following treatment. [0271] In certain embodiments, machine learning models may be trained to evaluate presence of synchronous metastases and then used to generate, at inference, predictions of whether patients presenting with localized disease will develop metastases, for example, at future times such as following treatment. For example, as demonstrated in Example 3, this approach provides accurate predictions. Without wishing to be bound to any particular theory this approach is believed to be justified by the premise that most early metastatic progression events occur consequent to growth of co-existing occult metastases at the time of curative intent therapy. Among other things, this approach allows for training strategies to benefit from potentially larger amounts of data, since it makes use of images obtained at a single time point. Otherwise, training examples corresponding exactly to the desired scenario – patients presenting initially with localized disease and then developing or not developing metastases later on, following treatment, would require imaging patients at an initial visit and then waiting, potentially several years, for them to undergo therapy and subsequent follow up - 65 - 12297548v2
Attorney Docket No.2010358-0329 imaging and diagnosis in order to label images from the initial visit as positive (e.g., the patient developed metastases later on) or negative (e.g., the patient did not develop metastases later on) examples. [0272] Accordingly, in certain embodiments, a machine learning model may be trained using a dataset comprising a plurality of example images, including images of purely localized disease (localized disease example) and images showing synchronous metastases (synchronous metastases examples). While the full training example images may show synchronous metastases or not (allowing them to be immediately labeled as positive or negative examples), the machine learning model may be trained on input corresponding a primary tumor region only, thereby causing the model to learn to classify patients as positive or negative for synchronous metastases based on image data within the primary tumor region alone. Following training, the (e.g., trained machine learning) model may be provided images of patients obtained at, for example, an initial (e.g., pre-treatment) visit. For images that are indicative of localized disease, as determined via another computational approach and/or by evaluation by a medical professional, the machine learning model may generate a metastases score, as it did during training. Although during training, parameters of the machine learning model may have been refined to allow for accurate prediction of synchronous metastases, values generated during inference may be used as a risk/likelihood that a patient initially presenting only with localized disease will, at a later date, present metastases (e.g., metachronous metastases). G. Guidance for Patient Diagnosis and Treatment [0273] Turning again to FIG.8A, metastases predictions of the present disclosure may, for example, be used to provide guidance for patient diagnosis and treatment decisions, for example being displayed and/or provided as part of a decision support system 810. [0274] The approaches described herein may be used, for example, in an initial visit, prior to therapy. Therapy and/or treatment approaches may be determined based on predictions, for example more aggressive therapy. For example, a patient may present with localized disease based on evaluation of medical images obtained at an initial staging or pre- treatment visit. These initial medical images may be analyzed by approaches described herein to produce metastases scores reflecting a risk/likelihood that the patient is prone to or will eventually develop metastases, e.g., at a later time. If metastases score is high, e.g., - 66 - 12297548v2
Attorney Docket No.2010358-0329 reflecting a high likelihood of metastases, for example, a more aggressive treatment approach may be determined to be prudent and selected, e.g., to compensate for/overcome this risk. H. Computer System and Network Architecture [0275] Certain embodiments described herein make use of computer algorithms in the form of software instructions executed by a computer processor. In certain embodiments, the software instructions include a machine learning module, also referred to herein as artificial intelligence software. As used herein, a machine learning module refers to a computer implemented process (e.g., a software function) that implements one or more specific machine learning techniques, e.g., artificial neural networks (ANNs), e.g., convolutional neural networks (CNNs), e.g., recursive neural networks, e.g., recurrent neural networks such as long short-term memory (LSTM) or Bilateral long short-term memory (Bi-LSTM), random forest, decision trees, support vector machines, and the like, in order to determine, for a given input, one or more output values. [0276] In certain embodiments, machine learning modules implementing machine learning techniques are trained, for example using datasets that include categories of data described herein (e.g., CT images, MRI images, PET images, SPECT images). Such training may be used to determine various parameters of machine learning algorithms implemented by a machine learning module, such as weights associated with layers in neural networks. In certain embodiments, once a machine learning module is trained, e.g., to accomplish a specific task such as segmenting anatomical regions, segmenting and/or classifying hotspots, or determining values for prognostic, treatment response, and/or predictive metrics, values of determined parameters are fixed and the (e.g., unchanging, static) machine learning module is used to process new data (e.g., different from the training data) and accomplish its trained task without further updates to its parameters (e.g., the machine learning module does not receive feedback and/or updates). In certain embodiments, machine learning modules may receive feedback, e.g., based on user review of accuracy, and such feedback may be used as additional training data, to dynamically update the machine learning module. In certain embodiments, two or more machine learning modules may be combined and implemented as a single module and/or a single software application. In certain embodiments, two or more machine learning modules may also be implemented separately, e.g., as separate software applications. A machine learning module may be software and/or hardware. For example, a - 67 - 12297548v2
Attorney Docket No.2010358-0329 machine learning module may be implemented entirely as software, or certain functions of an ANN module may be carried out via specialized hardware (e.g., via an application specific integrated circuit (ASIC)). [0277] Turning to FIG.9, an implementation of a network environment 900 for use in providing systems, methods, and architectures as described herein is shown and described. In brief overview, referring now to FIG.9, a block diagram of an exemplary cloud computing environment 900 is shown and described. The cloud computing environment 900 may include one or more resource providers 902a, 902b, 902c (collectively, 902). Each resource provider 902 may include computing resources. In some implementations, computing resources may include any hardware and/or software used to process data. For example, computing resources may include hardware and/or software capable of executing algorithms, computer programs, and/or computer applications. In some implementations, exemplary computing resources may include application servers and/or databases with storage and retrieval capabilities. Each resource provider 902 may be connected to any other resource provider 902 in the cloud computing environment 900. In some implementations, the resource providers 902 may be connected over a computer network 908. Each resource provider 902 may be connected to one or more computing device 904a, 904b, 904c (collectively, 904), over the computer network 908. [0278] The cloud computing environment 900 may include a resource manager 906. The resource manager 906 may be connected to the resource providers 902 and the computing devices 904 over the computer network 908. In some implementations, the resource manager 906 may facilitate the provision of computing resources by one or more resource providers 902 to one or more computing devices 904. The resource manager 906 may receive a request for a computing resource from a particular computing device 904. The resource manager 906 may identify one or more resource providers 902 capable of providing the computing resource requested by the computing device 904. The resource manager 906 may select a resource provider 902 to provide the computing resource. The resource manager 906 may facilitate a connection between the resource provider 902 and a particular computing device 904. In some implementations, the resource manager 906 may establish a connection between a particular resource provider 902 and a particular computing device 904. In some implementations, the resource manager 906 may redirect a particular computing device 904 to a particular resource provider 902 with the requested computing resource. - 68 - 12297548v2
Attorney Docket No.2010358-0329 [0279] FIG.10 shows an example of a computing device 1000 and a mobile computing device 1050 that can be used to implement the techniques described in this disclosure. The computing device 1000 is intended to represent various forms of digital computers, such as laptops, desktops, workstations, personal digital assistants, servers, blade servers, mainframes, and other appropriate computers. The mobile computing device 1050 is intended to represent various forms of mobile devices, such as personal digital assistants, cellular telephones, smart-phones, and other similar computing devices. The components shown here, their connections and relationships, and their functions, are meant to be examples only, and are not meant to be limiting. [0280] The computing device 1000 includes a processor 1002, a memory 1004, a storage device 1006, a high-speed interface 1008 connecting to the memory 1004 and multiple high-speed expansion ports 1010, and a low-speed interface 1012 connecting to a low-speed expansion port 1014 and the storage device 1006. Each of the processor 1002, the memory 1004, the storage device 1006, the high-speed interface 1008, the high-speed expansion ports 1010, and the low-speed interface 1012, are interconnected using various busses, and may be mounted on a common motherboard or in other manners as appropriate. The processor 1002 can process instructions for execution within the computing device 1000, including instructions stored in the memory 1004 or on the storage device 1006 to display graphical information for a GUI on an external input/output device, such as a display 1016 coupled to the high-speed interface 1008. In other implementations, multiple processors and/or multiple buses may be used, as appropriate, along with multiple memories and types of memory. Also, multiple computing devices may be connected, with each device providing portions of the necessary operations (e.g., as a server bank, a group of blade servers, or a multi-processor system). Thus, as the term is used herein, where a plurality of functions are described as being performed by “a processor”, this encompasses embodiments wherein the plurality of functions are performed by any number of processors (one or more) of any number of computing devices (one or more). Furthermore, where a function is described as being performed by “a processor”, this encompasses embodiments wherein the function is performed by any number of processors (one or more) of any number of computing devices (one or more) (e.g., in a distributed computing system). [0281] The memory 1004 stores information within the computing device 1000. In some implementations, the memory 1004 is a volatile memory unit or units. In some implementations, the memory 1004 is a non-volatile memory unit or units. The memory - 69 - 12297548v2
Attorney Docket No.2010358-0329 1004 may also be another form of computer-readable medium, such as a magnetic or optical disk. [0282] The storage device 1006 is capable of providing mass storage for the computing device 1000. In some implementations, the storage device 1006 may be or contain a computer-readable medium, such as a floppy disk device, a hard disk device, an optical disk device, or a tape device, a flash memory or other similar solid state memory device, or an array of devices, including devices in a storage area network or other configurations. Instructions can be stored in an information carrier. The instructions, when executed by one or more processing devices (for example, processor 1002), perform one or more methods, such as those described above. The instructions can also be stored by one or more storage devices such as computer- or machine-readable mediums (for example, the memory 1004, the storage device 1006, or memory on the processor 1002). [0283] The high-speed interface 1008 manages bandwidth-intensive operations for the computing device 1000, while the low-speed interface 1012 manages lower bandwidth- intensive operations. Such allocation of functions is an example only. In some implementations, the high-speed interface 1008 is coupled to the memory 1004, the display 1016 (e.g., through a graphics processor or accelerator), and to the high-speed expansion ports 1010, which may accept various expansion cards (not shown). In the implementation, the low-speed interface 1012 is coupled to the storage device 1006 and the low-speed expansion port 1014. The low-speed expansion port 1014, which may include various communication ports (e.g., USB, Bluetooth®, Ethernet, wireless Ethernet) may be coupled to one or more input/output devices, such as a keyboard, a pointing device, a scanner, or a networking device such as a switch or router, e.g., through a network adapter. [0284] The computing device 1000 may be implemented in a number of different forms, as shown in the figure. For example, it may be implemented as a standard server 1020, or multiple times in a group of such servers. In addition, it may be implemented in a personal computer such as a laptop computer 1022. It may also be implemented as part of a rack server system 1024. Alternatively, components from the computing device 1000 may be combined with other components in a mobile device (not shown), such as a mobile computing device 1050. Each of such devices may contain one or more of the computing device 1000 and the mobile computing device 1050, and an entire system may be made up of multiple computing devices communicating with each other. - 70 - 12297548v2
Attorney Docket No.2010358-0329 [0285] The mobile computing device 1050 includes a processor 1052, a memory 1064, an input/output device such as a display 1054, a communication interface 1066, and a transceiver 1068, among other components. The mobile computing device 1050 may also be provided with a storage device, such as a micro-drive or other device, to provide additional storage. Each of the processor 1052, the memory 1064, the display 1054, the communication interface 1066, and the transceiver 1068, are interconnected using various buses, and several of the components may be mounted on a common motherboard or in other manners as appropriate. [0286] The processor 1052 can execute instructions within the mobile computing device 1050, including instructions stored in the memory 1064. The processor 1052 may be implemented as a chipset of chips that include separate and multiple analog and digital processors. The processor 1052 may provide, for example, for coordination of the other components of the mobile computing device 1050, such as control of user interfaces, applications run by the mobile computing device 1050, and wireless communication by the mobile computing device 1050. [0287] The processor 1052 may communicate with a user through a control interface 1058 and a display interface 1056 coupled to the display 1054. The display 1054 may be, for example, a TFT (Thin-Film-Transistor Liquid Crystal Display) display or an OLED (Organic Light Emitting Diode) display, or other appropriate display technology. The display interface 1056 may comprise appropriate circuitry for driving the display 1054 to present graphical and other information to a user. The control interface 1058 may receive commands from a user and convert them for submission to the processor 1052. In addition, an external interface 1062 may provide communication with the processor 1052, so as to enable near area communication of the mobile computing device 1050 with other devices. The external interface 1062 may provide, for example, for wired communication in some implementations, or for wireless communication in other implementations, and multiple interfaces may also be used. [0288] The memory 1064 stores information within the mobile computing device 1050. The memory 1064 can be implemented as one or more of a computer-readable medium or media, a volatile memory unit or units, or a non-volatile memory unit or units. An expansion memory 1074 may also be provided and connected to the mobile computing device 1050 through an expansion interface 1072, which may include, for example, a SIMM (Single In Line Memory Module) card interface. The expansion memory 1074 may provide - 71 - 12297548v2
Attorney Docket No.2010358-0329 extra storage space for the mobile computing device 1050, or may also store applications or other information for the mobile computing device 1050. Specifically, the expansion memory 1074 may include instructions to carry out or supplement the processes described above, and may include secure information also. Thus, for example, the expansion memory 1074 may be provide as a security module for the mobile computing device 1050, and may be programmed with instructions that permit secure use of the mobile computing device 1050. In addition, secure applications may be provided via the SIMM cards, along with additional information, such as placing identifying information on the SIMM card in a non-hackable manner. [0289] The memory may include, for example, flash memory and/or NVRAM memory (non-volatile random access memory), as discussed below. In some implementations, instructions are stored in an information carrier. The instructions, when executed by one or more processing devices (for example, processor 1052), perform one or more methods, such as those described above. The instructions can also be stored by one or more storage devices, such as one or more computer- or machine-readable mediums (for example, the memory 1064, the expansion memory 1074, or memory on the processor 1052). In some implementations, the instructions can be received in a propagated signal, for example, over the transceiver 1068 or the external interface 1062. [0290] The mobile computing device 1050 may communicate wirelessly through the communication interface 1066, which may include digital signal processing circuitry where necessary. The communication interface 1066 may provide for communications under various modes or protocols, such as GSM voice calls (Global System for Mobile communications), SMS (Short Message Service), EMS (Enhanced Messaging Service), or MMS messaging (Multimedia Messaging Service), CDMA (code division multiple access), TDMA (time division multiple access), PDC (Personal Digital Cellular), WCDMA (Wideband Code Division Multiple Access), CDMA2000, or GPRS (General Packet Radio Service), among others. Such communication may occur, for example, through the transceiver 1068 using a radio-frequency. In addition, short-range communication may occur, such as using a Bluetooth®, Wi-Fi™, or other such transceiver (not shown). In addition, a GPS (Global Positioning System) receiver module 1070 may provide additional navigation- and location-related wireless data to the mobile computing device 1050, which may be used as appropriate by applications running on the mobile computing device 1050. - 72 - 12297548v2
Attorney Docket No.2010358-0329 [0291] The mobile computing device 1050 may also communicate audibly using an audio codec 1060, which may receive spoken information from a user and convert it to usable digital information. The audio codec 1060 may likewise generate audible sound for a user, such as through a speaker, e.g., in a handset of the mobile computing device 1050. Such sound may include sound from voice telephone calls, may include recorded sound (e.g., voice messages, music files, etc.) and may also include sound generated by applications operating on the mobile computing device 1050. [0292] The mobile computing device 1050 may be implemented in a number of different forms, as shown in the figure. For example, it may be implemented as a cellular telephone 1080. It may also be implemented as part of a smart-phone 1082, personal digital assistant, or other similar mobile device. [0293] Various implementations of the systems and techniques described here can be realized in digital electronic circuitry, integrated circuitry, specially designed ASICs (application specific integrated circuits), computer hardware, firmware, software, and/or combinations thereof. These various implementations can include implementation in one or more computer programs that are executable and/or interpretable on a programmable system including at least one programmable processor, which may be special or general purpose, coupled to receive data and instructions from, and to transmit data and instructions to, a storage system, at least one input device, and at least one output device. [0294] Actions associated with implementing the systems may be performed by one or more programmable processors executing one or more computer programs. All or part of the systems may be implemented as special purpose logic circuitry, for example, a field programmable gate array (FPGA) or an application-specific integrated circuit (ASIC), or both. All or part of the systems may also be implemented as special purpose logic circuitry, for example, a specially designed (or configured) central processing unit (CPU), conventional central processing units (CPU) a graphics processing unit (GPU), and/or a tensor processing unit (TPU). [0295] These computer programs (also known as programs, software, software applications or code) include machine instructions for a programmable processor, and can be implemented in a high-level procedural and/or object-oriented programming language, and/or in assembly/machine language. As used herein, the terms machine-readable medium and computer-readable medium refer to any computer program product, apparatus and/or device - 73 - 12297548v2
Attorney Docket No.2010358-0329 (e.g., magnetic discs, optical disks, memory, Programmable Logic Devices (PLDs)) used to provide machine instructions and/or data to a programmable processor, including a machine- readable medium that receives machine instructions as a machine-readable signal. The term machine-readable signal refers to any signal used to provide machine instructions and/or data to a programmable processor. [0296] To provide for interaction with a user, the systems and techniques described here can be implemented on a computer having a display device (e.g., a CRT (cathode ray tube) or LCD (liquid crystal display) monitor) for displaying information to the user and a keyboard and a pointing device (e.g., a mouse or a trackball) by which the user can provide input to the computer. Other kinds of devices can be used to provide for interaction with a user as well; for example, feedback provided to the user can be any form of sensory feedback (e.g., visual feedback, auditory feedback, or tactile feedback); and input from the user can be received in any form, including acoustic, speech, or tactile input. [0297] The systems and techniques described here can be implemented in a computing system that includes a back end component (e.g., as a data server), or that includes a middleware component (e.g., an application server), or that includes a front end component (e.g., a client computer having a graphical user interface or a Web browser through which a user can interact with an implementation of the systems and techniques described here), or any combination of such back end, middleware, or front end components. The components of the system can be interconnected by any form or medium of digital data communication (e.g., a communication network). Examples of communication networks include a local area network (LAN), a wide area network (WAN), and the Internet. [0298] The computing system can include clients and servers. A client and server are generally remote from each other and typically interact through a communication network. The relationship of client and server arises by virtue of computer programs running on the respective computers and having a client-server relationship to each other. [0299] In some implementations, modules described herein can be separated, combined or incorporated into single or combined modules. The modules depicted in the figures are not intended to limit the systems described herein to the software architectures shown therein. [0300] Elements of different implementations described herein may be combined to form other implementations not specifically set forth above. Elements may be left out of the - 74 - 12297548v2
Attorney Docket No.2010358-0329 processes, computer programs, databases, etc. described herein without adversely affecting their operation. In addition, the logic flows depicted in the figures do not require the particular order shown, or sequential order, to achieve desirable results. Various separate elements may be combined into one or more individual elements to perform the functions described herein. [0301] Throughout the description, where apparatus and systems are described as having, including, or comprising specific components, or where processes and methods are described as having, including, or comprising specific steps, it is contemplated that, additionally, there are apparatus, and systems of the present invention that consist essentially of, or consist of, the recited components, and that there are processes and methods according to the present invention that consist essentially of, or consist of, the recited processing steps. [0302] It should be understood that the order of steps or order for performing certain action is immaterial so long as the invention remains operable. Moreover, two or more steps or actions may be conducted simultaneously. [0303] While the invention has been particularly shown and described with reference to specific preferred embodiments, it should be understood by those skilled in the art that various changes in form and detail may be made therein without departing from the spirit and scope of the invention as defined by the appended claims. I. Imaging Agents [0304] As described herein, a variety of radionuclide labelled PSMA binding agents may be used as radiopharmaceutical imaging agents for nuclear medicine imaging to detect and evaluate prostate cancer. In certain embodiments, certain radionuclide labelled PSMA binding agents are appropriate for PET imaging, while others are suited for SPECT imaging. I.i. PET imaging radionuclide labelled PSMA binding agents [0305] In certain embodiments, a radionuclide labelled PSMA binding agent is a radionuclide labelled PSMA binding agent appropriate for PET imaging. [0306] In certain embodiments, a radionuclide labelled PSMA binding agent comprises [18F]DCFPyL (also referred to as PyLTM; also referred to as DCFPyL-18F): - 75 - 12297548v2
Attorney Docket No.2010358-0329
 [18F]DCFPyL, or a pharmaceutically acceptable salt thereof. [0307] In certain embodiments, a radionuclide labelled PSMA binding agent comprises [18F]DCFBC:
 [18F]DCFBC, or a pharmaceutically acceptable salt thereof. [0308] In certain embodiments, a radionuclide labelled PSMA binding agent comprises 68Ga-PSMA-HBED-CC (also referred to as 68Ga-PSMA-11):
 68Ga-PSMA-HBED-CC, or a pharmaceutically acceptable salt thereof. [0309] In certain embodiments, a radionuclide labelled PSMA binding agent comprises PSMA-617: - 76 - 12297548v2
Attorney Docket No.2010358-0329
68Ga-PSMA-HBED-CC, or a pharmaceutically acceptable salt thereof. [0309] In certain embodiments, a radionuclide labelled PSMA binding agent comprises PSMA-617: - 76 - 12297548v2
Attorney Docket No.2010358-0329
 PSMA-617, or a pharmaceutically acceptable salt thereof. In certain embodiments, the radionuclide labelled PSMA binding agent comprises 68Ga-PSMA-617, which is PSMA-617 labelled with 68Ga, or a pharmaceutically acceptable salt thereof. In certain embodiments, a radionuclide labelled PSMA binding agent comprises 177Lu-PSMA-617, which is PSMA-617 labelled with 177Lu, or a pharmaceutically acceptable salt thereof. [0310] In certain embodiments, a radionuclide labelled PSMA binding agent comprises PSMA-I&T:
 PSMA-I&T, or a pharmaceutically acceptable salt thereof. In certain embodiments, a radionuclide labelled PSMA binding agent comprises 68Ga-PSMA-I&T, which is PSMA-I&T labelled with 68Ga, or a pharmaceutically acceptable salt thereof. - 77 - 12297548v2
Attorney Docket No.2010358-0329 [0311] In certain embodiments, a radionuclide labelled PSMA binding agent comprises PSMA-1007:
PSMA-I&T, or a pharmaceutically acceptable salt thereof. In certain embodiments, a radionuclide labelled PSMA binding agent comprises 68Ga-PSMA-I&T, which is PSMA-I&T labelled with 68Ga, or a pharmaceutically acceptable salt thereof. - 77 - 12297548v2
Attorney Docket No.2010358-0329 [0311] In certain embodiments, a radionuclide labelled PSMA binding agent comprises PSMA-1007:
 PSMA-1007, or a pharmaceutically acceptable salt thereof. In certain embodiments, a radionuclide labelled PSMA binding agent comprises 18F-PSMA-1007, which is PSMA-1007 labelled with 18F, or a pharmaceutically acceptable salt thereof. [0312] In certain embodiments, a radionuclide labeled PSMA binding agent comprises 18F-JK-PSMA-7:
 18F-JK-PSMA-7, or a pharmaceutically acceptable salt thereof. [0313] In certain embodiments, a radionuclide labeled PSMA binding agent comprises (18F) rhPSMA-7.3 (e.g., POSLUMA®, also described at https://www.posluma.com/prescribing-information.pdf): - 78 - 12297548v2
Attorney Docket No.2010358-0329
18F-JK-PSMA-7, or a pharmaceutically acceptable salt thereof. [0313] In certain embodiments, a radionuclide labeled PSMA binding agent comprises (18F) rhPSMA-7.3 (e.g., POSLUMA®, also described at https://www.posluma.com/prescribing-information.pdf): - 78 - 12297548v2
Attorney Docket No.2010358-0329
 (18F) rhPSMA-7.3, or a pharmaceutically acceptable salt thereof. I.ii. SPECT imaging radionuclide labelled PSMA binding agents [0314] In certain embodiments, a radionuclide labelled PSMA binding agent is a radionuclide labelled PSMA binding agent appropriate for SPECT imaging. [0315] In certain embodiments, a radionuclide labelled PSMA binding agent comprises 1404 (also referred to as MIP-1404):
 1404, - 79 - 12297548v2
Attorney Docket No.2010358-0329 or a pharmaceutically acceptable salt thereof. [0316] In certain embodiments, a radionuclide labelled PSMA binding agent comprises 1405 (also referred to as MIP-1405):
1404, - 79 - 12297548v2
Attorney Docket No.2010358-0329 or a pharmaceutically acceptable salt thereof. [0316] In certain embodiments, a radionuclide labelled PSMA binding agent comprises 1405 (also referred to as MIP-1405):
 1405, or a pharmaceutically acceptable salt thereof. [0317] In certain embodiments, a radionuclide labelled PSMA binding agent comprises 1427 (also referred to as MIP-1427):
 1427, or a pharmaceutically acceptable salt thereof. [0318] In certain embodiments, a radionuclide labelled PSMA binding agent comprises 1428 (also referred to as MIP-1428): - 80 - 12297548v2
Attorney Docket No.2010358-0329
1427, or a pharmaceutically acceptable salt thereof. [0318] In certain embodiments, a radionuclide labelled PSMA binding agent comprises 1428 (also referred to as MIP-1428): - 80 - 12297548v2
Attorney Docket No.2010358-0329
 99mTc-MIP-1404, or a pharmaceutically acceptable salt thereof. In certain embodiments, 1404 may be chelated to other metal radioisotopes [e.g., a radioisotope of rhenium (Re) (e.g., rhenium-188 (188Re); e.g., rhenium-186 (186Re)); e.g., a radioisotope of yttrium (Y) (e.g., 90Y); e.g., a radioisotope of lutetium (Lu)(e.g., 177Lu); e.g., a radioisotope of gallium (Ga) (e.g., 68Ga; e.g., 67Ga); e.g., a radioisotope of indium (e.g., 111In); e.g., a radioisotope of copper (Cu) (e.g., 67Cu)] to form a compound having a structure similar to the structure shown above for 99mTc-MIP-1404, with the other metal radioisotope substituted for 99mTc. [0321] In certain embodiments, 1405 is labelled with a radionuclide (e.g., chelated to a radioisotope of a metal). In certain embodiments, a radionuclide labelled PSMA binding agent comprises 99mTc-MIP-1405, which is 1405 labelled with (e.g., chelated to) 99mTc:
 - 82 - 12297548v2
Attorney Docket No.2010358-0329 or a pharmaceutically acceptable salt thereof. In certain embodiments, 1405 may be chelated to other metal radioisotopes [e.g., a radioisotope of rhenium (Re) (e.g., rhenium-188 (188Re); e.g., rhenium-186 (186Re)); e.g., a radioisotope of yttrium (Y) (e.g., 90Y); e.g., a radioisotope of lutetium (Lu)(e.g., 177Lu); e.g., a radioisotope of gallium (Ga) (e.g., 68Ga; e.g., 67Ga); e.g., a radioisotope of indium (e.g., 111In); e.g., a radioisotope of copper (Cu) (e.g., 67Cu)] to form a compound having a structure similar to the structure shown above for 99mTc-MIP-1405, with the other metal radioisotope substituted for 99mTc. [0322] In certain embodiments, 1427 is labelled with (e.g., chelated to) a radioisotope of a metal, to form a compound according to the formula below:
- 82 - 12297548v2
Attorney Docket No.2010358-0329 or a pharmaceutically acceptable salt thereof. In certain embodiments, 1405 may be chelated to other metal radioisotopes [e.g., a radioisotope of rhenium (Re) (e.g., rhenium-188 (188Re); e.g., rhenium-186 (186Re)); e.g., a radioisotope of yttrium (Y) (e.g., 90Y); e.g., a radioisotope of lutetium (Lu)(e.g., 177Lu); e.g., a radioisotope of gallium (Ga) (e.g., 68Ga; e.g., 67Ga); e.g., a radioisotope of indium (e.g., 111In); e.g., a radioisotope of copper (Cu) (e.g., 67Cu)] to form a compound having a structure similar to the structure shown above for 99mTc-MIP-1405, with the other metal radioisotope substituted for 99mTc. [0322] In certain embodiments, 1427 is labelled with (e.g., chelated to) a radioisotope of a metal, to form a compound according to the formula below:
 1427 chelated to a metal, or a pharmaceutically acceptable salt thereof, wherein M is a metal radioisotope [e.g., a radioisotope of technetium (Tc) (e.g., technetium-99m (99mTc)); e.g., a radioisotope of rhenium (Re) (e.g., rhenium-188 (188Re); e.g., rhenium-186 (186Re)); e.g., a radioisotope of yttrium (Y) (e.g., 90Y); e.g., a radioisotope of lutetium (Lu)(e.g., 177Lu); e.g., a radioisotope of gallium (Ga) (e.g., 68Ga; e.g., 67Ga); e.g., a radioisotope of indium (e.g., 111In); e.g., a radioisotope of copper (Cu) (e.g., 67Cu)] with which 1427 is labelled. [0323] In certain embodiments, 1428 is labelled with (e.g., chelated to) a radioisotope of a metal, to form a compound according to the formula below: - 83 - 12297548v2
Attorney Docket No.2010358-0329
1427 chelated to a metal, or a pharmaceutically acceptable salt thereof, wherein M is a metal radioisotope [e.g., a radioisotope of technetium (Tc) (e.g., technetium-99m (99mTc)); e.g., a radioisotope of rhenium (Re) (e.g., rhenium-188 (188Re); e.g., rhenium-186 (186Re)); e.g., a radioisotope of yttrium (Y) (e.g., 90Y); e.g., a radioisotope of lutetium (Lu)(e.g., 177Lu); e.g., a radioisotope of gallium (Ga) (e.g., 68Ga; e.g., 67Ga); e.g., a radioisotope of indium (e.g., 111In); e.g., a radioisotope of copper (Cu) (e.g., 67Cu)] with which 1427 is labelled. [0323] In certain embodiments, 1428 is labelled with (e.g., chelated to) a radioisotope of a metal, to form a compound according to the formula below: - 83 - 12297548v2
Attorney Docket No.2010358-0329
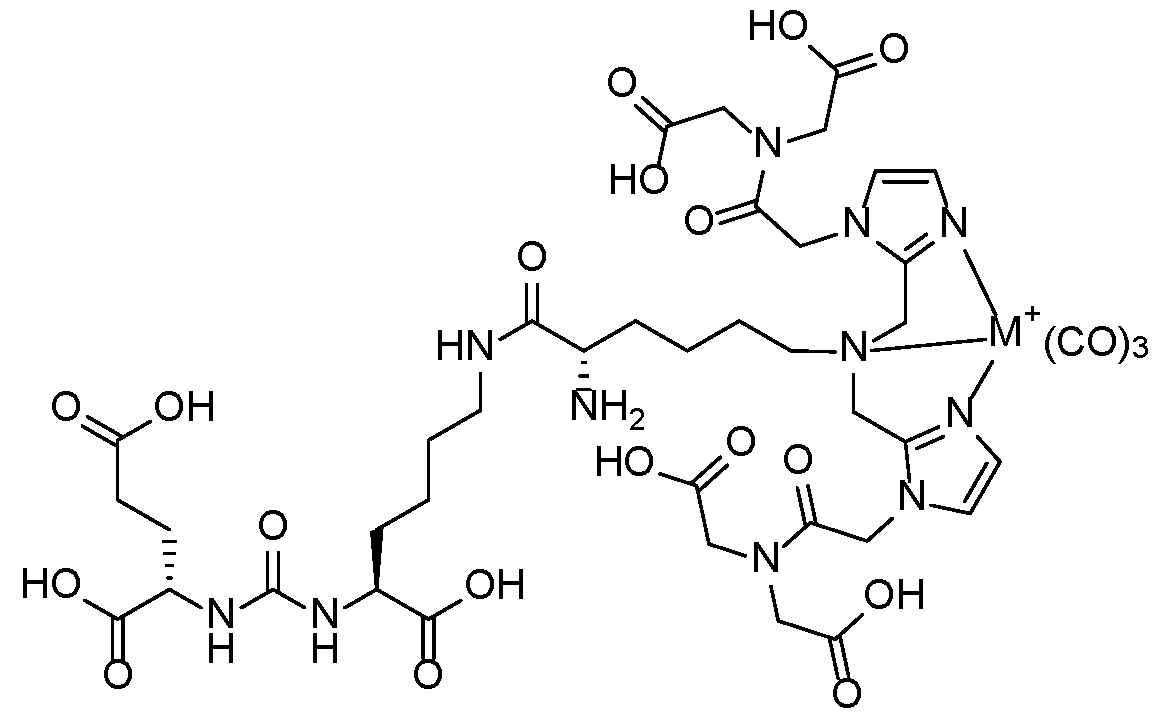 1428 chelated to a metal, or a pharmaceutically acceptable salt thereof, wherein M is a metal radioisotope [e.g., a radioisotope of technetium (Tc) (e.g., technetium-99m (99mTc)); e.g., a radioisotope of rhenium (Re) (e.g., rhenium-188 (188Re); e.g., rhenium-186 (186Re)); e.g., a radioisotope of yttrium (Y) (e.g., 90Y); e.g., a radioisotope of lutetium (Lu)(e.g., 177Lu); e.g., a radioisotope of gallium (Ga) (e.g., 68Ga; e.g., 67Ga); e.g., a radioisotope of indium (e.g., 111In); e.g., a radioisotope of copper (Cu) (e.g., 67Cu)] with which 1428 is labelled. [0324] In certain embodiments, a radionuclide labelled PSMA binding agent comprises PSMA I&S:

 - 88 - 12297548v2
Attorney Docket No.2010358-0329
- 88 - 12297548v2
Attorney Docket No.2010358-0329
 [0330] The technique requires multiple indirect pre-computed variables to correctly assign the score, among others: uptake localization within the prostate, uptake mask, uptake type classification as diffuse or focal, prostate zones (transition, peripheral, central), and PSMA expression score. Illustrative examples of the computation of those variables are presented in detail in the sections below. Table 4: Example Score Categories Used in an Automated Prostate Cancer Staging Scoring Method
 J.i. Standardized Uptake Value (SUV) [0331] In certain embodiments, the PET image is converted to SUV according to the following equation: - 89 - 12297548v2
Attorney Docket No.2010358-0329
J.i. Standardized Uptake Value (SUV) [0331] In certain embodiments, the PET image is converted to SUV according to the following equation: - 89 - 12297548v2
Attorney Docket No.2010358-0329
 where shift, slope, and intercept are parameters computed based on the subject weight, injection dose, and other PET scan-related variables. J.ii. Uptake Peak Localization and Peak SUV Value Calculation [0332] In certain embodiments, for the purpose of extracting uptake regions, the hotspot detection algorithm implemented in aPROMISE is used. Only prostate-located hotspots (hotspots that have an intersection with the prostate segmentation mask) are taken. Hotspots are filtered by their volume. Hotspots below 120 µl are discarded. [0333] The peak position is the maximum SUV value within the hotspot and prostate area: (7) ^^^^ ^^^^ ^^^^ ^^^^ ^^^^ ^^^^ ^^^^ ^^^^ ^^^^ ^^^^ ^^^^ ^^^^ = ^^^^ ^^^^ ^^^^ ^^^^ ^^^^ ^^^^(ℎ ^^^^ ^^^^ ^^^^ ^^^^ ^^^^ ^^^^ ^^^^ ^^^^ ^^^^ ^^^^ ∪ ^^^^ ^^^^ ^^^^ ^^^^ ^^^^ ^^^^ ^^^^ ^^^^ ^^^^ ^^^^ ^^^^ ^^^^) where hotspot_mask is a Boolean mask (e.g., for a single hotspot) and prostate_mask is filled with prostate SUV values. [0334] The peak value is the mean SUV value in a close location to the peak position. The cube with a 3-voxel side is centered on the peak position. The mean value of voxels belonging to the hotspot and within the cube is computed. (8) ^^^^ ^^^^ ^^^^ ^^^^ ^^^^ ^^^^ ^^^^ ^^^^ ^^^^ = ^^^^ ^^^^ ^^^^ ^^^^� ^^^^ ^^^^ ^^^^ ^^^^ ^^^^ ^^^^ ^^^^ ^^^^ ^^^^ ^^^^ ^^^^� ^^^^ ^^^^ ^^^^ ^^^^ ^^^^ ^^^^ ^^^^ ^^^^ ^^^^ ^^^^ ^^^^ ^^^^ − 1: ^^^^ ^^^^ ^^^^ ^^^^ ^^^^ ^^^^ ^^^^ ^^^^ ^^^^ ^^^^ ^^^^ ^^^^
 [0351] FIG.17A shows an example CNN architecture used for analyzing the 2- channel, 3D volume image inputs and performing a binary classification. [0352] Fifty experiments were performed, and metrics such as accuracy (Acc.), AUC, f1 score, recall, and precision calculated for each. Table 6C, below, shows values of each of these metrics computed for the worst, best, and average experiment. - 95 - 12297548v2
Attorney Docket No.2010358-0329 Table 6C. Performance over 50 experiments.
[0351] FIG.17A shows an example CNN architecture used for analyzing the 2- channel, 3D volume image inputs and performing a binary classification. [0352] Fifty experiments were performed, and metrics such as accuracy (Acc.), AUC, f1 score, recall, and precision calculated for each. Table 6C, below, shows values of each of these metrics computed for the worst, best, and average experiment. - 95 - 12297548v2
Attorney Docket No.2010358-0329 Table 6C. Performance over 50 experiments.
 Table 7C. Combined clinical variable measurement and CNN image analysis output model results.
 - 97 - 12297548v2
Attorney Docket No.2010358-0329 Table 7D. Measured and computed features model results.
- 97 - 12297548v2
Attorney Docket No.2010358-0329 Table 7D. Measured and computed features model results.
 Table 7E. Measured and computed features model results.
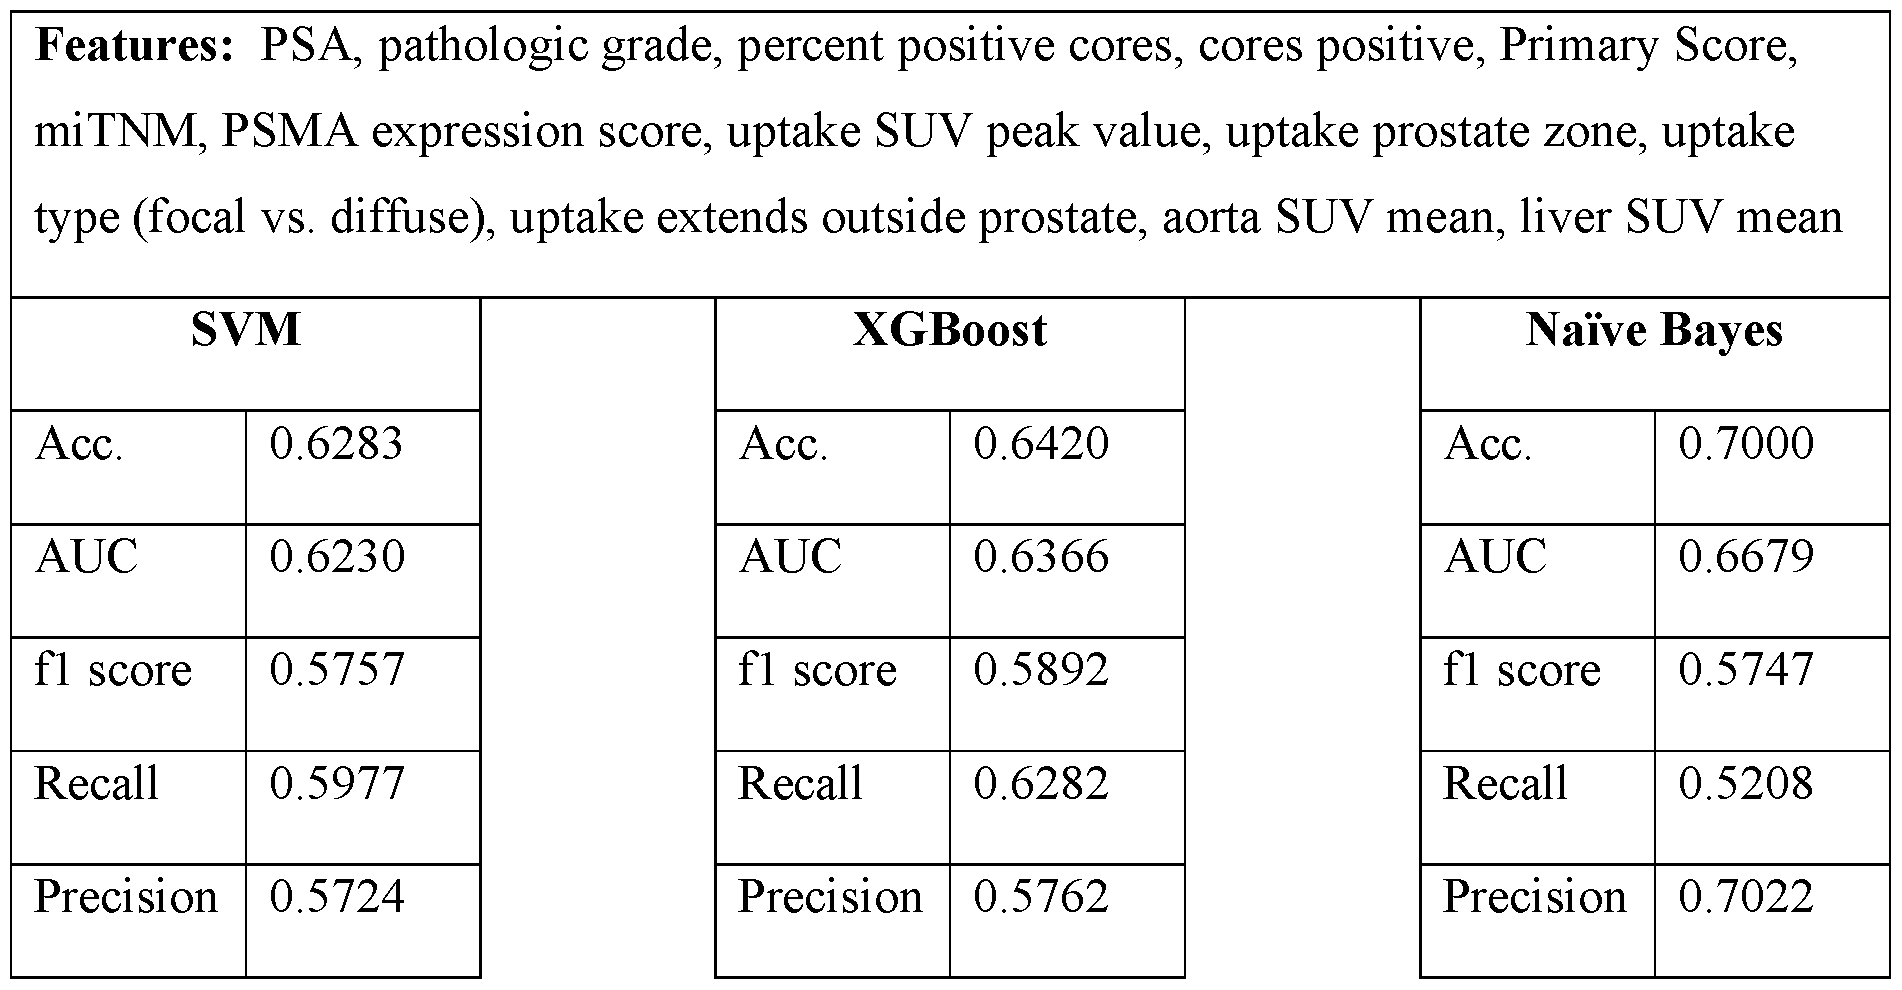 - 98 - 12297548v2
Attorney Docket No.2010358-0329 Table 7F. Combined CNN prediction and measured and computed features model results.
- 98 - 12297548v2
Attorney Docket No.2010358-0329 Table 7F. Combined CNN prediction and measured and computed features model results.
 L. Example 3: A convolutional neural network model using intraprostatic patterns of [F18]DCFPyL uptake in PSMA PET images for prediction of synchronous metastases [0356] This example provides additional results of and expands upon an imaging study that demonstrates use of a CNN model in conjunction with intraprostatic PSMA imaging, described in Example 2, above. [0357] In particular, [F18]DCFPyL (PyLTM) (also referred to as Piflufolast F-18 DCFPyL) is a PSMA targeted imaging agent that provides whole-body staging of prostate cancer. This example demonstrates how image analysis of a primary tumor using machine learning techniques (e.g., deep learning algorithms) can offer additional insight into disease biology, including the presence of co-existing metastatic disease. Approaches using convolutional neural network (CNN) models using inputs from whole prostate PyLTM PET/CT images along with automatically segmented hotspots within a prostate were used to predict presence or absence of synchronous metastases and were compared against established models built from clinicopathologic information. [0358] As described in further detail, veterans with de novo prostate cancer that had been imaged with PyL PET/CT for initial staging were included in the retrospective analysis described in this example. PyL PET/CT images of the prostate were analyzed using aPROMISE, which automatically segments, localizes, and quantifies disease on PSMA PET/CT images. Automatically segmented prostate volumes (determined via automated segmentation of CT images) were used to map PyLTM uptake within the prostate, as reflected - 99 - 12297548v2
Attorney Docket No.2010358-0329 in the PET image channel. aPROMISE was also used to automatically detect and segment 3D hotspots representing potential cancerous lesions within a subject. Both the entire prostate, as well as aPROMISE defined hotspots were used as inputs for the CNN model. As described in further detail herein (e.g., below) an attention map analysis indicates that the hotspot information facilitates the neural network in determining locations and extents of tumors within the prostate. The CNN model architecture in this example was based on SqueezeNet v2. In order to train the CNN models and evaluate their performance, the image dataset was randomly split into training, validation, and test sets. Receiver operating characteristic (ROC) curves were generated and area under the curve (AUC) metrics were computed to assess model performance in predicting presence of metastases, and test predictions were compared with ground truth (M1). Model training was repeated 50 times (50 experiments) and the best performing experiment (e.g., trained model) was identified. For purposes of comparison with previous techniques based on evaluation of clinicopathological data, prediction scores determined using the UCSF-CAPRA scoring system and UCLA PSMA risk calculator were determined and compared with CNN model performance. [0359] Of the 90 veterans evaluated in the analysis presented in this example, 47 presented localized disease and 43 had metastatic prostate cancer. The CNN model operating on image data alone achieved a median AUC of 0.72 for prediction of metastatic disease (ICR 0.64 and 0.8). Adding clinicopathologic information to imaging data via a fused model improved the AUC to a median of 0.82. For comparison, AUCs from the UCSF-CAPRA score and UCLA-PSMA risk calculator (any upstaging on PET), which rely on clinicopathologic information, were 0.729 and 0.754 for the dataset used in this example, respectively. [0360] Accordingly, results of this example show the ability of a CNN based model to predict presence of synchronous metastases in patients intraprostatic PyL uptake patterns alone. Predictive accuracies of the CNN model for this dataset were comparable to published prediction models based on clinicopathologic features (namely, UCSF-CAPRA scoring and UCLA-PSMA risk calculator). [0361] Predictions from CNN image analysis models were also combined with other measurable imaging parameters and clinicopathologic data to develop a fused model that discriminates between prostate cancers with or without co-existing metastases with high fidelity. - 100 - 12297548v2
Attorney Docket No.2010358-0329 Materials and Methods [0362] Dataset. Ninety (90) veterans with de novo prostate cancer were imaged with PyL PSMA PET/CT for initial staging (47 with localized disease and 43 with metastatic prostate cancer). Images of the prostate were analyzed using aPROMISE, which, among other things, segments the prostate gland and localizes and segments hotspots corresponding to regions of PET images determined to represent to potential intraprostatic lesions. The segmentation of the prostate was used to map PyL PET images of the prostate. Without wishing to be bound to any particular theory, neural networks are believed to exhibit performance improvements when provided with pragmatically extracted task-specific features, particularly when dealing with a limited number of cases. Accordingly, identifications of hotspots determined via aPROMISE were provided as input alongside PET prostate-region scans to CNN models to create a two-channel CNN model that leveraged information from prostate PET intensities and detected hotspots representing potential lesions. FIG.29 shows an example system architecture, illustrating image-based inputs (PET image intensities and hotspots) to a CNN model, as well as a fused model that integrates the CNN-based image system with clinicopathologic data. FIGs.18A-18C show example model inputs, with FIG.8A showing a cuboid region surrounding a prostate in a PET image, FIG. 18B showing the same cuboid region overlaid on a 3D hotspot mask, and FIG.18C showing an overlay of FIGs.18A and 18B. Attention map analysis, described in further detail herein, indicates that the 3D hotspot mask, when used as input to a neural network, facilitated the network in identifying locations and extents of tumors. [0363] CNN model architecture. Several different Convolutional Neural Network (CNN) architectures were evaluated. Since the limited number of training samples were believed to raise a high risk of model overfitting, only models with a relatively low number of parameters were considered in this example. In particular, modified version of the ResNet18, SqueezeNetv2, MobileNet, and ShuffleNet models were evaluated. These CNN architectures were originally designed for 2D image processing and, accordingly, were modified to make them suitable for 3D image analysis by substituting their original 2D convolutional and pooling layers with 3D convolution and pooling layers. Moreover, for the SqueezNetv2 architecture, the last network layers comprising dropout, convolution with kernel size 1, ReLU activation, and average 3D Pooling layers were substituted with adaptive max pooling 3D, dropout and fully connected layers. Models were trained using a weighted binary cross entropy loss function. The top-performing model (SqueezeNetv2) underwent - 101 - 12297548v2
Attorney Docket No.2010358-0329 further optimization through grid-search hyperparameter-tuning. Optimal values for group convolution, learning rate, regularization strength, and a set of augmentations (described in the paragraph below) were determined based on initial validation. The CNN model was trained for 300 epochs and the checkpoint for the best-performing epoch on the evaluation subset was retained and selected for testing. [0364] Augmentations. To avoid overfitting, a randomly selected set of augmentations were applied to CNN inputs each epoch. In the present example, seven of the following fifteen augmentations were sampled and applied in random order: random rotation, random flip in left-right axes, random Gaussian noise, random standard deviation intensity shift, random contrast adjustment, random Gaussian smoothing, random Gaussian sharpening, random histogram shift, random Coarse shuffle, random 3D elastic distortion, random affine transformation, random Gibbs noise, random bias field, random K-space spike noise, and random Rician noise. [0365] Multimodal model. To further improve metastases prediction performance, the top-performing CNN model (SqueezeNetv2), which utilized both the prostate intensities and hotspot identification input channels, was integrated into a fused model that also utilized various patient attributes, such as features derived from images and clinicopathologic data. These patient attributes included a measured PSA value, Pathologic Grade Group, Percent Positive Cores, a peak SUV prostate-located value, PRIMARY score, and PSMA Expression score (generated by PROMISEV2). A Naïve Bayes classifier was integrated to leverage the output from the CNN model in conjunction with other variable and categorical features to formulate the conclusive prediction of synchronous metastases. These categorical and variable features were integrated with the CNN model using fused model approaches, including a logistic regression, XGboost, and Naïve Bayes, resulting in a fused model. [0366] Metrics. The dataset was split into training, validation, and test sets using stratified random sampling, in ratios of 0.5, 0.2, and 0.3 accordingly. Area under the receiver operating characteristic curve (AUC) was computed to evaluate performance of various models in predicting the presence of metastases and test predictions were compared with ground truth (M1). Training was repeated 50 times (50 experiments) and the best-performing experiment was identified. Prediction scores from UCSF-CAPRA and UCLA PSMA risk calculator were used as comparators. - 102 - 12297548v2
Attorney Docket No.2010358-0329 [0367] Explainable artificial intelligence. This example also evaluates model performance using explainable artificial intelligence (AI). All deep learning models were explained using the FoXai library. Models on clinicopathologic data were explained using the SHAP library. In this manner, the set of input features could be selected based on their contribution to final model output, as measured using explainable AI techniques. Results [0368] Among the CNN model architectures tested, the SqueezeNetv2-based model provided the best performance, with an AUC of 0.7273. Results for all model architectures evaluated are shown in Table 8A, below. A fused model, which incorporated CNN model predictions along with patient attributes (e.g., clinicopathologic data), achieved state-of-the- art results in cancer metastasis diagnoses with a 0.82 AUC median, 0.75 and 0.87 AUCs in the 1st and 3rd quartile, respectively. Table 8A. Comparison of different CNN architecture performance. Metrics shown are a median of 50 experiments run with a stratified sampling of train, validation, and test set. Each neural network received two channels of input, a prostate volume and a hotspot mask.
L. Example 3: A convolutional neural network model using intraprostatic patterns of [F18]DCFPyL uptake in PSMA PET images for prediction of synchronous metastases [0356] This example provides additional results of and expands upon an imaging study that demonstrates use of a CNN model in conjunction with intraprostatic PSMA imaging, described in Example 2, above. [0357] In particular, [F18]DCFPyL (PyLTM) (also referred to as Piflufolast F-18 DCFPyL) is a PSMA targeted imaging agent that provides whole-body staging of prostate cancer. This example demonstrates how image analysis of a primary tumor using machine learning techniques (e.g., deep learning algorithms) can offer additional insight into disease biology, including the presence of co-existing metastatic disease. Approaches using convolutional neural network (CNN) models using inputs from whole prostate PyLTM PET/CT images along with automatically segmented hotspots within a prostate were used to predict presence or absence of synchronous metastases and were compared against established models built from clinicopathologic information. [0358] As described in further detail, veterans with de novo prostate cancer that had been imaged with PyL PET/CT for initial staging were included in the retrospective analysis described in this example. PyL PET/CT images of the prostate were analyzed using aPROMISE, which automatically segments, localizes, and quantifies disease on PSMA PET/CT images. Automatically segmented prostate volumes (determined via automated segmentation of CT images) were used to map PyLTM uptake within the prostate, as reflected - 99 - 12297548v2
Attorney Docket No.2010358-0329 in the PET image channel. aPROMISE was also used to automatically detect and segment 3D hotspots representing potential cancerous lesions within a subject. Both the entire prostate, as well as aPROMISE defined hotspots were used as inputs for the CNN model. As described in further detail herein (e.g., below) an attention map analysis indicates that the hotspot information facilitates the neural network in determining locations and extents of tumors within the prostate. The CNN model architecture in this example was based on SqueezeNet v2. In order to train the CNN models and evaluate their performance, the image dataset was randomly split into training, validation, and test sets. Receiver operating characteristic (ROC) curves were generated and area under the curve (AUC) metrics were computed to assess model performance in predicting presence of metastases, and test predictions were compared with ground truth (M1). Model training was repeated 50 times (50 experiments) and the best performing experiment (e.g., trained model) was identified. For purposes of comparison with previous techniques based on evaluation of clinicopathological data, prediction scores determined using the UCSF-CAPRA scoring system and UCLA PSMA risk calculator were determined and compared with CNN model performance. [0359] Of the 90 veterans evaluated in the analysis presented in this example, 47 presented localized disease and 43 had metastatic prostate cancer. The CNN model operating on image data alone achieved a median AUC of 0.72 for prediction of metastatic disease (ICR 0.64 and 0.8). Adding clinicopathologic information to imaging data via a fused model improved the AUC to a median of 0.82. For comparison, AUCs from the UCSF-CAPRA score and UCLA-PSMA risk calculator (any upstaging on PET), which rely on clinicopathologic information, were 0.729 and 0.754 for the dataset used in this example, respectively. [0360] Accordingly, results of this example show the ability of a CNN based model to predict presence of synchronous metastases in patients intraprostatic PyL uptake patterns alone. Predictive accuracies of the CNN model for this dataset were comparable to published prediction models based on clinicopathologic features (namely, UCSF-CAPRA scoring and UCLA-PSMA risk calculator). [0361] Predictions from CNN image analysis models were also combined with other measurable imaging parameters and clinicopathologic data to develop a fused model that discriminates between prostate cancers with or without co-existing metastases with high fidelity. - 100 - 12297548v2
Attorney Docket No.2010358-0329 Materials and Methods [0362] Dataset. Ninety (90) veterans with de novo prostate cancer were imaged with PyL PSMA PET/CT for initial staging (47 with localized disease and 43 with metastatic prostate cancer). Images of the prostate were analyzed using aPROMISE, which, among other things, segments the prostate gland and localizes and segments hotspots corresponding to regions of PET images determined to represent to potential intraprostatic lesions. The segmentation of the prostate was used to map PyL PET images of the prostate. Without wishing to be bound to any particular theory, neural networks are believed to exhibit performance improvements when provided with pragmatically extracted task-specific features, particularly when dealing with a limited number of cases. Accordingly, identifications of hotspots determined via aPROMISE were provided as input alongside PET prostate-region scans to CNN models to create a two-channel CNN model that leveraged information from prostate PET intensities and detected hotspots representing potential lesions. FIG.29 shows an example system architecture, illustrating image-based inputs (PET image intensities and hotspots) to a CNN model, as well as a fused model that integrates the CNN-based image system with clinicopathologic data. FIGs.18A-18C show example model inputs, with FIG.8A showing a cuboid region surrounding a prostate in a PET image, FIG. 18B showing the same cuboid region overlaid on a 3D hotspot mask, and FIG.18C showing an overlay of FIGs.18A and 18B. Attention map analysis, described in further detail herein, indicates that the 3D hotspot mask, when used as input to a neural network, facilitated the network in identifying locations and extents of tumors. [0363] CNN model architecture. Several different Convolutional Neural Network (CNN) architectures were evaluated. Since the limited number of training samples were believed to raise a high risk of model overfitting, only models with a relatively low number of parameters were considered in this example. In particular, modified version of the ResNet18, SqueezeNetv2, MobileNet, and ShuffleNet models were evaluated. These CNN architectures were originally designed for 2D image processing and, accordingly, were modified to make them suitable for 3D image analysis by substituting their original 2D convolutional and pooling layers with 3D convolution and pooling layers. Moreover, for the SqueezNetv2 architecture, the last network layers comprising dropout, convolution with kernel size 1, ReLU activation, and average 3D Pooling layers were substituted with adaptive max pooling 3D, dropout and fully connected layers. Models were trained using a weighted binary cross entropy loss function. The top-performing model (SqueezeNetv2) underwent - 101 - 12297548v2
Attorney Docket No.2010358-0329 further optimization through grid-search hyperparameter-tuning. Optimal values for group convolution, learning rate, regularization strength, and a set of augmentations (described in the paragraph below) were determined based on initial validation. The CNN model was trained for 300 epochs and the checkpoint for the best-performing epoch on the evaluation subset was retained and selected for testing. [0364] Augmentations. To avoid overfitting, a randomly selected set of augmentations were applied to CNN inputs each epoch. In the present example, seven of the following fifteen augmentations were sampled and applied in random order: random rotation, random flip in left-right axes, random Gaussian noise, random standard deviation intensity shift, random contrast adjustment, random Gaussian smoothing, random Gaussian sharpening, random histogram shift, random Coarse shuffle, random 3D elastic distortion, random affine transformation, random Gibbs noise, random bias field, random K-space spike noise, and random Rician noise. [0365] Multimodal model. To further improve metastases prediction performance, the top-performing CNN model (SqueezeNetv2), which utilized both the prostate intensities and hotspot identification input channels, was integrated into a fused model that also utilized various patient attributes, such as features derived from images and clinicopathologic data. These patient attributes included a measured PSA value, Pathologic Grade Group, Percent Positive Cores, a peak SUV prostate-located value, PRIMARY score, and PSMA Expression score (generated by PROMISEV2). A Naïve Bayes classifier was integrated to leverage the output from the CNN model in conjunction with other variable and categorical features to formulate the conclusive prediction of synchronous metastases. These categorical and variable features were integrated with the CNN model using fused model approaches, including a logistic regression, XGboost, and Naïve Bayes, resulting in a fused model. [0366] Metrics. The dataset was split into training, validation, and test sets using stratified random sampling, in ratios of 0.5, 0.2, and 0.3 accordingly. Area under the receiver operating characteristic curve (AUC) was computed to evaluate performance of various models in predicting the presence of metastases and test predictions were compared with ground truth (M1). Training was repeated 50 times (50 experiments) and the best-performing experiment was identified. Prediction scores from UCSF-CAPRA and UCLA PSMA risk calculator were used as comparators. - 102 - 12297548v2
Attorney Docket No.2010358-0329 [0367] Explainable artificial intelligence. This example also evaluates model performance using explainable artificial intelligence (AI). All deep learning models were explained using the FoXai library. Models on clinicopathologic data were explained using the SHAP library. In this manner, the set of input features could be selected based on their contribution to final model output, as measured using explainable AI techniques. Results [0368] Among the CNN model architectures tested, the SqueezeNetv2-based model provided the best performance, with an AUC of 0.7273. Results for all model architectures evaluated are shown in Table 8A, below. A fused model, which incorporated CNN model predictions along with patient attributes (e.g., clinicopathologic data), achieved state-of-the- art results in cancer metastasis diagnoses with a 0.82 AUC median, 0.75 and 0.87 AUCs in the 1st and 3rd quartile, respectively. Table 8A. Comparison of different CNN architecture performance. Metrics shown are a median of 50 experiments run with a stratified sampling of train, validation, and test set. Each neural network received two channels of input, a prostate volume and a hotspot mask.