WO2020075737A1 - Brain functional connectivity correlation value adjustment method, brain functional connectivity correlation value adjustment system, brain activity classifier harmonization method, brain activity classifier harmonization system, and brain activity biomarker system - Google Patents
Brain functional connectivity correlation value adjustment method, brain functional connectivity correlation value adjustment system, brain activity classifier harmonization method, brain activity classifier harmonization system, and brain activity biomarker system Download PDFInfo
- Publication number
- WO2020075737A1 WO2020075737A1 PCT/JP2019/039751 JP2019039751W WO2020075737A1 WO 2020075737 A1 WO2020075737 A1 WO 2020075737A1 JP 2019039751 W JP2019039751 W JP 2019039751W WO 2020075737 A1 WO2020075737 A1 WO 2020075737A1
- Authority
- WO
- WIPO (PCT)
- Prior art keywords
- measurement
- brain
- brain activity
- subjects
- classifier
- Prior art date
- Legal status (The legal status is an assumption and is not a legal conclusion. Google has not performed a legal analysis and makes no representation as to the accuracy of the status listed.)
- Ceased
Links
Images


Classifications
-
- A—HUMAN NECESSITIES
- A61—MEDICAL OR VETERINARY SCIENCE; HYGIENE
- A61B—DIAGNOSIS; SURGERY; IDENTIFICATION
- A61B5/00—Measuring for diagnostic purposes; Identification of persons
- A61B5/0033—Features or image-related aspects of imaging apparatus, e.g. for MRI, optical tomography or impedance tomography apparatus; Arrangements of imaging apparatus in a room
- A61B5/004—Features or image-related aspects of imaging apparatus, e.g. for MRI, optical tomography or impedance tomography apparatus; Arrangements of imaging apparatus in a room adapted for image acquisition of a particular organ or body part
- A61B5/0042—Features or image-related aspects of imaging apparatus, e.g. for MRI, optical tomography or impedance tomography apparatus; Arrangements of imaging apparatus in a room adapted for image acquisition of a particular organ or body part for the brain
-
- A—HUMAN NECESSITIES
- A61—MEDICAL OR VETERINARY SCIENCE; HYGIENE
- A61B—DIAGNOSIS; SURGERY; IDENTIFICATION
- A61B5/00—Measuring for diagnostic purposes; Identification of persons
- A61B5/05—Detecting, measuring or recording for diagnosis by means of electric currents or magnetic fields; Measuring using microwaves or radio waves
- A61B5/055—Detecting, measuring or recording for diagnosis by means of electric currents or magnetic fields; Measuring using microwaves or radio waves involving electronic [EMR] or nuclear [NMR] magnetic resonance, e.g. magnetic resonance imaging
-
- A—HUMAN NECESSITIES
- A61—MEDICAL OR VETERINARY SCIENCE; HYGIENE
- A61B—DIAGNOSIS; SURGERY; IDENTIFICATION
- A61B5/00—Measuring for diagnostic purposes; Identification of persons
- A61B5/145—Measuring characteristics of blood in vivo, e.g. gas concentration or pH-value ; Measuring characteristics of body fluids or tissues, e.g. interstitial fluid or cerebral tissue
- A61B5/14542—Measuring characteristics of blood in vivo, e.g. gas concentration or pH-value ; Measuring characteristics of body fluids or tissues, e.g. interstitial fluid or cerebral tissue for measuring blood gases
-
- A—HUMAN NECESSITIES
- A61—MEDICAL OR VETERINARY SCIENCE; HYGIENE
- A61B—DIAGNOSIS; SURGERY; IDENTIFICATION
- A61B5/00—Measuring for diagnostic purposes; Identification of persons
- A61B5/16—Devices for psychotechnics; Testing reaction times ; Devices for evaluating the psychological state
- A61B5/165—Evaluating the state of mind, e.g. depression, anxiety
-
- A—HUMAN NECESSITIES
- A61—MEDICAL OR VETERINARY SCIENCE; HYGIENE
- A61B—DIAGNOSIS; SURGERY; IDENTIFICATION
- A61B5/00—Measuring for diagnostic purposes; Identification of persons
- A61B5/72—Signal processing specially adapted for physiological signals or for diagnostic purposes
- A61B5/7235—Details of waveform analysis
- A61B5/7264—Classification of physiological signals or data, e.g. using neural networks, statistical classifiers, expert systems or fuzzy systems
- A61B5/7267—Classification of physiological signals or data, e.g. using neural networks, statistical classifiers, expert systems or fuzzy systems involving training the classification device
-
- G—PHYSICS
- G06—COMPUTING OR CALCULATING; COUNTING
- G06F—ELECTRIC DIGITAL DATA PROCESSING
- G06F18/00—Pattern recognition
- G06F18/20—Analysing
- G06F18/21—Design or setup of recognition systems or techniques; Extraction of features in feature space; Blind source separation
- G06F18/213—Feature extraction, e.g. by transforming the feature space; Summarisation; Mappings, e.g. subspace methods
- G06F18/2136—Feature extraction, e.g. by transforming the feature space; Summarisation; Mappings, e.g. subspace methods based on sparsity criteria, e.g. with an overcomplete basis
-
- G—PHYSICS
- G06—COMPUTING OR CALCULATING; COUNTING
- G06F—ELECTRIC DIGITAL DATA PROCESSING
- G06F18/00—Pattern recognition
- G06F18/20—Analysing
- G06F18/23—Clustering techniques
-
- G—PHYSICS
- G06—COMPUTING OR CALCULATING; COUNTING
- G06T—IMAGE DATA PROCESSING OR GENERATION, IN GENERAL
- G06T7/00—Image analysis
- G06T7/0002—Inspection of images, e.g. flaw detection
- G06T7/0012—Biomedical image inspection
- G06T7/0014—Biomedical image inspection using an image reference approach
- G06T7/0016—Biomedical image inspection using an image reference approach involving temporal comparison
-
- G—PHYSICS
- G06—COMPUTING OR CALCULATING; COUNTING
- G06V—IMAGE OR VIDEO RECOGNITION OR UNDERSTANDING
- G06V10/00—Arrangements for image or video recognition or understanding
- G06V10/70—Arrangements for image or video recognition or understanding using pattern recognition or machine learning
- G06V10/762—Arrangements for image or video recognition or understanding using pattern recognition or machine learning using clustering, e.g. of similar faces in social networks
-
- A—HUMAN NECESSITIES
- A61—MEDICAL OR VETERINARY SCIENCE; HYGIENE
- A61B—DIAGNOSIS; SURGERY; IDENTIFICATION
- A61B2576/00—Medical imaging apparatus involving image processing or analysis
- A61B2576/02—Medical imaging apparatus involving image processing or analysis specially adapted for a particular organ or body part
- A61B2576/026—Medical imaging apparatus involving image processing or analysis specially adapted for a particular organ or body part for the brain
-
- G—PHYSICS
- G06—COMPUTING OR CALCULATING; COUNTING
- G06T—IMAGE DATA PROCESSING OR GENERATION, IN GENERAL
- G06T2207/00—Indexing scheme for image analysis or image enhancement
- G06T2207/10—Image acquisition modality
- G06T2207/10072—Tomographic images
- G06T2207/10088—Magnetic resonance imaging [MRI]
-
- G—PHYSICS
- G06—COMPUTING OR CALCULATING; COUNTING
- G06T—IMAGE DATA PROCESSING OR GENERATION, IN GENERAL
- G06T2207/00—Indexing scheme for image analysis or image enhancement
- G06T2207/30—Subject of image; Context of image processing
- G06T2207/30004—Biomedical image processing
- G06T2207/30016—Brain
-
- G—PHYSICS
- G06—COMPUTING OR CALCULATING; COUNTING
- G06V—IMAGE OR VIDEO RECOGNITION OR UNDERSTANDING
- G06V2201/00—Indexing scheme relating to image or video recognition or understanding
- G06V2201/03—Recognition of patterns in medical or anatomical images
Definitions
- the present invention relates to a technique for adjusting a brain function coupling correlation value measured by a brain function image method in a plurality of devices, a brain activity classifier harmonization method using the brain function image method, a brain activity classifier harmonization system, and Brain activity biomarker system.
- Biomarker In order to quantitatively grasp biological changes in the living body, an index that quantifies and quantifies biological information is called a “biomarker”.
- biomarkers as "items that are objectively measured and evaluated as indicators of normal and pathological processes or pharmacological response to treatment.”
- biomarkers that characterize the state and change of disease and the degree of cure are used as surrogate markers (surrogate markers) to confirm the efficacy of new drugs in clinical trials.
- Blood glucose level and cholesterol level are typical biomarkers as indicators of lifestyle-related diseases. Not only substances derived from a living body contained in urine or blood, but also electrocardiogram, blood pressure, PET image, bone density, lung function and the like are included. Further, due to the progress of genome analysis and proteome analysis, various biomarkers related to DNA, RNA, biological proteins and the like have been found.
- a biomarker is not only a measure of the therapeutic effect after having a disease, but it is also a daily indicator to prevent the disease as a daily indicator to prevent the disease, and to select an effective treatment method that avoids side effects. Is expected to be applied. However, in the case of neurological and psychiatric disorders, although molecular markers that can be used as objective indicators from a biochemical or molecular genetic perspective have been studied, it is still in the examination stage.
- NIRS Near-InfraRed Spectroscopy
- Magnetic Resonance Imaging changes in the detected signal appear in response to changes in blood flow, which is used to visualize the active site of the brain against external stimuli. It is also possible.
- MRI Magnetic Resonance Imaging
- fMRI functional MRI
- fMRI In fMRI, an ordinary MRI device is used, which is equipped with the necessary hardware and software for fMRI measurement.
- the change in blood flow causes a change in NMR signal intensity by utilizing the fact that oxygenated and deoxygenated hemoglobins in blood have different magnetic properties.
- Oxygenated hemoglobin has the property of a diamagnetic substance and does not affect the relaxation time of hydrogen atoms in the surrounding water, whereas deoxygenated hemoglobin is a paramagnetic substance and changes the surrounding magnetic field. Therefore, when the brain is stimulated, the local blood flow increases, and the oxygenated hemoglobin increases, the change can be detected as an MRI signal.
- a stimulus to the subject for example, visual stimulus, auditory stimulus, execution of a predetermined task (task), or the like is used (for example, Patent Document 2).
- the entire disclosure of U.S. Pat. No. 6,096,849 is hereby incorporated by reference.
- MRI signal nuclear magnetic resonance signal
- BOLD effect a phenomenon in which the concentration of deoxygenated hemoglobin in red blood cells in microvenules and capillaries decreases.
- BOLD signal Blood Oxygen Level Dependent Signal
- the activity of the brain is measured by the MRI device while the subject is doing some kind of exercise.
- Non-Patent Document 1 a decoding technique capable of extracting more detailed information from fMRI data.
- fMRI analyzes brain activity in voxel units in the brain (volumetric pixel: voxel), so that it is possible to estimate a stimulus input or a recognition state from a spatial pattern of brain activity.
- Patent Document 3 discloses a brain activity analysis method for realizing a biomarker by a brain functional imaging method for a nerve / psychiatric disease. .
- the entire disclosure of U.S. Pat. No. 6,096,849 is hereby incorporated by reference.
- the correlation matrix of the activity between predetermined brain regions is derived for each subject from the data of resting functional connectivity MRI measured in the healthy group and the patient group.
- Feature extraction is performed by regularized canonical correlation analysis for the subject's attributes including the subject's disease / health label and the correlation matrix.
- a discriminator functioning as a biomarker is generated by discriminant analysis by sparse logistic regression (SLR) based on the result of the regularized canonical correlation analysis. It was shown that such a machine learning technique can predict the diagnosis result of a neurological disease based on the connection between the brain regions derived from the resting fMRI data. Moreover, it was shown that the verification of the prediction performance can be generalized to some extent not only for the brain activity measured at one facility but also for the brain activity measured at another facility.
- SLR sparse logistic regression
- Patent Document 4 The entire disclosure of U.S. Pat. No. 6,096,849 is hereby incorporated by reference.
- Non-Patent Document 2 The entire disclosure of Non-Patent Document 2 is incorporated herein by reference.
- Non-Patent Documents 3 and 4 The entire disclosure of Non-Patent Document 3 and the entire disclosure of Non-Patent Document 4 are incorporated herein by reference.
- the brain functional image The analysis of brain activity by the method is expected to be applied as a non-invasive functional marker to the development of diagnostic methods and the search and identification of target molecules for drug discovery to realize the underlying treatment.
- biomarkers generated by machine learning for brain activity measured at one facility are used. It is necessary to improve the prediction accuracy of. Further, it is necessary that the biomarker thus generated can be generalized to the brain activity measured in another facility.
- the first issue is the problem of small sample size.
- the data amount N which is the number of test subjects, is much smaller than the dimension M of the measured brain activity measurement data, the parameters of the discriminator easily overfit the training data.
- the constructed discriminator will show very poor performance on the newly sampled test data. This is because these test data were not used to train the discriminator.
- the second problem is that the constructed classifier is clinically effective only when it maintains good performance even for MRI data scanned at an imaging site different from the site where the training data was collected. It is useful and scientifically reliable. This is the so-called generalization capability across the imaging site.
- brain images need to be acquired from multiple sites because the amount of data that can be acquired at one site is limited.
- the difference between sites is the greatest obstacle. That is, in clinical applications, it has often been observed that data scanned at different sites cannot be generalized to a trained discriminator using data acquired at a particular site.
- the present invention has been made to solve the above problems, and an object thereof is to adjust and correct a measurement bias in each facility based on brain measurement data acquired from a plurality of facilities. It is an object of the present invention to provide an adjustment method of a functional combination correlation value and a system for adjusting a functional combination correlation value.
- Another object of the present invention is to brainize brain measurement data acquired from a plurality of facilities to realize a discrimination process by a brain functional image method for supporting diagnosis of a nerve / mental disorder.
- An object of the present invention is to provide a harmonization method for an activity classifier, a harmonization system for a brain activity classifier, a brain activity analysis device, and a brain activity analysis method.
- Another object of the present invention is to provide a brain activity analysis device, a brain activity analysis method, a brain activity biomarker system, and a brain activity biomarker system program for realizing a biomarker by measuring brain activity.
- a method of adjusting a brain function-coupling correlation value for correcting a brain function-coupling correlation value of a subject measured at a plurality of measurement sites comprising: For a plurality of mobile subjects to be commonly measured, a step of measuring brain activity for a plurality of predetermined brain regions of each mobile subject, and time correlation of brain activity for a set of brain regions are represented.
- a predetermined element of the brain function coupling matrix for each moving subject and the generalized linear mixed model method, for each predetermined element of the brain function coupling matrix, a plurality of measurement sites and a plurality of moving subjects can be obtained.
- the step of calculating the measurement bias and the measured bias at each measurement site are used.
- the brain function bond correlation value is a predetermined component of brain function binding matrix's and a step of obtaining an adjustment value.
- a brain function coupling correlation value adjustment system for measuring the brain activity of multiple subjects in time series.
- the calculation processing system is a storage device for storing data.
- the storage device stores the result of measuring brain activity for a plurality of predetermined brain regions of each mobile subject for a plurality of mobile subjects commonly measured at each of the plurality of measurement sites.
- a computing device calculates a predetermined element of a brain function coupling matrix representing a temporal correlation of brain activity for a set of a plurality of brain regions, for each moving subject, and generalizes the linear mixed model.
- the measurement bias is calculated as a fixed effect at each measurement site with respect to the average of the element over a plurality of measurement sites and a plurality of mobile subjects, and the measurement bias is used.
- An adjustment value is calculated by correcting a brain function coupling correlation value, which is a predetermined element of the brain function coupling matrix of the subject measured at each measurement site.
- a method of harmonizing a brain activity classifier for performing a classification process on at least one attribute of a plurality of subjects measured at a plurality of measurement sites comprising: For each of a plurality of mobile subjects that are commonly measured in each of the steps, a step of measuring the brain activity for a plurality of predetermined brain regions of each mobile subject, and the time of the brain activity for a set of the plurality of brain regions.
- the step of calculating a predetermined element of the brain function coupling matrix for each moving subject and the generalized linear mixed model method for each predetermined element of the brain function coupling matrix, a plurality of measurement sites and a plurality of As a fixed effect at each measurement site with respect to the average of the element over mobile subjects, the step of calculating the measurement bias and the measurement at each measurement site.
- the plurality of training data target subjects whose brain activity is measured at each measurement site include a first group of test subjects having an attribute and a second group of test subjects having no attribute, and a measurement bias.
- the step of calculating is by using the generalized linear mixed model method, for each predetermined element of the brain function coupling matrix, the average of the element over a plurality of measurement sites and a plurality of mobile subjects and a plurality of training data subject subjects. As a fixed effect at each measurement site for the measurement bias and the step of calculating the sample bias of the first group and the sample bias of the second group.
- the measurement bias is calculated by least squares regression by L2 normalization.
- the machine learning method with feature selection is a logistic regression analysis method using LASSO (least absolute shrinkage and selection operator).
- a harmonization system of a brain activity classifier for performing a classification process for at least one attribute based on the measurement result of the brain activity of the subject,
- a brain activity classifier for performing a classification process for at least one attribute based on the measurement result of the brain activity of the subject.
- multiple brain activity measurement devices provided at multiple measurement sites, and a predetermined element of the brain function coupling matrix that represents the time correlation of the brain activity of the subject of the training data
- a calculation processing system for correcting a certain brain function coupling correlation value includes a storage device for storing data, and the storage device is a measurement target common to each of a plurality of measurement sites.
- the result of measuring the brain activity for a plurality of predetermined brain regions of each mobile subject is stored for a plurality of mobile subjects to be
- a predetermined element of the brain function coupling matrix is calculated, and by using the generalized linear mixed model method, for each predetermined element of the brain function coupling matrix, a plurality of measurement sites and a plurality of mobile subjects are obtained.
- the measurement bias is calculated, and by using the measurement bias, a plurality of training data measured at each measurement site
- An adjustment value is calculated by correcting a certain brain function coupling correlation value, and a classifier for the attribute is generated by a machine learning method with feature selection based on the adjustment value.
- the plurality of training data target subjects whose brain activities are measured at each measurement site include a first group having an attribute and a second group having no attribute, and the arithmetic unit is configured to measure the bias.
- the generalized linear mixed model method in calculating, for each predetermined element of the functional coupling matrix, the average of the element over multiple measurement sites and multiple mobile subjects and multiple training data target subjects is calculated.
- the measurement bias, the sample bias of the first group, and the sample bias of the second group are calculated.
- the measurement bias is calculated by least-squares regression by L2 normalization.
- the machine learning method with feature selection is a logistic regression analysis method using LASSO.
- a brain activity biomarker using a brain activity classifier for performing a classification process on at least one attribute of the presence or absence of a disease based on the measurement result of the brain activity of the subject.
- the system in order to measure the brain activity of multiple subjects in time series, multiple brain activity measurement devices provided at multiple measurement sites and a brain function coupling matrix representing the time correlation of the brain activity of the subjects and a calculation processing system for correcting a brain function coupling correlation value, which is a predetermined element of the calculation processing system, the calculation processing system includes a storage device and a calculation device, and the calculation device is a plurality of measurement sites.
- each corrected adjustment value is calculated and stored in the storage device.
- Te brain activity classifier, generated by machine learning with a first feature selection.
- the storage device stores in advance, for a plurality of mobile subjects to be measured in common at each of the plurality of measurement sites, results of measuring brain activity in a plurality of predetermined brain regions of each mobile subject. That is, the arithmetic device calculates a predetermined element of the brain function coupling matrix representing the temporal correlation of brain activity for a set of a plurality of brain regions for each moving subject, and by using the generalized linear mixed model method, For each predetermined element of the brain function coupling matrix, the measurement bias is calculated as a fixed effect at each measurement site with respect to the average of the element over a plurality of measurement sites and a plurality of mobile subjects.
- the arithmetic unit performs a classification process for the attribute of the presence or absence of a disease based on the measurement data of the subject measured by any of the plurality of measurement sites.
- the arithmetic unit divides the adjustment value into a training data set for machine learning and a test data set for verification, and ii) for the training data set. Undersampling and subsampling by a predetermined number to generate a predetermined number of subsamples, iii) generating a classifier submodel by feature selection by sparse modeling method for each subsample, and iv) sparse sampling method A classifier for the attribute of the presence or absence of a disease is generated based on the feature selection by.
- the machine learning with the first feature selection includes nested cross validation with outer cross validation and inner cross validation
- the computing device includes: i) outer validation in the process of nested cross validation.
- the cross-validation is K split cross-validation, and the adjustment value is divided into a training data set for machine learning and a test data set for verification, and ii) a predetermined number of under-samplings and sub-samplings are performed on the training data set.
- the storage device stores information on a disease evaluation scale for each of a plurality of subjects, and the arithmetic device selects a regression model for the disease evaluation scale on the basis of the adjustment value and selects the second feature selection.
- the brain functional connection generated by the accompanying machine learning and commonly extracted by the first feature selection and the second feature selection is specified.
- a brain activity biomarker using a brain activity classifier for performing a classification process on at least one attribute of the presence or absence of a disease based on the measurement result of the brain activity of the subject.
- a brain activity biomarker system which is a computer program for controlling the operation of the system, includes a plurality of brain activity measurement devices provided at a plurality of measurement sites in order to measure the brain activity of a plurality of subjects in time series.
- a storage device and a computing device including a calculation processing system for correcting a brain function coupling correlation value which is a predetermined element of a brain function coupling matrix representing a temporal correlation of brain activity of an examinee, and a computer program ,
- the calculation device removes the measurement bias from the brain function coupling correlation value which is a predetermined element of the brain function coupling matrix of a plurality of subjects measured at each measurement site.
- the storage device stores in advance, for a plurality of mobile subjects to be measured in common at each of the plurality of measurement sites, results of measuring brain activity in a plurality of predetermined brain regions of each mobile subject.
- the computer program causes the arithmetic unit to calculate a predetermined element of a brain function coupling matrix representing a temporal correlation of brain activities for a set of a plurality of brain regions for each moving subject, and a generalized linear mixed model.
- calculating a measurement bias as a fixed effect at each measurement site with respect to an average of the elements over a plurality of measurement sites and a plurality of mobile subjects for each predetermined element of the brain function coupling matrix.
- the arithmetic unit is further caused to perform a step of performing a classification process for an attribute of presence or absence of a disease, based on measurement data of a subject measured at any of a plurality of measurement sites.
- the arithmetic unit i) divides the adjustment value into a training data set for machine learning and a test data set for verification, and ii) a training data set. For performing a predetermined number of undersamplings and subsamplings to generate a predetermined number of subsamples, and iii) generating a classifier submodel by feature selection by sparse modeling for each subsample. iv) generating a classifier for the attribute of the presence or absence of a disease based on feature selection by sparse modeling.
- the machine learning with the first feature selection includes a nested cross-validation having outer cross validation and inner cross validation, and the arithmetic unit in the processing of the nested cross validation: i) splitting the adjustment value into a training data set for machine learning and a test data set for verification, where the outer cross-validation is K split cross-validation, and ii) undersampling and Performing a predetermined number of sub-samplings to generate a predetermined number of sub-samples, and iii) generating a classifier sub-model for each sub-sample with inner cross-validation in each K-fold cross-validation loop. And iv) generating a brain activity classifier based on the classifier submodel.
- the storage device stores information on a disease evaluation scale for each of a plurality of subjects, and the arithmetic device selects a regression model for the disease evaluation scale on the basis of the adjustment value and selects the second feature selection.
- the step of generating by the accompanying machine learning and the step of specifying the brain functional connection commonly extracted by the first feature selection and the second feature selection are executed.
- the present invention it is possible to adjust and correct the measurement bias in each facility with respect to the brain activity measurement data measured in a plurality of facilities. As a result, it becomes possible to adjust the brain function connection correlation value based on the measurement data at a plurality of facilities.
- a classifier harmonization method, a brain activity classifier harmonization system, a brain activity analysis system, and a brain activity analysis method can be realized.
- a brain activity biomarker system by a functional brain imaging method, a program of a brain activity biomarker system for a nerve / psychiatric disease, for measurement data of brain activity measured at a plurality of facilities. It can be realized.
- FIG. 1 It is a conceptual diagram for demonstrating the harmonization process about the data measured by the MRI measurement system installed in the some measurement site. It is a conceptual diagram which shows the procedure which extracts the correlation matrix which shows the correlation of functional connection at rest about ROI (Region of Interest) of a subject's brain. It is a conceptual diagram which shows the example of the content of "measurement parameter" and "subject attribute data.”
- 3 is a hardware block diagram of a data processing unit 32.
- the rs-fcMRI method of the present embodiment it is a conceptual diagram for explaining a method of evaluating a difference between sites by a moving subject who receives measurement while moving between sites. It is a conceptual diagram for demonstrating the expression of the b-th functional connectivity of the subject a. It is a conceptual diagram explaining the process which produces
- the discrimination processing unit 3000 is a flowchart showing a process of generating a discriminator for a disease or healthy label for a subject. It is a conceptual diagram for demonstrating the harmonization process when a new measurement site is added after the harmonization process is performed. It is a conceptual diagram which shows the data of a multi-disease database and the dataset of a traveling subject used for a harmonization process. It is a figure which shows the content of the multi-disease data set of SRPBS. It is a figure which shows the imaging protocol in each measurement site. It is a graph which visualizes the difference between sites by a principal component analysis, and a disease effect.
- FIG. 6 shows the performance of the MDD classifier on an independent cohort.
- FIG. 7 shows the performance of the SCZ classifier on an independent cohort.
- FIG. 6 shows a scatter plot of real age and predicted age in an independent cohort.
- FIG. 6 shows a scatter plot of real age and predicted age in an independent cohort.
- FIG. 3 is a conceptual diagram of a procedure for deriving a common functional connection in the brain for the diagnosis and symptoms of mental illness (for example, major depressive disorder). It is a flowchart for demonstrating the procedure which produces
- FIG. 6 is a diagram showing the performance of a regression model with respect to a BDI score in an independent verification data set.
- FIG. 7 shows the spatial distribution of seven brain functionally connected FCs common to both MDD classifier and BDI regression model construction.
- FIG. 7 shows a list showing the characteristics of seven common brain functionally coupled FCs. It is a figure which shows the value of functional connection FC between the training data set and independent verification data set in common functional connection FC.
- the brain activity between a plurality of areas of the brain is measured in time series by a “brain activity measuring device” installed in a plurality of facilities, more specifically, an “MRI measurement system”.
- the present invention will be described as classifying subjects based on the pattern of time correlation between these areas.
- Such "MRI measurement system” is installed in a plurality of different facilities. As will be described later, the difference between the sites for measurement between these measurement facilities (measurement sites) is caused by the measurement equipment. The measurement bias and the difference due to the population of the subjects at the measurement site (sample bias) are independently evaluated. Then, the measurement value at each measurement site is subjected to the process of correcting the difference between the sites by removing the effect of the measurement bias, thereby realizing the harmonization process (harmonization) for the measurement result between the measurement sites.
- harmonization harmonization
- FIG. 1 is a conceptual diagram for explaining a harmonization process for data measured by MRI measurement systems installed at a plurality of measurement sites.
- measurement site MS. 1-MS. Ns (Ns: number of sites) includes MRI devices 100.1 to 100.n. It is assumed that Ns is installed. Measurement site MS. 1-MS. In Ns, the test subject group PA. 1-PA. Ns is measured. Subject group PA. 1-PA. It is assumed that each Ns includes a group classified into at least two or more, for example, a patient group and a healthy subject group. Further, the patient group is not particularly limited, but for example, a group of patients with mental illness, more specifically, a group of “patients with major depression” corresponds.
- the measurement of the subject shall be performed with a unified measurement protocol to the extent possible due to the specifications of the MRI device.
- Direction in which head scan is performed For example, the direction from the back side of the head (posterior: abbreviated as “P” below) to the front side (anterior: abbreviated as “A”) (hereinafter, “ It is necessary to specify whether scanning is performed in the opposite direction, that is, in the P ⁇ A direction), that is, in the direction from the front side to the rear side (hereinafter, referred to as the “A ⁇ P direction”). Depending on the situation, it may be specified to perform scanning in both cases.
- the default direction may be different, or both may not be set arbitrarily.
- the scanning direction may specify the "distortion method" of the image, for example, and the conditions are set as the protocol.
- Imaging condition of functional brain image A condition for capturing a functional brain image of the subject at "rest” is set by fMRI (functional Magnetic Resonance Imaging) method.
- a diffusion-weighted image is a type of MRI imaging sequence that is an image of the diffusion motion of water molecules.
- the spin echo pulse sequence that is usually used, signal attenuation due to diffusion can be ignored.
- the phase shift caused by the movement of each magnetization vector during that time cannot be ignored, and a region where the diffusion is active appears as a low signal. Diffusion-weighted images make use of this phenomenon.
- Imaging for Correcting EPI Distortion by Image Processing For example, as one method for correcting EPI distortion by image processing, a “field map method” is known, and an imaging condition for correcting spatial distortion is defined as follows. Set.
- the field map method collects EPI images by multiple echo times and calculates the amount of EPI distortion based on these EPI images.
- the field map method can be applied to correct the EPI distortion contained in the new image. Given a set of images of the same anatomy with different echo times, it is possible to calculate the EPI distortion and correct the distortion of the image.
- Known Document 1 Japanese Unexamined Patent Publication No. 2015-112474 Note that, in the measurement protocol, a necessary sequence portion may be appropriately extracted from the above conditions, and if necessary, another sequence or its condition may be extracted. May be added.
- sampling adoption as a subject who performs measurement is called “sampling”, and the cause of the difference between measurement values between sites caused by the bias of sampling at each measurement site is called “sample bias”.
- these subtypes are melancholic depression, non-melancholic depression, treatment-resistant depression, etc.
- these subtypes are melancholic depression, non-melancholic depression, treatment-resistant depression, etc.
- the distribution of subtypes contained in the patient group is uniform.
- the distribution of subtypes in the patient group at each measurement site is biased, and as a result, the above-mentioned “sample bias” occurs.
- the MRI apparatus 100.1-100 With Ns, it cannot be said that an MRI apparatus having the same measurement characteristics is used at each measurement site.
- the manufacturer of the MRI apparatus the model number of the MRI apparatus, the static magnetic field strength of the MRI apparatus, the number of (transmission) and reception coils in the MRI apparatus (the number of channels), the conditions of the MRI apparatus, the measurement conditions of the MRI apparatus, etc. Differences in measurement data between sites may occur depending on measurement conditions. The difference between sites caused by such measurement conditions is called “measurement bias”.
- a "multi-array coil” is generally adopted for the purpose of improving the SN ratio of the measured signal.
- the “number of receiving coils” refers to the number of “element coils” that form the multi-array coil. By increasing the sensitivity of each element coil and bundling this output, the receiving sensitivity is improved.
- the Ns is integrated and stored in the storage device 210 in the data center 200.
- the “measurement-related data” includes “measurement parameters” at each measurement site, and “patient group data” and “healthy group data” measured at each measurement site.
- patient group data and “healthy group data” include “patient MRI measurement data” and “healthy person MRI measurement data” corresponding to each subject, respectively.
- FIG. 2 is a conceptual diagram showing a procedure for extracting a correlation matrix showing a correlation of functional connections at rest for a region of interest (ROI: Region of Interest) of a subject's brain.
- ROI Region of Interest
- the “patient MRI measurement data” and the “healthy MRI measurement data” in the “patient group data” and the “healthy group data” include at least the following data.
- the data of the correlation matrix is calculated in each measurement site based on the time-series “brain function image data” and then stored in the storage device 210, and the calculation processing system 300 causes the storage device 210 to perform the calculation.
- the brain activity biomarker can be calculated based on the data of the correlation matrix in the above.
- the time-series “brain function image data” is stored in the storage device 210, and the calculation processing system 300 calculates the data of the correlation line example based on the “brain function image data” in the storage device 210. Further, it is also possible to adopt a configuration in which a brain activity biomarker is calculated.
- each measurement site executes anonymization processing before data is stored in the storage device 210.
- the anonymous processing process may be executed in the calculation processing system 300 when the subject who operates the calculation processing system 300 is permitted to handle personal information due to legal regulations.
- the average “activity level” of each region of interest is calculated from fMRI data of n (n: natural number) times of resting fMRI measured in real time.
- the correlation matrix of the functional connectivity (“activity correlation value”) between brain regions (between regions of interest) is calculated.
- Functional connectivity is calculated for each participant as the temporal correlation of the resting functional MRI blood oxygen concentration-dependent (BOLD) signal between the two brain regions.
- the independent off-diagonal components in the correlation matrix are: Nc x (Nc-1) / 2 (pieces) It turns out that.
- Method 1 “Define a region of interest based on the anatomical brain area.”
- the brain activity biomarker for example, 140 regions are adopted as regions of interest.
- ROIs of 137 included in Brain Sulci Atlas (BAL)
- ROIs of the cerebellum left and right
- insects of Automated Anatomical Labeling Atlas are used.
- FCs between 140 ROIs are used as feature quantities.
- Brain Sulci Atlas (BAL) and Automated Anatomical Labeling Atlas are disclosed in the following publicly known documents 2 and 3. All the disclosures of the known documents 2 and 3 are incorporated herein by reference.
- Reference 2 Perrot et al., Med Image Anal, 15 (4), 2011
- Reference 3 Tzourio-Mazoyer et al., Neuroimage, 15 (1), 2002
- DMPFC Dorsomedial prefrontal cortex
- VMPFC Ventromedial prefrontal area
- ACC Anterior cingulate cortex
- Cerebellar bug Left thalamus, Lower right parietal lobe, Right caudate, Right middle occipital lobe, Right middle cingulate cortex
- DMPFC Dorsomedial prefrontal cortex
- VMPFC Ventromedial prefrontal area
- ACC Anterior cingulate cortex
- Cerebellar bug Left thalamus, Lower right parietal lobe, Right caudate, Right middle occipital lobe, Right middle cingulate cortex
- the brain area to be adopted is not limited to such an area.
- the selected area may be changed according to the target nerve / mental disorder.
- Method 2 Define functional connectivity based on the brain area of the functional brain map that covers the entire brain.
- the brain region of such a functional brain map is also disclosed in the following documents and is not particularly limited, but for example, it is configured to have 268 nodes (brain regions). can do. All the disclosures of the following Documents 4 to 7 are incorporated herein by reference.
- Reference 4 Noble S, et al. Multisite reliability of MR-based functional connectivity. Neuroimage 146,959-970 (2017).
- Known Document 5 Finn ES, et al. Functional connectome fingerprinting: identifying individuals using patterns of brain connectivity. Nat Neurosci 18, 1664-1671 (2015).
- Reference 6 Rosenberg MD, et al. A neuromarker of sustained attention from whole-brain functional connectivity. Nat Neurosci 19, 165-171 (2016).
- Known Document 7 Shen X, Tokoglu F, Papademetris X, Constable RT. Groupwise whole-brain parcellation from resting-state fMRI data for network node identification. Neuroimage 82, 403-415 (2013).
- the Pearson's z-transformed Pearson's correlation coefficient for each time course of each possible set of nodes of the preprocessed BOLD signal is calculated, each element representing the strength of connectivity between the two nodes 268.
- a x268 symmetric binding matrix 35,778 (that is, (268 ⁇ 267) / 2) values of the coupling strength (connectivity) of the lower triangular matrix of the coupling matrix are used.
- the calculation of the elements of such a correlation matrix is not particularly limited, but can be executed as follows, for example.
- FC Functional connectivity
- pre-processing is performed on the functional MRI data at rest. The first 10 seconds of data are discarded to allow for T1 equilibration. Pre-processing steps include slice timing calibration, realignment, structural image segmentation with T1 enhancement, Montreal Institute for Neurology (MNI) space normalization, and space with a 6 mm full width half maximum isotropic Gaussian kernel. Includes smoothing.
- MNI Montreal Institute for Neurology
- the ROI is described by the 268-node gray matter map as described above, which was developed to cluster the voxels that are maximally similar.
- the time course of the BOLD signal is extracted from these 268 ROIs.
- linear regression with six motor parameters mean signal over the whole brain, 36 regression parameters such as white matter and cerebrospinal fluid is used. Derivatives and quadratic terms are also included for all parameters.
- Bandpass filters are applied in time series using a first order Butterworth filter with a passband between 0.01Hz and 0.08Hz to limit the analysis to low frequency fluctuations.
- FIG. 3 is a conceptual diagram showing an example of the contents of “measurement parameter” and “subject attribute data”.
- the “subject attribute data” is stored in association with the “patient group data” or the “healthy group data” in FIG. 1 in association with the “patient MRI measurement data” and the “healthy person MRI measurement data”, respectively. To do.
- the measurement parameters include a site ID for identifying a measurement site, a site name, a condition ID for identifying the measurement parameters, information about a measuring device, and information about a measurement condition.
- “Information about the measuring device” includes the manufacturer name, model number, and (sending / receiving) coil number of the MRI device for measuring the brain activity of the subject at each measuring site.
- the “information regarding the measuring device” is not limited to these items, and may include, for example, the static magnetic field strength, the uniformity of the magnetic field after shim adjustment, and other indexes indicating the performance of other measuring devices. .
- “Information regarding measurement conditions” includes the direction of phase encoding (P ⁇ A or A ⁇ P) at the time of image reconstruction, image type (T1 emphasis, T2 emphasis, diffusion emphasis, etc.), imaging sequence (spin echo, etc.), imaging It includes information such as open / closed eyes of the subject inside.
- the “information regarding the measurement conditions” is not limited to these.
- subject attribute data includes subject temporary IDs that have been pseudonym-controlled so that the subjects cannot be identified, condition IDs that represent measurement conditions when the subjects are measured, and subject attributes. Contains information.
- the "subject attribute information” includes information such as the subject's sex, age, health or disease label, the doctor's diagnosis disease name, the subject's medication history, and diagnosis history.
- the “subject attribute information” is, if necessary, for example, anonymized at the measurement site.
- the probability of individual identification is reduced to 1 / k or less.
- the attribute information of the subject can be processed so as to maintain “k-anonymity” that reduces and makes identification difficult.
- the “quasi-identifier” refers to an attribute such as “age”, “sex”, “place of residence” that cannot be individually specified, but can be specified by combining them.
- the medication history and the diagnosis history are subjected to anonymization processing as needed, such as randomizing or shifting of dates.
- the functional coupling calculated as the correlation of the activity over time between the brain regions of each subject by the method described above. This will be collectively referred to as "functional connectivity" for each area.
- functional connectivity When it is necessary to distinguish functional connectivity for each brain area, a subscript will be added to distinguish it, as described later.
- the MRI apparatus 100. 1 of the first measurement site is described in detail as an example.
- the basic configuration of Ns is similar.
- the MRI apparatus 100.1 includes a magnetic field applying mechanism 11 that applies a controlled magnetic field to a region of interest of the subject 2 to irradiate an RF wave, and a response wave (NMR signal) from the subject 2.
- Receiving coil 20 for receiving and outputting an analog signal
- a drive unit 21 for controlling the magnetic field applied to the subject 2 and for controlling the transmission and reception of RF waves, and a control sequence for the drive unit 21 is set and various types are set.
- a data processing unit 32 that processes a data signal to generate an image.
- the central axis of the cylindrical bore in which the subject 2 is placed is the Z axis
- the X axis is defined in the horizontal direction orthogonal to the Z axis and the Y axis is defined in the vertical direction.
- the static magnetic field applied by the magnetic field applying mechanism 11 causes the nuclear spins of the atomic nuclei constituting the subject 2 to be oriented in the magnetic field direction (Z axis) and Precession about this magnetic field is performed at the Larmor frequency peculiar to the nucleus.
- the atoms forming the subject 2 When the subject 2 is irradiated with an RF pulse having the same Larmor frequency, the atoms forming the subject 2 resonate and absorb energy to be excited, resulting in a nuclear magnetic resonance phenomenon (NMR phenomenon; Nuclear Magnetic Resonance).
- NMR phenomenon nuclear Magnetic Resonance
- the atoms output electromagnetic waves (NMR signals) of the same frequency as the Larmor frequency in the relaxation process of releasing energy and returning to the original steady state.
- the output NMR signal is received by the receiving coil 20 as a response wave from the subject 2, and the data processing unit 32 images the region of interest of the subject 2.
- the magnetic field applying mechanism 11 includes a static magnetic field generating coil 12, a gradient magnetic field generating coil 14, an RF irradiation unit 16, and a bed 18 on which the subject 2 is placed in the bore.
- the subject 2 lays on the bed 18, for example.
- the subject 2 can see the screen displayed on the display 6 installed perpendicularly to the Z axis by the prism glasses 4, for example.
- the image on the display 6 can give a visual stimulus to the subject 2 if necessary.
- the visual stimulus to the subject 2 may be configured such that an image is projected by the projector in front of the subject 2. Such a visual stimulus corresponds to the presentation of feedback information when performing neurofeedback on the subject.
- the drive unit 21 includes a static magnetic field power supply 22, a gradient magnetic field power supply 24, a signal transmission unit 26, a signal reception unit 28, and a bed drive unit 30 that moves the bed 18 to an arbitrary position in the Z-axis direction.
- the data processing unit 32 receives various operations and information input from an operator (not shown), a display unit 38 that displays various images and various information regarding the region of interest of the subject 2 on a screen, and executes various processes.
- a storage unit 36 that stores programs, control parameters, image data (such as a structural image) and other electronic data, and a control unit 42 that controls the operation of each functional unit such as generating a control sequence for driving the drive unit 21.
- An interface section 44 for transmitting and receiving various signals to and from the drive section 21, a data collecting section 46 for collecting data consisting of a group of NMR signals originating in the region of interest, and an image based on the data of the NMR signals.
- an image processing unit 48 for forming a network and a network interface unit 50 for executing communication with a network.
- the data processing unit 32 is not only a dedicated computer but also a general-purpose computer that executes a function for operating each functional unit, and based on a program installed in the storage unit 36, a specified calculation and data are performed. It may be one that causes processing and generation of a control sequence.
- the data processing unit 32 will be described as a general-purpose computer.
- the static magnetic field generating coil 12 is for generating an induction magnetic field by causing a current supplied from the static magnetic field power source 22 to flow in a spiral coil wound around the Z axis to generate a static magnetic field in the Z axis direction in the bore. .
- the region of interest of the subject 2 is set in the region where the static magnetic field formed in this bore is highly uniform.
- the static magnetic field coil 12 is composed of, for example, four air-core coils, and a uniform magnetic field is created inside by the combination thereof, and more specifically, a predetermined atomic nucleus in the body of the subject 2, more specifically, Orients the spin of hydrogen nuclei.
- the gradient magnetic field generating coil 14 includes an X coil, a Y coil, and a Z coil (not shown), and is provided on the inner peripheral surface of the static magnetic field generating coil 12 having a cylindrical shape.
- a shim coil (not shown) is provided to improve the homogeneity of the gradient magnetic field, and "shim adjustment" is performed.
- X-coil, Y-coil, and Z-coil superimpose a gradient magnetic field on the uniform magnetic field in the bore while sequentially switching the X-axis direction, the Y-axis direction, and the Z-axis direction, and give an intensity gradient to the static magnetic field.
- the Z coil when excited, tilts the magnetic field strength in the Z direction to limit the resonance plane, and the Y coil adds a short time tilt immediately after applying the magnetic field in the Z direction to phase-modulate the detection signal in proportion to the Y coordinate. (Phase encoding), and the X coil subsequently adds a gradient during data acquisition to give a frequency modulation proportional to the X coordinate to the detection signal (frequency encoding).
- Switching of the superimposed gradient magnetic field is realized by outputting different pulse signals to the X coil, the Y coil, and the Z coil from the transmission unit 24 according to the control sequence.
- the position of the subject 2 where the NMR phenomenon appears can be specified, and the positional information on the three-dimensional coordinates necessary for forming the image of the subject 2 is given.
- a slice direction, a phase encode direction, and a frequency encode direction are assigned to each, and imaging can be performed from various angles depending on the combination.
- a sagittal slice or a coronal slice orthogonal to the transverse slice and three axes of orthogonal magnetic field gradients in a direction perpendicular to the plane. It is possible to image an oblique slice or the like that is not parallel.
- the RF irradiation unit 16 irradiates an RF (Radio Frequency) pulse to the region of interest of the subject 2 based on the high frequency signal transmitted from the signal transmission unit 33 according to the control sequence.
- RF Radio Frequency
- the RF irradiation unit 16 may be provided on the bed 18 or integrated with the receiving coil 20 to form the transmitting / receiving coil 20. Good.
- the receiving coil 20 is for detecting a response wave (NMR signal) from the subject 2, and is arranged close to the subject 2 in order to detect the NMR signal with high sensitivity.
- NMR signal response wave
- the electromagnetic wave of the NMR signal cuts the coil wire
- a weak current is generated in the receiving coil 20 based on electromagnetic induction.
- This weak current is amplified in the signal receiving unit 28, further converted from an analog signal into a digital signal, and sent to the data processing unit 32.
- a multi-array coil is used to improve the SN ratio.
- the predetermined strength of the magnetic field is in a predetermined resonance condition.
- Nuclei such as hydrogen nuclei are selectively excited and begin to resonate.
- Predetermined atomic nuclei in a portion that matches the resonance condition for example, a slice of the subject 2 having a predetermined thickness
- the spins in the classical image
- the excitation pulse is stopped, the electromagnetic waves emitted by the rotating spins induce a signal in the receiving coil 20, and this signal is detected for a while. With this signal, the tissue in the body of the subject 2 containing predetermined atoms is observed. Then, in order to know the signal transmission position, a signal is detected by applying an X and Y gradient magnetic field.
- the image processing unit 48 measures the detection signal while repeatedly applying the excitation signal based on the data built in the storage unit 36, reduces the frequency of resonance to the X coordinate by the first Fourier transform calculation, and reduces the resonance frequency to the second time.
- the Y-coordinate is restored by the Fourier transform to obtain an image, and the corresponding image is displayed on the display unit 38.
- the BOLD signal described above is imaged in real time by such an MRI system, and the control unit 42 performs an analysis process as will be described later on the images captured in time series, thereby combining the functions at rest. It is possible to perform MRI (rs-fcMRI) imaging.
- the MRI apparatus 100.1 and MRI apparatuses 100.2 to 100 are integrated and stored in the storage device 210 via the communication interface 202 in the data center 200. Further, the calculation processing system 300 is configured to access the data in the storage device 210 via the communication interface 204.
- FIG. 5 is a hardware block diagram of the data processing unit 32.
- the hardware of the data processing unit 32 is not particularly limited, but a general-purpose computer can be used.
- the computer main body 2010 of the data processing unit 32 includes, in addition to the memory drive 2020 and the disk drive 2030, an arithmetic unit (CPU) 2040, a bus 2050 connected to the disk drive 2030 and the memory drive 2020, and boot-up.
- a RAM 2070 connected to a ROM 2060 for storing programs such as programs, for temporarily storing instructions of the application programs and for providing a temporary storage space, and for storing application programs, system programs, and data
- It includes a non-volatile storage device 2080 and a communication interface 2090.
- the communication interface 2090 corresponds to the interface unit 44 for exchanging signals with the drive unit 21 and the like and the network interface 50 for communicating with other computers via a network (not shown).
- a hard disk (HDD) and a solid state drive (SSD: Solid State Drive) can be used as the nonvolatile storage device 2080.
- the nonvolatile storage device 2080 corresponds to the storage unit 36.
- Each function of the data processing unit 32 for example, each function of the control unit 42, the data collecting unit 46, and the image processing unit 48 is realized by the arithmetic processing executed by the CPU 2040 based on the program.
- a program that causes the data processing unit 32 to execute the functions of the above-described embodiments is stored in the CD-ROM 2200 or the memory medium 2210, inserted into the disk drive 2030 or the memory drive 2020, and further stored in the nonvolatile storage device 2080. It may be transferred. The program is loaded into the RAM 2070 when it is executed.
- the data processing unit 32 further includes a keyboard 2100 and a mouse 2110 as input devices, and a display 2120 as an output device.
- the keyboard 2100 and the mouse 2110 correspond to the input unit 40
- the display 2120 corresponds to the display unit 38.
- the program for causing the CPU 2040 to function as the data processing unit 32 as described above does not need to include the operating system (OS) that causes the computer main body 2010 to execute the function of the information processing device or the like.
- This program may include only a part of an instruction that calls an appropriate function (module) in a controlled manner and obtains a desired result. It is well known how the data processing unit 32 operates, and a detailed description thereof will be omitted.
- the computer that executes the program may be a single computer or a plurality of computers. That is, centralized processing or distributed processing may be performed.
- the hardware in the calculation processing system 300 may have a difference in configuration such as an arithmetic processing device being parallelized, a GPGPU (General-purpose computing on-graphics processing unit) being used, etc. The configuration is similar to that shown in FIG.
- the measurement bias includes differences in characteristics of the MRI scanner such as imaging parameters, electric field strength, MRI device manufacturer and scanner type. Sample bias is associated with differences in groups of subjects between sites.
- FIG. 6 is a conceptual diagram for explaining a method of evaluating a difference between sites by a moving subject (hereinafter, “traveling subject”) that receives measurement while moving between sites in the rs-fcMRI method of the present embodiment. .
- traveling subject a moving subject that receives measurement while moving between sites in the rs-fcMRI method of the present embodiment.
- a harmonization method in which only the measurement bias can be removed by using a data set of traveling subjects will be described.
- measurement site MS. 1 to Ms A dataset of traveling subjects TS1 (number of persons: Nts) is acquired to assess measurement bias across Ns sites. Assuming that resting brain activity of healthy Nts participants is imaged at each of the Ns sites, the Ns sites are assumed to include all sites from which patient data was imaged.
- the acquired data set of the traveling subject is stored in the storage device 210 in the data center 200 as mobile subject data. Then, as will be described later, in the calculation processing system 300, the processing for the “brain activity biomarker harmonization method” is executed.
- the dataset of traveling subjects includes only the healthy group. Participants are the same across all sites. Therefore, for traveling subjects, the site-to-site difference consists only of "measurement bias".
- the measurement data at each measurement site is corrected by removing the influence of the “measurement bias”.
- GLM Generalized Linear Model
- link function link function
- linear predictor various types of data can be expressed by specifying how to combine these parts.
- the GLMM Generalized Linear Mixed Model
- GLM Generalized Linear Mixed Model
- the GLMM is a statistical model that can incorporate "individual differences that humans cannot or cannot measure” that cannot be explained by GLM.
- the location difference can be incorporated in the model.
- it is a model in which multiple probability distributions are used as components (mixed).
- bias and factor are generally used for what is called “effect”, and the terms “measurement bias” and “factor” are used for “bias”. Used for “Sample Bias” and “Factor” for other factors (subject factor or disease factor).
- the following analysis analyzes the factors without dividing it into "fixed effect” and "random effect". This is because normally when using GLMM, only the variance is estimated for random effects, and the magnitude of the effect of each factor is unknown. Therefore, in the following, in order to evaluate the magnitude of the effect of each factor, the variables are converted and estimated as follows so that the average fixed effect is 0 for each factor.
- i) Define the measurement bias for each site as the deviation of the correlation value for each functional connectivity from the average across all sites. ii) It is assumed that the sample biases of healthy subjects and patients with mental disorders differ from each other. Therefore, the sample bias of each site is calculated individually for the healthy subject group and the patient group having each disease. iii) Disease factor is defined as the deviation from the value of the healthy group.
- the generalized linear mixed-effects model is applied as follows to the data set containing the patient and the data set of the traveling subject.
- the traveling subject is Nts
- Nsh is the number of sites measured in healthy subjects among Ns measurement sites
- the number of sites measured is Nsh
- patients with a certain disease expressed by the subscript “dis” here
- the number of sites measured is Nsd.
- Participant factor (p), measurement bias (m), sample bias (Shc, Sdis) and mental illness factor (d) are the functions of all participants from the measurement data set and the traveling subject data set for the patient. It is evaluated by fitting a regression model to the correlation value of specific connectivity.
- vectors are denoted by lowercase letters (eg m) and it is assumed that the vectors are all column vectors.
- the elements of the vector are represented by subscripts like m k .
- a regression model of a functional connectivity vector (column vector) consisting of n correlation values between brain regions is expressed as the following formula.
- a 1-of-K binary coding scheme is used to represent the characteristics of the participants, and the target vector (eg, xm) for the measurement bias m belonging to site k is all zero except element k equal to one. equal. If the participant does not belong to any class (healthy, patient, traveling subject), the target vector is a vector in which all elements are equal to 0.
- the superscript T indicates a matrix or vector permutation, and x T indicates a row vector.
- m represents the measurement bias (Ns ⁇ 1 column vector)
- shc represents the sample bias (Nsh ⁇ 1 column vector) of the healthy group
- sdis is the patient sample bias (Nsd ⁇ 1 column vector).
- d is a disease factor (2 ⁇ 1 column vector, healthy and disease are elements
- p is a participant factor (Nts ⁇ 1 column vector)
- const is all Mean functional connectivity across all participants (including healthy subjects, patients, and traveling subjects) from the measurement site
- eN (0, ⁇ ⁇ 1 ) represent noise.
- the least squares regression by L2 normalization is used to evaluate each parameter.
- another evaluation method such as Bayesian estimation method can be used.
- FIG. 7 is a conceptual diagram for explaining the expression of the b-th functional connectivity of the subject a.
- the significance of the target vector of 1 item and 2 items, the measurement bias vector, and the sample bias vector of a healthy subject are shown. The same applies to the third and subsequent items.
- FIG. 8 is a conceptual diagram illustrating a process of generating a discriminator serving as a biomarker from the correlation matrix described in FIG.
- the calculation processing system 300 correlates the activity between the brain regions (between regions of interest) for each subject from the data of the functionally coupled MRI at rest measured in the healthy group and the patient group. Derive the matrix. Subsequently, for the non-diagonal components of the correlation matrix, the corresponding measurement bias is derived as described later, and the measurement bias is subtracted from the value of the element of the correlation row example, thereby performing the harmonization process. . Further, between the element values of the correlation matrix subjected to the harmonization process and the disease label (label indicating disease or health) for each subject, overlearning is suppressed, and a discriminant model with feature selection is calculated. (E.g., perform regularized logistic regression) to generate a discriminator.
- 9 and 10 are functional block diagrams for explaining the configuration of the calculation processing system 300 that executes the harmonization process, the discriminator generation process, and the discrimination process based on the data stored in the storage device 210 of the data center 200. is there.
- the calculation processing system 300 has a hardware configuration equivalent to that shown in FIG. Therefore, in the following, the hardware portion in the calculation processing system 300 will be described by adding “′” to the corresponding reference numeral in FIG. 5.
- the calculation processing system 300 calculates a storage device 2080 ′ for storing data from the storage device 210 and data generated during calculation, and data in the storage device 2080 ′. And an arithmetic unit 2040 ′ that executes processing.
- the arithmetic unit 2040 ' corresponds to, for example, a CPU.
- the arithmetic device 2040 ′ calculates the elements of the correlation matrix for the MRI measurement data 3102 of the patient group and the healthy group by executing the program, and stores the correlation matrix data 3106 in the storage device 2080 ′ as the correlation matrix calculation unit 3002. And a harmonization calculation unit 3020 that executes the harmonization process, and a discrimination processing unit 3000 that executes the discrimination process of the discriminator and the discrimination process by the generated discriminator based on the result of the harmonization process.
- FIG. 10 is a functional block diagram for explaining the configuration of FIG. 9 in more detail
- FIG. 11 is a flowchart for explaining the harmonization process.
- fMRI measurement data of test subjects healthy subjects and patients
- test subject attribute data test subject attribute data
- measurement parameters are collected from each measurement site ( Figure 11 S102).
- the brain activity of the traveling subject TS1 is not particularly limited, for example, it is measured by patrolling each measurement site at a predetermined cycle (for example, a one-year cycle), and the memory 210 of the data center 200 stores the data.
- FMRI measurement data of traveling subjects, subject attribute data, and measurement parameters are collected from each measurement site (FIG. 11, S104).
- the harmonization calculation unit 3020 evaluates the measurement bias of each measurement site for functional connectivity by using the GLMM (generalized linear mixed model) as described above (FIG. 11, S106).
- the harmonization calculation unit 3020 stores the measurement bias of each measurement site calculated in this way in the storage device 2080 as the measurement bias data 3108 (FIG. 11). S108).
- FIG. 12 is a flowchart showing a process in which the discrimination processing unit 3000 shown in FIG. 10 generates a discriminator for a disease or healthy label for a subject.
- a classifier or classifier
- auxiliary information support information
- the correlation value correction processing unit 3004 reads the measurement bias data 3108 for each measurement site stored in the storage device 2080 ′ (S202 in FIG. 12) and performs machine learning for discriminator generation. For the non-diagonal components of the correlation matrix of each subject to be trained for, the harmonization process is executed as in the following equation.
- the functional connectivity Connectivity represents the functional connectivity vector before harmonization
- Csub represents the functional connectivity vector after harmonization
- m (hat) (hereinafter, a character x with a ⁇ attached to the head thereof is referred to as “x (hat)”) is a measurement evaluated by the least-squares regression by the L2 normalization as described above. Represents the measurement bias at the site. As a result, the measurement bias corresponding to the measurement site where the functional connectivity is measured is subtracted from the functional connectivity and subjected to the harmonization process (FIG. 12). S204).
- the data after the correction processing is stored as the corrected correlation value data 3110 in the storage device 2080 ′.
- Known Document 9 Yahata N, et al. A small number of abnormal brain connections predicts adult autism spectrum disorder. Nat Commun 7, 11254 (2016). Then, subsequently, the discriminator generation unit 3008 executes regularized logistic regression for feature selection on the disease label of the subject including the disease / health label of the subject and the functional connectivity after the correction process. A discriminator is generated (S206 in FIG. 12).
- the logistic function is used to define the probability that a participant will belong to a disease class as follows.
- the weight vector w is determined so as to minimize the following function J.
- nsub is the number of subjects for generating the discriminator
- ⁇ represents a hyperparameter that controls the reduction amount applied to the evaluation.
- the method for suppressing the over-learning and executing the feature selection and the modeling is not limited to the regularized logistic regression by LASSO, and for example, the sparse logistic disclosed in the following documents. Other techniques may be used, such as regression or other Sparse Bayesian estimation methods.
- the entire disclosure of the following Document 10 is incorporated herein by reference.
- a discriminator (which functions as a brain activity biomarker classifier) for a disease is generated, and the discriminator generation unit 3008 stores information for identifying the discriminator in the storage device 2080 ′ as discriminator data 3112. Store (S208 in FIG. 12).
- the classification performance of a discriminator can be evaluated by a cross-validation procedure using training data.
- the above process is not particularly limited, but may be performed every predetermined period (for example, one year).
- the measurement bias of the measurement site can be assumed to be constant for a predetermined period.
- the unit 3010 subtracts the “measurement bias” corresponding to the measurement site at which the input data has already been calculated by the above-described procedure from the values of the elements of the correlation matrix of the input data of the input subject. By doing so, the harmonization process is executed. Then, by the above-mentioned procedure, the “discriminator” already created in the procedure of FIG. 12 outputs the discrimination label for the subject as the discrimination result.
- the discrimination result may be a value indicating either of “disease” and “healthy”, or may be a value indicating the probability of at least one of “disease” and “healthy”.
- the “input data” that is input may be the MRI measurement data itself representing the brain functional activity of the subject, or the subject's MRI measurement data at each measurement site. It may be data of the correlation value itself which is a non-diagonal element of the correlation matrix after calculating the value of the correlation matrix from the MRI measurement data representing the brain functional activity.
- FIG. 13 is a conceptual diagram for explaining the harmonization process when a new measurement site is added after the harmonization process is executed by the procedure described in FIG. 13, the (Ns + 1) th measurement site MS.
- Ns + 1 When Ns + 1 is newly added, the traveling subject TS1 is circulated again for all of the (Ns + 1) measurement sites, and the procedure similar to the above-described harmonization calculation process is performed to calculate the measurement bias again. Is possible.
- the system that executes the processing as in the first embodiment, in order to objectively judge the health or disease state by harmonizing the measurement data of the brain activity measured at a plurality of facilities. It is possible to realize the harmonization method of the brain activity classifier, the harmonization system of the brain activity classifier, the brain activity analysis system, and the brain activity analysis method capable of providing the data of 1.
- the biomarker based on the brain function imaging method for the nerve / mental illness is measured with respect to the measurement data of the brain activity measured at a plurality of facilities. It becomes possible to realize the program of the device and the biomarker device.
- Participant factor (p), measurement bias (m) are evaluated by fitting a regression model to the correlation value of functional connectivity of all participants from the traveling subject dataset.
- vectors are denoted by lowercase letters (eg, m) and all vectors are assumed to be column vectors.
- the elements of the vector are represented by subscripts like m k .
- a regression model of a functional connectivity vector (column vector) consisting of n correlation values between brain regions is expressed as the following formula.
- a 1-of-K binary coding scheme is used to represent the characteristics of the participants, and the target vector (eg, xm) for the measurement bias m belonging to site k is all zero except element k equal to one. equal.
- the superscript T indicates the transpose of a matrix or vector, and x T indicates the row vector.
- the difference between the method of the first embodiment and the method of the modified example of the first embodiment is that when only the traveling subject is used as in the method of the modified example of the first embodiment. Has the advantage that sample bias does not have to be taken into consideration.
- including both patient data and healthy subject data as in the method of the first embodiment is advantageous in that the number of data used for estimation increases. Therefore, it can be said that there is a trade-off relationship between the improvement of the estimation accuracy of the measurement bias without considering the sample bias and the improvement of the estimation accuracy of the measurement bias due to the large number of data.
- each measurement site may be allocated, and each measurement site may randomly extract the data for the number of participants.
- FIG. 14 is a conceptual diagram showing the data of the multi-disease database and the data set of the traveling subject used for the harmonization process. As shown in Fig. 14 (a), it is published as a multi-disease database (https://bicr-resource.atr.jp/decnefpro/) in Strategic Research Program for Brain Sciences (SRPBS) for brain science. The existing data is used for the patient group and the healthy group.
- SRPBS Strategic Research Program for Brain Sciences
- the data measured at a plurality of measurement sites is the difference between sites, and the sampling bias for patients with mental illness is used. And a sampling bias and a measurement bias for a healthy person.
- FIG. 14 (b) as a data set for the traveling subject, data measured at a plurality of measurement sites (in FIG. 14, site 1, site 2, and site 3 are typically shown) is , Only the measurement bias is included as the difference between the sites.
- Site-by-site differences can be divided into measurement and sample biases by simultaneous analysis of datasets, and their effect sizes on resting functional connectivity compared quantitatively with those of mental illness.
- sample bias the magnitude of the effect was quantitatively compared with respect to different imaging parameters, MRI device manufacturers, and the number of receiving coils in each MRI scanner.
- sample bias the underlying "sample bias" of the mechanism: The first hypothesis assumes that each site samples subjects from a common population. In this situation, sample bias will arise due to randomization of the subjects, which results in random differences in patient characteristics between sites.
- atypical depression may occur more frequently in Site A patients, while melancholic depression may occur more frequently in Site B patients.
- a regression model of subject information (eg, age) and a biomarker for mental illness were constructed based on resting function-coupled MRI data of multiple sites harmonized by the newly proposed method and existing method.
- FIG. 15 is a diagram showing the contents of the SRPBS multi-disease data set.
- This dataset which included 5 different diseased patients and a healthy control group (HC) examined at 9 sites, contained data for a total of 805 participants: 482 from 9 sites. Healthy subjects; 161 major depression (MDD) patients from 5 sites; 49 autism (ASD) patients from 1 site; 65 obsessive-compulsive disorder (OCD) from 1 site ) Patients; and 48 schizophrenia (SCZ) patients from 3 sites.
- MDD major depression
- ASD autism
- OCD obsessive-compulsive disorder
- SCZ schizophrenia
- FIG. 16 is a diagram showing an imaging protocol at each measurement site. Resting functional MRI data was obtained using a unified imaging protocol at all but three sites. (Http://www.cns.atr.jp/rs-fmri-protocol-2/)
- ATT Siemens Tim Trio Scanner at International Telecommunications Research Institute
- ATV Siemens Verio Scanner from International Telecommunications Research Institute
- KUT Siemens Tim Trio scanner from Kyoto University
- SWA Showa University
- HUH Hiroshima University Hospital
- HKH Hiroshima Kajikawa Hospital
- COI COI (Hiroshima University)
- KPM Kyoto Prefectural University of Medicine
- UTO The University of Tokyo
- ASD Autism disorder.
- MDD Major depressive disorder
- OCD Obsessive-compulsive disorder.
- SCZ Schizophrenia SIE: Siemens fMRI machine.
- GE GE fMRI device.
- PHI Philips fMRI machine.
- traveling subject dataset A dataset of traveling subjects was acquired to assess measurement bias across the measurement sites in the SRPBS dataset.
- the principal component analysis here corresponds to a dimension reduction method by unsupervised learning.
- the functional connectivity of the subject is, as described above, dependent on the blood oxygen concentration (BOLD) signal temporal correlation of the functional MRI at rest between the two brain regions for each participant (Pearson). (Using the correlation coefficient of the above).
- -Functional connectivity is defined based on a functional brain map consisting of 268 nodes (that is, brain regions) covering the entire brain.
- connection strength of 35,778 that is, (268 x 267) / 2) of the lower triangular matrix of the matrix showing the correlation of the functional connection is used.
- the HUH site was clearly separated from the main component 1, which explained most of the variance in the data.
- Patients with ASD were only scanned at the SWA site. Therefore, the averages of ASD ( ⁇ ) patients and healthy group HC ( ⁇ ) scanned at this site are plotted at almost the same position.
- FIG. 17 dimension reduction by PCA in a multi-disease dataset is shown.
- measurement bias for each site was defined as the deviation of the correlation value for each functional connectivity from the average across all sites.
- sample bias for each site was calculated individually for the healthy subject group and the patient group having each disease.
- the disease factor was defined as the deviation from the value of the healthy group. Specimen bias was assessed for MDD and SCZ patients because it was a group of patients sampled at multiple sites. Disease factors were evaluated for MDD, SCZ and ASD as no patients with OCD were scanned using the Unified Protocol. Since the two types of bias between sites change simultaneously, it is difficult to separate intersite differences into measurement bias and sampling using only the SRPBS multiple disease dataset.
- Linear mixed-effects model for SRPBS multiple disease dataset the correlation value of connectivity for each subject in the SRPBS multi-disease dataset consists of fixed and random effects.
- Fixed effects include the mean correlation value across all participants and all sites as a baseline, plus measurement bias, sample bias and disease factors. The combined effects of participant factors (ie individual differences) and changes between scans are considered random effects.
- Participant factor (p), measurement bias (m), sample bias (shc, smdd, sscz) and mental illness factor (d) are for all participants from the SRPBS multiple disease dataset and the traveling subject dataset. It was evaluated by fitting a regression model to the correlation value of functional connectivity.
- the vectors are shown in lowercase bold (eg, m) and all vectors are assumed to be column vectors.
- the elements of the vector are represented by subscripts like m k .
- the target vector (eg, xm) for the measurement bias m belonging to site k is an element equal to 1. All except k are equal to zero. Therefore, if the participants do not belong to any class, the target vector is a vector with all elements equal to 0.
- the superscript T indicates the transpose of a matrix or vector, and x T indicates the row vector.
- regression model For each connectivity, the regression model can be written as:
- m represents the measurement bias (12 sites x 1)
- shc represents the sample bias of the healthy group (6 sites x 1)
- smdd represents the sample bias of the MDD patient (3 sites x 1).
- Sscz represents the sample bias of SCZ patients (3 sites ⁇ 1)
- d represents the disease factor (3 diseases ⁇ 1)
- p represents the participant factor (9 traveling subjects of 1 ⁇ 1)
- const represents the average of functional connectivity across all participants from all sites
- eN (0, ⁇ ⁇ 1 ) represents noise.
- Linear mixed-effects model for the traveling subject dataset In the linear mixed-effects model for the traveling subject dataset, the correlation value of each participant's connectivity to a particular scan in the traveling subject dataset consists of a fixed effect and a random effect. Fixed effects include the sum of average correlation values across all participants and all sites, participant factors and measurement bias. Changes between scans were considered random effects.
- participant factor was defined as the deviation of the correlation value of brain function connectivity from the average across all participants.
- each bias or each factor was evaluated as a vector including a dimension that reflects the number of connectivity correlation values (that is, 35,778).
- Vectors included in this further analysis include measurement bias at 12 sites, sample bias for HC at 6 sites, sample bias for MDD patients at 3 sites, and sample bias for SCZ patients at 3 sites. And the participant factors of 9 traveling subjects and the factors of diagnosis of MDD, SCZ and ASD.
- the contribution size of the measurement bias (ie the first term) was calculated as follows.
- Nm represents the number of elements of each factor
- N represents the number of connectivity
- Ns represents the number of subjects
- Contribution size m represents the size of the contribution size of the measurement bias.
- measurement bias is a significant limitation in studies on mental illness.
- the largest variance in sample bias was significantly larger than the MDD factor variance, and the smallest variance in sample bias was one-half the variance for disease factors. This suggests that sample bias may also be a significant limitation in studies on mental illness.
- the standard deviation of participant factors was about twice the standard deviation for disease factors of SCZ, MDD, and ASD. Thus, individual variability within the healthy population was greater than among SCZ, MDD, and ASD patients when considering all functional connections.
- the standard deviation of the measurement bias was usually greater than the standard deviation of the disease factor, while the standard deviation of the sampling bias was comparable to the standard deviation of the disease factor.
- FIG. 18 is a dendrogram by the hierarchical clustering analysis. The height of each linkage in the dendrogram represents the dissimilarity (1-r) between the clusters connected by that link.
- the similarity of the measured measurement bias vectors to the 12 sites was determined by identifying the MRI scanner such as phase encoding direction, MRI manufacturer, coil type and scanner type. It was investigated whether it reflects the characteristics of.
- Hierarchical cluster analysis was used to discover similar patterns of clusters to measurement bias. As a result, as shown in FIG. 18, the measurement bias of the 12 sites was divided into clusters in the direction of phase encoding at the first level. The measurement bias was divided at a second level into fMRI maker clusters, further into coil type clusters, and then into scanner model clusters.
- FIG. 19 is a diagram showing the contribution size for each factor. As shown in FIG. 19, in order to evaluate the contribution of each factor, the same model was used to quantitatively confirm the relationship between the sizes of the factors.
- Contribution size was the largest in the phase encoding direction (0.0391), followed by fMRI maker (0.0318), coil type (0.0239) and scanner model (0.0152). These show that the main factor affecting the measurement bias is the phase encoding direction followed by the difference in fMRI maker, coil type and scanner model.
- FIG. 20 is a conceptual diagram showing the mechanism behind “sample bias”.
- the “single population model” shown in FIG. 20 (A) assumes that participants are sampled from a common population.
- the functional connectivity correlation value for each participant is generated from a Gaussian distribution.
- the “model of different subpopulations” shown in FIG. 20B it is assumed that the sample bias is caused, in part, by participants being sampled from different subpopulations at each site.
- the mean of the subpopulations varies between sites and is generated from a Gaussian distribution.
- the functional connectivity correlation value for each participant is generated from a Gaussian distribution based on the average of the subpopulations at each site.
- the models each represent a different relationship between the number of participants and the variance of the sample bias. Therefore, by comparing the modified Akaike information criterion (AICc) with the Bayesian information criterion (BIC), we investigated which model represented the actual relationship in this data. In addition, one-site cross-validation was performed on the predictive performance of using all but one site for model generation and predicting the variance of the sample bias for the remaining sites with that model. Then, the prediction performance between the two models was compared.
- AICc modified Akaike information criterion
- BIC Bayesian information criterion
- sampling bias is not only brought about by random sampling from a single large population, but also caused by sampling from different subpopulations.
- Sampling bias is a major limitation when trying to evaluate a true single distribution of healthy control or patient data based on measurements taken from a finite number of sites and participants. It means that.
- phase encode factor (pa q ) is included in the equation separately from the measurement bias.
- Measurement bias and phase encoding factors were evaluated by fitting a regression model to the combined SRPBS multiple disease dataset and traveling subject dataset.
- the regression model is as follows.
- pa represents a phase encoding factor (two phase encoding directions ⁇ 1).
- Each functional parameter was evaluated by performing a normalization with least squares regression with normal LS normalization on the correlation value of each functional connectivity.
- the site differences were removed by subtracting the evaluated site differences and the phase encoding factor.
- the correlation value of the functional connectivity with the sample bias harmonized is as follows.
- m represents the evaluated measurement bias
- pa (hat) represents the evaluated phase encoding factor
- FIG. 21 is a diagram visualizing the influence of the harmonization process and is a diagram to be compared with FIG. In FIG. 21, the data were plotted after removing only the measurement bias from the SRPBS multi-disease data set.
- FIG. 17 reflects the data before the harmonization, and in comparison with the data shown in FIG. 17, in FIG. 21, the HUH site is closer to the origin side (that is, the average of the population), It's moved a lot, and it's no longer so far away from other sites.
- results shown in FIG. 21 indicate that the separation of HUH sites as seen in FIG. 17 is caused by the measurement bias, which can be removed by harmonization.
- harmonization was also effective in distinguishing between patients and healthy subjects who were scanned at the same site. Since ASD patients were only scanned at the SWA site, the averages of ASD patients (A) and healthy controls (O) scanned at this site are plotted in Figure 17 at almost the same location. However, the two symbols are clearly separated from each other in FIG. In the first two PCs without harmonization, it was not possible to observe the effect of mental illness (ASD), which means that removal of the measurement bias made it possible to detect.
- ASSD mental illness
- the measurement bias was evaluated separately from the sample bias by combining the dataset of traveling subjects (ie, the method of traveling subjects) with the multi-disease dataset of SRPBS using a linear mixed-effects model .
- FIG. 22 is a diagram showing the classification performance of the classifier for MDD.
- FIG. 23 is a diagram showing the classification performance of the classifier for SCZ.
- the classifier generation procedure was repeated 100 times (that is, re-sampling) to ensure that all the participants' data were used. This is so that it can be said that the average value of the classifier performance indicates the classifier performance in the training data set.
- the probability that the diagnostic label indicates a disease exceeds 0.5 is considered to provide auxiliary information (support information) for diagnosing that the subject has a mental illness.
- the distribution of the probability of the diagnostic assistance information in the training data set clearly separates the mentally ill patient from the healthy by a threshold value of 0.5. Became clear (center line in each graph).
- the probability distribution of the diagnostic assistance information in the independent cohorts is 0.5 for the traveling subject method and the ComBat method only. It has been clarified that the threshold value of 1 separates the patient with mental illness from the healthy group.
- FIG. 24 is a diagram showing the performance of the MDD classifier with respect to the independent cohort.
- FIG. 25 shows the performance of the SCZ classifier for the independent cohort. The generalization to an independent cohort was considered directly without retuning the classifier.
- the classifier output is defined as the probability that a participant has been classified into the MDD or SCZ class.
- the area under the ROC curve (AUC: area under thecurve) for the Matthews correlation coefficients (MCC), ROC curve (ReceiverOperatorating Characteristic curve, receiver operating characteristic curve), Accuracy, Sensitivity, and Specificity were used.
- Traveling Subject method harmonizes only measurement biases, so this method outperformed other conventional GLM-based harmonization methods for classifiers and regression models.
- Machine learning techniques were applied to all functional connectivity data from a group of healthy people (425 healthy people from 9 sites) data were used to build each regression model. Linear regression was applied using the LASSO method to select the optimal subset of functional connectivity out of a total of 35,778 connectivity. Predictive performance was evaluated in the training data set using a 10-fold cross validation procedure.
- the generalization performance of the model was investigated in part using a fully independent validation cohort dataset obtained from ATR TimTrio, ATR Verio and ATR Prisma sites (223 HCs). Generalization to an independent cohort was considered without retuning the model.
- FIG. 26 and 27 are scatter plots of actual age and predicted age in an independent cohort.
- the solid line shows the linear regression of the actual age from the predicted age.
- the average absolute error (MAE: Mean Absolute Error) and the correlation coefficient (r) are shown in each graph. Each data point represents one participant.
- FIG. 26A shows the result for the traveling subject method
- FIG. 26B shows the result for the ComBat method.
- FIG. 27 (A) shows the results for the GLM method
- FIG. 27 (B) shows the results for the adjusted GLM method
- FIG. 27 (C) shows the raw data as is method (ie, the data is harmonized across sites). Result).
- the traveling subject method is universally applicable to more attribute classifications from the viewpoint of generalization performance, as a harmonization method for measurement data at multiple facilities, compared to other methods. In that respect, it can be said that this is an excellent method.
- a brain activity measuring device measures brain activity data measured at a plurality of measurement locations, and based on this brain activity data, generation of biomarkers and diagnosis by biomarkers.
- fMRI device a brain activity measuring device
- FIG. 28 is a functional block diagram showing an example of a case where data collection, estimation processing, and brain activity measurement of a subject are distributed and processed.
- N is a facility for measuring the data of the patient group and the healthy subject group by the brain activity measuring device, and the management server 200 ′ manages the sites 100.1-100. Manage the measurement data from Ns.
- the calculation processing system 300 generates a discriminator from the data stored in the server 200 ′.
- harmonization calculation unit 3020 of the calculation processing system 300 is used for the sites 100.1 to 100. Harmonization processing is executed including the sites of the Ns and MRI measurement device 410.
- the MRI device 410 is provided at another site that uses the result of the discriminator on the calculation processing system 300, and measures brain activity data for a specific subject.
- the computer 400 is installed at another site where the MRI apparatus 410 is installed, calculates the correlation data of the functional coupling of the brain of the specific subject from the measurement data of the MRI apparatus 410, and transmits the correlation data of the functional coupling to the calculation processing system 300. Then, the result of the discriminator returned is used.
- the server 200 ' is the site 100.1-100.
- the MRI measurement data 3102 of the patient group and the healthy subject group transmitted from Ns, and the human attribute information 3104 of the subject associated with the MRI measurement data 3102 are stored, and these are stored according to the access from the calculation processing system 300.
- the data is transmitted to the calculation processing system 300.
- the calculation processing system 300 receives the MRI measurement data 3102 and the human attribute information 3104 of the subject from the server 200 via the communication interface 2090.
- the hardware configurations of the server 200 ′, the calculation processing system 300, and the computer 400 are basically the same as the configuration of the “data processing unit 32” described in FIG. 5, so the description thereof will not be repeated.
- the correlation matrix calculation unit 3002 the correlation value correction processing unit 3004, the discriminator generation unit 3008, the discrimination value calculation unit 3010, and the correlation matrix data 3106, the measurement bias data 3108, and the corrected correlations of the functional combination.
- the value data 3110 and the discriminator data 3112 are the same as those described in the first embodiment, and therefore the description thereof will not be repeated.
- the MRI apparatus 410 measures brain activity data of a subject who is an estimation target of a diagnostic label, and the processing apparatus 4040 of the computer 400 stores the measured MRI measurement data 4102 in the non-volatile storage device 4100.
- the processing device 4040 of the computer 400 calculates the function coupling correlation matrix data 4106 based on the MRI measurement data 4102 in the same manner as the correlation matrix calculation unit 3002, and stores it in the non-volatile storage device 4100.
- the user of the computer 400 designates a disease to be diagnosed, and the computer 400 transmits the data 4106 of the correlation matrix of the functional coupling to the calculation processing system 300 according to the transmission instruction of the user.
- the calculation processing system 300 executes the harmonization processing corresponding to the site where the MRI apparatus 410 is installed.
- the discriminant value calculation unit 3010 calculates the discriminant result for the designated diagnostic label.
- the calculation processing system 300 transmits the determination result to the computer 400 via the communication interface 2090.
- the computer 400 informs the user of the determination result via a display device or the like (not shown).
- server 200 and the calculation processing system 300 may be managed by separate administrators. In that case, by limiting the computers that can access the server 200, it is possible to improve the security of the subject information stored in the server 200.
- real-time fMRI is used as the brain activity detection device for measuring brain activity in time series by the brain functional imaging method.
- the above-mentioned fMRI, magnetoencephalograph, near-infrared light measuring device (NIRS), electroencephalograph, or a combination thereof can be used as the brain activity detecting device.
- fMRI and NIRS detect signals related to changes in blood flow in the brain and have high spatial resolution.
- the magnetoencephalograph and the electroencephalograph are characterized by high temporal resolution because they detect changes in the electromagnetic field associated with brain activity.
- brain activity can be measured with high resolution spatially and temporally.
- a magnetoencephalograph even if the NIRS and the electroencephalograph are combined, it is also possible to configure a system that measures brain activity with high resolution spatially and temporally in a small and portable size.
- the discriminator in the case where the "diagnosis label" is included as the attribute of the subject, an example in which the discriminator is made to function as a biomarker by machine learning is generated.
- the present invention is not necessarily limited to such cases.
- a group of subjects for which measurement results to be machine learning targets are obtained in advance is divided into multiple classes by an objective method, and the correlation (coupling) between the brain areas (regions of interest) of the subjects is combined. ) Is measured, and a classifier for the class can be generated by machine learning on the measurement result, the classifier may be used for other discrimination.
- such discrimination may display the possibility of belonging to a certain attribute as a probability.
- the device according to the present embodiment can be used as a device for health management of the user in addition to the diagnosis support.
- FIG. 29 shows a traveling method of a traveling subject according to the third embodiment.
- the traveling subject TS1 is patroling the "base measurement sites MS.1 to MS.Ns" serving as bases.
- Base measurement site MS. 2 is under control of MS2.1 to MS2. Let n be present.
- This site measurement site MS. When “measurement site MS.2.n + 1” is newly added under the subordinate 2, the traveling subject TS2 circulates within the subordinate range. The same applies to other site measurement sites.
- the measurement bias of the measurement site MS.2 is fixed to the value evaluated by the traveling subject TS1. 2, MS2.1, MS2. n, MS2. It is also possible to adopt a configuration in which the measurement bias is determined for n + 1 based on the measurement result that the traveling subject TS2 has traveled.
- the “base measurement sites MS.1 to MS.Ns” exist in predetermined areas, and 1 in each area such as Hokkaido, Tohoku, Kanto, ..., Kansai, ... Kyushu in Japan. It is possible to set up each site, and the subordinate site may be, for example, a measurement site located in one Kansai region.
- the “base measurement sites MS.1 to MS.Ns” may be defined for each model of a predetermined MRI apparatus.
- the subordinate measurement site is a measurement site in which the same model of the MRI device as the base site is installed.
- the “base measurement sites MS.1 to MS.Ns” may be set for each predetermined area and for each predetermined model of the MRI apparatus.
- the subordinate measurement site is a measurement site in which the same model of the MRI apparatus is installed in the same area as the base site.
- a major depressive disorder that is, a group of patients who have been diagnosed by the doctor as a major depressive disorder by a conventional symptom-based diagnostic method to generate a classifier.
- a major depressive disorder that is, a group of patients who have been diagnosed by the doctor as a major depressive disorder by a conventional symptom-based diagnostic method to generate a classifier.
- the following describes the procedure to build an MDD classifier that distinguishes between healthy group (HC) and MDD patients based on functionally coupled FC.
- HC healthy group
- FC functionally coupled FC
- the Beck Depression Self-rating Scale (BDI) II is one of the most widely used tests for measuring the severity of depressive symptoms. Then, consider which functionally coupled FCs are important to identify FCs associated with the syndrome of depression for regression models. In addition, a resting functional joint FC common between functional joint FC associated with MDD diagnosis and functional symptoms associated with symptoms of depression is considered.
- FIG. 30 is a diagram showing the demographic characteristics of such a learning data set (first data set).
- the first data set is the data in SRPBS described above.
- FIG. 31 is a diagram showing the demographic characteristics of the independent verification data set (second data set).
- the second data set is also basically the data in the SRPBS described above.
- the following analysis uses the following two resting functional MRI (rs-fMRI) datasets (1) As shown in FIG. 30, the first dataset is data for 713 participants. (Health group HC of 564 from 4 sites, HC group of 149 MDD from 3 sites). (2) As shown in FIG. 31, the second data set contains data for 449 participants (264 healthy group HC from 4 sites, 185 MDD from 4 sites). Patient group).
- rs-fMRI resting functional MRI
- BDI Beck Depression Inventory
- Participant measurements are performed in a single resting functional MRI (rs-fMRI) session of 10 minutes each.
- “Demographic characteristics” in the data set are characteristics used in so-called “demographics”, and include attributes in the table, such as age, gender, etc., as well as diagnosis names. 30 and 31, the number in parentheses indicates the number of participants having the BDI score data. The demographic distribution is consistent between MDD and HC populations (p> 0.05) in all training datasets.
- the second data set is an "independent validation data set" and is used to test the MDD classifier and BDI regression model.
- the site for which imaging was performed on the second data set is not included in the first data set.
- Pre-processing steps include slice timing calibration, rear-line processing to correct body movement artifacts seen on the head, co-registration of brain functional images (EPI images) and morphological images, and distortion correction. , T1-weighted structural image segmentation, normalization to the Montreal Institute of Neurology (MNI) space, and smoothing of the space with an isotropic Gaussian kernel with a half-width of 6 mm.
- MNI Montreal Institute of Neurology
- HCP Human Connectome Project
- the temporal change of the BOLD signal is extracted from these 379 regions of interest (ROI).
- Known Document 15 Behzadi, Y., Restom, K., Liau, J., and Liu, TT (2007).
- Linear regression with regression parameters such as 6 motor parameters, whole brain, is used to remove some spurious sources (extra signal sources).
- Temporal filtering A temporal bandpass filter was applied to the time series data using a Butterworth filter with a passband between 0.01 Hz and 0.08 Hz to analyze low frequency fluctuations characteristic of BOLD activity. Is limited.
- FD frame-wise displacement
- FD represents the head movement between two volumes that are temporally continuous as a scalar quantity (that is, the sum of the absolute displacement in translation and rotation).
- FC functional coupling
- the traveling subject harmonization method for the learning data set as described in the first to third embodiments is used. To do.
- the harmonization method is not limited to this method, and other methods such as the above-described ComBat method may be used.
- a biomarker for MDD is constructed using the training dataset as described above as training data for the classifier. It is based on the value of the functionally bound FC of 71,631 and the healthy group (the population of the diagnostic label with healthy (HC)) and the MDD patient group (the population of the diagnostic label with major depressive disorder). It is to identify.
- FIG. 32 is a flowchart for explaining a machine learning procedure for generating such a classifier.
- MDD classifier a logistic regression analysis (sparse) by L1 regularization (LASSO: least absolute shrinkage and selectionoperator).
- L1 regularization LASSO: least absolute shrinkage and selectionoperator.
- the method of sparse modeling is not limited to such a method, and as will be described later, a variational Bayes method or a sparse logistic regression (SLR: Sparse Logistic Regression) in which the variational Bayes method is applied to logistic regression. It is also possible to use other methods such as using.
- SLR Sparse Logistic Regression
- the learning process for the MDD classifier is started (S100)
- the learning data set prepared in advance stored in the storage device 2080 ′
- the correlation matrix calculation unit is used. 3002 calculates the components of the binding matrix.
- the harmonization calculation unit 3020 calculates the measurement bias and carries out the harmonization process (S104).
- the harmonization process is preferably a method using a traveling subject, but may be another method.
- the discriminator generation unit 3008 generates MDD classifiers by modifying the so-called “Nested Cross Validation” method for the learning data.
- the discriminator generation unit 3008 sets one partial data set out of K divisions (10 divisions) as a “test data set” for verification, and the remaining (K ⁇ 1) division (9 divisions) of data. Is set as a training data set (training data set) (S108, S110).
- the discriminator generation unit 3008 executes an undersampling process and a subsampling process on the training data set (S112).
- the "undersampling process” is to adjust the number of data corresponding to the specific attribute data (two or more types) to be classified in the training data set, in order to adjust the number. It means processing to make the number the same, excluding the data of the attribute with the larger number.
- processing for aligning them is performed.
- sub-sampling process means a process of randomly extracting a predetermined number of samples from the training data set. That is, in the cross-validation that is repeated K times via steps S108 to S118 and S122, in each cross-validation, since the training data set is imbalanced with respect to the numbers of MDD patients and healthy subjects HC, a classifier is constructed. And a predetermined number of, for example, 130 MDD patients and the same number of 130 healthy subjects are randomly sampled from the training data set.
- the discriminator generation unit 3008 executes hyperparameter adjustment processing on each of the subsampled subsamples 1 to 10 (S114.1 to S114.10).
- a classifier sub-model is generated by using the following logistic function.
- logistic function is used in the sub-sample to define the possibility of participants belonging to the MDD class as follows.
- c sub represents the FC vector for the given participant
- w represents the weight vector.
- the weight vector w is determined so as to minimize the following evaluation function (cost function) (LASSO calculation).
- the sum (L1 norm) of the absolute values (first order) of each element of the weight vector exists as the second term in the cost function.
- ⁇ represents a hyper parameter and controls the amount of shrinkage applied to the evaluation.
- the discriminator generation unit 3008 is not particularly limited, but for example, assuming that the hyperparameter ⁇ is 0 ⁇ ⁇ 1.0, this section is divided into P equal parts (P: natural number), for example, 25 equal parts.
- the weight vector w is determined by the above-mentioned LASSO calculation using ⁇ of each value.
- cross-validation of nested structure is performed, and hyperparameter adjustment is performed as “inner cross-validation”. Inner cross-validation does not use the outer cross-validation “test dataset”.
- the discriminator generation unit 3008 compares the discrimination performance of the hyperparameter adjustment data with the generated logistic function corresponding to each value of ⁇ , and determines the logistic function corresponding to ⁇ having the highest discrimination performance. Yes (hyperparameter adjustment process).
- the discriminator generation unit 3008 sets the “classifier submodel” as the one that outputs the average of the output values of the logistic function corresponding to each subsample generated in the current cross-validation loop ( S116).
- the discriminator generation unit 3008 receives the test data set prepared in step S110 as an input and executes verification of the classifier submodel generated in the current cross-validation loop (S118).
- the LASSO method and hyperparameter adjustment described above are used.
- other sparse modeling methods may be used.
- the discriminator generation unit 3008 determines that the cross-validation loop has not been completed K times (here, 10 times) (N in S122), it is determined that the data has been used in the loop up to that time in the K-divided data. Sets another different partial data set to the test data set, sets the remaining partial data set to the training data set (S108, S110), and repeats the process.
- the discriminator generation unit 3008 sets K ⁇ M (10 ⁇ in this case) input data.
- MCC Matthews correlation coefficients
- ROC curve Receiveiver Operating Characteristic curve, receiver operating characteristic curve
- AUC Area under the ROC curve
- accuracy Sensitivity
- specificity Specificity
- the method of generating a classifier of a target disease (for example, MDD) using the feature amount (in this case, the element of the correlation matrix after the harmonization process for the measurement bias) selected in each sub-sample is Not only by averaging the output of multiple classifier sub-models like this, but using other modeling methods, especially other sparse modeling methods, for the classifier for the selected feature quantity It may be configured to.
- FIG. 33 is a diagram showing MDD prediction performance (probability distribution of output) for a learning data set for all imaging sites.
- the probability distribution of the two diagnoses corresponding to the MDD patient and healthy population at the output from the classifier model, with a threshold of 0.5, is clearly the right (MDD ) And left (HC).
- the classifier model separates MDD patients from the HC population with 66% accuracy.
- the corresponding AUC was 0.77, indicating high discriminating power.
- the MCC is about 0.33.
- FIG. 34 is a diagram showing the MDD prediction performance (probability distribution of the output of the classifier) for the learning data set for each imaging site. From FIG. 34, it can be seen that almost the same high classification accuracy is achieved not only for the entire dataset but also for the individual datasets of the three imaging sites (Site 1, Site 2, Site 4).
- FIG. 35 is a diagram showing a probability distribution of the output of the MDD classifier in the independent verification data set. That is, the independent validation data set is used to test the generalization performance of the classifier model.
- the classifier model generated with an accuracy of about 70% separates the MDD population from the HC population.
- the corresponding AUC was 0.75, indicating high discriminative ability (permutation test p ⁇ 0.01).
- a threshold of 0.5 clearly indicates that at the output from the classifier model, the probability distributions of the two diagnoses corresponding to the MDD patient and healthy population are right (MDD). ) And left (HC). The sensitivity is 68% and the specificity is 71%. This is a high MCC value of 0.38 (permutation test p ⁇ 0.01).
- FIG. 36 is a diagram showing the probability distribution of the output of the MDD classifier for the independent verification data set for each imaging site. It can be seen that a high classification accuracy is achieved not only for the entire dataset of the four imaging sites, but also for the individual datasets.
- the procedure of configuring the MDD classifier after the harmonization process is not necessarily limited to such a procedure.
- the procedure of “sparse modeling” disclosed in the following Documents 16 or 17 An MDD classifier corresponding to the "diagnostic label" may be generated.
- the entire disclosures of publications 16 and 17 are hereby incorporated by reference.
- Known Document 16 Patent No. 6341513
- Known Document 17 Patent No. 6195329
- a correlation matrix of activity between predetermined brain regions is derived from data of resting functional connectivity MRI measured in a healthy group and a patient group.
- the element of the correlation row example connected to the canonical variable corresponding to only the diagnostic label is extracted by regularization canonical correlation analysis (SCCA) for the subject's attribute including the diagnostic label of the subject and the correlation matrix.
- SCCA regularization canonical correlation analysis
- the second sum of the elements of the correlation matrix is obtained by sparse logistic regression (SLR) by one-out cross-validation. Extract a set.
- a discriminator is generated for the second union set by discriminant analysis by sparse logistic regression.
- Sparse logistic regression is a method that extends logistic regression analysis to the framework of Bayesian estimation, and is a method that performs dimension compression of feature vectors simultaneously with weight estimation for discrimination. This is useful when the number of dimensions of the data feature vector is very high and a large amount of unnecessary feature quantities are included.
- the weight parameter in the linear discriminant analysis is set to zero (that is, feature selection is performed), and only a very small number of features related to discrimination are extracted (sparseness).
- the probability p belonging to the class to be classified is obtained for each feature data obtained, and the maximum value is assigned to the output class.
- p is output by the logistic regression equation.
- the weight is estimated by ARD (Automatic Relevance determination), and the feature amount that has a small contribution to the class discrimination is excluded from the calculation as the weight approaches 0.
- FIG. 37 is a conceptual diagram of a procedure for deriving a common functional connection in the brain in the diagnosis and symptom of a mental illness (for example, major depressive disorder). That is, as described above, a classifier that discriminates between the healthy group (HC) and the patient group (for example, MDD patient group) is generated based on the brain functional connection at rest. On the other hand, as described below, a regression model of a symptom rating scale (for example, Beck's Depression Self-Rating Scale II) is constructed based on the brain functional connection at rest. Then, the intersection between the brain functional connections associated with diagnosis and the brain functional connections associated with symptoms is extracted.
- a symptom rating scale for example, Beck's Depression Self-Rating Scale II
- FIG. 38 is a flowchart for explaining a procedure for generating a regression model that predicts such a symptom evaluation scale (for example, the Beck Depression Self-Evaluation Scale II).
- a symptom evaluation scale for example, the Beck Depression Self-Evaluation Scale II.
- the learning process for the regression model of the evaluation scale is started (S200)
- the learning data set prepared in advance stored in the storage device 2080 ′
- the calculation unit 3002 calculates the components of the binding matrix.
- the harmonization calculation unit 3020 calculates the measurement bias and carries out the harmonization process (S204).
- the harmonization process is preferably a method using a traveling subject, but may be another method.
- the discriminator generation unit 3008 acquires, as a learning data set, data of the participants who have already acquired the symptom evaluation scale (for example, BDI score) from the data set after the harmonization process (S206).
- the symptom evaluation scale for example, BDI score
- the discriminator generation unit 3008 generates a regression model of the evaluation scale for the learning data by the so-called “K division cross-validation” method.
- the discriminator generation unit 3008 uses the learning data set based on the values of the functionally coupled FCs 71 and 631 to calculate a linear regression model to predict the BDI score, as in the following equation.
- the LASSO method is used for the learning data set having the BDI score, and the discriminator generation unit 3008 uses the linear regression as described below to calculate the regression sub-model i.
- I 1 to K
- the discriminator generation unit 3008 uses the linear regression as described below to calculate the regression sub-model i.
- (Prediction BDI sub ) w T c sub
- the predicted BDI sub represents the BDI score of the participant.
- c sub represents the participant's functionally coupled FC vector.
- w represents a weight vector for linear regression.
- the regression model is not limited to the linear regression model, and other functional regression models may be used.
- the discriminator generation unit 3008 determines that the cross-validation loop has not been completed K times (10 times) (N in S218), the discriminator generation unit 3008 uses the data in the K-divided data in the previous loops. Another partial data set different from is set as the test data set, the remaining partial data sets are set as the training data sets (S210, S212), and the process is repeated.
- the discriminator generation unit 3008 when the cross-validation loop is completed K times (10 times) (Y in S218), the discriminator generation unit 3008 generates a sub model in the 10-divided data set of the training data set.
- a functional subset of the brain that is integrated with the functional coupling FC selected for is extracted (S220), and a regression model is constructed using such a subset of the functional coupling of the brain as an explanatory variable ( S222).
- FIG. 39 is a diagram showing the prediction performance of the regression model generated based on the learning data set. As shown in FIG. 39, the mean absolute error (MAE) between the BDI score predicted by the regression model and the actually measured BDI score and the Pearson's correlation coefficient r are also shown.
- MAE mean absolute error
- FIG. 40 is a diagram showing the performance of the regression model with respect to the BDI score in an independent verification data set.
- FIG. 40 is a scatter plot of measured and predicted BDI.
- FIG. 41 is a diagram showing the spatial distribution of the seven functionally-coupled FCs in the brain, which are common in the construction of both the MDD classifier and the BDI regression model.
- the common functional connections between diagnosis and symptoms are shown as a view from the back, left, right and top. Interhemispherical connections are shown only in the posterior and plan views.
- FIG. 42 is a diagram showing a list showing the characteristics of the seven functionally combined FCs of the brain shown in FIG. 41.
- FIG. 42 common functional combinations and weights in the regression model of the BDI score are shown.
- the important functionally coupled FC associated with the diagnosis from the MDD classifier and the significant functionally associated FC from the BDI regression model is extracted.
- the functional combination FC is extracted by the discriminator generation unit 3008.
- the discriminator generation unit 3008 counts the number of times each functionally coupled FC is selected by the LASSO calculation in the 10-division cross-validation. If such a count is determined by binomial testing to be significantly higher than by chance, the functionally bound FC is determined to be important.
- the average number of functionally coupled FCs used in the MDD classifier is 329.1 per cross-validation (the number of FCs is 10 subs).
- B the number of FCs
- the significance level is set as 0.05 / 71,631.
- the discriminator generation unit 3008 determines that the FC selected three or more times in the 10-fold cross verification is an important FC related to the diagnosis.
- the number of functionally coupled FCs used in the BDI regression model was 3.4 on average per split cross-validation, so B (10,3 / 71, 631), assuming a binomial distribution of the number of times.
- the discriminator generation unit 3008 determines that the FC selected one or more times in the 10-fold cross verification is an important FC related to the symptom.
- Machine-learning algorithm automatically and objectively from data of regression model of classifier and BDI score between MDD patient group and healthy group HC, 340 functionally connected FC related to diagnosis, and related to symptoms Twenty-one functional combinations FC are identified.
- FIG. 43 is a diagram showing values of the functional combination FC between the learning data set and the independent verification data set in the common functional combination FC. As shown in FIG. 43, the average functional binding values of the seven common functional binding FCs were very similar between the training dataset and the independent validation dataset. This result suggests that seven functionally connected FCs are reliable in characterizing the neural basis of MDD and depressive symptoms.
- MDD classifier achieved high generalized predictive performance AUC and MCC for independent validation datasets. Furthermore, high generalized prediction performance is achieved not only for the entire dataset of independent validation datasets, but individually for the datasets of the four imaging sites. These validation datasets are not included in the training dataset. Moreover, although the imaging protocol in the independent verification data set was strictly different from the learning data set, this generalization was achieved. Not only successfully builds an MDD classifier generalized to independent validation data based on functionally coupled FC in the brain, but also successfully generalized classification for MDD without restrictions on MDD subtypes It will be.
- the machine learning algorithm as described above reliably and commonly has important functional combinations for both the disease (eg MDD) classifier and the symptom rating scale (eg BDI score) regression model.
- FC can be extracted.
- the seven functionally coupled FCs are closely related to the default mode network and the saliency network in terms of their contribution to the intrinsic functional network.
- FCs have nodes (ROIs) in either the default mode network or the saliency network.
- ROIs nodes
- Two of the seven functionally coupled FCs were the couplings between the two networks.
- Two functionally coupled FCs were in the default mode network and one functionally coupled FC was in the saliency network. It has been reported that the default mode network and the saliency network are involved in depression, and the above results are consistent with these.
- biomarkers are being developed for the purpose of diagnosing patients, the focus is shifting to identifying biomarkers that determine treatment goals (ie biomarkers that combine diagnosis and treatment). It allows for more individualized therapeutic approaches.
- the common functionally coupled FC extracted by the procedure as described above is associated with not only the diagnosis of MDD but also the symptoms of depression, these seven functionally coupled FCs are biomarkers that combine diagnosis and treatment for MDD. Is a promising candidate for. Therefore, in order to realize improvement of depressive symptoms, for example, by a method as disclosed in the following publicly-known document 21, these functionally coupled FCs are intervened in a functionally coupled neurofeedback training or the like. It becomes possible to use the method.
- the entire disclosure of the known document 21 is incorporated herein by reference.
Landscapes
- Health & Medical Sciences (AREA)
- Engineering & Computer Science (AREA)
- Life Sciences & Earth Sciences (AREA)
- Physics & Mathematics (AREA)
- General Health & Medical Sciences (AREA)
- Medical Informatics (AREA)
- Nuclear Medicine, Radiotherapy & Molecular Imaging (AREA)
- Artificial Intelligence (AREA)
- Heart & Thoracic Surgery (AREA)
- Veterinary Medicine (AREA)
- Public Health (AREA)
- Animal Behavior & Ethology (AREA)
- Surgery (AREA)
- Molecular Biology (AREA)
- Biomedical Technology (AREA)
- Pathology (AREA)
- Biophysics (AREA)
- Computer Vision & Pattern Recognition (AREA)
- Theoretical Computer Science (AREA)
- Radiology & Medical Imaging (AREA)
- Evolutionary Computation (AREA)
- Data Mining & Analysis (AREA)
- General Physics & Mathematics (AREA)
- Psychiatry (AREA)
- Mathematical Physics (AREA)
- Fuzzy Systems (AREA)
- Signal Processing (AREA)
- High Energy & Nuclear Physics (AREA)
- Physiology (AREA)
- Evolutionary Biology (AREA)
- General Engineering & Computer Science (AREA)
- Bioinformatics & Cheminformatics (AREA)
- Bioinformatics & Computational Biology (AREA)
- Quality & Reliability (AREA)
- Neurology (AREA)
- Computing Systems (AREA)
- Databases & Information Systems (AREA)
- Software Systems (AREA)
- Multimedia (AREA)
- Optics & Photonics (AREA)
Abstract
Description
この発明は、複数の装置において脳機能画像法により計測される脳機能結合相関値を調整する技術、脳機能画像法を用いた脳活動分類器のハーモナイズ方法、脳活動分類器のハーモナイズシステム、及び脳活動バイオマーカシステムに関する。この出願は、2018年10月11日出願の日本出願第2018-192842号及び2019年2月27日出願の日本出願第2019-034887号に基づく優先権を主張し、前記日本出願に記載された全ての記載内容を援用するものである。 The present invention relates to a technique for adjusting a brain function coupling correlation value measured by a brain function image method in a plurality of devices, a brain activity classifier harmonization method using the brain function image method, a brain activity classifier harmonization system, and Brain activity biomarker system. This application claims priority based on Japanese application No. 2018-192842 filed on October 11, 2018 and Japanese application No. 2019-034887 filed on February 27, 2019, and is described in the Japanese application. All the contents described are incorporated.
(バイオマーカ)
生体内の生物学的変化を定量的に把握するため、生体情報を数値化・定量化した指標のことを「バイオマーカ」と呼ぶ。
(Biomarker)
In order to quantitatively grasp biological changes in the living body, an index that quantifies and quantifies biological information is called a "biomarker".
FDA(米国食品医薬品局)はバイオマーカの位置づけを、「正常なプロセス及び病的プロセス、又は治療に対する薬理学的な反応の指標として客観的に測定・評価される項目」としている。また疾患の状態及び変化、治癒の程度を特徴づけるバイオマーカは、新薬の臨床試験での有効性を確認するためのサロゲートマーカ(代用マーカ)として使われる。血糖値及びコレステロール値などは、生活習慣病の指標として代表的なバイオマーカである。尿又は血液中に含まれる生体由来の物質だけでなく、心電図、血圧、PET画像、骨密度、肺機能なども含まれる。またゲノム解析及びプロテオーム解析が進んできたことによって、DNA、RNA、及び生体蛋白等に関連したさまざまなバイオマーカが見出されている。 FDA (US Food and Drug Administration) defines biomarkers as "items that are objectively measured and evaluated as indicators of normal and pathological processes or pharmacological response to treatment." In addition, biomarkers that characterize the state and change of disease and the degree of cure are used as surrogate markers (surrogate markers) to confirm the efficacy of new drugs in clinical trials. Blood glucose level and cholesterol level are typical biomarkers as indicators of lifestyle-related diseases. Not only substances derived from a living body contained in urine or blood, but also electrocardiogram, blood pressure, PET image, bone density, lung function and the like are included. Further, due to the progress of genome analysis and proteome analysis, various biomarkers related to DNA, RNA, biological proteins and the like have been found.
バイオマーカは、疾患にかかった後の治療効果の測定だけでなく、疾患を未然に防ぐための日常的な指標として疾患の予防に、さらに副作用を回避した有効な治療法を選択する個別化医療への応用が期待されている。ただし、神経・精神疾患の場合、生化学的もしくは分子遺伝学的観点から客観的な指標として利用可能な分子マーカなども研究されているものの、検討段階というべき状況である。 A biomarker is not only a measure of the therapeutic effect after having a disease, but it is also a daily indicator to prevent the disease as a daily indicator to prevent the disease, and to select an effective treatment method that avoids side effects. Is expected to be applied. However, in the case of neurological and psychiatric disorders, although molecular markers that can be used as objective indicators from a biochemical or molecular genetic perspective have been studied, it is still in the examination stage.
一方で、NIRS(Near-InfraRed Spectroscopy)技術を用いて、生体光計測により計測されたヘモグロビン信号から特徴量に応じて、統合失調症、うつ病などの精神疾患について分類を行う疾患判定システムなども報告がある(特許文献1)。特許文献1の開示の全てをここに参照により援用する。 On the other hand, using a NIRS (Near-InfraRed Spectroscopy) technology, a disease determination system that classifies mental disorders such as schizophrenia and depression according to the feature amount from hemoglobin signals measured by biological light measurement There is a report (Patent Document 1). The entire disclosure of U.S. Pat. No. 6,096,849 is hereby incorporated by reference.
(脳活動に基づくバイオマーカ)
一方で、核磁気共鳴映像法(MRI:Magnetic Resonance Imaging)では、血流量の変化に応じて、検出される信号に変化が現れることを用いて、外部刺激等に対する脳の活動部位を視覚化することも可能である。このような核磁気共鳴映像法を、特に、fMRI(functional MRI)と呼ぶ。
(Biomarker based on brain activity)
On the other hand, in Magnetic Resonance Imaging (MRI), changes in the detected signal appear in response to changes in blood flow, which is used to visualize the active site of the brain against external stimuli. It is also possible. Such a nuclear magnetic resonance imaging method is particularly called fMRI (functional MRI).
fMRIでは、装置としては通常のMRI装置に、さらに、fMRI計測に必要なハードウエア及びソフトウエアを装備したものが使用される。 In fMRI, an ordinary MRI device is used, which is equipped with the necessary hardware and software for fMRI measurement.
ここで、血流量の変化がNMR信号強度に変化をもたらすのは、血液中の酸素化及び脱酸素化ヘモグロビンは磁気的な性質が異なることを利用している。酸素化ヘモグロビンは反磁性体の性質があり、周りに存在する水の水素原子の緩和時間に影響を与えないのに対し、脱酸素化ヘモグロビンは常磁性体であり、周囲の磁場を変化させる。したがって、脳が刺激を受け、局部血流が増大し、酸素化ヘモグロビンが増加すると、その変化分をMRI信号として検出する事ができる。このような被験者への刺激は、たとえば、視覚による刺激、聴覚による刺激、又は所定の課題(タスク)の実行等が用いられる(たとえば、特許文献2)。特許文献2の開示の全てをここに参照により援用する。 Here, the change in blood flow causes a change in NMR signal intensity by utilizing the fact that oxygenated and deoxygenated hemoglobins in blood have different magnetic properties. Oxygenated hemoglobin has the property of a diamagnetic substance and does not affect the relaxation time of hydrogen atoms in the surrounding water, whereas deoxygenated hemoglobin is a paramagnetic substance and changes the surrounding magnetic field. Therefore, when the brain is stimulated, the local blood flow increases, and the oxygenated hemoglobin increases, the change can be detected as an MRI signal. As such a stimulus to the subject, for example, visual stimulus, auditory stimulus, execution of a predetermined task (task), or the like is used (for example, Patent Document 2). The entire disclosure of U.S. Pat. No. 6,096,849 is hereby incorporated by reference.
ここで、脳機能研究においては、微小静脈及び毛細血管における赤血球中の脱酸素化ヘモグロビンの濃度が減少する現象(BOLD効果)に対応した水素原子の核磁気共鳴信号(MRI信号)の上昇を測定することによって脳の活動の測定が行われている。 Here, in a brain function study, an increase in nuclear magnetic resonance signal (MRI signal) of hydrogen atoms corresponding to a phenomenon (BOLD effect) in which the concentration of deoxygenated hemoglobin in red blood cells in microvenules and capillaries decreases is measured. By doing so, the activity of the brain is measured.
このように、fMRI装置により計測される脳活動を反映した血中酸素濃度依存信号をBOLD信号(Blood Oxygen Level Dependent Signal)と呼ぶ。 The blood oxygen concentration-dependent signal that reflects the brain activity measured by the fMRI device is called BOLD signal (Blood Oxygen Level Dependent Signal).
特に、人の運動機能に関する研究では、被験者に何らかの運動を行わせつつ、上記MRI装置によって脳の活動を測定することが行われている。 In particular, in research on human motor function, the activity of the brain is measured by the MRI device while the subject is doing some kind of exercise.
ところで、ヒトの場合、非侵襲的な脳活動の計測が必要である。このため、fMRIデータから、より詳細な情報を抽出できるデコーディング技術が発達してきている(たとえば、非特許文献1)。非特許文献1の開示の全てをここに参照により援用する。特に、fMRIが脳におけるボクセル単位(volumetric pixel : voxel)で脳活動を解析することで、脳活動の空間的パターンから、刺激入力又は認識状態を推定することが可能となっている。
By the way, for humans, it is necessary to measure non-invasive brain activity. Therefore, a decoding technique capable of extracting more detailed information from fMRI data has been developed (for example, Non-Patent Document 1). The entire disclosure of Non-Patent
さらに、このようなデコーディング技術を発展させた技術として、特許文献3には、神経・精神疾患に対して、脳機能画像法によるバイオマーカを実現するための脳活動解析方法が開示されている。特許文献3の開示の全てをここに参照により援用する。この方法では、健常群、患者群において測定された安静時機能結合的MRIのデータから、それぞれの被験者について、所定の脳領域間の活動度の相関行列を導出する。被験者の疾患/健常ラベルを含む被験者の属性と相関行列とについて正則化正準相関解析により特徴抽出が行われる。正則化正準相関解析の結果に基づいて、スパースロジスティック回帰(Sparse Logistic Regression: SLR)による判別分析によりバイオマーカとして機能する判別器が生成される。このような機械学習の技術により、安静時のfMRI データから導き出される脳領野間の結合にもとづいて神経疾患の診断結果を予測可能であることが示された。しかも、その予測性能の検証は1つの施設において計測された脳活動のみではなく、他の施設で計測された脳活動に対しても、ある程度の汎化が可能であることが示された。
Furthermore, as a technique that has developed such a decoding technique,
さらに、このようなバイオマーカについて、汎化性能を向上させるための技術改良もなされている(特許文献4)。特許文献4の開示の全てをここに参照により援用する。 Furthermore, regarding such biomarkers, technical improvements have been made to improve generalization performance (Patent Document 4). The entire disclosure of U.S. Pat. No. 6,096,849 is hereby incorporated by reference.
また、最近では、米国のヒューマンコネクトームプロジェクトのように、大規模な脳画像データを得て共有することは、基礎的な神経科学研究と、精神疾患の診断及び治療のような臨床応用の間のギャップを埋めることにとって重要な意味を持つ、と認識されている (非特許文献2)。非特許文献2の開示の全てをここに参照により援用する。
In addition, recently, like the US Human Connectome Project, obtaining and sharing large-scale brain image data has become a common between basic neuroscience research and clinical applications such as diagnosis and treatment of mental disorders. It is recognized that it has an important meaning for filling the gap (No. 2). The entire disclosure of Non-Patent
2013年には、日本の国立研究開発法人 日本医療研究開発機構が、8つの研究所が2,239のサンプル及び5つの疾患を含む複数サイトの安静時の機能的磁気共鳴(安静時の機能MRI)データを収集し、公にSRPBS(Strategic Research Program for Brain Sciences,https://www.amed.go.jp/program/list/01/04/001_nopro.html)の複数サイトの複数疾患のデータベース(https://bicr-resource.atr.jp/decnefpro/)を通じてそれらを共有するという、デコーディッドニューロフィードバック(DecNef)プロジェクトを組織した。このプロジェクトは、完全に独立したコホートに汎化することができる、いくつかの精神疾患の、安静時の機能的なコネクティビティ(安静時の機能結合MRI)に基づくバイオマーカを同定した。 In 2013, the Japanese National Research and Development Agency, Japan Medical Research and Development Organization, 8 laboratories, functional magnetic resonance at rest (functional MRI at rest) of multiple sites including 2,239 samples and 5 diseases ) Collect data and publicly open multiple databases of multiple diseases on SRBS (Strategic Research Program for Brain Sciences, https://www.amed.go.jp/program/list/01/04/001_nopro.html). We have organized the Decoded Neurofeedback (DecNef) project to share them via https://bicr-resource.atr.jp/decnefpro/). The project identified biofunctional markers at rest (functional resting MRI at rest) based on functional connectivity at rest for several psychiatric disorders that could be generalized to completely independent cohorts.
ただし、大規模に脳画像データを収集することは、健常者についても、そして、特に、患者に対しては容易ではない。 However, collecting brain image data on a large scale is not easy for healthy persons and especially for patients.
さらに、大規模なデータ収集をするために、複数のサイトでの計測を実施すると、各計測サイトでの計測データのサイト間差が問題となる。 Furthermore, if measurement is performed at multiple sites to collect large-scale data, the difference between the measurement data sites at each measurement site becomes a problem.
たとえば、複数の計測サイトで、MRI計測をした場合の計測データのサイト間差を評価するために、複数のサイトへ多数の参加者が移動しつつ測定を受けるという、いわゆる「トラベリングサブジェクト」を採用することにより、安静時の機能的なコネクティビティに対する測定バイアスの効果を調査するという試みも実施されている(非特許文献3、非特許文献4)。非特許文献3の開示の全て及び非特許文献4の開示の全てをここに参照により援用する。
For example, the so-called "traveling subject" is adopted, in which a large number of participants move to multiple sites and receive measurements in order to evaluate differences in measurement data between multiple sites at the time of MRI measurement. By doing so, an attempt to investigate the effect of the measurement bias on the functional connectivity at rest has also been implemented (Non-Patent
以上のように、機能的磁気共鳴画像法などの脳機能画像法による脳活動の解析の神経・精神疾患の治療への応用を考えた場合、たとえば、上述したようなバイオマーカとして、脳機能画像法による脳活動の解析は、非侵襲的な機能マーカとして、診断法の開発、根本治療を実現するための創薬に向けた標的分子の探索・同定などへの応用も期待される。 As described above, in the case of considering the application of the analysis of the brain activity by the brain functional imaging method such as the functional magnetic resonance imaging method to the treatment of the nerve / psychiatric disease, for example, as the biomarker as described above, the brain functional image The analysis of brain activity by the method is expected to be applied as a non-invasive functional marker to the development of diagnostic methods and the search and identification of target molecules for drug discovery to realize the underlying treatment.
たとえば、これまで、自閉症などの精神疾患に対しては、遺伝子を用いた実用的なバイオマーカの完成には至っておらず、それゆえに、薬物の効果判定などが困難であるため、治療薬の開発も困難であった。 For example, for mental disorders such as autism, until now, practical biomarkers using genes have not been completed, and therefore it is difficult to determine the effects of drugs, so therapeutic drugs Was also difficult to develop.
脳活動の計測データに基づいて、機械学習により判別器を生成し、これをバイオマーカとして実用化させるためには、1つの施設において計測された脳活動に対して機械学習により生成されたバイオマーカの予測精度の向上が必要である。また、このようにして生成されたバイオマーカが、他の施設において計測された脳活動に対しても、汎化可能であることが必要である。 In order to generate a discriminator by machine learning based on measured brain activity data and put it into practical use as a biomarker, biomarkers generated by machine learning for brain activity measured at one facility are used. It is necessary to improve the prediction accuracy of. Further, it is necessary that the biomarker thus generated can be generalized to the brain activity measured in another facility.
すなわち、脳活動の計測データに基づく、機械学習により判別器を構築する際には、主な2つの課題が存在する。 That is, there are two main issues when constructing a discriminator by machine learning based on measurement data of brain activity.
第1の課題は、小標本サイズの問題である。 The first issue is the problem of small sample size.
被験者の人数であるデータ量Nが、計測された脳活動計測データの次元Mよりはるかに小さいので、判別器のパラメータは、容易に訓練データに過剰適合することになる。 Since the data amount N, which is the number of test subjects, is much smaller than the dimension M of the measured brain activity measurement data, the parameters of the discriminator easily overfit the training data.
この過剰適合のために、構築された判別器は、新しくサンプリングされたテスト・データについては、非常に貧弱なパフォーマンスを示すことになる。これは、これらのテスト・データは判別器を訓練するのに使用されていないものだからである。 Due to this overfitting, the constructed discriminator will show very poor performance on the newly sampled test data. This is because these test data were not used to train the discriminator.
したがって、判別器の望ましい汎化に対して本質的な特徴量だけを識別し利用するために正則化を適切に導入する必要がある。 Therefore, it is necessary to properly introduce regularization in order to identify and use only essential feature quantities for the desired generalization of the discriminator.
第2の課題は、構築された判別器が、訓練データが集められたサイトとは異なる撮像サイトで走査されたMRIデータに対しても、よいパフォーマンスを維持する場合のみ、判別器が臨床的に有用で、科学的に信頼できるということである。これは撮像サイトにわたる、いわゆる汎化能力である。 The second problem is that the constructed classifier is clinically effective only when it maintains good performance even for MRI data scanned at an imaging site different from the site where the training data was collected. It is useful and scientifically reliable. This is the so-called generalization capability across the imaging site.
精神疾患と関連する大規模な脳画像データを集める際には、脳画像は、1つのサイトで取得できるデータの量には制限があるため、複数のサイトから取得する必要がある。しかしながら、複数サイトでの脳画像データを取得する場合、サイト間差は最も大きな障壁となる。すなわち、臨床応用では、異なるサイトで走査されたデータに、特定のサイトで取得したデータを使用して訓練された判別器を汎化することができないことはしばしば観測されている。 When collecting large-scale brain image data related to mental illness, brain images need to be acquired from multiple sites because the amount of data that can be acquired at one site is limited. However, when acquiring brain image data at multiple sites, the difference between sites is the greatest obstacle. That is, in clinical applications, it has often been observed that data scanned at different sites cannot be generalized to a trained discriminator using data acquired at a particular site.
このため、上述したヒューマンコネクトームプロジェクトでは、これまでのところ、単一サイトで、単一のスキャナを用いた計測を行うこととされている。 For this reason, in the above-mentioned Human Connectome Project, so far, it has been decided to perform measurement using a single scanner at a single site.
この発明は、上記のような問題点を解決するためになされたものであって、その目的は、複数施設から取得された脳計測データに基づいて、各施設における測定バイアスを調整及び補正することが可能な機能結合相関値の調整方法、機能結合相関値の調整システムを提供することである。 The present invention has been made to solve the above problems, and an object thereof is to adjust and correct a measurement bias in each facility based on brain measurement data acquired from a plurality of facilities. It is an object of the present invention to provide an adjustment method of a functional combination correlation value and a system for adjusting a functional combination correlation value.
この発明の、他の目的は、複数施設から取得された脳計測データをハーモナイズして、神経・精神疾患に対しての診断を支援するための脳機能画像法による判別処理を実現するための脳活動分類器のハーモナイズ方法、脳活動分類器のハーモナイズシステム、脳活動解析装置及び脳活動解析方法を提供することである。 Another object of the present invention is to brainize brain measurement data acquired from a plurality of facilities to realize a discrimination process by a brain functional image method for supporting diagnosis of a nerve / mental disorder. An object of the present invention is to provide a harmonization method for an activity classifier, a harmonization system for a brain activity classifier, a brain activity analysis device, and a brain activity analysis method.
この発明の他の目的は、脳活動計測によるバイオマーカを実現するための脳活動解析装置、脳活動解析方法及び脳活動バイオマーカシステム、脳活動バイオマーカシステムのプログラムを提供することである。 Another object of the present invention is to provide a brain activity analysis device, a brain activity analysis method, a brain activity biomarker system, and a brain activity biomarker system program for realizing a biomarker by measuring brain activity.
この発明の1つの局面にしたがうと、複数の計測サイトで計測される被験者の脳機能結合相関値の補正を行うための脳機能結合相関値の調整方法であって、複数の計測サイトの各々において共通に計測対象となる複数の移動被験者に対して、各移動被験者の予め定められた複数の脳領域について脳活動を計測するステップと、複数の脳領域の組についての脳活動の時間相関を表す脳機能結合行列の所定の要素を各移動被験者について算出するステップと、一般化線形混合モデル法を用いることで、脳機能結合行列の所定の要素ごとに、複数の計測サイト及び複数の移動被験者にわたる当該要素の平均に対する各計測サイトにおける固定効果として、測定バイアスを算出するステップと、測定バイアスを用いて、各計測サイトで計測される被験者の脳機能結合行列の所定の要素である脳機能結合相関値を補正することで、調整値を得るステップとを含む。 According to one aspect of the present invention, there is provided a method of adjusting a brain function-coupling correlation value for correcting a brain function-coupling correlation value of a subject measured at a plurality of measurement sites, the method comprising: For a plurality of mobile subjects to be commonly measured, a step of measuring brain activity for a plurality of predetermined brain regions of each mobile subject, and time correlation of brain activity for a set of brain regions are represented. By using the step of calculating a predetermined element of the brain function coupling matrix for each moving subject and the generalized linear mixed model method, for each predetermined element of the brain function coupling matrix, a plurality of measurement sites and a plurality of moving subjects can be obtained. As a fixed effect at each measurement site with respect to the average of the element, the step of calculating the measurement bias and the measured bias at each measurement site are used. By correcting the brain function bond correlation value is a predetermined component of brain function binding matrix's and a step of obtaining an adjustment value.
この発明の他の局面にしたがうと、対象者の脳機能結合相関値の補正を行うための、脳機能結合相関値の調整システムであって、複数の被験者の脳活動を時系列で計測するために、複数の計測サイトにそれぞれ設けられた複数の脳活動計測装置と、脳機能結合相関値の補正を行うための計算処理システムとを備え、計算処理システムは、データを格納するための記憶装置を含み、記憶装置は、複数の計測サイトの各々において共通に計測対象となる複数の移動被験者に対して、各移動被験者の予め定められた複数の脳領域について脳活動を計測した結果を格納し、演算装置をさらに含み、演算装置は、複数の脳領域の組についての脳活動の時間相関を表す脳機能結合行列の所定の要素を各移動被験者について算出し、一般化線形混合モデル法を用いることで、脳機能結合行列の所定の要素ごとに、複数の計測サイト及び複数の移動被験者にわたる当該要素の平均に対する各計測サイトにおける固定効果として、測定バイアスを算出し、測定バイアスを用いて、各計測サイトで計測される被験者の脳機能結合行列の所定の要素である脳機能結合相関値を補正することで、調整値を算出する。 According to another aspect of the present invention, in order to correct the brain function coupling correlation value of the subject, a brain function coupling correlation value adjustment system, for measuring the brain activity of multiple subjects in time series. In addition, a plurality of brain activity measuring devices respectively provided at a plurality of measurement sites, and a calculation processing system for correcting a brain function coupling correlation value, the calculation processing system is a storage device for storing data. The storage device stores the result of measuring brain activity for a plurality of predetermined brain regions of each mobile subject for a plurality of mobile subjects commonly measured at each of the plurality of measurement sites. , A computing device, wherein the computing device calculates a predetermined element of a brain function coupling matrix representing a temporal correlation of brain activity for a set of a plurality of brain regions, for each moving subject, and generalizes the linear mixed model. By using, for each predetermined element of the brain function coupling matrix, the measurement bias is calculated as a fixed effect at each measurement site with respect to the average of the element over a plurality of measurement sites and a plurality of mobile subjects, and the measurement bias is used. An adjustment value is calculated by correcting a brain function coupling correlation value, which is a predetermined element of the brain function coupling matrix of the subject measured at each measurement site.
この発明のさらに他の局面にしたがうと、複数の計測サイトで計測される複数の被験者の少なくとも1つの属性に対する分類処理を実行するための脳活動分類器のハーモナイズ方法であって、複数の計測サイトの各々において共通に計測対象となる複数の移動被験者に対して、各移動被験者の予め定められた複数の脳領域について脳活動を計測するステップと、複数の脳領域の組についての脳活動の時間相関を表す脳機能結合行列の所定の要素を各移動被験者について算出するステップと、一般化線形混合モデル法を用いることで、脳機能結合行列の所定の要素ごとに、複数の計測サイト及び複数の移動被験者にわたる当該要素の平均に対する各計測サイトにおける固定効果として、測定バイアスを算出するステップと、各計測サイトで計測される複数の訓練データ対象の被験者の脳機能結合行列の所定の要素である脳機能結合相関値を測定バイアスを用いて補正することで、調整値をそれぞれ得るステップと、調整値に基づいて、属性に対する分類器を、特徴選択を伴う機械学習法により生成するステップと、を備える。 According to still another aspect of the present invention, there is provided a method of harmonizing a brain activity classifier for performing a classification process on at least one attribute of a plurality of subjects measured at a plurality of measurement sites, the method comprising: For each of a plurality of mobile subjects that are commonly measured in each of the steps, a step of measuring the brain activity for a plurality of predetermined brain regions of each mobile subject, and the time of the brain activity for a set of the plurality of brain regions. By using the step of calculating a predetermined element of the brain function coupling matrix for each moving subject and the generalized linear mixed model method, for each predetermined element of the brain function coupling matrix, a plurality of measurement sites and a plurality of As a fixed effect at each measurement site with respect to the average of the element over mobile subjects, the step of calculating the measurement bias and the measurement at each measurement site. By correcting the brain function coupling correlation value, which is a predetermined element of the brain function coupling matrix of the subject of the plurality of training data to be corrected, using the measurement bias, each step of obtaining an adjustment value, and based on the adjustment value, Generating a classifier for the attribute by a machine learning method with feature selection.
好ましくは、各計測サイトで脳活動を計測される複数の訓練データ対象の被験者は、属性を有する第1の群の被験者と、属性を有さない第2の群の被験者とを含み、測定バイアスを算出するステップは、一般化線形混合モデル法を用いることで、脳機能結合行列の所定の要素ごとに、複数の計測サイト及び複数の移動被験者並びに複数の訓練データ対象の被験者にわたる当該要素の平均に対する各計測サイトにおける固定効果として、測定バイアス並びに第1の群の標本バイアス及び第2の群の標本バイアスを算出するステップを含む。 Preferably, the plurality of training data target subjects whose brain activity is measured at each measurement site include a first group of test subjects having an attribute and a second group of test subjects having no attribute, and a measurement bias. The step of calculating is by using the generalized linear mixed model method, for each predetermined element of the brain function coupling matrix, the average of the element over a plurality of measurement sites and a plurality of mobile subjects and a plurality of training data subject subjects. As a fixed effect at each measurement site for the measurement bias and the step of calculating the sample bias of the first group and the sample bias of the second group.
より好ましくは、一般化線形混合モデル法においては、L2正規化による最小二乗回帰により、測定バイアスを算出する。 More preferably, in the generalized linear mixed model method, the measurement bias is calculated by least squares regression by L2 normalization.
さらに好ましくは、特徴選択を伴う機械学習法は、LASSO(least absolute shrinkage and selection operator)を使用するロジスティックスの回帰分析法である。 More preferably, the machine learning method with feature selection is a logistic regression analysis method using LASSO (least absolute shrinkage and selection operator).
この発明のさらに他の局面にしたがうと、対象者の脳活動の計測結果に基づいて、少なくとも1つの属性に対する分類処理を実行するための脳活動分類器のハーモナイズシステムであって、複数の被験者の脳活動を時系列で計測するために、複数の計測サイトにそれぞれ設けられた複数の脳活動計測装置と、訓練データ対象の被験者の脳活動の時間相関を表す脳機能結合行列の所定の要素である脳機能結合相関値の補正を行うための計算処理システムとを備え、計算処理システムは、データを格納するための記憶装置を含み、記憶装置は、複数の計測サイトの各々において共通に計測対象となる複数の移動被験者に対して、各移動被験者の予め定められた複数の脳領域について脳活動を計測した結果を格納し、演算装置をさらに含み、演算装置は、脳機能結合行列の所定の要素を各移動被験者について算出し、一般化線形混合モデル法を用いることで、脳機能結合行列の所定の要素ごとに、複数の計測サイト及び複数の移動被験者にわたる当該要素の平均に対する各計測サイトにおける固定効果として、測定バイアスを算出し、測定バイアスを用いて、各計測サイトで計測される複数の訓練データ対象の被験者の脳機能結合行列の所定の要素である脳機能結合相関値を補正することで、調整値をそれぞれ算出し、調整値に基づいて、属性に対する分類器を、特徴選択を伴う機械学習法により生成する。 According to still another aspect of the present invention, there is provided a harmonization system of a brain activity classifier for performing a classification process for at least one attribute based on the measurement result of the brain activity of the subject, In order to measure brain activity in time series, multiple brain activity measurement devices provided at multiple measurement sites, and a predetermined element of the brain function coupling matrix that represents the time correlation of the brain activity of the subject of the training data A calculation processing system for correcting a certain brain function coupling correlation value, the calculation processing system includes a storage device for storing data, and the storage device is a measurement target common to each of a plurality of measurement sites. The result of measuring the brain activity for a plurality of predetermined brain regions of each mobile subject is stored for a plurality of mobile subjects to be For each mobile subject, a predetermined element of the brain function coupling matrix is calculated, and by using the generalized linear mixed model method, for each predetermined element of the brain function coupling matrix, a plurality of measurement sites and a plurality of mobile subjects are obtained. As a fixed effect at each measurement site with respect to the average of the relevant elements over, the measurement bias is calculated, and by using the measurement bias, a plurality of training data measured at each measurement site An adjustment value is calculated by correcting a certain brain function coupling correlation value, and a classifier for the attribute is generated by a machine learning method with feature selection based on the adjustment value.
好ましくは、各計測サイトで脳活動を計測される複数の訓練データ対象の被験者は、属性を有する第1の群と、属性を有さない第2の群とを含み、演算装置は、測定バイアスを算出する際に、一般化線形混合モデル法を用いることで、機能結合行列の所定の要素ごとに、複数の計測サイト及び複数の移動被験者並びに複数の訓練データ対象の被験者にわたる当該要素の平均に対する各計測サイトにおける固定効果として、測定バイアス並びに第1の群の標本バイアス及び第2の群の標本バイアスを算出する。 Preferably, the plurality of training data target subjects whose brain activities are measured at each measurement site include a first group having an attribute and a second group having no attribute, and the arithmetic unit is configured to measure the bias. By using the generalized linear mixed model method in calculating, for each predetermined element of the functional coupling matrix, the average of the element over multiple measurement sites and multiple mobile subjects and multiple training data target subjects is calculated. As a fixed effect at each measurement site, the measurement bias, the sample bias of the first group, and the sample bias of the second group are calculated.
好ましくは、一般化線形混合モデル法においては、L2正規化による最小二乗回帰により、測定バイアスを算出する。 Preferably, in the generalized linear mixed model method, the measurement bias is calculated by least-squares regression by L2 normalization.
好ましくは、特徴選択を伴う機械学習法は、LASSOを使用するロジスティックスの回帰分析法である。 Preferably, the machine learning method with feature selection is a logistic regression analysis method using LASSO.
この発明のさらに他の局面にしたがうと、対象者の脳活動の計測結果に基づいて、少なくとも1つの疾患の有無の属性に対する分類処理を実行するための脳活動分類器を用いた脳活動バイオマーカシステムであって、複数の被験者の脳活動を時系列で計測するために、複数の計測サイトにそれぞれ設けられた複数の脳活動計測装置と、被験者の脳活動の時間相関を表す脳機能結合行列の所定の要素である脳機能結合相関値の補正を行うための計算処理システムとを備え、計算処理システムは、記憶装置と演算装置を含み、演算装置は、各計測サイトで計測される複数の被験者の脳機能結合行列の所定の要素である脳機能結合相関値から測定バイアスを除去することで、補正された調整値をそれぞれ算出して記憶装置に格納し、調整値に基づいて、脳活動分類器を、第1の特徴選択を伴う機械学習により生成する。 According to still another aspect of the present invention, a brain activity biomarker using a brain activity classifier for performing a classification process on at least one attribute of the presence or absence of a disease based on the measurement result of the brain activity of the subject. In the system, in order to measure the brain activity of multiple subjects in time series, multiple brain activity measurement devices provided at multiple measurement sites and a brain function coupling matrix representing the time correlation of the brain activity of the subjects And a calculation processing system for correcting a brain function coupling correlation value, which is a predetermined element of the calculation processing system, the calculation processing system includes a storage device and a calculation device, and the calculation device is a plurality of measurement sites. By removing the measurement bias from the brain function coupling correlation value, which is a predetermined element of the brain function coupling matrix of the subject, each corrected adjustment value is calculated and stored in the storage device. Te, brain activity classifier, generated by machine learning with a first feature selection.
好ましくは、記憶装置は、複数の計測サイトの各々において共通に計測対象となる複数の移動被験者に対して、各移動被験者の予め定められた複数の脳領域について脳活動を計測した結果を予め格納しており、演算装置は、複数の脳領域の組についての脳活動の時間相関を表す脳機能結合行列の所定の要素を各移動被験者について算出し、一般化線形混合モデル法を用いることで、脳機能結合行列の所定の要素ごとに、複数の計測サイト及び複数の移動被験者にわたる当該要素の平均に対する各計測サイトにおける固定効果として、測定バイアスを算出する。 Preferably, the storage device stores in advance, for a plurality of mobile subjects to be measured in common at each of the plurality of measurement sites, results of measuring brain activity in a plurality of predetermined brain regions of each mobile subject. That is, the arithmetic device calculates a predetermined element of the brain function coupling matrix representing the temporal correlation of brain activity for a set of a plurality of brain regions for each moving subject, and by using the generalized linear mixed model method, For each predetermined element of the brain function coupling matrix, the measurement bias is calculated as a fixed effect at each measurement site with respect to the average of the element over a plurality of measurement sites and a plurality of mobile subjects.
好ましくは、前記演算装置は、複数の計測サイトのいずれかで計測された対象者についての計測データに基づいて、疾患の有無の属性に対する分類処理を実行する。 Preferably, the arithmetic unit performs a classification process for the attribute of the presence or absence of a disease based on the measurement data of the subject measured by any of the plurality of measurement sites.
好ましくは、演算装置は、第1の特徴選択を伴う機械学習において、i)調整値を、機械学習用のトレーニングデータセットと検証用のテストデータセットとに分割し、ii)トレーニングデータセットに対して、アンダーサンプリング及びサブサンプリングを所定数だけ実行して、所定数のサブサンプルを生成し、iii)サブサンプルごとにスパースモデリング法による特徴選択により分類器サブモデルを生成し、iv)スパースサンプリング法による特徴選択に基づいて、疾患の有無の属性に対する分類器を生成する。 Preferably, in the machine learning with the first feature selection, the arithmetic unit divides the adjustment value into a training data set for machine learning and a test data set for verification, and ii) for the training data set. Undersampling and subsampling by a predetermined number to generate a predetermined number of subsamples, iii) generating a classifier submodel by feature selection by sparse modeling method for each subsample, and iv) sparse sampling method A classifier for the attribute of the presence or absence of a disease is generated based on the feature selection by.
好ましくは、第1の特徴選択を伴う機械学習は、外側の交差検証と内側の交差検証を有する入れ子構造の交差検証を含み、演算装置は、入れ子構造の交差検証の処理において、i)外側の交差検証をK分割交差検証として、調整値を、機械学習用のトレーニングデータセットと検証用のテストデータセットとに分割し、ii)トレーニングデータセットに対して、アンダーサンプリング及びサブサンプリングを所定数だけ実行して、所定数のサブサンプルを生成し、iii)K分割交差検証の各ループにおいて、内側の交差検証で、サブサンプルごとに分類器サブモデルを生成し、iv)分類器サブモデルに基づいて、脳活動分類器を生成する。 Preferably, the machine learning with the first feature selection includes nested cross validation with outer cross validation and inner cross validation, and the computing device includes: i) outer validation in the process of nested cross validation. The cross-validation is K split cross-validation, and the adjustment value is divided into a training data set for machine learning and a test data set for verification, and ii) a predetermined number of under-samplings and sub-samplings are performed on the training data set. Run to generate a predetermined number of subsamples, iii) in each loop of K-fold cross-validation, inner cross-validation to generate a classifier submodel for each subsample, and iv) based on the classifier submodel And generate a brain activity classifier.
好ましくは、記憶装置は、複数の被験者ごとに、疾患の評価尺度の情報を格納しており、演算装置は、調整値に基づいて、疾患の評価尺度に対する回帰モデルを、第2の特徴選択を伴う機械学習により生成し、第1の特徴選択及び第2の特徴選択により共通に抽出される脳機能結合を特定する。 Preferably, the storage device stores information on a disease evaluation scale for each of a plurality of subjects, and the arithmetic device selects a regression model for the disease evaluation scale on the basis of the adjustment value and selects the second feature selection. The brain functional connection generated by the accompanying machine learning and commonly extracted by the first feature selection and the second feature selection is specified.
この発明のさらに他の局面にしたがうと、対象者の脳活動の計測結果に基づいて、少なくとも1つの疾患の有無の属性に対する分類処理を実行するための脳活動分類器を用いた脳活動バイオマーカシステムの動作を制御するコンピュータプログラムであって、脳活動バイオマーカシステムは、複数の被験者の脳活動を時系列で計測するために、複数の計測サイトにそれぞれ設けられた複数の脳活動計測装置と、記憶装置と演算装置とを有し、験者の脳活動の時間相関を表す脳機能結合行列の所定の要素である脳機能結合相関値の補正を行うための計算処理システムと含み、コンピュータプログラムは、演算装置に、各計測サイトで計測される複数の被験者の脳機能結合行列の所定の要素である脳機能結合相関値から測定バイアスを除去することで、調整値をそれぞれ算出して記憶装置に格納するステップと、調整値に基づいて、脳活動分類器を、第1の特徴選択を伴う機械学習により生成するステップと、を実行させる。 According to still another aspect of the present invention, a brain activity biomarker using a brain activity classifier for performing a classification process on at least one attribute of the presence or absence of a disease based on the measurement result of the brain activity of the subject. A brain activity biomarker system, which is a computer program for controlling the operation of the system, includes a plurality of brain activity measurement devices provided at a plurality of measurement sites in order to measure the brain activity of a plurality of subjects in time series. , A storage device and a computing device, including a calculation processing system for correcting a brain function coupling correlation value which is a predetermined element of a brain function coupling matrix representing a temporal correlation of brain activity of an examinee, and a computer program , The calculation device removes the measurement bias from the brain function coupling correlation value which is a predetermined element of the brain function coupling matrix of a plurality of subjects measured at each measurement site. And in the step of storing an adjustment value to the calculated and the storage device, respectively, based on the adjustment value, the brain activity classifier, and generating a machine learning with a first feature selection, to execution.
好ましくは、記憶装置は、複数の計測サイトの各々において共通に計測対象となる複数の移動被験者に対して、各移動被験者の予め定められた複数の脳領域について脳活動を計測した結果を予め格納しており、コンピュータプログラムは、演算装置に、複数の脳領域の組についての脳活動の時間相関を表す脳機能結合行列の所定の要素を各移動被験者について算出するステップと、一般化線形混合モデル法を用いることで、脳機能結合行列の所定の要素ごとに、複数の計測サイト及び複数の移動被験者にわたる当該要素の平均に対する各計測サイトにおける固定効果として、測定バイアスを算出するステップと、を実行させる。 Preferably, the storage device stores in advance, for a plurality of mobile subjects to be measured in common at each of the plurality of measurement sites, results of measuring brain activity in a plurality of predetermined brain regions of each mobile subject. That is, the computer program causes the arithmetic unit to calculate a predetermined element of a brain function coupling matrix representing a temporal correlation of brain activities for a set of a plurality of brain regions for each moving subject, and a generalized linear mixed model. By using the method, calculating a measurement bias as a fixed effect at each measurement site with respect to an average of the elements over a plurality of measurement sites and a plurality of mobile subjects for each predetermined element of the brain function coupling matrix. Let
好ましくは、前記演算装置に、複数の計測サイトのいずれかで計測された対象者についての計測データに基づいて、疾患の有無の属性に対する分類処理を行うステップをさらに実行させる。 Preferably, the arithmetic unit is further caused to perform a step of performing a classification process for an attribute of presence or absence of a disease, based on measurement data of a subject measured at any of a plurality of measurement sites.
好ましくは、演算装置は、第1の特徴選択を伴う機械学習において、i)調整値を、機械学習用のトレーニングデータセットと検証用のテストデータセットとに分割するステップと、ii)トレーニングデータセットに対して、アンダーサンプリング及びサブサンプリングを所定数だけ実行して、所定数のサブサンプルを生成するステップと、iii)サブサンプルごとにスパースモデリングによる特徴選択により分類器サブモデルを生成するステップと、iv)スパースモデリングによる特徴選択に基づいて、疾患の有無の属性に対する分類器を生成するステップとを実行する。 Preferably, in the machine learning with the first feature selection, the arithmetic unit i) divides the adjustment value into a training data set for machine learning and a test data set for verification, and ii) a training data set. For performing a predetermined number of undersamplings and subsamplings to generate a predetermined number of subsamples, and iii) generating a classifier submodel by feature selection by sparse modeling for each subsample. iv) generating a classifier for the attribute of the presence or absence of a disease based on feature selection by sparse modeling.
好ましくは、第1の特徴選択を伴う機械学習は、外側の交差検証と内側の交差検証を有する入れ子構造の交差検証を含み、演算装置は、入れ子構造の交差検証の処理において、
i)外側の交差検証をK分割交差検証として、調整値を、機械学習用のトレーニングデータセットと検証用のテストデータセットとに分割するステップと、ii)トレーニングデータセットに対して、アンダーサンプリング及びサブサンプリングを所定数だけ実行して、所定数のサブサンプルを生成するステップと、iii)K分割交差検証の各ループにおいて、内側の交差検証で、サブサンプルごとに分類器サブモデルを生成するステップと、iv)分類器サブモデルに基づいて、脳活動分類器を生成するステップとを実行する。
Preferably, the machine learning with the first feature selection includes a nested cross-validation having outer cross validation and inner cross validation, and the arithmetic unit in the processing of the nested cross validation:
i) splitting the adjustment value into a training data set for machine learning and a test data set for verification, where the outer cross-validation is K split cross-validation, and ii) undersampling and Performing a predetermined number of sub-samplings to generate a predetermined number of sub-samples, and iii) generating a classifier sub-model for each sub-sample with inner cross-validation in each K-fold cross-validation loop. And iv) generating a brain activity classifier based on the classifier submodel.
好ましくは、記憶装置は、複数の被験者ごとに、疾患の評価尺度の情報を格納しており、演算装置は、調整値に基づいて、疾患の評価尺度に対する回帰モデルを、第2の特徴選択を伴う機械学習により生成するステップと、第1の特徴選択及び第2の特徴選択により共通に抽出される脳機能結合を特定するステップとを実行する。 Preferably, the storage device stores information on a disease evaluation scale for each of a plurality of subjects, and the arithmetic device selects a regression model for the disease evaluation scale on the basis of the adjustment value and selects the second feature selection. The step of generating by the accompanying machine learning and the step of specifying the brain functional connection commonly extracted by the first feature selection and the second feature selection are executed.
この発明によれば、複数の施設で計測される脳の活動の計測データに対して、各施設における測定バイアスを調整及び補正することが可能である。これにより、複数の施設での計測データに基づく、脳機能結合相関値を調整することが可能となる。 According to the present invention, it is possible to adjust and correct the measurement bias in each facility with respect to the brain activity measurement data measured in a plurality of facilities. As a result, it becomes possible to adjust the brain function connection correlation value based on the measurement data at a plurality of facilities.
また、この発明によれば、複数の施設で計測される脳の活動の計測データをハーモナイズして、健常又は疾患の状態を客観的に判断するためのデータを提供することが可能な、脳活動分類器のハーモナイズ方法、脳活動分類器のハーモナイズシステム、脳活動解析システム及び脳活動解析方法を実現することができる。 Further, according to the present invention, it is possible to provide data for objectively determining the state of health or disease by harmonizing measurement data of brain activity measured at a plurality of facilities. A classifier harmonization method, a brain activity classifier harmonization system, a brain activity analysis system, and a brain activity analysis method can be realized.
又は、この発明によれば、複数の施設で計測される脳の活動の計測データに対して、神経・精神疾患について、脳機能画像法による脳活動バイオマーカシステム、脳活動バイオマーカシステムのプログラムを実現することが可能となる。 Alternatively, according to the present invention, a brain activity biomarker system by a functional brain imaging method, a program of a brain activity biomarker system for a nerve / psychiatric disease, for measurement data of brain activity measured at a plurality of facilities. It can be realized.
以下、本発明の実施の形態のMRI計測システムの構成について、図にしたがって説明する。なお、以下の実施の形態において、同じ符号を付した構成要素及び処理工程は、同一又は相当するものであり、必要でない場合は、その説明は繰り返さない。 The configuration of the MRI measurement system according to the embodiment of the present invention will be described below with reference to the drawings. In the following embodiments, components and processing steps denoted by the same reference numerals are the same or equivalent, and the description thereof will not be repeated unless necessary.
また、本実施の形態では、複数の施設に設置された「脳活動計測装置」、より具体的には、「MRI計測システム」によって、脳の複数の領野間の脳活動を時系列で計測し、これらの領野間の時間相関のパターンに基づいて、被験者を分類するものとして本発明を説明する。 In addition, in the present embodiment, the brain activity between a plurality of areas of the brain is measured in time series by a “brain activity measuring device” installed in a plurality of facilities, more specifically, an “MRI measurement system”. The present invention will be described as classifying subjects based on the pattern of time correlation between these areas.
そして、このような「MRI計測システム」が、複数の異なる施設に設置されており、後述するように、これらの計測施設(計測サイト)間での計測に対するサイト間差を、測定機器を原因とする測定バイアスと、計測サイトにおける被験者のポピュレーションによる差(標本バイアス)とを独立に評価する。その上で、各計測サイトにおける計測値について、測定バイアスの効果を除いてサイト間差を補正する処理を実施することで、計測サイト間での測定結果に対する調和処理(ハーモナイゼーション)を実現する。 Such "MRI measurement system" is installed in a plurality of different facilities. As will be described later, the difference between the sites for measurement between these measurement facilities (measurement sites) is caused by the measurement equipment. The measurement bias and the difference due to the population of the subjects at the measurement site (sample bias) are independently evaluated. Then, the measurement value at each measurement site is subjected to the process of correcting the difference between the sites by removing the effect of the measurement bias, thereby realizing the harmonization process (harmonization) for the measurement result between the measurement sites.
[第1の実施の形態]
図1は、複数の計測サイトに設置されたMRI計測システムにより計測されたデータについて、ハーモナイゼーション処理を説明するための概念図である。
[First Embodiment]
FIG. 1 is a conceptual diagram for explaining a harmonization process for data measured by MRI measurement systems installed at a plurality of measurement sites.
図1を参照して、計測サイトMS.1~MS.Ns(Ns:サイト数)には、それぞれ、MRI装置100.1~100.Nsが設置されているものとする。計測サイトMS.1~MS.Nsにおいては、それぞれ、被験者群PA.1~PA.Nsの計測が行われる。被験者群PA.1~PA.Nsの各々には、少なくとも2つ以上に分類される群、たとえば、患者群と健常者群とが含まれるものとする。また、患者群としては、特に限定されないが、たとえば、精神疾患の患者、より特定的には、「大うつ病の患者」の群が相当するものとする。 Referring to FIG. 1, measurement site MS. 1-MS. Ns (Ns: number of sites) includes MRI devices 100.1 to 100.n. It is assumed that Ns is installed. Measurement site MS. 1-MS. In Ns, the test subject group PA. 1-PA. Ns is measured. Subject group PA. 1-PA. It is assumed that each Ns includes a group classified into at least two or more, for example, a patient group and a healthy subject group. Further, the patient group is not particularly limited, but for example, a group of patients with mental illness, more specifically, a group of “patients with major depression” corresponds.
そして、各計測サイトにおいては、原則として、MRI装置の仕様上、可能な範囲で、統一した計測プロトコルで被験者の計測が実施されるものとする。 At each measurement site, as a general rule, the measurement of the subject shall be performed with a unified measurement protocol to the extent possible due to the specifications of the MRI device.
ここで、特に限定されないが、計測プロトコルとしては、たとえば、以下のような内容が規定されているものとする。 Here, although not particularly limited, for example, the following contents are defined as the measurement protocol.
1)頭部のスキャンを実行する方向
たとえば、頭部の後側(posterior:以下、“P”と略記する)から前側(anterior:以下、“A”と略記する)に向かう方向(以下、「P→A方向」と呼ぶ)と、逆の方向、すなわち、前側から後側に向かう方向(以下、「A→P方向」と呼ぶ)にスキャンを行うのかを規定する必要がある。状況によっては、両方の場合のスキャンを行うことを規定することもあり得る。
1) Direction in which head scan is performed For example, the direction from the back side of the head (posterior: abbreviated as “P” below) to the front side (anterior: abbreviated as “A”) (hereinafter, “ It is necessary to specify whether scanning is performed in the opposite direction, that is, in the P → A direction), that is, in the direction from the front side to the rear side (hereinafter, referred to as the “A → P direction”). Depending on the situation, it may be specified to perform scanning in both cases.
MRI装置によって、デフォルトの方向が違っていたり、両方を任意に設定できなかったりする場合もあり得る。 Depending on the MRI device, the default direction may be different, or both may not be set arbitrarily.
スキャンの方向は、たとえば、画像としての「ひずみ方」を規定する可能性があり、プロトコルとして、条件を設定する。 ▽ The scanning direction may specify the "distortion method" of the image, for example, and the conditions are set as the protocol.
2)脳構造画像の撮像条件
いわゆるスピンエコー法により、「T1強調画像」及び「T2強調画像」のいずれか、又は両方を撮像する条件を設定する。
2) Imaging Condition of Brain Structure Image The so-called spin echo method is used to set the condition for imaging either or both of the “T1 weighted image” and the “T2 weighted image”.
3)脳機能画像の撮像条件
fMRI(functional Magnetic Resonance Imaging)法により、「安静時」の被験者の脳機能画像を撮像する条件を設定する。
3) Imaging condition of functional brain image A condition for capturing a functional brain image of the subject at "rest" is set by fMRI (functional Magnetic Resonance Imaging) method.
4)拡散強調画像の撮像条件
拡散強調画像(DWI:diffusion (weighted) image)を撮像するか否か、そしてその条件について設定する。
4) Imaging condition of diffusion-weighted image Whether or not to capture a diffusion-weighted image (DWI) is set, and the condition thereof is set.
拡散強調画像とは、MRI撮像のシーケンスの一種で、水分子の拡散運動を画像化したものである。通常用いられるスピンエコー法のパルス系列では拡散による信号の減衰は無視できる。しかし、大きな傾斜磁場が長時間にわたって印加されると、その間の各磁化ベクトルの移動によって生じる位相のずれが無視できなくなり、拡散が活発な領域ほど低信号として現れる。拡散強調画像はこの現象を利用するものである。 A diffusion-weighted image is a type of MRI imaging sequence that is an image of the diffusion motion of water molecules. In the spin echo pulse sequence that is usually used, signal attenuation due to diffusion can be ignored. However, when a large gradient magnetic field is applied for a long time, the phase shift caused by the movement of each magnetization vector during that time cannot be ignored, and a region where the diffusion is active appears as a low signal. Diffusion-weighted images make use of this phenomenon.
5)EPI歪みを画像処理で補正するための撮像
たとえば、EPI歪みを画像処理で補正するための1つの方法として、「フィールドマップ法」が知られており、空間歪みの補正に対する撮像の条件を設定する。
5) Imaging for Correcting EPI Distortion by Image Processing For example, as one method for correcting EPI distortion by image processing, a “field map method” is known, and an imaging condition for correcting spatial distortion is defined as follows. Set.
フィールドマップ法は、多重エコー時間によってEPI画像を収集し、これらのEPI画像に基づいてEPI歪みの量を算出する。フィールドマップ法を適用して、新規の画像に含まれるEPI歪みを補正することができる。異なるエコー時間による同一の解剖学的構造の一組の画像を前提として、EPI歪みを計算して、画像の歪みを補正することが可能である。 The field map method collects EPI images by multiple echo times and calculates the amount of EPI distortion based on these EPI images. The field map method can be applied to correct the EPI distortion contained in the new image. Given a set of images of the same anatomy with different echo times, it is possible to calculate the EPI distortion and correct the distortion of the image.
たとえば、以下の公知文献1に、「フィールドマップ法」が開示されている。公知文献1の開示の全てをここに参照により援用する。
For example, the following publicly known
公知文献1 : 特開2015-112474号明細書
なお、計測プロトコルには、上記の条件の中から適宜、必要となるシーケンス部分を抜き出してもよいし、必要に応じて、他のシーケンス又はその条件を追加してもよい。
Known Document 1: Japanese Unexamined Patent Publication No. 2015-112474 Note that, in the measurement protocol, a necessary sequence portion may be appropriately extracted from the above conditions, and if necessary, another sequence or its condition may be extracted. May be added.
再び、図1を参照して、各計測サイトMS.1~MS.Nsにおいて、計測を行う被験者として採用することを、「サンプリングする」と呼び、各計測サイトでのサンプリングの偏りにより生じる、計測値のサイト間差の原因を、「標本バイアス」と呼ぶ。 Again, referring to FIG. 1, each measurement site MS. 1-MS. In Ns, adoption as a subject who performs measurement is called “sampling”, and the cause of the difference between measurement values between sites caused by the bias of sampling at each measurement site is called “sample bias”.
たとえば、上述した例では、従来の診断基準で、「大うつ病」と診断される患者には、実は、いくつかのサブタイプが含まれることが知られている。 For example, in the above example, it is known that patients diagnosed as "major depression" by the conventional diagnostic criteria actually include several subtypes.
典型的には、これらのサブタイプはメランコリー型うつ病、非メランコリー型うつ病、治療抵抗性うつ病などである。各計測サイトでは、当該計測サイトの病院に来院する患者の地域性に由来する性向の偏り、及び当該病院での診断の傾向等々のさまざまの要因により、一口に、「大うつ病」の患者といったとしても、その患者群に含まれるサブタイプの分布が均一であるとは、必ずしも言えない。この結果、各計測サイトの患者群には、そのサブタイプの分布に、偏りが生じることが、むしろ一般的であり、その結果、上述した「標本バイアス」が生じると考えられる。 Typically, these subtypes are melancholic depression, non-melancholic depression, treatment-resistant depression, etc. At each measurement site, due to various factors such as the bias of regional tendency of patients who come to the hospital of the measurement site and the tendency of diagnosis at the hospital, etc. However, it cannot always be said that the distribution of subtypes contained in the patient group is uniform. As a result, it is more common that the distribution of subtypes in the patient group at each measurement site is biased, and as a result, the above-mentioned “sample bias” occurs.
また、「健常群」と呼ばれる被験者の群であっても、その中には、複数のサブタイプが存在することが一般であり、その点では、「健常群」においても、「標本バイアス」が存在することになる。 In addition, even in a group of subjects called "healthy group", it is common that there are multiple subtypes, and in that respect, even in the "healthy group", "sample bias" is Will exist.
また、MRI装置100.1~100.Nsも、各計測サイトで決して同一計測特性を有するMRI装置が使用されているとは言えない。 Also, the MRI apparatus 100.1-100. With Ns, it cannot be said that an MRI apparatus having the same measurement characteristics is used at each measurement site.
たとえば、MRI装置の製造メーカ、MRI装置の型番、MRI装置の静磁場強度、MRI装置における(送)受信コイルのコイル数(チャンネル数)、等々、MRI装置の条件、MRI装置の計測条件などの測定条件に応じて、計測データのサイト間差異が生じうる。このような測定条件により生じるサイト間差異のことを「測定バイアス」と呼ぶ。 For example, the manufacturer of the MRI apparatus, the model number of the MRI apparatus, the static magnetic field strength of the MRI apparatus, the number of (transmission) and reception coils in the MRI apparatus (the number of channels), the conditions of the MRI apparatus, the measurement conditions of the MRI apparatus, etc. Differences in measurement data between sites may occur depending on measurement conditions. The difference between sites caused by such measurement conditions is called “measurement bias”.
仮に、同一のMRI装置の製造メーカの同一の型番のMRI装置であっても、装置の固有な個性により、完全に同一の計測特性を実現するとも、必ずしも言えない。 Even if MRI devices of the same model number manufactured by the same MRI device manufacturer achieve completely the same measurement characteristics due to the unique characteristics of the devices, it cannot always be said.
ここで、(送)受信コイルとしては、計測される信号のSN比を向上させることを目的として、「マルチアレイコイル」が採用されることが一般的である。「受信コイルのコイル数」とは、マルチアレイコイルを構成する「エレメントコイル」の個数を指す。個々のエレメントコイルの感度を高め,この出力を束ねることで受信感度の向上を図るものである。 Here, as the (transmission / reception) coil, a "multi-array coil" is generally adopted for the purpose of improving the SN ratio of the measured signal. The “number of receiving coils” refers to the number of “element coils” that form the multi-array coil. By increasing the sensitivity of each element coil and bundling this output, the receiving sensitivity is improved.
そして、後に説明するような手法により、本実施の形態では、「標本バイアス」と「測定バイアス」とを独立に評価することを可能とする。 Then, in the present embodiment, it is possible to independently evaluate the “sample bias” and the “measurement bias” by a method described later.
再び、図1を参照して、各計測サイトMS.1~MS.Nsからそれぞれ得られる計測関連データDA100.1~DA100.Nsは、データセンター200内の記憶装置210に集積され、格納される。
Again, referring to FIG. 1, each measurement site MS. 1-MS. Measurement-related data DA100.1 to DA100. The Ns is integrated and stored in the
ここで、「計測関連データ」は、各計測サイトでの「測定パラメータ」と、各計測サイトにおいて計測された「患者群データ」及び「健常群データ」とを含む。 Here, the “measurement-related data” includes “measurement parameters” at each measurement site, and “patient group data” and “healthy group data” measured at each measurement site.
さらに、「患者群データ」及び「健常群データ」は、それぞれ、各々の被験者に対応して「患者のMRI計測データ」及び「健常者のMRI計測データ」とを含む。 Furthermore, the “patient group data” and “healthy group data” include “patient MRI measurement data” and “healthy person MRI measurement data” corresponding to each subject, respectively.
以下では、このような「計測関連データ」について説明する。図2は、被験者の脳の関心領域(ROI:Region of Interest)について、安静時の機能結合の相関を示す相関行列を抽出する手続きを示す概念図である。 The following explains such "measurement-related data". FIG. 2 is a conceptual diagram showing a procedure for extracting a correlation matrix showing a correlation of functional connections at rest for a region of interest (ROI: Region of Interest) of a subject's brain.
ここで、図1において、「患者群データ」及び「健常群データ」における、「患者のMRI計測データ」及び「健常者のMRI計測データ」は、少なくとも、以下のようなデータを含む。
i)相関行列のデータを算出するための時系列の「脳機能画像データ」、及び/又は、相関行列のデータ自身
すなわち、図1における計算処理システム300が、記憶装置210内に格納されたデータに基づいて、後述するような脳活動バイオマーカを算出する際の基礎となるデータとして、これらのデータが使用される。
Here, in FIG. 1, the “patient MRI measurement data” and the “healthy MRI measurement data” in the “patient group data” and the “healthy group data” include at least the following data.
i) Time-series “brain function image data” for calculating the data of the correlation matrix, and / or the data of the correlation matrix itself, that is, the data stored in the
ここで、相関行列のデータについては、時系列の「脳機能画像データ」に基づいて、各計測サイトで計算された後に、記憶装置210内に格納され、計算処理システム300が、この記憶装置210内の相関行列のデータに基づいて、脳活動バイオマーカを算出する、という構成とすることができる。
Here, the data of the correlation matrix is calculated in each measurement site based on the time-series “brain function image data” and then stored in the
又は、時系列の「脳機能画像データ」が記憶装置210内に格納され、計算処理システム300が、この記憶装置210内の「脳機能画像データ」に基づいて、相関行例のデータを算出し、さらに、脳活動バイオマーカを算出する、という構成とすることも可能である。
Alternatively, the time-series “brain function image data” is stored in the
したがって、「患者のMRI計測データ」及び「健常者のMRI計測データ」の各々については、少なくとも、相関行列のデータを算出するための時系列の「脳機能画像データ」、及び、相関行列のデータ自身のいずれか一方が含まれることになる。 Therefore, for each of the “patient MRI measurement data” and the “healthy person MRI measurement data”, at least the time-series “brain function image data” for calculating the correlation matrix data and the correlation matrix data Either one of them will be included.
ii)被験者の構造画像データ、及び、拡散強調画像データ
なお、特に限定されないが、EPI歪みを画像処理で補正する処理については、各計測サイトで演算処理がされた後に、記憶装置210内にデータが格納される構成とすることができる。
ii) Structural image data of subject and diffusion-weighted image data Note that, although not particularly limited, regarding processing for correcting EPI distortion by image processing, data is stored in the
また、特に、限定されないが、個人情報保護の観点から、記憶装置210内へデータが格納される前に、各計測サイトにおいて、匿名加工処理を実行する構成とすることが可能である。ただし、匿名加工処理については、計算処理システム300を運営する主体が、法規制上、個人情報を扱うことが認められている場合は、計算処理システム300において実行する構成としてもよい。
Further, although not particularly limited, from the viewpoint of personal information protection, it is possible to configure that each measurement site executes anonymization processing before data is stored in the
図2に戻って、図2(A)に示すように、リアルタイムで測定した安静時のfMRIのn個(n:自然数)の時刻分のfMRIデータから、各関心領域の平均的な「活動度」を算出し、図2(B)に示すように、脳領域間(関心領域間)の機能的なコネクティビティ(「活動度の相関値」)の相関行列を算出する。 Returning to FIG. 2, as shown in FIG. 2 (A), the average “activity level” of each region of interest is calculated from fMRI data of n (n: natural number) times of resting fMRI measured in real time. 2B, the correlation matrix of the functional connectivity (“activity correlation value”) between brain regions (between regions of interest) is calculated.
機能的なコネクティビティは、各参加者に対して2つの脳領域間の安静時の機能MRIの血中酸素濃度に依存する(BOLD)信号の時間的な相関性として計算される。 Functional connectivity is calculated for each participant as the temporal correlation of the resting functional MRI blood oxygen concentration-dependent (BOLD) signal between the two brain regions.
ここで、関心領域としては、上述したようにNc領域を考えているので、相関行列における独立な非対角成分は、対称性を考慮すると、
Nc×(Nc-1)/2(個)
ということになる。
Here, since the Nc region is considered as the region of interest as described above, the independent off-diagonal components in the correlation matrix are:
Nc x (Nc-1) / 2 (pieces)
It turns out that.
関心領域の設定の方法としては、以下のような方法が想定される。
方法1)“解剖学的な脳領野に基づいて、関心領域を定義する。”
ここでは、脳活動バイオマーカのために、たとえば、関心領域として140の領域を採用する。
The following method is assumed as a method of setting the region of interest.
Method 1) “Define a region of interest based on the anatomical brain area.”
Here, for the brain activity biomarker, for example, 140 regions are adopted as regions of interest.
つまり、この方法では、ROIについては、Brain Sulci Atlas (BAL)に含まれる137のROIに加え、 Automated Anatomical Labeling Atlas の小脳(左右)及び虫部のROIを用いる。これら合計140のROI間の機能的結合FCを特徴量として用いる。 In other words, with this method, ROIs of 137 included in Brain Sulci Atlas (BAL), as well as ROIs of the cerebellum (left and right) and insects of Automated Anatomical Labeling Atlas are used. These functionally combined FCs between 140 ROIs are used as feature quantities.
ここで、Brain Sulci Atlas (BAL)及びAutomated Anatomical Labeling Atlasについては、以下の公知文献2及び3に開示がある。公知文献2及び公知文献3の開示の全てをここに参照により援用する。
Here, Brain Sulci Atlas (BAL) and Automated Anatomical Labeling Atlas are disclosed in the following publicly known
公知文献2:Perrot et al., Med Image Anal, 15(4), 2011
公知文献3:Tzourio-Mazoyer et al., Neuroimage, 15(1), 2002
Reference 2: Perrot et al., Med Image Anal, 15 (4), 2011
Reference 3: Tzourio-Mazoyer et al., Neuroimage, 15 (1), 2002
このような関心領域としては、たとえば、以下のような領域がある。
背内側前頭前皮質(DMPFC)
前頭前野腹内側部(VMPFC)
前帯状皮質(ACC)
小脳虫部、
左視床、
右下頭頂葉、
右尾状核、
右中後頭葉、
右中帯状皮質
ただし、採用する脳の領野は、このような領域に限定されるものではない。たとえば、対象とする神経・精神疾患に応じて、選択する領域を変更してもよい。
Examples of such a region of interest include the following regions.
Dorsomedial prefrontal cortex (DMPFC)
Ventromedial prefrontal area (VMPFC)
Anterior cingulate cortex (ACC)
Cerebellar bug,
Left thalamus,
Lower right parietal lobe,
Right caudate,
Right middle occipital lobe,
Right middle cingulate cortex However, the brain area to be adopted is not limited to such an area. For example, the selected area may be changed according to the target nerve / mental disorder.
方法2) “機能的なコネクティビティを、全体の脳をカバーする機能的な脳地図の脳領域に基づいて、定義する。”
ここで、このような機能的な脳地図の脳領域については、以下のような文献にも開示がされており、特に限定されないが、たとえば、268のノード(脳領域)から成る、という構成とすることができる。以下の公知文献4から公知文献7の開示の全てをここに参照により援用する。
Method 2) “Define functional connectivity based on the brain area of the functional brain map that covers the entire brain.”
Here, the brain region of such a functional brain map is also disclosed in the following documents and is not particularly limited, but for example, it is configured to have 268 nodes (brain regions). can do. All the disclosures of the following
公知文献4:Noble S, et al. Multisite reliability of MR-based functional connectivity. Neuroimage 146,959-970 (2017).
公知文献5:Finn ES, et al. Functional connectome fingerprinting: identifying individuals using patterns of brain connectivity. Nat Neurosci 18, 1664-1671 (2015).
公知文献6:Rosenberg MD, et al. A neuromarker of sustained attention from whole-brain functional connectivity. Nat Neurosci 19, 165-171 (2016).
公知文献7:Shen X, Tokoglu F, Papademetris X, Constable RT. Groupwise whole-brain parcellation from resting-state fMRI data for network node identification. Neuroimage 82, 403-415 (2013).
Reference 4: Noble S, et al. Multisite reliability of MR-based functional connectivity. Neuroimage 146,959-970 (2017).
Known Document 5: Finn ES, et al. Functional connectome fingerprinting: identifying individuals using patterns of brain connectivity.
Reference 6: Rosenberg MD, et al. A neuromarker of sustained attention from whole-brain functional connectivity.
Known Document 7: Shen X, Tokoglu F, Papademetris X, Constable RT. Groupwise whole-brain parcellation from resting-state fMRI data for network node identification. Neuroimage 82, 403-415 (2013).
以下では、「方法2」の機能的な脳地図の脳領域に基づいて機能的なコネクティビティを定義する方法を用いるものとして説明する。たとえば、タンジェント法又は部分相関法のような機能的なコネクティビティの計測に対するいくつかの候補がある。しかしながら、以下では、ピアソンの相関係数を使用する。
In the following, it is assumed that the method of defining functional connectivity based on the brain area of the functional brain map of “
前処理されたBOLD信号の可能なノード組の各々の時間経過の間についてのフィッシャーのz変換後のピアソンの相関係数が計算され、要素がそれぞれ2つのノード間のコネクティビティの強度を表わす、268×268の対照的な結合マトリックスを構築するために使用される。この場合、結合マトリックスの下三角行列の35,778個(つまり、(268×267)/2)の結合強度(コネクティビティ)の値が使用されることになる。 The Pearson's z-transformed Pearson's correlation coefficient for each time course of each possible set of nodes of the preprocessed BOLD signal is calculated, each element representing the strength of connectivity between the two nodes 268. Used to construct a x268 symmetric binding matrix. In this case, 35,778 (that is, (268 × 267) / 2) values of the coupling strength (connectivity) of the lower triangular matrix of the coupling matrix are used.
このような相関行列の要素の算出については、特に限定されないが、たとえば、以下のように実行することが可能である。 The calculation of the elements of such a correlation matrix is not particularly limited, but can be executed as follows, for example.
安静時脳活動データから、各被験者について、異なる関心領域(Region of interest、 ROI)間の機能的結合(Functional connectivity, FC)を計算する。FCは安静時脳活動解析において一般的に利用される特徴量であり、異なるROIの時系列信号間のピアソンの相関係数により定義される。 Calculating the functional connectivity (Functional connectivity, FC) between different regions of interest (Region of interest, ROI) for each subject from resting brain activity data. FC is a feature amount generally used in resting brain activity analysis, and is defined by Pearson's correlation coefficient between time series signals of different ROIs.
まず、各ROIに含まれる全ボクセルの平均信号の時系列を抽出する。 First, the time series of the average signal of all voxels included in each ROI is extracted.
特に限定されないが、安静時の機能MRIデータは、以下のような前処理が実施される。データの最初の10秒間は、T1平衡を考慮に入れるために廃棄される。前処理ステップは、スライスタイミングの校正、リアラインメント、T1強調による構造画像による区画化、モントリオール神経学研究所(MNI)空間への規格化、及び6mmの半値全幅の等方性のガウスカーネルによる空間スムージングを含んでいる。 Although not particularly limited, the following pre-processing is performed on the functional MRI data at rest. The first 10 seconds of data are discarded to allow for T1 equilibration. Pre-processing steps include slice timing calibration, realignment, structural image segmentation with T1 enhancement, Montreal Institute for Neurology (MNI) space normalization, and space with a 6 mm full width half maximum isotropic Gaussian kernel. Includes smoothing.
相関行列(コネクティビティマトリックス)の分析については、ROIは、最大に類似するボクセルをクラスタ化するために開発された上述したような268個ノードの灰白質地図によって記述される。BOLD信号の時間的経過は、これらの268個のROIから抽出される。スプーリアス変化のいくつかを除去するために、6つの運動パラメータ、全脳上の平均信号、白質及び脳脊髄液のような36の回帰パラメータによる線形回帰を使用する。微分係数と二次の項もすべてのパラメータに対して含まれる。 For the analysis of the correlation matrix (connectivity matrix), the ROI is described by the 268-node gray matter map as described above, which was developed to cluster the voxels that are maximally similar. The time course of the BOLD signal is extracted from these 268 ROIs. To eliminate some of the spurious changes, linear regression with six motor parameters, mean signal over the whole brain, 36 regression parameters such as white matter and cerebrospinal fluid is used. Derivatives and quadratic terms are also included for all parameters.
バンドパスフィルタは、低周波の変動に分析を制限するために、0.01Hzと0.08Hzの間の通過帯域を備えた第1オーダーのバターワース・フィルタを使用して、時系列に適用される。 Bandpass filters are applied in time series using a first order Butterworth filter with a passband between 0.01Hz and 0.08Hz to limit the analysis to low frequency fluctuations.
回帰後の残差系列を機能的結合と関連する時系列信号値と考え、異なるROIの時系列間でピアソンの相関係数を計算する。 Consider the residual series after regression as time series signal values related to functional coupling, and calculate Pearson's correlation coefficient between time series of different ROIs.
図3は、「測定パラメータ」及び「被験者属性データ」の内容の例を示す概念図である。 FIG. 3 is a conceptual diagram showing an example of the contents of “measurement parameter” and “subject attribute data”.
「被験者属性データ」は、図1における「患者群データ」又は「健常群データ」において、「患者のMRI計測データ」及び「健常者のMRI計測データ」に、それぞれ関連づけて格納されているものとする。 The “subject attribute data” is stored in association with the “patient group data” or the “healthy group data” in FIG. 1 in association with the “patient MRI measurement data” and the “healthy person MRI measurement data”, respectively. To do.
図3(A)に示すように、測定パラメータは、計測サイトを識別するためのサイトIDと、サイト名と、測定パラメータを識別するための条件IDと、計測装置に関する情報と、計測条件に関する情報とを含む。 As shown in FIG. 3A, the measurement parameters include a site ID for identifying a measurement site, a site name, a condition ID for identifying the measurement parameters, information about a measuring device, and information about a measurement condition. Including and
「計測装置に関する情報」は、各計測サイトにおいて被験者の脳活動を計測するためのMRI装置のメーカ名と、型番と、(送)受信コイル数とを含む。なお、「計測装置に関する情報」は、これらのものに限られず、たとえば、静磁場強度、シム調整後の磁場の均一性、等々の他の計測装置の性能を表す指標などを含んでいてもよい。 “Information about the measuring device” includes the manufacturer name, model number, and (sending / receiving) coil number of the MRI device for measuring the brain activity of the subject at each measuring site. Note that the “information regarding the measuring device” is not limited to these items, and may include, for example, the static magnetic field strength, the uniformity of the magnetic field after shim adjustment, and other indexes indicating the performance of other measuring devices. .
「計測条件に関する情報」は、画像再構成時の位相エンコードの方向(P→A又はA→P)、画像種類(T1強調、T2強調、拡散強調など)、撮像シーケンス(スピンエコーなど)、撮像中の被験者の開眼/閉眼、等々の情報を含む。「計測条件に関する情報」も、これらのものに限られるものではない。 “Information regarding measurement conditions” includes the direction of phase encoding (P → A or A → P) at the time of image reconstruction, image type (T1 emphasis, T2 emphasis, diffusion emphasis, etc.), imaging sequence (spin echo, etc.), imaging It includes information such as open / closed eyes of the subject inside. The “information regarding the measurement conditions” is not limited to these.
図3(B)に示されるように、「被験者属性データ」は、被験者の識別ができないように仮名制御した被験者仮ID,その被験者を計測した際の測定条件を表す条件ID、及び被験者の属性情報を含む。 As shown in FIG. 3B, “subject attribute data” includes subject temporary IDs that have been pseudonym-controlled so that the subjects cannot be identified, condition IDs that represent measurement conditions when the subjects are measured, and subject attributes. Contains information.
そして、「被験者の属性情報」は、被験者の性別、年齢、健常又は疾患のいずれかを示すラベル、医師による被験者の診断病名、被験者への投薬履歴、診断履歴などの情報を含む。なお、「被験者の属性情報」は、必要に応じて、たとえば、計測サイトにおいて、匿名加工処理が行われているものとする。 The "subject attribute information" includes information such as the subject's sex, age, health or disease label, the doctor's diagnosis disease name, the subject's medication history, and diagnosis history. The “subject attribute information” is, if necessary, for example, anonymized at the measurement site.
たとえば、年齢及び性別などについては、準識別子(同一属性)のデータがk件以上になるようにデータを変換するなどの処理を行うことで、個人が特定される確率をk分の1以下に低減し特定を困難にする「k-匿名性」を維持するように被験者の属性情報を加工することができる。ここで、「準識別子」とは、「年齢」「性別」「居住地」など単体では個人を特定できないが、組み合わせることで個人の特定が可能になる属性をいう。投薬履歴及び診断履歴は、日付のランダム化又はシフト化など、必要に応じて、匿名化のための処理を行う。 For example, with regard to age and gender, by performing processing such as converting the data so that there are k or more quasi-identifier (same attribute) data, the probability of individual identification is reduced to 1 / k or less. The attribute information of the subject can be processed so as to maintain “k-anonymity” that reduces and makes identification difficult. Here, the “quasi-identifier” refers to an attribute such as “age”, “sex”, “place of residence” that cannot be individually specified, but can be specified by combining them. The medication history and the diagnosis history are subjected to anonymization processing as needed, such as randomizing or shifting of dates.
そして、以下では、「患者のMRI計測データ」及び「健常者のMRI計測データ」に関し、上述した方法で、各被験者の脳領野間の各々について経時的な活動の相関として算出される機能的結合のことを、各領野間について総称して「機能的なコネクティビティConnectivity」と呼ぶことにする。脳領野ごとに、機能的なコネクティビティを区別する必要がある場合は、後述するように、下添え字を付加して区別するものとする。 Then, in the following, regarding “the MRI measurement data of the patient” and “the MRI measurement data of the healthy person”, the functional coupling calculated as the correlation of the activity over time between the brain regions of each subject by the method described above. This will be collectively referred to as "functional connectivity" for each area. When it is necessary to distinguish functional connectivity for each brain area, a subscript will be added to distinguish it, as described later.
(MRI装置の構成)
図4は、各計測サイトに設置されるMRI装置100.i(1≦i≦Ns)の全体構成を示す模式図である。図4においては、1番目の計測サイトのMRI装置100.1を、例示的に、詳しく説明している。他のMRI装置100.2~100.Nsについても、基本的な構成は同様である。
(Structure of MRI device)
FIG. 4 shows an MRI apparatus 100. It is a schematic diagram which shows the whole structure of i (1 <= i <= Ns). In FIG. 4, the MRI apparatus 100. 1 of the first measurement site is described in detail as an example. Other MRI apparatus 100.2-100. The basic configuration of Ns is similar.
図4に示すように、MRI装置100.1は、被験者2の関心領域に制御された磁場を付与してRF波を照射する磁場印加機構11と、この被験者2からの応答波(NMR信号)を受信してアナログ信号を出力する受信コイル20と、この被験者2に付与される磁場を制御するとともにRF波の送受信を制御する駆動部21と、この駆動部21の制御シーケンスを設定するとともに各種データ信号を処理して画像を生成するデータ処理部32とを備える。
As shown in FIG. 4, the MRI apparatus 100.1 includes a magnetic
なお、ここで、被験者2が載置される円筒形状のボアの中心軸をZ軸にとりZ軸と直交する水平方向にX軸及び鉛直方向にY軸を定義する。
Note that, here, the central axis of the cylindrical bore in which the
MRI装置100.1は、このような構成であるので、磁場印加機構11により印加される静磁場により、被験者2を構成する原子核の核スピンは、磁場方向(Z軸)に配向するとともに、この原子核に固有のラーモア周波数でこの磁場方向を軸とする歳差運動を行う。
Since the MRI apparatus 100.1 has such a configuration, the static magnetic field applied by the magnetic
そして、このラーモア周波数と同じRFパルスを被験者2に照射すると、被験者2を構成する原子は共鳴しエネルギーを吸収して励起され、核磁気共鳴現象(NMR現象;Nuclear Magnetic Resonance)が生じる。この共鳴の後に、RFパルス照射を停止すると、原子はエネルギーを放出して元の定常状態に戻る緩和過程で、ラーモア周波数と同じ周波数の電磁波(NMR信号)を出力する。この出力されたNMR信号を被験者2からの応答波として受信コイル20で受信し、データ処理部32において、被験者2の関心領域が画像化される。
When the subject 2 is irradiated with an RF pulse having the same Larmor frequency, the atoms forming the subject 2 resonate and absorb energy to be excited, resulting in a nuclear magnetic resonance phenomenon (NMR phenomenon; Nuclear Magnetic Resonance). When the RF pulse irradiation is stopped after this resonance, the atoms output electromagnetic waves (NMR signals) of the same frequency as the Larmor frequency in the relaxation process of releasing energy and returning to the original steady state. The output NMR signal is received by the receiving
磁場印加機構11は、静磁場発生コイル12と、傾斜磁場発生コイル14と、RF照射部16と、被験者2をボア中に載置する寝台18とを備える。
The magnetic
被験者2は、寝台18に、たとえば、仰臥する。被験者2は、特に限定されないが、たとえば、プリズムメガネ4により、Z軸に対して垂直に設置されたディスプレイ6に表示される画面を見ることができる。このディスプレイ6の画像により、必要に応じて、被験者2に視覚刺激を与えることもできる。なお、被験者2への視覚刺激は、被験者2の目前にプロジェクタにより画像が投影される構成であってもよい。このような視覚刺激は、被験者にニューロフィードバックを行う場合は、フィードバック情報の提示に相当する。
The
駆動部21は、静磁場電源22と、傾斜磁場電源24と、信号送信部26と、信号受信部28と、寝台18をZ軸方向の任意位置に移動させる寝台駆動部30とを備える。
The
データ処理部32は、操作者(図示略)から各種操作及び情報入力を受け付ける入力部40と、被験者2の関心領域に関する各種画像及び各種情報を画面表示する表示部38と、各種処理を実行させるプログラム・制御パラメータ・画像データ(構造画像等)及びその他の電子データを記憶する記憶部36と、駆動部21を駆動させる制御シーケンスを発生させるなどの各機能部の動作を制御する制御部42と、駆動部21との間で各種信号の送受信を実行するインターフェイス部44と、関心領域に由来する一群のNMR信号からなるデータを収集するデータ収集部46と、このNMR信号のデータに基づいて画像を形成する画像処理部48と、ネットワークとの間で通信を実行するためのネットワークインターフェイス部50を備える。
The
また、データ処理部32は、専用コンピュータである場合の他、各機能部を動作させる機能を実行する汎用コンピュータであって、記憶部36にインストールされたプログラムに基づいて、指定された演算及びデータ処理並びに制御シーケンスの発生をさせるものでもよい。以下では、データ処理部32は、汎用コンピュータであるものとして説明する。
Further, the
静磁場発生コイル12は、Z軸周りに巻回される螺旋コイルに静磁場電源22から供給される電流を流して誘導磁場を発生させ、ボアにZ軸方向の静磁場を発生させるものである。このボアに形成される静磁場の均一性の高い領域に被験者2の関心領域を設定することになる。ここで、静磁場コイル12は、より詳しくは、たとえば、4個の空芯コイルから構成され、その組み合わせで内部に均一な磁界を作り、被験者2の体内の所定の原子核、より特定的には水素原子核のスピンに配向性を与える。
The static magnetic
傾斜磁場発生コイル14は、Xコイル、Yコイル及びZコイル(図示省略)から構成され、円筒形状を示す静磁場発生コイル12の内周面に設けられる。なお、傾斜磁場の均一性を向上させるためにシムコイル(図示せず)が設けられ、「シム調整」が実施される。
The gradient magnetic
これらXコイル、Yコイル及びZコイルは、それぞれX軸方向、Y軸方向及びZ軸方向を順番に切り替えながら、ボア内の均一磁場に対し傾斜磁場を重畳させ、静磁場に強度勾配を付与する。Zコイルは励起時に、磁界強度をZ方向に傾斜させて共鳴面を限定し、Yコイルは、Z方向の磁界印加の直後に短時間の傾斜を加えて検出信号にY座標に比例した位相変調を加え(位相エンコーディング)、Xコイルは、続いてデータ採取時に傾斜を加えて、検出信号にX座標に比例した周波数変調を与える(周波数エンコーディング)。 These X-coil, Y-coil, and Z-coil superimpose a gradient magnetic field on the uniform magnetic field in the bore while sequentially switching the X-axis direction, the Y-axis direction, and the Z-axis direction, and give an intensity gradient to the static magnetic field. . The Z coil, when excited, tilts the magnetic field strength in the Z direction to limit the resonance plane, and the Y coil adds a short time tilt immediately after applying the magnetic field in the Z direction to phase-modulate the detection signal in proportion to the Y coordinate. (Phase encoding), and the X coil subsequently adds a gradient during data acquisition to give a frequency modulation proportional to the X coordinate to the detection signal (frequency encoding).
この重畳される傾斜磁場の切り替えは、制御シーケンスにしたがって、Xコイル、Yコイル及びZコイルにそれぞれ異なるパルス信号が送信部24から出力されることにより実現される。これにより、NMR現象が発現する被験者2の位置を特定することができ、被験者2の画像を形成するのに必要な三次元座標上の位置情報が与えられる。
Switching of the superimposed gradient magnetic field is realized by outputting different pulse signals to the X coil, the Y coil, and the Z coil from the
ここで、上述のように、3組の直交する傾斜磁場を用いて、それぞれにスライス方向、位相エンコード方向、及び周波数エンコード方向を割り当ててその組み合わせにより様々な角度から撮影を行える。たとえば、一般にX線CT装置で撮像されるものと同じ方向のトランスバーススライスに加えて、それと直交するサジタルスライス又はコロナルスライス、更には面と垂直な方向が3組の直交する傾斜磁場の軸と平行でないオブリークスライス等について撮像することができる。 Here, as described above, three sets of orthogonal gradient magnetic fields are used, and a slice direction, a phase encode direction, and a frequency encode direction are assigned to each, and imaging can be performed from various angles depending on the combination. For example, in addition to a transverse slice in the same direction as that generally imaged by an X-ray CT apparatus, a sagittal slice or a coronal slice orthogonal to the transverse slice, and three axes of orthogonal magnetic field gradients in a direction perpendicular to the plane. It is possible to image an oblique slice or the like that is not parallel.
RF照射部16は、制御シーケンスにしたがって信号送信部33から送信される高周波信号に基づいて、被験者2の関心領域にRF(Radio Frequency)パルスを照射するものである。 なお、RF照射部16は、図1において、磁場印加機構11に内蔵されているが、寝台18に設けられたり、又は、受信コイル20と一体化されて、送受信コイル20として構成されていてもよい。
The
受信コイル20は、被験者2からの応答波(NMR信号)を検出するものであって、このNMR信号を高感度で検出するために、被験者2に近接して配置されている。ここで、受信コイル20には、NMR信号の電磁波がそのコイル素線を切ると電磁誘導に基づき微弱電流が生じる。この微弱電流は、信号受信部28において増幅され、さらにアナログ信号からデジタル信号に変換されデータ処理部32に送られる。
The receiving
(送)受信コイル20については、上述の通り、SN比の向上のためにマルチアレイコイルが使用される。
Regarding the (transmission)
すなわち、静磁界にZ軸傾斜磁界を加えた状態にある被験者2に、共鳴周波数の高周波電磁界を、RF照射部16を通じて印加すると、磁界の強さが共鳴条件になっている部分の所定の原子核、たとえば、水素原子核が、選択的に励起されて共鳴し始める。共鳴条件に合致した部分(たとえば、被験者2の所定の厚さの断層)にある所定の原子核が励起され、(古典的な描像では)スピンがいっせいに回転する。励起パルスを止めると、受信コイル20には、今度は、回転しているスピンが放射する電磁波が信号を誘起し、しばらくの間、この信号が検出される。この信号によって、被験者2の体内の、所定の原子を含んだ組織を観察する。そして、信号の発信位置を知るために、XとYの傾斜磁界を加えて信号を検知する、という構成になっている。
That is, when a high-frequency electromagnetic field having a resonance frequency is applied to the subject 2 in a state in which the Z-axis gradient magnetic field is added to the static magnetic field through the
画像処理部48は、記憶部36に構築されているデータに基づき、励起信号を繰り返し与えつつ検出信号を測定し、1回目のフーリエ変換計算により、共鳴の周波数をX座標に還元し、2回目のフーリエ変換でY座標を復元して画像を得て、表示部38に対応する画像を表示する。
The
たとえば、このようなMRIシステムにより、上述したBOLD信号をリアルタイムで撮像し、制御部42により、時系列に撮像される画像について、後に説明するような解析処理を行うことで、安静時機能結合的MRI(rs-fcMRI)の撮像を行うことが可能となる。
For example, the BOLD signal described above is imaged in real time by such an MRI system, and the
図4においては、MRI装置100.1及び他の計測サイトにおけるMRI装置100.2~100.Nsからの計測データ、測定パラメータ、及び被験者属性データが、データセンター200内の通信インターフェイス202を介して記憶装置210に集積され、格納される。さらに、計算処理システム300は、通信インターフェイス204を介して、記憶装置210内のデータにアクセスする構成となっている。
In FIG. 4, the MRI apparatus 100.1 and MRI apparatuses 100.2 to 100. The measurement data, measurement parameters, and subject attribute data from Ns are integrated and stored in the
図5は、データ処理部32のハードウェアブロック図である。データ処理部32のハードウェアとしては、上述のとおり、特に限定されないが、汎用コンピュータを使用することが可能である。
FIG. 5 is a hardware block diagram of the
図5において、データ処理部32のコンピュータ本体2010は、メモリドライブ2020、ディスクドライブ2030に加えて、演算装置(CPU)2040と、ディスクドライブ2030及びメモリドライブ2020に接続されたバス2050と、ブートアッププログラム等のプログラムを記憶するためのROM2060とに接続され、アプリケーションプログラムの命令を一時的に記憶するとともに一時記憶空間を提供するためのRAM2070と、アプリケーションプログラム、システムプログラム、及びデータを記憶するための不揮発性記憶装置2080と、通信インターフェイス2090とを含む。通信インターフェイス2090は、駆動部21等と信号の授受を行うためのインターフェイス部44及び図示しないネットワークを介して他のコンピュータと通信するためのネットワークインターフェイス50に相当する。なお、不揮発性記憶装置2080としては、ハードディスク(HDD)及びソリッドステートドライブ(SSD:Solid State Drive)などを使用することが可能である。不揮発性記憶装置2080が、記憶部36に相当する。
In FIG. 5, the computer
CPU2040が、プログラムに基づいて実行する演算処理により、データ処理部32の各機能、たとえば、制御部42、データ収集部46、画像処理部48の各機能が実現される。
Each function of the
データ処理部32に、上述した実施の形態の機能を実行させるプログラムは、CD-ROM2200、又はメモリ媒体2210に記憶されて、ディスクドライブ2030又はメモリドライブ2020に挿入され、さらに不揮発性記憶装置2080に転送されても良い。プログラムは実行の際にRAM2070にロードされる。
A program that causes the
データ処理部32は、さらに、入力装置としてのキーボード2100及びマウス2110と、出力装置としてのディスプレイ2120とを備える。キーボード2100及びマウス2110が入力部40に相当し、ディスプレイ2120が表示部38に相当する。
The
上述したようなデータ処理部32としてCPU2040を機能させるためのプログラムは、コンピュータ本体2010に、情報処理装置等の機能を実行させるオペレーティングシステム(OS)を含まなくても良い。このプログラムは、制御された態様で適切な機能(モジュール)を呼び出し、所望の結果が得られるようにする命令の部分のみを含んでいれば良い。データ処理部32がどのように動作するかは周知であり、詳細な説明は省略する。
The program for causing the
また、上記プログラムを実行するコンピュータは、単数であってもよく、複数であってもよい。すなわち、集中処理を行ってもよく、又は分散処理を行ってもよい。また、計算処理システム300内のハードウェアも、演算処理装置が並列化されていたり、GPGPU(General-purpose computing on graphics processing units)が使用される等の構成上の相違はあり得るものの、基本的な構成は、図5に示したものと同様である。
The computer that executes the program may be a single computer or a plurality of computers. That is, centralized processing or distributed processing may be performed. In addition, the hardware in the
(脳活動バイオマーカのハーモナイゼーション)
精神疾患と関連したビッグデータを収集するときには、1つのサイトが大規模な脳画像データ(人間の疾患と関係するコネクトーム)を集めることがほとんど不可能である。したがって、複数のサイトから画像データを収集することが必要である。
(Harmonization of brain activity biomarker)
When collecting big data related to mental illness, it is almost impossible for one site to collect large-scale brain image data (connectome related to human disease). Therefore, it is necessary to collect image data from multiple sites.
MRI装置(スキャナー)の型、プロトコル及び患者層を完全に制御するのは難しい。したがって、多くの場合、収集したデータを解析するには、異種条件下で撮像された脳画像データが用いられる。 It is difficult to completely control the type, protocol, and patient layer of the MRI device (scanner). Therefore, in many cases, brain image data taken under different conditions is used to analyze the collected data.
特に、疾患要因はサイト要因と交絡する傾向があるので、そのような異種条件下のデータに機械学習技術を適用することで疾患要因を抽出する場合、サイト間差は最も大きな障壁となる。1つのサイト(又は病院)は、ほんの少数のタイプの精神疾患(例えば、サイトAからは主として統合失調症、及びサイトBからは主として自閉症)をサンプリングしがちであるので、交絡が生じることになる。適切にそのような異種条件下のデータを管理するために、サイト間のデータをハーモナイズ(調和)させることが必要である。 Especially, disease factors tend to be entangled with site factors, so when extracting disease factors by applying machine learning technology to data under such heterogeneous conditions, the difference between sites is the largest barrier. Confounding occurs because one site (or hospital) tends to sample only a few types of mental illness (eg, mainly schizophrenia from Site A and autism from Site B). become. In order to properly manage the data under such heterogeneous conditions, it is necessary to harmonize the data between the sites.
サイト間差は、本質的に2つのタイプのバイアスを含んでいる。技術的なバイアス(つまり測定バイアス)及び生物学的なバイアス(つまり標本バイアス)である。 Site differences inherently include two types of bias. These are technical bias (ie measurement bias) and biological bias (ie sample bias).
測定バイアスは、撮像パラメータ、電界の強さ、MRI装置メーカ及びスキャナの型のようなMRIスキャナの特性の違いを含む。標本バイアスは、サイト間の被験者のグループの相違に関連している。 The measurement bias includes differences in characteristics of the MRI scanner such as imaging parameters, electric field strength, MRI device manufacturer and scanner type. Sample bias is associated with differences in groups of subjects between sites.
以下では、標本バイアスとは独立に、測定バイアスと評価して計測データをハーモナイズするための手法について説明する。 In the following, a method for evaluating measurement bias and harmonizing measurement data independently of sample bias will be described.
(トラベリングサブジェクト法のハーモナイゼーション)
図6は、本実施の形態のrs-fcMRI法において、サイト間を移動しながら計測を受ける移動被験者(以下、「トラベリングサブジェクト」)によるサイト間差の評価手法を説明するための概念図である。以下に説明するように、本実施の形態では、トラベリングサブジェクトのデータセットを使用して、測定バイアスだけを除くことができるようなハーモナイゼーション法について説明する。
(Harmonization of the traveling subject method)
FIG. 6 is a conceptual diagram for explaining a method of evaluating a difference between sites by a moving subject (hereinafter, “traveling subject”) that receives measurement while moving between sites in the rs-fcMRI method of the present embodiment. . As described below, in the present embodiment, a harmonization method in which only the measurement bias can be removed by using a data set of traveling subjects will be described.
図6を参照して、計測サイトMS.1~Ms.Nsのサイトを横断して測定バイアスを評価するために、トラベリングサブジェクトTS1(人数:Nts人)のデータセットを取得する。健康なNts人の参加者の安静時脳活動が、Ns個のサイトの各々で撮像されるものとして、Ns個のサイトは、患者データを撮像したすべてのサイトを含んでいるものとする。取得されたトラベリングサブジェクトのデータセットは、データセンター200における記憶装置210に移動被験者データとして格納される。そして、後述するように、計算処理システム300において、「脳活動バイオマーカのハーモナイズ方法」のための処理が実行される。トラベリングサブジェクトのデータセットは健常者群だけを含む。また、参加者はすべてのサイトにわたって同じとする。したがって、トラベリングサブジェクトについては、サイト間差は「測定バイアス」のみから成る。
Referring to FIG. 6, measurement site MS. 1 to Ms. A dataset of traveling subjects TS1 (number of persons: Nts) is acquired to assess measurement bias across Ns sites. Assuming that resting brain activity of healthy Nts participants is imaged at each of the Ns sites, the Ns sites are assumed to include all sites from which patient data was imaged. The acquired data set of the traveling subject is stored in the
以下に説明する本実施の形態のハーモナイゼーション法では、「脳活動バイオマーカのハーモナイズ方法」として、各計測サイトにおける計測データについて、「測定バイアス」の影響を除いて補正する処理を行う。 In the harmonization method of the present embodiment described below, as a “brain activity biomarker harmonization method”, the measurement data at each measurement site is corrected by removing the influence of the “measurement bias”.
つまり、以下では、「測定バイアス」及び「標本バイアス」を、「統計モデリング」手法のなかの「一般化線形混合モデル(GLMM:Generalized Linear Mixed Model)」を用いて評価する。ここで、通常は、GLM(Generalized Linear Model:一般化線形モデル)は、「応答変数」の確率分布を説明する「説明変数」を組み込んだモデルである。GLMには、「確率分布」「リンク関数」「線形予測子」という主に3つの部品があり、この部品の組み合わせかたを指定することによって、さまざまなタイプのデータを表現できる。 That is, in the following, "measurement bias" and "sample bias" are evaluated using the "Generalized Linear Mixed Model (GLMM)" of the "statistical modeling" methods. Here, normally, a GLM (Generalized Linear Model) is a model that incorporates "explanatory variables" that explain the probability distribution of "response variables". The GLM has three main parts, “probability distribution”, “link function”, and “linear predictor”, and various types of data can be expressed by specifying how to combine these parts.
さらに、GLMM(一般化線形混合モデル)は、GLMでは説明できない「人間が測定できない・測定しなかった個体差など」を組み込むことができる統計モデルである。GLMMでは、たとえば、対象がいくつかの部分集合(たとえば、計測場所が異なる部分集合)からなるような場合も、その場所差をモデルに組み込むことができる。別の言い方をすれば、複数の確率分布を部品とする(混合させた)モデルということになる。 Furthermore, the GLMM (Generalized Linear Mixed Model) is a statistical model that can incorporate "individual differences that humans cannot or cannot measure" that cannot be explained by GLM. In the GLMM, for example, even when an object is composed of several subsets (for example, subsets having different measurement locations), the location difference can be incorporated in the model. In other words, it is a model in which multiple probability distributions are used as components (mixed).
たとえば、GLMMについては、以下の文献に開示がある。公知文献8の開示の全てをここに参照により援用する。
公知文献8:久保 拓弥著、「データ解析のための統計モデリング入門」、岩波書店、2012年 第1刷、2017年 第14刷
For example, the GLMM is disclosed in the following documents. The entire disclosure of WO 03/09312 is incorporated herein by reference.
Publication 8: Takuya Kubo, "Introduction to Statistical Modeling for Data Analysis," Iwanami Shoten, 2012 1st edition, 2017 14th edition
ただし、以下に説明する本実施の形態の統計モデルでは、通常、「効果」と呼ばれるものについて、「バイアス」と「要因(ファクター)」という用語を、「バイアス」に関しては「測定バイアス」と「標本バイアス」に使用し、「要因(ファクター)」に関しては、その他の要因(被験者要因又は疾患要因)に関して使用する。 However, in the statistical model of the present embodiment described below, the terms “bias” and “factor” are generally used for what is called “effect”, and the terms “measurement bias” and “factor” are used for “bias”. Used for "Sample Bias" and "Factor" for other factors (subject factor or disease factor).
そして、以下の解析は、単純なGLMMの流れとは異なり、「固定効果」と「ランダム効果」という分け方をせずに要因の解析を行う。これは、通常、GLMMを使用すると、ランダム効果に関しては分散のみが推定され、各要因の効果の大きさがわからなくなるからである。そこで、以下では、各要因の効果の大きさを評価するために、各要因について、平均0の固定効果となるように、以下のように変数を変換して、推定を行う。 And unlike the flow of a simple GLMM, the following analysis analyzes the factors without dividing it into "fixed effect" and "random effect". This is because normally when using GLMM, only the variance is estimated for random effects, and the magnitude of the effect of each factor is unknown. Therefore, in the following, in order to evaluate the magnitude of the effect of each factor, the variables are converted and estimated as follows so that the average fixed effect is 0 for each factor.
i) 各々の機能的なコネクティビティに対する相関値のすべてのサイトにわたる平均からの偏差として、各サイトの測定バイアスを定義する。
ii) 健常者及び精神疾患の患者の標本バイアスは、互いに異なると仮定する。したがって、健常者群及び各疾患を有する患者群に対して個別に、各サイトの標本バイアスを計算する。
iii) 疾患要因は、健常群の値からの偏差として定義する。
i) Define the measurement bias for each site as the deviation of the correlation value for each functional connectivity from the average across all sites.
ii) It is assumed that the sample biases of healthy subjects and patients with mental disorders differ from each other. Therefore, the sample bias of each site is calculated individually for the healthy subject group and the patient group having each disease.
iii) Disease factor is defined as the deviation from the value of the healthy group.
すなわち、以下では、患者が含まれるデータセットと、トラベリングサブジェクトのデータセットに対して、一般化線形混合効果モデルを以下のように適用する。 In other words, in the following, the generalized linear mixed-effects model is applied as follows to the data set containing the patient and the data set of the traveling subject.
トラベリングサブジェクトが、Nts人であり、Ns個の計測サイトのうち、健常者の計測が行われたサイト数をNsh個とし、ある疾患(ここでは、添え字“dis”で表現する)の患者の計測が行われたサイトの個数をNsd個とする。 The traveling subject is Nts, and Nsh is the number of sites measured in healthy subjects among Ns measurement sites, and the number of sites measured is Nsh, and patients with a certain disease (expressed by the subscript “dis” here) The number of sites measured is Nsd.
参加者要因(p)、測定バイアス(m)、標本バイアス(Shc, Sdis)及び精神疾患要因(d)は、患者に対する計測結果のデータセット及びトラベリングサブジェクトのデータセットからのすべての参加者の機能的なコネクティビティの相関値に、回帰モデルを適合させることにより評価される。 Participant factor (p), measurement bias (m), sample bias (Shc, Sdis) and mental illness factor (d) are the functions of all participants from the measurement data set and the traveling subject data set for the patient. It is evaluated by fitting a regression model to the correlation value of specific connectivity.
以下では、ベクトルは小文字(例えば、m)によって表示され、ベクトルはすべて列ベクトルであると仮定される。ベクトルの要素は、mkのように添字によって表示される。 In the following, vectors are denoted by lowercase letters (eg m) and it is assumed that the vectors are all column vectors. The elements of the vector are represented by subscripts like m k .
脳領野間のn個の相関値からなる機能的コネクティビティベクトル(列ベクトルとする)の回帰モデルは、以下の式のように表される。 A regression model of a functional connectivity vector (column vector) consisting of n correlation values between brain regions is expressed as the following formula.
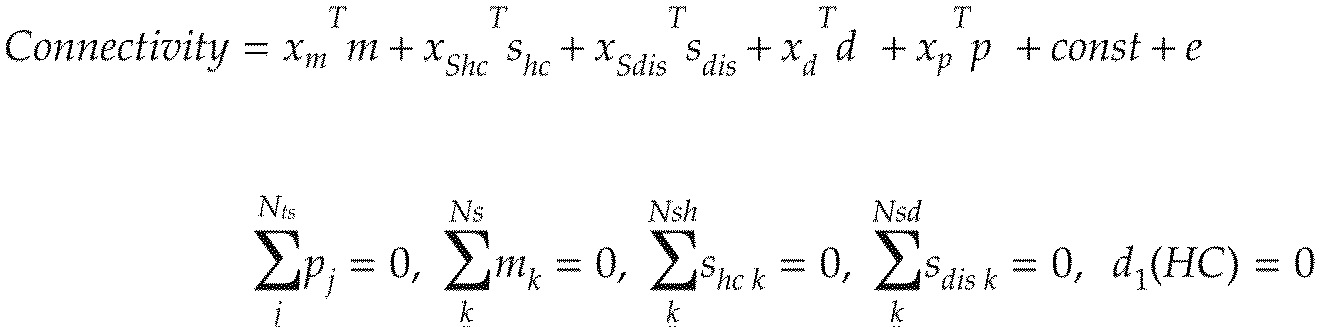
参加者の特性を表わすために、1-of-Kのバイナリコード体系を使用し、サイトkに属する測定バイアスmに対するターゲットベクトル(たとえば、xm)は、1に等しい要素k以外は、全てゼロに等しい。参加者がどんなクラス(健常者、患者、トラベリングサブジェクト)にも属さなければ、ターゲットベクトルは、すべての要素が0に等しいベクトルである。 A 1-of-K binary coding scheme is used to represent the characteristics of the participants, and the target vector (eg, xm) for the measurement bias m belonging to site k is all zero except element k equal to one. equal. If the participant does not belong to any class (healthy, patient, traveling subject), the target vector is a vector in which all elements are equal to 0.
上付きの添字Tは、マトリックスかベクトルの置換を表示し、xTは行ベクトルを表わす。 The superscript T indicates a matrix or vector permutation, and x T indicates a row vector.
ここで、mは、測定バイアス(Ns×1の列ベクトル)を表し、shcは、健常群の標本バイアス(Nsh×1の列ベクトル)を表し、sdisは、患者の標本バイアス(Nsd×1の列ベクトル)を表し、dは、疾患要因(2×1の列ベクトル、健常及び疾患を要素とする)、pは、参加者要因(Nts×1の列ベクトル)を表し、constは、すべての計測サイトからの全ての参加者(健常者、患者、トラベリングサブジェクトを含む)にわたる機能的コネクティビティの平均を表し、e~N(0,γ-1)は、ノイズを表す。 Here, m represents the measurement bias (Ns × 1 column vector), shc represents the sample bias (Nsh × 1 column vector) of the healthy group, and sdis is the patient sample bias (Nsd × 1 column vector). Column vector), d is a disease factor (2 × 1 column vector, healthy and disease are elements), p is a participant factor (Nts × 1 column vector), and const is all Mean functional connectivity across all participants (including healthy subjects, patients, and traveling subjects) from the measurement site, and eN (0, γ −1 ) represent noise.
なお、ここでは、説明の簡略化のための疾患の種類は1種類であるものとして説明している。疾患の種類が複数ある場合については、後述する。 Note that, here, it is assumed that there is one type of disease for simplification of the explanation. The case where there are multiple types of diseases will be described later.
各機能的なコネクティビティの相関値に対しては、回帰モデルの計画行列がランク不足であるので、L2正規化による最小二乗回帰を使用して、それぞれのパラメータを評価する。なお、L2正規化による最小二乗回帰法以外にも、たとえば、ベイズ推定法など別の評価方法を用いることも可能である。 With respect to the correlation value of each functional connectivity, since the design matrix of the regression model has insufficient rank, the least squares regression by L2 normalization is used to evaluate each parameter. In addition to the least-squares regression method by L2 normalization, another evaluation method such as Bayesian estimation method can be used.
上記のような回帰計算の後には、被験者aのb番目のコネクティビティは、以下のように記述できる: After the above regression calculation, the b-th connectivity of subject a can be described as follows:
![]()
![]()
図7は、被験者aのb番目の機能的なコネクティビティの表現を説明するための概念図である。図7においては、1項目と2項目のターゲットベクトルの意義と、測定バイアスベクトル及び健常者の標本バイアスベクトルについて示している。第3項目以降についても同様である。 FIG. 7 is a conceptual diagram for explaining the expression of the b-th functional connectivity of the subject a. In FIG. 7, the significance of the target vector of 1 item and 2 items, the measurement bias vector, and the sample bias vector of a healthy subject are shown. The same applies to the third and subsequent items.
図8は、図2で説明したような相関行列から、バイオマーカとなる判別器を生成する過程を説明する概念図である。 FIG. 8 is a conceptual diagram illustrating a process of generating a discriminator serving as a biomarker from the correlation matrix described in FIG.
図5に示すように、健常群、患者群において測定された安静時機能結合的MRIのデータから、それぞれの被験者について、計算処理システム300が、脳領域間(関心領域間)の活動度の相関行列を導出する。続いて、相関行列の非対角成分について、後述するようにして、対応する測定バイアスを導出しておき、その測定バイアスを相関行例の要素の値から減算することで、ハーモナイゼーション処理を実行する。さらに、ハーモナイゼーション処理が行われた相関行列の要素値と、各被験者についての疾患ラベル(疾患又は健常を示すラベル)との間で、過学習を抑制し、特徴選択を伴う判別モデルを算出して(たとえば、正則化ロジスティック回帰を実施して)、判別器を生成する。
As shown in FIG. 5, the
図9及び図10は、データセンター200の記憶装置210に格納されたデータに基づき、ハーモナイゼーション処理、判別器生成処理、判別処理を実行する計算処理システム300の構成を説明するための機能ブロック図である。
9 and 10 are functional block diagrams for explaining the configuration of the
図5においても説明したように、計算処理システム300は、図5に示した構成と同等のハードウェア構成を有する。そこで、以下では、計算処理システム300内のハードウェア部分については、図5中の対応する符号に“´”を付して説明することにする。
As described with reference to FIG. 5, the
図9を参照して、計算処理システム300は、記憶装置210からのデータ及び計算途中で生成されるデータを格納するための記憶装置2080´と、記憶装置2080´内のデータに対して、演算処理を実行する演算装置2040´とを含む。演算装置2040´としては、たとえば、CPUが相当する。
With reference to FIG. 9, the
演算装置2040´は、プログラムの実行により、患者群及び健常群のMRI計測データ3102について相関行列の要素を算出し、相関行列データ3106として、記憶装置2080´に格納するための相関行列算出部3002と、ハーモナイゼーション処理を実行するハーモナイゼーション算出部3020と、ハーモナイゼーション処理の結果に基づいて、判別器の生成処理及び生成された判別器による判別処理を実行する判別処理部3000とを含む。
The
図10は、図9の構成をより詳しく説明する機能ブロック図であり、図11は、ハーモナイゼーション処理を説明するためのフローチャートである。図10及び図11を参照して、まず、データセンター200の記憶装置210には、各計測サイトから被験者(健常者及び患者)のfMRI計測データ、被験者の属性データ、測定パラメータが収集される(図11 S102)。
FIG. 10 is a functional block diagram for explaining the configuration of FIG. 9 in more detail, and FIG. 11 is a flowchart for explaining the harmonization process. With reference to FIGS. 10 and 11, first, in the
続いて、トラベリングサブジェクトTS1の脳活動が、特に限定されないが、たとえば、所定の周期(たとえば、1年周期)で、各計測サイトを巡回して計測され、データセンター200の記憶装置210には、各計測サイトからトラベリングサブジェクトのfMRI計測データ、被験者の属性データ、測定パラメータが収集される(図11 S104)。
Subsequently, although the brain activity of the traveling subject TS1 is not particularly limited, for example, it is measured by patrolling each measurement site at a predetermined cycle (for example, a one-year cycle), and the
ハーモナイゼーション算出部3020は、上述したようなGLMM(一般化線形混合モデル)を用いることで、機能的コネクティビティについて、各計測サイトの測定バイアスを評価する(図11 S106)。
The
このようにして算出された各計測サイトの測定バイアスを、ハーモナイゼーション算出部3020は、記憶装置2080に測定バイアスデータ3108として格納する(図11
S108)。
The
S108).
(判別器生成処理)
図12は、図10に示した判別処理部3000が、被験者に対する疾患又は健常ラベルについての判別器を生成する処理を示すフローチャートである。このような判別器(又は分類器)は、被験者を診断するための補助情報(支援情報)を提供する。
(Discriminator generation process)
FIG. 12 is a flowchart showing a process in which the
図10及び図12を参照して、相関値補正処理部3004は、記憶装置2080´に格納されている各計測サイトごとの測定バイアスデータ3108を読出し(図12 S202)、判別器生成の機械学習のための訓練対象となる各被験者の相関行列の非対角成分について、以下の式のようにして、ハーモナイゼーション処理を実行する。
With reference to FIGS. 10 and 12, the correlation value

ここで、機能的コネクティビティConnectivityは、ハーモナイゼーション前の機能的コネクティビティベクトルを表し、Csubは、ハーモナイゼーション後の機能的コネクティビティベクトルを表す。また、m(ハット)(以下、文字xの頭部に^が付されたものを“x(ハット)”と表記する)は、上述したようなL2正規化による最小二乗回帰により評価された計測サイトにおける測定バイアスを表す。これにより、機能的コネクティビティConnectivityが計測された計測サイトに対応する測定バイアスが、機能的コネクティビティConnectivityから減算され、ハーモナイゼーション処理を受けることになる(図12
S204)。補正処理が実行された後のデータは、補正後相関値データ3110として、記憶装置2080´に格納される。
Here, the functional connectivity Connectivity represents the functional connectivity vector before harmonization, and Csub represents the functional connectivity vector after harmonization. Further, m (hat) (hereinafter, a character x with a ^ attached to the head thereof is referred to as “x (hat)”) is a measurement evaluated by the least-squares regression by the L2 normalization as described above. Represents the measurement bias at the site. As a result, the measurement bias corresponding to the measurement site where the functional connectivity is measured is subtracted from the functional connectivity and subjected to the harmonization process (FIG. 12).
S204). The data after the correction processing is stored as the corrected
なお、以下の文献にも記載されるように、疾患要因は、脳全体のコネクティビティに関係しているわけではなく、コネクティビティの特定の部分集合に関係している、と仮定する。以下の公知文献9の開示の全てをここに参照により援用する。
Note that, as described in the following literature, it is assumed that disease factors are not related to the connectivity of the whole brain, but are related to a specific subset of connectivity. The entire disclosure of the following
公知文献9:Yahata N, et al. A small number of abnormal brain connections predicts adult autism spectrum disorder. Nat Commun 7, 11254 (2016).
そこで、続いて、判別器生成部3008により、被験者についての疾患/健常ラベルを含む被験者の疾患ラベルと補正処理後の機能的なコネクティビティとについて、特徴選択のための正則化ロジスティック回帰を実行して判別器を生成する(図12 S206)。
Known Document 9: Yahata N, et al. A small number of abnormal brain connections predicts adult autism spectrum disorder.
Then, subsequently, the
まず、ロジスティック関数は、参加者が疾患クラスに属する確率を以下のように定義するために使用される。 First, the logistic function is used to define the probability that a participant will belong to a disease class as follows.
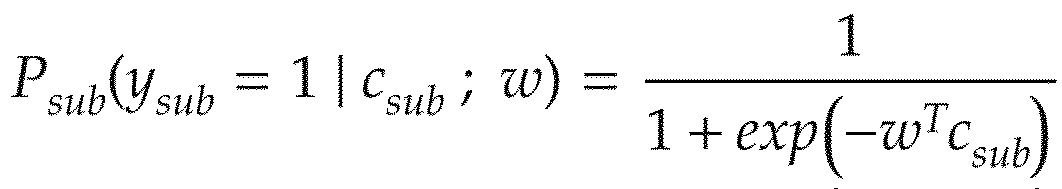
ここで、ysubは、参加者のクラスラベル(診断ラベルが「疾患」のときには、y=1であり、診断ラベルが「健常者」のときには、y=0)であり、wは、重みベクトルを表す。 Here, ysub is a class label of the participant (y = 1 when the diagnostic label is “disease”, y = 0 when the diagnostic label is “healthy”), and w is a weight vector. Represent
正則化ロジスティック回帰としては、L1正則化によるLASSO(least absolute shrinkage and selection operator)を使用するロジスティックスの回帰分析を実施することができ、上述したような、35,778個の結合の中から、機能的なコネクティビティの最適な部分集合を選択する。 As regularized logistic regression, it is possible to carry out a logistic regression analysis using LASSO (least absolute shrinkage and selectionoperator) by L1 regularization. From the 35,778 combinations described above, the function The optimal subset of dynamic connectivity.
すなわち、ここで、重みベクトルwは、以下の関数Jを最小化するように決定される。 That is, here, the weight vector w is determined so as to minimize the following function J.

ここで、nsubは、判別器を生成するための被験者数であり、λは、評価に適用される縮小量を制御するハイパーパラメータを表わす。 Here, nsub is the number of subjects for generating the discriminator, and λ represents a hyperparameter that controls the reduction amount applied to the evaluation.
なお、過学習を抑制して、特徴選択とモデル化を実行するための手法としては、LASSOによる正則化ロジスティック回帰に限定されるものではなく、たとえば、以下の文献に開示されるようなスパースロジスティック回帰、又は他のスパースベイズ推定法など、他の手法を使用してもよい。以下の公知文献10の開示の全てをここに参照により援用する。
It should be noted that the method for suppressing the over-learning and executing the feature selection and the modeling is not limited to the regularized logistic regression by LASSO, and for example, the sparse logistic disclosed in the following documents. Other techniques may be used, such as regression or other Sparse Bayesian estimation methods. The entire disclosure of the following
公知文献10:Okito Yamashita, Masaaki Sato, Taku Yoshioka, Frank Tong, and Yukiyasu Kamitani. “Sparse Estimation automatically selects voxels relevant for the decoding of fMRI activity patterns.” NeuroImage, Vol. 42, No. 4, pp. 1414-1429, 2008. Known document 10: Okita Yamashita, Masaaki Sato, Taku Yoshioka, Frank Tong, and Yukiyasu Kamitani. “Sparse Estimation automatically selects voxels relevant for the decoding of fMRI activity patterns,” 1429, 2008.
以上により、疾患に対する判別器(脳活動バイオマーカの分類器として機能する)が生成され、判別器生成部3008は、判別器を特定するための情報を記憶装置2080´に、判別器データ3112として格納する(図12 S208)。
As described above, a discriminator (which functions as a brain activity biomarker classifier) for a disease is generated, and the
なお、たとえば、判別器の分類性能は、トレーニング・データを使用して、交差検証の手続きによって評価することとすることができる。 Note that, for example, the classification performance of a discriminator can be evaluated by a cross-validation procedure using training data.
以上のような処理は、上述したように、特に限定されないが、所定の期間(たとえば、1年)ごとに実施されるものとしてよい。 As described above, the above process is not particularly limited, but may be performed every predetermined period (for example, one year).
そして、いずれかの計測サイトに、新たに1人の被験者についての機能的コネクティビティの計測が実行された場合、当該計測サイトの測定バイアスは、所定期間の間は一定と仮定できるので、判別値算出部3010は、入力される当該被験者についての入力データの相関行列の要素の値から、上述した手続きですでに算出されている当該入力データが計測された計測サイトに対応する「測定バイアス」を減算することにより、ハーモナイゼーション処理を実行する。そして、上述した手続きにより、すでに図12の手続きで作成されている「判別器」により、当該被験者についての判別ラベルを判別結果として出力する。
Then, when the measurement of the functional connectivity of one subject is newly performed at any of the measurement sites, the measurement bias of the measurement site can be assumed to be constant for a predetermined period. The
判別結果は、「疾患」「健常」の二者のいずれかを示す値であってもよいし、又は、「疾患」「健常」の少なくとも一方の確率を示す値であってもよい。 The discrimination result may be a value indicating either of “disease” and “healthy”, or may be a value indicating the probability of at least one of “disease” and “healthy”.
なお、判別値算出部3010が実施する判別処理に際して、入力される「入力データ」としては、被験者の脳機能活動を表すMRI計測データそのものであってもよいし、又は、各計測サイトにおいて被験者の脳機能活動を表すMRI計測データから相関行列の値を計算した後の相関行列の非対角要素である相関値そのもののデータであってもよい。
In the discrimination processing performed by the discriminant
(新たな計測サイトが追加された場合のハーモナイゼーション算出処理)
図13は、図6において説明したような手続きにより、ハーモナイゼーション処理が実行された後に、新たな計測サイトが追加された場合のハーモナイゼーション処理を説明するための概念図である。図13を参照して、(Ns+1)個目の計測サイトMS.Ns+1が新たに加わった場合、改めて、トラベリングサブジェクトTS1を、また、この(Ns+1)個の計測サイト全体について、巡回させ、上述したハーモナイゼーション算出処理と同様の手続きを行い、測定バイアスを改めて算出することが可能である。
(Harmonization calculation process when a new measurement site is added)
FIG. 13 is a conceptual diagram for explaining the harmonization process when a new measurement site is added after the harmonization process is executed by the procedure described in FIG. 13, the (Ns + 1) th measurement site MS. When Ns + 1 is newly added, the traveling subject TS1 is circulated again for all of the (Ns + 1) measurement sites, and the procedure similar to the above-described harmonization calculation process is performed to calculate the measurement bias again. Is possible.
以上説明したような第1の実施の形態のような処理を実行するシステムにより、複数の施設で計測される脳の活動の計測データに対して、各施設における測定バイアスを調整及び補正することが可能である。これにより、複数の施設での計測データに基づく、脳機能結合相関値を調整することが可能となる。 With the system that executes the processing according to the first embodiment as described above, it is possible to adjust and correct the measurement bias in each facility with respect to the measurement data of the brain activity measured in a plurality of facilities. It is possible. As a result, it becomes possible to adjust the brain function connection correlation value based on the measurement data at a plurality of facilities.
また、第1の実施の形態のような処理を実行するシステムによれば、複数の施設で計測される脳の活動の計測データをハーモナイズして、健常又は疾患の状態を客観的に判断するためのデータを提供することが可能な脳活動分類器のハーモナイズ方法、脳活動分類器のハーモナイズシステム、脳活動解析システム及び脳活動解析方法を実現することができる。 Further, according to the system that executes the processing as in the first embodiment, in order to objectively judge the health or disease state by harmonizing the measurement data of the brain activity measured at a plurality of facilities. It is possible to realize the harmonization method of the brain activity classifier, the harmonization system of the brain activity classifier, the brain activity analysis system, and the brain activity analysis method capable of providing the data of 1.
又は、第1の実施の形態のような処理を実行するシステムによれば、複数の施設で計測される脳の活動の計測データに対して、神経・精神疾患について、脳機能画像法によるバイオマーカ装置、バイオマーカ装置のプログラムを実現することが可能となる。 Alternatively, according to the system that executes the processing as in the first embodiment, the biomarker based on the brain function imaging method for the nerve / mental illness is measured with respect to the measurement data of the brain activity measured at a plurality of facilities. It becomes possible to realize the program of the device and the biomarker device.
[第1の実施の形態の変形例]
なお、以上の説明では、各計測サイトでは、以下の被験者のデータが取得されていることを前提として、ハーモナイゼーション算出処理について説明した。
i)患者のデータ
ii)健常者のデータ
iii)トラベリングサブジェクトのデータ
ただし、上述した「測定バイアス」の評価のみを目的とするのであれば、トラベリングサブジェクトについて計測したデータに基づいて、GLMM(一般化線形混合モデル)により、「測定バイアス」を評価することとしてもよい。
[Modification of First Embodiment]
In the above description, the harmonization calculation process has been described on the assumption that the following test subject data has been acquired at each measurement site.
i) Patient data ii) Healthy subject data iii) Traveling subject data However, if only the above-mentioned "measurement bias" is evaluated, the GLMM (generalized) is used based on the data measured for the traveling subject. The “measurement bias” may be evaluated by a linear mixed model).
すなわち、トラベリングサブジェクトが、Nts人であるとする。参加者要因(p)、測定バイアス(m)は、トラベリングサブジェクトのデータセットからのすべての参加者の機能的なコネクティビティの相関値に、回帰モデルを適合させることにより評価される。ここでも、ベクトルは小文字(例えば、m)によって表示され、ベクトルはすべて列ベクトルであると仮定される。ベクトルの要素は、mkのように添字によって表示される。 That is, it is assumed that the traveling subject is Nts. Participant factor (p), measurement bias (m) are evaluated by fitting a regression model to the correlation value of functional connectivity of all participants from the traveling subject dataset. Again, vectors are denoted by lowercase letters (eg, m) and all vectors are assumed to be column vectors. The elements of the vector are represented by subscripts like m k .
脳領野間のn個の相関値からなる機能的コネクティビティベクトル(列ベクトルとする)の回帰モデルは、以下の式のように表される。 A regression model of a functional connectivity vector (column vector) consisting of n correlation values between brain regions is expressed as the following formula.

参加者の特性を表わすために、1-of-Kのバイナリコード体系を使用し、サイトkに属する測定バイアスmに対するターゲットベクトル(たとえば、xm)は、1に等しい要素k以外は、全てゼロに等しい。 A 1-of-K binary coding scheme is used to represent the characteristics of the participants, and the target vector (eg, xm) for the measurement bias m belonging to site k is all zero except element k equal to one. equal.
上付きの添字Tは、マトリックスかベクトルの転置を表示し、xTは行ベクトルを表わす。 The superscript T indicates the transpose of a matrix or vector, and x T indicates the row vector.
以上のような構成によって、「測定バイアス」を算出して、ハーモナイゼーション処理を実行する構成とすることも可能である。 With the above configuration, it is possible to calculate the "measurement bias" and execute the harmonization process.
第1の実施の形態の手法と、第1の実施の形態の変形例の手法との相違点としては,第1の実施の形態の変形例の手法のようにトラベリングサブジェクトのみを使用する場合には、標本バイアスは考慮しなくてよくなるという利点があることが挙げられる。その反面、第1の実施の形態の手法のように患者のデータと健常者のデータとの双方を含んだ方が、推定に使用されるデータ数が多くなるという利点がある。したがって、標本バイアスを考慮しないことによる測定バイアスの推定精度の向上と、データ数が多いことによる測定バイアスの推定精度の向上とは、互いにトレードオフの関係にあるといえる。 The difference between the method of the first embodiment and the method of the modified example of the first embodiment is that when only the traveling subject is used as in the method of the modified example of the first embodiment. Has the advantage that sample bias does not have to be taken into consideration. On the other hand, including both patient data and healthy subject data as in the method of the first embodiment is advantageous in that the number of data used for estimation increases. Therefore, it can be said that there is a trade-off relationship between the improvement of the estimation accuracy of the measurement bias without considering the sample bias and the improvement of the estimation accuracy of the measurement bias due to the large number of data.
そこで、特に限定されないが、たとえば、現実の運用の中で、各計測サイトにおいて使用する参加者(患者及び健常者)のデータ数については、実験的に最適化をすることも可能である。その場合、特に限定されないが、各計測サイトから抽出する参加者の人数を割り振っておき、各計測サイトでは、ランダムに当該人数分のデータを抽出することとしてもよい。 Therefore, although not particularly limited, for example, it is possible to experimentally optimize the number of data of participants (patients and healthy subjects) used at each measurement site in actual operation. In that case, although not particularly limited, the number of participants to be extracted from each measurement site may be allocated, and each measurement site may randomly extract the data for the number of participants.
[実際の脳活動計測結果に対するデータ及びその解析]
以下では、実際に公開されている多疾患データベースのデータに対して、上述したようなハーモナイゼーション処理を実行した結果について説明する。
[Data and analysis of actual brain activity measurement results]
Below, the result of executing the above-described harmonization process on the data of the multi-disease database that is actually open to the public will be described.
図14は、ハーモナイゼーション処理に使用する、多疾患データベースのデータとトラベリングサブジェクトのデータセットとを示す概念図である。図14(a)に示すように、脳科学に対する戦略的研究プログラム(SRPBS:Strategic Research Program for Brain Sciences)における多疾患データベース(https://bicr-resource.atr.jp/decnefpro/)として、公開されているデータを患者群及び健常群のデータセットを使用する。 FIG. 14 is a conceptual diagram showing the data of the multi-disease database and the data set of the traveling subject used for the harmonization process. As shown in Fig. 14 (a), it is published as a multi-disease database (https://bicr-resource.atr.jp/decnefpro/) in Strategic Research Program for Brain Sciences (SRPBS) for brain science. The existing data is used for the patient group and the healthy group.
多疾患データセットとして、複数の計測サイト(図14では、サイト1、サイト2、サイト3を、典型的に示す)で計測されたデータは、サイト間差として、精神疾患の患者についてのサンプリングバイアスと、健常者についてのサンプリングバイアスと、測定バイアスとを含む。
As the multi-disease data set, the data measured at a plurality of measurement sites (in FIG. 14,
一方、図14(b)に示すように、トラベリングサブジェクトについてのデータセットとして、複数の計測サイト(図14では、サイト1、サイト2、サイト3を、典型的に示す)で計測されたデータは、サイト間差として、測定バイアスのみを含む。
On the other hand, as shown in FIG. 14 (b), as a data set for the traveling subject, data measured at a plurality of measurement sites (in FIG. 14,
データセットの同時分析によってサイト間差を測定バイアス及び標本バイアスに分割することができ、安静時の機能的なコネクティビティ上のそれらの効果サイズを精神疾患のものと定量的に比較する。 Site-by-site differences can be divided into measurement and sample biases by simultaneous analysis of datasets, and their effect sizes on resting functional connectivity compared quantitatively with those of mental illness.
測定バイアスについては、定量的に、異なる撮像パラメータ、MRI装置メーカ、及び各MRIスキャナ中の受信コイルの数について、効果の大きさを比較した。さらに、メカニズムの根本的な「標本バイアス」に関する2つの対立仮説を検討した:
第1の仮説は、サイトがそれぞれ共通の母集団からの被験者をサンプリングすると仮定する。この状況では、標本バイアスは、被験者の無作為抽出のために生じることになり、それは、サイト間の偶然の患者の特性の差に帰着する。
Regarding the measurement bias, the magnitude of the effect was quantitatively compared with respect to different imaging parameters, MRI device manufacturers, and the number of receiving coils in each MRI scanner. In addition, we examined two alternative hypotheses regarding the underlying "sample bias" of the mechanism:
The first hypothesis assumes that each site samples subjects from a common population. In this situation, sample bias will arise due to randomization of the subjects, which results in random differences in patient characteristics between sites.
第2の仮説は、サイトがそれぞれ異なる部分母集団からの被験者をサンプリングすると仮定する。この状況では、標本バイアスは、異なる特性を備えた部分母集団からサンプリングするために生じることになる。 The second hypothesis is that sites sample subjects from different subpopulations. In this situation, sample bias will arise due to sampling from subpopulations with different characteristics.
例えば、大うつ病性障害の患者の同じ母集団からデータを集めることを複数のサイトが計画すると仮定する。大うつ病性障害のサブタイプは、非定型うつ病及びメランコリー型うつ病のような母集団内に存在する。したがって、1つの部分母集団は、非定型うつ病の多くの患者を含む一方、別の部分母集団は、メランコリー型うつ病の多くの患者を含む可能性がある。したがって、いくつかの実例では、非定型うつ病はサイトAの患者において、より出現頻度が高く、一方で、メランコリー型うつ病は、サイトBの患者においてより出現頻度が高いかもしれない。 For example, assume multiple sites plan to collect data from the same population of patients with major depressive disorder. Subtypes of major depressive disorder exist within populations such as atypical depression and melancholic depression. Thus, one subpopulation may include many patients with atypical depression, while another subpopulation may include many patients with melancholic depression. Thus, in some instances, atypical depression may occur more frequently in Site A patients, while melancholic depression may occur more frequently in Site B patients.
大規模データセットを集めるための基本的なプロトコルは、このような2つの仮説の間で異なることになる。したがって、SRPBSデータセットの特性を最も適切に反映する仮説を決定することが必要である。 The basic protocol for collecting large datasets will differ between these two hypotheses. Therefore, it is necessary to determine the hypothesis that best reflects the characteristics of the SRPBS dataset.
前者の仮定の下では、少数のサイトであっても、単に、多くの被験者からデータを集めることが必要になるだけである。後者の仮定の下では、真に代表的なデータを得るためには、複数のサイトからデータを取得することが、必要となる。 Under the former assumption, it is only necessary to collect data from many subjects, even for a small number of sites. Under the latter assumption, it is necessary to obtain data from multiple sites in order to get truly representative data.
サイト間差に関連したこれらの制限を克服するために、トラベリングサブジェクトのデータセットを使用して、測定バイアスだけを除くことができるようなハーモナイゼーション法を実行する。 To overcome these limitations associated with site-to-site differences, use a traveling subject's data set to perform a harmonization method that can eliminate measurement bias only.
新しく提案する方法及び既存の方法によってハーモナイズされた複数サイトの安静時の機能結合MRIデータに基づいて、被験者の情報(属性)(例えば、年齢)の回帰モデル及び精神疾患のバイオマーカを構築した。 A regression model of subject information (attribute) (eg, age) and a biomarker for mental illness were constructed based on resting function-coupled MRI data of multiple sites harmonized by the newly proposed method and existing method.
これらの予測モデルの性能が、ハーモナイゼーションの方法に基づいて、どのように変わるか調べた。 We investigated how the performance of these prediction models would change based on the harmonization method.
(使用したデータセット)
以下のような3つの安静時の機能MRIデータセットを使用した:
(1)SRPBSの複数疾患のデータセット、
(2)19人のトラベリングサブジェクトデータセット、及び
(3)独立した検証用データセット。
(Data set used)
We used three resting functional MRI datasets:
(1) SRPBS multiple disease data set,
(2) 19 traveling subject datasets, and (3) independent validation datasets.
(SRPBSの多疾患のデータセット)図15は、SRPBSの多疾患データセットの内容を示す図である。9つのサイトで診察された、5つの異なる疾患患者及び健常な対照群(HC)を含んだこのデータセットは、以下の合計805人の参加者のデータを含んでいた:9つのサイトからの482人の健常者;5つのサイトからの、161人の大うつ病(MDD)患者;1つのサイトからの49人の自閉症(ASD)患者;1つのサイトからの65人の強迫障害(OCD)の患者;及び3つのサイトからの48人の統合失調症(SCZ)患者。 (SRPBS Multi-disease Data Set) FIG. 15 is a diagram showing the contents of the SRPBS multi-disease data set. This dataset, which included 5 different diseased patients and a healthy control group (HC) examined at 9 sites, contained data for a total of 805 participants: 482 from 9 sites. Healthy subjects; 161 major depression (MDD) patients from 5 sites; 49 autism (ASD) patients from 1 site; 65 obsessive-compulsive disorder (OCD) from 1 site ) Patients; and 48 schizophrenia (SCZ) patients from 3 sites.
図16は、各計測サイトにおける撮像プロトコルを示す図である。安静時の機能MRIデータは、3つのサイト以外のすべてで統一された撮像プロトコルを使用して得られた。(http://www.cns.atr.jp/rs-fmri-protocol-2/) FIG. 16 is a diagram showing an imaging protocol at each measurement site. Resting functional MRI data was obtained using a unified imaging protocol at all but three sites. (Http://www.cns.atr.jp/rs-fmri-protocol-2/)
このデータセットのサイト間差は、測定及び標本バイアスの両方を含んでいた。バイアス評価については、統一プロトコルを使用して得られたデータのみを使用した。なお、OCD患者はこの統一プロトコルを使用して、スキャンされなかったので、OCDのために疾患要因を評価することは行っていない。 Site-to-site differences in this dataset included both measurement and sample bias. For bias assessment, only data obtained using the unified protocol were used. It should be noted that OCD patients have not been evaluated for disease factors for OCD because they were not scanned using this unified protocol.
表中の略号は、以下のようである。 The abbreviations in the table are as follows.
ATT:国際電気通信基礎技術研究所のシーメンスTimTrioスキャナ;
ATV:国際電気通信基礎技術研究所のシーメンスVerioスキャナ;
KUT:京都大学のシーメンスTimTrioスキャナ;
SWA:昭和大学;
HUH:広島大学病院;
HKH:ヒロシマKajikawa病院;
COI:COI(広島大学);
KPM:京都府立医科大学;
UTO:東京大学;
ASD:自閉症障害。
MDD:大うつ病性障害
OCD:強迫障害。
SCZ:統合失調症
SIE:シーメンスfMRI装置。
GE:GE fMRI装置。
PHI:フィリップスfMRI装置。
ATT: Siemens Tim Trio Scanner at International Telecommunications Research Institute;
ATV: Siemens Verio Scanner from International Telecommunications Research Institute;
KUT: Siemens Tim Trio scanner from Kyoto University;
SWA: Showa University;
HUH: Hiroshima University Hospital;
HKH: Hiroshima Kajikawa Hospital;
COI: COI (Hiroshima University);
KPM: Kyoto Prefectural University of Medicine;
UTO: The University of Tokyo;
ASD: Autism disorder.
MDD: Major depressive disorder OCD: Obsessive-compulsive disorder.
SCZ: Schizophrenia SIE: Siemens fMRI machine.
GE: GE fMRI device.
PHI: Philips fMRI machine.
(トラベリングサブジェクトのデータセット)
SRPBSデータセット中の計測サイトを横断して測定バイアスを評価するために、トラベリングサブジェクトのデータセットを取得した。
(Traveling subject dataset)
A dataset of traveling subjects was acquired to assess measurement bias across the measurement sites in the SRPBS dataset.
健康な9人の参加者(すべての男性; 年齢層: 24-32歳; 平均年齢: 27±2.6歳)が、12のサイトの各々で撮像され、12のサイトにはSRPBSデータセットを撮像した9つのサイトを含んでおり、合計411セッションの操作が実施された。 Nine healthy participants (all males; age group: 24-32 years; average age: 27 ± 2.6 years) were imaged at each of 12 sites, with 12 sites containing the SRPBS dataset. A total of 411 sessions of operations were performed, including the nine sites imaged.
SRPBSの複数疾患のデータセットと同じ撮像プロトコルを使用して、このデータセットを得ることを試みたものの、各サイトのパラメータ・セッティング又は慣習的なスキャン条件の制限のために、サイト間では、撮像プロトコルにいくつかの違いがあった。たとえば、2つの位相エンコード方式の方向(P→AとA→P)、3社のMRIメーカ(シーメンス、GE及びフィリップス)、4つのコイル・チャンネル数(8、12、24及び32)及び7つのスキャナ・タイプ(TimTrio、Verio、Skyra、スペクトル、MR750W、SignaHDxt及びAchieva)というような相違が存在する。 Although we attempted to obtain this dataset using the same imaging protocol as the multi-disease dataset of SRPBS, imaging between sites was limited due to parameter setting or customary scanning condition limitations at each site. There were some differences in the protocols. For example, two phase encoding directions (P → A and A → P), three MRI makers (Siemens, GE and Philips), four coil channel numbers (8, 12, 24 and 32) and 7 There are differences such as scanner type (TimTrio, Verio, Skyra, Spectral, MR750W, SignaHDxt and Achieva).
同じ9人の参加者が12のサイトにわたって撮像されたので、このデータセットのサイト間差は測定バイアスのみを含んでいた。 Since the same 9 participants were imaged across 12 sites, the inter-site differences in this dataset included only measurement bias.
(独立した検証データセット)
安静時の機能結合MRIデータに基づいた、精神疾患の分類器及び参加者の年齢を予測するモデルの汎化性能を検証するために、2つの疾患及び7つのサイトをカバーする独立した検証コホートのデータを取得した。このデータには、合計625人の参加者が含まれていた。すなわち、6つのサイトからの476人の健常群(HCs)、2つのサイトからのMDDの93人の患者、及び1つのサイトからのSCZの56人の患者のデータが取得された。
(サイト間差と疾患効果の視覚化)
最初に、主成分分析(PCA:principal component analysis)によって、SRPBS複数疾患の安静時の機能結合MRIデータセットにおける、サイト間差及び疾患効果を視覚化した。図17は、このような主成分分析によるサイト間差及び疾患効果を視覚化を示すグラフである。ここでの主成分分析は、教師なしの学習による次元低減手法に相当する。
被験者の機能的なコネクティビティは、上述したように、各参加者に対して2つの脳領域間の安静時の機能MRIの血中酸素濃度に依存する(BOLD)信号の時間的な相関性(ピアソンの相関係数を使用)として計算された。
(Independent verification data set)
To validate the generalization performance of a classifier of mental illness and a model for predicting age of participants based on resting functionally coupled MRI data, an independent validation cohort covering 2 diseases and 7 sites was developed. I got the data. This data included a total of 625 participants. That is, data for 476 healthy groups (HCs) from 6 sites, 93 patients with MDD from 2 sites, and 56 patients with SCZ from 1 site were acquired.
(Visualization of site difference and disease effect)
Initially, principal component analysis (PCA) visualized inter-site differences and disease effects in the functionally coupled MRI data set at rest for SRPBS multiple diseases. FIG. 17 is a graph showing visualization of differences between sites and disease effects by such principal component analysis. The principal component analysis here corresponds to a dimension reduction method by unsupervised learning.
The functional connectivity of the subject is, as described above, dependent on the blood oxygen concentration (BOLD) signal temporal correlation of the functional MRI at rest between the two brain regions for each participant (Pearson). (Using the correlation coefficient of the above).
機能的なコネクティビティは、全体の脳をカバーする268のノード(つまり脳領域)から成る機能的な脳地図に基づいて、定義される。 -Functional connectivity is defined based on a functional brain map consisting of 268 nodes (that is, brain regions) covering the entire brain.
機能結合の相関を表すマトリックスの下三角行列の35,778個(つまり、(268×267)/2)の結合強度(コネクティビティ)の値が使用される。 The value of the connection strength of 35,778 (that is, (268 x 267) / 2) of the lower triangular matrix of the matrix showing the correlation of the functional connection is used.
図17に示すように、SRPBS複数疾患のデータセット中の参加者のデータはすべて、最初の2つの主成分から成る2つの軸の上でプロットされた。すなわち、SRPBS複数疾患のデータセットのすべての参加者は、小さい薄い色のマーカによって示されるように、最初の2つの主成分(PC)へ投影されている。 各サイトのすべての健常な対照群間の平均及び各精神疾患内の平均は、濃い色がつけられたマーカとして示される。マーカの色は、サイトを表わし、形は精神疾患を表わす。 As shown in FIG. 17, all participant data in the SRPBS multi-disease dataset were plotted on two axes consisting of the first two principal components. That is, all participants in the SRPBS multi-disease dataset are projected onto the first two principal components (PCs), as indicated by the small light-colored markers. The mean between all healthy controls on each site and the mean within each mental illness is shown as darkened markers. The color of the marker represents the site and the shape represents the mental illness.
主成分1に対して、HUHサイトが明瞭に分離しており、それは、データの中の分散のほとんどを説明するほどであった。ASDの患者はSWAのサイトのみでスキャンされた。したがって、このサイトでスキャンされたASD(▲)の患者及び健常群HC(●)の平均は、ほとんど同一の位置へプロットされている。図17では、複数疾患のデータセットにおけるPCAによる次元削減が示される。
The HUH site was clearly separated from the
(バイアス評価)
定量的に安静時の機能結合MRIデータのサイト間差を調べるために、測定バイアス、標本バイアス及び診断の要因を特定した。上述したように、各々の機能的なコネクティビティに対する相関値のすべてのサイトにわたる平均からの偏差として、各サイトの測定バイアスを定義した。健常者及び精神疾患の患者の標本バイアスは、互いに異なると仮定する。したがって、健常者群及び各疾患を有する患者群に対して個別に、各サイトの標本バイアスを計算した。
(Bias evaluation)
In order to quantitatively investigate site differences in functionally coupled MRI data at rest, measurement bias, sample bias and diagnostic factors were identified. As described above, the measurement bias for each site was defined as the deviation of the correlation value for each functional connectivity from the average across all sites. We assume that the sample biases of healthy and mentally ill patients differ from each other. Therefore, the sample bias of each site was calculated individually for the healthy subject group and the patient group having each disease.
疾患要因は、健常群の値からの偏差として定義された。複数のサイトでサンプリングされた患者群であったという理由で、標本バイアスは、MDDとSCZの患者に対して評価された。 統一プロトコルを使用してはOCDの患者がスキャンされなかったので、疾患要因は、MDD、SCZ及びASDに対して評価された。サイト間で2つのタイプのバイアスは、同時に変化するので、SRPBS複数疾患のデータセットだけを使用してサイト間差を測定バイアス及びサンプリングに分離するのは難しい。 The disease factor was defined as the deviation from the value of the healthy group. Specimen bias was assessed for MDD and SCZ patients because it was a group of patients sampled at multiple sites. Disease factors were evaluated for MDD, SCZ and ASD as no patients with OCD were scanned using the Unified Protocol. Since the two types of bias between sites change simultaneously, it is difficult to separate intersite differences into measurement bias and sampling using only the SRPBS multiple disease dataset.
対照的に、トラベリングサブジェクトのデータセットでは、参加者は固定されているので、測定バイアスのみを含んでいた。 In contrast, in the traveling subject data set, the participants were fixed and therefore included only the measurement bias.
トラベリングサブジェクトをSRPBS複数疾患のデータセットと組み合わせることによって、異なるサイトによって影響を受けた異なる要因として、同時に測定バイアス及びサンプリングを評価した。機能的なコネクティビティに対する両方のタイプのバイアスと疾患の要因の効果を評価するために、以下のように、「線形混合効果モデル」を利用した。 By combining the Traveling Subject with the SRPBS multi-disease dataset, we simultaneously assessed measurement bias and sampling as different factors affected by different sites. To assess the effects of both types of bias and disease factors on functional connectivity, a "linear mixed-effects model" was utilized as follows.
(SRPBS複数疾患のデータセットに対する線形混合効果モデル)
線形混合効果モデルでは、SRPBS複数疾患のデータセットの各被験者のコネクティビティの相関値は、固定効果及びランダム効果からなる。固定効果は、ベースラインとしてすべての参加者及びすべてのサイトをにわたる平均相関値と、測定バイアス、標本バイアス及び疾患要因の和を含む。参加者の要因(つまり個人差)及びスキャン間の変化の結合した効果は、ランダム効果と見なされる。
(Linear mixed-effects model for SRPBS multiple disease dataset)
In the linear mixed-effects model, the correlation value of connectivity for each subject in the SRPBS multi-disease dataset consists of fixed and random effects. Fixed effects include the mean correlation value across all participants and all sites as a baseline, plus measurement bias, sample bias and disease factors. The combined effects of participant factors (ie individual differences) and changes between scans are considered random effects.
(バイアス及び要因の評価の詳細)
参加者要因(p)、測定バイアス(m)、標本バイアス(shc, smdd, sscz)及び精神疾患要因(d)は、SRPBS複数疾患のデータセット及びトラベリングサブジェクトのデータセットからのすべての参加者の機能的なコネクティビティの相関値に回帰モデルを適合させることにより評価された。
(Details of evaluation of bias and factors)
Participant factor (p), measurement bias (m), sample bias (shc, smdd, sscz) and mental illness factor (d) are for all participants from the SRPBS multiple disease dataset and the traveling subject dataset. It was evaluated by fitting a regression model to the correlation value of functional connectivity.
この例では、ベクトルは小文字の太字(例えばm)によって表示され、ベクトルはすべて列ベクトルであると仮定される。ベクトルの要素は、mkのように添字によって表示される。 In this example, the vectors are shown in lowercase bold (eg, m) and all vectors are assumed to be column vectors. The elements of the vector are represented by subscripts like m k .
上述したのと同様に、参加者の特性を表わすために、1-of-Kのバイナリコード体系を使用し、サイトkに属する測定バイアスmに対するターゲットベクトル(たとえば、xm)は、1に等しい要素k以外は、全てゼロに等しい。したがって、参加者がどんなクラスにも属さなければ、ターゲットベクトルは、すべての要素が0に等しいベクトルである。 As before, we use a 1-of-K binary coding scheme to characterize the participants, and the target vector (eg, xm) for the measurement bias m belonging to site k is an element equal to 1. All except k are equal to zero. Therefore, if the participants do not belong to any class, the target vector is a vector with all elements equal to 0.
上付きの添字Tは、マトリックスかベクトルの転置を表示し、xTは行ベクトルを表わす。 The superscript T indicates the transpose of a matrix or vector, and x T indicates the row vector.
各コネクティビティについては、回帰モデルは以下のように書くことができる。 For each connectivity, the regression model can be written as:
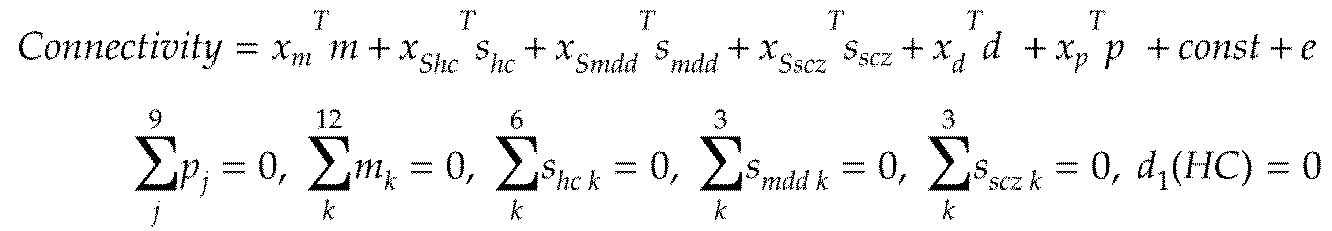
(トラベリングサブジェクトのデータセットに対する線形混合効果モデル)
トラベリングサブジェクトのデータセットに対する線形混合効果モデルは、トラベリングサブジェクトのデータセットにおいて特定のスキャンに対する各参加者のコネクティビティの相関値は、固定効果及びランダム効果からなる。固定効果は、すべての参加者及びすべてのサイトをにわたる平均相関値と、参加者要因と、測定バイアスとの和を含む。スキャン間の変化は、ランダム効果と見なされた。
(Linear mixed-effects model for the traveling subject dataset)
In the linear mixed-effects model for the traveling subject dataset, the correlation value of each participant's connectivity to a particular scan in the traveling subject dataset consists of a fixed effect and a random effect. Fixed effects include the sum of average correlation values across all participants and all sites, participant factors and measurement bias. Changes between scans were considered random effects.
各参加者に対して、すべての参加者にわたった平均からの脳機能コネクティビティの相関値の偏差として、参加者要因を定義した。 For each participant, the participant factor was defined as the deviation of the correlation value of brain function connectivity from the average across all participants.
2つの異なるデータセットの機能的なコネクティビティの相関値に、同時に前述の2つの回帰モデルをフィッティングさせることにより、すべてのバイアス及び要因を評価した。 この回帰分析においては、SRPBS複数疾患のデータセットの中で、統一された撮像プロトコルを使用してスキャンされた参加者、及びトラベリングサブジェクトのデータセットのすべての参加者からのデータを使用した。 All biases and factors were evaluated by fitting the above two regression models to the correlation value of functional connectivity of two different data sets at the same time. In this regression analysis, we used data from the participants in the SRPBS multi-disease dataset that were scanned using the unified imaging protocol and from all participants in the traveling subject dataset.
以上を要約すると、バイアス又は各要因は、それぞれ、コネクティビティの相関値の数(つまり35,778個)を反映する次元を含んだベクトルとして評価された。 このさらなる分析に含まれるベクトルは、12サイトでの測定バイアスと、6つのサイトでのHCの標本バイアスと、3つのサイトでのMDD患者に対する標本バイアスと、3つのサイトでのSCZ患者に対する標本バイアスと、9人のトラベリングサブジェクトの参加者要因と、MDD、SCZ及びASDの診断の要因である。 To summarize the above, each bias or each factor was evaluated as a vector including a dimension that reflects the number of connectivity correlation values (that is, 35,778). Vectors included in this further analysis include measurement bias at 12 sites, sample bias for HC at 6 sites, sample bias for MDD patients at 3 sites, and sample bias for SCZ patients at 3 sites. And the participant factors of 9 traveling subjects and the factors of diagnosis of MDD, SCZ and ASD.
(寄与サイズの分析)
定量的に要因間の大きさの関係を確認するために、線形混合効果モデルにおいて、寄与サイズを計算し比較して、各タイプのバイアス及び要因が、どの程度、データの分散を説明するのかを決定した。モデルに適合した後、被験者aからのb番目のコネクティビティは、以下のように記述できる。
(Analysis of contribution size)
To quantitatively confirm the magnitude relationship between factors, we calculated and compared contribution sizes in a linear mixed-effects model to determine how much each type of bias and factor explains the variance of the data. Decided. After fitting the model, the b-th connectivity from subject a can be described as:
![]()
![]()
例えば、このモデル中で、測定バイアス(つまり最初の項)の寄与サイズは、以下の通り計算された。 For example, in this model, the contribution size of the measurement bias (ie the first term) was calculated as follows.
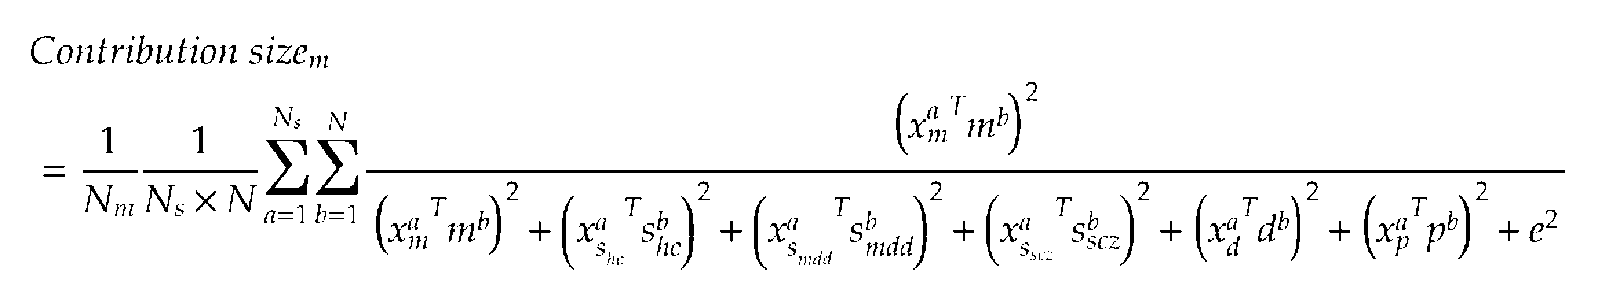
これらの式は、測定バイアス(例えば、位相エンコーディング方向、スキャナ、コイル及びfMRIメーカ)と関係する個々の要因の寄与サイズを評価するために使用された。特に、測定バイアスをこれらの要因へ分解し、その後、関連するパラメータが評価された。他のパラメータは、それ以前に評価したものと同じ値に固定された。 These equations were used to evaluate the contribution size of individual factors related to measurement bias (eg phase encoding direction, scanner, coil and fMRI maker). In particular, the measurement bias was decomposed into these factors, after which the relevant parameters were evaluated. The other parameters were fixed at the same values as previously evaluated.
寄与サイズの評価からは、以下のことが分かった。 From the evaluation of the contribution size, the following was found.
1)機能的なコネクティビティに対する測定バイアスの効果サイズは、参加者要因より小さいことを示すものの、ほとんど疾患要因のものより大きく、測定バイアスが精神疾患に関する研究で重大な制限となることを示唆する。
2)標本バイアスにおける最も大きな分散は、MDD要因の分散よりも有意に大きく、標本バイアスにおける最も小さな分散は、疾患要因に対する分散の2分の1であった。このことは、標本バイアスは、また、精神疾患に関する研究で重大な制限となることを示唆する。
3)参加者要因の標準偏差は、SCZ,MDD,及びASDの疾患要因に対する標準偏差の約2倍であった。したがって、健常者の母集団内における個人の変動は、すべての機能結合を考慮した場合は、SCZ,MDD,及びASDの患者間よりも大きかった。
4)さらに、測定バイアスの標準偏差は、疾患要因の標準偏差よりも、大抵は大きく、一方で、サンプリンバイアスの標準偏差は、疾患要因の標準偏差と同程度であった。そのような関係性は、精神疾患又は発達障害に対する、安静時の機能結合MRIに基づく分類器を開発することを、大変、困難なものにしている。非常に少ない数の疾患に特定的な、又は、測定サイトに独立な異常な機能結合を、多数の結合から選択できる場合にのみ、複数のサイトについて、ロバストで、汎化可能な分類器を生成することを可能とする。
1) Although the effect size of measurement bias on functional connectivity is smaller than that of participant factors, it is larger than that of most disease factors, suggesting that measurement bias is a significant limitation in studies on mental illness.
2) The largest variance in sample bias was significantly larger than the MDD factor variance, and the smallest variance in sample bias was one-half the variance for disease factors. This suggests that sample bias may also be a significant limitation in studies on mental illness.
3) The standard deviation of participant factors was about twice the standard deviation for disease factors of SCZ, MDD, and ASD. Thus, individual variability within the healthy population was greater than among SCZ, MDD, and ASD patients when considering all functional connections.
4) Furthermore, the standard deviation of the measurement bias was usually greater than the standard deviation of the disease factor, while the standard deviation of the sampling bias was comparable to the standard deviation of the disease factor. Such relationships make it very difficult to develop resting functionally coupled MRI-based classifiers for mental disorders or developmental disorders. Generate robust, generalizable classifiers for multiple sites only if a large number of unusual functional connections specific to a very small number of diseases or independent of measurement sites can be selected It is possible to do.
(測定バイアスに対する階層的クラスタリング分析)
各サイトkに対して、測定バイアスmk(N×1、ここで、Nは、機能的なコネクティビティの個数)間のピアソンの相関係数を計算し、測定バイアスにわたる相関係数に基づいた階層的クラスタリング分析を行なった。図18は、階層的クラスタリング分析による樹状図である。樹状図中の各リンケージの高さは、そのリンクによって連結されたクラスタ間で非類似性(1-r)を表わす。
(Hierarchical clustering analysis for measurement bias)
For each site k, calculate the Pearson's correlation coefficient between the measurement biases mk (N × 1, where N is the number of functional connectivity), and calculate the hierarchical coefficient based on the correlation coefficient across the measurement biases. Clustering analysis was performed. FIG. 18 is a dendrogram by the hierarchical clustering analysis. The height of each linkage in the dendrogram represents the dissimilarity (1-r) between the clusters connected by that link.
測定バイアスの特性を調べるにあたり、12か所のサイトに対して、評価された測定バイアスベクトルの類似性が、位相エンコードの方向、MRIメーカ、コイル・タイプ及びスキャナ・タイプのようなMRIスキャナの特定の特性を反映するものかどうかを調べた。 In examining the characteristics of the measurement bias, the similarity of the measured measurement bias vectors to the 12 sites was determined by identifying the MRI scanner such as phase encoding direction, MRI manufacturer, coil type and scanner type. It was investigated whether it reflects the characteristics of.
測定バイアスに対する同様のパターンのクラスタを発見するために、階層的クラスタ分析を使用した。その結果、図18に示すように、12のサイトの測定バイアスは、最初のレベルで、位相エンコードの方向のクラスタに分割された。測定バイアスは、第2のレベルで、fMRIメーカのクラスタに分割され、さらに、コイル・タイプ・クラスタへさらに分割され、そして、スキャナ・モデル・クラスタに分割された。 Hierarchical cluster analysis was used to discover similar patterns of clusters to measurement bias. As a result, as shown in FIG. 18, the measurement bias of the 12 sites was divided into clusters in the direction of phase encoding at the first level. The measurement bias was divided at a second level into fMRI maker clusters, further into coil type clusters, and then into scanner model clusters.
図19は、各要因についての寄与サイズを示す図である。図19に示すように、各要因の寄与を評価するために、同じモデルを使用することにより、定量的に要因の大きさの関係を確認した。 FIG. 19 is a diagram showing the contribution size for each factor. As shown in FIG. 19, in order to evaluate the contribution of each factor, the same model was used to quantitatively confirm the relationship between the sizes of the factors.
寄与サイズは、位相エンコーディング方向(0.0391)に対して最大であり、続いて、fMRIメーカ(0.0318)、コイル・タイプ(0.0239)及びスキャナ・モデル(0.0152)が、これに続くという関係であった。これらにより、測定バイアスに影響を及ぼす主な要因が、位相エンコーディング方向、続いて、fMRIメーカ、コイル・タイプ及びスキャナ・モデルの相違であることを示す。 Contribution size was the largest in the phase encoding direction (0.0391), followed by fMRI maker (0.0318), coil type (0.0239) and scanner model (0.0152). These show that the main factor affecting the measurement bias is the phase encoding direction followed by the difference in fMRI maker, coil type and scanner model.
(部分母集団の中からサンプリングによる標本バイアス)
上述したような「標本バイアス」の背景にあるメカニズムの2つの択一的なモデルを調べた。図20は、「標本バイアス」の背景にあるメカニズムを示す概念図である。
(Sample bias from sampling from the subpopulation)
We examined two alternative models of the mechanism behind the "sample bias" as described above. FIG. 20 is a conceptual diagram showing the mechanism behind “sample bias”.
図20(A)に示す「単一の母集団のモデル」では、参加者が共通の母集団からサンプリングされると仮定するものである。各参加者の機能的なコネクティビティの相関値は、ガウス分布から生成される。
図20(B)に示す「異なる部分母集団のモデル」では、標本バイアスは、部分的には参加者が各サイトで異なる部分母集団の中からサンプリングされることにより生じると仮定している。部分母集団の平均がサイト間で異なり、ガウス分布から生成される。 さらに、各参加者の機能的なコネクティビティの相関値は、各サイトで部分母集団の平均に基づいて、ガウス分布から生成される。
The “single population model” shown in FIG. 20 (A) assumes that participants are sampled from a common population. The functional connectivity correlation value for each participant is generated from a Gaussian distribution.
In the “model of different subpopulations” shown in FIG. 20B, it is assumed that the sample bias is caused, in part, by participants being sampled from different subpopulations at each site. The mean of the subpopulations varies between sites and is generated from a Gaussian distribution. Furthermore, the functional connectivity correlation value for each participant is generated from a Gaussian distribution based on the average of the subpopulations at each site.
いずれのモデルが複数のサイトにわたって、ビッグデータを集めるのに、よりふさわしいか決めることが必要である。なぜなら、もしも前者のモデルが正しい場合、サイトの数が少なくても、取得されたデータは、参加者の数を増加させることにより母集団を表わすために使用されうる。一方で、後者のモデルが正しい場合、非常に大きなサンプルサイズである場合でさえ、1つのサイトは、真実の全母集団分布を表わすとは言えないので、データは多くのサイトから集められるべきである。 It is necessary to decide which model is more suitable for collecting big data across multiple sites. Because, if the former model is correct, then even with a small number of sites, the acquired data can be used to represent the population by increasing the number of participants. On the other hand, if the latter model is correct, data should be collected from many sites, as one site may not represent the true total population distribution, even for very large sample sizes. is there.
各モデルについては、各サイトの参加者の数が機能的なコネクティビティにおける標本バイアスに対する効果をどのように決定するかについて、最初に調べた。機能的なコネクティビティにわたる標本バイアスに対する分散値に基づいて、効果の大きさを測定した。どの値が使用されるかに基づいた相違が本質的にあるわけではないものの、統計分析を単純化するために標準偏差の代わりに分散を使用した。 For each model, we first looked at how the number of participants at each site determines the effect on sample bias in functional connectivity. The magnitude of the effect was measured based on the variance value for the sample bias over the functional connectivity. Variance was used in place of standard deviation to simplify statistical analysis, although there is essentially no difference based on which value is used.
モデルが、それぞれ参加者の数と、標本バイアスの分散の間の異なる関係性を表わすことを理論付けた。したがって、修正された赤池情報量基準(AICc)とベイズ情報量基準(BIC)とを比較することにより、このデータにおける実際の関係性を、いずれのモデルが表しているのかを調べた。さらに、1つのサイトを除いたすべてのサイトをモデル生成に使用して、標本バイアスの分散を残りのサイトにそのモデルで予測するという予測性能に対する一サイト抜き交差検証を行った。その後、2つのモデル間の予測性能を比較した。 Theorized that the models each represent a different relationship between the number of participants and the variance of the sample bias. Therefore, by comparing the modified Akaike information criterion (AICc) with the Bayesian information criterion (BIC), we investigated which model represented the actual relationship in this data. In addition, one-site cross-validation was performed on the predictive performance of using all but one site for model generation and predicting the variance of the sample bias for the remaining sites with that model. Then, the prediction performance between the two models was compared.
それらの結果からは、このデータに対しては、単一の母集団のモデルより異なる部分母集団のモデルがよりよく適合することを示した。(異なる部分母集団のモデル: AICc = -108.80及びBIC= -113.22; 単一の母集団のモデル: AICc = -96.71及びBIC = -97.92)。さらに、予測性能は、単一の母集団のモデルより異なる部分母集団のモデルには有意により高かった。(絶対誤差に適用されたウィルコクソンの符号付順位検定では、以下の通り: p = 0.0469、サイン・ランク= 19、n = 6) The results showed that different subpopulation models fit the data better than single population models. (Models of different subpopulations: AICc = -108.80 and BIC = -113.22; Models of a single population: AICc ==-96.71 and BIC = -97.92). Furthermore, the predictive performance was significantly higher for the different subpopulation models than for the single population model. (The Wilcoxon signed-rank test applied to the absolute error is as follows: p = 0.0469, sine rank = 19, n = 6)
この結果は、標本バイアスが、単一の大きな母集団からの無作為抽出によってもたらされるだけでなく、異なる部分母集団の中からサンプリングすることによっても引き起こされることを示している。標本バイアスは、有限な数のサイト及び参加者から得られた測定に基づいて、健常対照群又は患者のデータの真の単一の分布の評価をしようとする場合には、主要な制限となることを表している。 The results show that sampling bias is not only brought about by random sampling from a single large population, but also caused by sampling from different subpopulations. Sampling bias is a major limitation when trying to evaluate a true single distribution of healthy control or patient data based on measurements taken from a finite number of sites and participants. It means that.
(ハーモナイゼーション効果の視覚化)
次に、トラベリングサブジェクトのデータセットを使用して、測定バイアスだけを除くことを可能とするハーモナイゼーション法について説明する。
(Visualization of the harmonization effect)
Next, a harmonization method capable of eliminating only the measurement bias by using the data set of the traveling subject will be described.
上述のとおり、線形混合効果モデルを使用して、測定バイアスを標本バイアスとは別に評価した。この方法により、SRPBSの複数疾患のデータセットから測定バイアスだけを取り除き、生物学的な情報を含んでいる標本バイアスを維持することができる。 As mentioned above, a linear mixed-effects model was used to assess measurement bias separately from sample bias. In this way, only measurement biases can be removed from the SRPBS multi-disease data set and sample biases containing biological information can be maintained.
(トラベリングサブジェクトのハーモナイゼーション)
HKHサイトでの位相エンコーディング方向が、SRPBS複数疾患のデータセットとトラベリングサブジェクトのデータセットの間で異なっていた。そのため、測定バイアスを評価するために、以下では、測定バイアスとは別個に、式中に位相エンコード要因(paq)を含めることとした。測定バイアス及び位相エンコード要因は、SRPBS複数疾患のデータセット及びトラベリングサブジェクトのデータセットを結合したものに、回帰モデルを適合させることにより評価された。
(Traveling subject harmonization)
The phase encoding direction at the HKH site was different between the SRPBS multiple disease dataset and the traveling subject dataset. Therefore, in order to evaluate the measurement bias, hereinafter, the phase encode factor (pa q ) is included in the equation separately from the measurement bias. Measurement bias and phase encoding factors were evaluated by fitting a regression model to the combined SRPBS multiple disease dataset and traveling subject dataset.
回帰モデルは、以下のようになる。 The regression model is as follows.
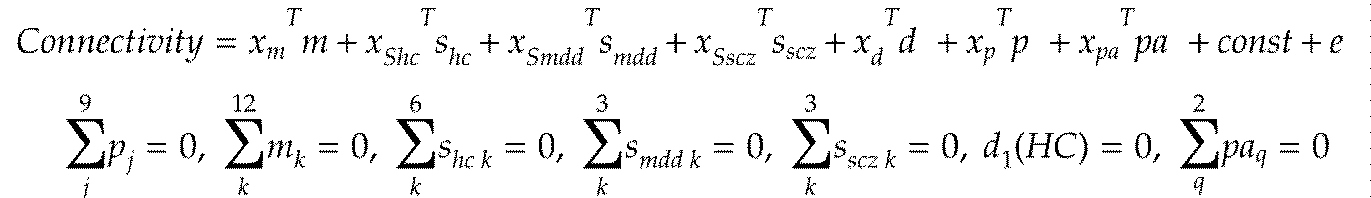
各機能的なコネクティビティの相関値に正規のLS正規化による最小二乗法回帰で正規化を実行して使用して、パラメータをそれぞれ評価した。サイト間差は、評価されたサイト間差及び位相エンコード要因を引くことにより除去された。
Each functional parameter was evaluated by performing a normalization with least squares regression with normal LS normalization on the correlation value of each functional connectivity. The site differences were removed by subtracting the evaluated site differences and the phase encoding factor.
したがって、標本バイアスがハーモナイズされた機能的なコネクティビティの相関値は以下のようになる。 Therefore, the correlation value of the functional connectivity with the sample bias harmonized is as follows.

図21は、ハーモナイゼーションプロセスの影響を視覚化した図であり、図17と対比される図である。図21では、SRPBSの複数疾患のデータセットから測定バイアスだけを除いた後にデータをプロットした。図17ではハーモナイゼーションの前のデータを反映しており、図17に示されたデータと比較して、図21においては、HUHサイトは、原点側(つまり母集団の平均)により近くなるように、大きく移動しており、また他のサイトから大きく離れるということはなくなった。 21. FIG. 21 is a diagram visualizing the influence of the harmonization process and is a diagram to be compared with FIG. In FIG. 21, the data were plotted after removing only the measurement bias from the SRPBS multi-disease data set. FIG. 17 reflects the data before the harmonization, and in comparison with the data shown in FIG. 17, in FIG. 21, the HUH site is closer to the origin side (that is, the average of the population), It's moved a lot, and it's no longer so far away from other sites.
図21に示した結果は、図17で見られたようなHUHサイトの分離は、測定バイアスによりもたらされており、それは、ハーモナイゼーションによって取り除かれうることを示している。 The results shown in FIG. 21 indicate that the separation of HUH sites as seen in FIG. 17 is caused by the measurement bias, which can be removed by harmonization.
さらに、ハーモナイゼーションは、同じサイトでスキャンされた患者と健常者群とを識別するのにも有効であった。ASDの患者は、SWAのサイトのみでスキャンされたので、このサイトでスキャンされたASD患者(▲)及び健常者(○)の平均は、図17では、ほとんど同一の位置へプロットされている。しかしながら、2つのシンボルは、図21では、お互いに明白に分離されている。ハーモナイゼーションのない最初の2つのPCにおいては、精神疾患(ASD)の影響を観察することができなかったものの、測定バイアスの除去をすることで、検知できるようになったことを意味する。 Furthermore, harmonization was also effective in distinguishing between patients and healthy subjects who were scanned at the same site. Since ASD patients were only scanned at the SWA site, the averages of ASD patients (A) and healthy controls (O) scanned at this site are plotted in Figure 17 at almost the same location. However, the two symbols are clearly separated from each other in FIG. In the first two PCs without harmonization, it was not possible to observe the effect of mental illness (ASD), which means that removal of the measurement bias made it possible to detect.
(MDDとSCZに対する分類器)
定量的にハーモナイゼーション法を評価するために、安静時の機能結合MRIデータに基づいて健常者群と患者を識別することを目的として、SRPBSの複数疾患のデータセットを使用して、精神疾患用バイオマーカを構築し、SRPBSの複数疾患データセットからのサイト間差の除去のための以下の4つの異なるハーモナイゼーション法を比較した。
(Classifier for MDD and SCZ)
In order to quantitatively evaluate the harmonization method, using a multi-disease data set of SRPBS for the purpose of distinguishing between healthy subjects and patients based on the functionally coupled MRI data at rest, biopsy for mental disorders was performed. Markers were constructed and the following four different harmonization methods for the removal of inter-site differences from the SRPBS multiple disease dataset were compared.
(1)線形混合効果モデルを使用して、トラベリングサブジェクトのデータセット(つまりトラベリングサブジェクトの方法)とSRPBSの複数疾患のデータセットを組み合わせることにより、測定バイアスは、標本バイアスとは別個に評価された。 (1) The measurement bias was evaluated separately from the sample bias by combining the dataset of traveling subjects (ie, the method of traveling subjects) with the multi-disease dataset of SRPBS using a linear mixed-effects model .
(2)ComBat法の使用による、一般にゲノミクスの中で使用されてきたバッチ効力修正ツールを使用して、サイト間差はモデル化され除去された。なお、ComBat法については、たとえば、以下の文献に開示がある。以下の公知文献11の開示の全てをここに参照により援用する。
公知文献11: Johnson WE, Li C, Rabinovic A,”Adjusting batch effects in microarray expression data using empirical Bayes methods.” Biostatistics 8, 118-127 (2007).
(3)一般化線形モデル(GLM)を使用して、測定バイアスはSRPBSの多疾患データセットのみを使用して、生物学の共変量(例えば診断又は年齢)に対する調節を行うことなく、評価された(つまりGLM法)。GLM法については、たとえば、以下の文献に開示がある。以下の公知文献12の開示の全てをここに参照により援用する。
公知文献12:Fortin JP, et al. Harmonization of cortical thickness measurements across scanners and sites. Neuroimage 167, 104-120 (2017).
(2) Site-to-site differences were modeled and eliminated using the batch potency correction tool commonly used in genomics by using the ComBat method. The ComBat method is disclosed in the following documents, for example. The entire disclosures of the following
Reference 11: Johnson WE, Li C, Rabinovic A, “Adjusting batch effects in microarray expression data using empirical Bayes methods.”
(3) Using a generalized linear model (GLM), measurement bias was evaluated using only the multi-disease dataset of SRPBS, without adjustment for biological covariates (eg diagnosis or age). (That is, GLM method). The GLM method is disclosed in the following documents, for example. The entire disclosures of the following
Known Document 12: Fortin JP, et al. Harmonization of cortical thickness measurements across scanners and sites. Neuroimage 167, 104-120 (2017).
(4)GLM法を使用して、測定バイアスは、SRPBSの複数疾患のデータセットのみ、生物学の共変量に対する調整を行って評価された(つまり、調整されたGLM方法)。この方法についても、上述した公知文献12に開示がある。
(4) Using the GLM method, measurement bias was evaluated only in the SRPBS multi-disease dataset, with adjustments for biology covariates (ie, adjusted GLM method). This method is also disclosed in the above-mentioned
さらに、これらの4つの方法を非ハーモナイゼーション法(生データのままの方法)と比較した。 Furthermore, we compared these four methods with the non-harmonization method (method with raw data as is).
複数サイト・データに注目することを目的とし、複数のサイトからサンプリングされたMDDとSCZを持った患者からのデータをターゲットとした。そこで、各分類器を構築するために、機械学習技術を、以下の2つの場合に適用した。 For the purpose of focusing on multi-site data, we targeted data from patients with MDD and SCZ sampled from multiple sites. Therefore, in order to construct each classifier, the machine learning technique was applied to the following two cases.
(1)SRPBS複数疾患のデータセットからの健常者群及びMDD患者に対するすべての機能的なコネクティビティデータ(5つのサイトからの135人のMDD患者、9つのサイトからの425人の健常者群)
(2)SRPBS複数疾患のデータセットからの健常者群及びSCZ患者に対するすべての機能的なコネクティビティデータ(3つのサイトからの44人のSCZ患者、9つのサイトからの425人の健常者群)。
(1) All functional connectivity data for the healthy group and MDD patients from the SRPBS multiple disease dataset (135 MDD patients from 5 sites, 425 healthy groups from 9 sites).
(2) All functional connectivity data for the healthy group and SCZ patients from the SRPBS multiple disease dataset (44 SCZ patients from 3 sites, 425 healthy groups from 9 sites).
上述したように、特徴選択のためのLASSO法を使用するロジスティックスの回帰分析を実施して、35,778個の結合の中から、機能的なコネクティビティの最適な部分集合を選択した。
モデルの汎化性能は、完全に独立した検証コホートのためのデータセットを部分的に使用してテストされた。図22は、MDDに対する分類器の分類性能を示す図である。図23は、SCZに対する分類器の分類性能を示す図である。
As described above, a logistic regression analysis using the LASSO method for feature selection was performed to select the optimal subset of functional connectivity among the 35,778 connections.
The generalization performance of the model was tested partially using the data set for a completely independent validation cohort. FIG. 22 is a diagram showing the classification performance of the classifier for MDD. FIG. 23 is a diagram showing the classification performance of the classifier for SCZ.
分類器のトレーニングの中に、参加者のデータをすべて使用することを保証するために、分類器の生成の手続きを100回(つまり再サンプリング)繰り返した。これは、分類器性能の平均値は、トレーニングデータセットにおける分類器性能を示すといえるようにするためである。 During the classifier training, the classifier generation procedure was repeated 100 times (that is, re-sampling) to ensure that all the participants' data were used. This is so that it can be said that the average value of the classifier performance indicates the classifier performance in the training data set.
図22及び図23において、診断ラベルが疾患を示す確率が0.5を超えることは、対象が精神疾患であるとの診断のための補助情報(支援情報)を提供するものと考えられる。 In FIGS. 22 and 23, the probability that the diagnostic label indicates a disease exceeds 0.5 is considered to provide auxiliary information (support information) for diagnosing that the subject has a mental illness.
図22及び図23の左側の列に示すように、トレーニングデータセットにおける診断支援情報の確率の分布は、0.5というしきい値によって、精神疾患の患者と健常とが明白に分離されることが明らかになった(各グラフ中の中央のライン)。 As shown in the left column of FIGS. 22 and 23, the distribution of the probability of the diagnostic assistance information in the training data set clearly separates the mentally ill patient from the healthy by a threshold value of 0.5. Became clear (center line in each graph).
これに対して、図22及び図23の右側の列に示すように、独立したコホートの中の診断支援情報の確率の分布は、トラベリングサブジェクト法とComBat法の方法に対してのみ、0.5のしきい値によって、精神疾患の患者と健常群とが分離されることを明らかにしている。 On the other hand, as shown in the right column of FIGS. 22 and 23, the probability distribution of the diagnostic assistance information in the independent cohorts is 0.5 for the traveling subject method and the ComBat method only. It has been clarified that the threshold value of 1 separates the patient with mental illness from the healthy group.
したがって、独立したコホートでは、非常に低い感度(0.5未満)及び過度に高い特異性が、GLM法及び調整GLM法に対して観測されたものの、中程度の感度(約0.5)及び過度に高い特異度が、MDDとSCZに対する分類器に対する生データのままの方法に対して観察された。これは、患者と健常者とが健常者として、区別されることなく分類されたので、過度に高い特異度が観察されたことになる。この結果は、GLM法及び調整GLM法が、サイト間差を削除することができず、むしろ、否定的に分類に影響を与えた可能性を示す。 Thus, in the independent cohorts, very low sensitivity (less than 0.5) and overly high specificity were observed for the GLM and adjusted GLM methods, but with moderate sensitivity (about 0.5) and overly high. A high specificity was observed for the raw raw method for classifiers for MDD and SCZ. This means that the patient and the healthy subject were classified as healthy subjects without being distinguished, and thus an excessively high specificity was observed. This result indicates that the GLM method and the adjusted GLM method could not eliminate the difference between the sites, but rather negatively affected the classification.
図24は、MDD分類器の独立コホートに対する性能を示す図である。図25は、SCZ分類器の独立コホートに対する性能を示す図である。独立コホートへの汎化は、分類器の再チューニングなしで直接検討された。分類器出力は、参加者がMDD又はSCZのクラスへ分類されている確率として定義される。 FIG. 24 is a diagram showing the performance of the MDD classifier with respect to the independent cohort. FIG. 25 shows the performance of the SCZ classifier for the independent cohort. The generalization to an independent cohort was considered directly without retuning the classifier. The classifier output is defined as the probability that a participant has been classified into the MDD or SCZ class.
ここでは、分類器の性能として、マシューズ相関係数(MCC:Matthews correlation coefficients)、ROC曲線(Receiver Operatorating Characteristic curve、受信者動作特性曲線)についてのROC曲線下面積(AUC: area under the curve)、正確度(Accuracy)、感度(Sensitivity)、特異度(Specificity)を使用した。 Here, as the performance of the classifier, the area under the ROC curve (AUC: area under thecurve) for the Matthews correlation coefficients (MCC), ROC curve (ReceiverOperatorating Characteristic curve, receiver operating characteristic curve), Accuracy, Sensitivity, and Specificity were used.
トラベリングサブジェクトのデータセット(つまりトラベリングサブジェクト法)を使用してハーモナイゼーション法を開発した。得られたハーモナイゼーション法を既存のハーモナイゼーション法と比較した結果、精神疾患の分類器の汎化性能、及び、後述するような参加者の年齢を予測するための回帰モデルの開発に関して、トラベリングサブジェクト法及びComBat法が、他の従来のGLM法に基づいたハーモナイゼーション法より性能が上であることを実証している。 Developed a harmonization method using the traveling subject data set (that is, the traveling subject method). As a result of comparing the obtained harmonization method with the existing harmonization method, regarding the generalization performance of the classifier for mental illness, and the development of a regression model for predicting the age of participants as described later, the traveling subject method and the It has been demonstrated that the ComBat method outperforms other conventional GLM-based harmonization methods.
さらに、標本バイアスと測定バイアスを識別することができない、GLM法に基づいたハーモナイゼーション法の汎化性能は、データがサイトにわたってハーモナイズされていない生データのままの方法よりさらに悪いことが分かった。 Furthermore, it was found that the generalization performance of the harmonization method based on the GLM method, which is incapable of discriminating between sample bias and measurement bias, is worse than the raw data method where the data is not harmonized across sites.
ComBat法は、MDD分類器及び後述する年齢の回帰モデルに対して、最も高い性能を達成したが、SCZ分類器に対しては、生データのままの方法よりも劣っていた。このような結果となったのは、SCZの患者が少数(n=48)であったという理由で、ComBat法が、測定バイアスとターゲット属性の関連とを、明確に区別することができなかった可能性を示す。 The ComBat method achieved the highest performance with respect to the MDD classifier and the regression model of age described later, but was inferior to the method of raw data for the SCZ classifier. The result was that the ComBat method could not clearly distinguish between the measurement bias and the target attribute because the number of patients with SCZ was small (n = 48). Show the possibility.
対照的に、トラベリングサブジェクトの方法は、測定バイアスだけをハーモナイズするので、この方法は、分類器と回帰モデルに対して、他の従来のGLM法に基づいたハーモナイゼーション法より性能が上であった。 In contrast, the Traveling Subject method harmonizes only measurement biases, so this method outperformed other conventional GLM-based harmonization methods for classifiers and regression models.
(4つのハーモナイゼーション法に基づいた参加者の年齢の回帰モデル)
さらにハーモナイゼーション法の有効性を調査することを目的として、参加者の年齢を予測するために、生データのままの方法と同様に4つの異なるハーモナイゼーション法を使用して、回帰モデルを構築し、モデルの予測性能を比較した。
(Regression model of participant's age based on four harmonization methods)
To further investigate the effectiveness of the harmonization method, we constructed a regression model using four different harmonization methods as well as the raw data method to predict participants' ages. The prediction performances of
各回帰モデルを構築するために、機械学習技術が、健常者群からのすべての機能的なコネクティビティデータに適用された(9つのサイトからの425人の健常者)のデータが使用された。線形回帰は、LASSO法を使用して適用され、合計35,778個のコネクティビティの中からの機能的なコネクティビティの最適な部分集合を選択した。予測性能は、10分割交差検証の手続きを使用して、トレーニングデータセットの中で評価された。 Machine learning techniques were applied to all functional connectivity data from a group of healthy people (425 healthy people from 9 sites) data were used to build each regression model. Linear regression was applied using the LASSO method to select the optimal subset of functional connectivity out of a total of 35,778 connectivity. Predictive performance was evaluated in the training data set using a 10-fold cross validation procedure.
モデルの汎化性能は、ATR TimTrio、ATR Verio及びATR Prismaサイト(223人のHC)から得られた完全に独立した検証コホート・データセットを部分的に使用して調べられた。 独立したコホートへの汎化はモデルの再チューニングなしで検討された。 The generalization performance of the model was investigated in part using a fully independent validation cohort dataset obtained from ATR TimTrio, ATR Verio and ATR Prisma sites (223 HCs). Generalization to an independent cohort was considered without retuning the model.
図26及び図27は、独立したコホートの中の実年齢及び予測された年齢の散布図を示す図である。これらの図において、実線は、予測された年齢からの実年齢の線形回帰を示す。平均の絶対誤差(MAE:Mean Absolute Error)及び相関係数(r)は各グラフ中で示される。各データポイントは、1人の参加者を表わす。図26(A)は、トラベリングサブジェクト法に対する結果、図26(B)は、ComBat法に対する結果を示す。 26 and 27 are scatter plots of actual age and predicted age in an independent cohort. In these figures, the solid line shows the linear regression of the actual age from the predicted age. The average absolute error (MAE: Mean Absolute Error) and the correlation coefficient (r) are shown in each graph. Each data point represents one participant. FIG. 26A shows the result for the traveling subject method, and FIG. 26B shows the result for the ComBat method.
図27(A)は、GLM方法に対する結果、図27(B)は調整GLM方法に対する結果、及び図27(C)は生データのままの方法(つまり、データはサイトを横断して調和させていない)に対する結果を示す。 FIG. 27 (A) shows the results for the GLM method, FIG. 27 (B) shows the results for the adjusted GLM method, and FIG. 27 (C) shows the raw data as is method (ie, the data is harmonized across sites). Result).
図26に示すように、ComBat法は、最低の平均絶対誤差(MAE)値及び最も高いr値を達成したものの、トラベリングサブジェクト法は2番目に低いMAE価値及び2番目に高いr値を達成した。さらに、ComBat法及びトラベリングサブジェクト法のMAE値は生データのままの方法より有意に低かった(両側ペアt-検定; ComBat: p = 3.1×10⁻²⁰、t = -10.18、df = 222; トラベリングサブジェクト:p = 6.3 × 10⁻⁸, t = -5.5, df = 222)。 As shown in FIG. 26, the ComBat method achieved the lowest mean absolute error (MAE) value and the highest r value, while the traveling subject method achieved the second lowest MAE value and the second highest r value. . Furthermore, the MAB values of the ComBat method and the traveling subject method were significantly lower than those of the raw data method (two-sided pair t-test; ComBat: p = 3.1 × 10⁻²⁰, t = -10.18, df = 222; traveling). Subject: p = 6.3 × 10⁻⁸, t = -5.5, df = 222).
これらの結果は、ComBat法及びトラベリングサブジェクト法が、汎化性能に関して参加者の年齢を予測するために回帰モデルを構築する他のハーモナイゼーション法より性能が上であったことを示す。 These results indicate that the ComBat method and the traveling subject method outperformed other harmonization methods that build a regression model to predict the age of participants with respect to generalization performance.
以上の結果により、トラベリングサブジェクト法は、他の方法に比べて、複数施設での計測データに対するハーモナイゼーション方法として、汎化性能の観点からも、より多くの属性の分類に対して普遍的に適用できるという点でも、優れた方法であるということができる。 From the above results, the traveling subject method is universally applicable to more attribute classifications from the viewpoint of generalization performance, as a harmonization method for measurement data at multiple facilities, compared to other methods. In that respect, it can be said that this is an excellent method.
[第2の実施の形態]
第1の実施の形態では、脳活動計測装置(fMRI装置)で、複数の測定場所で計測された脳活動データを計測し、この脳活動データに基づいて、バイオマーカの生成及びバイオマーカによる診断ラベルの推定(予測)を行う構成として、分散処理により行う一例の構成を説明した。
[Second Embodiment]
In the first embodiment, a brain activity measuring device (fMRI device) measures brain activity data measured at a plurality of measurement locations, and based on this brain activity data, generation of biomarkers and diagnosis by biomarkers. As a configuration for label estimation (prediction), an example configuration for performing distributed processing has been described.
ただし、以下を、それぞれ、異なる施設で分散して実行する構成とすることも可能である。
i)バイオマーカを機械学習により訓練するための脳活動データの計測(データ収集)、
ii)バイオマーカの機械学習による生成処理及び特定の被験者についてのバイオマーカによる診断ラベルの推定(予測)の処理(推定処理)、及び
iii)上記特定の被験者についての脳活動データの計測(対象者の脳活動計測)。
However, it is also possible to have a configuration in which the following are distributed and executed in different facilities.
i) Measurement of brain activity data for training biomarkers by machine learning (data collection),
ii) Machine-learning biomarker generation processing and biomarker-based diagnostic label estimation (prediction) processing (estimation processing) for a specific subject; and iii) Brain activity data measurement (target person) for the specific subject. Brain activity measurement).
図28は、データ収集、推定処理及び対象者の脳活動計測を、分散して処理する場合の一例を示す機能ブロック図である。 FIG. 28 is a functional block diagram showing an example of a case where data collection, estimation processing, and brain activity measurement of a subject are distributed and processed.
図28を参照して、サイト100.1~100.Nは、患者群、健常者群のデータを脳活動計測装置により計測する施設であり、管理サーバ200´は、サイト100.1~100.Nsからの計測データを管理する。
Referring to FIG. 28, sites 100.1-100. N is a facility for measuring the data of the patient group and the healthy subject group by the brain activity measuring device, and the
計算処理システム300は、サーバ200´に格納されたデータから判別器を生成する。
The
また、計算処理システム300のハーモナイゼーション算出部3020は、サイト100.1~100.Ns及びMRI計測装置410のサイトを含めて、ハーモナイゼーション処理を実行するものとする。
Further, the
MRI装置410は、計算処理システム300上の判別器の結果を利用する別サイトに設けられており、特定の被験者について脳活動のデータを計測する。
The
コンピュータ400は、MRI装置410が設けられる別サイトに設置され、MRI装置410の測定データから特定被験者の脳の機能結合の相関データを算出し、機能結合の相関データを計算処理システム300に送信して、返信されてくる判別器の結果を利用する。
The
サーバ200´は、サイト100.1~100.Nsから送信されてくる患者群及び健常者群のMRI測定データ3102と、MRI測定データ3102に関連付けられた被験者の人属性情報3104とを格納し、計算処理システム300からのアクセスにしたがって、これらのデータを計算処理システム300に送信する。
The server 200 'is the site 100.1-100. The
計算処理システム300は、通信インターフェイス2090を介して、サーバ200からのMRI測定データ3102及び被験者の人属性情報3104を受信する。
The
なお、サーバ200´、計算処理システム300、コンピュータ400のハードウェアの構成は、基本的に、図5で説明した「データ処理部32」の構成と同様であるので、その説明は繰り返さない。
Note that the hardware configurations of the
図28に戻って、相関行列算出部3002、相関値補正処理部3004、判別器生成部3008及び判別値算出部3010、ならびに、機能結合の相関行列のデータ3106、測定バイアスデータ3108、補正後相関値データ3110及び判別器データ3112については、第1の実施の形態で説明したのと同様であるので、その説明は、繰り返さない。
Returning to FIG. 28, the correlation
MRI装置410は、診断ラベルの推定対象となる被験者の脳活動データを計測し、コンピュータ400の処理装置4040は、計測されたMRI測定データ4102を不揮発性記憶装置4100に格納する。
The
さらに、コンピュータ400の処理装置4040は、MRI測定データ4102に基づいて、相関行列算出部3002と同様にして、機能結合の相関行列のデータ4106を算出し、不揮発性記憶装置4100に格納する。
Further, the
コンピュータ400のユーザから診断の対象となる疾患が指定され、当該ユーザの送信の指示に従い、コンピュータ400が、機能結合の相関行列のデータ4106を計算処理システム300に送信する。これに応じて、計算処理システム300は、MRI装置410の設置されるサイトに対応したハーモナイゼーション処理を実行する。判別値算出部3010は、指定された診断ラベルについての判別結果を算出する。計算処理システム300は、通信インターフェイス2090を介して、判別結果をコンピュータ400に送信する。
The user of the
コンピュータ400は、図示しない表示装置などを介して、ユーザに対して、判別結果を知らせる。
The
このような構成とすることで、より多くの被験者について収集したデータに基づいて、判別器による診断ラベルの推定結果を提供することが可能となる。 With such a configuration, it is possible to provide the estimation result of the diagnostic label by the discriminator based on the data collected for more subjects.
また、サーバ200と計算処理システム300とを別個の管理者が管理する形態とすることも可能である。その場合、サーバ200にアクセスできるコンピュータを制限することで、サーバ200に格納される被験者の情報のセキュリティを向上させることも可能となる。
Further, the
さらに、計算処理システム300の運営主体からみると、「判別器による判別のサービスを受ける側(コンピュータ400)」に対して、判別器についての情報又は「測定バイアス」に関する情報は、一切提供しなくても、「判別結果を提供するサービス」を行うことが可能となる。
Furthermore, from the perspective of the operator of the
なお、以上の第1の実施の形態及び第2の実施の形態の説明では、脳機能画像法により脳活動を時系列に計測するための脳活動検出装置としては、リアルタイムfMRIを用いるものとして説明した。ただし、脳活動検出装置として、上述したfMRI、脳磁計、近赤外光計測装置(NIRS)、脳波計、又はこれらの組み合わせを使用することができる。たとえば、これらの組合せを用いる場合、fMRIとNIRSとは、脳内の血流変化に関連する信号を検出するものであり、高空間分解能である。一方で、脳磁計及び脳波計は、脳活動に伴う電磁場の変化を検出するために高時間分解能であるという特徴をもつ。したがって、たとえば、fMRIと脳磁計とを組み合わせれば、空間的にも時間的にも高分解能で脳活動を計測することができる。又は、NIRSと脳波計とを組み合わせても、同様に空間的にも時間的にも高分解能で脳活動を計測するシステムを小型で携帯可能な大きさで構成することも可能である。 In the above description of the first and second embodiments, real-time fMRI is used as the brain activity detection device for measuring brain activity in time series by the brain functional imaging method. did. However, the above-mentioned fMRI, magnetoencephalograph, near-infrared light measuring device (NIRS), electroencephalograph, or a combination thereof can be used as the brain activity detecting device. For example, when these combinations are used, fMRI and NIRS detect signals related to changes in blood flow in the brain and have high spatial resolution. On the other hand, the magnetoencephalograph and the electroencephalograph are characterized by high temporal resolution because they detect changes in the electromagnetic field associated with brain activity. Therefore, for example, if fMRI and a magnetoencephalograph are combined, brain activity can be measured with high resolution spatially and temporally. Alternatively, even if the NIRS and the electroencephalograph are combined, it is also possible to configure a system that measures brain activity with high resolution spatially and temporally in a small and portable size.
以上のような構成により、神経・精神疾患に対して、脳機能画像法によるバイオマーカとして機能する脳活動解析装置及び脳活動解析方法を実現することが可能となる。 With the above configuration, it becomes possible to realize a brain activity analysis device and a brain activity analysis method that function as a biomarker by brain function imaging for neurological and mental disorders.
また、以上の説明では、被験者の属性として「診断ラベル」を含んだ場合について、機械学習による判別器の生成により、当該判別器をバイオマーカとして機能させる例について説明した。しかし、本発明は、必ずしもこのような場合に限定されない。事前に機械学習の対象となる測定結果を得る対象の被験者群が、客観的な方法により、複数のクラスに分けられており、被験者の脳領域間(関心領域間)の活動度の相関(結合)を測定し、測定結果に対する機械学習により、クラスに対する判別器が生成できるものであれば、他の判別のために使用されるものであってもよい。 Also, in the above description, in the case where the "diagnosis label" is included as the attribute of the subject, an example in which the discriminator is made to function as a biomarker by machine learning is generated. However, the present invention is not necessarily limited to such cases. A group of subjects for which measurement results to be machine learning targets are obtained in advance is divided into multiple classes by an objective method, and the correlation (coupling) between the brain areas (regions of interest) of the subjects is combined. ) Is measured, and a classifier for the class can be generated by machine learning on the measurement result, the classifier may be used for other discrimination.
また、上述のとおり、このような判別は、ある属性に属する可能性を確率として表示するものであってもよい。 Also, as described above, such discrimination may display the possibility of belonging to a certain attribute as a probability.
したがって、たとえば、ある「訓練」又は「行動パターン」をとることが、被験者にとっての健康増進に役立つかを客観的に評価することができる。また、実際には、疾患に至っていない状態(「未病」)であっても、ある「食物」「飲料」等のような摂取物、及びある活動などが、より健康状態に近づくために効果があるのか、ということを客観的に評価することも可能である。 Therefore, for example, it is possible to objectively evaluate whether or not taking a certain “training” or “behavior pattern” is useful for improving the health of the subject. In addition, in fact, even if the condition is not diseased (“non-illness”), ingestion such as certain “food” and “beverage”, and certain activity are effective for bringing the condition closer to health. It is also possible to objectively evaluate whether or not there is.
また、未病の状態においても、上述したように、たとえば、「健常である確率は、XX%」というような表示が出力されれば、ユーザに対して、健康状態について客観的な数値としての表示を行うことができる。このとき、出力されるのは、必ずしも確率でなくとも、「健康度合いの連続値、たとえば、健常である確率」をスコアに変換したものを表示することとしてもよい。このような表示を行うことで、本実施の形態の装置を、診断の支援以外にも、ユーザの健康管理のための装置として使用することも可能である。 Further, even in a non-illness state, as described above, for example, if a display such as “probability of being healthy is XX%” is output, it is possible to give the user an objective numerical value of the health state. The display can be done. At this time, what is output is not necessarily the probability, but the continuous value of the degree of health, for example, the probability of being healthy may be converted into a score and displayed. By performing such a display, the device according to the present embodiment can be used as a device for health management of the user in addition to the diagnosis support.
[第3の実施の形態]
以上の説明では、すべての計測サイトについて、平等に、トラベリングサブジェクトが移動して計測を行うことにより、測定バイアスを評価するとの構成であった。
[Third Embodiment]
In the above description, the traveling subject moves evenly for all the measurement sites to perform the measurement, and the measurement bias is evaluated.
図29は、第3の実施の形態のトラベリングサブジェクトの巡回方式を示す。この第3の実施の形態では、図29に示すように、拠点となる「拠点計測サイトMS.1~MS.Ns」について、トラベリングサブジェクトTS1が巡回していることを前提とする。 FIG. 29 shows a traveling method of a traveling subject according to the third embodiment. In the third embodiment, as shown in FIG. 29, it is premised that the traveling subject TS1 is patroling the "base measurement sites MS.1 to MS.Ns" serving as bases.
たとえば、これらの拠点計測サイトMS.1~MS.Nsのうちの拠点計測サイトMS.2については、配下となるMS2.1~MS2.nが存在するとする。この拠点計測サイトMS.2の配下に、新たに「計測サイトMS.2.n+1」が追加された場合は、この配下の範囲でトラベリングサブジェクトTS2が巡回する。他の拠点計測サイトについても同様である。
For example, these site measurement sites MS. 1-MS. Base measurement site MS. 2 is under control of MS2.1 to MS2. Let n be present. This site measurement site MS. When “measurement site MS.2.n + 1” is newly added under the
すなわち、拠点計測サイトMS.2の測定バイアスは、トラベリングサブジェクトTS1で評価された値に固定して、計測サイトMS.2、MS2.1、MS2.n,MS2.n+1について、トラベリングサブジェクトTS2が巡回した計測結果に基づいて、測定バイアスを決定するという構成とすることも可能である。 That is, the site measurement site MS. The measurement bias of the measurement site MS.2 is fixed to the value evaluated by the traveling subject TS1. 2, MS2.1, MS2. n, MS2. It is also possible to adopt a configuration in which the measurement bias is determined for n + 1 based on the measurement result that the traveling subject TS2 has traveled.
たとえば、「拠点計測サイトMS.1~MS.Ns」は、予め定められた地域ごとに存在するとして、日本国内の北海道、東北、関東、…、関西、…九州というような各地域に、1か所ずつ設置されており、配下サイトというのは、たとえば、その地域の1つの関西に位置する計測サイト、というような構成とすることも考えられる。 For example, it is assumed that the “base measurement sites MS.1 to MS.Ns” exist in predetermined areas, and 1 in each area such as Hokkaido, Tohoku, Kanto, ..., Kansai, ... Kyushu in Japan. It is possible to set up each site, and the subordinate site may be, for example, a measurement site located in one Kansai region.
又は、「拠点計測サイトMS.1~MS.Ns」は、予め定められたMRI装置の機種ごとに定められていてもよい。この場合、配下の計測サイトは、拠点サイトと同一のMRI装置の機種が設置された計測サイトということになる。 Alternatively, the “base measurement sites MS.1 to MS.Ns” may be defined for each model of a predetermined MRI apparatus. In this case, the subordinate measurement site is a measurement site in which the same model of the MRI device as the base site is installed.
又は、「拠点計測サイトMS.1~MS.Ns」は、予め定められた地域ごとに、定められたMRI装置の機種ごとに定められていてもよい。この場合、配下の計測サイトは、拠点サイトと同一の地域内で、同一のMRI装置の機種が設置された計測サイトということになる。 Alternatively, the “base measurement sites MS.1 to MS.Ns” may be set for each predetermined area and for each predetermined model of the MRI apparatus. In this case, the subordinate measurement site is a measurement site in which the same model of the MRI apparatus is installed in the same area as the base site.
このような構成であっても、第1の実施の形態と同様の効果を奏することが可能である。 Even with such a configuration, it is possible to achieve the same effect as that of the first embodiment.
[第4の実施の形態]
以下では、精神疾患のうち、大うつ病性障害を例として、すなわち、従来の症候に基づく診断手法により医師によって大うつ病性障害と診断された患者群を例として、分類器を生成する処理を説明する。すなわち、図10又は図28に示した判別器生成部3008が、患者群と健常群とを判別するための診断の補助情報を出力するような分類器を生成するために実行する処理の他の例を説明する。
[Fourth Embodiment]
In the following, among the mental disorders, as an example, a major depressive disorder, that is, a group of patients who have been diagnosed by the doctor as a major depressive disorder by a conventional symptom-based diagnostic method to generate a classifier. Will be explained. That is, the other processing of the
以下では、機能的結合FCに基づいて、健常群(HC)及びMDD患者を識別するMDD分類器を構築する手続きについて説明する。MDD診断と関係する機能的結合FCを特定するために、どの機能的結合FCが分類器の構築に重要であるのかについても検討する。 The following describes the procedure to build an MDD classifier that distinguishes between healthy group (HC) and MDD patients based on functionally coupled FC. In order to identify the functionally coupled FCs associated with MDD diagnosis, we also consider which functionally coupled FCs are important in the construction of the classifier.
さらに、以下では、ベックうつ病自己評価尺度IIに対する回帰モデルを構築する。ベックうつ病自己評価尺度(BDI)IIは抑うつの症候の重症度の測定に対する最も広く用いられているテストのうちの1つである。その上で、どの機能的結合FCが、回帰モデルに対して、抑うつの症候群と関係するFCを識別するために、重要であるのかを検討する。更に、MDD診断に関連する機能的結合FCと、抑うつの症候と関係する機能的結合の間で共通の安静時機能的結合FCを検討する。 Furthermore, in the following, a regression model for the Beck Depression Self-Evaluation Scale II will be constructed. The Beck Depression Self-rating Scale (BDI) II is one of the most widely used tests for measuring the severity of depressive symptoms. Then, consider which functionally coupled FCs are important to identify FCs associated with the syndrome of depression for regression models. In addition, a resting functional joint FC common between functional joint FC associated with MDD diagnosis and functional symptoms associated with symptoms of depression is considered.
既述したように、機械学習アルゴリズムを使用する信頼できる分類器及び回帰モデルの構築については、多数の撮像サイトから集められた大規模なサンプルサイズのデータを用いることが必要である。そこで、以下では、4つの異なる撮像サイトから集められたMDD患者を含む、約700人の参加者の学習用の安静時fMRIデータセットを使用して検討する。 As mentioned above, in order to build a reliable classifier and regression model using machine learning algorithms, it is necessary to use large sample size data collected from many imaging sites. Therefore, in the following, the resting fMRI dataset for learning of about 700 participants, including MDD patients collected from four different imaging sites, will be considered.
図30は、このような学習用のデータセット(第1のデータセット)のデモグラフィック特性を示す図である。第1のデータセットは、上述したSRPBS中のデータである。図31は、独立検証のデータセット(第2のデータセット)のデモグラフィック特性を示す図である。第2のデータセットも、基本的には、上述したSRPBS中のデータである。 FIG. 30 is a diagram showing the demographic characteristics of such a learning data set (first data set). The first data set is the data in SRPBS described above. FIG. 31 is a diagram showing the demographic characteristics of the independent verification data set (second data set). The second data set is also basically the data in the SRPBS described above.
すなわち、以下の分析では、以下の2つの安静時機能的MRI(rs-fMRI)データセットを使用する
(1)図30に示すように、第1のデータセットは、713人の参加者に対するデータを含んでいる(4つのサイトから564人の健常群HC、3つのサイトからの149人のMDD患者群)。
(2)図31に示すように、第2のデータセットは、449人の参加者に対するデータを含んでいる(4つのサイトからの264人の健常群HC 、4つのサイトからの185人のMDD患者群)。
That is, the following analysis uses the following two resting functional MRI (rs-fMRI) datasets (1) As shown in FIG. 30, the first dataset is data for 713 participants. (Health group HC of 564 from 4 sites, HC group of 149 MDD from 3 sites).
(2) As shown in FIG. 31, the second data set contains data for 449 participants (264 healthy group HC from 4 sites, 185 MDD from 4 sites). Patient group).
また、併せて「抑うつの症候」は、各データセットの大部分の参加者から得られたベックうつ病自己評価尺度(BDI:Beck Depression Inventory)IIを使用して評価されている。
第1のデータセットは、「学習用データセット」であり、MDDの分類器及びBDIの直線回帰モデルを構築するのに使用される。
In addition, "depressive symptoms" are also evaluated using the Beck Depression Inventory (BDI) II obtained from the majority of participants in each data set.
The first data set is the "training data set" and is used to build the MDD classifier and the BDI linear regression model.
参加者の計測は、それぞれ10分間の単一の安静時機能的MRI(rs-fMRI)セッションにて実行されている。 Participant measurements are performed in a single resting functional MRI (rs-fMRI) session of 10 minutes each.
ここでも、統一された撮像プロトコルの下で安静時機能的MRI(rs-fMRI)データが取得されている(http://www.cns.atr.jp/rs-fmri-protocol-2/)。ただし、第1の実施の形態と同様に、画像診断がすべてのサイトで同じパラメータを使用して行なわれたことを保証することは実際には困難であり、2つの位相変調方式の方向(P→AとA→P)、2社のMRI装置メーカ(シーメンスとGE)、コイルの3つの異なる数(12,24,32)及び3つの型番のスキャナが計測に使用されている。 Again, resting functional MRI (rs-fMRI) data has been acquired under a unified imaging protocol (http://www.cns.atr.jp/rs-fmri-protocol-2/). However, as in the first embodiment, it is actually difficult to guarantee that the image diagnosis has been performed using the same parameters at all sites, and the two phase modulation method directions (P → A and A → P), two MRI device manufacturers (Siemens and GE), three different numbers of coils (12, 24, 32) and three model scanners are used for measurement.
安静時機能的MRI(rs-fMRI)のスキャン中に、参加者は、原則として、以下のような教示がされている。
「リラックスしてください。眠らないでください。中央の十字線マーク上を注視して、特定のことに関して考えないでください。」
During a resting functional MRI (rs-fMRI) scan, participants are, in principle, taught as follows.
"Relax. Don't sleep. Look down on the crosshairs in the middle and don't think about anything specific."
データセットにおける「デモグラフィック特性」は、いわゆる「人口統計学」において使用される特性であって、年齢、性別、などの他、診断名のような表中の属性を含む。なお、図30及び図31において、括弧中の人数は、BDIスコアのデータを有する参加者の数を示す。デモグラフィック分布は、すべての学習用データセットの中でMDDとHCの個体群間で一致する(p>0.05)。 “Demographic characteristics” in the data set are characteristics used in so-called “demographics”, and include attributes in the table, such as age, gender, etc., as well as diagnosis names. 30 and 31, the number in parentheses indicates the number of participants having the BDI score data. The demographic distribution is consistent between MDD and HC populations (p> 0.05) in all training datasets.
第2のデータセットは、 「独立した検証データセット」であり、MDDの分類器及びBDIの回帰モデルをテストするために使用される。第2のデータセットに対する撮像を行ったサイトは、第1のデータセットに含まれていない。 The second data set is an "independent validation data set" and is used to test the MDD classifier and BDI regression model. The site for which imaging was performed on the second data set is not included in the first data set.
年齢のデモグラフィックな分布は独立した検証データセットの中でMDDとHCの個体群間で一致しているものの(p>0.05)、性比のデモグラフィックな分布は独立した検証データセットの中でMDDとHCの個体群間で一致していない(p<0.05)。 Although the demographic distribution of age was consistent between MDD and HC populations in the independent validation dataset (p> 0.05), the demographic distribution of sex ratios was independent of the validation data set. Among them, there is discordance between the MDD and HC populations (p <0.05).
(安静時機能的結合FCマトリックスの前処理及び計算)
データの最初の10秒間はT1平衡を考慮に入れるために廃棄される。
(Pretreatment and calculation of resting functionally coupled FC matrix)
The first 10 seconds of data are discarded to allow for T1 equilibration.
前処理のステップは、スライスタイミングの校正、頭部に見られる体動アーチファクトの補正を行うためのリアライン処理、脳機能画像(EPI画像)と形態画像の共登録(co-registration)、歪補正、T1強調構造画像の分割、モントリオール神経学研究所(MNI)空間への正規化及び、6mmの半値幅の等方性のガウスカーネルによる空間の平滑化などの処理を実施する。 Pre-processing steps include slice timing calibration, rear-line processing to correct body movement artifacts seen on the head, co-registration of brain functional images (EPI images) and morphological images, and distortion correction. , T1-weighted structural image segmentation, normalization to the Montreal Institute of Neurology (MNI) space, and smoothing of the space with an isotropic Gaussian kernel with a half-width of 6 mm.
このような前処理のパイプライン処理については、たとえば、以下のサイトに開示がある。
http://fmriprep.readthedocs.io/en/latest/workflows.html
Such preprocessing pipeline processing is disclosed, for example, at the following site.
http://fmriprep.readthedocs.io/en/latest/workflows.html
(脳領域の区画化(パーセレーション:Parcellation))
脳領域のパーセレーションについては、ヒューマンコネクトームプロジェクト(HCP)スタイルの「表面ベースの方法」でデータを分析するために、以下のサイトに開示されるようなツールボックスを使用した(ciftifyツールボックスバージョン2.0.2)。
https://edickie.github.io/ciftify/#/
このツールボックスは、使用するデータ(それらはHCPパイプラインに必要なT2強調画像を欠いている)を分析することを、HCP類似の表面ベースのパイプラインの中で可能にするものである。
(Partitioning of the brain area (Parcellation))
For brain region parsellation, we used a toolbox as disclosed at the following site to analyze the data in a Human Connectome Project (HCP) style "surface-based method" (ciftify toolbox version 2.0.2).
https://edickie.github.io/ciftify/#/
This toolbox allows to analyze the data used (they lack the T2-weighted images required for HCP pipelines) in HCP-like surface-based pipelines.
そして、以下の解析では、関心領域(ROI)として、以下の公知文献13に開示される379の表面ベースの区画(皮質の360の区画+皮質下の19の区画)を使用する。公知文献13の開示の全てをここに参照により援用する。
公知文献13:Glasser, M.F., Coalson, T.S., Robinson, E.C., Hacker, C.D., Harwell, J., Yacoub, E., et al. (2016). A multi-modal parcellation of human cerebral cortex. Nature 536(7615), 171-178. doi: 10.1038/nature18933.
Then, in the following analysis, as the region of interest (ROI), 379 surface-based sections (360 sections of cortex + 19 sections of subcortex) disclosed in the following
Known Document 13: Glasser, MF, Coalson, TS, Robinson, EC, Hacker, CD, Harwell, J., Yacoub, E., et al. (2016). A multi-modal parcellation of human cerebral cortex. Nature 536 ( 7615), 171-178.doi: 10.1038 / nature18933.
BOLD信号の時間的変化は、これらの379個の関心領域(ROI)から抽出される。 The temporal change of the BOLD signal is extracted from these 379 regions of interest (ROI).
さらに、以下の公知文献14に開示されるような解剖学的な自動標識付(AAL)及びNeurosynth(http://neurosynth.org/locations/)の使用により、重要なROIの解剖学的名称、及びROIを含む内在性の脳ネットワークの名称を特定する。公知文献14の開示の全てをここに参照により援用する。
公知文献14:Tzourio-Mazoyer, N., Landeau, B., Papathanassiou, D., Crivello, F., Etard, O., Delcroix, N., et al. (2002). Automated anatomical labeling of activations in SPM using a macroscopic anatomical parcellation of the MNI MRI single-subject brain. Neuroimage 15(1), 273-289. doi: 10.1006/nimg.2001.0978.
In addition, the use of anatomical automatic labeling (AAL) and Neurosynth (http://neurosynth.org/locations/) as disclosed in the following
Known Document 14: Tzourio-Mazoyer, N., Landeau, B., Papathanassiou, D., Crivello, F., Etard, O., Delcroix, N., et al. (2002). Automated anatomical labeling of activations in SPM. using a macroscopic anatomical parcellation of the MNI MRI single-subject brain. Neuroimage 15 (1), 273-289. doi: 10.1006 / nimg.2001.0978.
(生理的な雑音回帰)
生理的な雑音回帰は、以下の公知文献15に開示されるCompCorを適用して実行される。公知文献15の開示の全てをここに参照により援用する。
公知文献15:Behzadi, Y., Restom, K., Liau, J., and Liu, T.T. (2007). A component based noise correction method (CompCor) for BOLD and perfusion based fMRI. Neuroimage 37(1), 90-101. doi: 10.1016/j.neuroimage.2007.04.042.
(Physiological noise regression)
The physiological noise regression is executed by applying CompCor disclosed in the following known
Known Document 15: Behzadi, Y., Restom, K., Liau, J., and Liu, TT (2007). A component based noise correction method (CompCor) for BOLD and perfusion based fMRI. Neuroimage 37 (1), 90 -101.doi: 10.1016 / j.neuroimage.2007.04.042.
いくつかのスプーリアスの源(余計な信号源)を除去するために、6つの運動パラメータ、全脳、など回帰母数を備えた直線回帰が使用される。 Linear regression with regression parameters such as 6 motor parameters, whole brain, is used to remove some spurious sources (extra signal sources).
(時間的なフィルタリング)
時間的なバンドパスフィルタが、0.01Hzと0.08Hzの間の通過帯域を備えたバターワース・フィルタを使用して、時系列データに適用され、BOLD活動の特性である低周波の変動に分析が限定される。
(Temporal filtering)
A temporal bandpass filter was applied to the time series data using a Butterworth filter with a passband between 0.01 Hz and 0.08 Hz to analyze low frequency fluctuations characteristic of BOLD activity. Is limited.
(頭部運動)
フレームの位置ずれ(FD:Frame-wise displacement)が、個々の機能的なセッションにおいて計算され、頭部運動による機能的結合FCのスプーリアスの変化を低減するために、FD>0.5mmであるボリュームが除去される。FDは、スカラ量(つまり並進運動と回転における絶対的な変位の加算)として時間的に連続する2つのボリュームの間の頭部運動を表わす。
(Head movement)
The frame-wise displacement (FD) is calculated in each functional session and the volume is FD> 0.5 mm to reduce the change in sprue of the functionally coupled FC due to head movement. Are removed. FD represents the head movement between two volumes that are temporally continuous as a scalar quantity (that is, the sum of the absolute displacement in translation and rotation).
上述したような具体的なデータセットでは、スクラビングの後に除去されたボリュームの比率が、(平均±3標準偏差)を超過した場合、その参加者のデータは分析から除外される。その結果、データセット全体では、35人の参加者が除去された。 In the concrete dataset as described above, if the ratio of the volume removed after scrubbing exceeds (mean ± 3 standard deviation), the data of the participant will be excluded from the analysis. As a result, 35 participants were removed from the entire dataset.
したがって、学習用データセットの中で683人の参加者(545人のHC、138人のMDD)を使用し、独立した検証データセットの中で444人の参加者(263人のHC、181人のMDDを患者)のデータが、以下の分析に対して使用される。 Therefore, we used 683 participants (545 HC, 138 MDD) in the training dataset and 444 participants (263 HC, 181 in the independent validation dataset). MDD patient) data is used for the following analyses.
(機能的結合(FC)マトリックスの計算)
本実施の形態の具体例においては、機能的結合FCは、各参加者につき379個の関心領域(ROI)にわたってBOLD信号の時間的な相関として計算される。
(Calculation of functional coupling (FC) matrix)
In the example of this embodiment, the functional combination FC is calculated as the temporal correlation of the BOLD signal over 379 regions of interest (ROI) for each participant.
機能的結合の計算では、特に限定されないが、ここでも、ピアソンの相関係数を使用する。個々の可能な組のROIの前処理されたBOLD信号の時間的経過間のフィッシャーのz変換されたピアソンの相関係数が計算され、要素がそれぞれ2つのROIの間の結合の強度を表わす、379行×379列の対称的な結合マトリックスが構築される。さらに、分析のために、結合マトリックスの下三角行列の71,631(=(379×378)/2)の機能的結合FCの値が使用される。 In the calculation of functional coupling, the Pearson's correlation coefficient is used here as well, although not particularly limited thereto. Fisher's z-transformed Pearson correlation coefficient between the time courses of the preprocessed BOLD signals of each possible set of ROIs is calculated, each element representing the strength of the coupling between the two ROIs, A symmetrical coupling matrix of 379 rows and 379 columns is constructed. In addition, the value of 71,631 (= (379 × 378) / 2) of the functional combination FC of the lower triangular matrix of the combination matrix is used for the analysis.
(サイト効果の制御)
また、以下では、機能的結合FCの上のサイト効果を制御するために、第1から第3の実施の形態で説明したような学習用データセットに対するトラベリングサブジェクトのハーモナイゼーション方法を使用するものとして説明する。ただし、ハーモナイゼーション方法としては、この方法に限定されるものではなく、たとえば、上述したようなComBat法など他の方法を使用してもよい。
(Control of site effect)
Also, in the following description, in order to control the site effect on the functionally coupled FC, the traveling subject harmonization method for the learning data set as described in the first to third embodiments is used. To do. However, the harmonization method is not limited to this method, and other methods such as the above-described ComBat method may be used.
トラベリングサブジェクトのハーモナイゼーション方法を使用することで、純粋なサイト間差(測定バイアス)を除去することが可能となる。なお、独立した検証データセットに含まれたサイトに対しては、トラベリングサブジェクトのデータセットが存在しなかったので、独立した検証データセットの中でサイト効果のコントロールのためには、ComBat法によるハーモナイゼーション方法を使用している。 By using the harmonization method of the traveling subject, it becomes possible to remove the pure site difference (measurement bias). For the sites included in the independent verification dataset, there was no dataset for the traveling subject, so in order to control the site effect in the independent verification dataset, the harmonization by the ComBat method was used. You are using the method.
(訓練データセットにおけるMDDに対する分類器)
分類器の訓練データとして、上述したような学習用データセットを使用して、MDDのためのバイオマーカを構築する。それは、71,631の機能的結合FCの値に基づいて、健常群(健常(HC)との診断ラベルの個体群)及びMDD患者群(大うつ病性障害との診断ラベルの個体群)を識別するものである。
(Classifier for MDD in training data set)
A biomarker for MDD is constructed using the training dataset as described above as training data for the classifier. It is based on the value of the functionally bound FC of 71,631 and the healthy group (the population of the diagnostic label with healthy (HC)) and the MDD patient group (the population of the diagnostic label with major depressive disorder). It is to identify.
図32は、このような分類器を生成するための機械学習の手続きを説明するためのフローチャートである。 FIG. 32 is a flowchart for explaining a machine learning procedure for generating such a classifier.
以下に説明するように、MDDに対する分類器(以下、「MDD分類器」と呼ぶ)の生成のための学習処理において、L1正則化(LASSO: least absolute shrinkage and selection operator)によるロジスティク回帰分析(スパースモデリング法の1つ)を使用して、71,631個の機能的結合FCの中からの機能的結合FCの最適な部分集合を選択する。一般に、L1正則化を使用すると、いくつかのパラメータ(以下の説明では、ウェイトの要素)を0にすることができる。つまり、特徴選択を行っていることになり、スパースモデルになる。ただし、スパースモデリングの手法としては、このような手法には限定されず、後述するように、変分ベイズ法、又は変分ベイズ法をロジスティック回帰に応用したスパースロジスティック回帰(SLR:Sparse Logistic Regression)を用いるなど、他の手法を用いることも可能である。 As described below, in a learning process for generating a classifier for MDD (hereinafter, referred to as “MDD classifier”), a logistic regression analysis (sparse) by L1 regularization (LASSO: least absolute shrinkage and selectionoperator). One of the modeling methods) is used to select the optimal subset of functionally coupled FCs out of 71,631 functionally coupled FCs. In general, using L1 regularization, some parameters (in the description below, the elements of the weights) can be zero. In other words, it means that the feature selection is performed, and it becomes a sparse model. However, the method of sparse modeling is not limited to such a method, and as will be described later, a variational Bayes method or a sparse logistic regression (SLR: Sparse Logistic Regression) in which the variational Bayes method is applied to logistic regression. It is also possible to use other methods such as using.
図32を参照して、MDD分類器に対する学習処理が開始されると(S100)、予め準備され(記憶装置2080´に格納され)た学習データセットを使用して(S102)、相関行列算出部3002が、結合マトリックスの成分を算出する。
With reference to FIG. 32, when the learning process for the MDD classifier is started (S100), the learning data set prepared in advance (stored in the
続いて、ハーモナイゼーション算出部3020が、測定バイアスを算出して、ハーモナイゼーション処理を実施する(S104)。上述のとおり、ハーモナイゼーション処理は、トラベリングサブジェクトを用いた方法が望ましいが、他の方法であってもよい。
Subsequently, the
続いて、判別器生成部3008は、学習用データに対して、いわゆる「入れ子構造の交差検証(Nested Cross Validation)」の手法を修正した方法により、MDD分類器を生成する。
Next, the
まず、判別器生成部3008は、学習用データに対して、「K分割交差検証」(K:自然数)(外側の交差検証)を使用して学習処理を実行するために、たとえば、K=10として、学習用データを10分割する。
First, the
すなわち、判別器生成部3008は、K分割(10分割)されたうちの1つの部分データセットを検証用の「テストデータセット」とし、残りの(K-1)分割(9分割)分のデータを訓練データセット(トレーニングデータセット)に設定する(S108,S110)。
That is, the
続いて、判別器生成部3008は、トレーニングデータセットに対して、アンダーサンプリング処理及びサブサンプリング処理を実行する(S112)。
Subsequently, the
ここで、「アンダーサンプリング処理」とは、トレーニングデータセットにおいて、分類の対象となる特定の属性データ(2種以上)にそれぞれ対応するデータの数がそろっていない場合に、この数をそろえるために数が多い方の属性のデータを除いて同数となるように行う処理を意味する。ここでは、トレーニングデータセットにおいて、MDD患者群の被験者数と、健常群の被験者数が等しくないために、これをそろえるための処理を行う。 Here, the "undersampling process" is to adjust the number of data corresponding to the specific attribute data (two or more types) to be classified in the training data set, in order to adjust the number. It means processing to make the number the same, excluding the data of the attribute with the larger number. Here, since the number of subjects in the MDD patient group is not equal to the number of subjects in the healthy group in the training data set, processing for aligning them is performed.
さらに、「サブサンプリング処理」とは、トレーニングデータセットから所定数のサンプルをランダムに抽出する処理を意味する。すなわち、ステップS108~S118、S122を経由して、K回繰り返される交差検証において、各交差検証では、トレーニングデータセットがMDD患者及び健常者HCの数に関して不均衡であるので、分類器を構築するためのアンダーサンプリング方法を行うこととし、かつ、サブサンプリング処理として、所定数、たとえば、130人のMDD患者及び同数の130人の健常者が、トレーニングデータセットからランダムにサンプリングされる。 Furthermore, "sub-sampling process" means a process of randomly extracting a predetermined number of samples from the training data set. That is, in the cross-validation that is repeated K times via steps S108 to S118 and S122, in each cross-validation, since the training data set is imbalanced with respect to the numbers of MDD patients and healthy subjects HC, a classifier is constructed. And a predetermined number of, for example, 130 MDD patients and the same number of 130 healthy subjects are randomly sampled from the training data set.
なお、130人という数値は、このような値に限定されるものではなく、学習データセット中のデータ数(第1のデータセットでは683人)、分割数K(ここでは、たとえば、K=10)、並びに、分類の対象となる特定の属性に含まれるデータ数の不均衡の程度に応じて、適宜、上述したようなアンダーサンプリングが可能となるように決定される。 The numerical value of 130 people is not limited to such a value, and the number of data in the learning data set (683 in the first data set) and the number of divisions K (here, K = 10, for example). ), And the degree of imbalance of the number of data included in the specific attribute to be classified, the undersampling as described above is appropriately determined.
このようなサブサンプリング処理を実行するのは、アンダーサンプリングでは、除外されたデータを使用して分類器が学習することができなくなるという点で不利であるためである。この不利を除去するために、無作為抽出手続き(つまりサブサンプリング)を、M回(M:自然数、たとえば、M=10)繰り返す処理である。 The reason for executing such sub-sampling processing is that under-sampling is disadvantageous in that the classifier cannot learn using the excluded data. In order to remove this disadvantage, the random sampling procedure (that is, subsampling) is repeated M times (M: natural number, for example, M = 10).
続いて、判別器生成部3008は、サブサンプリングされたサブサンプル1~10の各々に対して、ハイパーパラメータの調整処理を実行する(S114.1~S114.10)。
Subsequently, the
ここで、各サブサンプルにおいて、以下のようなロジスティック関数を使用することで、分類器サブモデルが生成される。このようなロジスティック関数は、サブサンプル内において、MDDクラスに属する参加者の可能性を以下のように定義するために使用される。 Here, in each sub-sample, a classifier sub-model is generated by using the following logistic function. Such a logistic function is used in the sub-sample to define the possibility of participants belonging to the MDD class as follows.
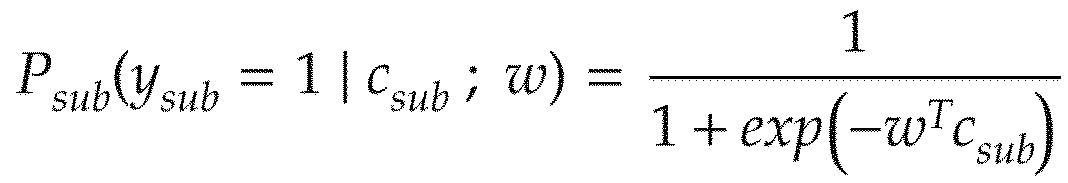
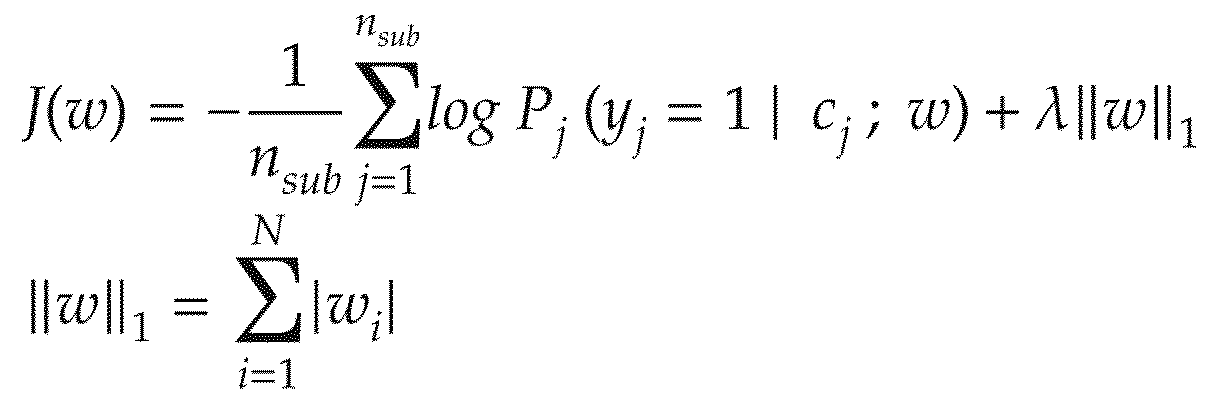
LASSO計算では、コスト関数において、ウェイトベクトルの各要素の絶対値(1次)の総和(L1ノルム)が第2項として存在する。ここで、λはハイパーパラメータを表わし、評価に適用される収縮量をコントロールする。 In the LASSO calculation, the sum (L1 norm) of the absolute values (first order) of each element of the weight vector exists as the second term in the cost function. Here, λ represents a hyper parameter and controls the amount of shrinkage applied to the evaluation.
判別器生成部3008は、各サブサンプルにおいて、これも特に限定されないが、所定数のデータをハイパーパラメータ調整用データとし、残りのデータ(たとえば、n=250又は248人のデータ)を用いてウェイトベクトルwを決定する。このとき、判別器生成部3008は、特に限定されないが、たとえば、ハイパーパラメータλが0<λ≦1.0であるものとして、この区間を、P等分(P:自然数)、たとえば25等分した各値のλを使用して、上記のようなLASSO計算により、ウェイトベクトルwを決定する。
The
このとき、上述の通り、「入れ子構造の交差検証」として、ハイパーパラメータの調整については、「内側の交差検証」として実行する。内側の交差検証では、外側の交差検証の「テストデータセット」は、使用されない。 At this time, as described above, “cross-validation of nested structure” is performed, and hyperparameter adjustment is performed as “inner cross-validation”. Inner cross-validation does not use the outer cross-validation “test dataset”.
その上で、判別器生成部3008は、生成された各λの値に対応するロジスティック関数によりハイパ―パラメータ調整用データについて判別性能を比較し、最も判別性能の高いλに対応するロジスティック関数を決定する(ハイパーパラメータの調整処理)。
Then, the
続いて、判別器生成部3008は、現在の交差検証のループの中で生成された各サブサンプルに対応するロジスティック関数の出力値の平均を出力するものとして「分類器サブモデル」を設定する(S116)。
Subsequently, the
判別器生成部3008は、ステップS110で準備されたテストデータセットを入力として、現在の交差検証のループの中で生成された分類器サブモデルの検証を実行する(S118)。
The
なお、アンダーサンプリングとサブサンプリングにより、サブサンプルを生成して、各サブサンプルにおいて、特徴選択を実行して分類器サブモデルを生成する方法としては、上記のようなLASSO法とハイパーパラメータの調整とを実行する方法以外に、他のスパースモデリングの手法を利用していもよい。 As a method of generating subsamples by undersampling and subsampling and executing feature selection in each subsample to generate a classifier submodel, the LASSO method and hyperparameter adjustment described above are used. In addition to the method of executing, other sparse modeling methods may be used.
判別器生成部3008は、交差検証のループをK回(ここでは10回)分終了していないと判断すると(S122でN)、K分割されたデータにおいて、それまでのループで使用したのとは異なる別の部分データセットをテストデータセットに設定し、残りの部分データセットをトレーニングデータセットに設定して(S108,S110)、処理を繰り返す。
When the
一方で、判別器生成部3008は、交差検証のループをK回(10回)分終了している場合(S122でY)、入力データに対して、K×M個(この場合は、10×10=100個)のロジスティック関数(分類器)の出力の平均を出力するものとして、MDDに対する分類器モデル(MDD分類器)を生成する(S120)。
On the other hand, if the cross-validation loop has been completed K times (10 times) (Y in S122), the
MDD分類器の出力(診断の確率値)が、0.5を超えるときは、MDD患者を示す指標と見なすことができる。 When the output of MDD classifier (probability value of diagnosis) exceeds 0.5, it can be regarded as an index indicating an MDD patient.
さらに、本実施の形態でも、このようにして生成されたMDD分類器の性能の評価指標として、マシューズ相関係数(MCC:Matthews correlation coefficients)、ROC曲線(Receiver Operatorating Characteristic curve、受信者動作特性曲線)についてのROC曲線下面積(AUC: area under the curve)、正確度(Accuracy)、感度(Sensitivity)、特異度(Specificity)を使用する。 Further, also in the present embodiment, as an evaluation index of the performance of the MDD classifier generated in this manner, Matthews correlation coefficients (MCC), ROC curve (Receiver Operating Characteristic curve, receiver operating characteristic curve) Area under the ROC curve (AUC), accuracy (Sensitivity), and specificity (Specificity).
なお、それぞれのサブサンプルにおいて選択された特徴量(この場合、測定バイアスに対するハーモナイゼーション処理後の相関行列の要素)を使用して、対象疾患(たとえば、MDD)の分類器を生成する手法は、このような複数個の分類器サブモデルの出力の平均処理によるものに限られず、特徴選択された特徴量に対して、他のモデリング手法、特に、他のスパースモデリング手法を使用して分類器を生成する構成としてもよい。 Note that the method of generating a classifier of a target disease (for example, MDD) using the feature amount (in this case, the element of the correlation matrix after the harmonization process for the measurement bias) selected in each sub-sample is Not only by averaging the output of multiple classifier sub-models like this, but using other modeling methods, especially other sparse modeling methods, for the classifier for the selected feature quantity It may be configured to.
図33は、全撮像サイトについて、学習用データセットに対するMDDの予測性能(出力の確率分布)を示す図である。学習用データセットに対して、0.5のしきい値によって、分類器モデルからの出力において、MDD患者と健常者の個体群に対応する2つの診断の確率分布が、明白に、右(MDD)と左(HC)へ分離されている。 FIG. 33 is a diagram showing MDD prediction performance (probability distribution of output) for a learning data set for all imaging sites. For the training dataset, the probability distribution of the two diagnoses corresponding to the MDD patient and healthy population at the output from the classifier model, with a threshold of 0.5, is clearly the right (MDD ) And left (HC).
分類器モデルは、MDD患者を66%の正確度でHC個体群から分離する。対応するAUCは、0.77であり、高い識別力を示した。また、MCCは、約0.33である。 The classifier model separates MDD patients from the HC population with 66% accuracy. The corresponding AUC was 0.77, indicating high discriminating power. The MCC is about 0.33.
図34は、各撮像サイトについて、学習用データセットに対するMDDの予測性能(分類器の出力の確率分布)を示す図である。図34から、全データセットだけでなく3つの撮像サイト(サイト1、サイト2、サイト4)の個々のデータセットに対して、ほとんど同じ程度に高い分類精度が達成されることがわかる。
FIG. 34 is a diagram showing the MDD prediction performance (probability distribution of the output of the classifier) for the learning data set for each imaging site. From FIG. 34, it can be seen that almost the same high classification accuracy is achieved not only for the entire dataset but also for the individual datasets of the three imaging sites (
なお、サイト3(SWA)のデータセットには、単に健常者群があるだけであるが、その確率分布は、他のサイトの健常者群のものに相当している。 Note that the dataset for Site 3 (SWA) simply has a group of healthy people, but its probability distribution is equivalent to that of healthy people of other sites.
(分類器の汎化性能)
図35は、独立した検証データセットにおけるMDDの分類器の出力の確率分布を示す図である。すなわち、独立した検証データセットを使用して、分類器モデルの汎化性能がテストされる。
(Generalization performance of classifier)
FIG. 35 is a diagram showing a probability distribution of the output of the MDD classifier in the independent verification data set. That is, the independent validation data set is used to test the generalization performance of the classifier model.
MDDに対して、図32の処理において100個(10分割×10サブサンプリング)のロジスティック関数の分類器が機械学習により生成されており、独立した検証データセットを、生成された100個の分類器のすべて(分類器の集合としての分類器モデル)に入力する。そして、各参加者につき100個の分類器の出力の平均(診断の確率)をとり、平均された診断の確率値が>0.5だった場合、その参加者の診断ラベルとして、大うつ病性障害が該当するものとする。 For MDD, 100 (10 divisions × 10 subsampling) classifiers of logistic functions are generated by machine learning in the process of FIG. 32, and independent verification data sets are generated for the 100 classifiers. To all (classifier model as a set of classifiers). Then, the average (probability of diagnosis) of the output of 100 classifiers for each participant is taken, and when the average probability value of diagnosis is> 0.5, the major participant's diagnosis label is the major depression. Sexual disorders shall apply.
独立した検証データセットにおいて、約70%の精度で、生成された分類器モデルは、MDD個体群をHC個体群から分離している。対応するAUCは、0.75となり、高い識別能力となる能力を示した(並べかえ検定p<0.01)。 -In an independent verification data set, the classifier model generated with an accuracy of about 70% separates the MDD population from the HC population. The corresponding AUC was 0.75, indicating high discriminative ability (permutation test p <0.01).
独立検証データセットに対して、0.5のしきい値によって、分類器モデルからの出力において、MDD患者と健常者の個体群に対応する2つの診断の確率分布が、明白に、右(MDD)と左(HC)へ分離されている。感度は68%であり、特異度は71%である。これは、0.38という高いMCC値となっている(並べかえ検定 p<0.01)。 For the independent validation data set, a threshold of 0.5 clearly indicates that at the output from the classifier model, the probability distributions of the two diagnoses corresponding to the MDD patient and healthy population are right (MDD). ) And left (HC). The sensitivity is 68% and the specificity is 71%. This is a high MCC value of 0.38 (permutation test p <0.01).
図36は、各撮像サイトについて、独立検証データセットに対するMDDの分類器の出力の確率分布を示す図である。4つの撮像サイトの全データセットだけでなく個々のデータセットに対して高い分類精度が達成されることがわかる。 FIG. 36 is a diagram showing the probability distribution of the output of the MDD classifier for the independent verification data set for each imaging site. It can be seen that a high classification accuracy is achieved not only for the entire dataset of the four imaging sites, but also for the individual datasets.
なお、以上の説明では、図32に示したようなフローチャートにより生成された、K×M個のロジスティック関数(分類器)の出力の平均が、分類器モデル(MDD分類器)となる例について説明した。このような構成により、複数の計測サイトにおいて異なる計測装置により計測された脳活動情報(時系列の安静時fMRI画像情報)に基づいて、十分な汎化性能を有して、健常群と患者群とを分類することが可能な分類器を生成することが可能となる。 In the above description, an example in which the average of the outputs of the K × M logistic functions (classifiers) generated by the flowchart shown in FIG. 32 becomes the classifier model (MDD classifier) is described. did. With such a configuration, based on the brain activity information (time-series resting fMRI image information) measured by different measurement devices at a plurality of measurement sites, the general group and the patient group have sufficient generalization performance. It is possible to generate a classifier capable of classifying and.
ただし、ハーモナイゼーション処理の後に、MDD分類器を構成する手続きは、このようなものに必ずしも限定されず、たとえば、以下の公知文献16又は17に開示されるような「スパースモデリング」の手法により、「診断ラベル」に対応するMDD分類器を生成してもよい。公知文献16及び17の開示の全てをここに参照により援用する。
公知文献16:特許第6341513号
公知文献17:特許第6195329号
However, the procedure of configuring the MDD classifier after the harmonization process is not necessarily limited to such a procedure. For example, the procedure of “sparse modeling” disclosed in the following
Known Document 16: Patent No. 6341513 Known Document 17: Patent No. 6195329
たとえば、特許第6195329号では、健常群、患者群において測定された安静時機能結合的MRIのデータから、所定の脳領域間の活動度の相関行列を導出する。被験者の診断ラベルを含む被験者の属性と相関行列とについて正則化正準相関解析(SCCA:Sparse Canonical Correlation Analysis)により、診断ラベルのみに対応する正準変数と接続する相関行例の要素を抽出する。正則化正準相関解析の特徴抽出により得られた相関行列の要素の第1の和集合に対して、1個抜き交差検証によるスパースロジスティク回帰(SLR)で、相関行列の要素の第2の和集合を抽出する。第2の和集合に対して、スパースロジスティク回帰による判別分析により判別器が生成される。 For example, in Japanese Patent No. 6195329, a correlation matrix of activity between predetermined brain regions is derived from data of resting functional connectivity MRI measured in a healthy group and a patient group. The element of the correlation row example connected to the canonical variable corresponding to only the diagnostic label is extracted by regularization canonical correlation analysis (SCCA) for the subject's attribute including the diagnostic label of the subject and the correlation matrix. . With respect to the first union of the elements of the correlation matrix obtained by the feature extraction of the regularized canonical correlation analysis, the second sum of the elements of the correlation matrix is obtained by sparse logistic regression (SLR) by one-out cross-validation. Extract a set. A discriminator is generated for the second union set by discriminant analysis by sparse logistic regression.
スパースロジスティック回帰は、ロジスティック回帰分析をベイズ推定の枠組みに拡張した手法であり、特徴ベクトルの次元圧縮を判別のための重み推定と同時に行う手法である。データの特徴ベクトルの次元数が非常に高く、不要な特徴量が多く含まれている場合に有用である。不要な特徴量に対しては線形判別分析における重みパラメータをゼロにし(すなわち、特徴選択を行い)、判別に関連するごく少数の特徴量だけを取り出す(スパース性)。 Sparse logistic regression is a method that extends logistic regression analysis to the framework of Bayesian estimation, and is a method that performs dimension compression of feature vectors simultaneously with weight estimation for discrimination. This is useful when the number of dimensions of the data feature vector is very high and a large amount of unnecessary feature quantities are included. For unnecessary features, the weight parameter in the linear discriminant analysis is set to zero (that is, feature selection is performed), and only a very small number of features related to discrimination are extracted (sparseness).
スパースロジスティック回帰では得られた特徴データに対して、分類するクラスへの所属する確率pをクラス毎に求め、最大値を出力したクラスに割り当てる。pはロジスティック回帰式によって出力される。重みの推定はARD(Automatic Relevance determination)によって行われ、クラス判別への貢献が少ない特徴量は、重みが0に近づくことで計算から除外される。 In the sparse logistic regression, the probability p belonging to the class to be classified is obtained for each feature data obtained, and the maximum value is assigned to the output class. p is output by the logistic regression equation. The weight is estimated by ARD (Automatic Relevance determination), and the feature amount that has a small contribution to the class discrimination is excluded from the calculation as the weight approaches 0.
なお、このようなスパースロジスティック回帰については、以下の公知文献18又は19に開示がある。公知文献18及び19の開示の全てをここに参照により援用する。
Note that such sparse logistic regression is disclosed in the following known
公知文献18:Okito Yamashita, Masa aki Sato, Taku Yoshioka, Frank Tong, and Yukiyasu Kamitani. ”Sparse Estimation automatically selects voxels relevant for the decoding of fMRI activity patterns.” NeuroImage, Vol. 42, No. 4, pp. 1414-1429, 2008.
公知文献19:相良和彦、田中靖人、竹市博臣、山下宙人、長谷川良平、岡部達哉、前田太郎著、「ブレインコミュニケーション-脳と社会の通信手段-」、電子情報通信学会編、コロナ社、平成23年4月25日初版第1刷発行(診断と症候に共通する脳機能結合の抽出)
Known Document 18: Okito Yamashita, Masa aki Sato, Taku Yoshioka, Frank Tong, and Yukiyasu Kamitani. “Sparse Estimation automatically selects voxels relevant for the decoding of fMRI activity patterns.” NeuroImage, Vol. 42, No. 4, pp. 1414 -1429, 2008.
Publicly known document 19: Kazuhiko Sagara, Yasuto Tanaka, Hiroomi Takeichi, Chuto Yamashita, Ryohei Hasegawa, Tatsuya Okabe, Taro Maeda, "Brain Communication-Brain and Social Communication Means-", The Institute of Electronics, Information and Communication Engineers, Corona Publishing, First edition issued April 25, 2011 (extraction of brain functional connections common to diagnosis and symptoms)
従来は、以下の公知文献20にも示されるように、安静時脳機能結合に基づいて健常群(HC)とMDD患者群とを識別するバイオマーカを構築する場合に、(医師による従来の症候に基づく手法での)MDDの診断に基づいている。公知文献20の開示の全てをここに参照により援用する。
公知文献20:Ichikawa, N., Lisi, G., Yahata, N., Okada, G., Takamura, M., Yamada, M., et al. (2017). Identifying melancholic depression biomarker using whole-brain functional connectivity. arXiv.
Conventionally, as shown in the following publicly known
Reference 20: Ichikawa, N., Lisi, G., Yahata, N., Okada, G., Takamura, M., Yamada, M., et al. (2017). Identifying melancholic depression biomarker using whole-brain functional. connectivity.arXiv.
しかしながら、多くの研究で、既存の臨床診断のカテゴリーと神経生物学的な異常の間の明瞭な関連性を見出すことの困難さが指摘されている。このような困難は、症候、疫学調査、及び医師の経験といったようなものが複雑に混合した情報に、各患者の診断が基づくという事実によっていると考えられる。複数の疾患について、構造的、機能的及び遺伝的な異常の高度に合併した病的状態は、この問題をさらに難しくさせる。 However, many studies have pointed out the difficulty in finding a clear link between existing clinical diagnostic categories and neurobiological abnormalities. Such difficulties may be due to the fact that each patient's diagnosis is based on a complex mix of information such as symptoms, epidemiological studies, and physician experience. The highly complicated pathological conditions of structural, functional and genetic abnormalities for multiple diseases make this problem even more difficult.
このような背景の下で、脳科学的な理解に基づいたMDDの診断及び治療のためには、MDD診断と関係する機能的結合と抑うつの症候に関係する安静時機能的結合とを比較しつつ、このような症候に関連する機能的結合を調べることが必要になる。 Against this background, for the diagnosis and treatment of MDD based on the understanding of brain science, the functional connection associated with the MDD diagnosis and the resting functional connection associated with the symptoms of depression are compared. However, it is necessary to investigate the functional connections associated with such symptoms.
そこで、以下では、診断と症候と関係する安静時機能的結合FCを自動的に客観的に識別するような機械学習アルゴリズムについて説明する。 Therefore, in the following, we will describe a machine learning algorithm that automatically and objectively identifies resting functionally coupled FCs that are related to diagnosis and symptoms.
図37は、このように、精神疾患(たとえば、大うつ病性障害)の診断と症候とに、共通な脳内の機能的結合を導き出す手続きの概念図である。すなわち、これまでに説明したように、安静時の脳機能結合に基づいて、健常群(HC)及び患者群(たとえば、MDD患者群)を識別するような分類器が生成される。一方で、以下に説明するように、安静時の脳機能結合に基づいて、症候の評価尺度(たとえば、ベックうつ病自己評価尺度II)の回帰モデルを構築する。その後、診断と関係する脳機能結合と、症候と関係する脳機能結合の間の共通部分を抽出する。 FIG. 37 is a conceptual diagram of a procedure for deriving a common functional connection in the brain in the diagnosis and symptom of a mental illness (for example, major depressive disorder). That is, as described above, a classifier that discriminates between the healthy group (HC) and the patient group (for example, MDD patient group) is generated based on the brain functional connection at rest. On the other hand, as described below, a regression model of a symptom rating scale (for example, Beck's Depression Self-Rating Scale II) is constructed based on the brain functional connection at rest. Then, the intersection between the brain functional connections associated with diagnosis and the brain functional connections associated with symptoms is extracted.
図38は、このような症候の評価尺度(たとえば、ベックうつ病自己評価尺度II)を予測するような回帰モデル生成する手続きを説明するためのフローチャートである。 FIG. 38 is a flowchart for explaining a procedure for generating a regression model that predicts such a symptom evaluation scale (for example, the Beck Depression Self-Evaluation Scale II).
図38を参照して、評価尺度の回帰モデルに対する学習処理が開始されると(S200)、予め準備され(記憶装置2080´に格納され)た学習データセットを使用して(S202)、相関行列算出部3002が、結合マトリックスの成分を算出する。
Referring to FIG. 38, when the learning process for the regression model of the evaluation scale is started (S200), the learning data set prepared in advance (stored in the
続いて、ハーモナイゼーション算出部3020が、測定バイアスを算出して、ハーモナイゼーション処理を実施する(S204)。上述のとおり、ハーモナイゼーション処理は、トラベリングサブジェクトを用いた方法が望ましいが、他の方法であってもよい。
Subsequently, the
続いて、判別器生成部3008は、ハーモナイゼーション処理後のデータセットのうち、症候評価尺度(たとえば、BDIスコア)を取得済みの参加者についてのデータを学習用データセットとして取得する(S206)。
Subsequently, the
続いて、判別器生成部3008は、学習用データに対して、いわゆる「K分割交差検証」の手法により、評価尺度の回帰モデルを生成する。
Next, the
まず、判別器生成部3008は、学習用データに対して、「K分割交差検証」を使用して学習処理を実行するために、たとえば、K=10として、学習用データを10分割する。すなわち、判別器生成部3008は、K分割(たとえば、10分割)されたうちの1つの部分データセットを検証用の「テストデータセット」とし、残りの(K-1)分割(9分割)分のデータを訓練データセット(トレーニングデータセット)に設定する(S210,S212)。
First, the
続いて、判別器生成部3008は、以下の式のように、71,631の機能的結合FCの値に基づいた学習用データセットを使用して、BDIスコアを予測するために直線回帰モデルを構築する。すなわち、直線回帰モデルを構築するために、BDIスコアを有する学習用データセットに、LASSO法を使用して、判別器生成部3008は、以下のように直線回帰を使用して、回帰サブモデルi(i=1~K)を生成する(S214)。
(予測BDIsub)=wTcsub
ここで、予測BDIsubは、参加者のBDIスコアを表わす。csubは、参加者の機能的結合FCベクトルを表わす。また、wは、直線回帰のウェイトベクトルを表わす。なお、回帰モデルとしては、直線回帰モデルに限定されるものではなく、他の関数形の回帰モデルを用いてもよい。
Then, the
(Prediction BDI sub ) = w T c sub
Here, the predicted BDI sub represents the BDI score of the participant. c sub represents the participant's functionally coupled FC vector. Further, w represents a weight vector for linear regression. The regression model is not limited to the linear regression model, and other functional regression models may be used.
続いて、テストデータセットにより、回帰サブモデルiの検証が実行される(S216)。 Subsequently, the regression sub-model i is verified by the test data set (S216).
続いて、判別器生成部3008は、交差検証のループをK回(10回)分終了していないと判断すると(S218でN)、K分割されたデータにおいて、それまでのループで使用したのとは異なる別の部分データセットをテストデータセットに設定し、残りの部分データセットをトレーニングデータセットに設定して(S210,S212)、処理を繰り返す。
Subsequently, when the
一方で、判別器生成部3008は、交差検証のループをK回(10回)分終了している場合(S218でY)、トレーニングデータセット中の10分割のデータセット中で、サブモデルの生成のために選択された機能的結合FCを統合した脳の機能的結合の部分集合を抽出し(S220)、このような脳の機能的結合の部分集合を説明変数として、回帰モデルを構築する(S222)。
On the other hand, when the cross-validation loop is completed K times (10 times) (Y in S218), the
ただし、このような手続きでは、分割間での情報リークを引き起こして、トレーニングデータセットに対する学習結果は、過適応を起こす可能性がある。そこで、以下に説明するように、独立した検証データセットにこの回帰モデルを適用することにより、汎化性能も確認する。 However, such a procedure may cause information leakage between divisions, and the learning result for the training data set may be over-adapted. Therefore, as described below, generalization performance is also confirmed by applying this regression model to an independent verification data set.
図39は、学習用データセットに基づいて生成された回帰モデルの予測性能を示す図である。図39に示すように、回帰モデルにより予測されたBDIスコアと実測されたBDIスコアとの間の平均絶対誤差(MAE)及びピアソンの相関係数rも併せて示す。 FIG. 39 is a diagram showing the prediction performance of the regression model generated based on the learning data set. As shown in FIG. 39, the mean absolute error (MAE) between the BDI score predicted by the regression model and the actually measured BDI score and the Pearson's correlation coefficient r are also shown.
図39を参照して、この回帰モデルにより、統計的に有意な相関でBDIスコアがよく予測されることがわかる(r=0.62及びp=5.3×10-52; 平均の絶対誤差=6.24)。 Referring to FIG. 39, this regression model shows that the BDI score is well predicted with a statistically significant correlation (r = 0.62 and p = 5.3 × 10 −52 ; mean absolute error. = 6.24).
図40は、独立した検証データセットにおけるBDIスコアに対する回帰モデルの性能を示す図である。図40は、測定されたBDI及び予測されたBDIの散布図である。 FIG. 40 is a diagram showing the performance of the regression model with respect to the BDI score in an independent verification data set. FIG. 40 is a scatter plot of measured and predicted BDI.
ここでも、この回帰モデルにより統計的に有意な相関でBDIスコアがよく予測されることがわかる(r =0.21、p=9.1×10⁻⁶;平均の絶対誤差=11.8)。 Again, this regression model shows that the BDI score is well predicted with a statistically significant correlation (r = 0.21, p = 9.1 x 10 -6 ; mean absolute error = 11.8). .
図41は、MDD分類器とBDI回帰モデルの双方の構築において、共通する7つの脳の機能的結合FCの空間分布を示す図である。図41では、診断と症候の間の共通の機能結合が、後ろ、左、右及び上部から見た図として示される。半球間結合は後部と平面図の中でのみ示される。 FIG. 41 is a diagram showing the spatial distribution of the seven functionally-coupled FCs in the brain, which are common in the construction of both the MDD classifier and the BDI regression model. In Figure 41, the common functional connections between diagnosis and symptoms are shown as a view from the back, left, right and top. Interhemispherical connections are shown only in the posterior and plan views.
図42は、図41に示した共通する7つの脳の機能的結合FCの特性を示すリストを示す図である。図42では、共通の機能結合及びBDIスコアの回帰モデル中のウェイト(重み)が示される。 42 is a diagram showing a list showing the characteristics of the seven functionally combined FCs of the brain shown in FIG. 41. In FIG. 42, common functional combinations and weights in the regression model of the BDI score are shown.
図41及び図42に示される共通な機能的結合FCを抽出するにあたっては、まず、MDD分類器からの診断と関係する重要な機能的結合FC、及びBDI回帰モデルからの症候と関係する重要な機能的結合FCが、判別器生成部3008により、抽出される。
In extracting the common functionally coupled FC shown in FIGS. 41 and 42, first, the important functionally coupled FC associated with the diagnosis from the MDD classifier and the significant functionally associated FC from the BDI regression model. The functional combination FC is extracted by the
具体的には、判別器生成部3008は、各機能的結合FCが10分割交差検証においてLASSO計算によって選択された回数をカウントする。このようなカウント数が二項検定により偶然より有意に高いと判定された場合、機能的結合FCを重要であると判定する。
Specifically, the
以上説明したような具体例では、1つの交差検証当たりに、MDD分類器で使用される機能的結合FCの数が、平均で329.1だったので(このFCの数は、10個のサブサンプリングで少なくとも1回以上選択された数である)、診断と関係するFCに関して、B(10, 329/71,631)として回数の二項分布を仮定する。その後、ボンフェローニの訂正の後に、0.05/71,631として有意水準を設定する。 In the specific example described above, the average number of functionally coupled FCs used in the MDD classifier is 329.1 per cross-validation (the number of FCs is 10 subs). Assume a binomial distribution of the number of times as B (10,329 / 71,631) for FC related to diagnosis, which is the number selected at least once in the sampling). After that, after correcting Bonferroni, the significance level is set as 0.05 / 71,631.
以上の具体例の場合、判別器生成部3008は、10分割交差検証において3回以上選択されたFCは、診断と関係する重要なFCと判断することになる。
In the case of the above specific example, the
同様に、症候と関係するFCに関しては、BDI回帰モデルの中で使用された機能的結合FCの数は、1分割の交差検証当たり平均で3.4であったので、B(10, 3/71,631)として回数の二項分布を仮定する。以上の具体例の場合、判別器生成部3008は、10分割交差検証において1回以上選択されたFCは、症候と関係する重要なFCと判断することになる。
Similarly, for FCs associated with symptoms, the number of functionally coupled FCs used in the BDI regression model was 3.4 on average per split cross-validation, so B (10,3 / 71, 631), assuming a binomial distribution of the number of times. In the case of the above specific example, the
機械学習アルゴリズムによってMDD患者群と健常群HCとの間の分類器及びBDIスコアの回帰モデルのデータから自動的にかつ客観的に、診断と関係する340個の機能的結合FC、及び症候と関係する21の機能的結合FCが特定される。 Machine-learning algorithm automatically and objectively from data of regression model of classifier and BDI score between MDD patient group and healthy group HC, 340 functionally connected FC related to diagnosis, and related to symptoms Twenty-one functional combinations FC are identified.
7つの機能的結合FCが、340個の機能的結合FCと21個の機能的結合FCの間で共通していた。 ⑦ Seven functionally coupled FCs were common between 340 functionally coupled FCs and 21 functionally coupled FCs.
図43は、共通の機能的結合FCにおける学習用データセット及び独立した検証データセットの間の機能的結合FCの値を示す図である。図43に示すように、7つの共通する機能的結合FCの平均の機能的結合の値は、学習用データセット、及び独立した検証データセットの間で非常に類似していた。この結果は、7つの機能的結合FCがMDD及び抑うつの症候の神経基盤を特徴づけることにおいて信頼できることを示唆する。 FIG. 43 is a diagram showing values of the functional combination FC between the learning data set and the independent verification data set in the common functional combination FC. As shown in FIG. 43, the average functional binding values of the seven common functional binding FCs were very similar between the training dataset and the independent validation dataset. This result suggests that seven functionally connected FCs are reliable in characterizing the neural basis of MDD and depressive symptoms.
したがって、以上説明したような方法によれば、複数のサイトで集められたMDD患者群及び健常群HCの安静時fMRIデータを使用して、機能的結合FCの全脳のパターンを用いることにより、脳画像検査に基づいた信頼できるMDDに対する分類器及びBDIの回帰モデルを構築できることが示される。 Therefore, according to the method as described above, by using the resting fMRI data of the MDD patient group and the healthy group HC collected at a plurality of sites and using the whole brain pattern of the functionally coupled FC, It is shown that a classifier and BDI regression model for reliable MDD based on brain imaging can be constructed.
MDD分類器は、独立した検証データセットに対して高い汎化された予測性能AUC及びMCCを達成した。更に、高い汎化された予測性能は、独立した検証データセットの全データセットだけでなく4つの撮像サイトのデータセットに対して個別にも達成される。これらの検証データセットは学習用データセットに含まれていない。しかも、独立した検証データセット中の撮像プロトコルは学習用データセットとは、厳密には異なっていたが、この汎化が達成された。脳の機能的結合FCに基づいて独立した検証データに汎化したMDD分類器の成功裏に構築するというだけでなく、MDDサブタイプに対する制限のないMDDに対する汎化された分類に成功していることになる。 MDD classifier achieved high generalized predictive performance AUC and MCC for independent validation datasets. Furthermore, high generalized prediction performance is achieved not only for the entire dataset of independent validation datasets, but individually for the datasets of the four imaging sites. These validation datasets are not included in the training dataset. Moreover, although the imaging protocol in the independent verification data set was strictly different from the learning data set, this generalization was achieved. Not only successfully builds an MDD classifier generalized to independent validation data based on functionally coupled FC in the brain, but also successfully generalized classification for MDD without restrictions on MDD subtypes It will be.
また、以上説明したような機械学習アルゴリズムは、信頼性をもって、疾患(たとえば、MDD)の分類器及び症候の評価尺度(たとえば、BDIスコア)の回帰モデルの両方に共通して重要な機能的結合FCを抽出することができる。 In addition, the machine learning algorithm as described above reliably and commonly has important functional combinations for both the disease (eg MDD) classifier and the symptom rating scale (eg BDI score) regression model. FC can be extracted.
さらに、以下のように、MDDに関して、診断と症候に共通な7つの機能的結合FCの特性として、以下のような点があることも示される。 Furthermore, as shown below, regarding MDD, it is also shown that there are the following points as characteristics of seven functionally coupled FCs that are common to diagnosis and symptoms.
第1に、機能的結合FCの強さに関して、7つのFCはすべて、MDD個体群では、ハイポコネクティビティ(hypoconnectivity)を示す(すなわち、機能的結合FCの強さはHC個体群よりMDD個体群ではより0に近くなる)。 First, with respect to the strength of functionally coupled FCs, all seven FCs exhibit hypoconnectivity in MDD populations (ie, the strength of functionally coupled FCs is higher in MDD populations than in HC populations). Closer to 0).
第2に、7つの機能的結合FCは、内在性の機能的なネットワークへの寄与に関しては、密接にデフォルト・モード・ネットワーク及び顕著性ネットワークと関係がある。 Second, the seven functionally coupled FCs are closely related to the default mode network and the saliency network in terms of their contribution to the intrinsic functional network.
これらの7つの機能的結合FCを含む13の脳領域から、5つの部位がデフォルト・モード・ネットワークに属し、5つの部位が顕著性ネットワークに属した。 From 13 brain regions containing these 7 functionally linked FCs, 5 parts belonged to the default mode network and 5 parts belonged to the saliency network.
更に、6つの機能的結合FCがデフォルト・モード・ネットワーク又は顕著性ネットワークのいずれかにノード(ROI)を持っている。7つの機能的結合FCのうちの2つの機能的結合FCは、2つのネットワーク間の結合であった。2つの機能的結合FCはデフォルト・モード・ネットワーク内の結合であり、1つの機能的結合FCは顕著性ネットワーク内の結合であった。デフォルト・モード・ネットワーク及び顕著性ネットワークは、従来から、抑うつに関与するとの報告があり、上記のような結果は、これらと矛盾しない。 Furthermore, 6 functionally coupled FCs have nodes (ROIs) in either the default mode network or the saliency network. Two of the seven functionally coupled FCs were the couplings between the two networks. Two functionally coupled FCs were in the default mode network and one functionally coupled FC was in the saliency network. It has been reported that the default mode network and the saliency network are involved in depression, and the above results are consistent with these.
バイオマーカは、患者を診断する目的で開発されているが、焦点は、治療の目標を決定するバイオマーカを特定することに移りつつある(つまり、診断と治療を融合するバイオマーカ)。それはより多くの個別化された治療アプローチを可能とする。上述したような手続きで抽出された共通な機能的結合FCは、MDDの診断だけでなく抑うつの症候と関係があるので、この7つの機能的結合FCはMDDに対する診断と治療を融合するバイオマーカの有望な候補である。したがって、抑うつ症候の改善を実現するために、たとえば、以下の公知文献21に開示されるような手法により、これらの機能的結合FCに対して、機能結合ニューロフィードバックトレーニングのような機能結合に介入する方法を使用することが可能となる。公知文献21の開示の全てをここに参照により援用する。
Although biomarkers are being developed for the purpose of diagnosing patients, the focus is shifting to identifying biomarkers that determine treatment goals (ie biomarkers that combine diagnosis and treatment). It allows for more individualized therapeutic approaches. Since the common functionally coupled FC extracted by the procedure as described above is associated with not only the diagnosis of MDD but also the symptoms of depression, these seven functionally coupled FCs are biomarkers that combine diagnosis and treatment for MDD. Is a promising candidate for. Therefore, in order to realize improvement of depressive symptoms, for example, by a method as disclosed in the following publicly-known
公知文献21:Yamada, T., Hashimoto, R.I., Yahata, N., Ichikawa, N., Yoshihara, Y., Okamoto, Y., et al. (2017). Resting-State Functional Connectivity-Based Biomarkers and Functional MRI-Based Neurofeedback for Psychiatric Disorders: A Challenge for Developing Theranostic Biomarkers. Int J Neuropsychopharmacol 20(10), 769-781. doi: 10.1093/ijnp/pyx059. Known document 21: Yamada, T., Hashimoto, RI, Yahata, N., Ichikawa, N., Yoshihara, Y., Okamoto, Y., et al. (2017). Resting-State Functional Connectivity-Based Biomarkers and Functional MRI-Based Neurofeedback for Psychiatric Disorders: Challenge for Developing Thermodynamics Biomarkers. IntJJ Neuropsychopharmacol 20 (10), 769-781. Doi: 10.1093 / ijnp / pyx059.
今回開示された実施の形態は、本発明を具体的に実施するための構成の例示であって、本発明の技術的範囲を制限するものではない。本発明の技術的範囲は、実施の形態の説明ではなく、請求の範囲によって示されるものであり、請求の範囲の文言上の範囲及び均等の意味の範囲内での変更が含まれることが意図される。 The embodiment disclosed this time is an example of a configuration for specifically implementing the present invention, and does not limit the technical scope of the present invention. The technical scope of the present invention is shown not by the description of the embodiments but by the scope of claims, and is intended to include modifications within the literal scope of the scope of claims and equivalent meanings. To be done.
2 被験者、6 ディスプレイ、10 MRI装置、11 磁場印加機構、12 静磁場発生コイル、14 傾斜磁場発生コイル、16 RF照射部、18 寝台、20 受信コイル、21 駆動部、22 静磁場電源、24 傾斜磁場電源、26 信号送信部、28 信号受信部、30寝台駆動部、32 データ処理部、36 記憶部、38 表示部、40 入力部、42 制御部、44 インターフェイス部、46 データ収集部、48 画像処理部、50 ネットワークインターフェイス 2 subjects, 6 display, 10 MRI device, 11 magnetic field applying mechanism, 12 static magnetic field generating coil, 14 gradient magnetic field generating coil, 16 RF irradiation unit, 18 bed, 20 receiving coil, 21 drive unit, 22 static magnetic field power supply, 24 gradient Magnetic field power supply, 26 signal transmitting unit, 28 signal receiving unit, 30 bed driving unit, 32 data processing unit, 36 storage unit, 38 display unit, 40 input unit, 42 control unit, 44 interface unit, 46 data collecting unit, 48 images Processing unit, 50 network interfaces
Claims (22)
複数の計測サイトの各々において共通に計測対象となる複数の移動被験者に対して、各前記移動被験者の予め定められた複数の脳領域について脳活動を計測するステップと、
前記複数の脳領域の組についての脳活動の時間相関を表す脳機能結合行列の所定の要素を各前記移動被験者について算出するステップと、
一般化線形混合モデル法を用いることで、前記脳機能結合行列の所定の要素ごとに、前記複数の計測サイト及び前記複数の移動被験者にわたる当該要素の平均に対する各計測サイトにおける固定効果として、測定バイアスを算出するステップと、
前記測定バイアスを用いて、各前記計測サイトで計測される被験者の前記脳機能結合行列の所定の要素である脳機能結合相関値を補正することで、調整値を得るステップとを含む、脳機能結合相関値の調整方法。 An adjustment method for correcting a brain function coupling correlation value of a subject measured at a plurality of measurement sites,
For a plurality of mobile subjects to be commonly measured in each of the plurality of measurement sites, a step of measuring brain activity for a plurality of predetermined brain regions of each mobile subject,
Calculating a predetermined element of a brain function coupling matrix representing the temporal correlation of brain activity for the set of the plurality of brain regions for each of the mobile subjects,
By using the generalized linear mixed model method, as a fixed effect at each measurement site with respect to the average of the plurality of measurement sites and the element over the plurality of mobile subjects, a measurement bias is obtained for each predetermined element of the brain function coupling matrix. And a step of calculating
Using the measurement bias to correct a brain function coupling correlation value, which is a predetermined element of the brain function coupling matrix of the subject measured at each of the measurement sites, to obtain an adjustment value. How to adjust the joint correlation value.
複数の被験者の脳活動を時系列で計測するために、複数の計測サイトにそれぞれ設けられた複数の脳活動計測装置と、
前記脳機能結合相関値の補正を行うための計算処理システムとを備え、
前記計算処理システムは、
データを格納するための記憶装置を含み、前記記憶装置は、前記複数の計測サイトの各々において共通に計測対象となる複数の移動被験者に対して、各前記移動被験者の予め定められた複数の脳領域について脳活動を計測した結果を格納し、
演算装置をさらに含み、前記演算装置は、
前記複数の脳領域の組についての脳活動の時間相関を表す脳機能結合行列の所定の要素を各前記移動被験者について算出し、
一般化線形混合モデル法を用いることで、前記脳機能結合行列の所定の要素ごとに、前記複数の計測サイト及び前記複数の移動被験者にわたる当該要素の平均に対する各計測サイトにおける固定効果として、測定バイアスを算出し、
前記測定バイアスを用いて、各前記計測サイトで計測される被験者の前記脳機能結合行列の所定の要素である脳機能結合相関値を補正することで、調整値を算出する、脳機能結合相関値の調整システム。 An adjustment system for correcting a brain function coupling correlation value of a subject,
In order to measure the brain activity of multiple subjects in time series, multiple brain activity measurement devices respectively provided at multiple measurement sites,
And a calculation processing system for correcting the brain function coupling correlation value,
The calculation processing system,
A storage device for storing data is provided, wherein the storage device has a plurality of predetermined brains of each of the mobile subjects for a plurality of mobile subjects to be commonly measured at each of the plurality of measurement sites. Stores the results of measuring brain activity for a region,
A computing device is further included, and the computing device is
Calculate a predetermined element of the brain function coupling matrix representing the temporal correlation of brain activity for the set of the plurality of brain regions for each of the mobile subjects,
By using the generalized linear mixed model method, as a fixed effect at each measurement site with respect to the average of the plurality of measurement sites and the element over the plurality of mobile subjects, a measurement bias is obtained for each predetermined element of the brain function coupling matrix. And calculate
Using the measurement bias, the adjustment value is calculated by correcting the brain function coupling correlation value that is a predetermined element of the brain function coupling matrix of the subject measured at each of the measurement sites, and the brain function coupling correlation value is calculated. Adjustment system.
前記複数の計測サイトの各々において共通に計測対象となる複数の移動被験者に対して、各前記移動被験者の予め定められた複数の脳領域について脳活動を計測するステップと、
前記複数の脳領域の組についての脳活動の時間相関を表す脳機能結合行列の所定の要素を各前記移動被験者について算出するステップと、
一般化線形混合モデル法を用いることで、前記脳機能結合行列の所定の要素ごとに、前記複数の計測サイト及び前記複数の移動被験者にわたる当該要素の平均に対する各計測サイトにおける固定効果として、測定バイアスを算出するステップと、
各前記計測サイトで計測される複数の訓練データ対象の被験者の前記脳機能結合行列の所定の要素である脳機能結合相関値を前記測定バイアスを用いて補正することで、調整値をそれぞれ得るステップと、
前記調整値に基づいて、前記属性に対する分類器を、特徴選択を伴う機械学習法により生成するステップと、を備える、脳活動分類器のハーモナイズ方法。 A brain activity classifier harmonization method for performing a classification process on at least one attribute of a plurality of subjects measured at a plurality of measurement sites, comprising:
For a plurality of mobile subjects to be commonly measured in each of the plurality of measurement sites, measuring brain activity for a plurality of predetermined brain regions of each mobile subject,
Calculating a predetermined element of a brain function coupling matrix representing the temporal correlation of brain activity for the set of the plurality of brain regions for each of the mobile subjects,
By using the generalized linear mixed model method, as a fixed effect at each measurement site with respect to the average of the plurality of measurement sites and the element over the plurality of mobile subjects, a measurement bias is obtained for each predetermined element of the brain function coupling matrix. And a step of calculating
A step of obtaining adjustment values by correcting the brain function coupling correlation value, which is a predetermined element of the brain function coupling matrix of the subject of the plurality of training data measured at each of the measurement sites, by using the measurement bias. When,
Generating a classifier for the attribute based on the adjustment value by a machine learning method with feature selection, the harmonization method of the brain activity classifier.
前記測定バイアスを算出するステップは、
一般化線形混合モデル法を用いることで、前記脳機能結合行列の所定の要素ごとに、前記複数の計測サイト及び前記複数の移動被験者並びに前記複数の訓練データ対象の被験者にわたる当該要素の平均に対する各計測サイトにおける固定効果として、前記測定バイアス並びに前記第1の群の標本バイアス及び前記第2の群の標本バイアスを算出するステップを含む、請求項3に記載の脳活動分類器のハーモナイズ方法。 The subjects of the plurality of training data targets whose brain activity is measured at each of the measurement sites include a first group of subjects having the attribute and a second group of subjects not having the attribute,
The step of calculating the measurement bias includes
By using the generalized linear mixed model method, for each predetermined element of the brain function coupling matrix, each of the plurality of measurement sites and the plurality of mobile subjects and the average of the corresponding element over the plurality of training data subject subjects The harmonization method for the brain activity classifier according to claim 3, further comprising the step of calculating the measurement bias, the sample bias of the first group, and the sample bias of the second group as fixed effects at a measurement site.
複数の被験者の脳活動を時系列で計測するために、複数の計測サイトにそれぞれ設けられた複数の脳活動計測装置と、
訓練データ対象の被験者の脳活動の時間相関を表す脳機能結合行列の所定の要素である脳機能結合相関値の補正を行うための計算処理システムとを備え、
前記計算処理システムは、
データを格納するための記憶装置を含み、前記記憶装置は、前記複数の計測サイトの各々において共通に計測対象となる複数の移動被験者に対して、各前記移動被験者の予め定められた複数の脳領域について脳活動を計測した結果を格納し、
演算装置をさらに含み、前記演算装置は、
前記脳機能結合行列の所定の要素を各前記移動被験者について算出し、
一般化線形混合モデル法を用いることで、前記脳機能結合行列の所定の要素ごとに、前記複数の計測サイト及び前記複数の移動被験者にわたる当該要素の平均に対する各計測サイトにおける固定効果として、測定バイアスを算出し、
前記測定バイアスを用いて、前記各前記計測サイトで計測される複数の訓練データ対象の被験者の前記脳機能結合行列の所定の要素である脳機能結合相関値を補正することで、調整値をそれぞれ算出し、
前記調整値に基づいて、前記属性に対する分類器を、特徴選択を伴う機械学習法により生成する、脳活動分類器のハーモナイズシステム。 A harmony system of a brain activity classifier for performing a classification process for at least one attribute based on a measurement result of a brain activity of a subject,
In order to measure the brain activity of multiple subjects in time series, multiple brain activity measurement devices respectively provided at multiple measurement sites,
A training data target, and a calculation processing system for correcting a brain function coupling correlation value, which is a predetermined element of a brain function coupling matrix representing a time correlation of brain activity,
The calculation processing system,
A storage device for storing data is provided, wherein the storage device has a plurality of predetermined brains of each of the mobile subjects for a plurality of mobile subjects to be commonly measured at each of the plurality of measurement sites. Stores the results of measuring brain activity for a region,
A computing device is further included, and the computing device is
Calculating a predetermined element of the brain function coupling matrix for each of the mobile subjects,
By using the generalized linear mixed model method, as a fixed effect at each measurement site with respect to the average of the plurality of measurement sites and the element over the plurality of mobile subjects, a measurement bias is obtained for each predetermined element of the brain function coupling matrix. And calculate
By using the measurement bias, by correcting the brain function coupling correlation value that is a predetermined element of the brain function coupling matrix of the plurality of training data target subjects measured at each of the measurement sites, the adjustment values are respectively adjusted. Calculate,
A brain activity classifier harmonization system for generating a classifier for the attribute by a machine learning method with feature selection based on the adjustment value.
前記演算装置は、前記測定バイアスを算出する際に、
一般化線形混合モデル法を用いることで、前記機能結合行列の所定の要素ごとに、前記複数の計測サイト及び前記複数の移動被験者並びに前記複数の訓練データ対象の被験者にわたる当該要素の平均に対する各計測サイトにおける固定効果として、前記測定バイアス並びに前記第1の群の標本バイアス及び前記第2の群の標本バイアスを算出する、請求項7に記載の脳活動分類器のハーモナイズシステム。 The subjects of the plurality of training data objects whose brain activity is measured at each of the measurement sites include a first group having the attribute and a second group having no attribute,
The calculation device, when calculating the measurement bias,
By using the generalized linear mixed model method, for each predetermined element of the functional coupling matrix, each measurement with respect to the average of the plurality of measurement sites and the plurality of mobile subjects and the plurality of training data target subjects. 8. The brain activity classifier harmonization system according to claim 7, wherein the measurement bias, the sample bias of the first group, and the sample bias of the second group are calculated as fixed effects at a site.
複数の被験者の脳活動を時系列で計測するために、複数の計測サイトにそれぞれ設けられた複数の脳活動計測装置と、
被験者の脳活動の時間相関を表す脳機能結合行列の所定の要素である脳機能結合相関値の補正を行うための計算処理システムとを備え、
前記計算処理システムは、記憶装置と演算装置を含み、
前記演算装置は、
各前記計測サイトで計測される複数の被験者の前記脳機能結合行列の所定の要素である脳機能結合相関値から測定バイアスを除去することで、補正された調整値をそれぞれ算出して前記記憶装置に格納し、
前記調整値に基づいて、前記脳活動分類器を、第1の特徴選択を伴う機械学習により生成する、脳活動バイオマーカシステム。 A brain activity biomarker system using a brain activity classifier for performing a classification process on at least one attribute of presence or absence of a disease based on a measurement result of a brain activity of a subject,
In order to measure the brain activity of multiple subjects in time series, multiple brain activity measurement devices respectively provided at multiple measurement sites,
And a calculation processing system for correcting a brain function coupling correlation value, which is a predetermined element of a brain function coupling matrix representing a temporal correlation of brain activity of a subject,
The calculation processing system includes a storage device and a calculation device,
The arithmetic unit is
By removing the measurement bias from the brain function coupling correlation value that is a predetermined element of the brain function coupling matrix of a plurality of subjects measured at each of the measurement sites, each corrected adjustment value is calculated and the storage device Stored in
A brain activity biomarker system for generating the brain activity classifier based on the adjustment value by machine learning with first feature selection.
前記演算装置は、
前記複数の脳領域の組についての脳活動の時間相関を表す脳機能結合行列の所定の要素を各前記移動被験者について算出し、
一般化線形混合モデル法を用いることで、前記脳機能結合行列の所定の要素ごとに、前記複数の計測サイト及び前記複数の移動被験者にわたる当該要素の平均に対する各計測サイトにおける固定効果として、前記測定バイアスを算出する、請求項11に記載の脳活動バイオマーカシステム。 The storage device stores in advance the results of measuring the brain activity for a plurality of predetermined brain regions of each of the mobile subjects for a plurality of mobile subjects that are commonly measured at each of the plurality of measurement sites. And
The arithmetic unit is
Calculate a predetermined element of the brain function coupling matrix representing the temporal correlation of brain activity for the set of the plurality of brain regions for each of the mobile subjects,
By using the generalized linear mixed model method, for each predetermined element of the brain function coupling matrix, the measurement is performed as a fixed effect at each measurement site with respect to the average of the elements across the plurality of measurement sites and the plurality of mobile subjects. The brain activity biomarker system according to claim 11, which calculates a bias.
i)前記調整値を、機械学習用のトレーニングデータセットと検証用のテストデータセットとに分割し、
ii)前記トレーニングデータセットに対して、アンダーサンプリング及びサブサンプリングを所定数だけ実行して、前記所定数のサブサンプルを生成し、
iii)前記サブサンプルごとにスパースモデリング法による特徴選択により分類器サブモデルを生成し、
iv)前記スパースサンプリング法による前記特徴選択に基づいて、前記脳活動分類器を生成する、請求項11から請求項13のいずれか1項に記載の脳活動バイオマーカシステム。 In the machine learning with the first feature selection,
i) dividing the adjustment value into a training data set for machine learning and a test data set for verification,
ii) performing a predetermined number of undersamplings and subsamplings on the training data set to generate the predetermined number of subsamples,
iii) generating a classifier sub-model for each sub-sample by feature selection by sparse modeling,
iv) The brain activity biomarker system according to any one of claims 11 to 13, which generates the brain activity classifier based on the feature selection by the sparse sampling method.
前記演算装置は、前記入れ子構造の交差検証の処理において、
i)前記外側の交差検証をK分割交差検証として、前記調整値を、機械学習用のトレーニングデータセットと検証用のテストデータセットとに分割し、
ii)前記トレーニングデータセットに対して、アンダーサンプリング及びサブサンプリングを所定数だけ実行して、前記所定数のサブサンプルを生成し、
iii)前記K分割交差検証の各ループにおいて、前記内側の交差検証で、前記サブサンプルごとに分類器サブモデルを生成し、
iv)前記分類器サブモデルに基づいて、前記脳活動分類器を生成する、請求項11から請求項13のいずれか1項に記載の脳活動バイオマーカシステム。 The machine learning with the first feature selection includes nested cross validation with outer cross validation and inner cross validation,
In the processing of cross validation of the nested structure, the arithmetic unit
i) dividing the adjustment value into a training data set for machine learning and a test data set for verification by using the outer cross-validation as K-division cross-validation,
ii) performing a predetermined number of undersamplings and subsamplings on the training data set to generate the predetermined number of subsamples,
iii) in each of the K-fold cross-validation loops, the inner cross-validation produces a classifier sub-model for each sub-sample,
iv) The brain activity biomarker system according to any one of claims 11 to 13, which generates the brain activity classifier based on the classifier submodel.
前記演算装置は、
前記調整値に基づいて、前記疾患の評価尺度に対する回帰モデルを、第2の特徴選択を伴う機械学習により生成し、
前記第1の特徴選択及び前記第2の特徴選択により共通に抽出される脳機能結合を特定する、請求項11から請求項15のいずれか1項に記載の脳活動バイオマーカシステム。 The storage device, for each of the plurality of subjects, stores information of the evaluation scale of the disease,
The arithmetic unit is
A regression model for the disease rating scale is generated by machine learning with a second feature selection based on the adjusted values;
The brain activity biomarker system according to any one of claims 11 to 15, which specifies brain functional connections commonly extracted by the first feature selection and the second feature selection.
前記脳活動バイオマーカシステムは、
複数の被験者の脳活動を時系列で計測するために、複数の計測サイトにそれぞれ設けられた複数の脳活動計測装置と、
記憶装置と演算装置とを有し、被験者の脳活動の時間相関を表す脳機能結合行列の所定の要素である脳機能結合相関値の補正を行うための計算処理システムと含み、
前記コンピュータプログラムは、前記演算装置に、
各前記計測サイトで計測される複数の被験者の前記脳機能結合行列の所定の要素である前記脳機能結合相関値から測定バイアスを除去することで、調整値をそれぞれ算出して前記記憶装置に格納するステップと、
前記調整値に基づいて、前記脳活動分類器を、第1の特徴選択を伴う機械学習により生成するステップと、を実行させる、コンピュータプログラム。 A computer program for controlling the operation of a brain activity biomarker system using a brain activity classifier for performing a classification process on at least one attribute of presence or absence of a disease based on a measurement result of a brain activity of a subject. ,
The brain activity biomarker system,
In order to measure the brain activity of multiple subjects in time series, multiple brain activity measurement devices respectively provided at multiple measurement sites,
A storage device and a calculation device, including a calculation processing system for correcting a brain function coupling correlation value which is a predetermined element of a brain function coupling matrix representing a time correlation of brain activity of a subject,
The computer program, in the arithmetic unit,
By removing the measurement bias from the brain function coupling correlation value that is a predetermined element of the brain function coupling matrix of a plurality of subjects measured at each of the measurement sites, adjustment values are calculated and stored in the storage device. Steps to
Generating the brain activity classifier by machine learning with first feature selection based on the adjustment value.
前記コンピュータプログラムは、前記演算装置に、
前記複数の脳領域の組についての脳活動の時間相関を表す前記脳機能結合行列の所定の要素を各前記移動被験者について算出するステップと、
一般化線形混合モデル法を用いることで、前記脳機能結合行列の所定の要素ごとに、前記複数の計測サイト及び前記複数の移動被験者にわたる当該要素の平均に対する各計測サイトにおける固定効果として、測定バイアスを算出するステップと、を実行させる、請求項17に記載のコンピュータプログラム。 The storage device stores in advance the results of measuring the brain activity for a plurality of predetermined brain regions of each of the mobile subjects for a plurality of mobile subjects that are commonly measured at each of the plurality of measurement sites. And
The computer program, in the arithmetic unit,
Calculating a predetermined element of the brain function coupling matrix representing the temporal correlation of brain activity for a set of the plurality of brain regions for each of the mobile subjects,
By using the generalized linear mixed model method, as a fixed effect at each measurement site with respect to the average of the plurality of measurement sites and the element over the plurality of mobile subjects, a measurement bias is obtained for each predetermined element of the brain function coupling matrix. The computer program according to claim 17, which executes the step of:
i)前記調整値を、機械学習用のトレーニングデータセットと検証用のテストデータセットとに分割するステップと、
ii)前記トレーニングデータセットに対して、アンダーサンプリング及びサブサンプリングを所定数だけ実行して、前記所定数のサブサンプルを生成するステップと、
iii)前記サブサンプルごとにスパースモデリングによる特徴選択により分類器サブモデルを生成するステップと、
iv)前記スパースモデリングによる特徴選択に基づいて、前記疾患の有無の属性に対する分類器を生成するステップとを実行する、請求項17から請求項19のいずれか1項に記載のコンピュータプログラム。 In the machine learning with the first feature selection,
i) dividing the adjustment value into a training data set for machine learning and a test data set for verification;
ii) performing a predetermined number of undersamplings and subsamplings on the training data set to generate the predetermined number of subsamples;
iii) generating a classifier submodel for each subsample by feature selection by sparse modeling;
iv) Generating a classifier for the attribute of the presence or absence of the disease based on the feature selection by the sparse modeling, and the computer program according to any one of claims 17 to 19.
前記演算装置は、前記入れ子構造の交差検証の処理において、
i)前記外側の交差検証をK分割交差検証として、前記調整値を、機械学習用のトレーニングデータセットと検証用のテストデータセットとに分割するステップと、
ii)前記トレーニングデータセットに対して、アンダーサンプリング及びサブサンプリングを所定数だけ実行して、前記所定数のサブサンプルを生成するステップと、
iii)前記K分割交差検証の各ループにおいて、前記内側の交差検証で、前記サブサンプルごとに分類器サブモデルを生成するステップと、
iv)前記分類器サブモデルに基づいて、前記脳活動分類器を生成するステップとを実行する、請求項17から請求項19のいずれか1項に記載のコンピュータプログラム。 Machine learning with the first feature selection includes nested cross validation with outer cross validation and inner cross validation,
In the processing of cross validation of the nested structure, the arithmetic unit
i) dividing the adjustment value into a training data set for machine learning and a test data set for verification by using the outer cross-validation as K-division cross-validation.
ii) performing a predetermined number of undersamplings and subsamplings on the training data set to generate the predetermined number of subsamples;
iii) generating a classifier sub-model for each sub-sample in the inner cross-validation in each loop of the K-fold cross-validation;
iv) generating the brain activity classifier based on the classifier sub-model. 20. A computer program as claimed in any one of claims 17 to 19.
前記演算装置は、
前記調整値に基づいて、前記疾患の評価尺度に対する回帰モデルを、第2の特徴選択を伴う機械学習により生成するステップと、
前記第1の特徴選択及び前記第2の特徴選択により共通に抽出される脳機能結合を特定するステップとを実行する、請求項17から請求項21のいずれか1項に記載のコンピュータプログラム。
The storage device, for each of the plurality of subjects, stores information of the evaluation scale of the disease,
The arithmetic unit is
Generating a regression model for the disease rating scale based on the adjustment values by machine learning with second feature selection;
22. The computer program according to any one of claims 17 to 21, which executes a step of identifying brain functional connections commonly extracted by the first feature selection and the second feature selection.
Priority Applications (3)
| Application Number | Priority Date | Filing Date | Title |
|---|---|---|---|
| US17/284,051 US12390108B2 (en) | 2018-10-11 | 2019-10-09 | Brain functional connectivity correlation value adjustment method, brain functional connectivity correlation value adjustment system, brain activity classifier harmonization method, brain activity classifier harmonization system, and brain activity biomarker system |
| CN201980066976.XA CN112839577B (en) | 2018-10-11 | 2019-10-09 | Method for adjusting brain functional connection related value, system for adjusting brain functional connection related value, coordination method for brain activity classifier, coordination system for brain activity classifier, and brain activity biomarker system |
| EP19870503.0A EP3865061B1 (en) | 2018-10-11 | 2019-10-09 | Brain functional connectivity correlation value adjustment method, brain functional connectivity correlation value adjustment system, brain activity classifier harmonization method, brain activity classifier harmonization system, and brain activity biomarker system |
Applications Claiming Priority (4)
| Application Number | Priority Date | Filing Date | Title |
|---|---|---|---|
| JP2018192842 | 2018-10-11 | ||
| JP2018-192842 | 2018-10-11 | ||
| JP2019034887A JP6812022B2 (en) | 2018-10-11 | 2019-02-27 | Brain function binding correlation value adjustment method, brain function binding correlation value adjustment system, brain activity classifier harmonization method, brain activity classifier harmonization system, and brain activity biomarker system |
| JP2019-034887 | 2019-02-27 |
Publications (1)
| Publication Number | Publication Date |
|---|---|
| WO2020075737A1 true WO2020075737A1 (en) | 2020-04-16 |
Family
ID=70164134
Family Applications (1)
| Application Number | Title | Priority Date | Filing Date |
|---|---|---|---|
| PCT/JP2019/039751 Ceased WO2020075737A1 (en) | 2018-10-11 | 2019-10-09 | Brain functional connectivity correlation value adjustment method, brain functional connectivity correlation value adjustment system, brain activity classifier harmonization method, brain activity classifier harmonization system, and brain activity biomarker system |
Country Status (2)
| Country | Link |
|---|---|
| US (1) | US12390108B2 (en) |
| WO (1) | WO2020075737A1 (en) |
Cited By (10)
| Publication number | Priority date | Publication date | Assignee | Title |
|---|---|---|---|---|
| CN114052668A (en) * | 2022-01-17 | 2022-02-18 | 北京航空航天大学杭州创新研究院 | Brain function analysis method based on magnetoencephalogram data |
| CN114334140A (en) * | 2022-03-08 | 2022-04-12 | 之江实验室 | Disease prediction system and device based on multi-relation function connection matrix |
| CN115424067A (en) * | 2022-08-30 | 2022-12-02 | 上海市精神卫生中心(上海市心理咨询培训中心) | System, method, processor and storage medium for realizing classification processing of depression subtypes based on multiple fusion brain network diagram technology |
| JP2022181936A (en) * | 2021-05-27 | 2022-12-08 | いすゞ自動車株式会社 | Information processing device |
| CN115708678A (en) * | 2022-11-21 | 2023-02-24 | 昆明理工大学 | Brain-computer interface experimental method based on functional near infrared |
| CN115770044A (en) * | 2022-11-17 | 2023-03-10 | 天津大学 | Emotion recognition method and device based on EEG phase-amplitude coupling network |
| CN116486135A (en) * | 2023-02-12 | 2023-07-25 | 北京师范大学 | Sample classification method, device, computing device and storage medium |
| EP4272636A4 (en) * | 2020-12-30 | 2024-09-04 | Neurophet Inc. | MEDICAL IMAGE ANALYSIS METHOD, MEDICAL IMAGE ANALYSIS DEVICE, AND MEDICAL IMAGE ANALYSIS SYSTEM |
| US12437876B2 (en) | 2022-03-08 | 2025-10-07 | Zhejiang Lab | Disease prediction system and apparatus based on multi-relation functional connectivity matrix |
| CN115424067B (en) * | 2022-08-30 | 2026-02-13 | 上海市精神卫生中心(上海市心理咨询培训中心) | A system, method, processor, and storage medium for classifying depression subtypes based on multi-fusion brain network mapping technology. |
Families Citing this family (13)
| Publication number | Priority date | Publication date | Assignee | Title |
|---|---|---|---|---|
| US11733332B2 (en) * | 2019-12-09 | 2023-08-22 | Nous Imaging, Inc. | Systems and method of precision functional mapping-guided interventional planning |
| JP7627872B2 (en) * | 2020-02-25 | 2025-02-07 | パナソニックIpマネジメント株式会社 | Biological index calculation device and biological index calculation method |
| US20220334205A1 (en) * | 2021-04-16 | 2022-10-20 | Luis Andre Dutra e Silva | Detection of Bio-Markers in Functional MRI Scans |
| US11796615B2 (en) * | 2021-04-16 | 2023-10-24 | The General Hospital Corporation | Subject-specific and hardware-specific bias removal from functional magnetic resonance imaging signals using deep learning |
| US11334976B1 (en) * | 2021-11-16 | 2022-05-17 | Omniscient Neurotechnology Pty Limited | Medical imaging with functional architecture tracking |
| US11694806B2 (en) * | 2021-11-19 | 2023-07-04 | Omniscient Neurotechnology Pty Limited | Systems and methods for grouping brain parcellation data |
| CN114343639B (en) * | 2022-01-05 | 2024-04-12 | 北京理工大学 | Electroencephalogram signal feature recognition analysis method based on clustering-fusion |
| CN115005775B (en) * | 2022-05-26 | 2025-03-21 | 丹阳慧创医疗设备有限公司 | Artifact correction method, device and storage medium for near infrared signal data |
| CN115414041A (en) * | 2022-08-26 | 2022-12-02 | 深圳先进技术研究院 | Autism assessment device, method, terminal device and medium based on electroencephalogram data |
| CN115147417B (en) * | 2022-09-02 | 2022-11-15 | 之江实验室 | Function connection matrix processing system and device based on filtering method feature selection |
| CN117731312A (en) | 2022-09-13 | 2024-03-22 | 上海联影医疗科技股份有限公司 | A scanning method and system for medical images |
| CN116649916B (en) * | 2023-07-24 | 2023-10-20 | 北京大学 | Causal difference estimation method for brain region connection |
| CN120726043B (en) * | 2025-08-27 | 2025-11-07 | 高精特(成都)大数据科技有限公司 | A lesion identification system and method based on image information |
Citations (8)
| Publication number | Priority date | Publication date | Assignee | Title |
|---|---|---|---|---|
| JPS6341513B2 (en) | 1981-10-30 | 1988-08-17 | Mitsubishi Genshi Nenryo Kk | |
| WO2006132313A1 (en) | 2005-06-09 | 2006-12-14 | Hitachi Medical Corporation | Disease judging supporting system |
| JP2011000184A (en) | 2009-06-16 | 2011-01-06 | Advanced Telecommunication Research Institute International | Magnetic resonance imaging apparatus and magnetic resonance imaging method |
| JP2015062817A (en) | 2013-05-01 | 2015-04-09 | 株式会社国際電気通信基礎技術研究所 | Brain activity analysis device, brain activity analysis method, and biomarker device |
| JP2015112474A (en) | 2013-12-06 | 2015-06-22 | 株式会社東芝 | Medical image processing apparatus and magnetic resonance imaging apparatus |
| WO2017090590A1 (en) * | 2015-11-24 | 2017-06-01 | 株式会社国際電気通信基礎技術研究所 | Brain activity analysis device, brain activity analysis method, program, and biomarker device |
| JP2018192842A (en) | 2017-05-12 | 2018-12-06 | いすゞ自動車株式会社 | Vehicle control device |
| JP2019034887A (en) | 2018-12-07 | 2019-03-07 | 株式会社フジクラ | Non-contact direction converter and method for manufacturing optical fiber |
-
2019
- 2019-10-09 WO PCT/JP2019/039751 patent/WO2020075737A1/en not_active Ceased
- 2019-10-09 US US17/284,051 patent/US12390108B2/en active Active
Patent Citations (10)
| Publication number | Priority date | Publication date | Assignee | Title |
|---|---|---|---|---|
| JPS6341513B2 (en) | 1981-10-30 | 1988-08-17 | Mitsubishi Genshi Nenryo Kk | |
| WO2006132313A1 (en) | 2005-06-09 | 2006-12-14 | Hitachi Medical Corporation | Disease judging supporting system |
| JP2011000184A (en) | 2009-06-16 | 2011-01-06 | Advanced Telecommunication Research Institute International | Magnetic resonance imaging apparatus and magnetic resonance imaging method |
| JP2015062817A (en) | 2013-05-01 | 2015-04-09 | 株式会社国際電気通信基礎技術研究所 | Brain activity analysis device, brain activity analysis method, and biomarker device |
| JP2015112474A (en) | 2013-12-06 | 2015-06-22 | 株式会社東芝 | Medical image processing apparatus and magnetic resonance imaging apparatus |
| WO2017090590A1 (en) * | 2015-11-24 | 2017-06-01 | 株式会社国際電気通信基礎技術研究所 | Brain activity analysis device, brain activity analysis method, program, and biomarker device |
| JP6195329B1 (en) | 2015-11-24 | 2017-09-13 | 株式会社国際電気通信基礎技術研究所 | Brain activity analysis device, brain activity analysis method, program, and biomarker device |
| JP2017196523A (en) | 2015-11-24 | 2017-11-02 | 株式会社国際電気通信基礎技術研究所 | Brain activity analysis device, brain activity analysis method, program, and biomarker device |
| JP2018192842A (en) | 2017-05-12 | 2018-12-06 | いすゞ自動車株式会社 | Vehicle control device |
| JP2019034887A (en) | 2018-12-07 | 2019-03-07 | 株式会社フジクラ | Non-contact direction converter and method for manufacturing optical fiber |
Non-Patent Citations (21)
| Title |
|---|
| BEHZADI, Y.RESTOM, K.LIAU, J.LIU, T.T.: "A component based noise correction method (CompCor) for BOLD and perfusion based fMRI", NEUROIMAGE, vol. 37, no. 1, 2007, pages 90 - 101, XP026268023, DOI: 10.1016/j.neuroimage.2007.04.042 |
| FINN ES ET AL.: "Functional connectome fingerprinting: identifying individuals using patterns of brain connectivity", NAT NEUROSCI, vol. 18, 2015, pages 1664 - 1671 |
| FORTIN JP ET AL.: "Harmonization of cortical thickness measurements across scanners and sites", NEUROIMAGE, vol. 167, 2017, pages 104 - 120, XP055722918, DOI: 10.1016/j.neuroimage.2017.11.024 |
| GLASSER MF ET AL.: "The Human Connectome Project's neuroimaging approach", NAT NEUROSCI, vol. 19, 2016, pages 1175 - 1187 |
| GLASSER, M.F.COALSON, T.S.ROBINSON, E.C.HACKER, C.D.HARWELL, J.YACOUB, E. ET AL.: "A multi-modal parcellation of human cerebral cortex", NATURE, vol. 536, no. 7615, 2016, pages 171 - 178 |
| ICHIKAWA, N.LISI, G.YAHATA, N.OKADA, G.TAKAMURA, M.YAMADA, M. ET AL.: "Identifying melancholic depression biomarker using whole-brain functional connectivity", ARXIV, 2017 |
| JOHNSON WELI CRABINOVIC A: "Adjusting batch effects in microarray expression data using empirical Bayes methods", BIOSTATISTICS, vol. 8, 2007, pages 118 - 127, XP055067729, DOI: 10.1093/biostatistics/kxj037 |
| KAMITANI YTONG F: "Decoding the visual and subjective contents of the human brain", NAT NEUROSCI., vol. 8, 2005, pages 679 - 85 |
| KAZUHIKO SAGARAYASUTO TANAKAHIROSHIGE TAKEICHIOKITO YAMASHITARYOHEI HASEGAWATATSUYA OKABETARO MAEDA: "Brain Communication - Nou to shakai no tsuushin shudan'' (Brain Communication - Communication Means between Brain and Society", 25 April 2011, CORONA-SHA |
| NOBLE S ET AL.: "Multisite reliability of MR-based functional connectivity", NEUROIMAGE, vol. 146, 2017, pages 959 - 970, XP029917364, DOI: 10.1016/j.neuroimage.2016.10.020 |
| NOBLE, STEPHANIE ET AL.: "Multisite reliability of MR-based functional connectivity", NEUROLMAGE, vol. 146, 1 February 2017 (2017-02-01), pages 959 - 970, XP029917364, DOI: 10.1016/j.neuroimage.2016.10.020 * |
| OKITO YAMASHITAMASAAKI SATOTAKU YOSHIOKAFRANK TONGYUKIYASU KAMITANI: "Sparse Estimation automatically selects voxels relevant for the decoding of fMRI activity patterns", NEUROLMAGE, vol. 42, no. 4, 2008, pages 1414 - 1429 |
| PEARLSON G: "Multisite collaborations and large databases in psychiatric neuroimaging advantages, problems, and challenges", SCHIZOPHR BULL, vol. 35, 2009, pages 1 - 2 |
| PERROT ET AL., MED IMAGE ANAL, vol. 15, no. 4, 2011 |
| ROSENBERG MD ET AL.: "A neuromarker of sustained attention from whole-brain functional connectivity", NAT NEUROSCI, vol. 19, 2016, pages 165 - 171 |
| See also references of EP3865061A4 |
| SHEN XTOKOGLU FPAPADEMETRIS XCONSTABLE RT: "Groupwise whole-brain parcellation from resting-state fMRI data for network node identification", NEUROIMAGE, vol. 82, 2013, pages 403 - 415, XP028705583, DOI: 10.1016/j.neuroimage.2013.05.081 |
| TAKUYA KUBO: "Data kaiseki no tameno toukei modeling nyu'mon'' (Introduction to statistical modeling for data analysis", 2012, IWANAMI SHOTEN |
| TZOURIO-MAZOYER, N.LANDEAU, B.PAPATHANASSIOU, D.CRIVELLO, F.ETARD, O.DELCROIX, N. ET AL.: "Automated anatomical labeling of activations in SPM using a macroscopic anatomical parcellation of the MNI MRI single-subject brain", NEUROIMAGE, vol. 15, no. 1, 2002, pages 273 - 289, XP055129124, DOI: 10.1006/nimg.2001.0978 |
| YAHATA N ET AL.: "A small number of abnormal brain connections predict adult autism spectrum disorder", NAT COMMUN, vol. 7, 2016, pages 11254 |
| YAMADA, T.HASHIMOTO, R.I.YAHATA, N.ICHIKAWA, N.YOSHIHARA, Y.OKAMOTO, Y. ET AL.: "Resting-State Functional Connectivity-Based Biomarkers and Functional MRI-Based Neurofeedback for Psychiatric Disorders: A Challenge for Developing Theranostic Biomarkers", INT J NEUROPSYCHOPHARMACOL, vol. 20, no. 10, 2017, pages 769 - 781, XP055589968, DOI: 10.1093/ijnp/pyx059 |
Cited By (11)
| Publication number | Priority date | Publication date | Assignee | Title |
|---|---|---|---|---|
| EP4272636A4 (en) * | 2020-12-30 | 2024-09-04 | Neurophet Inc. | MEDICAL IMAGE ANALYSIS METHOD, MEDICAL IMAGE ANALYSIS DEVICE, AND MEDICAL IMAGE ANALYSIS SYSTEM |
| US12417534B2 (en) | 2020-12-30 | 2025-09-16 | NEUROPHET Inc. | Medical image analysis method, medical image analysis device, and medical image analysis system |
| JP2022181936A (en) * | 2021-05-27 | 2022-12-08 | いすゞ自動車株式会社 | Information processing device |
| CN114052668A (en) * | 2022-01-17 | 2022-02-18 | 北京航空航天大学杭州创新研究院 | Brain function analysis method based on magnetoencephalogram data |
| CN114334140A (en) * | 2022-03-08 | 2022-04-12 | 之江实验室 | Disease prediction system and device based on multi-relation function connection matrix |
| US12437876B2 (en) | 2022-03-08 | 2025-10-07 | Zhejiang Lab | Disease prediction system and apparatus based on multi-relation functional connectivity matrix |
| CN115424067A (en) * | 2022-08-30 | 2022-12-02 | 上海市精神卫生中心(上海市心理咨询培训中心) | System, method, processor and storage medium for realizing classification processing of depression subtypes based on multiple fusion brain network diagram technology |
| CN115424067B (en) * | 2022-08-30 | 2026-02-13 | 上海市精神卫生中心(上海市心理咨询培训中心) | A system, method, processor, and storage medium for classifying depression subtypes based on multi-fusion brain network mapping technology. |
| CN115770044A (en) * | 2022-11-17 | 2023-03-10 | 天津大学 | Emotion recognition method and device based on EEG phase-amplitude coupling network |
| CN115708678A (en) * | 2022-11-21 | 2023-02-24 | 昆明理工大学 | Brain-computer interface experimental method based on functional near infrared |
| CN116486135A (en) * | 2023-02-12 | 2023-07-25 | 北京师范大学 | Sample classification method, device, computing device and storage medium |
Also Published As
| Publication number | Publication date |
|---|---|
| US12390108B2 (en) | 2025-08-19 |
| US20210401289A1 (en) | 2021-12-30 |
Similar Documents
| Publication | Publication Date | Title |
|---|---|---|
| JP7247159B2 (en) | Brain activity classifier harmonization system and brain activity classifier program | |
| US12390108B2 (en) | Brain functional connectivity correlation value adjustment method, brain functional connectivity correlation value adjustment system, brain activity classifier harmonization method, brain activity classifier harmonization system, and brain activity biomarker system | |
| JP7365496B2 (en) | Brain function connection correlation value clustering device, brain function connection correlation value clustering system, brain function connection correlation value clustering method, brain function connection correlation value classifier program, brain activity marker classification system, and brain function connection correlation value clustering classifier model | |
| US12396652B2 (en) | Brain activity analyzing apparatus, brain activity analyzing method and biomarker apparatus | |
| CN111447874B (en) | Determination device, method for determining depressive symptoms, method for determining the level of depressive symptoms, method for classifying patients with depression, method for determining the therapeutic effect of depressive symptoms, and brain activity training device | |
| JP6903518B2 (en) | Brain activity analysis system, brain activity analysis device, and brain activity analysis program | |
| EP2992823B1 (en) | Brain activity training device | |
| JP7737099B2 (en) | Brain function connection correlation value clustering device, brain function connection correlation value clustering system, brain function connection correlation value clustering method, brain function connection correlation value classifier program, and brain activity marker classification system | |
| JP7057995B2 (en) | Biomarkers and their use to detect the pathological profile of depression in mammals | |
| JP2024003782A (en) | Diagnostic support system, diagnostic support device, diagnostic support method, and support program for providing information on schizophrenia spectrum disorders | |
| Jacquemin | Image Smoothing in Neuroimaging: Effect of Gaussian vs. Tissue-Specific Approaches on Statistical Analysis |
Legal Events
| Date | Code | Title | Description |
|---|---|---|---|
| 121 | Ep: the epo has been informed by wipo that ep was designated in this application |
Ref document number: 19870503 Country of ref document: EP Kind code of ref document: A1 |
|
| NENP | Non-entry into the national phase |
Ref country code: DE |
|
| ENP | Entry into the national phase |
Ref document number: 2019870503 Country of ref document: EP Effective date: 20210511 |
|
| WWG | Wipo information: grant in national office |
Ref document number: 2019870503 Country of ref document: EP |
|
| WWG | Wipo information: grant in national office |
Ref document number: 17284051 Country of ref document: US |