WO2016170076A1 - Method for simulating blood flow in the cerebral vascular tree - Google Patents
Method for simulating blood flow in the cerebral vascular tree Download PDFInfo
- Publication number
- WO2016170076A1 WO2016170076A1 PCT/EP2016/058936 EP2016058936W WO2016170076A1 WO 2016170076 A1 WO2016170076 A1 WO 2016170076A1 EP 2016058936 W EP2016058936 W EP 2016058936W WO 2016170076 A1 WO2016170076 A1 WO 2016170076A1
- Authority
- WO
- WIPO (PCT)
- Prior art keywords
- blood
- cerebral vascular
- vascular tree
- node
- model
- Prior art date
- Legal status (The legal status is an assumption and is not a legal conclusion. Google has not performed a legal analysis and makes no representation as to the accuracy of the status listed.)
- Ceased
Links
Classifications
-
- G—PHYSICS
- G16—INFORMATION AND COMMUNICATION TECHNOLOGY [ICT] SPECIALLY ADAPTED FOR SPECIFIC APPLICATION FIELDS
- G16H—HEALTHCARE INFORMATICS, i.e. INFORMATION AND COMMUNICATION TECHNOLOGY [ICT] SPECIALLY ADAPTED FOR THE HANDLING OR PROCESSING OF MEDICAL OR HEALTHCARE DATA
- G16H50/00—ICT specially adapted for medical diagnosis, medical simulation or medical data mining; ICT specially adapted for detecting, monitoring or modelling epidemics or pandemics
- G16H50/50—ICT specially adapted for medical diagnosis, medical simulation or medical data mining; ICT specially adapted for detecting, monitoring or modelling epidemics or pandemics for simulation or modelling of medical disorders
Definitions
- the present invention relates to a method, a computer program as well as a system for simulating the blood flow in the cerebral vascular tree, particularly of a human person or patient.
- Stroke is one of the leading causes of death in Europe and the United States and often leads to disability.
- stroke is projected to become of even more important concerning medical treatment, costs and the subsequent necessity of more defined and tailor-made diagnostics and therapeutical procedures.
- Extra-intracranial bypass surgery was introduced for secondary prevention of stroke in the context of steno-occlusive disease of the cerebral vascular system back in the 1960ies and was performed routinely until 1985, when the publication of a multi- center study showed no significant improvement in patients undergoing bypass surgery when compared to best medical treatment [EC/IC Bypass Study NEJM 1985].
- bypass surgery as a means of flow augmentation is indicated in patients with chronic hemodynamic cerebrovascular insufficiency based on an occlusion or a high-grade stenosis of the internal carotid artery or proximal segments of the middle cerebral artery resulting in an impaired blood flow to brain regions.
- acute flow replacement might be necessary in the treatment of patients with complex aneuryms or tumors necessitating sacrifice of the aneurysm- or tumor supplying vessel.
- Goals of the diagnostic work-up include the evaluation of the collateral blood flow to the vascular territory which is supplied by the affected carotid artery, in order to address the acute stroke risk following potential vessel sacrifice, and, secondly, the assessment of the cerebral vascular reserve capacity in case of initial tolerance of vessel sacrifice reflecting the chronic stroke risk. Since the extent of collateral blood flow via the Circle of Willis and leptomeningeal collaterals may interindividually vary significantly it is mandatory to identify those high risk patients who would not tolerate vessel occlusion and, therefore, necessitate surgical flow replacement.
- TCD transcranial doppler sonography
- SPECT single photon emission computed tomography
- electrophysiological monitoring and the measurement.
- none of these methods provide the possibility to hypothetically and individually simulate blood flow and perfusion pressure in the brain for comparing the different therapeutical options (surgery, interventional stenting, conservative therapy) before therapy, i.e. risk factors and benefit of the different therapeutical options can currently not be compared for each individual patient and further treatment can currently not be sufficiently personalised.
- the problem underlying the present invention is to provide a method, a computer program and a system that provide an advancement of the understanding of the cerebral circulation that can be used in particular for an improvement of patient treatment.
- the method for simulating the blood flow in the cerebral vascular tree comprises the steps of:
- said perfusion pressures can be used for improving preoperative diagnostics in patients with stenosis of the ICA and/or MCA and/or other brain- supplying vessels, since these quantities can be used in a further step for evaluation of the potential risk of ischemic events
- the cerebral vascular tree is described by a planar graph in analogy to electric circuits, wherein said graph particularly comprises specific blood supply areas (i.e. regions in the brain where blood is needed in order to guarantee proper functioning of the brain) in the form of so called third nodes (or supply nodes).
- specific blood supply areas i.e. regions in the brain where blood is needed in order to guarantee proper functioning of the brain
- third nodes or supply nodes
- the response of the supply areas to changes of blood flow is modelled using an auto-regulation function that provides constant blood supply.
- the invention allows to simulate stenosis and occlusion of respective arteries (modelled as first edges of the planar graph corresponding to vessel segments of the cerebral vascular tree). Further, the invention allows to prospectively and hypothetically simulate various treatment options such as surgery, stenting et cetera and compare risks and benefits of these options for the individual patient before treatment.
- the model used in the present invention can be adapted to individual patient data derived from imaging sources.
- elements of pre-set models can be used to supplement the medical data.
- the invention also allows to incorporate vessel segments by hand into the model/planar graph in order to examine their effect in the cerebral vascular tree and/or to supplement missing medical data/information.
- the invention provides a dynamic and individualised simulation model for the brain circulation integrating individual patient data and enabling simulation of vascular pathology as stenosis and occlusion for prediction of ischemic events.
- This simulation model might help to individually evaluate stroke risks and could in future represent a crucial parameter in treatment indication for patients potentially undergoing surgical or interventional vascularisation procedures.
- the method further comprises automatically calculating at least one of: blood flow rates, blood velocities, partial derivatives of perfusion pressures (particularly with respect to the radius of a vessel segment/first edge, see also below), partial derivatives of blood flow rates (particularly with respect to the radius of a vessel segment/first edge). This allows one to study certain sensitivities, which are described further below.
- the step of extracting said model comprises the steps of automatically detecting vessel segments of the cerebral vascular tree in the medical image data, wherein particularly the length and radius of the detected vessel segments are automatically determined, respectively, and detecting connection points at which one (e.g. detected) vessel segment is connected to one or several further (e.g. detected) vessel segments.
- the planar graph comprises first edges, wherein each of said first edges is associated to a detected (arterial blood) vessel segment of the cerebral vascular tree, wherein particularly each detected vessel segment is one of: a vessel segment of the circle of Willis of the cerebral vascular tree, a vessel segment of the cerebral vascular tree forming a first, second, or third order branch of the cerebral vascular tree.
- the first edges represent/form a circle of Willis and branches connected to the circle of Willis, wherein particularly one or several branches are of order one, and wherein particularly one or several branches are of order two, and wherein particularly one or several branches are of order three.
- a first order branch e.g.
- a corresponding first edge is directly connected to the circle of Willis, i.e., to a node on the circle of Willis, while a second order branch is connected to a first order branch and a third order branch is connected to a second order branch.
- said first edges are modelled as conduits having the length L and the radius r of the associated (e.g. detected) vessel segment, as well as particularly a flow resistance with respect to blood of
- ⁇ is the viscosity of the blood.
- the planar graph comprises first nodes, wherein each of said first nodes is associated to a (e.g. detected) connection point and connects a first edge to one or several other first edges, particularly to two other first edges (corresponding e.g. to detected vessel segments).
- the planar graph comprises second nodes which are source nodes that represent points of said region of the cerebral vascular tree via which the latter is supplied with blood.
- the planar graph comprises third nodes which represent supply areas of the cerebral vascular tree to which blood is to be guided. In the human brain, these supply areas correspond to a network of fine small arterioles.
- each third node is connected via a second edge to a sink node, via which blood supplied to the planar graph via the second nodes leaves the planar graph and particularly "circulates" back to the source nodes.
- the perfusion pressure of the sink node is set to be zero.
- the sink node comprises a flow resistance R au to that is modelled according to
- R ⁇ 2 5 - R min when P inp > ⁇ WmmHg wherein P inp and P ou t as well as Q SU ppiy describe the respective supply area, wherein particularly P inp is the perfusion pressure at the respective supply node, and wherein particularly P out is the pressure at the sink that may be set to zero in particular.
- G (i,j) —Gij when node i and j are connected by a first edge (i.e. a vessel segment), and wherein
- Gij is the reciprocal resistance of the first edge connecting node i and j;
- the vector Q contains the components q lt — , q N --i, wherein
- P 0 is a systemic pressure that drives the blood through the edges of said model of the cerebral vascular tree
- Qsuppiy.is is the blood flow rate in the second edge from third node i to sink node s, and again
- Gij is the reciprocal resistance of the first edge connecting nodes i and
- the system pressure P 0 that drives the blood through the edges of said model of the cerebral vascular tree and blood flow rates in the second edges are used as an input for automatically calculating said perfusion pressures (i.e. for solving said mass flow equations stated above).
- the method may comprise measuring said blood flow rates at the third nodes (i.e. in corresponding supply areas of the brain of the patient) by means of Doppler flow measurement and/or additional similar means (Laser-Speckle, et cetera).
- the method comprise the further step: providing data (e.g. based on one or several of the computed quantities described herein) which allows for quantification of prediction of stroke risk (e.g. stroke risk score) and for simulation and comparison of different treatment options (see also below).
- data e.g. based on one or several of the computed quantities described herein
- stroke risk e.g. stroke risk score
- simulation and comparison of different treatment options see also below.
- said medical image data is transferred via a data connection to a remote computer by a user, particularly a physician, wherein said extracting of said model, and said calculating of perfusion pressures is performed on said computer, and wherein said calculated perfusion pressures are transmitted back to the user (e.g. to a suitable device of the user) via a data connection.
- At least one of the following quantities: blood flow rates, blood velocities, partial derivatives of perfusion pressures, partial derivatives of blood flow rates, is calculated on said remote computer, too, and is transmitted back to the user via said data connection.
- a stroke risk score is generated and transmitted back to the user.
- the computer program according to the invention comprises software code which is adapted to conduct the following steps when executed on a computer:
- system for conducting the method according to one of the claims 1 to 18, wherein the system comprises an analyzing means (e.g. a general purpose computer or dedicated hardware) configured to
- system further comprises a medical data generation means configured to generate said medical image data.
- the system according to the invention can be a stand-alone device or an add-on for an existing medical device, for instance an add-on for a medical imaging device.
- the cerebral vascular tree may be imaged with said medical imaging device and the add-on (i.e. system according to the invention) then simulates the blood flow according to the invention using the medical image data generated with the medical imaging device.
- the computer program according to the invention may be executed on a stand-alone device designed particularly for conducting the method according to the invention (i.e. a system according to the invention) or may be executed on an existing medical device, e.g. a medical imaging device (particularly comprising the necessary hardware such as e.g. a general purpose computer or dedicated hardware), as an add-on to the already existing functionality of the medical imaging device.
- a stand-alone device designed particularly for conducting the method according to the invention (i.e. a system according to the invention) or may be executed on an existing medical device, e.g. a medical imaging device (particularly comprising the necessary hardware such as e.g. a general purpose computer or dedicated hardware), as an add-on to the already existing functionality of the medical imaging device.
- an existing medical device e.g. a medical imaging device (particularly comprising the necessary hardware such as e.g. a general purpose computer or dedicated hardware), as an add-on to the already existing functionality of the medical imaging device.
- Fig. 1 shows a model of the circle of Willis comprising a planar graph
- Fig. 2 shows a graphical illustration of Kirchhoff s first law
- Fig. 3 shows the right half of the circle of Willis and supplying vessel for the three supply areas on the right half of the brain
- Fig. 4 shows a normal node with two incident edges and three outgoing edges
- Fig. 5 shows a graph segment with a source node and two vessels
- Fig. 6 shows a graph segment with dashed edges that correspond to supply areas that are governed by auto-regulation
- Fig. 7 shows a planar graph or virtual model of the cerebral vascular tree that was simulated with the method according to the invention.
- the virtual model used in the method of the present invention particularly describes the cerebral vascular tree 1 by a planar graph 2, an example of which is shown given in Fig. 1 .
- the blood flow through the vessel tree is modelled in analogy to an electric circuit. However, with the addition of a blood supply area a new element in the circuit is introduced. The exact behavior of the blood supply circuit element is described below.
- the square third nodes 23 in Fig. 1 represent supply nodes or areas and the edges with the arrow show the flow directions to the supply areas or away from source nodes which are denoted as second nodes.
- Edges 10 in the graph 2 i.e. a direct connection between two nearest neighbour nodes
- Nodes can either be junctions between vessel segments V (i.e. first nodes 21 connecting first edges 10 representing blood vessel segments V), blood sources (i.e. second nodes 22) or supply areas (i.e. supply nodes 23 connected to a single sink note 24 via second edges 1 1 , see also below).
- Initial circular nodes 22 are blood sources; square end nodes 23 are supply areas.
- the cerebral vessel tree has an overall Reynolds numbers that allows us to describe the cerebral blood flow in terms of a Newtonian fluid.
- the arteries vein segments
- conduits e.g. perfect cylinders
- Equation 1 Hagen- Poiseuille's law
- Fig. 2 shows a graphical illustration of Kirchhoffs first law. The current entering a node must equal the current leaving that node, see equation 3 above.
- the Nodal Analysis algorithm is modified or adapted such that a system can be modelled that is driven by a system pressure and that ensures constant blood supply to specific regions (e.g. the supply areas).
- the algorithm is explained in detail below.
- the model or planar graph 2 (also denoted as network) comprises three types of nodes and two types of edges.
- the primary type of node i.e. the first nodes 21
- the second type of node i.e. the second nodes 22
- the third type of node i.e. the third nodes 23
- the incident pressure e.g. perfusion pressure or P inp
- edges in the network represent normal arterial blood vessel segments (first edges 10) and vessels (second edges 1 1 ) that connect our supply areas (i.e. the supply nodes) to the sink node 24.
- the resistance of the latter is determined via the auto-regulation function given below.
- the vessel network that is simulated according to the invention is limited to the circle of Willis 3 and a few arterial vessel segments V outside the circle of Willis. Those are the vessel segments that are accessible for surgery and their anatomical architecture can be deducted from medical imaging. However, most of the vascular network's resistance originates from the supply areas. They represent a network of fine small arteriole that can change their radii in order to decrease or increase the blood supply in the particular supply area. This process is called auto- regulation and ensures that the blood supply to the brain remains largely constant within certain borders (see also above):
- the blood flow into the supply areas is provided by the outgoing segments (A2, P2 and M1 ) of the circle of Willis 3, see Fig. 3, which shows the right half of the circle of Willis and supplying vessel segments for the three supply areas on the right half of the brain.
- the behavior of the supply areas 23 is modelled according to equation 4. This means that the peripheral resistances of the supply areas adjust themselves such that the blood flow is kept constant for a given pressure gradient ⁇ .
- Equation 4 will be used to model the edges 1 1 that connect supply areas 23 to the systems sink node 24.
- the model requires a system pressure that drives the flow through the network such that the blood supply to the various supply areas of the brain is constant. The flows and pressures will adjust accordingly.
- the auto- regulation model presented here is limited to the region between 80mmHg and 180mmHg of the systolic blood pressure.
- the simulation method according to the invention can particularly be used to compare simulated pressures to pre-defined pressure values in order to access the risk whether ischemia will occur and which supply areas will not be sufficiently supplied. Further, particularly, for the simulation to run, one has to provide a system pressure as well as a blood flow rate per supply area.
- Table 2 Physiological data used in the model (as an example). Table 2 lists the physiological data that is preferably used in the present model. Of course the model may be easily adapted also to other data. The data is taken from the publication of J. Alastruey et al. (Alastruey J, Parker KH, Peiro J, Byrd SM, Sherwin SJ. Modelling the circle of Willis to assess the effects of anatomical variations and occlusions on cerebral flows. J Biomech. 2007;40(8):1794-805. Epub 2006 Oct 1 1 .) and it is an aggregation of physiological data collected by Stergiopulos et al. (1992), Fahrig et al. (1999) and Moore et al. (2006). In table 2 the geometrical properties of the respective vessel segments are depicted on the presumption of symmetry for the left and right hemisphere of the brain.
- the algorithm particularly used in the method according to the invention is a modified Nodal Analysis algorithm.
- the rules for the construction of the matrix equation per type of node and edge are given below.
- the system one is looking at is overdetermined by N equations, where N stands for the number of nodes.
- the last node is taken as the sink node, with a perfusion pressure value of zero. Therefore, the system will be described by N-1 mass flow equations.
- the matrix G represents the network structure; and it consists of the inverse resistances of the vessel segments. In the following it will be explained how to determine the matrix G from a vessel graph like that depicted in Fig. 1 .
- the matrix row vector for a normal node such as node 3 in Fig. 4, which shows a normal (first) node 3 with two incident edges 10 and three outgoing edges 10, is determined in the following way:
- the diagonal element G(3,3) for the node 3, of the matrix is the sum of all G values for all connected edges. While the non-diagonal elements G(3,/) are set to be the negative conductivity value of the corresponding edge - or otherwise 0.
- G ⁇ 3,3) G 31 + G 32 + G 34 + G 35 + G 36 (7)
- Figure 5 depicts a graph segment with a source node s (second node 22) and two connected vessels 10.
- the matrix equation is formulated as follows. First of all one needs to note that the flow into the source node is going to be determined via the supply areas. Therefore, the source node flow is an unknown and therefore an element of the vector P in equation 5.
- the corresponding diagonal element Gdia is:
- Fig. 6 depicts a case with two supply areas (23), denoted by the thick dashed lines (second edges 1 1 ) that are connected to the same sink 24.
- the diagonal element G(1 , 1 ) is the sum of incident edges, however in case the edge is a supply area it does not contribute to the sum.
- the elements of vector Q are: ll QsupplyXs 03) and tfsink i suppfyXs 0 for the incident (13) and ending node (14) respectively.
- the vector Q has a contribution if we have a supply area or a node. If an edge connects a source with a supply area, the corresponding q-vector will have contributions from both the source and the supply area.
- Table 3 Summary of the algorithm, rules for the vector Q, i.e. (incident node)— incident flow— (typed node as per table)— flow from node— (typed node as per configuration).
- edge conductivity is described by equation (15). Basically, the edge conductivity between a supply node and the sink is replaced by our auto-regulation function. For the algorithm this has only an effect on the q-vector, but not on the G-matrix. for a vessel
- Table 4 Summary of algorithm, rules for the matrix G, i-th row.
- a sensitivity analysis was performed, too.
- the basic idea behind the sensitivity analysis is to determine the partial derivative of a variable such as the perfusion pressure or blood flow rate Q with respect to the radius of a given vessel, e.g.: d A1 « EXPRESSION (16)
- a lower bound of 80mmHg at which the auto-regulation will fail is defined to provide a constant blood flow. Therefore, if the incident pressure of a supply area sinks below 80mmHg, one will have an insufficient blood supply to the corresponding supply area.
- the overall minimal systemic pressure necessary to ensure sufficient blood supply to all supply areas is denoted as the critical operating pressure (COP).
- COP critical operating pressure
- COPs for several variations of the circle of Willis with and without the occlusion of the right Internal Carotid Artery I have been computed using the method according to the invention. Results are listed in table 12 and 13 below.
- the COPs for the different anatomical variations without occlusion vary from 93.69 mm Hg up to 98.38 mm Hg of the systolic blood pressure.
- Table 5 Critical operating pressure for an incomplete circle of Willis with a missing A1 L artery.
- equation 16 it was investigated how a change of the radius affect the flow in certain vessels. For this, equation 16 has been employed.
- Table 6 lists only the flows that change as well as how they change.
- simulated critical pressures per supply area are listed below as an example.
- the pressure values are the minimal pressure to maintain an adequate blood supply to the corresponding supply area.
- Table 8 Critical operating pressures How do these critical values change if the Int. Car. I R artery is occluded? The results for this case are given in table 9.
- Table 9 is in agreement with the sensitivity analysis.
- the two frontal supply areas S4, S5 as well as the middle right supply area S9 are affected most strongly by the occlusion, which is a change of the radius of the Int. Car. I artery to a very small value.
- the method/simulation according to the invention was used for determining where to set a bypass.
- the simulation showed that the bypass is best placed to the nearest node of the supply area that has the highest pressure drop.
- the results of the simulation are listed below:
- Table 10 The table lists the flows towards the supply area S5 as well as the pressure at the supply area. The first row corresponds to the ideal situation. Thus connecting the bypass to node P2 has the optimal effect.
- Fig. 7 shows a typical graphical output (e.g. planar graph 2) provided by an embodiment of the method according to the invention that can be displayed on a suitable display device (e.g. monitor etc.) in order to visualize the simulation outcome.
- a suitable display device e.g. monitor etc.
- the graph 2 indicates the individual perfusion pressures in the model.
- Other visualizations are also possible showing for instance the blood flow rates, blood velocities, changes due to occlusions and/or stenosis, computed sensitivities, or any other quantity that can be derived from the simulation result.
- the present invention provides an easy to implement circulation model integrating individual patient data and enabling simulation of vascular pathology as stenosis and occlusion for prediction of ischemic events.
- the method does not need large resources for computing the desired quantities such as the perfusion pressures.
- This simulation model according to the invention will help to individually evaluate stroke risks and might in future represent a crucial parameter in surgical indication for patients potentially undergoing surgical vascularisation procedures.
- Table 12 Crititical operating pressures for the various variations of the circle of Willis.
- anatomical values may be associated to a specific patient. Such values can however be adapted in the model, i.e. the present model can be adapted to any patient.
- a model according to the invention may also be based on generic assumptions. Further, assumed values may be combined with values derived from a patient.
Landscapes
- Medical Informatics (AREA)
- Engineering & Computer Science (AREA)
- Public Health (AREA)
- Health & Medical Sciences (AREA)
- Pathology (AREA)
- Databases & Information Systems (AREA)
- Data Mining & Analysis (AREA)
- Biomedical Technology (AREA)
- Epidemiology (AREA)
- General Health & Medical Sciences (AREA)
- Primary Health Care (AREA)
- Measuring And Recording Apparatus For Diagnosis (AREA)
- Measuring Pulse, Heart Rate, Blood Pressure Or Blood Flow (AREA)
Abstract
The invention relates to a method for simulating the blood flow in the cerebral vascular tree, comprisingthe steps of: Providing medical image data of at least a region of the cerebral vascular tree,extracting a model of said region of the cerebral vascular tree in the form of a planar graph using said medical image data, and automatically calculating velocities, perfusion pressures of the blood in said model of the cerebral vascular tree using a nodal analysis. This is to 1. calculate a stroke risk score of an individual patient for the future and 2. to simulate different treatment options and their respective benefits and risks. Further, the invention relates to a corresponding computer program and a corresponding system.
Description
Method for simulating blood flow in the cerebral vascular tree Specification
The present invention relates to a method, a computer program as well as a system for simulating the blood flow in the cerebral vascular tree, particularly of a human person or patient.
The benefit of surgical procedures for securing blood flow to the brain and thus preventing ischemic events remains an open question. Consequently, there is strong demand for improved methods in the assessment of stroke risks in patients with stenosis of brain-supplying vessels.
Stroke is one of the leading causes of death in Europe and the United States and often leads to disability. Taken the increasing relative and absolute population of people over the age of 60 years, stroke is projected to become of even more important concerning medical treatment, costs and the subsequent necessity of more defined and tailor-made diagnostics and therapeutical procedures.
Stenosis of the internal carotid artery, middle cerebral artery, and other brain- supplying arteries respectively, accounts for approximately 15-30% of ischemic strokes in the supplied territories. After the first stroke the 2-year-risk of experiencing a second ischemic event under best medical treatment is 10-15%. Consequently, several procedures were developed to prevent stroke and recurrent stroke in patients with stenosis of one or several of the brain-supplying vessels: 1 . extracranial- intracranial (EC-IC) arterial bypass surgery was introduced as a revascularisation procedure for improving hemodynamics in the territory at risk. 2. Carotid endarterectomy was developed and it has been shown that in patients with symptomatic carotid stenosis greater than 50-70%, the occurrence of ipsilateral stroke is reduced by around 75%. 3. Interventional carotid stenting or stenting of other brain-supplying vessels has been established. However, in patients with asymptomatic carotid stenosis it remains controversial, whether they benefit from interventions such as surgical thrombendarterectomy or stenting procedures. Besides embolism, which represents a leading mechanism in stroke, insufficient blood flow to cerebral territories due to hemodynamic compromise in presence of
stenosis and/or occlusion of the brain-supplying vessels constitutes an important factor for ischemic events.
Extra-intracranial bypass surgery was introduced for secondary prevention of stroke in the context of steno-occlusive disease of the cerebral vascular system back in the 1960ies and was performed routinely until 1985, when the publication of a multi- center study showed no significant improvement in patients undergoing bypass surgery when compared to best medical treatment [EC/IC Bypass Study NEJM 1985].
However, for two indications extracranial-intracranial bypass surgery remained a major therapeutical option. First, bypass surgery as a means of flow augmentation is indicated in patients with chronic hemodynamic cerebrovascular insufficiency based on an occlusion or a high-grade stenosis of the internal carotid artery or proximal segments of the middle cerebral artery resulting in an impaired blood flow to brain regions. Secondly, acute flow replacement might be necessary in the treatment of patients with complex aneuryms or tumors necessitating sacrifice of the aneurysm- or tumor supplying vessel.
In these patient groups the assessment of the extra- and intracranial vascular state is crucial. Goals of the diagnostic work-up include the evaluation of the collateral blood flow to the vascular territory which is supplied by the affected carotid artery, in order to address the acute stroke risk following potential vessel sacrifice, and, secondly, the assessment of the cerebral vascular reserve capacity in case of initial tolerance of vessel sacrifice reflecting the chronic stroke risk. Since the extent of collateral blood flow via the Circle of Willis and leptomeningeal collaterals may interindividually vary significantly it is mandatory to identify those high risk patients who would not tolerate vessel occlusion and, therefore, necessitate surgical flow replacement.
It has been shown, that immediate sacrifice of the carotid artery without prior evaluation carries a high morbidity and mortality rate, which can be as high as 80%. The sacrifice of one of the internal carotid arteries carries a high risk of provoking cerebral hypoperfusion, and thus, can ultimately lead to stroke. In addition, vessel sacrifice might be initially tolerated but may result in a loss of cerebrovascular reserve capacity due to a maximum dilation of pre-capillary arterioles. Loss of cerebrovascular reserve capacity will result in a chronic increase in stroke risk up to 30-45% per 2 years.
To advance preoperative diagnostics, various tests have been proposed and introduced into clinical practice, such as neurological/clinical evaluation, transcranial doppler sonography (TCD), Xenon-CT imaging, single photon emission computed tomography (SPECT), electrophysiological monitoring and the measurement.
None of these methods strives to depict a dynamic image of blood flow and supply of the brain and its different regions by means of modelling vessel architecture and its response to changes, though.
Furthermore, none of these methods provide the possibility to hypothetically and individually simulate blood flow and perfusion pressure in the brain for comparing the different therapeutical options (surgery, interventional stenting, conservative therapy) before therapy, i.e. risk factors and benefit of the different therapeutical options can currently not be compared for each individual patient and further treatment can currently not be sufficiently personalised.
Therefore, the problem underlying the present invention is to provide a method, a computer program and a system that provide an advancement of the understanding of the cerebral circulation that can be used in particular for an improvement of patient treatment.
This problem is solved by a method having the features of claim 1 . Preferred embodiments are stated in the corresponding sub claims and are described below.
According to claim 1 the method for simulating the blood flow in the cerebral vascular tree comprises the steps of:
- Providing medical image data of at least a region of the cerebral vascular tree (particularly based on image acquisition by one or several of: Magnetic Resonance Imaging, Computed Tomography, Digital Subtraction Angiography, et cetera).
- Extracting an (e.g. virtual or computer) model of said region of the cerebral vascular tree in the form of a planar graph using said medical image data, and
- Automatically calculating perfusion pressures of the blood in said model of the cerebral vascular tree using a (e.g. modified) nodal analysis.
Advantageously, said perfusion pressures (and other quantities calculated using the method according to the invention) can be used for improving preoperative diagnostics in patients with stenosis of the ICA and/or MCA and/or other brain-
supplying vessels, since these quantities can be used in a further step for evaluation of the potential risk of ischemic events
Particularly, according to the invention, the cerebral vascular tree is described by a planar graph in analogy to electric circuits, wherein said graph particularly comprises specific blood supply areas (i.e. regions in the brain where blood is needed in order to guarantee proper functioning of the brain) in the form of so called third nodes (or supply nodes). Particularly, the response of the supply areas to changes of blood flow is modelled using an auto-regulation function that provides constant blood supply.
We defined and determined critical operating pressure values for the respective territories and for several variations of the circle of Willis representing areas at risk for ischemia. Further, the invention allows to simulate stenosis and occlusion of respective arteries (modelled as first edges of the planar graph corresponding to vessel segments of the cerebral vascular tree). Further, the invention allows to prospectively and hypothetically simulate various treatment options such as surgery, stenting et cetera and compare risks and benefits of these options for the individual patient before treatment.
Advantageously, the model used in the present invention can be adapted to individual patient data derived from imaging sources. In case certain information about single vessel segment of the respective cerebral vascular tree are not available by means of medical (e.g. image) data generated before, elements of pre-set models can be used to supplement the medical data. The invention also allows to incorporate vessel segments by hand into the model/planar graph in order to examine their effect in the cerebral vascular tree and/or to supplement missing medical data/information.
Particularly, the invention provides a dynamic and individualised simulation model for the brain circulation integrating individual patient data and enabling simulation of vascular pathology as stenosis and occlusion for prediction of ischemic events. This simulation model might help to individually evaluate stroke risks and could in future represent a crucial parameter in treatment indication for patients potentially undergoing surgical or interventional vascularisation procedures.
According to a preferred embodiment of the method according to the invention, the method further comprises automatically calculating at least one of: blood flow rates, blood velocities, partial derivatives of perfusion pressures (particularly with respect to the radius of a vessel segment/first edge, see also below), partial derivatives of blood
flow rates (particularly with respect to the radius of a vessel segment/first edge). This allows one to study certain sensitivities, which are described further below.
Further, according to a preferred embodiment of the method according to the invention, the step of extracting said model comprises the steps of automatically detecting vessel segments of the cerebral vascular tree in the medical image data, wherein particularly the length and radius of the detected vessel segments are automatically determined, respectively, and detecting connection points at which one (e.g. detected) vessel segment is connected to one or several further (e.g. detected) vessel segments.
Further, according to a preferred embodiment of the method according to the invention, the planar graph comprises first edges, wherein each of said first edges is associated to a detected (arterial blood) vessel segment of the cerebral vascular tree, wherein particularly each detected vessel segment is one of: a vessel segment of the circle of Willis of the cerebral vascular tree, a vessel segment of the cerebral vascular tree forming a first, second, or third order branch of the cerebral vascular tree. Particularly, the first edges represent/form a circle of Willis and branches connected to the circle of Willis, wherein particularly one or several branches are of order one, and wherein particularly one or several branches are of order two, and wherein particularly one or several branches are of order three. Particularly a first order branch (e.g. a corresponding first edge) is directly connected to the circle of Willis, i.e., to a node on the circle of Willis, while a second order branch is connected to a first order branch and a third order branch is connected to a second order branch.
Further, according to a preferred embodiment of the method according to the invention, said first edges are modelled as conduits having the length L and the radius r of the associated (e.g. detected) vessel segment, as well as particularly a flow resistance with respect to blood of
wherein μ is the viscosity of the blood.
Further, according to a preferred embodiment of the method according to the invention, the planar graph comprises first nodes, wherein each of said first nodes is associated to a (e.g. detected) connection point and connects a first edge to one or several other first edges, particularly to two other first edges (corresponding e.g. to detected vessel segments).
Further, according to a preferred embodiment of the method according to the invention, the planar graph comprises second nodes which are source nodes that represent points of said region of the cerebral vascular tree via which the latter is supplied with blood.
Further, according to a preferred embodiment of the method according to the invention, the planar graph comprises third nodes which represent supply areas of the cerebral vascular tree to which blood is to be guided. In the human brain, these supply areas correspond to a network of fine small arterioles.
Further, according to a preferred embodiment of the method according to the invention, each third node is connected via a second edge to a sink node, via which blood supplied to the planar graph via the second nodes leaves the planar graph and particularly "circulates" back to the source nodes. Particularly, the perfusion pressure of the sink node is set to be zero.
Further, according to a preferred embodiment of the method according to the invention, the sink node comprises a flow resistance Rauto that is modelled according to
Pin - pgut
— ^ — when \80mmHg > Pinp > SOmmHg
Q supply
Raut0 (Pinp . Pout ) = Rmin = ™mHg when Pinp < 80mmHg
z~> supply
R^ = 2 5 - Rmin when Pinp > \WmmHg wherein Pinp and Pout as well as QSUppiy describe the respective supply area, wherein particularly Pinp is the perfusion pressure at the respective supply node, and wherein particularly Pout is the pressure at the sink that may be set to zero in particular.
Further, according to a preferred embodiment of the method according to the invention, the step of automatically calculating said perfusion pressures, particularly perfusion pressures at the third, second and/or first nodes, comprises solving N-1 mass flow equations being representable (or being represented in the automatic calculation) as G■ P = Q , wherein N is the total number of nodes (e.g. the last node is taken to be the sink node having pressure pN = 0, see above), P = (vi>- ,VN-I) is a vector containing the perfusion pressures t to be calculated, Q = (qt, - , qN--i) is a vector containing blood flow rates, and G is a matrix, particularly containing inverse flow resistances, e.g. of the first edges/vessel segments.
Further, according to a preferred embodiment of the method according to the invention said matrix G contains the matrix elements G (i,j),
wherein G (i, i) = -1 if t is a source node and
G (i,j) =∑f≠i Gij otherwise, and wherein
G (i,j) = —Gij when node i and j are connected by a first edge (i.e. a vessel segment), and wherein
G (i,j) = 0 when node i and j are connected by a second edge, and wherein
2
Gij = is the reciprocal resistance of the first edge connecting node i and j;
Further, according to a preferred embodiment of the method according to the invention the vector Q contains the components qlt— , qN--i, wherein
qt = 0 when i is a first node, and wherein qs = -(∑j connected to s Gsj)P0 when s is a second node, and wherein qc = GSCP0 when c is a node directly connected to a second node s, and wherein qt = —Qsuppiy.is when i is a third node, and wherein sink = Qsuppiy.is when sink is a sink node, and wherein
P0 is a systemic pressure that drives the blood through the edges of said model of the cerebral vascular tree,
Qsuppiy.is is the blood flow rate in the second edge from third node i to sink node s, and again
2
Gij = is the reciprocal resistance of the first edge connecting nodes i and
Further, according to a preferred embodiment of the method according to the invention the system pressure P0 that drives the blood through the edges of said model of the cerebral vascular tree and blood flow rates in the second edges (i.e. from the third nodes to the sink node) are used as an input for automatically calculating said perfusion pressures (i.e. for solving said mass flow equations stated above).
Particularly, the method may comprise measuring said blood flow rates at the third nodes (i.e. in corresponding supply areas of the brain of the patient) by means of Doppler flow measurement and/or additional similar means (Laser-Speckle, et cetera).
Particularly, the system pressure P0 is the cerebral perfusion pressure pcpp which is particularly approximated by cpp = V-V diastolic [mmHg] + psystoiiC [mmHg])/3 - picp [mmHg], wherein p diastolic is the diastolic pressure, Vsystoiic the systolic pressure and picp the intercranial pressure.
According to a further embodiment of the method according to the invention, the method comprise the further step: providing data (e.g. based on one or several of the computed quantities described herein) which allows for quantification of prediction of stroke risk (e.g. stroke risk score) and for simulation and comparison of different treatment options (see also below).
Further, according to an embodiment of the method according to the present invention, before said calculating of said perfusion pressures, said medical image data is transferred via a data connection to a remote computer by a user, particularly a physician, wherein said extracting of said model, and said calculating of perfusion pressures is performed on said computer, and wherein said calculated perfusion pressures are transmitted back to the user (e.g. to a suitable device of the user) via a data connection.
Further, according to an embodiment of the method according to the present invention, at least one of the following quantities: blood flow rates, blood velocities, partial derivatives of perfusion pressures, partial derivatives of blood flow rates, is calculated on said remote computer, too, and is transmitted back to the user via said data connection.
Further, according to an embodiment of the method according to the present invention, based on said calculated perfusion pressures and particularly on said quantities at least one of: a stroke risk score, or a risk map, is generated and transmitted back to the user.
Further, according to an embodiment of the method according to the present invention, using said model (particularly said calculated perfusion pressure and particularly at least one of or several of said quantities) different therapy options, particularly bypass surgery, stenting procedures, drug administration and/or wait- and-see-approaches, are automatically simulated and particularly compared to each other on said computer and a risk profile for the respective patient is transmitted back to the user via a data connection.
The problem underlying the present invention is further solved by a computer program according to claim 19. The computer program is further adapted to conduct the steps of the method according to the invention as claimed in claims 2 to 18 or described above.
According to claim 19, the computer program according to the invention comprises software code which is adapted to conduct the following steps when executed on a computer:
Extracting a (e.g. virtual or computer) model of at least a region of the cerebral vascular tree in the form of a planar graph using medical image data that was provided or generated before, and
Automatically calculating perfusion pressures of the blood in said model of the cerebral vascular tree using a nodal analysis.
Finally, the problem underlying the present invention is further solved by a system having the features of claim 20.
System for conducting the method according to one of the claims 1 to 18, wherein the system comprises an analyzing means (e.g. a general purpose computer or dedicated hardware) configured to
extract a (e.g. virtual or computer) model of at least a region of the cerebral vascular tree in the form of a planar graph using medical image data, and to calculate perfusion pressures of the blood in said model of the cerebral vascular tree using a nodal analysis, and wherein
particularly the system further comprises a medical data generation means configured to generate said medical image data.
Particularly, the system according to the invention can be a stand-alone device or an add-on for an existing medical device, for instance an add-on for a medical imaging device. Here, the cerebral vascular tree may be imaged with said medical imaging device and the add-on (i.e. system according to the invention) then simulates the blood flow according to the invention using the medical image data generated with the medical imaging device.
Likewise, the computer program according to the invention may be executed on a stand-alone device designed particularly for conducting the method according to the invention (i.e. a system according to the invention) or may be executed on an existing
medical device, e.g. a medical imaging device (particularly comprising the necessary hardware such as e.g. a general purpose computer or dedicated hardware), as an add-on to the already existing functionality of the medical imaging device.
In the following further features and embodiments of the present invention shall be described with reference to the Figures, wherein
Fig. 1 shows a model of the circle of Willis comprising a planar graph;
Fig. 2 shows a graphical illustration of Kirchhoff s first law;
Fig. 3 shows the right half of the circle of Willis and supplying vessel for the three supply areas on the right half of the brain; and
Fig. 4 shows a normal node with two incident edges and three outgoing edges;
Fig. 5 shows a graph segment with a source node and two vessels;
Fig. 6 shows a graph segment with dashed edges that correspond to supply areas that are governed by auto-regulation; and
Fig. 7 shows a planar graph or virtual model of the cerebral vascular tree that was simulated with the method according to the invention.
The virtual model used in the method of the present invention particularly describes the cerebral vascular tree 1 by a planar graph 2, an example of which is shown given in Fig. 1 . The blood flow through the vessel tree is modelled in analogy to an electric circuit. However, with the addition of a blood supply area a new element in the circuit is introduced. The exact behavior of the blood supply circuit element is described below.
The square third nodes 23 in Fig. 1 represent supply nodes or areas and the edges with the arrow show the flow directions to the supply areas or away from source nodes which are denoted as second nodes. Edges 10 in the graph 2 (i.e. a direct connection between two nearest neighbour nodes) correspond to blood vessel segments V. Nodes can either be junctions between vessel segments V (i.e. first nodes 21 connecting first edges 10 representing blood vessel segments V), blood sources (i.e. second nodes 22) or supply areas (i.e. supply nodes 23 connected to a single sink note 24 via second edges 1 1 , see also below). Initial circular nodes 22 are blood sources; square end nodes 23 are supply areas.
The cerebral vessel tree has an overall Reynolds numbers that allows us to describe the cerebral blood flow in terms of a Newtonian fluid. We model the arteries (vessel
segments) as conduits (e.g. perfect cylinders) and can therefore use Hagen- Poiseuille's law (equation 1 ) to determine the pressure drop ΔΡ along a cerebral artery or vessel segment of length L, radius r and with the blood viscosity μ for a flow rate Q.
ΔΡ (1 )
r2
Hagen-Poiseuille's law is equivalent to Ohm's law (R=U/I). Therefore, we can define the resistance of an arterial vessel segment to be:
Additionally, the conservation of mass leads to the mass flow law, described by eq. 3. It states that the amount of blood entering a node must equal the amount of blood that leaves a node.

We can use these equations to formulate mass flow conservation equations for each node and then solve these equations for the pressures. This approach can be automated with a simple algorithm used in electrical engineering, called modified Nodal Analysis (Cheng, Chung-Kuan. Lecture Notes for CSE245: Computer-Aided Circuit Simulation and Verification. Spring 2006. Lecture I .Vincent Acary; Olivier Bonnefon; Bernard Brogliato (2010). Nonsmooth Modeling and Simulation for Switched Circuits. Springer Science & Business Media, pp. 3-4 (for the diode example). ISBN 978-90-481 -9681 -4.).
Fig. 2 shows a graphical illustration of Kirchhoffs first law. The current entering a node must equal the current leaving that node, see equation 3 above.
In the framework of the present invention, the Nodal Analysis algorithm is modified or adapted such that a system can be modelled that is driven by a system pressure and that ensures constant blood supply to specific regions (e.g. the supply areas). The algorithm is explained in detail below.
The model or planar graph 2 (also denoted as network) comprises three types of nodes and two types of edges. The primary type of node (i.e. the first nodes 21 ), is one that connects different vessel segments V with each other (junctions between vessels). The second type of node (i.e. the second nodes 22), is a source node that will provide the system with blood. The third type of node (i.e. the third nodes 23) is a
supply area, whose resistance depends on the incident pressure (e.g. perfusion pressure or Pinp) and the auto-regulation process described in the next section.
The types of edges in the network represent normal arterial blood vessel segments (first edges 10) and vessels (second edges 1 1 ) that connect our supply areas (i.e. the supply nodes) to the sink node 24. The resistance of the latter is determined via the auto-regulation function given below.
Preferably, the vessel network that is simulated according to the invention is limited to the circle of Willis 3 and a few arterial vessel segments V outside the circle of Willis. Those are the vessel segments that are accessible for surgery and their anatomical architecture can be deducted from medical imaging. However, most of the vascular network's resistance originates from the supply areas. They represent a network of fine small arteriole that can change their radii in order to decrease or increase the blood supply in the particular supply area. This process is called auto- regulation and ensures that the blood supply to the brain remains largely constant within certain borders (see also above):
P. -P
mp — , 1 MmmHg > P. > MmmHg
Q supply
Rauto (PinP > Pou = in = , < 80mmHg (4)
z~- supply
Rmax = ^5 - Rmin ,Pinp > mmHg
The blood flow into the supply areas is provided by the outgoing segments (A2, P2 and M1 ) of the circle of Willis 3, see Fig. 3, which shows the right half of the circle of Willis and supplying vessel segments for the three supply areas on the right half of the brain.
The behavior of the supply areas 23 is modelled according to equation 4. This means that the peripheral resistances of the supply areas adjust themselves such that the blood flow is kept constant for a given pressure gradient ΔΡ.
Equation 4 will be used to model the edges 1 1 that connect supply areas 23 to the systems sink node 24.
Further, the model requires a system pressure that drives the flow through the network such that the blood supply to the various supply areas of the brain is constant. The flows and pressures will adjust accordingly. Particularly, the auto-
regulation model presented here is limited to the region between 80mmHg and 180mmHg of the systolic blood pressure.
The simulation method according to the invention can particularly be used to compare simulated pressures to pre-defined pressure values in order to access the risk whether ischemia will occur and which supply areas will not be sufficiently supplied. Further, particularly, for the simulation to run, one has to provide a system pressure as well as a blood flow rate per supply area.

Table 1 : Boundary Conditions.
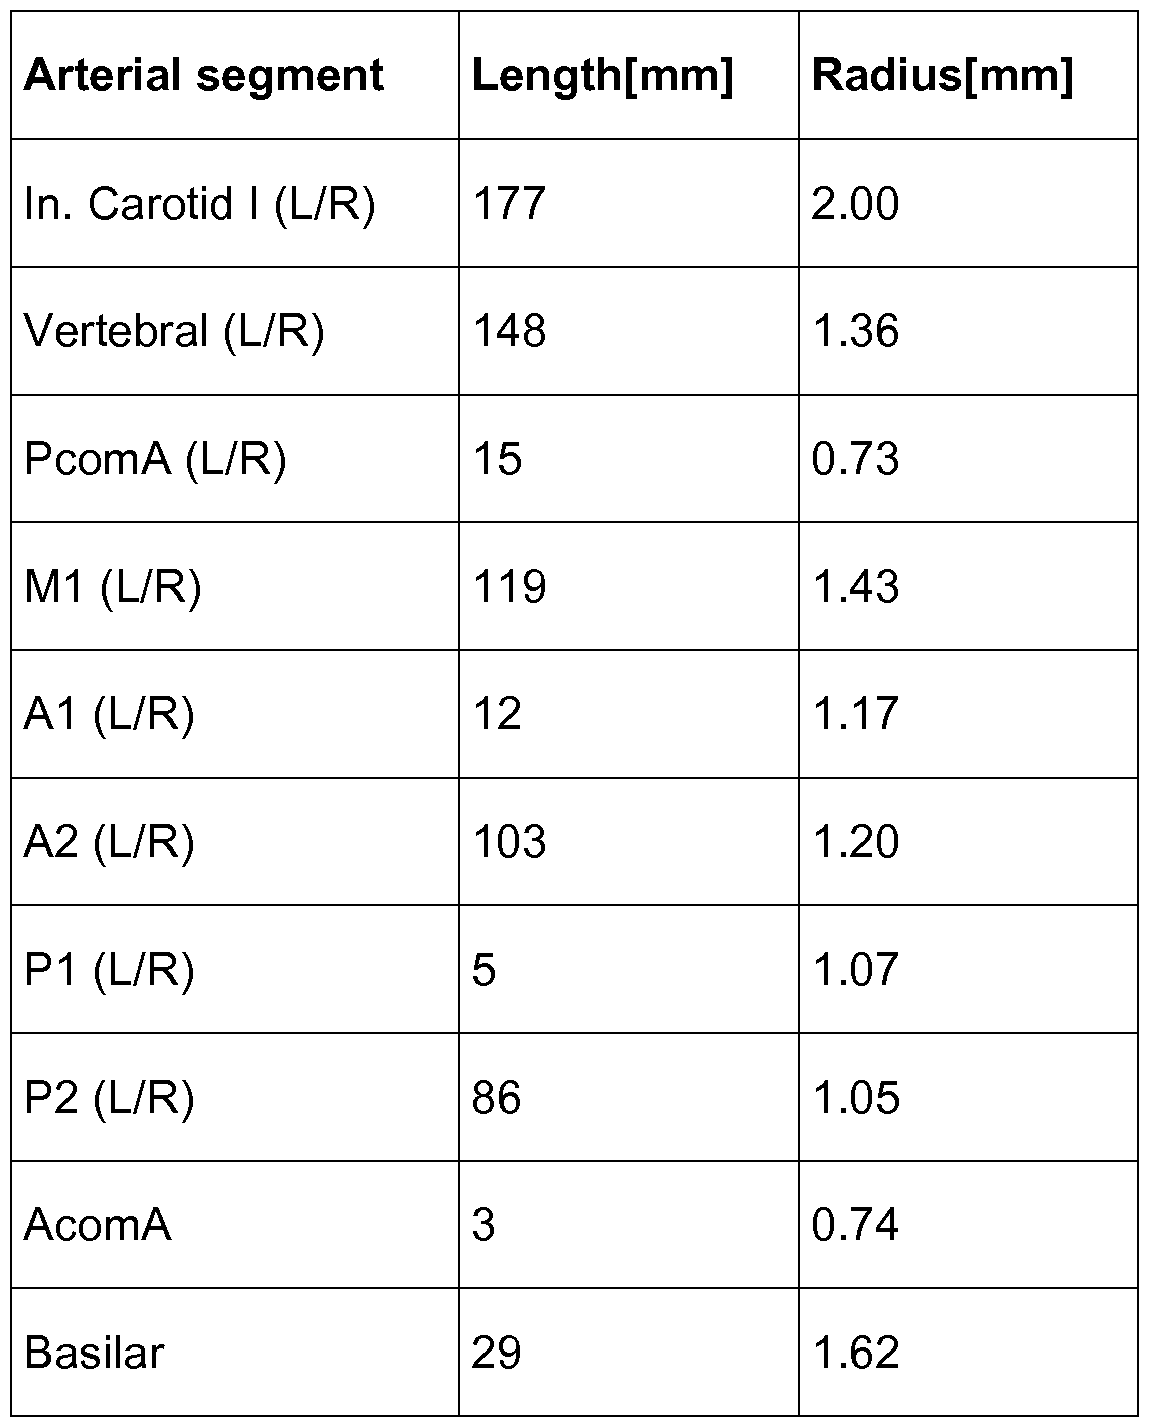
Table 2: Physiological data used in the model (as an example).
Table 2 lists the physiological data that is preferably used in the present model. Of course the model may be easily adapted also to other data. The data is taken from the publication of J. Alastruey et al. (Alastruey J, Parker KH, Peiro J, Byrd SM, Sherwin SJ. Modelling the circle of Willis to assess the effects of anatomical variations and occlusions on cerebral flows. J Biomech. 2007;40(8):1794-805. Epub 2006 Oct 1 1 .) and it is an aggregation of physiological data collected by Stergiopulos et al. (1992), Fahrig et al. (1999) and Moore et al. (2006). In table 2 the geometrical properties of the respective vessel segments are depicted on the presumption of symmetry for the left and right hemisphere of the brain.
This data together with the planar graph depicted in Fig. 1 is particularly used in an embodiment of the invention to build the model of the circle of Willis and connected vessel segments.
The algorithm particularly used in the method according to the invention is a modified Nodal Analysis algorithm. The rules for the construction of the matrix equation per type of node and edge are given below. The system one is looking at is overdetermined by N equations, where N stands for the number of nodes. The last node is taken as the sink node, with a perfusion pressure value of zero. Therefore, the system will be described by N-1 mass flow equations. One can represent these mass flow equations in terms of a matrix equation 5 (or in any other form suitable for computation by means of a computer).
G P = Q (5)
We then need to solve the matrix equation to determine the perfusion pressures and particularly eventually the blood flow rates in the edges (vessel segments) of the model. The matrix G represents the network structure; and it consists of the inverse resistances of the vessel segments. In the following it will be explained how to determine the matrix G from a vessel graph like that depicted in Fig. 1 .
The matrix row vector for a normal node, such as node 3 in Fig. 4, which shows a normal (first) node 3 with two incident edges 10 and three outgoing edges 10, is determined in the following way:
The diagonal element G(3,3) for the node 3, of the matrix is the sum of all G values for all connected edges. While the non-diagonal elements G(3,/) are set to be the negative conductivity value of the corresponding edge - or otherwise 0.
This leads to the following matrix row vector for the G matrix:
G G3l - G32 G(3,3) - G34 G G (6)
Where G(3,3) is:
G{3,3) = G31 + G32 + G34 + G35 + G36 (7)
And in general the off diagonal element G(3,/): G(3, i )= - G3i
The corresponding element of the vector Q is just 0. This represents a flow equation like equation 3.
Figure 5 depicts a graph segment with a source node s (second node 22) and two connected vessels 10. Here, the matrix equation is formulated as follows. First of all one needs to note that the flow into the source node is going to be determined via the supply areas. Therefore, the source node flow is an unknown and therefore an element of the vector P in equation 5. The corresponding diagonal element Gdia is:
Gdia = -1 (9)
All other matrix elements are then again just like equation (8). The interesting part here is the value of the vector Q for the source node: qs = -(Gs, + Gs2 )- P* ( 0). And for the nodes that are directly connected with the source node:
¾ connected s,connected
Particularly, in order to model supply areas, the auto-regulation equation (5) is preferably used. Fig. 6 depicts a case with two supply areas (23), denoted by the thick dashed lines (second edges 1 1 ) that are connected to the same sink 24.
The matrix row for the node 1 is given below: (12)
Again the diagonal element G(1 , 1 ) is the sum of incident edges, however in case the edge is a supply area it does not contribute to the sum. The elements of vector Q are: ll QsupplyXs 03)
and tfsink i suppfyXs 0 for the incident (13) and ending node (14) respectively. The vector Q has a contribution if we have a supply area or a node. If an edge connects a source with a supply area, the corresponding q-vector will have contributions from both the source and the supply area.
In table 3 we have listed the terms for the elements of the vector Q in dependence on the type of node.

Table 3: Summary of the algorithm, rules for the vector Q, i.e. (incident node)— incident flow— (typed node as per table)— flow from node— (typed node as per configuration).
The edge conductivity is described by equation (15). Basically, the edge conductivity between a supply node and the sink is replaced by our auto-regulation function. For the algorithm this has only an effect on the q-vector, but not on the G-matrix. for a vessel
8 · · Ζ (15)
0 for a supply area
Table 4 summarizes the algorithm for the creation and determination of the G-matrix.
Element Value
G(i,i)
G(i,j) - G9
Table 4: Summary of algorithm, rules for the matrix G, i-th row.
In order to predict the effects of changes of a certain variable of the system, such as the radius of a blood vessel, a sensitivity analysis was performed, too. The basic idea behind the sensitivity analysis is to determine the partial derivative of a variable such as the perfusion pressure or blood flow rate Q with respect to the radius of a given vessel, e.g.: d A1 « EXPRESSION (16)
^rint.Car.I
One can easily formulate similar Newton steps for all relevant system variables and can therefore analyze and predict how the system reacts to changes of certain system variables. This would, for instance, allow to determine which vessels will correct the compromised blood flow due to occlusions.
In the present model of the auto-regulation used in the method according to the invention, a lower bound of 80mmHg at which the auto-regulation will fail is defined to provide a constant blood flow. Therefore, if the incident pressure of a supply area sinks below 80mmHg, one will have an insufficient blood supply to the corresponding supply area. In the framework of the present invention, the overall minimal systemic pressure necessary to ensure sufficient blood supply to all supply areas is denoted as the critical operating pressure (COP). Particularly, in a further step the simulation according to the invention therefore allows one to determine COPs for which ischemia will not occur.
As an example, COPs for several variations of the circle of Willis with and without the occlusion of the right Internal Carotid Artery I (ICA I) have been computed using the method according to the invention. Results are listed in table 12 and 13 below. The COPs for the different anatomical variations without occlusion vary from 93.69 mm Hg up to 98.38 mm Hg of the systolic blood pressure.
Non Occluded Occluded
92.82 mm Hg 138.30 mm Hg
Table 5: Critical operating pressure for an incomplete circle of Willis with a missing A1 L artery.
However, an occlusion of the ICA changes the COPs significantly. A particular extreme change occurs for the anatomical variation where the A1 L segment is missing. Table 5 shows the two values for the COP with and without occlusion. Therefore, patients with a missing A1 L will have a particularly strong reaction to the occlusion of the right Int. Car. I.
Further, as an example, it was investigated how a change of the radius affect the flow in certain vessels. For this, equation 16 has been employed.
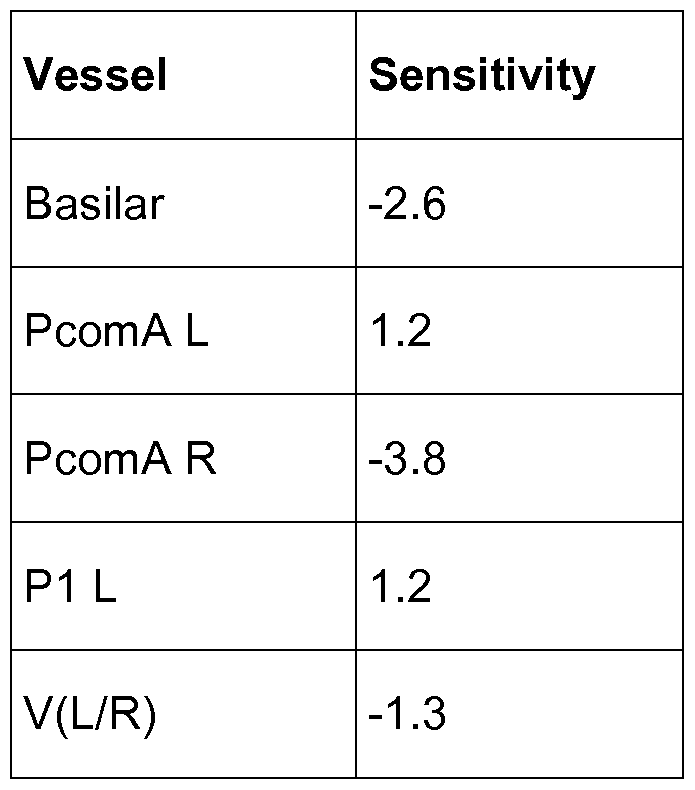
Table 6: Sensitivity Analysis for the Int. Car. I arteries radius.
Table 6 lists only the flows that change as well as how they change.
Vessels that are not listed have the same flow, therefore the flow does not change.
Supply Area Sensitivity
S5 18.85
S4 18.85
S9 18.85
S18 5.476
S19 4.209
S8 0.049
Table 7: Sensitivity of supply area pressure.
In table 7 we see the results of the sensitivity analysis for the supply areas. The pressure for all supply areas increases. However, the two frontal supply areas as well as the right middle supply area are effected the strongest. For the left middle supply area S8 the pressure change is almost zero. The remaining supply areas react a bit.
Thus, we can see which supply areas are most sensitive to changes of the radius of the right interior carotid artery.
Further, simulated critical pressures per supply area are listed below as an example. The pressure values are the minimal pressure to maintain an adequate blood supply to the corresponding supply area.

Table 8: Critical operating pressures
How do these critical values change if the Int. Car. I R artery is occluded? The results for this case are given in table 9.
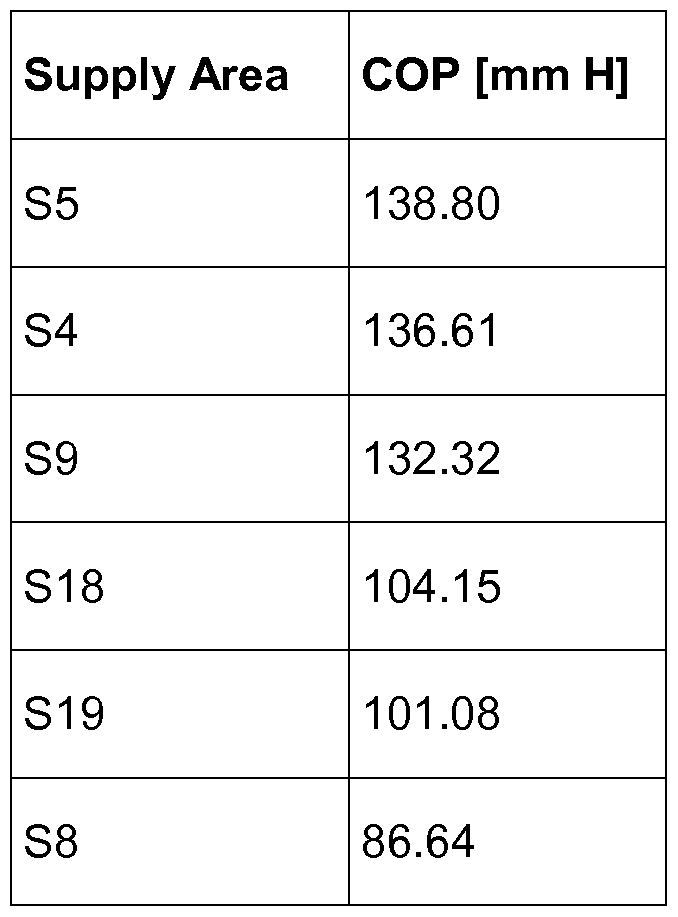
Table 9: Critical operating pressures
Table 9 is in agreement with the sensitivity analysis. The two frontal supply areas S4, S5 as well as the middle right supply area S9 are affected most strongly by the occlusion, which is a change of the radius of the Int. Car. I artery to a very small value.
Further, the method/simulation according to the invention was used for determining where to set a bypass. The simulation showed that the bypass is best placed to the nearest node of the supply area that has the highest pressure drop. The results of the simulation are listed below:

Table 10: The table lists the flows towards the supply area S5 as well as the pressure at the supply area.
The first row corresponds to the ideal situation. Thus connecting the bypass to node P2 has the optimal effect.
Further, Fig. 7 shows a typical graphical output (e.g. planar graph 2) provided by an embodiment of the method according to the invention that can be displayed on a suitable display device (e.g. monitor etc.) in order to visualize the simulation outcome.
Here, the graph 2 indicates the individual perfusion pressures in the model. Other visualizations are also possible showing for instance the blood flow rates, blood velocities, changes due to occlusions and/or stenosis, computed sensitivities, or any other quantity that can be derived from the simulation result.
Particularly, to summarize, the present invention provides an easy to implement circulation model integrating individual patient data and enabling simulation of vascular pathology as stenosis and occlusion for prediction of ischemic events. Advantageously the method does not need large resources for computing the desired quantities such as the perfusion pressures.
This simulation model according to the invention will help to individually evaluate stroke risks and might in future represent a crucial parameter in surgical indication for patients potentially undergoing surgical vascularisation procedures.
Table 12: Crititical operating pressures for the various variations of the circle of Willis.
Variation COP[mm Hg]
Complete 90.94
A1 (L/R) 92.82
P1 (L/R) 93.95
PcomAs 93.93
PcomA (L/R) 92.10
AcomA 90.94
PcomA R, P1 L (L/R) 93.95
Table 13: Critical operating pressures for the various variations with an occlusion of the right interior carotid artery Table.

Particularly, in the above, anatomical values may be associated to a specific patient. Such values can however be adapted in the model, i.e. the present model can be adapted to any patient. However, a model according to the invention may also be based on generic assumptions. Further, assumed values may be combined with values derived from a patient.
Claims
1 . A method for simulating the blood flow in the cerebral vascular tree (1 ), comprising the steps of:
Providing medical image data of at least a region of the cerebral vascular tree (1 ),
Extracting a model of said region of the cerebral vascular tree in the form of a planar graph (2) using said medical image data, and
Automatically calculating perfusion pressures of the blood in said model of the cerebral vascular tree using a nodal analysis.
2. The method according to claim 1 , characterized in that the method further comprises automatically calculating at least one of: blood flow rates, blood velocities, partial derivatives of perfusion pressures, partial derivatives of blood flow rates.
3. The method according to claim 1 or 2, characterized in that the step of extracting said model comprises the steps of automatically detecting vessel segments (V) of the cerebral vascular tree (1 ) in the medical image data, wherein particularly the length (L) and radius (r) of the detected vessel segments are automatically determined, respectively, and detecting connection points (P) at which one vessel segment is connected to one or several, particularly two, further vessel segments.
4. The method according to one of the preceding claims, characterized in that the planar graph (2) comprises first edges (10), wherein each of said first edges is associated to a detected vessel segment (V) of the cerebral vascular tree (1 ), wherein particularly each detected vessel segment is one of:
a vessel segment (V) of the circle of Willis (3) of the cerebral vascular tree,
a vessel segment (V) of the cerebral vascular tree (1 ) forming a first, second, or third order branch of the cerebral vascular tree (1 ).
5. The method according to claim 4, characterized in that said first edges (10) are modelled as conduits having the length (L) and the radius (r) of the associated vessel segment, as well as particularly a flow resistance with respect to blood of
wherein μ is the viscosity of the blood.
6. The method according to one of the preceding claims, characterized in that the planar graph (2) comprises first nodes (21 ), wherein each of said first nodes is associated to a detected connection point (P) and connects a first edge (10) to one or several, particularly two, other first edges (10).
7. The method according to one of the preceding claims, characterized in that the planar graph (2) comprises second nodes (22) which are source nodes that represent points of said region of the cerebral vascular tree (1 ) via which the latter is supplied with blood, respectively.
8. The method according to one of the preceding claims, characterized in that the planar graph (2) comprises third nodes (23) which represent supply areas of the cerebral vascular tree (1 ) to which blood is to be guided.
9. The method according to one of the preceding claims, characterized in that each third node (23) is connected via a second edge (1 1 ) to a sink node (24), via which blood supplied to the planar graph via the second nodes leaves the planar graph.
10. The method according to claim 9, characterized in that the sink node (24) comprises a flow resistance Rauto that is modelled according to
Raut0 [Pinp . Pout ) = Pinp ~ P°ut when 1 SOmmHg > Pinp > SOmmHg,
supply
Raut0 (Pinp . Pout ) = Rmin = ™mHg when Pinp < 80mmHg,
z~> supply
Rauto (Pinp , Pout ) = R^ = 2- 5 · Rmin when Pinp > 1 SOmmHg.
1 1 . The method according to one of the preceding claims, characterized in that the step of automatically calculating said perfusion pressures, particularly perfusion pressures at the third, second and/or first nodes (21 , 22, 23), comprises solving N-1 mass flow equations being representable as G■ P = Q, wherein N is the total number of nodes, P = (p1( - , pw-i) is a vector containing the perfusion pressures t to be calculated, Q = (qt, - , qN--i) is a vector containing blood flow rates, and G is a matrix particularly containing inverse flow resistances.
12. The method according to claim 1 1 , characterized in that said matrix G contains the matrix elements G(i,j), wherein G(i, i) =—1 if i is a second node (22) and
G(i,j)
 when node i and j are connected by a first edge (10), and wherein G(i,j) = 0 when node i and j are connected by a second edge (1 1 ), and wherein Gi) ■, = is the reciprocal resistance of the first edge connecting node i and j;
and/or that the vector Q contains the components qlt ··· , qN-l t wherein qt = 0 when i is a first node, and wherein qs = -(∑_,■ connected to s GSj)P0 when s is a second node, and wherein qc = GSCP0 when c is a node directly connected to a second node s, and wherein qt = —QSUppiy,is when i is a third node, and wherein qsink = Qsuppiy.is when sink is a sink node, and wherein P0 is a system pressure that drives the blood through said model of the cerebral vascular tree, QSUppiy,is is the blood flow rate in the second edge from third node i to sink node s, and
Gij = is the reciprocal resistance of the first edge connecting nodes i and
13. The method according to one of the preceding claims, characterized in that the system pressure (P0) that drives the blood through said model of the cerebral vascular tree (1 ) and blood flow rates in the second edges are used as an input for automatically calculating said perfusion pressures, particularly the system pressure (P0) is the cerebral perfusion pressure (pcpp) which is particularly approximated by
Pcpp = V-V diastolic [mmHg] + psystoiic [mmHg])/3 - picp[mmHg]].
14. The method according to one of the preceding claims, characterized in that the method comprise the further step: Providing data which allows for quantification of prediction of stroke risk and for simulation and comparison of different treatment options.
15. The method according to one of the preceding claims, characterized in that, before said calculating of said perfusion pressures, said medical image data is transferred via a data connection to a remote computer by a user, particularly a physician, wherein said extracting of said model, and said calculating of perfusion pressures is performed on said computer, and wherein said calculated perfusion pressures are transmitted back to the user via a data connection.
16. The method according to claim 15, characterized in that at least one of the following quantities: blood flow rates, blood velocities, partial derivatives of
perfusion pressures, partial derivatives of blood flow rates, is calculated on said remote computer, too, and is transmitted back to the user via said data connection.
17. The method according to claim 15 or 16, characterized in that, based on said calculated perfusion pressures and particularly on said quantities at least one of: a stroke risk score, or a risk map, is generated and transmitted back to the user.
18. The method according to one of the claims 15 to 17, characterized in that using said model different therapy options, particularly bypass surgery, stenting procedures, drug administration and/or wait-and-see-approaches, are automatically simulated and particularly compared to each other on said computer and a risk profile for the respective patient is transmitted back to the user via a data connection.
19. A computer program comprising software code which is adapted to conduct the following steps when executed on a computer:
Extracting a model of at least a region of the cerebral vascular tree in the form of a planar graph using medical image data that was provided or generated before, and
Automatically calculating perfusion pressures of the blood in said model of the cerebral vascular tree using a nodal analysis.
20. System for conducting the method according to one of the claims 1 to 18, wherein the system comprises an analyzing means configured to
extract a model of at least a region of the cerebral vascular tree in the form of a planar graph using medical image data, and
to calculate perfusion pressures of the blood in said model of the cerebral vascular tree using a nodal analysis, and wherein
particularly the system further comprises a medical data generation means configured to generate said medical image data.
Applications Claiming Priority (2)
| Application Number | Priority Date | Filing Date | Title |
|---|---|---|---|
| EP15164563.7 | 2015-04-21 | ||
| EP15164563 | 2015-04-21 |
Publications (1)
| Publication Number | Publication Date |
|---|---|
| WO2016170076A1 true WO2016170076A1 (en) | 2016-10-27 |
Family
ID=53005486
Family Applications (1)
| Application Number | Title | Priority Date | Filing Date |
|---|---|---|---|
| PCT/EP2016/058936 Ceased WO2016170076A1 (en) | 2015-04-21 | 2016-04-21 | Method for simulating blood flow in the cerebral vascular tree |
Country Status (1)
| Country | Link |
|---|---|
| WO (1) | WO2016170076A1 (en) |
Cited By (3)
| Publication number | Priority date | Publication date | Assignee | Title |
|---|---|---|---|---|
| WO2018131754A1 (en) * | 2017-01-10 | 2018-07-19 | 삼성메디슨 주식회사 | Method and apparatus for displaying ultrasound image of target object |
| DE102020200750A1 (en) | 2020-01-22 | 2021-07-22 | Siemens Healthcare Gmbh | Providing a blood flow parameter set of a vascular malformation |
| CN113539516A (en) * | 2021-07-07 | 2021-10-22 | 深圳睿心智能医疗科技有限公司 | Method and device for acquiring effect after application of treatment scheme |
Citations (1)
| Publication number | Priority date | Publication date | Assignee | Title |
|---|---|---|---|---|
| US20150038860A1 (en) * | 2013-07-30 | 2015-02-05 | Heartflow, Inc. | Method and system for modeling blood flow with boundary conditions for optimized diagnostic performance |
-
2016
- 2016-04-21 WO PCT/EP2016/058936 patent/WO2016170076A1/en not_active Ceased
Patent Citations (1)
| Publication number | Priority date | Publication date | Assignee | Title |
|---|---|---|---|---|
| US20150038860A1 (en) * | 2013-07-30 | 2015-02-05 | Heartflow, Inc. | Method and system for modeling blood flow with boundary conditions for optimized diagnostic performance |
Non-Patent Citations (8)
| Title |
|---|
| ALASTRUEY J; PARKER KH; PEIR6 J; BYRD SM; SHERWIN SJ: "Modelling the circle of Willis to assess the effects of anatomical variations and occlusions on cerebral flows", J BIOMECH., vol. 40, no. 8, 11 October 2006 (2006-10-11), pages 1794 - 805, XP022070088, DOI: doi:10.1016/j.jbiomech.2006.07.008 |
| ANONYMOUS: "Cerebral perfusion pressure", 9 February 2014 (2014-02-09), XP002759640, Retrieved from the Internet <URL:https://en.wikipedia.org/w/index.php?title=Cerebral_perfusion_pressure&oldid=594603807> [retrieved on 20160707] * |
| ANONYMOUS: "Vascular resistance", 24 February 2015 (2015-02-24), XP002759683, Retrieved from the Internet <URL:https://en.wikipedia.org/w/index.php?title=Vascular_resistance&oldid=648589333> [retrieved on 20160708] * |
| CHENG; CHUNG-KUAN, LECTURE NOTES FOR CSE245: COMPUTER-AIDED CIRCUIT SIMULATION AND VERIFICATION, 2006 |
| DAVID T ET AL: "Modeling perfusion in the cerebral vasculature", MEDICAL ENGINEERING & PHYSICS, BUTTERWORTH-HEINEMANN, GB, vol. 30, no. 10, 1 December 2008 (2008-12-01), pages 1227 - 1245, XP025682037, ISSN: 1350-4533, [retrieved on 20081105], DOI: 10.1016/J.MEDENGPHY.2008.09.008 * |
| MASHAYEKHI G ET AL: "Modeling blood flow & pressure in systemic circulation with cuff occlusion", 2013 20TH IRANIAN CONFERENCE ON BIOMEDICAL ENGINEERING (ICBME), IEEE, 18 December 2013 (2013-12-18), pages 48 - 53, XP032584030, DOI: 10.1109/ICBME.2013.6782191 * |
| SEMMLOW, JOHN L.: "Circuits, Signals, and Systems for Bioengineers: A MATLAB-Based Introduction", 15 April 2005, ELSEVIER B.V., ISBN: 012-08-8493-3, XP040425645 * |
| VINCENT ACARY; OLIVIER BONNEFON; BERNARD BROGLIATO: "Nonsmooth Modeling and Simulation for Switched Circuits", 2010, SPRINGER SCIENCE & BUSINESS MEDIA, ISBN: 978-90-481-96, pages: 3 - 4 |
Cited By (4)
| Publication number | Priority date | Publication date | Assignee | Title |
|---|---|---|---|---|
| WO2018131754A1 (en) * | 2017-01-10 | 2018-07-19 | 삼성메디슨 주식회사 | Method and apparatus for displaying ultrasound image of target object |
| US11413019B2 (en) | 2017-01-10 | 2022-08-16 | Samsung Medison Co., Ltd. | Method and apparatus for displaying ultrasound image of target object |
| DE102020200750A1 (en) | 2020-01-22 | 2021-07-22 | Siemens Healthcare Gmbh | Providing a blood flow parameter set of a vascular malformation |
| CN113539516A (en) * | 2021-07-07 | 2021-10-22 | 深圳睿心智能医疗科技有限公司 | Method and device for acquiring effect after application of treatment scheme |
Similar Documents
| Publication | Publication Date | Title |
|---|---|---|
| US11638609B2 (en) | Systems and methods for risk assessment and treatment planning of arterio-venous malformation | |
| JP7304390B2 (en) | Method and system for patient-specific blood flow modeling | |
| US20220406470A1 (en) | Systems and methods for processing electronic images to determine flow using flow ratio | |
| CN102551780B (en) | Device and computed tomography scanner for determining and visualizing the perfusion of the myocardial muscle | |
| JP2016528975A (en) | Method and system for modeling blood flow using boundary conditions for optimized diagnostic capabilities | |
| JP2018515167A (en) | System and method for identifying and visualizing functional relationship between vascular network and perfused tissue | |
| WO2016170076A1 (en) | Method for simulating blood flow in the cerebral vascular tree | |
| Pennati et al. | Boundary conditions of patient-specific fluid dynamics modelling of cavopulmonary connections: possible adaptation of pulmonary resistances results in a critical issue for a virtual surgical planning | |
| CN113423330B (en) | Non-invasive determination of resting diastolic hemodynamic information | |
| Mamatyukov et al. | Comprehensive research of human brain hemodynamics: Clinical monitoring and computer simulations | |
| Clark et al. | A patient-specific computer model for prediction of clinical outcomes in the cerebral circulation using MR flow measurements | |
| WO2021248046A1 (en) | Mathematical modeling of blood flow to evaluate hemodynamic significance of peripheral vascular legions |
Legal Events
| Date | Code | Title | Description |
|---|---|---|---|
| 121 | Ep: the epo has been informed by wipo that ep was designated in this application |
Ref document number: 16723257 Country of ref document: EP Kind code of ref document: A1 |
|
| DPE1 | Request for preliminary examination filed after expiration of 19th month from priority date (pct application filed from 20040101) | ||
| NENP | Non-entry into the national phase |
Ref country code: DE |
|
| 122 | Ep: pct application non-entry in european phase |
Ref document number: 16723257 Country of ref document: EP Kind code of ref document: A1 |