WO2012086443A1 - Monitoring data analysis device, monitoring data analysis method, and monitoring data analysis program - Google Patents
Monitoring data analysis device, monitoring data analysis method, and monitoring data analysis program Download PDFInfo
- Publication number
- WO2012086443A1 WO2012086443A1 PCT/JP2011/078710 JP2011078710W WO2012086443A1 WO 2012086443 A1 WO2012086443 A1 WO 2012086443A1 JP 2011078710 W JP2011078710 W JP 2011078710W WO 2012086443 A1 WO2012086443 A1 WO 2012086443A1
- Authority
- WO
- WIPO (PCT)
- Prior art keywords
- data
- regression model
- monitoring
- value
- data item
- Prior art date
- Legal status (The legal status is an assumption and is not a legal conclusion. Google has not performed a legal analysis and makes no representation as to the accuracy of the status listed.)
- Ceased
Links
Images


Classifications
-
- G—PHYSICS
- G06—COMPUTING OR CALCULATING; COUNTING
- G06F—ELECTRIC DIGITAL DATA PROCESSING
- G06F11/00—Error detection; Error correction; Monitoring
- G06F11/30—Monitoring
- G06F11/34—Recording or statistical evaluation of computer activity, e.g. of down time, of input/output operation ; Recording or statistical evaluation of user activity, e.g. usability assessment
- G06F11/3466—Performance evaluation by tracing or monitoring
- G06F11/3485—Performance evaluation by tracing or monitoring for I/O devices
-
- G—PHYSICS
- G06—COMPUTING OR CALCULATING; COUNTING
- G06N—COMPUTING ARRANGEMENTS BASED ON SPECIFIC COMPUTATIONAL MODELS
- G06N20/00—Machine learning
-
- G—PHYSICS
- G06—COMPUTING OR CALCULATING; COUNTING
- G06F—ELECTRIC DIGITAL DATA PROCESSING
- G06F11/00—Error detection; Error correction; Monitoring
- G06F11/30—Monitoring
- G06F11/34—Recording or statistical evaluation of computer activity, e.g. of down time, of input/output operation ; Recording or statistical evaluation of user activity, e.g. usability assessment
- G06F11/3452—Performance evaluation by statistical analysis
-
- G—PHYSICS
- G06—COMPUTING OR CALCULATING; COUNTING
- G06F—ELECTRIC DIGITAL DATA PROCESSING
- G06F11/00—Error detection; Error correction; Monitoring
- G06F11/30—Monitoring
- G06F11/34—Recording or statistical evaluation of computer activity, e.g. of down time, of input/output operation ; Recording or statistical evaluation of user activity, e.g. usability assessment
- G06F11/3409—Recording or statistical evaluation of computer activity, e.g. of down time, of input/output operation ; Recording or statistical evaluation of user activity, e.g. usability assessment for performance assessment
-
- G—PHYSICS
- G06—COMPUTING OR CALCULATING; COUNTING
- G06F—ELECTRIC DIGITAL DATA PROCESSING
- G06F11/00—Error detection; Error correction; Monitoring
- G06F11/30—Monitoring
- G06F11/34—Recording or statistical evaluation of computer activity, e.g. of down time, of input/output operation ; Recording or statistical evaluation of user activity, e.g. usability assessment
- G06F11/3447—Performance evaluation by modeling
-
- G—PHYSICS
- G06—COMPUTING OR CALCULATING; COUNTING
- G06F—ELECTRIC DIGITAL DATA PROCESSING
- G06F11/00—Error detection; Error correction; Monitoring
- G06F11/30—Monitoring
- G06F11/34—Recording or statistical evaluation of computer activity, e.g. of down time, of input/output operation ; Recording or statistical evaluation of user activity, e.g. usability assessment
- G06F11/3466—Performance evaluation by tracing or monitoring
- G06F11/3476—Data logging
-
- G—PHYSICS
- G06—COMPUTING OR CALCULATING; COUNTING
- G06F—ELECTRIC DIGITAL DATA PROCESSING
- G06F2201/00—Indexing scheme relating to error detection, to error correction, and to monitoring
- G06F2201/81—Threshold
-
- G—PHYSICS
- G06—COMPUTING OR CALCULATING; COUNTING
- G06F—ELECTRIC DIGITAL DATA PROCESSING
- G06F2201/00—Indexing scheme relating to error detection, to error correction, and to monitoring
- G06F2201/88—Monitoring involving counting
Definitions
- the present invention relates to a monitoring data analysis device, a monitoring data analysis method, and a monitoring data analysis program.
- Patent Document 1 discloses a technique related to a performance monitoring apparatus for a WWW site.
- some systems have a plurality of usage patterns, such as being frequently used by data retrieval such as browsing processing in the daytime and frequently used by data updating such as batch processing at night.
- the conventional performance management method when predicting the disk usage rate with respect to the number of operation requests such as reading and writing, the conventional performance management method generates a regression model using monitoring data in all usage patterns. Therefore, a large gap occurs between the actual value in each usage pattern and the predicted value based on the regression model, and the prediction error increases.
- the present invention has been made to solve the above-described problem, and even when the monitoring target system has a plurality of usage patterns, the monitoring data analysis apparatus and the monitoring data analysis that can reduce the prediction error It is an object to provide a method and a monitoring data analysis program.
- the monitoring data analysis apparatus of the present invention includes a data storage unit that stores log data including monitoring data in a monitoring target system that is a target of performance management, and a usage status of components of the monitoring target system included in the log data.
- a data classifying unit that classifies the log data into a plurality of groups based on characteristics of usage data to be shown; a regression model generating unit that generates a regression model by performing regression analysis of the log data for each group; Is provided.
- the monitoring data analysis method of the present invention includes a data accumulation step for accumulating log data including monitoring data in a monitoring target system that is a target of performance management, and a usage status of components of the monitoring target system included in the log data.
- the monitoring data analysis program of the present invention causes a computer to execute each step included in the monitoring data analysis method.
- the present invention it is possible to reduce the prediction error even when the monitoring target system has a plurality of usage patterns.
- a monitoring data analysis apparatus is an apparatus that analyzes monitoring data in a monitoring target system that is a target of performance management.
- the monitoring data analysis device physically includes, for example, a CPU (Central Processing Unit), a storage device, and an input / output interface.
- the storage device includes, for example, a ROM (Read Only Memory) and HDD (Hard Disk Drive) for storing programs and data processed by the CPU, and a RAM (Random Access Memory) mainly used as various work areas for control processing. ) Etc. are included. These elements are connected to each other via a bus.
- the CPU executes the program stored in the ROM and processes the message received via the input / output interface and the data expanded in the RAM, thereby realizing the functions of the respective units in the monitoring data analysis device described later. be able to.
- the monitoring data analysis device 1 functionally includes, for example, a data classification unit 11 and a regression model generation unit 12.
- the data classification unit 11 classifies the log data stored in the log data file 21 into groups for each usage pattern.
- the usage pattern for example, a data search type (reading type) or a data update type (writing type) is applicable.
- the log data is data in which monitoring data in the monitoring target system is recorded in time series.
- the data structure of the log data file 21 will be described with reference to FIG.
- the log data file 21 includes, for example, a time division item, a disk usage rate item, a request count item, a write count item, a read count item, and an average data length item as data items.
- the log data file 21 generates one record (hereinafter referred to as “log record”) for each time division item.
- the time classification item stores classification information for identifying the time zone to which each data of the log record belongs.
- the disk usage rate item stores the usage rate of a disk (for example, HDD) in the monitored system.
- the disk usage rate is used as the resource usage rate of the monitoring target system.
- the resource usage rate is not limited to the disk usage rate.
- data indicating the utilization status of the components of the monitoring target system can be used.
- a CPU utilization rate for example, a memory (for example, RAM) utilization rate, a network utilization rate, and the like are applicable.
- the number of requests field stores the number of requests received by the monitored system.
- the number of requests is not limited, and for example, the arrival rate of requests may be used.
- the write count item stores the number of times data has been written to the monitored system disk.
- the read count item stores the number of times data is read from the disk of the monitoring target system.
- the average data length item stores the average value of the data length of each request received in the target time zone in the target time zone.
- a known clustering method such as a shortest distance method, a longest distance method, a group average method, or a ward method can be used.
- the characteristic of the disk usage rate ⁇ with respect to the number of requests ⁇ is used as a characteristic for classification into groups.
- log data is placed on the coordinate plane shown in FIG. 3 in units of log records.
- the horizontal axis in FIG. 3 indicates the number of requests ⁇ , and the vertical axis indicates the disk usage rate ⁇ .
- the data arranged on the coordinate plane are sequentially collected based on the characteristics of the disk usage rate ⁇ with respect to the number of requests ⁇ .
- it is finally classified into a first group G1 and a second group G2 shown in FIG.
- log data belonging to the data update type usage pattern is classified into the first group G1
- log data belonging to the data search type usage pattern is classified into the second group G2.
- the regression model generation unit 12 shown in FIG. 1 performs a regression analysis of log data for each classified group to generate a regression model.
- a method for generating a regression model for example, the method described in Reference Document 1 below can be used.
- the regression model generation unit 12 performs a regression analysis using the disk usage rate ⁇ as an objective variable for regression analysis and the number of requests ⁇ as an explanatory variable for regression analysis.
- a regression model represented by the following formula (1) is generated as the regression model M1 of log data belonging to the first group G1, and the log belonging to the second group G2 As the data regression model M2, a regression model represented by the following equation (2) is generated.
- the regression model generation unit 12 stores the generated regression model M1 and regression model M2 in the regression model file 22.
- the data classification unit 11 clusters the log data stored in the log data file 21 and classifies the log data into a plurality of groups (step S101).
- the regression model generation unit 12 performs a regression analysis of the log data for each classified group to generate a regression model (step S102).
- the generated regression model can be used, for example, when calculating a resource usage rate such as a disk usage rate or determining an abnormality of the monitoring target system, as will be described later.
- log data can be classified into groups according to usage patterns such as a data update type and a data search type, and for each classified group.
- a regression model can be generated.
- the resource usage rate such as the disk usage rate is greatly different for each usage pattern, it is possible to generate regression models corresponding to the usage patterns. Therefore, even when the monitoring target system has a plurality of usage patterns, errors in prediction using the regression model can be reduced.
- the monitoring data analysis apparatus of the second embodiment includes a feature data item extraction unit 13, a regression model, in addition to the various functions of the monitoring data analysis apparatus (see FIG. 1) of the first embodiment described above.
- the monitoring data analysis apparatus of the first embodiment is different in that it further includes a recalculation unit 14, a performance value calculation unit 15, and an abnormality determination unit 16. Since other configurations are the same as those of the monitoring data analysis apparatus of the first embodiment, the same reference numerals are given to the respective components, and the description thereof is omitted. In the following, differences from the first embodiment will be mainly described.
- the feature data item extraction unit 13 extracts a data item related to the explanatory variable (number of requests ⁇ ) of the regression model as a feature data item from the data items included in the log data.
- the feature data item extraction unit 13 calculates, for each group classified by the data classification unit 11, the degree of dependence of each data item on the explanatory variable for each data item included in the log data forming the group.
- the feature data item extraction unit 13 extracts data items whose dependency is higher than a predetermined threshold as feature data items.
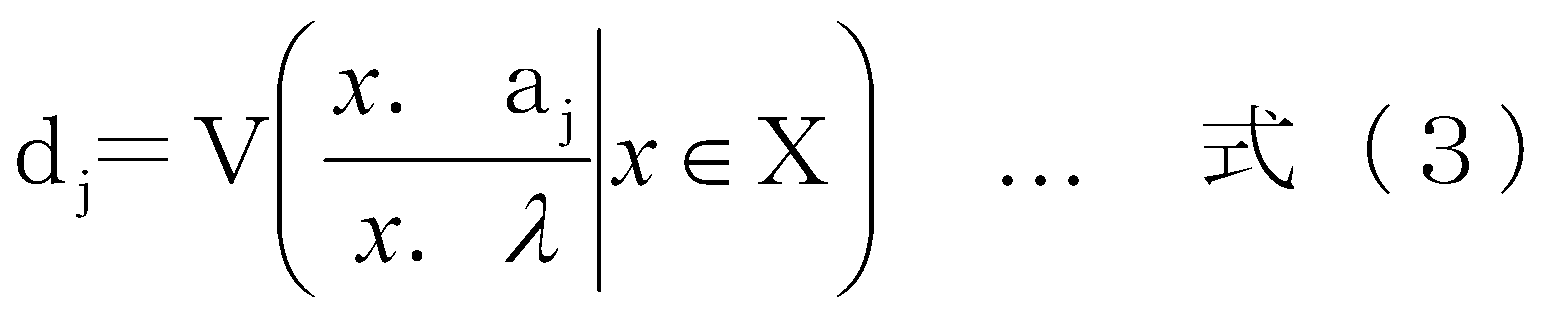
- Feature data item extraction section 13 as shown in the following formula (3), and the entire group X which is classified by the data classification section 11 to a subject, the log data for each data item a j, of the data item a j Value x.
- a j is the value of the explanatory variable of the regression model (number of requests) x.
- a variance d j of the value divided by ⁇ (hereinafter referred to as “variance d j in the entire group”) is calculated.
- the feature data item extraction unit 13 targets each group X i classified by the data classification unit 11 for each data item a j of log data belonging to each group X i. , the data item a j of the value x.
- a j is the value of the explanatory variable of the regression model (number of requests) x.
- the variance d ji of the value divided by ⁇ is calculated for each group X i .
- Feature data item extraction section 13 as shown in the following formula (5), the dispersion d ji of each data item a j calculated for each group X i by aggregated in all groups X, for each group X i A total d j ′ of the variance d ji in the entire group (hereinafter referred to as “total variance d j ′ in each group”) is calculated.
- Feature data item extraction section 13 the 'case where the value obtained by dividing the dispersion d j of the entire group is smaller than the predetermined threshold value k (d j' sum d j of the dispersion / d j ⁇ k) in each group,
- the data item a j that satisfies the condition is determined to have a high dependency on the explanatory variable, and the data item a j is extracted as a feature data item.
- FIG. 6 shows a bar graph representing the value of (d j ′ / d j ) for each data item a j .
- each data item a j is arranged on the horizontal axis, and the value of (d j ′ / d j ) is shown on the vertical axis.
- the threshold value k is set to 0.3.
- the data items whose (d j ′ / d j ) value is smaller than 0.3 are “write count item” and “read count item”. Therefore, the “write count item” and the “read count item” are extracted as feature data items.
- the regression model recalculation unit 14 shown in FIG. 5 supervises a plurality of regression models generated by the regression model generation unit 12 with reference to the feature data items extracted by the feature data item extraction unit 13. Calculate (re-calculate) a regression model to be used for performance inspection of the target system.
- the known data item can be used instead of referring to the feature data item extracted by the feature data item extraction unit 13.
- the “write count item” and the “read count item” are characteristic data items.
- the regression model recalculation unit 14 calculates the ratio of the value of each feature data item with respect to the explanatory variable for each group, and synthesizes the regression model of each group using the calculated ratio.
- a regression model for each feature data item which is a regression model for the data item, is calculated.
- the regression model recalculation unit 14 uses each calculated feature data item regression model for each feature data included in log data (hereinafter referred to as “test target log data”) to be subjected to performance inspection in the monitoring target system.
- a regression model is calculated by combining them according to the appearance rate of the item values.
- the characteristic data item regression model is calculated as follows, for example.
- the regression model recalculation unit 14 when the number of classified groups is m and the number of extracted feature data items is n, the regression model recalculation unit 14 generates a matrix A having m rows and n columns. In each element (i, j) of the matrix A, an average value in the group X i of values obtained by dividing the value of the feature data item a j by the explanatory variable (number of requests ⁇ ) is arranged.
- the classified groups are two groups, “group 1” and “group 2”, and the extracted feature data items are “write number item” and “read number item”.
- the matrix A is a 2 ⁇ 2 matrix.
- Each data column shown in FIG. 7 stores an average value in each group of values obtained by dividing the value of each feature data item by the number of requests ⁇ . That is, the value of each data column becomes each element (i, j) of the matrix A.
- the matrix A in this case is expressed as follows.
- the regression model recalculation unit 14 calculates a pseudo inverse matrix A + of the matrix A.
- a method for calculating the pseudo inverse matrix for example, the method described in Reference Document 2 below can be used.
- the regression model recalculation unit 14 sets the regression model h aj ( ⁇ ) when the value of a certain feature data item a j is “1” and the value of another feature data item is “0” as follows:
- F i ( ⁇ ) in the following equation (6) is a regression model of the group X i generated by the regression model generation unit 12.
- the regression model recalculation unit 14 calculates the average value b j in the inspection target log data of the value obtained by dividing the value of each feature data item a j included in the inspection target log data by the explanatory variable (number of requests ⁇ ). calculate.
- the regression model recalculation unit 14 generates a regression model f ( ⁇ ) using the following equation (7). That is, the regression model used when performing a performance test based on the inspection target log data is recalculated using a plurality of existing regression models.
- the inspection target log data is the log data shown in FIG.
- the 5 uses the regression model f ( ⁇ ) recalculated by the regression model recalculation unit 14 to calculate the disk usage rate ⁇ corresponding to the number of requests ⁇ . Thereby, the performance value based on the inspection target log data can be calculated.
- the abnormality determination unit 16 shown in FIG. 5 uses a value f ( ⁇ ′) obtained by substituting the value ⁇ ′ of the number-of-requests item into the regression model f ( ⁇ ) for each log record of the inspection target log data, and disk usage. It is determined whether or not the difference (
- the presence or absence of an abnormality in the monitored system can be determined as follows.
- the abnormality determination unit 16 obtains the variance V ( ⁇ ) with respect to the objective variable (disk utilization rate ⁇ ) of the regression model f ( ⁇ ) recalculated by the regression model recalculation unit 14, and calculates the standard deviation ( ⁇ V). calculate.
- the abnormality determination unit 16 calculates
- the value of the threshold value a can be set arbitrarily. In other words, the abnormality determination unit 16 determines the presence or absence of abnormality based on how far the value of
- the variance V ( ⁇ ) can be obtained, for example, by calculating the following formula (9) derived from the following formula (8).
- the regression model f ( ⁇ ) of the following equation (8) can be derived from the above equations (6) and (7), and the variance V ( ⁇ ) of the following equation (9) can be derived from the following equation (8). Can be derived.
- V ( ⁇ j ) in the above equation (9) is a variance related to the objective variable (disk utilization rate ⁇ ) of the regression model calculated for each group X i .
- ⁇ j is a random variable indicating the distribution of the objective variable in the group X i .
- the operation of the monitoring data analyzer in the second embodiment will be described.
- the operation when the log data is classified into a plurality of groups and the regression model is generated for each group is the same as the operation of the monitoring data analyzer in the first embodiment described above (see FIG. 4). The description is omitted.
- the feature data item extraction unit 13 executes a feature data item extraction process described later (step S201).
- the regression model recalculation unit 14 executes a regression model recalculation process to be described later (step S202).
- the performance value calculation unit 15 calculates the disk usage rate corresponding to the assumed number of requests using the regression model f ( ⁇ ) recalculated by the regression model recalculation unit 14 (step S203).
- the assumed number of requests can be arbitrarily set by the administrator in the monitoring data analyzer.
- step S201 With reference to FIG. 10, the feature data item extraction process executed in step S201 will be described.
- step S301 to step S304 described below is executed in a loop for each data item a j in order for all the data items a j included in the log data.
- the feature data item extraction unit 13 uses the above equation (3) and sets the value of the target data item a j as the number of requests ⁇ for the log data of all the groups X classified by the data classification unit 11. calculating the variance d j of the division value (step S301).
- the feature data item extraction unit 13 using the above equation (4), the log data of each group X i in the subject, the dispersion d ji of a value obtained by dividing the value of the target data item a j in the request number ⁇ Is calculated for each group X i , and the total d j ′ for the entire group of variance d ji is calculated using the above equation (5) (step S302).
- the feature data item extraction unit 13 determines whether or not a value obtained by dividing the total d j ′ calculated in step S302 by the variance d j calculated in step S301 is smaller than a threshold value k ( Step S303). If this determination is NO (step S303; NO), the process proceeds to the subsequent stage of step S304.
- step S303 determines that the value of (d j ′ / d j ) is smaller than the threshold value k (step S303; YES).
- step S202 the regression model recalculation process executed in step S202 will be described.
- the regression model recalculation unit 14 calculates the average value in the group X i of the value obtained by dividing the value of each feature data item a j extracted in step S201 by the explanatory variable (number of requests ⁇ ) as a matrix element. And a matrix A having the number of groups of m rows ⁇ the number of feature data items of n columns is generated (step S401).
- the regression model recalculation unit 14 calculates a pseudo inverse matrix A + of the matrix A (step S402).
- the regression model recalculation unit 14 calculates a regression model h aj ( ⁇ ) for each feature data item using the above equation (6) (step S403).
- the regression model recalculation unit 14 calculates an average value b j in the inspection target log data of a value obtained by dividing the value of each feature data item a j included in the inspection target log data by the number of requests ⁇ (step S1). S404).
- the regression model recalculation unit 14 substitutes the characteristic data item-specific regression model h aj ( ⁇ ) calculated in step S403 and the average value b j calculated in step S404 into the equation (7).
- the regression model f ( ⁇ ) for the inspection target log data is generated (recalculated) (step S405).
- the abnormality determination process is executed after step S202 of FIG. 9 described above is executed.
- the abnormality determination process may be executed in parallel with step S203 of FIG. 9, or may be executed before or after step S203.
- the abnormality determining unit 16 refers to the recalculated regression model f ( ⁇ ) recalculated by the regression model recalculating unit 14, and calculates the standard deviation ( ⁇ V) regarding the objective variable (disk utilization rate ⁇ ). (Step S501).
- step S502 to step S503 described below is executed by sequentially looping for each log record for all log records included in the inspection target log data.
- the abnormality determination unit 16 substitutes the value ⁇ ′ of the request count item of the inspection target log data into the recalculation regression model f ( ⁇ ) and the value f ( ⁇ ′) of the inspection target log data.
- a difference from the value ⁇ ′ of the disk usage rate item is obtained, and a value obtained by dividing the difference by the standard deviation ( ⁇ V) calculated in step S501 is calculated (step S502).
- the abnormality determination unit 16 determines whether or not the value calculated in step S502 is greater than the threshold value a (step S503). If this determination is NO (step S503; NO), the process proceeds to the subsequent stage.
- step S503 when it is determined in step S503 that the value calculated in step S502 is greater than the threshold value a (step S503; YES), the abnormality determination unit 16 determines that there is an abnormality in the monitored system. Then, the administrator is notified of the abnormality (step S504).
- a method for notifying an administrator of an abnormality for example, a method for outputting a message to that effect, a method for outputting a warning sound, or the like is applicable.
- a new regression model can be generated (recalculated) by synthesizing a plurality of existing regression models.
- a regression model adapted to the assumed usage pattern can be generated, and the resource usage rate such as the disk usage rate can be predicted using this regression model. Therefore, even when the resource usage rate such as the disk usage rate varies greatly for each usage pattern, it is possible to improve the prediction accuracy of the resource usage rate, and take appropriate measures according to this resource usage rate. be able to.
- the abnormality of the monitored system can be found based on the difference from the regression model adapted to the assumed usage pattern, it is possible to improve the accuracy of finding the abnormality.
- the feature data item extraction unit 13 in the second embodiment described above extracts feature data items by using the dependency of each data item on the explanatory variable. It is not limited to. For example, the following extraction method can be used.
- the feature data item extraction unit 13 For each group X i classified by the data classification unit 11, the feature data item extraction unit 13 sets each data item a j and explanatory variables (number of requests) for each data item a j included in the log data forming the group. The average value of the correlation coefficient with ⁇ ) in the group X i is calculated. The feature data item extraction unit 13 extracts a data item a j whose calculated average value is equal to or greater than a predetermined threshold k ′ as a feature data item.
- the average value of the correlation coefficient between each data item a j and the explanatory variable can be calculated by the following procedure, for example.
- the feature data item extraction unit 13 calculates the correlation coefficient r ji between each data item a j and the explanatory variable (number of requests ⁇ ) for each group X i using the following equation (10). .
- a j is the value of the data item a j of the k-th log record belonging to the group X i
- ⁇ is the value of the request number item of the k-th log record belonging to the group X i
- m is the number of groups.
- the feature data item extraction unit 13 divides the correlation coefficient r ji for each group X i by all the groups X by the number of groups m, so that each data item a j and the explanatory variable are divided.
- the average value r j of the correlation coefficient is calculated.
- the feature data item extraction unit 13 extracts a data item a j in which
- the feature data item is extracted by the feature data item extraction unit 13, but the present invention is not limited to this.
- the administrator may set the feature data item in advance in the memory.
- the feature data item extraction unit 13 can be omitted.
- the regression model recalculation unit 14 may acquire the value of the feature data item with reference to the memory.
- the regression model recalculation unit 14 in the second embodiment described above synthesizes a plurality of regression models generated by the regression model generation unit 12 with reference to the feature data items, so that the performance value of the monitored system is obtained.
- the regression model used at the time of calculation and abnormality determination is calculated (recalculated).
- the regression model recalculation unit 14 can be omitted. This is a case where the inspection target log data used when calculating the performance value or determining the abnormality matches or approximates any of the plurality of regression models generated by the regression model generation unit 12.
- a business trip settlement system a business trip settlement from a user is accepted interactively during the daytime.
- settlement processing is performed by batch processing at night.
- separate regression models are generated for daytime and nighttime. Accordingly, either one of the regression models may be used according to the generation time of the inspection target log data used when calculating the performance value or determining the abnormality.
- the present invention is implemented by a single monitoring data analysis apparatus, but the present invention can also be implemented by a plurality of apparatuses.
- the functions of the monitoring data analysis device in each of the above-described embodiments are distributed to a plurality of devices, and the plurality of device groups function in the same manner as the monitoring data analysis device in each of the above-described embodiments. Good.
- a data storage unit that stores log data including monitoring data in a monitoring target system that is a target of performance management, and usage status data that indicates the usage status of the components of the monitoring target system included in the log data
- a data classification unit that classifies the log data into a plurality of groups based on characteristics, and a regression model generation unit that generates a regression model by performing regression analysis of the log data for each group.
- Monitoring data analysis device A data storage unit that stores log data including monitoring data in a monitoring target system that is a target of performance management, and usage status data that indicates the usage status of the components of the monitoring target system included in the log data
- a data classification unit that classifies the log data into a plurality of groups based on characteristics
- a regression model generation unit that generates a regression model by performing regression analysis of the log data for each group. Monitoring data analysis device.
- the characteristic data item extraction part which extracts the said data item relevant to the explanatory variable of the said regression model as a characteristic data item from the data items contained in the said log data is further provided, It is characterized by the above-mentioned.
- the monitoring data analyzer according to appendix 1.
- the said feature data extraction part calculates the dependence to the said explanatory variable in each data item of the data which forms the said group for every said group, and the said calculated said dependence is higher than a predetermined threshold value
- the monitoring data analysis apparatus according to supplementary note 2, wherein a data item is extracted as the characteristic data item.
- the said feature data extraction part calculates the correlation coefficient between the said explanatory variables in each data item of the data which forms the said group for every said group, and each said calculated correlation coefficient of each said correlation coefficient
- the monitoring data analysis apparatus according to supplementary note 2, wherein a data item having an average value larger than a predetermined threshold is extracted as the feature data item.
- the performance value calculation part which calculates the performance value which is the objective variable of the said regression model using the regression model generated by the regression model generation part is further provided,
- the monitoring data analyzer according to any one of appendices 1 to 4, characterized in that:
- the value of the data item corresponding to the explanatory variable of the regression model included in the inspection target log data which is the log data to be subjected to the performance inspection is substituted into the regression model generated by the regression model generation unit.
- An abnormality determination unit that determines the presence or absence of abnormality in the monitoring target system based on the difference between the value obtained and the value of the data item corresponding to the objective variable of the regression model included in the inspection target log data,
- the monitoring data analyzer according to any one of appendices 1 to 4, characterized in that:
- the ratio of the value of each said characteristic data item with respect to the said explanatory variable is calculated for every said group,
- the said regression data of each said group is synthesize
- the feature data item regression model that is the regression model for the item is calculated, and the calculated feature data item regression model is included in the inspection target log data that is the log data to be subjected to performance inspection.
- the monitoring data analysis according to any one of appendices 2 to 4, further comprising: a regression model recalculation unit that recalculates the regression model by synthesizing according to the appearance rate of the value of the data item. apparatus.
- the performance value calculation part which calculates the performance value which is the objective variable of the said regression model is further provided using the said regression model recalculated by the said regression model recalculation part, The additional remark characterized by the above-mentioned 7.
- the monitoring data analysis device according to 7.
- the apparatus further comprises an abnormality determination unit that determines whether there is an abnormality in the monitoring target system based on a difference from a value of a data item corresponding to the objective variable of the regression model included in the target log data.
- the monitoring data analyzer according to appendix 7.
- Monitoring data analysis method
- the monitoring data analysis apparatus, the monitoring data analysis method, and the monitoring data analysis program according to the present invention are suitable for reducing the prediction error even when the monitoring target system has a plurality of usage patterns.
Landscapes
- Engineering & Computer Science (AREA)
- Theoretical Computer Science (AREA)
- General Engineering & Computer Science (AREA)
- Physics & Mathematics (AREA)
- General Physics & Mathematics (AREA)
- Quality & Reliability (AREA)
- Computer Hardware Design (AREA)
- Life Sciences & Earth Sciences (AREA)
- Software Systems (AREA)
- Bioinformatics & Cheminformatics (AREA)
- Probability & Statistics with Applications (AREA)
- Evolutionary Biology (AREA)
- Bioinformatics & Computational Biology (AREA)
- Data Mining & Analysis (AREA)
- Mathematical Physics (AREA)
- Artificial Intelligence (AREA)
- Computing Systems (AREA)
- Evolutionary Computation (AREA)
- Debugging And Monitoring (AREA)
- Medical Informatics (AREA)
- Computer Vision & Pattern Recognition (AREA)
- Health & Medical Sciences (AREA)
- Biomedical Technology (AREA)
- Biophysics (AREA)
- Computational Linguistics (AREA)
- General Health & Medical Sciences (AREA)
- Molecular Biology (AREA)
Abstract
Description
本発明は、監視データ分析装置、監視データ分析方法および監視データ分析プログラムに関する。 The present invention relates to a monitoring data analysis device, a monitoring data analysis method, and a monitoring data analysis program.
システムの性能管理を行う場合に、監視対象システムにおける過去の監視データを回帰分析して回帰モデルを求め、この回帰モデルを用いてシステムの性能値を予測する技術がある。例えば、下記特許文献1には、WWWサイトの性能監視装置に関する技術が開示されている。
When performing system performance management, there is a technique for obtaining a regression model by performing regression analysis on past monitoring data in a monitored system and predicting the performance value of the system using this regression model. For example,
ところで、システムの中には、例えば昼間は閲覧処理等のデータ検索による利用が多く、夜間はバッチ処理等のデータ更新による利用が多いなどのように、複数の利用パターンを有するものがある。このようなシステムにおいて、読出しや書込み等の操作要求数に対するディスクの利用率を予測する場合、従来の性能管理手法では、全ての利用パターンにおける監視データを用いて回帰モデルを生成することになる。したがって、各利用パターンにおける実際の値と回帰モデルによる予測値との間に大きな隔たりが生じ、予測誤差が大きくなってしまう。 By the way, some systems have a plurality of usage patterns, such as being frequently used by data retrieval such as browsing processing in the daytime and frequently used by data updating such as batch processing at night. In such a system, when predicting the disk usage rate with respect to the number of operation requests such as reading and writing, the conventional performance management method generates a regression model using monitoring data in all usage patterns. Therefore, a large gap occurs between the actual value in each usage pattern and the predicted value based on the regression model, and the prediction error increases.
本発明は、上述した課題を解決するためになされたものであり、監視対象システムが複数の利用パターンを有する場合であっても、予測誤差を低減することができる監視データ分析装置、監視データ分析方法および監視データ分析プログラムを提供することを目的とする。 The present invention has been made to solve the above-described problem, and even when the monitoring target system has a plurality of usage patterns, the monitoring data analysis apparatus and the monitoring data analysis that can reduce the prediction error It is an object to provide a method and a monitoring data analysis program.
本発明の監視データ分析装置は、性能管理の対象となる監視対象システムにおける監視データを含むログデータを蓄積するデータ蓄積部と、前記ログデータに含まれる前記監視対象システムの構成要素の利用状況を示す利用状況データの特性に基づいて、前記ログデータを複数のグループに分類するデータ分類部と、前記グループごとに前記ログデータの回帰分析を実行して回帰モデルを生成する回帰モデル生成部と、を備える。 The monitoring data analysis apparatus of the present invention includes a data storage unit that stores log data including monitoring data in a monitoring target system that is a target of performance management, and a usage status of components of the monitoring target system included in the log data. A data classifying unit that classifies the log data into a plurality of groups based on characteristics of usage data to be shown; a regression model generating unit that generates a regression model by performing regression analysis of the log data for each group; Is provided.
本発明の監視データ分析方法は、性能管理の対象となる監視対象システムにおける監視データを含むログデータを蓄積するデータ蓄積ステップと、前記ログデータに含まれる前記監視対象システムの構成要素の利用状況を示す利用状況データの特性に基づいて、前記ログデータを複数のグループに分類するデータ分類ステップと、前記グループごとに前記ログデータの回帰分析を実行して回帰モデルを生成する回帰モデル生成ステップと、を含む。 The monitoring data analysis method of the present invention includes a data accumulation step for accumulating log data including monitoring data in a monitoring target system that is a target of performance management, and a usage status of components of the monitoring target system included in the log data. A data classification step of classifying the log data into a plurality of groups based on characteristics of usage data to be shown; a regression model generation step of generating a regression model by performing a regression analysis of the log data for each group; including.
本発明の監視データ分析プログラムは、上記監視データ分析方法に含まれる各ステップをコンピュータに実行させる。 The monitoring data analysis program of the present invention causes a computer to execute each step included in the monitoring data analysis method.
本発明によれば、監視対象システムが複数の利用パターンを有する場合であっても、予測誤差を低減することができる。 According to the present invention, it is possible to reduce the prediction error even when the monitoring target system has a plurality of usage patterns.
以下、添付図面を参照して、本発明に係る監視データ分析装置、監視データ分析方法および監視データ分析プログラムの好適な実施形態について説明する。本発明に係る監視データ分析装置は、性能管理の対象となる監視対象システムにおける監視データを分析する装置である。 Hereinafter, preferred embodiments of a monitoring data analysis apparatus, a monitoring data analysis method, and a monitoring data analysis program according to the present invention will be described with reference to the accompanying drawings. A monitoring data analysis apparatus according to the present invention is an apparatus that analyzes monitoring data in a monitoring target system that is a target of performance management.
[第1実施形態]
まず、第1実施形態における監視データ分析装置の構成について説明する。
[First embodiment]
First, the configuration of the monitoring data analysis apparatus in the first embodiment will be described.
監視データ分析装置は、物理的には、例えば、CPU(Central Processing Unit)と、記憶装置と、入出力インターフェースとを含んで構成される。記憶装置には、例えば、CPUで処理されるプログラムやデータを記憶するROM(Read Only Memory)やHDD(Hard Disk Drive)、主として制御処理のための各種作業領域として使用されるRAM(Random Access Memory)等の要素が含まれる。これらの要素は、互いにバスを介して接続されている。CPUが、ROMに記憶されたプログラムを実行し、入出力インターフェースを介して受信されるメッセージや、RAMに展開されるデータを処理することで、後述する監視データ分析装置における各部の機能を実現することができる。 The monitoring data analysis device physically includes, for example, a CPU (Central Processing Unit), a storage device, and an input / output interface. The storage device includes, for example, a ROM (Read Only Memory) and HDD (Hard Disk Drive) for storing programs and data processed by the CPU, and a RAM (Random Access Memory) mainly used as various work areas for control processing. ) Etc. are included. These elements are connected to each other via a bus. The CPU executes the program stored in the ROM and processes the message received via the input / output interface and the data expanded in the RAM, thereby realizing the functions of the respective units in the monitoring data analysis device described later. be able to.
図1に示すように、監視データ分析装置1は、機能的には、例えば、データ分類部11と、回帰モデル生成部12とを有する。
As shown in FIG. 1, the monitoring
データ分類部11は、ログデータファイル21に格納されたログデータを、利用パターンごとのグループに分類する。利用パターンとしては、例えばデータ検索型(読出し型)や、データ更新型(書込み型)が該当する。ログデータは、監視対象システムにおける監視データを時系列に記録したデータである。
The
図2を参照して、ログデータファイル21のデータ構成について説明する。ログデータファイル21は、データ項目として、例えば、時刻区分項目、ディスク利用率項目、リクエスト数項目、書込回数項目、読出回数項目および平均データ長項目を有する。ログデータファイル21は、時刻区分項目ごとに一件のレコード(以下、「ログレコード」という。)を生成する。
The data structure of the
時刻区分項目は、ログレコードの各データが属する時間帯を識別する区分情報を格納する。ディスク利用率項目は、監視対象システムにおけるディスク(例えばHDD)の利用率を格納する。本実施形態では、監視対象システムの資源利用率として、ディスク利用率を用いて説明するが、資源利用率をディスク利用率に限定するものではない。資源利用率には、監視対象システムの構成要素の利用状況を示すデータを用いることができる。具体的には、上記ディスク利用率の他に、例えば、CPUの利用率や、メモリ(例えばRAM)の利用率、ネットワークの利用率等が該当する。 The time classification item stores classification information for identifying the time zone to which each data of the log record belongs. The disk usage rate item stores the usage rate of a disk (for example, HDD) in the monitored system. In this embodiment, the disk usage rate is used as the resource usage rate of the monitoring target system. However, the resource usage rate is not limited to the disk usage rate. For the resource utilization rate, data indicating the utilization status of the components of the monitoring target system can be used. Specifically, in addition to the disk utilization rate, for example, a CPU utilization rate, a memory (for example, RAM) utilization rate, a network utilization rate, and the like are applicable.
リクエスト数項目は、監視対象システムが受信したリクエストの件数を格納する。なお、リクエストの件数であることには限定されず、例えば、リクエストの到着率を用いてもよい。 The number of requests field stores the number of requests received by the monitored system. The number of requests is not limited, and for example, the arrival rate of requests may be used.
書込回数項目は、監視対象システムのディスクにデータを書き込んだ回数を格納する。読出回数項目は、監視対象システムのディスクからデータを読み出した回数を格納する。平均データ長項目は、対象時間帯に受信した各リクエストのデータ長の対象時間帯での平均値を格納する。 The write count item stores the number of times data has been written to the monitored system disk. The read count item stores the number of times data is read from the disk of the monitoring target system. The average data length item stores the average value of the data length of each request received in the target time zone in the target time zone.
利用パターンごとのグループに分類する手法として、例えば、最短距離法、最長距離法、群平均法、ウォード方等の公知のクラスタリング手法を用いることができる。 As a method for classifying into groups for each usage pattern, for example, a known clustering method such as a shortest distance method, a longest distance method, a group average method, or a ward method can be used.
クラスタリング手法を用いてログデータを複数のグループに分類する際の手順の一例を、以下に述べる。本実施形態では、グループに分類する際の特性として、リクエスト数λに対するディスク利用率ρの特性を用いる。 An example of the procedure for classifying log data into multiple groups using the clustering method is described below. In the present embodiment, the characteristic of the disk usage rate ρ with respect to the number of requests λ is used as a characteristic for classification into groups.
最初に、ログデータをログレコード単位に、図3に示す座標平面上に配置する。図3の横軸はリクエスト数λを示し、縦軸はディスク利用率ρを示す。 First, log data is placed on the coordinate plane shown in FIG. 3 in units of log records. The horizontal axis in FIG. 3 indicates the number of requests λ, and the vertical axis indicates the disk usage rate ρ.
続いて、上記クラスタリング手法を用い、リクエスト数λに対するディスク利用率ρの特性に基づいて、座標平面上に配置した各データを順次まとめていく。ここでは、最終的に、図3に示す第1グループG1と第2グループG2とに分類される。この場合、第1グループG1には、データ更新型の利用パターンに属するログデータが分類され、第2グループG2には、データ検索型の利用パターンに属するログデータが分類される。 Subsequently, using the above clustering method, the data arranged on the coordinate plane are sequentially collected based on the characteristics of the disk usage rate ρ with respect to the number of requests λ. Here, it is finally classified into a first group G1 and a second group G2 shown in FIG. In this case, log data belonging to the data update type usage pattern is classified into the first group G1, and log data belonging to the data search type usage pattern is classified into the second group G2.
図1に示す回帰モデル生成部12は、分類されたグループごとにログデータの回帰分析を実行し、回帰モデルを生成する。回帰モデルを生成する手法としては、例えば、下記参考文献1に記載されている手法を用いることができる。
The regression
[参考文献1]
長畑秀和著、「多変量解析へのステップ」、2章回帰分析、共立出版
[Reference 1]
Hidekazu Nagahata, “Steps to Multivariate Analysis”,
具体的に、回帰モデル生成部12は、例えば、回帰分析の目的変数としてディスク利用率ρを用い、回帰分析の説明変数としてリクエスト数λを用いて回帰分析を行う。例えば、図3に示すログデータを回帰分析した場合に、第1グループG1に属するログデータの回帰モデルM1として下記式(1)で表される回帰モデルが生成され、第2グループG2に属するログデータの回帰モデルM2として、下記式(2)で表される回帰モデルが生成される。
Specifically, for example, the regression
回帰モデルM1:f1(λ)=ρ=0.0041λ+0.0951 … 式(1)
回帰モデルM2:f2(λ)=ρ=0.0019λ+0.1188 … 式(2)
Regression model M1: f 1 (λ) = ρ = 0.0041λ + 0.0951 (1)
Regression model M2: f 2 (λ) = ρ = 0.0001λ + 0.1188 Equation (2)
回帰モデル生成部12は、生成した回帰モデルM1および回帰モデルM2を回帰モデルファイル22に格納する。
The regression
次に、図4を参照して、第1実施形態における監視データ分析装置の動作について説明する。 Next, the operation of the monitoring data analysis apparatus in the first embodiment will be described with reference to FIG.
最初に、データ分類部11は、ログデータファイル21に格納されたログデータをクラスタリングし、複数のグループに分類する(ステップS101)。
First, the
続いて、回帰モデル生成部12は、分類されたグループごとにログデータの回帰分析を実行し、回帰モデルを生成する(ステップS102)。
Subsequently, the regression
なお、生成した回帰モデルは、後述するように、例えば、ディスク利用率等の資源利用率を算出する際や、監視対象システムの異常を判定する際等に用いることができる。 Note that the generated regression model can be used, for example, when calculating a resource usage rate such as a disk usage rate or determining an abnormality of the monitoring target system, as will be described later.
上述したように、第1実施形態における監視データ分析装置1によれば、ログデータを、データ更新型やデータ検索型等の利用パターンに応じたグループに分類することができ、分類したグループごとに回帰モデルを生成することができる。これにより、ディスク利用率等の資源利用率が利用パターンごとに大きく相違する場合であっても、それぞれの利用パターンに応じた回帰モデルをそれぞれ生成することが可能となる。それゆえに、監視対象システムが複数の利用パターンを有する場合であっても、回帰モデルを用いて予測する際の誤差を低減することができる。
As described above, according to the monitoring
[第2実施形態]
本発明の第2実施形態について説明する。まず、第2実施形態における監視データ分析装置の構成について説明する。
[Second Embodiment]
A second embodiment of the present invention will be described. First, the configuration of the monitoring data analyzer in the second embodiment will be described.
図5に示すように、第2実施形態の監視データ分析装置は、上述した第1実施形態の監視データ分析装置(図1参照)が有する各種機能に加え、特徴データ項目抽出部13、回帰モデル再計算部14、性能値算出部15、および異常判定部16をさらに有する点で第1実施形態の監視データ分析装置と異なる。それ以外の構成については、第1実施形態の監視データ分析装置と同様であるため、各構成要素には同一の符合を付し、その説明は省略する。以下においては、主に第1実施形態との相違点について説明する。
As shown in FIG. 5, the monitoring data analysis apparatus of the second embodiment includes a feature data
特徴データ項目抽出部13は、ログデータに含まれるデータ項目の中から、回帰モデルの説明変数(リクエスト数λ)と関連があるデータ項目を、特徴データ項目として抽出する。
The feature data
特徴データ項目抽出部13は、データ分類部11により分類されたグループごとに、そのグループを形成するログデータに含まれる各データ項目について、各データ項目の説明変数への依存度を算出する。特徴データ項目抽出部13は、上記依存度が所定閾値よりも高いデータ項目を、特徴データ項目として抽出する。
The feature data
各データ項目の説明変数への依存度は、例えば、以下のように算出することができる。 Dependency of each data item on explanatory variables can be calculated as follows, for example.
特徴データ項目抽出部13は、下記式(3)に示すように、データ分類部11により分類された全グループXを対象にして、ログデータのデータ項目ajごとに、そのデータ項目ajの値x.ajを回帰モデルの説明変数の値(リクエスト数)x.λで除算した値の分散dj(以下、「グループ全体での分散dj」という。)を算出する。
特徴データ項目抽出部13は、下記式(4)に示すように、データ分類部11によって分類された各グループXiを対象にして、各グループXiに属するログデータのデータ項目ajごとに、データ項目ajの値x.ajを回帰モデルの説明変数の値(リクエスト数)x.λで除算した値の分散djiを、グループXiごとに算出する。

特徴データ項目抽出部13は、下記式(5)に示すように、グループXiごとに算出した各データ項目ajの分散djiを全グループXで集計することで、各グループXiでの分散djiのグループ全体における合計dj’(以下、「各グループでの分散の総和dj’」という。)を算出する。

特徴データ項目抽出部13は、各グループでの分散の総和dj’をグループ全体での分散djで除算した値が所定閾値kよりも小さい場合(dj’/dj < k)に、その条件を満たすデータ項目ajは説明変数への依存度が高いと判定し、そのデータ項目ajを特徴データ項目として抽出する。
Feature data
図6に、データ項目aj別に(dj’/dj)の値を棒グラフで表した図を示す。図6では、各データ項目ajを横軸に配置し、(dj’/dj)の値を縦軸に示す。また、閾値kを0.3に設定している。この場合に、(dj’/dj)の値が0.3よりも小さいデータ項目は、“書込回数項目”と“読出回数項目”とである。したがって、“書込回数項目”と“読出回数項目”とが、特徴データ項目として抽出される。 FIG. 6 shows a bar graph representing the value of (d j ′ / d j ) for each data item a j . In FIG. 6, each data item a j is arranged on the horizontal axis, and the value of (d j ′ / d j ) is shown on the vertical axis. The threshold value k is set to 0.3. In this case, the data items whose (d j ′ / d j ) value is smaller than 0.3 are “write count item” and “read count item”. Therefore, the “write count item” and the “read count item” are extracted as feature data items.
図5に示す回帰モデル再計算部14は、回帰モデル生成部12により生成された複数の回帰モデルを、特徴データ項目抽出部13により抽出された特徴データ項目を参照して合成することで、監視対象システムの性能検査をするときに用いる回帰モデルを算出(再計算)する。
The regression
なお、予め特徴データ項目が判明している場合には、特徴データ項目抽出部13により抽出された特徴データ項目を参照する代わりに、判明しているデータ項目を利用することもできる。例えば、Webシステムでは、データベースへの書き込みが有る場合と無い場合とでは、処理性能が大きく異なることが知られている。したがって、このような場合には、“書込回数項目”と“読出回数項目”とが特徴データ項目になることが予め判明していることになる。
If the feature data item is known in advance, the known data item can be used instead of referring to the feature data item extracted by the feature data
具体的に、回帰モデル再計算部14は、説明変数に対する各特徴データ項目の値の割合をグループごとに算出し、この算出した割合を用いて各グループの回帰モデルを合成することで、各特徴データ項目に関する回帰モデルである特徴データ項目別回帰モデルを算出する。回帰モデル再計算部14は、算出した各特徴データ項目別回帰モデルを、監視対象システムでの性能検査の対象となるログデータ(以下、「検査対象ログデータ」という。)に含まれる各特徴データ項目の値の出現率に応じて合成することで、回帰モデルを算出する。
Specifically, the regression
特徴データ項目別回帰モデルは、例えば、以下のように算出する。 The characteristic data item regression model is calculated as follows, for example.
最初に、分類したグループ数をmとし、抽出した特徴データ項目数をnとした場合に、回帰モデル再計算部14は、m行n列の行列Aを生成する。この行列Aの各要素(i、j)には、特徴データ項目ajの値を説明変数(リクエスト数λ)で除算した値のグループXiでの平均値が配列される。
First, when the number of classified groups is m and the number of extracted feature data items is n, the regression
例えば、図7に示すように、分類したグループが“グループ1”と“グループ2”との2グループであり、抽出した特徴データ項目が“書込回数項目”と“読出回数項目”との2データ項目である場合には、行列Aは2行×2列の行列となる。図7に示す各データ欄には、各特徴データ項目の値をリクエスト数λで除算した値の各グループでの平均値が格納されている。つまり、この各データ欄の値が、行列Aの各要素(i、j)となる。この場合の行列Aは、以下のように表される。

続いて、回帰モデル再計算部14は、行列Aの疑似逆行列A+を算出する。疑似逆行列を算出する手法は、例えば、下記参考文献2に記載されている手法を用いることができる。
Subsequently, the regression
[参考文献2]
D.A.ハーヴィル著、「統計のための行列代数 下 (2)」、20章ムーア_ベンローズ形逆行列、シュプリンガー・ジャパン(株)
[Reference 2]
D. A. Harville, “Matrix Algebra for Statistics (2)”,
例えば、上記例示した行列Aの疑似逆行列A+は、以下のように表される。

続いて、回帰モデル再計算部14は、ある特徴データ項目ajの値を“1”とし、その他の特徴データ項目の値を“0”とした場合の回帰モデルhaj(λ)を、下記式(6)を用いて算出することで、特徴データ項目別回帰モデルを算出する。下記式(6)のfi(λ)は、回帰モデル生成部12により生成されたグループXiの回帰モデルである。

ここで、図7に示す“グループ1”の回帰モデルが、“f1(λ)=0.0041λ+0.0951”であり、“グループ2”の回帰モデルが、“f2(λ)=0.0019λ+0.1188”であると仮定する。この場合に、“書込回数項目a1”の特徴データ項目別回帰モデルは、上記式(6)を用いて“ha1(λ)=1.2(0.0041λ+0.0951)-0.2(0.0019λ+0.1188)”と算出される。また、“読出回数項目a2”の特徴データ項目別回帰モデルは、上記式(6)を用いて“ha2(λ)=-0.3(0.0041λ+0.0951)+1.3(0.0019λ+0.1188)”と算出される。
Here, the regression model of “
次に、特徴データ項目別回帰モデルを用いて回帰モデルを再計算する際の手順を以下に述べる。 Next, the procedure for recalculating the regression model using the regression model by feature data item is described below.
最初に、回帰モデル再計算部14は、検査対象ログデータに含まれる各特徴データ項目ajの値を説明変数(リクエスト数λ)で除算した値の検査対象ログデータでの平均値bjを算出する。
First, the regression
続いて、回帰モデル再計算部14は、下記式(7)を用いて回帰モデルf(λ)を生成する。つまり、既存の複数の回帰モデルを利用して、検査対象ログデータに基づいて性能検査をするときに用いる回帰モデルを再計算する。

ここで、検査対象ログデータが、図8に示すログデータであると仮定する。この場合、特徴データ項目である“書込回数項目a1”の値をリクエスト数λで除算した値の平均値b1は、90/100=0.9となる。また、特徴データ項目である“読出回数項目a2”の値をリクエスト数λで除算した値の平均値b2は、10/100=0.1となる。 Here, it is assumed that the inspection target log data is the log data shown in FIG. In this case, an average value b 1 of values obtained by dividing the value of the characteristic data item “number of times of writing item a 1 ” by the number of requests λ is 90/100 = 0.9. Further, an average value b 2 of values obtained by dividing the value of the “read number item a 2 ” that is the feature data item by the request number λ is 10/100 = 0.1.
したがって、図8に示す検査対象ログデータに基づいて性能検査をするときに用いる回帰モデルは、上記式(7)より、“f(λ)=0.9ha1(λ)+0.1ha2(λ)”となる。 Therefore, the regression model used when performing the performance inspection based on the inspection target log data shown in FIG. 8 is expressed by “f (λ) = 0.9 h a1 (λ) +0.1 h a2 (λ ) ”.
図5に示す性能値算出部15は、回帰モデル再計算部14により再計算された回帰モデルf(λ)を用いて、リクエスト数λに対応するディスク利用率ρを算出する。これにより、検査対象ログデータに基づく性能値を算出することができる。
5 uses the regression model f (λ) recalculated by the regression
ここで、例えば、再計算された回帰モデルが“f(λ)=0.9ha1(λ)+0.1ha2(λ)”であり、書込回数項目a1の特徴データ項目別回帰モデルが“ha1(λ)=1.2(0.0041λ+0.0951)-0.2(0.0019λ+0.1188)”であり、読出回数項目a2の特徴データ項目別回帰モデルが“ha2(λ)=-0.3(0.0041λ+0.0951)+1.3(0.0019λ+0.1188)”である場合に、想定するリクエスト数λが“400”に設定されたときのディスク利用率ρを求めてみる。 Here, for example, the recalculated regression model is “f (λ) = 0.9 h a1 (λ) +0.1 h a2 (λ)”, and the regression model for each characteristic data item of the write count item a 1 is “H a1 (λ) = 1.2 (0.0041λ + 0.0951) −0.2 (0.0019λ + 0.1188)”, and the regression model for each characteristic data item of the read count item a 2 is “h a2 (λ ) = − 0.3 (0.0041λ + 0.0951) +1.3 (0.0019λ + 0.1188) ”, the disk usage rate ρ is calculated when the assumed number of requests λ is set to“ 400 ”. Try.
この場合、ディスク利用率ρは、ρ=f(400)=0.9ha1(400)+0.1ha2(400)=1.77と求まる。つまり、この例では、ディスク利用率ρが1を超えることになる。したがって、この場合、管理者は、ディスク資源を増強する等の処置を講ずることになる。 In this case, the disk usage rate ρ is obtained as ρ = f (400) = 0.9 h a1 (400) +0.1 h a2 (400) = 1.77. That is, in this example, the disk utilization rate ρ exceeds 1. Therefore, in this case, the administrator takes measures such as increasing disk resources.
図5に示す異常判定部16は、検査対象ログデータのログレコードごとに、リクエスト数項目の値λ’を回帰モデルf(λ)に代入して得られる値f(λ’)と、ディスク利用率項目の値ρ’との差(|f(λ’)-ρ’|)が所定の閾値よりも大きいか否かを判定する。異常判定部16は、|f(λ’)-ρ’|が所定の閾値よりも大きい場合に、監視対象システムに異常が有ると判定する。
The
具体的に、監視対象システムにおける異常の有無は、以下のように判定することができる。 Specifically, the presence or absence of an abnormality in the monitored system can be determined as follows.
異常判定部16は、回帰モデル再計算部14により再計算された回帰モデルf(λ)の目的変数(ディスク利用率ρ)に関して、分散V(ρ)を求め、その標準偏差(√V)を算出する。異常判定部16は、|f(λ’)-ρ’|を算出し、この値を標準偏差(√V)で除算した値が、閾値aよりも大きい場合に、監視対象システムに異常が有ると判定する。閾値aの値は任意に設定することができる。言い替えると、異常判定部16は、|f(λ’)-ρ’|の値が、標準偏差(√V)に対してどの程度の隔たりを有するのかを基準にして異常の有無を判定する。
The
上記分散V(ρ)は、例えば、下記式(8)から導出される下記式(9)を計算することで求めることができる。下記式(8)の回帰モデルf(λ)は、上記式(6)および式(7)から導出することができ、下記式(9)の分散V(ρ)は、下記式(8)から導出することができる。

上記式(9)のV(ρj)は、グループXiごとに算出される回帰モデルの目的変数(ディスク利用率ρ)に関する分散である。ρjは、グループXiにおける目的変数の分布を示す確率変数である。 V (ρ j ) in the above equation (9) is a variance related to the objective variable (disk utilization rate ρ) of the regression model calculated for each group X i . ρ j is a random variable indicating the distribution of the objective variable in the group X i .
次に、第2実施形態における監視データ分析装置の動作について説明する。ここで、ログデータを複数のグループに分類し、グループごとに回帰モデルを生成する際の動作については、上述した第1実施形態における監視データ分析装置の動作(図4参照)と同様であるため、その説明を省略する。 Next, the operation of the monitoring data analyzer in the second embodiment will be described. Here, the operation when the log data is classified into a plurality of groups and the regression model is generated for each group is the same as the operation of the monitoring data analyzer in the first embodiment described above (see FIG. 4). The description is omitted.
まず、図9を参照して、回帰モデルを用いてディスク利用率を算出する際の動作について説明する。 First, with reference to FIG. 9, the operation when calculating the disk usage rate using the regression model will be described.
最初に、特徴データ項目抽出部13が、後述する特徴データ項目抽出処理を実行する(ステップS201)。続いて、回帰モデル再計算部14が、後述する回帰モデル再計算処理を実行する(ステップS202)。続いて、性能値算出部15は、回帰モデル再計算部14により再計算された回帰モデルf(λ)を用いて、想定するリクエスト数に対応するディスク利用率を算出する(ステップS203)。想定するリクエスト数は、管理者が監視データ分析装置に任意に設定することができる。
First, the feature data
図10を参照して、上記ステップS201で実行される特徴データ項目抽出処理について説明する。 With reference to FIG. 10, the feature data item extraction process executed in step S201 will be described.
以下に説明するステップS301~ステップS304までの各処理は、ログデータに含まれる全てのデータ項目ajを対象にして、データ項目ajごとに順次ループして実行する。 Each processing from step S301 to step S304 described below is executed in a loop for each data item a j in order for all the data items a j included in the log data.
最初に、特徴データ項目抽出部13は、上記式(3)を用い、データ分類部11により分類された全グループXのログデータを対象にして、対象データ項目ajの値をリクエスト数λで除算した値の分散djを算出する(ステップS301)。
First, the feature data
続いて、特徴データ項目抽出部13は、上記式(4)を用い、各グループXiのログデータを対象にして、対象データ項目ajの値をリクエスト数λで除算した値の分散djiを、グループXiごとに求め、さらに、上記式(5)を用い、分散djiのグループ全体での総和dj’を算出する(ステップS302)。
Then, the feature data
続いて、特徴データ項目抽出部13は、上記ステップS302で算出した総和dj’を、上記ステップS301で算出した分散djで除算した値が、閾値kよりも小さいか否かを判定する(ステップS303)。この判定がNOである場合(ステップS303;NO)には、処理をステップS304の後段に移行する。
Subsequently, the feature data
一方、上記ステップS303の判定で、上記(dj’/dj)の値が閾値kよりも小さいと判定された場合(ステップS303;YES)に、特徴データ項目抽出部13は、対象データ項目ajを特徴データ項目として抽出する(ステップS304)。
On the other hand, if it is determined in step S303 that the value of (d j ′ / d j ) is smaller than the threshold value k (step S303; YES), the feature data
図11を参照して、上記ステップS202で実行される回帰モデル再計算処理について説明する。 Referring to FIG. 11, the regression model recalculation process executed in step S202 will be described.
最初に、回帰モデル再計算部14は、上記ステップS201で抽出された各特徴データ項目ajの値を説明変数(リクエスト数λ)で除算した値のグループXiでの平均値を行列の要素とし、グループ数m行×特徴データ項目数n列の行列Aを生成する(ステップS401)。
First, the regression
続いて、回帰モデル再計算部14は、行列Aの疑似逆行列A+を算出する(ステップS402)。
Subsequently, the regression
続いて、回帰モデル再計算部14は、上記式(6)を用い、特徴データ項目別回帰モデルhaj(λ)を算出する(ステップS403)。
Subsequently, the regression
続いて、回帰モデル再計算部14は、検査対象ログデータに含まれる各特徴データ項目ajの値をリクエスト数λで除算した値の検査対象ログデータでの平均値bjを算出する(ステップS404)。
Subsequently, the regression
続いて、回帰モデル再計算部14は、上記ステップS403で算出した特徴データ項目別回帰モデルhaj(λ)と、上記ステップS404で算出した平均値bjとを、上記式(7)に代入して回帰モデルf(λ)を算出することで、検査対象ログデータ用の回帰モデルf(λ)を生成(再計算)する(ステップS405)。
Subsequently, the regression
次に、図12を参照して、監視対象システムの異常判定処理について説明する。この異常判定処理は、上述した図9のステップS202が実行された後に実行する。異常判定処理は、図9のステップS203と並行して実行してもよいし、ステップS203の前または後に実行してもよい。 Next, the abnormality determination process of the monitoring target system will be described with reference to FIG. This abnormality determination process is executed after step S202 of FIG. 9 described above is executed. The abnormality determination process may be executed in parallel with step S203 of FIG. 9, or may be executed before or after step S203.
最初に、異常判定部16は、回帰モデル再計算部14により再計算された再計算回帰モデルf(λ)を参照して、目的変数(ディスク利用率ρ)に関する標準偏差(√V)を算出する(ステップS501)。
First, the
以下に説明するステップS502~ステップS503までの各処理は、検査対象ログデータに含まれる全てのログレコードを対象にして、ログレコードごとに順次ループして実行する。 Each process from step S502 to step S503 described below is executed by sequentially looping for each log record for all log records included in the inspection target log data.
続いて、異常判定部16は、検査対象ログデータのリクエスト数項目の値λ’を、再計算回帰モデルf(λ)に代入して得られる値f(λ’)と、検査対象ログデータのディスク利用率項目の値ρ’との差を求め、この差を、上記ステップS501で算出した標準偏差(√V)で除算した値を算出する(ステップS502)。
Subsequently, the
続いて、異常判定部16は、上記ステップS502で算出した値が、閾値aよりも大きいか否かを判定する(ステップS503)。この判定がNOである場合(ステップS503;NO)には、処理を後段に移行する。
Subsequently, the
一方、上記ステップS503の判定で、上記ステップS502で算出した値が閾値aよりも大きいと判定された場合(ステップS503;YES)に、異常判定部16は、監視対象システムに異常が有ると判定し、管理者に異常を通知する(ステップS504)。管理者に異常を通知する手法としては、例えば、その旨のメッセージを出力する手法や、警告音を出力する手法等が該当する。
On the other hand, when it is determined in step S503 that the value calculated in step S502 is greater than the threshold value a (step S503; YES), the
上述したように、第2実施形態の監視データ分析装置によれば、第1実施形態の監視データ分析装置による効果に加え、検査対象ログデータに含まれる各特徴データ項目の値の割合に応じて、既存の複数の回帰モデルを合成し、新たな回帰モデルを生成(再計算)することができる。これにより、想定する利用パターンに適応させた回帰モデルを生成し、この回帰モデルを用いてディスク利用率等の資源利用率を予測することができる。したがって、ディスク利用率等の資源利用率が利用パターンごとに大きく相違する場合であっても、資源利用率の予測精度を向上させることが可能となり、この資源利用率に応じて的確な処置を講ずることができる。 As described above, according to the monitoring data analysis apparatus of the second embodiment, in addition to the effects of the monitoring data analysis apparatus of the first embodiment, according to the value ratio of each feature data item included in the inspection target log data. A new regression model can be generated (recalculated) by synthesizing a plurality of existing regression models. As a result, a regression model adapted to the assumed usage pattern can be generated, and the resource usage rate such as the disk usage rate can be predicted using this regression model. Therefore, even when the resource usage rate such as the disk usage rate varies greatly for each usage pattern, it is possible to improve the prediction accuracy of the resource usage rate, and take appropriate measures according to this resource usage rate. be able to.
また、想定する利用パターンに適応させた回帰モデルとの差に基づいて監視対象システムの異常を発見することができるため、異常発見の精度を向上さることが可能となる。 Also, since the abnormality of the monitored system can be found based on the difference from the regression model adapted to the assumed usage pattern, it is possible to improve the accuracy of finding the abnormality.
なお、上述した第2実施形態における特徴データ項目抽出部13は、各データ項目の説明変数への依存度を用いて特徴データ項目を抽出しているが、特徴データ項目を抽出する方法は、これに限定されない。例えば、以下のような抽出方法を用いることができる。
Note that the feature data
特徴データ項目抽出部13は、データ分類部11により分類されたグループXiごとに、そのグループを形成するログデータに含まれる各データ項目ajについて、各データ項目ajと説明変数(リクエスト数λ)との間の相関係数のグループXiでの平均値を算出する。特徴データ項目抽出部13は、算出した上記平均値が所定閾値k’以上となるデータ項目ajを、特徴データ項目として抽出する。
For each group X i classified by the
各データ項目ajと説明変数との間の相関係数の平均値は、例えば、以下の手順で算出することができる。 The average value of the correlation coefficient between each data item a j and the explanatory variable can be calculated by the following procedure, for example.
最初に、特徴データ項目抽出部13は、下記式(10)を用い、グループXiごとに、各データ項目ajと説明変数(リクエスト数λ)との間の相関係数rjiを算出する。

上記式(10)のp(k).ajはグループXiに属するk番目のログレコードのデータ項目ajの値であり、p(k).λはグループXiに属するk番目のログレコードのリクエスト数項目の値であり、mはグループ数である。 P (k) . a j is the value of the data item a j of the k-th log record belonging to the group X i , and p (k) . λ is the value of the request number item of the k-th log record belonging to the group X i , and m is the number of groups.
続いて、特徴データ項目抽出部13は、グループXiごとの相関係数rjiを全グループXで集計した値を、グループ数mで除算することで、各データ項目ajと説明変数との間の相関係数の平均値rjを算出する。
Subsequently, the feature data
続いて、特徴データ項目抽出部13は、|rj|が閾値k’以上となるデータ項目ajを、特徴データ項目として抽出する。
Subsequently, the feature data
また、上述した第2実施形態では、特徴データ項目抽出部13によって特徴データ項目を抽出しているが、これに限定されない。例えば、特徴データ項目が明らかである場合には、管理者が予め特徴データ項目をメモリに登録する等して設定してもよい。この場合には、特徴データ項目抽出部13を不要にすることができる。特徴データ項目抽出部13を不要とした場合、回帰モデル再計算部14は、上記メモリを参照して特徴データ項目の値を取得すればよい。
In the second embodiment described above, the feature data item is extracted by the feature data
また、上述した第2実施形態における回帰モデル再計算部14は、回帰モデル生成部12により生成された複数の回帰モデルを、特徴データ項目を参照して合成することで、監視対象システムの性能値算出時や異常判定時に用いる回帰モデルを算出(再計算)している。しかしながら、次の場合には、回帰モデル再計算部14を不要にすることができる。それは、性能値算出時や異常判定時に用いる検査対象ログデータが、回帰モデル生成部12により生成された複数の回帰モデルのいずれかに一致または近似する場合である。例えば、ある出張精算システムでは、昼間はユーザからの出張精算をインタラクティブに受け付ける。一方、夜間はバッチ処理により、精算処理を行う。このような場合、昼間と夜間とで別個の回帰モデルが生成される。したがって、性能値算出時や異常判定時に用いる検査対象ログデータの発生時刻に応じて、いずれか一方の回帰モデルを利用すればよい。
In addition, the regression
[各実施形態の変形例]
上述した各実施形態は、単なる例示に過ぎず、各実施形態に明示していない種々の変形や技術の適用を排除するものではない。すなわち、本発明は、その趣旨を逸脱しない範囲で様々な形態に変形して実施することができる。
[Modification of each embodiment]
Each of the above-described embodiments is merely an example, and does not exclude various modifications and technical applications that are not explicitly described in each embodiment. That is, the present invention can be implemented by being modified into various forms without departing from the spirit of the present invention.
例えば、上述した各実施形態では一つの監視データ分析装置で本発明を実施しているが、本発明は複数の装置で実施することもできる。この場合には、上述した各実施形態における監視データ分析装置が有する各機能を複数の装置に分散し、これら複数の装置群を上述した各実施形態における監視データ分析装置と同様に機能させればよい。 For example, in the above-described embodiments, the present invention is implemented by a single monitoring data analysis apparatus, but the present invention can also be implemented by a plurality of apparatuses. In this case, if the functions of the monitoring data analysis device in each of the above-described embodiments are distributed to a plurality of devices, and the plurality of device groups function in the same manner as the monitoring data analysis device in each of the above-described embodiments. Good.
また、上記の各実施形態の一部または全部は、以下の付記のようにも記載され得るが、本発明を以下に限定するものではない。 In addition, a part or all of each of the above embodiments can be described as in the following supplementary notes, but the present invention is not limited to the following.
(付記1) 性能管理の対象となる監視対象システムにおける監視データを含むログデータを蓄積するデータ蓄積部と、前記ログデータに含まれる前記監視対象システムの構成要素の利用状況を示す利用状況データの特性に基づいて、前記ログデータを複数のグループに分類するデータ分類部と、前記グループごとに前記ログデータの回帰分析を実行して回帰モデルを生成する回帰モデル生成部と、を備えることを特徴とする監視データ分析装置。 (Appendix 1) A data storage unit that stores log data including monitoring data in a monitoring target system that is a target of performance management, and usage status data that indicates the usage status of the components of the monitoring target system included in the log data A data classification unit that classifies the log data into a plurality of groups based on characteristics, and a regression model generation unit that generates a regression model by performing regression analysis of the log data for each group. Monitoring data analysis device.
(付記2) 前記ログデータに含まれるデータ項目の中から、前記回帰モデルの説明変数と関連がある前記データ項目を特徴データ項目として抽出する特徴データ項目抽出部を、さらに備える、ことを特徴とする付記1記載の監視データ分析装置。
(Additional remark 2) The characteristic data item extraction part which extracts the said data item relevant to the explanatory variable of the said regression model as a characteristic data item from the data items contained in the said log data is further provided, It is characterized by the above-mentioned. The monitoring data analyzer according to
(付記3) 前記特徴データ抽出部は、前記グループごとに、当該グループを形成するデータの各データ項目における前記説明変数への依存度を算出し、当該算出した前記依存度が所定閾値よりも高いデータ項目を、前記特徴データ項目として抽出する、ことを特徴とする付記2記載の監視データ分析装置。
(Additional remark 3) The said feature data extraction part calculates the dependence to the said explanatory variable in each data item of the data which forms the said group for every said group, and the said calculated said dependence is higher than a predetermined threshold value The monitoring data analysis apparatus according to
(付記4) 前記特徴データ抽出部は、前記グループごとに、当該グループを形成するデータの各データ項目における前記説明変数との間の相関係数を算出し、当該算出した各前記相関係数の平均値が所定閾値よりも大きいデータ項目を、前記特徴データ項目として抽出する、ことを特徴とする付記2記載の監視データ分析装置。
(Additional remark 4) The said feature data extraction part calculates the correlation coefficient between the said explanatory variables in each data item of the data which forms the said group for every said group, and each said calculated correlation coefficient of each said correlation coefficient The monitoring data analysis apparatus according to
(付記5) 前記回帰モデル生成部により生成された前記回帰モデルを用いて、当該回帰モデルの目的変数である性能値を算出する性能値算出部を、さらに備える、
ことを特徴とする付記1~4のいずれかに記載の監視データ分析装置。
(Additional remark 5) The performance value calculation part which calculates the performance value which is the objective variable of the said regression model using the regression model generated by the regression model generation part is further provided,
The monitoring data analyzer according to any one of
(付記6) 性能検査の対象となる前記ログデータである検査対象ログデータに含まれる前記回帰モデルの説明変数に対応するデータ項目の値を前記回帰モデル生成部により生成された回帰モデルに代入して得られる値と、前記検査対象ログデータに含まれる前記回帰モデルの目的変数に対応するデータ項目の値との差に基づいて、前記監視対象システムにおける異常の有無を判定する異常判定部を、さらに備える、
ことを特徴とする付記1~4のいずれかに記載の監視データ分析装置。
(Additional remark 6) The value of the data item corresponding to the explanatory variable of the regression model included in the inspection target log data which is the log data to be subjected to the performance inspection is substituted into the regression model generated by the regression model generation unit. An abnormality determination unit that determines the presence or absence of abnormality in the monitoring target system based on the difference between the value obtained and the value of the data item corresponding to the objective variable of the regression model included in the inspection target log data, In addition,
The monitoring data analyzer according to any one of
(付記7) 前記説明変数に対する各前記特徴データ項目の値の割合を前記グループごとに算出し、当該算出した前記割合を用いて各前記グループの前記回帰モデルを合成することで、各前記特徴データ項目に関する前記回帰モデルである特徴データ項目別回帰モデルを算出し、当該算出した各前記特徴データ項目別回帰モデルを、性能検査の対象となる前記ログデータである検査対象ログデータに含まれる前記特徴データ項目の値の出現率に応じて合成することで、前記回帰モデルを再計算する回帰モデル再計算部を、さらに備える、ことを特徴とする付記2~4のいずれかに記載の監視データ分析装置。
(Additional remark 7) The ratio of the value of each said characteristic data item with respect to the said explanatory variable is calculated for every said group, The said regression data of each said group is synthesize | combined using the said calculated said ratio, and each said characteristic data The feature data item regression model that is the regression model for the item is calculated, and the calculated feature data item regression model is included in the inspection target log data that is the log data to be subjected to performance inspection. The monitoring data analysis according to any one of
(付記8) 前記回帰モデル再計算部により再計算された前記回帰モデルを用いて、当該回帰モデルの目的変数である性能値を算出する性能値算出部を、さらに備える、ことを特徴とする付記7記載の監視データ分析装置。 (Additional remark 8) The performance value calculation part which calculates the performance value which is the objective variable of the said regression model is further provided using the said regression model recalculated by the said regression model recalculation part, The additional remark characterized by the above-mentioned 7. The monitoring data analysis device according to 7.
(付記9) 前記検査対象ログデータに含まれる前記回帰モデルの説明変数に対応するデータ項目の値を前記回帰モデル再計算部により再計算された回帰モデルに代入して得られる値と、前記検査対象ログデータに含まれる前記回帰モデルの目的変数に対応するデータ項目の値との差に基づいて、前記監視対象システムにおける異常の有無を判定する異常判定部を、さらに備える、ことを特徴とする付記7記載の監視データ分析装置。
(Supplementary note 9) The value obtained by substituting the value of the data item corresponding to the explanatory variable of the regression model included in the inspection target log data into the regression model recalculated by the regression model recalculation unit, and the inspection The apparatus further comprises an abnormality determination unit that determines whether there is an abnormality in the monitoring target system based on a difference from a value of a data item corresponding to the objective variable of the regression model included in the target log data. The monitoring data analyzer according to
(付記10) 性能管理の対象となる監視対象システムにおける監視データを含むログデータを蓄積するデータ蓄積ステップと、前記ログデータに含まれる前記監視対象システムの構成要素の利用状況を示す利用状況データの特性に基づいて、前記ログデータを複数のグループに分類するデータ分類ステップと、前記グループごとに前記ログデータの回帰分析を実行して回帰モデルを生成する回帰モデル生成ステップと、を含むことを特徴とする監視データ分析方法。 (Supplementary Note 10) A data accumulation step for accumulating log data including monitoring data in the monitoring target system that is the target of performance management, and usage status data indicating the usage status of the components of the monitoring target system included in the log data A data classification step of classifying the log data into a plurality of groups based on characteristics; and a regression model generation step of generating a regression model by executing a regression analysis of the log data for each group. Monitoring data analysis method.
(付記11) 付記10に記載の各ステップをコンピュータに実行させるための監視データ分析プログラム。
(Supplementary note 11) A monitoring data analysis program for causing a computer to execute each step described in
この出願は、2010年12月24日に出願された日本出願特願2010-288525を基礎とする優先権を主張し、その開示の全てをここに取り込む。 This application claims priority based on Japanese Patent Application No. 2010-288525 filed on Dec. 24, 2010, the entire disclosure of which is incorporated herein.
本発明に係る監視データ分析装置、監視データ分析方法および監視データ分析プログラムは、監視対象システムが複数の利用パターンを有する場合であっても、予測誤差を低減することに適している。 The monitoring data analysis apparatus, the monitoring data analysis method, and the monitoring data analysis program according to the present invention are suitable for reducing the prediction error even when the monitoring target system has a plurality of usage patterns.
1…監視データ分析装置、11…データ分類部、12…回帰モデル生成部、13…特徴データ項目抽出部、14…回帰モデル再計算部、15…性能値算出部、16…異常判定部、21…ログデータファイル、22…回帰モデルファイル。
DESCRIPTION OF
Claims (11)
前記ログデータに含まれる前記監視対象システムの構成要素の利用状況を示す利用状況データの特性に基づいて、前記ログデータを複数のグループに分類するデータ分類部と、
前記グループごとに前記ログデータの回帰分析を実行して回帰モデルを生成する回帰モデル生成部と、
を備えることを特徴とする監視データ分析装置。 A data accumulating unit for accumulating log data including monitoring data in the monitoring target system to be performance management;
A data classification unit for classifying the log data into a plurality of groups based on characteristics of usage status data indicating usage status of components of the monitoring target system included in the log data;
A regression model generation unit that generates a regression model by performing regression analysis of the log data for each group;
A monitoring data analysis device comprising:
ことを特徴とする請求項1記載の監視データ分析装置。 A feature data item extraction unit that extracts the data items related to the explanatory variables of the regression model as feature data items from the data items included in the log data;
The monitoring data analysis apparatus according to claim 1, wherein:
ことを特徴とする請求項2記載の監視データ分析装置。 The feature data extraction unit calculates, for each group, a dependency on the explanatory variable in each data item of data forming the group, and the calculated data item has a higher dependency than a predetermined threshold. Extracting as the feature data item,
The monitoring data analysis apparatus according to claim 2, wherein
ことを特徴とする請求項2記載の監視データ分析装置。 The feature data extraction unit calculates, for each group, a correlation coefficient with the explanatory variable in each data item of data forming the group, and an average value of the calculated correlation coefficients is predetermined. A data item larger than a threshold is extracted as the feature data item;
The monitoring data analysis apparatus according to claim 2, wherein
ことを特徴とする請求項1~4のいずれか1項に記載の監視データ分析装置。 A performance value calculation unit that calculates a performance value that is an objective variable of the regression model using the regression model generated by the regression model generation unit is further provided.
The monitoring data analysis apparatus according to any one of claims 1 to 4, wherein
ことを特徴とする請求項1~4のいずれか1項に記載の監視データ分析装置。 A value obtained by substituting the value of the data item corresponding to the explanatory variable of the regression model included in the inspection target log data, which is the log data to be subjected to performance inspection, into the regression model generated by the regression model generation unit And an abnormality determination unit that determines whether there is an abnormality in the monitoring target system based on a difference between the value of the data item corresponding to the objective variable of the regression model included in the inspection target log data,
The monitoring data analysis apparatus according to any one of claims 1 to 4, wherein
ことを特徴とする請求項2~4のいずれか1項に記載の監視データ分析装置。 The ratio of the value of each feature data item to the explanatory variable is calculated for each group, and the regression model of each group is synthesized using the calculated ratio, and the regression for each feature data item is calculated. A feature data item regression model that is a model is calculated, and each calculated feature data item regression model is a value of the feature data item included in the inspection target log data that is the log data to be subjected to performance inspection. A regression model recalculation unit that recalculates the regression model by synthesizing according to the appearance rate of
The monitoring data analysis apparatus according to any one of claims 2 to 4, wherein
ことを特徴とする請求項7記載の監視データ分析装置。 Using the regression model recalculated by the regression model recalculation unit, further comprising a performance value calculation unit that calculates a performance value that is an objective variable of the regression model,
The monitoring data analyzer according to claim 7.
ことを特徴とする請求項7記載の監視データ分析装置。 A value obtained by substituting the value of the data item corresponding to the explanatory variable of the regression model included in the inspection target log data into the regression model recalculated by the regression model recalculation unit, and the inspection target log data An abnormality determination unit that determines whether there is an abnormality in the monitored system based on a difference from a value of a data item corresponding to an objective variable of the regression model included,
The monitoring data analyzer according to claim 7.
前記ログデータに含まれる前記監視対象システムの構成要素の利用状況を示す利用状況データの特性に基づいて、前記ログデータを複数のグループに分類するデータ分類ステップと、
前記グループごとに前記ログデータの回帰分析を実行して回帰モデルを生成する回帰モデル生成ステップと、
を含むことを特徴とする監視データ分析方法。 A data accumulation step for accumulating log data including monitoring data in a monitoring target system to be performance management;
A data classification step of classifying the log data into a plurality of groups based on characteristics of usage status data indicating usage status of components of the monitoring target system included in the log data;
A regression model generation step of generating a regression model by performing regression analysis of the log data for each group;
A monitoring data analysis method comprising:
Priority Applications (2)
| Application Number | Priority Date | Filing Date | Title |
|---|---|---|---|
| JP2012549723A JP5871192B2 (en) | 2010-12-24 | 2011-12-12 | Monitoring data analysis apparatus, monitoring data analysis method, and monitoring data analysis program |
| US13/824,601 US9111227B2 (en) | 2010-12-24 | 2011-12-12 | Monitoring data analyzing apparatus, monitoring data analyzing method, and monitoring data analyzing program |
Applications Claiming Priority (2)
| Application Number | Priority Date | Filing Date | Title |
|---|---|---|---|
| JP2010-288525 | 2010-12-24 | ||
| JP2010288525 | 2010-12-24 |
Publications (1)
| Publication Number | Publication Date |
|---|---|
| WO2012086443A1 true WO2012086443A1 (en) | 2012-06-28 |
Family
ID=46313722
Family Applications (1)
| Application Number | Title | Priority Date | Filing Date |
|---|---|---|---|
| PCT/JP2011/078710 Ceased WO2012086443A1 (en) | 2010-12-24 | 2011-12-12 | Monitoring data analysis device, monitoring data analysis method, and monitoring data analysis program |
Country Status (3)
| Country | Link |
|---|---|
| US (1) | US9111227B2 (en) |
| JP (1) | JP5871192B2 (en) |
| WO (1) | WO2012086443A1 (en) |
Cited By (7)
| Publication number | Priority date | Publication date | Assignee | Title |
|---|---|---|---|---|
| JP2015094919A (en) * | 2013-11-14 | 2015-05-18 | 株式会社リコー | Failure prediction apparatus and image forming apparatus |
| CN105786677A (en) * | 2014-10-20 | 2016-07-20 | 三星Sds株式会社 | Apparatus and method for detecting abnormal connection |
| JP2018041212A (en) * | 2016-09-06 | 2018-03-15 | 株式会社東芝 | Evaluation device, evaluation method and evaluation program |
| JP2018063518A (en) * | 2016-10-12 | 2018-04-19 | 株式会社日立製作所 | Management server, management method and program thereof |
| JP2018525728A (en) * | 2015-07-14 | 2018-09-06 | サイオス テクノロジー コーポレーションSios Technology Corporation | A distributed machine learning analysis framework for analyzing streaming datasets from computer environments |
| JPWO2020255413A1 (en) * | 2019-06-21 | 2020-12-24 | ||
| JP2022171623A (en) * | 2021-04-29 | 2022-11-11 | インターナショナル・ビジネス・マシーンズ・コーポレーション | System, computer implementation method, and computer program (grouping anomalous components of distributed application) |
Families Citing this family (4)
| Publication number | Priority date | Publication date | Assignee | Title |
|---|---|---|---|---|
| JP5848597B2 (en) * | 2011-12-21 | 2016-01-27 | インターナショナル・ビジネス・マシーンズ・コーポレーションInternational Business Machines Corporation | Software configuration value optimization method, apparatus, system, and program using CMDB |
| US10963922B1 (en) | 2013-03-15 | 2021-03-30 | Twitter, Inc. | Campaign goal setting in a messaging platform |
| US9400732B2 (en) * | 2014-05-20 | 2016-07-26 | Red Hat Israel, Ltd. | Performance regression testing in presence of noise |
| US12380061B2 (en) * | 2020-04-30 | 2025-08-05 | Kyndryl, Inc. | Technique selection for file system utilization prediction |
Citations (6)
| Publication number | Priority date | Publication date | Assignee | Title |
|---|---|---|---|---|
| JPH0765168A (en) * | 1993-08-31 | 1995-03-10 | Hitachi Ltd | Function approximating apparatus and method |
| JP2003263342A (en) * | 2002-03-07 | 2003-09-19 | Telecommunication Advancement Organization Of Japan | Monitoring apparatus, monitoring method, and program for information processing apparatus |
| JP2004086897A (en) * | 2002-08-06 | 2004-03-18 | Fuji Electric Holdings Co Ltd | Model building method and model building system |
| WO2006046297A1 (en) * | 2004-10-28 | 2006-05-04 | Fujitsu Limited | Analyzing method and device |
| US20090287744A1 (en) * | 2008-05-15 | 2009-11-19 | International Business Machines Corporation | Apparatus, system and method for healthcheck of information technology infrastructure based on log data |
| JP2011070635A (en) * | 2009-08-28 | 2011-04-07 | Hitachi Ltd | Method and device for monitoring state of facility |
Family Cites Families (4)
| Publication number | Priority date | Publication date | Assignee | Title |
|---|---|---|---|---|
| JP3666365B2 (en) * | 2000-06-15 | 2005-06-29 | 日本電気株式会社 | Online time zone reservation system and online time zone reservation method |
| JP2002007169A (en) * | 2000-06-23 | 2002-01-11 | Nec Corp | System for measuring grammar comprehension rate |
| JP2002268922A (en) | 2001-03-09 | 2002-09-20 | Ntt Data Corp | Performance monitoring device for WWW site |
| JP5489085B2 (en) * | 2009-05-15 | 2014-05-14 | 日本電気株式会社 | Failure cause estimation system, failure cause estimation method, and failure cause estimation program |
-
2011
- 2011-12-12 WO PCT/JP2011/078710 patent/WO2012086443A1/en not_active Ceased
- 2011-12-12 JP JP2012549723A patent/JP5871192B2/en not_active Expired - Fee Related
- 2011-12-12 US US13/824,601 patent/US9111227B2/en active Active
Patent Citations (6)
| Publication number | Priority date | Publication date | Assignee | Title |
|---|---|---|---|---|
| JPH0765168A (en) * | 1993-08-31 | 1995-03-10 | Hitachi Ltd | Function approximating apparatus and method |
| JP2003263342A (en) * | 2002-03-07 | 2003-09-19 | Telecommunication Advancement Organization Of Japan | Monitoring apparatus, monitoring method, and program for information processing apparatus |
| JP2004086897A (en) * | 2002-08-06 | 2004-03-18 | Fuji Electric Holdings Co Ltd | Model building method and model building system |
| WO2006046297A1 (en) * | 2004-10-28 | 2006-05-04 | Fujitsu Limited | Analyzing method and device |
| US20090287744A1 (en) * | 2008-05-15 | 2009-11-19 | International Business Machines Corporation | Apparatus, system and method for healthcheck of information technology infrastructure based on log data |
| JP2011070635A (en) * | 2009-08-28 | 2011-04-07 | Hitachi Ltd | Method and device for monitoring state of facility |
Cited By (12)
| Publication number | Priority date | Publication date | Assignee | Title |
|---|---|---|---|---|
| JP2015094919A (en) * | 2013-11-14 | 2015-05-18 | 株式会社リコー | Failure prediction apparatus and image forming apparatus |
| CN105786677A (en) * | 2014-10-20 | 2016-07-20 | 三星Sds株式会社 | Apparatus and method for detecting abnormal connection |
| JP2018525728A (en) * | 2015-07-14 | 2018-09-06 | サイオス テクノロジー コーポレーションSios Technology Corporation | A distributed machine learning analysis framework for analyzing streaming datasets from computer environments |
| JP2018041212A (en) * | 2016-09-06 | 2018-03-15 | 株式会社東芝 | Evaluation device, evaluation method and evaluation program |
| JP2018063518A (en) * | 2016-10-12 | 2018-04-19 | 株式会社日立製作所 | Management server, management method and program thereof |
| WO2018070211A1 (en) * | 2016-10-12 | 2018-04-19 | 株式会社日立製作所 | Management server, management method and program therefor |
| JPWO2020255413A1 (en) * | 2019-06-21 | 2020-12-24 | ||
| WO2020255413A1 (en) * | 2019-06-21 | 2020-12-24 | 日本電気株式会社 | Data analysis device, data analysis method, and computer-readable recording medium |
| JP7235111B2 (en) | 2019-06-21 | 2023-03-08 | 日本電気株式会社 | Data analysis device, data analysis method, and program |
| US12169262B2 (en) | 2019-06-21 | 2024-12-17 | Nec Corporation | Data analysis apparatus, data analysis method, and computer-readable recording medium |
| JP2022171623A (en) * | 2021-04-29 | 2022-11-11 | インターナショナル・ビジネス・マシーンズ・コーポレーション | System, computer implementation method, and computer program (grouping anomalous components of distributed application) |
| JP7764100B2 (en) | 2021-04-29 | 2025-11-05 | インターナショナル・ビジネス・マシーンズ・コーポレーション | System, computer-implemented method, and computer program for grouping unusual components of distributed applications |
Also Published As
| Publication number | Publication date |
|---|---|
| JP5871192B2 (en) | 2016-03-01 |
| US20130185236A1 (en) | 2013-07-18 |
| US9111227B2 (en) | 2015-08-18 |
| JPWO2012086443A1 (en) | 2014-05-22 |
Similar Documents
| Publication | Publication Date | Title |
|---|---|---|
| JP5871193B2 (en) | Monitoring data analysis apparatus, monitoring data analysis method, and monitoring data analysis program | |
| JP5871192B2 (en) | Monitoring data analysis apparatus, monitoring data analysis method, and monitoring data analysis program | |
| CN107003928B (en) | Performance anomaly diagnostics | |
| CN115454779A (en) | Cloud monitoring stream data detection method and device based on cluster analysis and storage medium | |
| JP2011253254A (en) | Simulation parameter calibrating method, device and program | |
| JPWO2013073377A1 (en) | Information diffusion scale prediction apparatus, information diffusion scale prediction method, and information diffusion scale prediction program | |
| JP2015097078A (en) | Feature extraction method and apparatus used in causal analysis | |
| CN105843733B (en) | A kind of method for testing performance and device of big data platform | |
| CN111881082A (en) | Snapshot generation method and device, electronic equipment and storage medium | |
| WO2018227167A1 (en) | Predicting molecular properties of molecular variants using residue-specific molecular structural features | |
| CN118228154A (en) | Power grid frequency anomaly detection method, device, computer equipment and storage medium | |
| Wei et al. | An incremental algorithm for clustering spatial data streams: exploring temporal locality | |
| JP6697082B2 (en) | Demand forecasting method, demand forecasting system and program thereof | |
| JP5600693B2 (en) | Clustering apparatus, method and program | |
| US11315036B2 (en) | Prediction for time series data using a space partitioning data structure | |
| JP2013156698A (en) | Clustering device, method, and program | |
| WO2015141157A1 (en) | Information processing device and clustering method | |
| CN116541252B (en) | Computer room fault log data processing method and device | |
| US20190138931A1 (en) | Apparatus and method of introducing probability and uncertainty via order statistics to unsupervised data classification via clustering | |
| US12399954B2 (en) | Data lineage metric based data processing | |
| JP7769267B2 (en) | Estimation device, estimation method, and estimation program | |
| Borba et al. | A Hierarchical Modeling Approach for Assessing the Reliability and Performability of Burst Buffers | |
| Streicher et al. | Eigenvector analysis for the ranking of control loop importance | |
| WO2020178938A1 (en) | Information processing device, information processing method, and information processing program | |
| JP5582017B2 (en) | Phase diagram generation program, phase diagram generation system, and phase diagram generation method |
Legal Events
| Date | Code | Title | Description |
|---|---|---|---|
| 121 | Ep: the epo has been informed by wipo that ep was designated in this application |
Ref document number: 11851432 Country of ref document: EP Kind code of ref document: A1 |
|
| WWE | Wipo information: entry into national phase |
Ref document number: 13824601 Country of ref document: US |
|
| ENP | Entry into the national phase |
Ref document number: 2012549723 Country of ref document: JP Kind code of ref document: A |
|
| NENP | Non-entry into the national phase |
Ref country code: DE |
|
| 122 | Ep: pct application non-entry in european phase |
Ref document number: 11851432 Country of ref document: EP Kind code of ref document: A1 |