WO2010060055A1 - Predicting cancer risk and treatment success - Google Patents
Predicting cancer risk and treatment success Download PDFInfo
- Publication number
- WO2010060055A1 WO2010060055A1 PCT/US2009/065570 US2009065570W WO2010060055A1 WO 2010060055 A1 WO2010060055 A1 WO 2010060055A1 US 2009065570 W US2009065570 W US 2009065570W WO 2010060055 A1 WO2010060055 A1 WO 2010060055A1
- Authority
- WO
- WIPO (PCT)
- Prior art keywords
- recurrence
- cancer
- genes
- expression
- likelihood
- Prior art date
- Legal status (The legal status is an assumption and is not a legal conclusion. Google has not performed a legal analysis and makes no representation as to the accuracy of the status listed.)
- Ceased
Links
Classifications
-
- G01N33/57535—
-
- G01N33/5758—
Definitions
- methods for predicting the likelihood of recurrence of a cancer are provided.
- the methods are suitable for predicting recurrence of colon cancer.
- the expression levels of a set of genes in a cancer cell from the subject are determined and compared to a reference.
- the set of genes assessed includes at least five genes from the recurrence predictor set of Table 1.
- the results are predictive of a likelihood of recurrence of the cancer
- methods of developing a treatment plan for an individual with colon cancer are provided.
- the predicted likelihood of recurrence of a cancer may be used to develop a treatment plan for the individual with the colon cancer.
- the treatment plan may include administering an effective amount of a chemotherapeutic agent to the individual with the cancer which is predicted to recur.
- kits including a gene chip for predicting likelihood of recurrence comprising nucleic acids capable of detecting at least five genes from Table 1 and instructions for predicting recurrence of colon cancer.
- computer readable mediums including gene expression profiles of reference cancers having known recurrence phenotypes and corresponding likelihood of recurrence information.
- the gene expression profiles include at least five genes from Table 1 are provided.
- FIG. 1 is a depiction of the clinical application of the recurrence predictor set.
- FIG. 2 A is a diagram showing the method used to develop the recurrence predictor set for colon cancer.
- FIG. 2B (top) shows a heat-map of the samples used to develop the recurrence predictor set with blue and red representing extremes of expression.
- FIG. 2B (middle) is a graph showing the recurrence score (prediction) of patients that remained disease free as compared to those who had recurrent disease.
- FIG. 2(bottom) is a graph showing the ROC curve identifying the recurrence score of 0.76 as the optimal cut-point to be used in classifying samples in the validation set.
- the area under the curve (AUC) is indicated to be 0.94, which confirms the robustness of the recurrence predictor set.
- FIG. 3 is a graph showing the accuracy of the recurrence predictor set using the score of 0.76 as a cut-point, the accuracy was 90.3% in a leave -one -out cross validation analysis.
- FIG. 4 is a set of graphs showing the accuracy and recurrence scores separated by the stage of the disease. The recurrence predictor predicted recurrence for both stage I and stage II colon cancer.
- FIG. 5 is a set of graphs further showing validation of the recurrence predictor set.
- FIG. 5 A shows an independent validation of the model comparing individual and mean recurrence scores for a distinct group of samples.
- FIG. 5C is a graph showing the Kaplan-Meier survival analysis demonstrating the time to recurrence in the two groups. The top line represents those with a low recurrence score and the bottom line represents those with a high recurrence score.
- FIG. 6 is a graph showing that RT-PCR analysis of the top ten differentially expressed genes demonstrated concordance for 9 of 10 genes with the microarray data. The data are presented as a comparison between the gene coefficients (specific to each gene in the Bayesian model) of the candidate genes and the log of the RQ values for the respective genes in the RT-PCR experiments.
- FIG. 7 is a connectivity map computationally matching drugs likely to be effective based on a core gene expression profile and a list of drugs identified in the analysis based on the recurrence predictor set.
- FIG. 8 is a graph showing the recurrence score of 14 colon cancer cell lines plotted against the metagene score generated using the recurrence predictor set.
- FIG. 9 is a set of graphs showing the in vitro validation of candidate chemotherapeutic agent sensitivity.
- FIG. 9A left panel shows the mutational events seen in the colon cancer cell lines sorted based on the recurrence probability generated based on the recurrence predictor set (blue: lowest risk; red: highest risk).
- FIG. 9A right panel shows the results of chemotherapeutic treatments based on the recurrence predictor set (circles: low; triangles: high). The cell lines with high scores were more sensitive to treatments with celecoxib, LY294002 (PBkinase inhibitor) and retinol.
- FIG. 9B left panel shows the change in recurrence score after exposure to chemotherapeutic agents.
- FIG. 9B right panel shows that traditional chemotherapy agents (5 -FU and oxaliplatin) do not show significantly greater predilection for inhibiting growth in cell lines with a high recurrence score.
- FIG. 9C is a histogram showing that all of the cell lines demonstrate a decrease in recurrence score post-treatment, indicating a reversal of the high-risk phenotype after exposure to LY294002 or celecoxib, with DLD-I showing the greatest sensitivity to reversal and COLO-23 showing the least effect. The effects of 5 -FU and oxaliplatin were inconsistent.
- FIG. 9C is a histogram showing that all of the cell lines demonstrate a decrease in recurrence score post-treatment, indicating a reversal of the high-risk phenotype after exposure to LY294002 or celecoxib, with DLD-I showing the greatest sensitivity to reversal and COLO-23 showing the least effect.
- COX2 and PBkinase inhibitors are valuable as initial agents for treating early stage colon cancers at high risk of recurrence.
- the inventors have discovered a method for identifying those colon cancers, suitably early stage colon cancers, which are likely to recur using gene expression analysis as described below.
- the analysis allows classification of the cancer into a low risk of recurrence versus a high risk of recurrence.
- Treatment plans including administration of chemotherapeutic agents may be developed for those with a high risk of recurrence.
- the inventors identified gene expression patterns within colonic tumors or cell lines that predict which cancers are likely to recur after surgical resection.
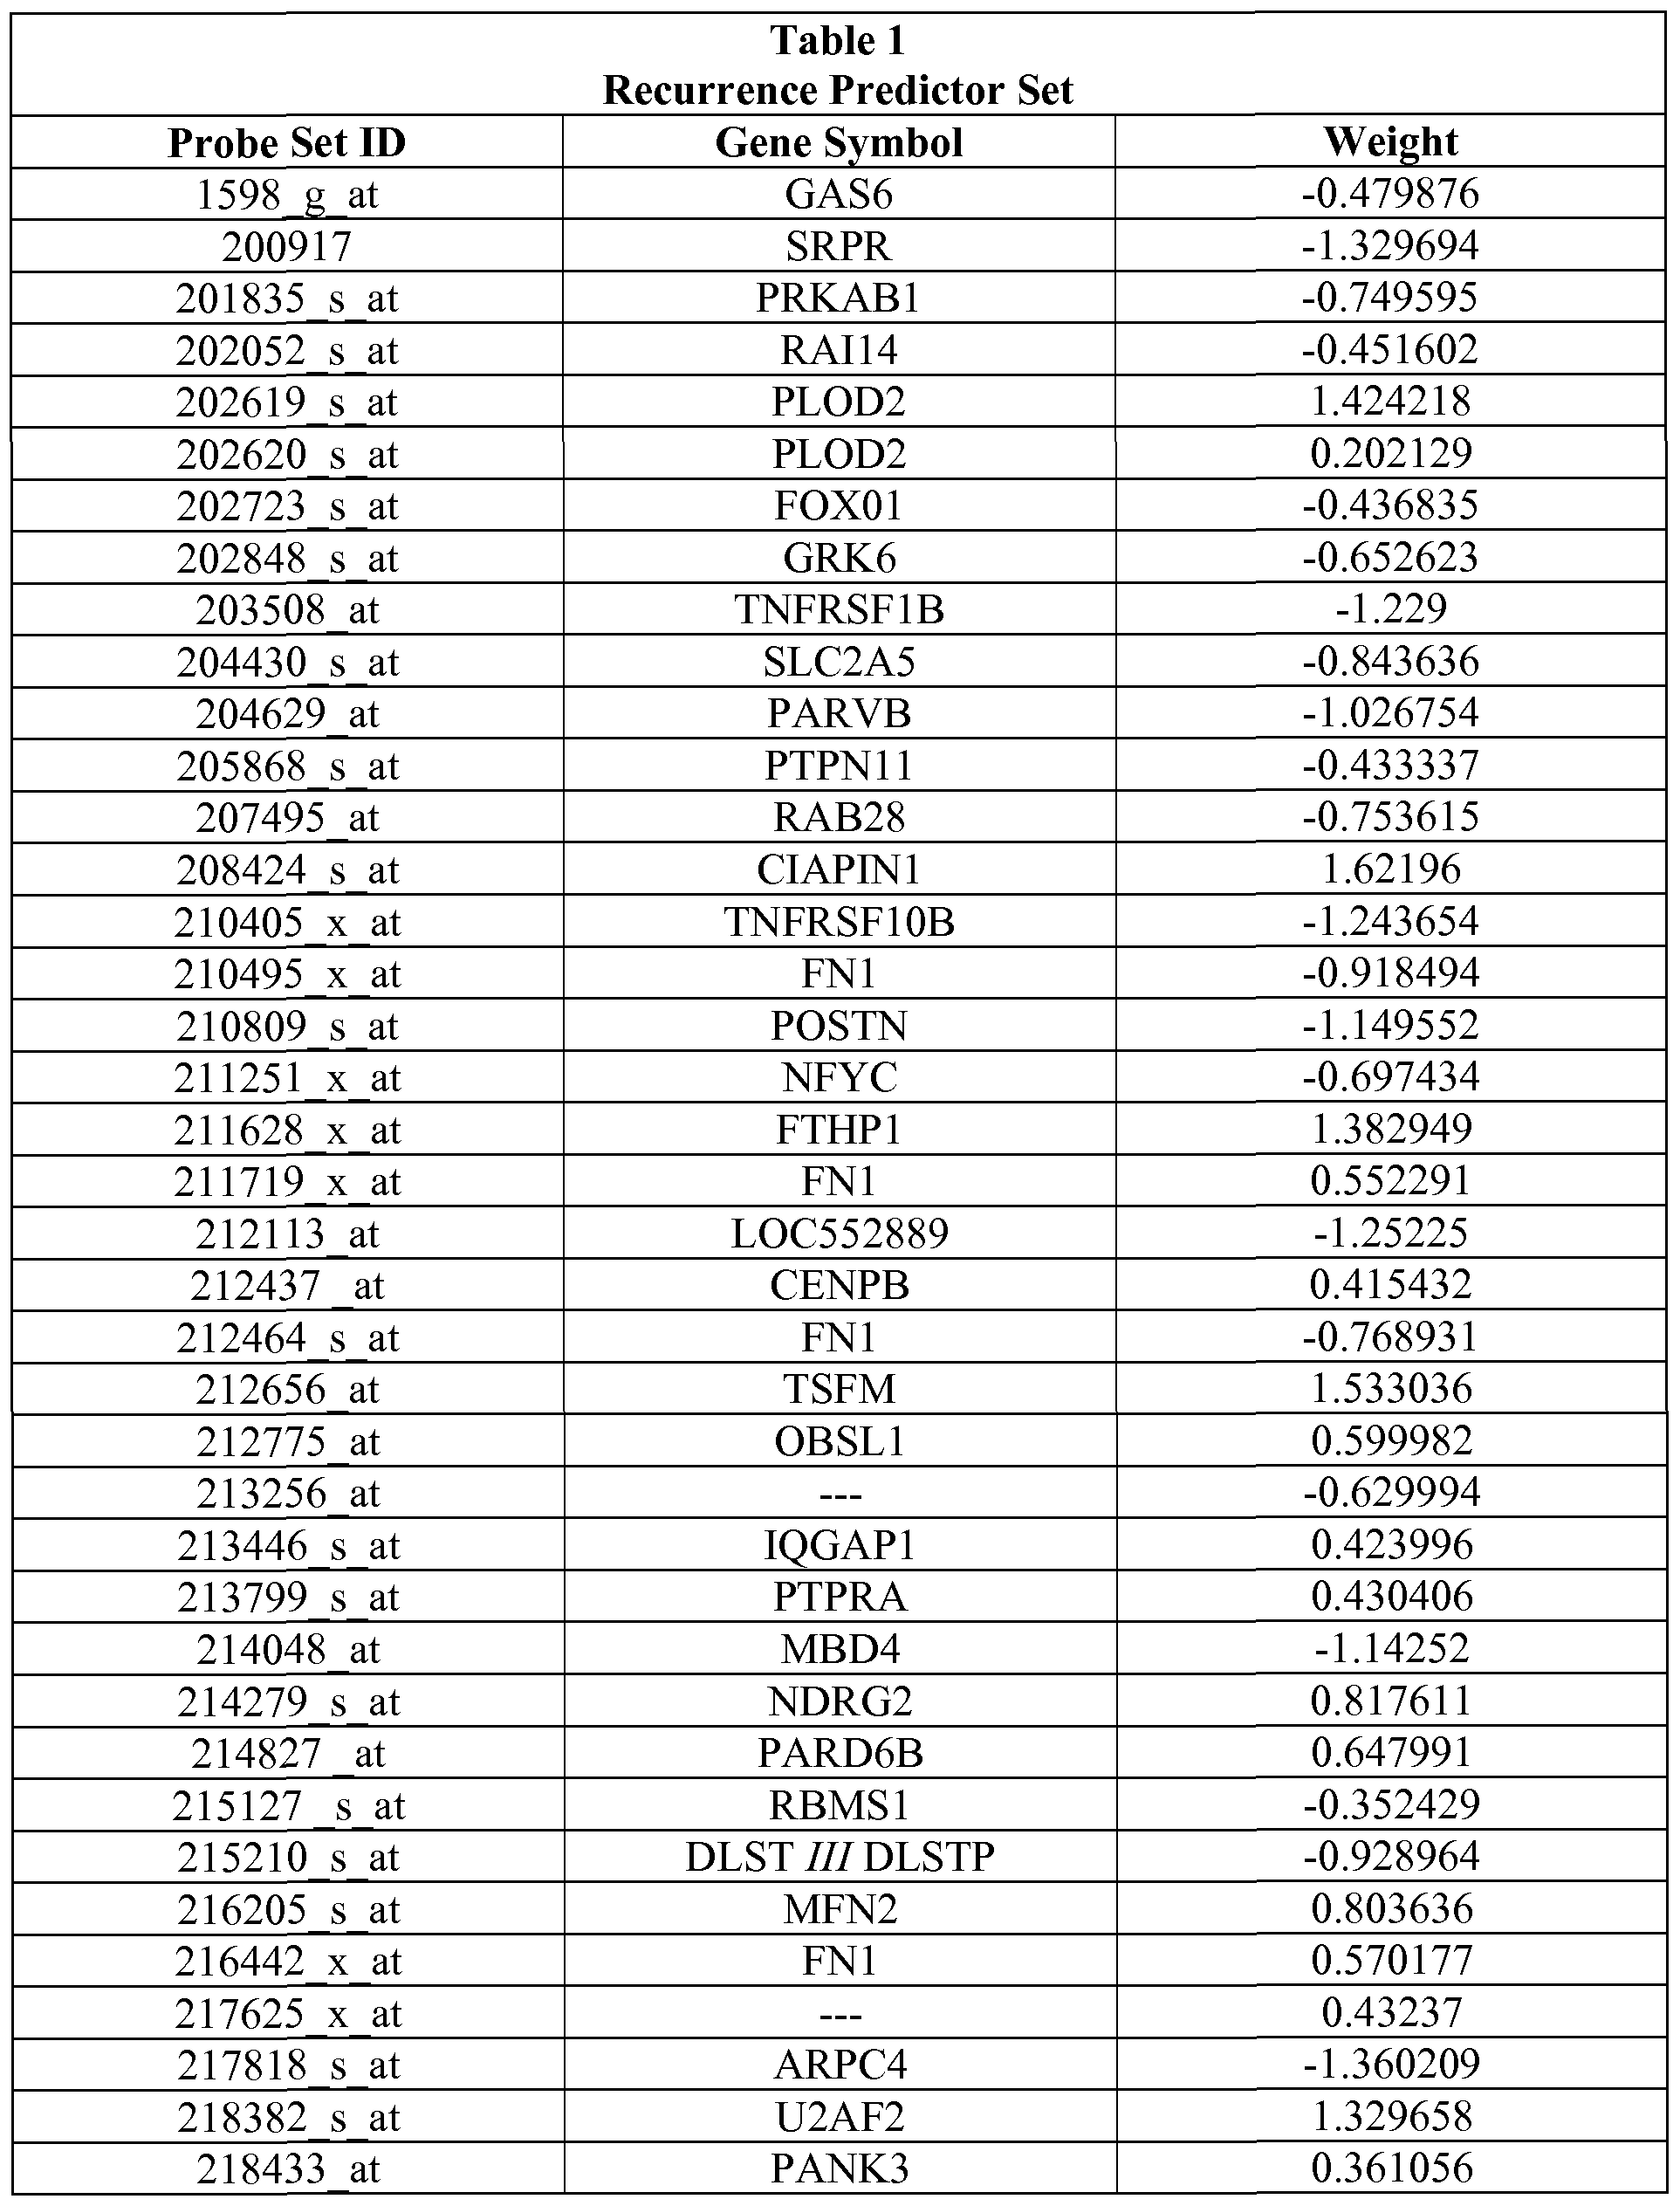
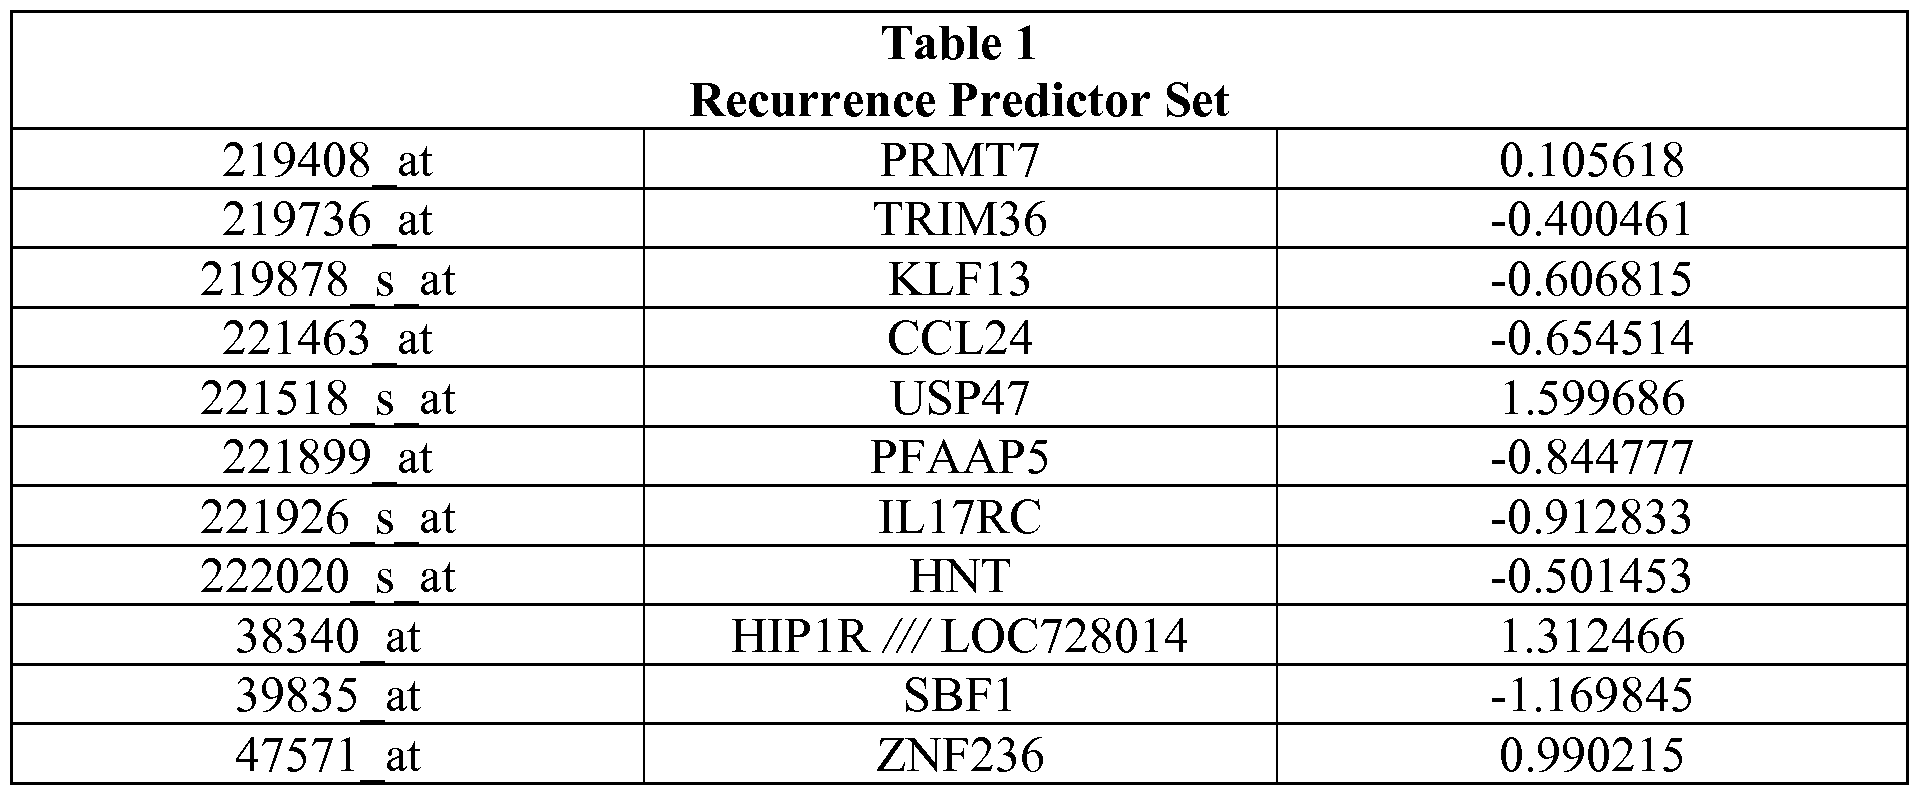
- the recurrence predictor set developed from these studies is provided in Table 1. These predictions may be used to develop treatment plans for individual cancer patients. For example, those patients whose tumors are likely to recur may be treated with chemotherapeutic agents after surgery to prevent recurrence.
- the invention also provides integrating gene expression profiles that predict recurrence with administration of chemotherapeutic agents as a strategy for developing personalized treatment plans for individual patients. Treatment plans may result in individuals having a complete response, a partial response or an incomplete response as defined below. Treatment plans may result in treatment of the cancer as described below.
- a “complete response” (CR) to treatment of cancer is defined as a complete disappearance of all measurable and assessable disease. Complete responders show no signs of cancer recurrence after seven years. An individual who exhibits a complete response is known as a "complete responder.”
- IR incomplete response
- PR partial response
- SD stable disease
- PD progressive disease
- An incomplete response includes individuals in which the colon cancer recurs.
- Effective amount refers to an amount of a chemotherapeutic agent that is sufficient to treat the cancer.
- An effective amount may exert a prophylactic or therapeutic effect in the subject, i.e., that amount which will stop or reduce the growth of the cancer or cause the cancer to become smaller in size compared to the cancer before treatment or compared to a suitable control or that stops recurrence of the cancer after treatment e.g., surgical resection, chemotherapy or radiation therapy.
- an effective amount will be known or understood or can be determined by those skilled in the art.
- the result of administering an effective amount of a chemotherapeutic agent may lead to effective treatment of the patient.
- an effective amount is an amount sufficient to exert cytotoxic effects on cancerous cells.
- Predicting and “prediction” as used herein includes, but is not limited to, generating a statistically based indication of whether a particular cancer such as a colon cancer is likely to recur after treatment, e.g., surgical resection and further whether a chemotherapeutic agent will be effective to prevent recurrence and/or treat the cancer. This does not mean that the event will happen with 100% certainty.
- a “patient” refers to an “individual” who is under the care of a treating physician.
- the present invention may be practiced using any suitable technique, including techniques known to those skilled in the art. Such techniques are available in the literature or in scientific treatises, such as Molecular Cloning: A Laboratory Manual, second edition (Sambrook et al., 1989) and Molecular Cloning: A Laboratory Manual, third edition (Sambrook and Russel, 2001), (jointly referred to herein as "Sambrook); Current Protocols in Molecular Biology (F. M.
- Methods of staging cancers, predicting aggressiveness and predicting the likelihood of recurrence of a cancer are provided herein. Specifically, the methods rely on using a comparison of a gene expression profile of the cancer to a recurrence predictor set of gene expression profiles to predict the likelihood of recurrence of cancer after surgical resection.
- the recurrence predictor set is, or may be derived from, a set of gene expression profiles obtained from control samples.
- the controls samples may be cell lines, tumor samples, etc. with a known recurrence phenotype.
- the comparison of the expression of a specific set of genes in the cancer to the same set of genes in samples known to recur or not to recur allows prediction of the likelihood of recurrence of the cancer.
- the prediction may indicate that the cancer is unlikely to recur or it may predict that the cancer may recur.
- the method may also provide an indication of how likely the cancer is to recur without chemotherapeutic intervention.
- the methods described herein provide an indication of whether the cancer in the patient is likely to recur or not after primary treatment such as surgical resection, chemotherapy or radiation therapy.
- the prediction may be more accurate than predictions made using population-based approaches from clinical studies which have been used to stage colon cancers.
- the methods allow identification of cancers estimated to require further medical intervention so that the patients with these cancers are treated with chemotherapeutics after surgical resection.
- the methods also may identify which chemotherapeutic agent may be most useful. This results in a more cost-effective, targeted therapy for the cancer patient and avoids side effects from chemotherapeutic agents for patients with cancers that are not likely to recur.
- Table 1 also provides the relative "weights" of each of the individual genes that make up the recurrence predictor set.
- the weights demonstrate that some genes are more strongly indicative of recurrence of a cancer. Predictions based on the complete set of genes are expected to provide the most accurate predictions regarding likelihood of the cancer recurring. Those of skill in the art will understand based on the weights of each gene in the recurrence predictor set that some genes are more predictive of outcome than others and thus that the entire recurrence predictor set need not be used to develop a useful prediction.
- a treatment plan can be developed incorporating chemotherapeutic agents for individuals with cancers likely to recur.
- the recurrence predictor may be used to predict responsiveness to chemotherapeutic agents and an effective amount of the chemotherapeutic agent(s) may be administered to the individual with the cancer.
- the methods do not guarantee that the individuals will be responsive to the selected chemotherapeutic agent or that such treatment will stop recurrence, but the methods will increase the probability that the selected treatment will be effective to treat the cancer.
- combination therapy is often suitable.
- Treatment or treating a cancer includes, but is not limited to, reduction in cancer growth or tumor burden, enhancement of an anti-cancer immune response, induction of apoptosis of cancer cells, inhibition of angiogenesis, enhancement of cancer cell apoptosis, inhibition of metastases or inhibition of recurrence.
- Administration of an effective amount of a chemotherapeutic agent to a subject may be carried out by any means known in the art including, but not limited to, intraperitoneal, intravenous, intramuscular, subcutaneous, transcutaneous, oral, nasopharyngeal or transmucosal absorption.
- the specific amount or dosage administered in any given case will be adjusted in accordance with the specific cancer being treated, the condition, including the age and weight, of the subject, and other relevant medical factors known to those of skill in the art.
- the sample of the cancer used to determine the expression levels of a set of genes may be directly from a tumor that was surgically removed.
- the sample of the cancer could be from cells obtained in a biopsy or other tumor sample such as by aspiration or other methods available to those skilled in the art.
- RNA e.g., total RNA
- microarray Affymetrix Human Ul 33 A chip.
- RT-PCR RT-PCR
- microarrays include, but are not limited to, Stratagene (e.g., Universal Human Microarray), Genomic Health (e.g., Oncotype DX chip), Clontech (e.g., AtlasTM Glass Microarrays), and other types of Affymetrix microarrays.
- the microarray may be made by a researcher or obtained from an educational institution.
- customized microarrays which include the particular set of genes that are particularly suitable for prediction, can be used.
- the expression profile of the set of genes may be obtained by any other means, including those known to those of skill in the art, e.g., Northern blots, real time rt-PCR, Western blots for the expressed proteins or protein assays.
- the reference may be a set of cancer cells with known recurrence phenotype, a set of samples obtained from patients with known recurrence phenotype, or a numerical algorithm capable of predicting recurrence phenotype based on data obtained from such references.
- Table 1 describes the recurrence predictor set. Development of the recurrence predictor set described herein is provided in the Examples. The use of the recurrence predictor set of genes in its entirety is contemplated; however, it is also possible to use subsets of the predictor set.
- a subset of at least 2, 5, 10, 15, 20, 25, 30, 35 or 40 or more genes from Table 1 can be used for predictive purposes.
- 10, 15, 20, 25, 30, 35, 40, 45, or 50 genes from Table 1 could be used as a recurrence predictor set. Indeed any number of the genes could be used in a predictor set.
- Table 1 also provides the weights of each gene in the predictor set. The weight indicates how tightly correlated the expression of the gene is with recurrence or lack thereof by the cancer. Numbers farther from 0 are more predictive than those close to 0.
- recurrence predictor set as detailed in the Examples to predict whether an individual or patient with cancer is likely to have recurrent cancer. If the individual has cancer likely to recur, then a treatment plan may be designed in which therapeutic agents will be administered in an effective amount after surgical resection of the cancer. If cancer is predicted to be unlikely to recur than chemotherapy may be unnecessary.
- a treatment plan may be designed in which therapeutic agents will be administered in an effective amount after surgical resection of the cancer. If cancer is predicted to be unlikely to recur than chemotherapy may be unnecessary.
- the expression profile of the genes in the cancer may be useful in determining which chemotherapeutic agents may be effective. As demonstrated in the Examples, the genes in the recurrence predictor set may be used to predict which chemotherapeutic agents are effective.
- the gene expression profile of the cancer may be tested against additional predictor sets to allow development of a treatment plan with the best likelihood of treating the individual with the cancer.
- an individual testing for a high likelihood of recurrence can be evaluated for responsiveness to one or more chemotherapeutic agents. See U.S. Patent Publication Nos. 20070172844, 20070294067, 20090186024 and 20090105167, each of which is incorporated herein by reference in its entirety.
- the methods are performed outside of the human body.
- Example cancers with a high likelihood of recurrence were further treated with a chemotherapeutic agent.
- the genes in the recurrence predictor set were also correlated with susceptibility to certain chemotherapeutic agents, such that these agents may be more effective than others to treat these recurrent cancers.
- the agents identified include a retinal analog, (Tetinon) a PI3K inhibitor (LY-294002), sulindae and a Cox inhibitor (celecoxib).
- High recurrence risk cell lines treated with these agents demonstrated increased sensitivity to these agents as compared to chemotherapeutic agents currently used clinically for colon cancer, namely 5-FU and oxaliplatin.
- the expression of genes within the recurrence predictor set in a cancer may be used to develop a treatment plan for an individual with cancer. Those skilled in the art can determine dosages and treatment regimes for individuals.
- the teachings herein provide a gene expression model that predicts recurrence of colon cancer.
- the Examples provide evidence that recurrent cancers may be treated by administrating chemotherapeutic agents after surgical resection.
- the gene expression model was developed by using Bayesian binary regression analysis to identify genes highly correlated with recurrence.
- the developed models were validated in a leave -one-out cross validation.
- the methods described herein also include treating an individual afflicted with cancer.
- This method involves administering an effective amount of a chemotherapeutic agent to those individuals predicted to have recurrent cancer.
- a chemotherapeutic agent is administered in an effective amount after surgical resection.
- the therapeutic agent is administered before or concurrently with surgical resection.
- One aspect of the invention provides a method for predicting, estimating, aiding in the prediction of, or aiding in the estimation of, the likelihood of cancer recurrence in a subject afflicted with cancer.
- the methods of the application are performed outside of the human body.
- One method comprises (a) determining the expression level of multiple genes in a tumor sample from the subject; (b) defining the value of one or more metagenes from the expression levels of step (a), wherein each metagene is defined by extracting a single dominant value using singular value decomposition (SVD) from a recurrence predictor set; and (c) averaging the predictions of one or more statistical tree models applied to the values of the metagenes, wherein each model includes one or more nodes, each node representing a metagene, each node including a statistical predictive probability of tumor sensitivity to the therapeutic agent, thereby estimating the likelihood of cancer recurrence in a subject afflicted with cancer.
- SSD singular value decomposition
- Another method comprises (a) determining the expression level of multiple genes in a tumor sample from the subject; (b) defining the value of one or more metagenes from the expression levels of step (a), wherein each metagene is defined by extracting a single dominant value using singular value decomposition (SVD) from a recurrence predictor set; and (c) averaging the predictions of one or more binary regression models applied to the values of the metagenes, wherein each model includes a statistical predictive probability of tumor recurrence thereby estimating the likelihood of cancer recurrence in a subject afflicted with colon cancer.
- SSD singular value decomposition
- the methods predict the likelihood of cancer recurrence in a subject afflicted with cancer with at least 60% accuracy. In another embodiment, the methods predict the likelihood of cancer recurrence in a subject afflicted with cancer with at least 70% accuracy. In another embodiment, the methods predict the likelihood of cancer recurrence in a subject afflicted with cancer with at least 80% accuracy. In another embodiment, the methods predict the likelihood of cancer recurrence in a subject afflicted with cancer with at least 90% accuracy. In another embodiment, the methods predict the likelihood of cancer recurrence in a subject afflicted with cancer with at least 60%, 70%, 75%, 80%, 85%, 90% or 95% accuracy when tested against a validation sample.
- the methods predict the efficacy of a therapeutic agent in treating a subject afflicted with cancer with at least 60%, 70%, 75%, 80%, 85%, 90% or 95% accuracy when tested against a set of training samples.
- the methods predict the likelihood of cancer recurrence in a subject afflicted with cancer with at least 60%, 70%, 75%, 80%, 85%, 90% or 95% accuracy when tested on human primary tumors ex vivo or in vivo.
- Accuracy is the ability of the methods to predict whether a cancer will recur or not.
- the methods predict the likelihood of cancer recurrence in a subject with cancer with at least 60%, 70%, 75%, 80%, 85%, 90%, 95%, 97%, 98%, 99% or 100% sensitivity.
- the methods predict the likelihood of cancer recurrence in a subject afflicted with cancer with at least 60%, 70%, 75%, 80%, 85%, 90%, 95%, 97%, 98%, 99% or 100% sensitivity when tested against a validation sample.
- the methods predict the likelihood of cancer recurrence in a subject afflicted with cancer with at least 60%, 70%, 75%, 80%, 85%, 90%, 95%, 97%, 98%, 99% or 100% sensitivity when tested against a set of training samples.
- the methods predict the likelihood of cancer recurrence in a subject afflicted with cancer with at least 60%, 70%, 75%, 80%, 85%, 90%, 95%, 97%, 98%, 99% or 100% sensitivity when tested on human primary tumors ex vivo or in vivo. Sensitivity measures the ability of the methods to predict all cancers that will recur.
- the methods comprise determining the expression level of genes in a tumor sample from the subject. In one embodiment, the methods comprise the step of surgically removing a tumor sample from the subject, obtaining a tumor sample from the subject, or providing a tumor sample from the subject.
- the sample may be derived from cells from the cancer, or cancerous cells.
- the sample may contain nucleic acids from the cancer. Any method may be used to remove the sample from the patient and prepare nucleic acids or proteins for expression analysis. In one embodiment, at least 40%, 50%, 60%, 70%, 80% or 90% of the cells in the sample are cancer cells. In preferred embodiments, samples having greater than 50% cancer cell content are used.
- the sample is a live tumor sample. In another embodiment, the sample is a frozen sample. In one embodiment, the sample is one that was frozen within less than 5, 4, 3, 2, 1, 0.75, 0.5, 0.25, 0.1, or 0.05 hours after extraction from the patient. Frozen samples include those stored in liquid nitrogen or at a temperature of about -80 0 C or below.
- the expression of the genes may be determined using any method known in the art for assaying gene expression. Gene expression may be determined by measuring mRNA or protein levels for the genes. In one embodiment, an mRNA transcript of a gene may be detected for determining the expression level of the gene. Based on the sequence information provided by the GenBank TM database entries, the genes can be detected and expression levels measured using techniques well known to one of ordinary skill in the art, including but not limited to rtPCR, Northern blot analysis and microarray analysis. For example, sequences within the sequence database entries corresponding to polynucleotides of the genes can be used to construct probes for detecting mRNAs by, e.g., Northern blot hybridization analyses.
- the hybridization of the probe to a gene transcript in a subject biological sample can be also carried out on a DNA array.
- the use of an array is suitable for detecting the expression level of a plurality of the genes.
- the sequences can be used to construct primers for specifically amplifying the polynucleotides in, e.g., amplification-based detection methods such as reverse-transcription based polymerase chain reaction (RT-PCR).
- RT-PCR reverse-transcription based polymerase chain reaction
- mRNA levels can be assayed by quantitative RT-PCR.
- the expression level of the genes can be analyzed based on the biological activity or quantity of proteins encoded by the genes. Methods for determining the quantity of the protein include immunoassay methods such as Western blot analysis.
- the targets for Affymetrix DNA microarray analysis were prepared according to the manufacturer's instructions.
- determining the expression level (or obtaining a first gene expression profile) of multiple genes in a tumor sample from the subject comprises extracting nucleic acids from the sample from the subject.
- the nucleic acid sample is an mRNA sample.
- the expression level of the nucleic acid is determined by hybridizing the nucleic acid, or amplification products thereof, to a DNA microarray. Amplification products may be generated, for example, with reverse transcription, optionally followed by PCR amplification of the products.
- the predictive methods of the invention comprise determining the expression level of all the genes in the cluster that define the recurrence metagene. In one embodiment, the predictive methods of the invention comprise determining the expression level of at least 50%, 60%, 70%, 80%, 90%, 95%, 98%, 99% of the genes in each of the clusters that defines the colon cancer recurrence metagene.
- a metagene is a cluster or set of genes which may be used to predict the likelihood of recurrence of a cancer.
- At least 50%, 60%, 70%, 80%, 90%, 95%, 98%, 99% of the genes whose expression levels are used in order to predict recurrence are genes listed in Table 1.
- At least 50%, 60%, 70%, 80%, 90%, 95%, 98%, 99% of the genes listed in Table 1 are used to predict recurrence of a cancer.
- Table 1 shows the genes in the cluster that are used to define metagenes and indicate the likelihood of recurrence.
- the predictive methods of the invention comprise defining the value of one or more metagenes from the expression levels of the genes.
- a metagene value is defined by extracting a single dominant value from a cluster of genes associated with the likelihood of recurrence of the cancer.
- the dominant single value is obtained using single value decomposition (SVD).
- the cluster of genes of each metagene or at least of one metagene comprises at least 3, 4, 5, 6, 7, 8, 9, 10, 12, 15, 18, 20 or 25 genes.
- the predictive methods of the invention comprise defining the value of at least one metagene wherein the genes in the cluster of genes from which the metagene is defined, share at least 50%, 60%, 70%, 80%, 90%, 95% or 98% of genes in common to the genes in Table 1. In one embodiment, the predictive methods of the invention comprise defining the value of at least two metagenes, wherein the genes in the cluster of genes from which each metagene is defined share at least 50%, 60%, 70%, 80%, 90%, 95% or 98% of genes in common to the genes in Table 1.
- the predictive methods of the invention comprise defining the value of a metagene from a cluster of genes, wherein at least 2, 3, 4, 5, 6, 7, 8, 9, 10, 11, 12, 13, 14, 15, 16, 17, 18, 19 or 20 genes in the cluster are selected from the genes listed in Table 1.
- the clusters of genes that define each metagene were identified using supervised classification methods of analysis as previously described. See, for example, West, M. et al. Proc Natl Acad Sci USA 98, 11462-11467 (2001).
- the dominant principal components from such a set of genes defines a relevant phenotype-related metagene, and regression models, such as binary regression models, were used to assign the relative probability of recurrence of the cancer.
- the methods comprise averaging the predictions of one or more statistical tree models applied to the metagene values, wherein each model includes one or more nodes, each node representing a metagene, each node including a statistical predictive probability of recurrence of the cancer.
- the statistical tree models may be generated using the methods described herein for the generation of tree models. General methods of generating tree models may also be found in the art (See for example Pitman et al, Biostatistics 2004;5:587-601; Denison et al. Biometrika 1999;85:363-77; Nevins et al. Hum MoI Genet 2003;12:R153-7; Huang et al.
- the methods comprise deriving a prediction from a single statistical tree model, wherein the model includes one or more nodes, each node representing a metagene, each node including a statistical predictive probability of recurrence of the cancer.
- the tree may comprise at least 2, 3, 4, or 5 nodes.
- the methods comprise averaging the predictions of one or more statistical tree models applied to the metagene values, wherein each model includes one or more nodes, each node representing a metagene, each node including a statistical predictive probability of recurrence of the cancer. Accordingly, the invention provides methods that use mixed trees, where a tree may contain at least two nodes, where each node represents a metagene representative of the likelihood of cancer recurrence.
- the statistical predictive probability was derived from a Bayesian analysis.
- the Bayesian analysis included a sequence of Bayes factor based tests of association to rank and select predictors that define a node binary split, the binary split including a predictor/threshold pair.
- Bayesian analysis is an approach to statistical analysis that is based on the Bayes law, which states that the posterior probability of a parameter p is proportional to the prior probability of parameter p multiplied by the likelihood of p derived from the data collected.
- This methodology represents an alternative to the traditional (or frequentist probability) approach: whereas the latter attempts to establish confidence intervals around parameters, and/or falsify a-priori null-hypotheses, the Bayesian approach attempts to keep track of how a priori expectations about some phenomenon of interest can be refined, and how observed data can be integrated with such a priori beliefs, to arrive at updated posterior expectations about the phenomenon.
- Bayesian analysis has been applied to numerous statistical models to predict outcomes of events based on available data. These include standard regression models, e.g. binary regression models, as well as to more complex models that are applicable to multi-variate and essentially non-linear data. Another such model is commonly known as the tree model which is essentially based on a decision tree.
- Decision trees can be used in clarification, prediction and regression.
- a decision tree model is built starting with a root mode, and training data partitioned to what are essentially the "children" nodes using a splitting rule. For instance, for clarification, training data contains sample vectors that have one or more measurement variables and one variable that determines that class of the sample.
- Various splitting rules may be used.
- a statistical predictive tree model to which Bayesian analysis is applied may consistently deliver accurate results with high predictive capabilities. Other statistical models known to those of skill in the art may be used.
- Gene expression signatures that reflect the activity of a given pathway may be identified using supervised classification method of analysis previously described (e.g., West, M. et al. Proc Natl Acad Sci USA 98, 11462-11467, 2001).
- the analysis selects a set of genes whose expression levels are most highly correlated with the classification of tumor samples into likely to recur versus unlikely to recur.
- the dominant principal components from such a set of genes then defines a relevant phenotype-related metagene, and regression models assign the relative probability of recurrence of the cancer.
- each statistical tree model generated by the methods described herein comprises 2, 3, 4, 5, 6 or more nodes.
- the resulting model predicts cancer recurrence with at least 60%, 70%, 80%, 85%, or 90% or higher accuracy.
- the model predicts cancer recurrence with greater accuracy than clinical variables.
- the clinical variables are selected from age of the subject, gender of the subject, tumor size of the sample, stage of cancer disease and histological subtype of the sample.
- the cluster of genes that define each metagene comprise at least 3, 4, 5, 6, 7, 8, 9, 10, 12 or 15 genes.
- the correlation-based clustering is Markov chain correlation-based clustering or K-means clustering.
- arrays can contain the profiles of 5, 10, 15, 20, 25, 30, 40, 50, 75, 100, 150, 200 or more genes as disclosed in Table 1. Accordingly, arrays for detection of recurrence can be customized for diagnosis or treatment of colon cancer.
- the array can be packaged as part of kit comprising the customized array itself and a set of instructions for how to use the array to determine an individual's likelihood of recurrence.
- reagents and kits for practicing one or more of the above described methods.
- the subject reagents and kits thereof may vary greatly.
- Reagents of interest include reagents specifically designed for use in production of the above described metagene values.
- One type of such reagent is an array probe of nucleic acids, such as a DNA chip, in which the genes defining the metagenes in the recurrence predictive tree models are represented.
- array probe of nucleic acids such as a DNA chip
- a variety of different array formats are known in the art, with a wide variety of different probe structures, substrate compositions and attachment technologies.
- Representative array structures of interest include those described in U.S. Pat. Nos.
- DNA chip is conveniently used to compare the expression levels of a number of genes at the same time.
- DNA chip-based expression profiling can be carried out, for example, by the method as disclosed in "Microarray Biochip Technology" (Mark Schena, Eaton Publishing, 2000).
- a DNA chip comprises immobilized high-density probes to detect a number of genes.
- the expression levels of many genes can be estimated at the same time by a single-round analysis.
- the expression profile of a specimen can be determined with a DNA chip.
- a DNA chip may comprise probes, which have been spotted thereon, to detect the expression level of the metagene-defining genes of the present invention, i.e. the genes described in Table 1.
- a probe may be designed for each marker gene selected, and spotted on a DNA chip.
- Such a probe may be, for example, an oligonucleotide comprising 5-50 nucleotide residues. Methods for synthesizing such oligonucleotides on DNA chips are known to those skilled in the art. Longer DNAs can be synthesized by PCR or chemically.
- Methods for spotting long DNA, which is synthesized by PCR or the like, onto a glass slide are also known to those skilled in the art.
- a DNA chip that is obtained by the methods described above can be used for estimating the recurrence of a cancer in a subject afflicted with cancer according to the present invention.
- DNA microarray and methods of analyzing data from microarrays are well- described in the art, including in DNA Microarrays: A Molecular Cloning Manual. Ed. by Bowtel and Sambrook (Cold Spring Harbor Laboratory Press, 2002); Microarraysfor an Integrative Genomics by Kohana (MIT Press, 2002); A Biologist's Guide to Analysis of DNA Micraarray Data, by Knudsen (Wiley, John & Sons, Incorporated, 2002); DNA Microarrays: A Practical Approach, Vol. 205 by Schema (Oxford University Press, 1999); and Methods of Microarray Data Analysis II, ed. by Lin et al. (Kluwer Academic Publishers, 2002) all of which are incorporated herein by reference.
- One aspect of the invention provides a kit comprising: (a) any of the gene chips described herein; and (b) one of the computer-readable mediums described herein.
- the arrays include probes for at least 2, 3, 4, 5, 6, 7, 8, 9, 10, 15, 20, 25, 30, 40, or 50 of the genes listed in Table 1.
- the number of genes that are from Table 1 that are represented on the array is at least 5, at least 10, at least 25 or at least 50, including all of the genes listed in the table.
- the subject arrays include probes for additional genes not listed in the table, in certain embodiments the number % of additional genes that are represented does not exceed about 50%, 40%, 30%, 20%, 15%, 10%, 8%, 6%, 5%, 4%, 3%, 2% or 1%.
- a great majority of genes in the collection are genes that define the metagenes of the invention, whereby great majority is meant at least about 75%, usually at least about 80% and sometimes at least about 85, 90, 95% or higher, including embodiments where 100% of the genes in the collection are metagene-defming genes.
- the arrays for use in the invention may include a majority of probes that are not listed in Table 1.
- kits of the subject invention may include the above described arrays or gene chips.
- the kits may further include one or more additional reagents employed in the various methods, such as primers for generating target nucleic acids, dNTPs and/or rNTPs, which may be either premixed or separate, one or more uniquely labeled dNTPs and/or rNTPs, such as biotinylated or Cy3 or Cy5 tagged dNTPs, gold or silver particles with different scattering spectra, or other post synthesis labeling reagent, such as chemically active derivatives of fluorescent dyes, enzymes, such as reverse transcriptases, DNA polymerases, RNA polymerases, and the like, various buffer mediums, e.g.
- hybridization and washing buffers prefabricated probe arrays, labeled probe purification reagents and components, like spin columns, etc.
- signal generation and detection reagents e,g. streptavidin-alkaline phosphatase conjugate, chemifluorescent or chemiluminescent substrate, and the like.
- the subject kits further include instructions for practicing the subject methods. These instructions may be present in the subject kits in a variety of forms, one or more of which may be present in the kit.
- One form in which these instructions may be present is as printed information on a suitable medium or substrate, e.g., a piece or pieces of paper on which the information is printed, in the packaging of the kit, in a package insert, etc.
- Yet another means would be a computer readable medium, e.g., diskette, CD, etc., on which the information has been recorded.
- Yet another means that may be present is a website address which may be used via the internet to access the information at a remote site. Any convenient means of conveying instructions may be present in the kits.
- kits also include packaging material such as, but not limited to, ice, dry ice, styrofoam, foam, plastic, cellophane, shrink wrap, bubble wrap, paper, cardboard, starch peanuts, twist ties, metal clips, metal cans, drierite, glass, and rubber.
- packaging material such as, but not limited to, ice, dry ice, styrofoam, foam, plastic, cellophane, shrink wrap, bubble wrap, paper, cardboard, starch peanuts, twist ties, metal clips, metal cans, drierite, glass, and rubber.
- the invention also contemplates computer readable media that comprises reference gene expression profiles.
- Such media can contain all or part of the gene expression profiles of the genes listed in Table 1 that comprise the recurrence predictor set.
- the media can be a list of the genes or contain the raw data for running a user's own statistical calculation, such as the methods disclosed herein.
- Another aspect of the invention provides a program product (i.e., software product) for use in a computer device that executes program instructions recorded in a computer- readable medium to perform one or more steps of the methods described herein, such as for estimating the likelihood of cancer recurrence in a subject afflicted with cancer.
- a program product i.e., software product
- One aspect of the invention provides a computer readable medium having computer readable program codes embodied therein, the computer readable medium program codes performing one or more of the following functions: defining the value of one or more metagenes from the expression levels of genes in known recurrent of non-recurrent cancers defining a metagene value by extracting a single dominant value using singular value decomposition (SVD) from a cluster of genes associated with tumor recurrence; averaging the predictions of one or more statistical tree models applied to the values of the metagenes; or averaging the predictions of one or more binary regression models applied to the values of the metagenes, wherein each model includes a statistical predictive probability of tumor recurrence.
- SSD singular value decomposition
- kits comprising the program product or the computer readable medium, optionally with a computer system.
- a system comprising: a computer; a computer readable medium, operatively coupled to the computer, the computer readable medium program codes performing one or more of the following functions: defining the value of one or more metagenes from the expression levels genes; defining a metagene value by extracting a single dominant value using singular value decomposition (SVD) from a cluster of genes associated with tumor recurrence; averaging the predictions of one or more statistical tree models applied to the values of the metagenes; or averaging the predictions of one or more binary regression models applied to the values of the metagenes, wherein each model includes a statistical predictive probability of tumor recurrence.
- SSD singular value decomposition
- the program product comprises: a recordable medium; and a plurality of computer-readable instructions executable by the computer device to analyze data from the array hybridization steps, to transmit array hybridization from one location to another, or to evaluate genome-wide location data between two or more genomes.
- Computer readable media include, but are not limited to, CD-ROM disks (CD-R, CD-RW), DVD-RAM disks, DVD-RW disks, floppy disks and magnetic tape.
- kits comprising the program products described herein.
- kits may also optionally contain paper and/or computer-readable format instructions and/or information, such as, but not limited to, information on DNA microarrays, on tutorials, on experimental procedures, on reagents, on related products, on available experimental data, on using kits, on chemotherapeutic agents including their toxicity, and on other information.
- the kits optionally also contain in paper and/or computer-readable format information on minimum hardware requirements and instructions for running and/or installing the software.
- the kits optionally also include, in a paper and/or computer readable format, information on the manufacturers, warranty information, availability of additional software, technical services information, and purchasing information.
- kits optionally include a video or other viewable medium or a link to a viewable format on the internet or a network that depicts the use of the software, and/or use of the kits.
- the kits also include packaging material such as, but not limited to, styrofoam, foam, plastic, cellophane, shrink wrap, bubble wrap, paper, cardboard, starch peanuts, twist ties, metal clips, metal cans, drierite, glass, and rubber.
- the analysis of data, as well as the transmission of data steps, can be implemented by the use of one or more computer systems. Computer systems are readily available.
- the processing that provides the displaying and analysis of image data for example can be performed on multiple computers or can be performed by a single, integrated computer or any variation thereof.
- the components contained in the computer system are those typically found in general purpose computer systems used as servers, workstations, personal computers, network terminals, and the like. In fact, these components are intended to represent a broad category of such computer components that are well known in the art.
- a general purpose computer system for performing the functions of the software according to an illustrative embodiment of the invention includes a central processing unit (CPU), a memory, and an interconnect bus.
- the CPU may include a single microprocessor or a plurality of microprocessors for configuring computer system as a multi-processor system.
- the memory illustratively includes a main memory and a read only memory.
- the computer also includes the mass storage device 1508 having, for example, various disk drives, tape drives, etc.
- the main memory also includes dynamic random access memory (DRAM) and high-speed cache memory. In operation, the main memory stores at least portions of instructions and data for execution by the CPU.
- DRAM dynamic random access memory
- the mass storage may include one or more magnetic disk or tape drives or optical disk drives, for storing data and instructions for use by the CPU.
- At least one component of the mass storage system preferably in the form of a disk drive or tape drive, stores one or more databases, such as databases containing of transcriptional start sites, genomic sequence, promoter regions, or other information.
- the mass storage system may also include one or more drives for various portable media, such as a floppy disk, a compact disc read only memory (CD-ROM), or an integrated circuit non-volatile memory adapter (i.e., PC-MCIA adapter) to input and output data and code to and from the computer system.
- portable media such as a floppy disk, a compact disc read only memory (CD-ROM), or an integrated circuit non-volatile memory adapter (i.e., PC-MCIA adapter) to input and output data and code to and from the computer system.
- CD-ROM compact disc read only memory
- PC-MCIA adapter integrated circuit non-volatile memory adapter
- the computer system may also include one or more input/output interfaces for communications, shown by way of example, as interface for data communications via a network.
- the data interface may be a modem, an Ethernet card or any other suitable data communications device.
- the data interface may provide a relatively high-speed link to a network, such as an intranet, internet, or the
- the communication link to the network may be, for example, optical, wired, or wireless (e.g., via satellite or cellular network).
- the computer system may include a mainframe or other type of host computer system capable of Web-based communications via the network.
- the computer system also includes suitable input/output ports or use the interconnect bus for interconnection with a local display and keyboard or the like serving as a local user interface for programming and/or data retrieval purposes.
- server operations personnel may interact with the system for controlling and/or programming the system from remote terminal devices via the network.
- probes (202619_s_at and 202620_s_at) that represent splice variants for PLOD2.
- RT-PCR validation of the top 10 differentially expressed candidate genes demonstrated that 9 of 10 genes (all except HNT) identified to be most differentially expressed in our genomic model could also be validated by using RT-PCR (FIG. 6).
- FOG. 6 RT-PCR
- Recurrence Signature Identifies Therapeutic Opportunities.
- Using gene expression methodologies to understand the molecular mechanisms involved in cancer progression may be helpful beyond prognosis because this knowledge may lead to the study of drugs that target relevant, deregulated pathways in an individual patient. More importantly, we may be able to identify specific, effective agents from a repertoire of currently existing drugs.
- Connectivity Map a project developed at the Broad Institute, to assemble a reference collection of gene-expression profiles from cells that have been treated with a variety of drugs. This effort established links between gene expression profiles and drugs (20).
- Connectivity Map a project developed at the Broad Institute, to assemble a reference collection of gene-expression profiles from cells that have been treated with a variety of drugs. This effort established links between gene expression profiles and drugs (20).
- 9A shows the stratification of the cell lines by recurrence score and their respective mutational events [KRAS, p53, BRAF, PI3K, CTNNB2 (beta-catenin), APC and CDKN2A], demonstrating that the risk categories determined by our model of recurrence do not segregate based on any one mutation and simulates the genetic heterogeneity seen in clinical practice.
- DWD Distance-Weighted Discrimination
- a probit function enabled us to generate a probability of recurrence for each sample, referred to as the "Recurrence Score.”
- An optimal threshold recurrence score value of 0.76 was chosen based on a receiver operated characteristic (ROC) analysis, and was used as the predefined 'cut-point', to dichotomize samples into low risk (Recurrence Score ⁇ 0.76) and high risk (Recurrence Score > 0.76).
- RNA extracted from each of the seven high risk and seven low risk cell lines are reverse transcribed into cDNA by using random primers.
- Taqman gene expression assays including 18s used as the manufacturing control
- gene targets were analyzed by assessing Ct values after normalization to GAPDH to compare quantitative expression values. Further details on patient selection, RNA extraction, preprocessing of gene expression data, and statistical analysis are available as SI Methods .
- This training set was further filtered based on P values obtained from multiple t tests, and 91 specific genes with significant survival effects (P ⁇ 0.001) were selected for Bayesian binary regression analyses.
- Bayesian fitting of binary probit regression models to the training data then permits an assessment of the relevance of the metagene signatures in within-sample classification, and estimation and uncertainty assessments for the binary regression weights mapping metagenes to probabilities.
- a metagene predictor consisting of 50 genes was developed using the aforementioned methodologies.
- GATHER http://gather.genome.duke-.edu/
- GATHER is a tool that integrates various forms of available metadata to elucidate the biological context within molecular signatures produced from high-throughput data.
- GATHER also has the capacity to discover novel functions of gene groups by integrating annotations from evolutionary homologs and other genes related through protein interactions or literature networks.
- GATHER further annotates the characteristics of the genes with respect to data sets from multiple systems, helping synthesize evidence to develop or reinforce hypotheses.
- the accuracy with which GATHER can infer novel functions of signatures is interpreted through a Bayesian statistical model.
- an optimal threshold recurrence score value of 0.76 was chosen based on a receiver operated characteristic (ROC) analysis, and was used as the predefined 'cut-point', to dichotomize samples into low risk (Recurrence Score ⁇ 0.76) and high risk (Recurrence Score ⁇ 0.76).
- ROC receiver operated characteristic
- a binary probit regression model is estimated using Bayesian methods.
- the initial training set and the validation sets (obtained from refs. 1 and 2) were normalized using the DWD method.
- Standard Kaplan-Meier mortality curves and their statistical significance were generated from the predictive probability values of patients using Graph- Pad software.
- the survival curves were compared using the log-rank test. This test generates a two-tailed P value testing the null hypothesis that the survival curves are identical in the overall populations. Therefore, the null hypothesis is that the populations have no differences in survival.
- Each probe set ID in given Affymetrix gene chips were first mapped to the corresponding LocusID by parsing local copies of LocusLink and UniGene databases to identify any inherent relationship between the GenBank accession number associated with each probe set sequence and its corresponding LocusID. This was followed by matching probe sets from different gene chips that share the same LocusID.
- ComBat Method When combining data sets from different platforms and different experiments, non-biological experimental variation or "batch effects" are most commonly faced by researchers. It is inappropriate to combine data sets without adjusting for batch effects. To reduce the systematic differences from different data sets and integrate gene expression from all data sets, ComBat method (http://statistics.byu.edu/johnson/ ComBat/) was applied.
- ComBat method applies either parametric or non-parametric empirical Bayes framework for adjusting data for batch effects that is robust to outliers in a given data set.
- the location (mean) and scale (variance) model parameters are specifically estimated by pooling information across genes in each batch to shrink the batch effect parameter estimated toward the overall mean of the batch effect estimates. This method was applied to data sets consisting of normal colon samples and tumor samples separately.
- Colon Cancer Cell Lines Fourteen colon cancer cell lines (COLO- 320 HSR, DLD-I, HCTl 15, HCTl 16, HT29, LS174T, LS180, RKO, SW48, SW403, SWl 116, SW1417, SWl 463, and WiDr) that were commercially available were grown as recommended by the supplier (American Type Culture Collection).
- celecoxib was obtained from LKT Laboratories Inc.
- the LY294002 was obtained from Cayman Chemical
- the retinol, and sulindac were obtained from Sigma- Aldrich.
- 5 -FU and oxaliplatin were obtained from the Duke University pharmacy.
- To classify cell lines we measured genome-wide expression in the 14 colon cancer cell lines using the Affymetrix Ul 33 A Plus 2.0 GeneChip. Total RNA was extracted from the cells with RNeasy kits (Qiagen).
- RNA quality was assessed with the use of a bioanalyzer (Agilent 2100 model).
- Hybridization targets were prepared from the total RNA according to standard Affymetrix protocols.
- 'Recurrence Scores' were generated for the cell lines and the predefined (from the training set) threshold value was then used to dichotomize the cell lines into low and high risk phenotypes.
- In vitro cell proliferation assays were used to demonstrate the mean percent sensitivity when the highest concentration of drug (celecoxib, retinol, LY294002, sulindac, 5 -FU, and oxaliplatin) was used in each cell line as the basis for comparisons of sensitivity, between high and low recurrence risk groups, for each of the drugs tested.
- gene expression profiles were re-assessed to determine if the high-risk phenotype had been reversed.
- the cell proliferation assays for the 14 colon cancer cell lines profiled by gene array analyses included growth inhibition measurements using standard colorimetric assays. Cells were plated in 96-well assay plates at a density of 5,000 cells per well. After incubating for 24 h at 37°C, drugs were added to each well at specific concentrations. Cells were grown in the presence of drugs for an additional 96 h.
- Celecoxib was used at concentrations of 0.1, 5, 25, 50, and 100; LY294002, a PBKinase inhibitor was used at concentrations of 0.1, 1, 10, 20 and 200; retinol was used at concentrations of 0, 0.1, 1, 5, 10, and 50; sulindac was used at concentrations of 0, 0.1, 1, 10, 100, and 1,000; 5-FU and oxaliplatin were used at concentrations of 0, 0.1, 1, 5, 10, and 20. All concentrations were micromolar. Sensitivity to celecoxib, LY294002, retinol, sulindac, 5-FU, and oxaliplatin was determined by quantifying the percent reduction in growth at 96 h using the standard MTT Cell Proliferation Kit from Roche Applied Science. A Perkin-Elmer Victor 3 Multilabel Plate Reader was used to determine UV absorbance. All experiments were repeated at least three times.
- RNA was extracted using the Qiashredder and Qiagen Rneasy Mini kits. Quality of the RNA was checked by an Agilent 2100 Bioanalyzer. The targets for Affymetrix DNA microarray analysis were prepared according to the manufacturer's instructions. Biotin-labeled cRNA, produced by in vitro transcription, was fragmented and hybridized to the Affymetrix HG-Ul 33 A Plus 2.0 GeneChip arrays at 45°C for 16 h and then washed and stained using the GeneChip Fluidics.
- the arrays were scanned by a GeneArray Scanner and patterns of hybridization were detected as light emitted from the fluorescent reporter groups incorporated into the target and hybridized to oligonucleotide probes. All analyses were performed in a MIAME (minimal information about a microarray experiment)- compliant fashion, as defined in the guidelines established by MGED. RT-PCR Analysis. The top 10 differentially expressed genes from among the 50-gene model were chosen for further validation using real-time PCR. Briefly, the methods involved Taqman custom arrays, a 384-well micro fluidic card that enables 384 real-time PCR reactions to be performed simultaneously without the use of liquid-handling robots or multichannel pipettes. The array is designed for a two-step RT-PCR.
- RNA extracted from each of the seven high risk and seven low risk cell lines are reverse transcribed into cDNA using random primers from the High Capacity cDNA Reverse Transcription Kit.
- One thousand ng of total RNA were transcribed in a 25 ⁇ l reaction.
- 25 ⁇ l of RNase/DNase-free water was added.
- PCR Taqman gene expression assays (including 18 s used as the manufacturing control) were preloaded into each of the wells of the array. Sample-specific PCR mix was generated by adding 50 ⁇ l of the Taqman Universal Master Mix to the 50 ⁇ l of cDNA plus water reactions.
- WoodLD et al. (2007) The genomic landscapes ofhumanbreast and colorectal cancers. Science 318:1108-1113.
Landscapes
- Measuring Or Testing Involving Enzymes Or Micro-Organisms (AREA)
Abstract
Provided herein are methods for predicting the likelihood of recurrence of a cancer using gene expression profiles. Methods for developing treatment plans for individuals with cancer are also provided. Kits including gene chips and instructions for predicting recurrence of a cancer and computer readable media comprising recurrence information are also provided.
Description
PREDICTING CANCER RISK AND TREATMENT SUCCESS
CROSS-REFERENCE TO RELATED APPLICATIONS
This application claims the benefit of U.S. Provisional Application No. 61/119261, filed December 2, 2008, and U.S. Provisional Application No. 61/117010, filed November 21, 2008, each of which is incorporated herein by reference in its entirety.
GOVERNMENT FUNDING
This invention was made with government support under grants awarded by the National Institutes of Health and the National Cancer Institute. The government has certain rights in the invention.
BACKGROUND OF THE INVENTION
The National Cancer Institute has estimated that in the United States alone, one in three people will be afflicted with cancer. Moreover, approximately 50% to 60% of people with cancer will eventually die from the disease. Colorectal cancer is the second leading cause of cancer death in the United States. Approximately 40% of newly diagnosed cases are identified when the cancer is in an early or localized stage. The current system of clinical staging is an important prognostic tool, but provides only broad categories of risk and does not efficiently characterize the risk of recurrence or the susceptibility of the cancer to particular therapeutics. The inability to predict which cancers are likely to lead to recurrent disease and which will respond to specific therapies is a major impediment to improving outcome for colon cancer patients.
BRIEF SUMMARY OF THE INVENTION
In one aspect, methods for predicting the likelihood of recurrence of a cancer are provided. The methods are suitable for predicting recurrence of colon cancer. The expression levels of a set of genes in a cancer cell from the subject are determined and compared to a reference. The set of genes assessed includes at least five genes from the recurrence predictor set of Table 1. The results are predictive of a likelihood of recurrence of the cancer
In another aspect, methods of developing a treatment plan for an individual with colon cancer are provided. The predicted likelihood of recurrence of a cancer may be used
to develop a treatment plan for the individual with the colon cancer. The treatment plan may include administering an effective amount of a chemotherapeutic agent to the individual with the cancer which is predicted to recur.
In yet another aspect, kits including a gene chip for predicting likelihood of recurrence comprising nucleic acids capable of detecting at least five genes from Table 1 and instructions for predicting recurrence of colon cancer.
In a further aspect, computer readable mediums including gene expression profiles of reference cancers having known recurrence phenotypes and corresponding likelihood of recurrence information. The gene expression profiles include at least five genes from Table 1 are provided.
Throughout this specification, reference numbering is sometimes used to refer to the full citation for the references, which can be found in the "Reference Bibliography" after the Examples section. The disclosure of all patents, patent applications, and publications cited herein are hereby incorporated by reference in their entirety for all purposes.
BRIEF DESCRIPTION OF THE DRAWINGS
The patent or application file contains at least one drawing executed in color. Copies of this patent or patent application publication with color drawing(s) will be provided by the Office upon request and payment of the necessary fee.
FIG. 1 is a depiction of the clinical application of the recurrence predictor set. FIG. 2 A is a diagram showing the method used to develop the recurrence predictor set for colon cancer. FIG. 2B (top) shows a heat-map of the samples used to develop the recurrence predictor set with blue and red representing extremes of expression. FIG. 2B (middle) is a graph showing the recurrence score (prediction) of patients that remained disease free as compared to those who had recurrent disease. FIG. 2(bottom) is a graph showing the ROC curve identifying the recurrence score of 0.76 as the optimal cut-point to be used in classifying samples in the validation set. The area under the curve (AUC) is indicated to be 0.94, which confirms the robustness of the recurrence predictor set.
FIG. 3 is a graph showing the accuracy of the recurrence predictor set using the score of 0.76 as a cut-point, the accuracy was 90.3% in a leave -one -out cross validation analysis.
FIG. 4 is a set of graphs showing the accuracy and recurrence scores separated by the stage of the disease. The recurrence predictor predicted recurrence for both stage I and stage II colon cancer.
FIG. 5 is a set of graphs further showing validation of the recurrence predictor set. FIG. 5 A shows an independent validation of the model comparing individual and mean recurrence scores for a distinct group of samples. FIG. 5B is a scatter plot showing the actual and mean recurrence scores for a group of samples based on actual recurrence (P=O.007, t test; 90% sensitivity). FIG. 5C is a graph showing the Kaplan-Meier survival analysis demonstrating the time to recurrence in the two groups. The top line represents those with a low recurrence score and the bottom line represents those with a high recurrence score.
FIG. 6 is a graph showing that RT-PCR analysis of the top ten differentially expressed genes demonstrated concordance for 9 of 10 genes with the microarray data. The data are presented as a comparison between the gene coefficients (specific to each gene in the Bayesian model) of the candidate genes and the log of the RQ values for the respective genes in the RT-PCR experiments.
FIG. 7 is a connectivity map computationally matching drugs likely to be effective based on a core gene expression profile and a list of drugs identified in the analysis based on the recurrence predictor set. FIG. 8 is a graph showing the recurrence score of 14 colon cancer cell lines plotted against the metagene score generated using the recurrence predictor set.
FIG. 9 is a set of graphs showing the in vitro validation of candidate chemotherapeutic agent sensitivity. FIG. 9A left panel shows the mutational events seen in the colon cancer cell lines sorted based on the recurrence probability generated based on the recurrence predictor set (blue: lowest risk; red: highest risk). FIG. 9A right panel shows the results of chemotherapeutic treatments based on the recurrence predictor set (circles: low; triangles: high). The cell lines with high scores were more sensitive to treatments with celecoxib, LY294002 (PBkinase inhibitor) and retinol. FIG. 9B left panel shows the change in recurrence score after exposure to chemotherapeutic agents. An ANOVA analysis demonstrating a significant difference between pretreatment and post-treatment recurrence scores in colon cancer cell lines. FIG 9B right panel shows that traditional chemotherapy agents (5 -FU and oxaliplatin) do not show significantly greater predilection for inhibiting growth in cell lines with a high recurrence score. FIG. 9C is a histogram
showing that all of the cell lines demonstrate a decrease in recurrence score post-treatment, indicating a reversal of the high-risk phenotype after exposure to LY294002 or celecoxib, with DLD-I showing the greatest sensitivity to reversal and COLO-23 showing the least effect. The effects of 5 -FU and oxaliplatin were inconsistent. FIG. 10 is a linear regression analysis of the probability of the recurrence phenotype/score in colon cancer cell lines and in vitro sensitivity to therapeutic agents. Specific COX2 and PBkinase inhibitors may be valuable as initial agents for treating early stage colon cancers at high risk of recurrence.
DETAILED DESCRIPTION OF THE INVENTION Current methods of staging colon cancer are not highly effective at identifying those cancers most likely to recur after surgical removal. In addition, the chemotherapeutic agents chosen for treating individuals with later stage cancers are not completely effective. Colon cancers may contain a variety of underlying genetic abnormalities. Hence a personalized treatment plan to identify individuals at risk for recurrence and to determine which chemotherapeutic agents will be most effective to treat these individuals is highly desirable.
As shown in FIG. 1 the inventors have discovered a method for identifying those colon cancers, suitably early stage colon cancers, which are likely to recur using gene expression analysis as described below. The analysis allows classification of the cancer into a low risk of recurrence versus a high risk of recurrence. Treatment plans including administration of chemotherapeutic agents may be developed for those with a high risk of recurrence.
As described in the Examples, the inventors identified gene expression patterns within colonic tumors or cell lines that predict which cancers are likely to recur after surgical resection. The recurrence predictor set developed from these studies is provided in Table 1. These predictions may be used to develop treatment plans for individual cancer patients. For example, those patients whose tumors are likely to recur may be treated with chemotherapeutic agents after surgery to prevent recurrence. The invention also provides integrating gene expression profiles that predict recurrence with administration of chemotherapeutic agents as a strategy for developing personalized treatment plans for individual patients. Treatment plans may result in individuals having a complete response,
a partial response or an incomplete response as defined below. Treatment plans may result in treatment of the cancer as described below.
A "complete response" (CR) to treatment of cancer is defined as a complete disappearance of all measurable and assessable disease. Complete responders show no signs of cancer recurrence after seven years. An individual who exhibits a complete response is known as a "complete responder."
Individuals with an "incomplete response" (IR) includes those who exhibited a "partial response" (PR), had "stable disease" (SD), or demonstrated "progressive disease" (PD) during primary therapy. An incomplete response includes individuals in which the colon cancer recurs.
"Effective amount" refers to an amount of a chemotherapeutic agent that is sufficient to treat the cancer. An effective amount may exert a prophylactic or therapeutic effect in the subject, i.e., that amount which will stop or reduce the growth of the cancer or cause the cancer to become smaller in size compared to the cancer before treatment or compared to a suitable control or that stops recurrence of the cancer after treatment e.g., surgical resection, chemotherapy or radiation therapy. In most cases, an effective amount will be known or understood or can be determined by those skilled in the art. The result of administering an effective amount of a chemotherapeutic agent may lead to effective treatment of the patient.
It is desirable for an effective amount to be an amount sufficient to exert cytotoxic effects on cancerous cells.
"Predicting" and "prediction" as used herein includes, but is not limited to, generating a statistically based indication of whether a particular cancer such as a colon cancer is likely to recur after treatment, e.g., surgical resection and further whether a
chemotherapeutic agent will be effective to prevent recurrence and/or treat the cancer. This does not mean that the event will happen with 100% certainty.
As used herein, "individual" and "subject" are interchangeable. A "patient" refers to an "individual" who is under the care of a treating physician. The present invention may be practiced using any suitable technique, including techniques known to those skilled in the art. Such techniques are available in the literature or in scientific treatises, such as Molecular Cloning: A Laboratory Manual, second edition (Sambrook et al., 1989) and Molecular Cloning: A Laboratory Manual, third edition (Sambrook and Russel, 2001), (jointly referred to herein as "Sambrook); Current Protocols in Molecular Biology (F. M. Ausubel et al., eds., 1987, including supplements); PCR: The Polymerase Chain Reaction, (Mullis et al., eds., 1994); Harlow and Lane (1988) Antibodies, A Laboratory Manual, Cold Spring Harbor Publications, New York; Harlow and Lane (1999) Using Antibodies: A Laboratory Manual Cold Spring Harbor Laboratory Press, Cold Spring Harbor, NY (jointly referred to herein as "Harlow and Lane"), Beaucage et al. eds., Current Protocols in Nucleic Acid Chemistry John Wiley & Sons; Inc., New York, 2000) and Casarett and Doull 's Toxicology The Basic Science of Poisons, C. Klaassen, ed., 6th edition (2001).
Methods for Predicting Recurrence of Colon Cancer
Methods of staging cancers, predicting aggressiveness and predicting the likelihood of recurrence of a cancer are provided herein. Specifically, the methods rely on using a comparison of a gene expression profile of the cancer to a recurrence predictor set of gene expression profiles to predict the likelihood of recurrence of cancer after surgical resection.
See Table 1 for the recurrence predictor sets.
The recurrence predictor set is, or may be derived from, a set of gene expression profiles obtained from control samples. The controls samples may be cell lines, tumor samples, etc. with a known recurrence phenotype. The comparison of the expression of a specific set of genes in the cancer to the same set of genes in samples known to recur or not to recur allows prediction of the likelihood of recurrence of the cancer. The prediction may indicate that the cancer is unlikely to recur or it may predict that the cancer may recur. The method may also provide an indication of how likely the cancer is to recur without chemotherapeutic intervention.
The methods described herein provide an indication of whether the cancer in the patient is likely to recur or not after primary treatment such as surgical resection, chemotherapy or radiation therapy. The prediction may be more accurate than predictions made using population-based approaches from clinical studies which have been used to stage colon cancers. The methods allow identification of cancers estimated to require further medical intervention so that the patients with these cancers are treated with chemotherapeutics after surgical resection. The methods also may identify which chemotherapeutic agent may be most useful. This results in a more cost-effective, targeted therapy for the cancer patient and avoids side effects from chemotherapeutic agents for patients with cancers that are not likely to recur.
Table 1 also provides the relative "weights" of each of the individual genes that make up the recurrence predictor set. The weights demonstrate that some genes are more strongly indicative of recurrence of a cancer. Predictions based on the complete set of genes are expected to provide the most accurate predictions regarding likelihood of the cancer recurring. Those of skill in the art will understand based on the weights of each gene in the recurrence predictor set that some genes are more predictive of outcome than others and thus that the entire recurrence predictor set need not be used to develop a useful prediction.
Once an individual's cancer is predicted to be likely to recur or not, then a treatment plan can be developed incorporating chemotherapeutic agents for individuals with cancers likely to recur. The recurrence predictor may be used to predict responsiveness to chemotherapeutic agents and an effective amount of the chemotherapeutic agent(s) may be administered to the individual with the cancer. Those of skill in the art will appreciate that the methods do not guarantee that the individuals will be responsive to the selected chemotherapeutic agent or that such treatment will stop recurrence, but the methods will increase the probability that the selected treatment will be effective to treat the cancer. Also encompassed is the ability to predict the responsiveness of the cancer to the one or more chemotherapeutic agents and then to develop a treatment plan using one or more chemotherapeutic agents. Those of skill in the art appreciate that combination therapy is often suitable.
Treatment or treating a cancer includes, but is not limited to, reduction in cancer growth or tumor burden, enhancement of an anti-cancer immune response, induction of apoptosis of cancer cells, inhibition of angiogenesis, enhancement of cancer cell apoptosis,
inhibition of metastases or inhibition of recurrence. Administration of an effective amount of a chemotherapeutic agent to a subject may be carried out by any means known in the art including, but not limited to, intraperitoneal, intravenous, intramuscular, subcutaneous, transcutaneous, oral, nasopharyngeal or transmucosal absorption. The specific amount or dosage administered in any given case will be adjusted in accordance with the specific cancer being treated, the condition, including the age and weight, of the subject, and other relevant medical factors known to those of skill in the art.
The sample of the cancer used to determine the expression levels of a set of genes may be directly from a tumor that was surgically removed. Alternatively, the sample of the cancer could be from cells obtained in a biopsy or other tumor sample such as by aspiration or other methods available to those skilled in the art.
The sample is then analyzed to determine the expression of a set of genes. This can be achieved by any suitable means, including those available to those of skill in the art. One method that can be used is to isolate RNA (e.g., total RNA) from the cellular sample and use a publicly or commercially available micro array system to analyze the gene expression profile in a set of genes from the cellular sample. One microarray that may be used is Affymetrix Human Ul 33 A chip. One of skill in the art may follow the standard directions that come with a commercially available microarray. Other types of microarrays may be used, for example, microarrays using RT-PCR for measurement. Other sources of microarrays include, but are not limited to, Stratagene (e.g., Universal Human Microarray), Genomic Health (e.g., Oncotype DX chip), Clontech (e.g., Atlas™ Glass Microarrays), and other types of Affymetrix microarrays. In one embodiment, the microarray may be made by a researcher or obtained from an educational institution. In other embodiments, customized microarrays, which include the particular set of genes that are particularly suitable for prediction, can be used. The expression profile of the set of genes may be obtained by any other means, including those known to those of skill in the art, e.g., Northern blots, real time rt-PCR, Western blots for the expressed proteins or protein assays.
Once the expression profile of the set of genes has been obtained from the sample, it is compared with a reference gene expression profile. The reference may be a set of cancer cells with known recurrence phenotype, a set of samples obtained from patients with known recurrence phenotype, or a numerical algorithm capable of predicting recurrence phenotype based on data obtained from such references. Table 1 describes the recurrence predictor set. Development of the recurrence predictor set described herein is provided in the Examples.
The use of the recurrence predictor set of genes in its entirety is contemplated; however, it is also possible to use subsets of the predictor set. For example, a subset of at least 2, 5, 10, 15, 20, 25, 30, 35 or 40 or more genes from Table 1 can be used for predictive purposes. For example, 10, 15, 20, 25, 30, 35, 40, 45, or 50 genes from Table 1 could be used as a recurrence predictor set. Indeed any number of the genes could be used in a predictor set. Table 1 also provides the weights of each gene in the predictor set. The weight indicates how tightly correlated the expression of the gene is with recurrence or lack thereof by the cancer. Numbers farther from 0 are more predictive than those close to 0.
Thus, one of skill in art may use the recurrence predictor set as detailed in the Examples to predict whether an individual or patient with cancer is likely to have recurrent cancer. If the individual has cancer likely to recur, then a treatment plan may be designed in which therapeutic agents will be administered in an effective amount after surgical resection of the cancer. If cancer is predicted to be unlikely to recur than chemotherapy may be unnecessary. Those of skill in the art will understand that the expression profile of the genes in the cancer may be useful in determining which chemotherapeutic agents may be effective. As demonstrated in the Examples, the genes in the recurrence predictor set may be used to predict which chemotherapeutic agents are effective. In addition, the gene expression profile of the cancer may be tested against additional predictor sets to allow development of a treatment plan with the best likelihood of treating the individual with the cancer. For example, an individual testing for a high likelihood of recurrence can be evaluated for responsiveness to one or more chemotherapeutic agents. See U.S. Patent Publication Nos. 20070172844, 20070294067, 20090186024 and 20090105167, each of which is incorporated herein by reference in its entirety. In certain embodiments, the methods are performed outside of the human body.
In the Example cancers with a high likelihood of recurrence were further treated with a chemotherapeutic agent. The genes in the recurrence predictor set were also correlated with susceptibility to certain chemotherapeutic agents, such that these agents may be more effective than others to treat these recurrent cancers. The agents identified include a retinal analog, (Tetinon) a PI3K inhibitor (LY-294002), sulindae and a Cox inhibitor (celecoxib). High recurrence risk cell lines treated with these agents demonstrated increased sensitivity to these agents as compared to chemotherapeutic agents currently used clinically for colon cancer, namely 5-FU and oxaliplatin. Thus, the expression of genes
within the recurrence predictor set in a cancer may be used to develop a treatment plan for an individual with cancer. Those skilled in the art can determine dosages and treatment regimes for individuals.
As shown in the Examples, the teachings herein provide a gene expression model that predicts recurrence of colon cancer. The Examples provide evidence that recurrent cancers may be treated by administrating chemotherapeutic agents after surgical resection. The gene expression model was developed by using Bayesian binary regression analysis to identify genes highly correlated with recurrence. The developed models were validated in a leave -one-out cross validation.
Method of Treating Individuals with Colon Cancer
The methods described herein also include treating an individual afflicted with cancer. This method involves administering an effective amount of a chemotherapeutic agent to those individuals predicted to have recurrent cancer. In one aspect, a chemotherapeutic agent is administered in an effective amount after surgical resection. In alternative embodiments, the therapeutic agent is administered before or concurrently with surgical resection.
Methods of Predicting/Estimating the Likelihood of Recurrence of Colon Cancer
One aspect of the invention provides a method for predicting, estimating, aiding in the prediction of, or aiding in the estimation of, the likelihood of cancer recurrence in a subject afflicted with cancer. In certain embodiments, the methods of the application are performed outside of the human body.
One method comprises (a) determining the expression level of multiple genes in a tumor sample from the subject; (b) defining the value of one or more metagenes from the expression levels of step (a), wherein each metagene is defined by extracting a single dominant value using singular value decomposition (SVD) from a recurrence predictor set; and (c) averaging the predictions of one or more statistical tree models applied to the values of the metagenes, wherein each model includes one or more nodes, each node representing a metagene, each node including a statistical predictive probability of tumor sensitivity to the therapeutic agent, thereby estimating the likelihood of cancer recurrence in a subject afflicted with cancer. Another method comprises (a) determining the expression level of multiple genes in a tumor sample from the subject; (b) defining the value of one or more
metagenes from the expression levels of step (a), wherein each metagene is defined by extracting a single dominant value using singular value decomposition (SVD) from a recurrence predictor set; and (c) averaging the predictions of one or more binary regression models applied to the values of the metagenes, wherein each model includes a statistical predictive probability of tumor recurrence thereby estimating the likelihood of cancer recurrence in a subject afflicted with colon cancer.
In one embodiment, the methods predict the likelihood of cancer recurrence in a subject afflicted with cancer with at least 60% accuracy. In another embodiment, the methods predict the likelihood of cancer recurrence in a subject afflicted with cancer with at least 70% accuracy. In another embodiment, the methods predict the likelihood of cancer recurrence in a subject afflicted with cancer with at least 80% accuracy. In another embodiment, the methods predict the likelihood of cancer recurrence in a subject afflicted with cancer with at least 90% accuracy. In another embodiment, the methods predict the likelihood of cancer recurrence in a subject afflicted with cancer with at least 60%, 70%, 75%, 80%, 85%, 90% or 95% accuracy when tested against a validation sample. In another embodiment, the methods predict the efficacy of a therapeutic agent in treating a subject afflicted with cancer with at least 60%, 70%, 75%, 80%, 85%, 90% or 95% accuracy when tested against a set of training samples. In another embodiment, the methods predict the likelihood of cancer recurrence in a subject afflicted with cancer with at least 60%, 70%, 75%, 80%, 85%, 90% or 95% accuracy when tested on human primary tumors ex vivo or in vivo. Accuracy is the ability of the methods to predict whether a cancer will recur or not.
The methods predict the likelihood of cancer recurrence in a subject with cancer with at least 60%, 70%, 75%, 80%, 85%, 90%, 95%, 97%, 98%, 99% or 100% sensitivity. In another embodiment, the methods predict the likelihood of cancer recurrence in a subject afflicted with cancer with at least 60%, 70%, 75%, 80%, 85%, 90%, 95%, 97%, 98%, 99% or 100% sensitivity when tested against a validation sample. In another embodiment, the methods predict the likelihood of cancer recurrence in a subject afflicted with cancer with at least 60%, 70%, 75%, 80%, 85%, 90%, 95%, 97%, 98%, 99% or 100% sensitivity when tested against a set of training samples. In another embodiment, the methods predict the likelihood of cancer recurrence in a subject afflicted with cancer with at least 60%, 70%, 75%, 80%, 85%, 90%, 95%, 97%, 98%, 99% or 100% sensitivity when tested on human primary tumors ex vivo or in vivo. Sensitivity measures the ability of the methods to predict all cancers that will recur.
(A) Sample of the cancer
In one embodiment, the methods comprise determining the expression level of genes in a tumor sample from the subject. In one embodiment, the methods comprise the step of surgically removing a tumor sample from the subject, obtaining a tumor sample from the subject, or providing a tumor sample from the subject.
Alternatively, the sample may be derived from cells from the cancer, or cancerous cells. The sample may contain nucleic acids from the cancer. Any method may be used to remove the sample from the patient and prepare nucleic acids or proteins for expression analysis. In one embodiment, at least 40%, 50%, 60%, 70%, 80% or 90% of the cells in the sample are cancer cells. In preferred embodiments, samples having greater than 50% cancer cell content are used. In one embodiment, the sample is a live tumor sample. In another embodiment, the sample is a frozen sample. In one embodiment, the sample is one that was frozen within less than 5, 4, 3, 2, 1, 0.75, 0.5, 0.25, 0.1, or 0.05 hours after extraction from the patient. Frozen samples include those stored in liquid nitrogen or at a temperature of about -800C or below.
(B) Gene Expression
The expression of the genes may be determined using any method known in the art for assaying gene expression. Gene expression may be determined by measuring mRNA or protein levels for the genes. In one embodiment, an mRNA transcript of a gene may be detected for determining the expression level of the gene. Based on the sequence information provided by the GenBank ™ database entries, the genes can be detected and expression levels measured using techniques well known to one of ordinary skill in the art, including but not limited to rtPCR, Northern blot analysis and microarray analysis. For example, sequences within the sequence database entries corresponding to polynucleotides of the genes can be used to construct probes for detecting mRNAs by, e.g., Northern blot hybridization analyses. The hybridization of the probe to a gene transcript in a subject biological sample can be also carried out on a DNA array. The use of an array is suitable for detecting the expression level of a plurality of the genes. As another example, the sequences can be used to construct primers for specifically amplifying the polynucleotides in, e.g., amplification-based detection methods such as reverse-transcription based polymerase chain reaction (RT-PCR). As another example, mRNA levels can be assayed
by quantitative RT-PCR. Furthermore, the expression level of the genes can be analyzed based on the biological activity or quantity of proteins encoded by the genes. Methods for determining the quantity of the protein include immunoassay methods such as Western blot analysis. In one embodiment, about l-50mg of cancer tissue was added to a chilled tissue pulverizer, such as to a Bio Pulverizer H tube (BiolOl Systems, Carlsbad, CA). Lysis buffer, such as from the Qiagen RNeasy Mini kit, was added to the tissue and homogenized. A device such as a Mini-Beadbeater (Biospec Products, Bartlesville, OK) was used. Tubes were spun briefly as needed to pellet the mixture and reduce foam. The resulting lysate was passed through syringes, such as a 21 gauge needle, to shear DNA. Total RNA was extracted using commercially available kits, such as the Qiagen RNeasy Mini kit. The samples were prepared and arrayed using Affymetrix Ul 33 plus 2.0 GeneChips or Affymetrix U133A GeneChips. Any suitable gene chip may be used.
In one embodiment, total RNA was extracted using the Qiashredder and Qiagen RNeasy Mini kit and the quality of RNA was checked by an Agilent 2100 Bioanalyzer. The targets for Affymetrix DNA microarray analysis were prepared according to the manufacturer's instructions. Biotin-labeled cRNA, produced by in vitro transcription, was fragmented and hybridized to the Affymetrix U133A GeneChip arrays at 45° C for 16 hrs and then washed and stained using the GeneChip Fluidics. The arrays were scanned by a GeneArray Scanner and patterns of hybridization were detected as light emitted from the fluorescent reporter groups incorporated into the target and hybridized to oligonucleotide probes. Full details of the methods used for RNA extraction and development of gene expression data from lung and ovarian tumors have been described previously. (BiId A, Yao G, Chang JT, et al: Oncogenic pathways signatures in human cancers as guide to targeted therapies. Nature 439(7074):353-357, 200, Potti A, Dressman HK, BiId A, et al: Genomic signatures to guide the use of chemotherapeutics. Nature Medicine 12(11): 1294- 1300, 2006).
In one embodiment, determining the expression level (or obtaining a first gene expression profile) of multiple genes in a tumor sample from the subject comprises extracting nucleic acids from the sample from the subject. In certain embodiments, the nucleic acid sample is an mRNA sample. In one embodiment, the expression level of the nucleic acid is determined by hybridizing the nucleic acid, or amplification products
thereof, to a DNA microarray. Amplification products may be generated, for example, with reverse transcription, optionally followed by PCR amplification of the products.
(C) Genes Screened
In one embodiment, the predictive methods of the invention comprise determining the expression level of all the genes in the cluster that define the recurrence metagene. In one embodiment, the predictive methods of the invention comprise determining the expression level of at least 50%, 60%, 70%, 80%, 90%, 95%, 98%, 99% of the genes in each of the clusters that defines the colon cancer recurrence metagene. A metagene is a cluster or set of genes which may be used to predict the likelihood of recurrence of a cancer. In one embodiment, at least 50%, 60%, 70%, 80%, 90%, 95%, 98%, 99% of the genes whose expression levels are used in order to predict recurrence (or the genes in the cluster that define a metagene having said predictivity) are genes listed in Table 1.
In one embodiment, at least 50%, 60%, 70%, 80%, 90%, 95%, 98%, 99% of the genes listed in Table 1 are used to predict recurrence of a cancer. Table 1 shows the genes in the cluster that are used to define metagenes and indicate the likelihood of recurrence.
(D) Metagene Valuation
In one embodiment, the predictive methods of the invention comprise defining the value of one or more metagenes from the expression levels of the genes. A metagene value is defined by extracting a single dominant value from a cluster of genes associated with the likelihood of recurrence of the cancer.
In one embodiment, the dominant single value is obtained using single value decomposition (SVD). In one embodiment, the cluster of genes of each metagene or at least of one metagene comprises at least 3, 4, 5, 6, 7, 8, 9, 10, 12, 15, 18, 20 or 25 genes.
In one embodiment, the predictive methods of the invention comprise defining the value of at least one metagene wherein the genes in the cluster of genes from which the metagene is defined, share at least 50%, 60%, 70%, 80%, 90%, 95% or 98% of genes in common to the genes in Table 1. In one embodiment, the predictive methods of the invention comprise defining the value of at least two metagenes, wherein the genes in the cluster of genes from which each metagene is defined share at least 50%, 60%, 70%, 80%, 90%, 95% or 98% of genes in common to the genes in Table 1. In one embodiment, the predictive methods of the invention comprise defining the value of a metagene from a
cluster of genes, wherein at least 2, 3, 4, 5, 6, 7, 8, 9, 10, 11, 12, 13, 14, 15, 16, 17, 18, 19 or 20 genes in the cluster are selected from the genes listed in Table 1.
In one embodiment, the clusters of genes that define each metagene were identified using supervised classification methods of analysis as previously described. See, for example, West, M. et al. Proc Natl Acad Sci USA 98, 11462-11467 (2001). The dominant principal components from such a set of genes defines a relevant phenotype-related metagene, and regression models, such as binary regression models, were used to assign the relative probability of recurrence of the cancer.
(E) Predictions from Tree Models In one embodiment, the methods comprise averaging the predictions of one or more statistical tree models applied to the metagene values, wherein each model includes one or more nodes, each node representing a metagene, each node including a statistical predictive probability of recurrence of the cancer. The statistical tree models may be generated using the methods described herein for the generation of tree models. General methods of generating tree models may also be found in the art (See for example Pitman et al, Biostatistics 2004;5:587-601; Denison et al. Biometrika 1999;85:363-77; Nevins et al. Hum MoI Genet 2003;12:R153-7; Huang et al. Lancet 2003;361 : 1590-6; West et al . Proc Natl A cad Sci USA 2001 ;98:11462-7; U.S. Patent Pub. Nos. 2003-0224383; 2004- 0083084; 2005- 0170528; 2004-0106113; and U.S. Application No. 11/198782). In one embodiment, the methods comprise deriving a prediction from a single statistical tree model, wherein the model includes one or more nodes, each node representing a metagene, each node including a statistical predictive probability of recurrence of the cancer. In alternative embodiments, the tree may comprise at least 2, 3, 4, or 5 nodes. In one embodiment, the methods comprise averaging the predictions of one or more statistical tree models applied to the metagene values, wherein each model includes one or more nodes, each node representing a metagene, each node including a statistical predictive probability of recurrence of the cancer. Accordingly, the invention provides methods that use mixed trees, where a tree may contain at least two nodes, where each node represents a metagene representative of the likelihood of cancer recurrence.
In one embodiment, the statistical predictive probability was derived from a Bayesian analysis. In another embodiment, the Bayesian analysis included a sequence of
Bayes factor based tests of association to rank and select predictors that define a node binary split, the binary split including a predictor/threshold pair. Bayesian analysis is an approach to statistical analysis that is based on the Bayes law, which states that the posterior probability of a parameter p is proportional to the prior probability of parameter p multiplied by the likelihood of p derived from the data collected. This methodology represents an alternative to the traditional (or frequentist probability) approach: whereas the latter attempts to establish confidence intervals around parameters, and/or falsify a-priori null-hypotheses, the Bayesian approach attempts to keep track of how a priori expectations about some phenomenon of interest can be refined, and how observed data can be integrated with such a priori beliefs, to arrive at updated posterior expectations about the phenomenon. Bayesian analysis has been applied to numerous statistical models to predict outcomes of events based on available data. These include standard regression models, e.g. binary regression models, as well as to more complex models that are applicable to multi-variate and essentially non-linear data. Another such model is commonly known as the tree model which is essentially based on a decision tree. Decision trees can be used in clarification, prediction and regression. A decision tree model is built starting with a root mode, and training data partitioned to what are essentially the "children" nodes using a splitting rule. For instance, for clarification, training data contains sample vectors that have one or more measurement variables and one variable that determines that class of the sample. Various splitting rules may be used. A statistical predictive tree model to which Bayesian analysis is applied may consistently deliver accurate results with high predictive capabilities. Other statistical models known to those of skill in the art may be used.
Gene expression signatures that reflect the activity of a given pathway may be identified using supervised classification method of analysis previously described (e.g., West, M. et al. Proc Natl Acad Sci USA 98, 11462-11467, 2001). The analysis selects a set of genes whose expression levels are most highly correlated with the classification of tumor samples into likely to recur versus unlikely to recur. The dominant principal components from such a set of genes then defines a relevant phenotype-related metagene, and regression models assign the relative probability of recurrence of the cancer.
In one embodiment, each statistical tree model generated by the methods described herein comprises 2, 3, 4, 5, 6 or more nodes. In one embodiment of the methods described herein for defining a statistical tree model predictive of the likelihood of recurrence the
resulting model predicts cancer recurrence with at least 60%, 70%, 80%, 85%, or 90% or higher accuracy. In another embodiment, the model predicts cancer recurrence with greater accuracy than clinical variables. In one embodiment, the clinical variables are selected from age of the subject, gender of the subject, tumor size of the sample, stage of cancer disease and histological subtype of the sample. In one embodiment, the cluster of genes that define each metagene comprise at least 3, 4, 5, 6, 7, 8, 9, 10, 12 or 15 genes. In one embodiment, the correlation-based clustering is Markov chain correlation-based clustering or K-means clustering.
Gene Chips and Kits Arrays and microarrays which contain probes specific for the genes within the recurrence predictor set for determining recurrence as disclosed here are also encompassed within the scope of this invention. Methods of making arrays are well-known in the art and as such do not need to be described in detail here.
Such arrays can contain the profiles of 5, 10, 15, 20, 25, 30, 40, 50, 75, 100, 150, 200 or more genes as disclosed in Table 1. Accordingly, arrays for detection of recurrence can be customized for diagnosis or treatment of colon cancer. The array can be packaged as part of kit comprising the customized array itself and a set of instructions for how to use the array to determine an individual's likelihood of recurrence.
Also provided are reagents and kits for practicing one or more of the above described methods. The subject reagents and kits thereof may vary greatly. Reagents of interest include reagents specifically designed for use in production of the above described metagene values.
One type of such reagent is an array probe of nucleic acids, such as a DNA chip, in which the genes defining the metagenes in the recurrence predictive tree models are represented. A variety of different array formats are known in the art, with a wide variety of different probe structures, substrate compositions and attachment technologies.
Representative array structures of interest include those described in U.S. Pat. Nos.
5,143,854; 5,288,644; 5,324,633; 5,432,049; 5,470,710; 5,492,806; 5,503,980; 5,510,270;
5,525,464; 5,547,839; 5,580,732; 5,661,028; 5,800,992; as well as WO 95/21265; WO 96/31622; WO 97/10365; WO 97/27317; EP 373 203; and EP 785 280; the disclosures of which are herein incorporated by reference.
The DNA chip is conveniently used to compare the expression levels of a number of genes at the same time. DNA chip-based expression profiling can be carried out, for example, by the method as disclosed in "Microarray Biochip Technology" (Mark Schena, Eaton Publishing, 2000). A DNA chip comprises immobilized high-density probes to detect a number of genes. Thus, the expression levels of many genes can be estimated at the same time by a single-round analysis. Namely, the expression profile of a specimen can be determined with a DNA chip. A DNA chip may comprise probes, which have been spotted thereon, to detect the expression level of the metagene-defining genes of the present invention, i.e. the genes described in Table 1. A probe may be designed for each marker gene selected, and spotted on a DNA chip. Such a probe may be, for example, an oligonucleotide comprising 5-50 nucleotide residues. Methods for synthesizing such oligonucleotides on DNA chips are known to those skilled in the art. Longer DNAs can be synthesized by PCR or chemically. Methods for spotting long DNA, which is synthesized by PCR or the like, onto a glass slide are also known to those skilled in the art. A DNA chip that is obtained by the methods described above can be used for estimating the recurrence of a cancer in a subject afflicted with cancer according to the present invention.
DNA microarray and methods of analyzing data from microarrays are well- described in the art, including in DNA Microarrays: A Molecular Cloning Manual. Ed. by Bowtel and Sambrook (Cold Spring Harbor Laboratory Press, 2002); Microarraysfor an Integrative Genomics by Kohana (MIT Press, 2002); A Biologist's Guide to Analysis of DNA Micraarray Data, by Knudsen (Wiley, John & Sons, Incorporated, 2002); DNA Microarrays: A Practical Approach, Vol. 205 by Schema (Oxford University Press, 1999); and Methods of Microarray Data Analysis II, ed. by Lin et al. (Kluwer Academic Publishers, 2002) all of which are incorporated herein by reference. One aspect of the invention provides a kit comprising: (a) any of the gene chips described herein; and (b) one of the computer-readable mediums described herein.
In some embodiments, the arrays include probes for at least 2, 3, 4, 5, 6, 7, 8, 9, 10, 15, 20, 25, 30, 40, or 50 of the genes listed in Table 1. In certain embodiments, the number of genes that are from Table 1 that are represented on the array is at least 5, at least 10, at least 25 or at least 50, including all of the genes listed in the table. Where the subject arrays include probes for additional genes not listed in the table, in certain embodiments the number % of additional genes that are represented does not exceed about 50%, 40%, 30%, 20%, 15%, 10%, 8%, 6%, 5%, 4%, 3%, 2% or 1%. In some embodiments, a great majority
of genes in the collection are genes that define the metagenes of the invention, whereby great majority is meant at least about 75%, usually at least about 80% and sometimes at least about 85, 90, 95% or higher, including embodiments where 100% of the genes in the collection are metagene-defming genes. In an alternative embodiment, the arrays for use in the invention may include a majority of probes that are not listed in Table 1.
The kits of the subject invention may include the above described arrays or gene chips. The kits may further include one or more additional reagents employed in the various methods, such as primers for generating target nucleic acids, dNTPs and/or rNTPs, which may be either premixed or separate, one or more uniquely labeled dNTPs and/or rNTPs, such as biotinylated or Cy3 or Cy5 tagged dNTPs, gold or silver particles with different scattering spectra, or other post synthesis labeling reagent, such as chemically active derivatives of fluorescent dyes, enzymes, such as reverse transcriptases, DNA polymerases, RNA polymerases, and the like, various buffer mediums, e.g. hybridization and washing buffers, prefabricated probe arrays, labeled probe purification reagents and components, like spin columns, etc., signal generation and detection reagents, e,g. streptavidin-alkaline phosphatase conjugate, chemifluorescent or chemiluminescent substrate, and the like.
In addition to the above components, the subject kits further include instructions for practicing the subject methods. These instructions may be present in the subject kits in a variety of forms, one or more of which may be present in the kit. One form in which these instructions may be present is as printed information on a suitable medium or substrate, e.g., a piece or pieces of paper on which the information is printed, in the packaging of the kit, in a package insert, etc. Yet another means would be a computer readable medium, e.g., diskette, CD, etc., on which the information has been recorded. Yet another means that may be present is a website address which may be used via the internet to access the information at a remote site. Any convenient means of conveying instructions may be present in the kits.
The kits also include packaging material such as, but not limited to, ice, dry ice, styrofoam, foam, plastic, cellophane, shrink wrap, bubble wrap, paper, cardboard, starch peanuts, twist ties, metal clips, metal cans, drierite, glass, and rubber.
Computer Readable Media Comprising Gene Expression Profiles
The invention also contemplates computer readable media that comprises reference gene expression profiles. Such media can contain all or part of the gene expression profiles of the genes listed in Table 1 that comprise the recurrence predictor set. The media can be a list of the genes or contain the raw data for running a user's own statistical calculation, such as the methods disclosed herein.
Another aspect of the invention provides a program product (i.e., software product) for use in a computer device that executes program instructions recorded in a computer- readable medium to perform one or more steps of the methods described herein, such as for estimating the likelihood of cancer recurrence in a subject afflicted with cancer.
One aspect of the invention provides a computer readable medium having computer readable program codes embodied therein, the computer readable medium program codes performing one or more of the following functions: defining the value of one or more metagenes from the expression levels of genes in known recurrent of non-recurrent cancers defining a metagene value by extracting a single dominant value using singular value decomposition (SVD) from a cluster of genes associated with tumor recurrence; averaging the predictions of one or more statistical tree models applied to the values of the metagenes; or averaging the predictions of one or more binary regression models applied to the values of the metagenes, wherein each model includes a statistical predictive probability of tumor recurrence.
Another related aspect of the invention provides kits comprising the program product or the computer readable medium, optionally with a computer system. One aspect of the invention provides a system, the system comprising: a computer; a computer readable medium, operatively coupled to the computer, the computer readable medium program codes performing one or more of the following functions: defining the value of one or more metagenes from the expression levels genes; defining a metagene value by extracting a single dominant value using singular value decomposition (SVD) from a cluster of genes associated with tumor recurrence; averaging the predictions of one or more statistical tree models applied to the values of the metagenes; or averaging the predictions of one or more binary regression models applied to the values of the metagenes, wherein each model includes a statistical predictive probability of tumor recurrence.
In one embodiment, the program product comprises: a recordable medium; and a plurality of computer-readable instructions executable by the computer device to analyze
data from the array hybridization steps, to transmit array hybridization from one location to another, or to evaluate genome-wide location data between two or more genomes. Computer readable media include, but are not limited to, CD-ROM disks (CD-R, CD-RW), DVD-RAM disks, DVD-RW disks, floppy disks and magnetic tape. A related aspect of the invention provides kits comprising the program products described herein. The kits may also optionally contain paper and/or computer-readable format instructions and/or information, such as, but not limited to, information on DNA microarrays, on tutorials, on experimental procedures, on reagents, on related products, on available experimental data, on using kits, on chemotherapeutic agents including their toxicity, and on other information. The kits optionally also contain in paper and/or computer-readable format information on minimum hardware requirements and instructions for running and/or installing the software. The kits optionally also include, in a paper and/or computer readable format, information on the manufacturers, warranty information, availability of additional software, technical services information, and purchasing information. The kits optionally include a video or other viewable medium or a link to a viewable format on the internet or a network that depicts the use of the software, and/or use of the kits. The kits also include packaging material such as, but not limited to, styrofoam, foam, plastic, cellophane, shrink wrap, bubble wrap, paper, cardboard, starch peanuts, twist ties, metal clips, metal cans, drierite, glass, and rubber. The analysis of data, as well as the transmission of data steps, can be implemented by the use of one or more computer systems. Computer systems are readily available. The processing that provides the displaying and analysis of image data for example, can be performed on multiple computers or can be performed by a single, integrated computer or any variation thereof. The components contained in the computer system are those typically found in general purpose computer systems used as servers, workstations, personal computers, network terminals, and the like. In fact, these components are intended to represent a broad category of such computer components that are well known in the art.
A general purpose computer system for performing the functions of the software according to an illustrative embodiment of the invention includes a central processing unit (CPU), a memory, and an interconnect bus. The CPU may include a single microprocessor or a plurality of microprocessors for configuring computer system as a multi-processor system. The memory illustratively includes a main memory and a read only memory. The computer also includes the mass storage device 1508 having, for example, various disk
drives, tape drives, etc. The main memory also includes dynamic random access memory (DRAM) and high-speed cache memory. In operation, the main memory stores at least portions of instructions and data for execution by the CPU.
The mass storage may include one or more magnetic disk or tape drives or optical disk drives, for storing data and instructions for use by the CPU. At least one component of the mass storage system, preferably in the form of a disk drive or tape drive, stores one or more databases, such as databases containing of transcriptional start sites, genomic sequence, promoter regions, or other information.
The mass storage system may also include one or more drives for various portable media, such as a floppy disk, a compact disc read only memory (CD-ROM), or an integrated circuit non-volatile memory adapter (i.e., PC-MCIA adapter) to input and output data and code to and from the computer system.
The computer system may also include one or more input/output interfaces for communications, shown by way of example, as interface for data communications via a network. The data interface may be a modem, an Ethernet card or any other suitable data communications device. To provide the functions of a computer system, the data interface may provide a relatively high-speed link to a network, such as an intranet, internet, or the
Internet, either directly or through another external interface. The communication link to the network may be, for example, optical, wired, or wireless (e.g., via satellite or cellular network). Alternatively, the computer system may include a mainframe or other type of host computer system capable of Web-based communications via the network.
The computer system also includes suitable input/output ports or use the interconnect bus for interconnection with a local display and keyboard or the like serving as a local user interface for programming and/or data retrieval purposes. Alternatively, server operations personnel may interact with the system for controlling and/or programming the system from remote terminal devices via the network.
The following examples are provided to illustrate aspects of the invention but are not intended to limit the invention in any manner.
EXAMPLES Gene Expression Signature of Recurrence in Early Stage Colon Cancer. There is a significant unmet need to further characterize and treat early stage colonic tumors in an individualized fashion. This is particularly relevant for patients diagnosed with early stage
colon cancer (stages I and II) who are usually considered cured after surgical resection, despite the fact that up to 20% of these patients later develop disease recurrence (8, 9). Because the current TNM staging system provides only an arbitrary method to characterize patients with stage I colon cancer, our aim was to develop a prognostic model using gene- expression data to predict disease recurrence after curative surgery (a clinically relevant phenotype) in early-stage colon cancer. Toward this end, as detailed in FIG. 2A we developed a prognostic model using a collection of 52 samples representing clinical stage I and stage II disease, for which gene expression data were available. Two independent datasets of 55 and 73 samples were used for validation of the prognostic model. The clinical characteristics of the patients are detailed in supporting information (SI) Table 2.
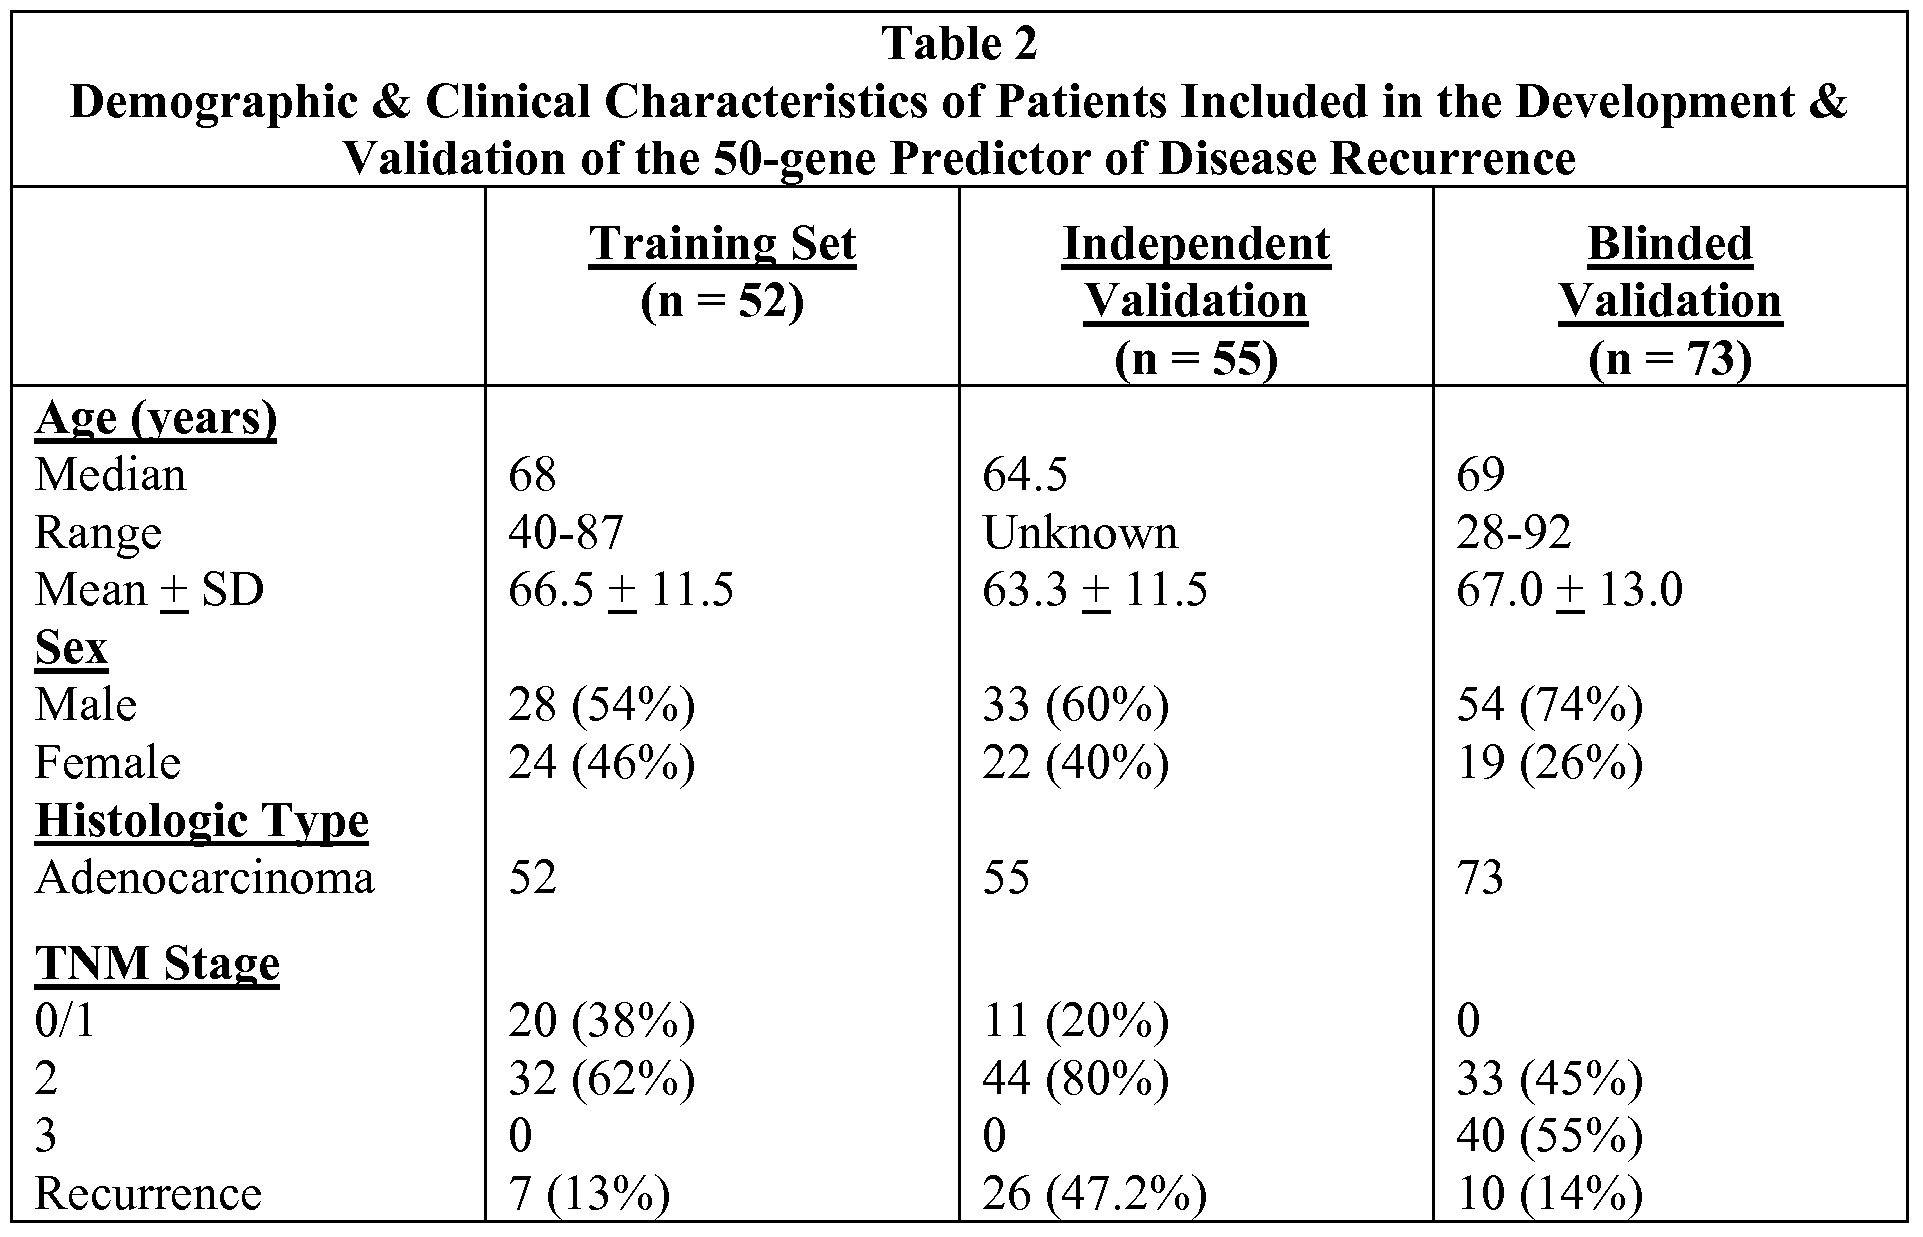
Using Bayesian regression methods (12-14), we identified gene expression profiles, or metagenes, constituted by 50 genes that predict the risk of recurrence in an initial 'training' cohort of 52 patients with early-stage colon cancer (FIG. 2B) The predictive accuracy of the 50-gene model was assessed by using leave-one out- cross-validation in which the analysis is performed repeatedly with one sample removed each time and the probability of recurrence is predicted for that sample. The 50-gene model predicted recurrence with an accuracy of 90.3% (FIG. 3) with a significant difference in the predicted probability of recurrence or 'recurrence scores' between the two groups (P < 0.001) (FIG. 2B).
Furthermore, a receiver operator characteristic (ROC) analysis revealed that the area under the curve was 0.94 (P < 0.0001) and established the optimal cut-point for the Recurrence Score at 0.76 (Sensitivity: 85.71%, Specificity: 95.56%, likelihood ratio: 19.29) (FIG. 2B). The 50 gene recurrence predictor set is provided in Table 1 and Table 3. Finally and importantly, the prognostic ability of the 50-gene model was similar irrespective of TNM stage in early stage colon cancer (FIG. 4).
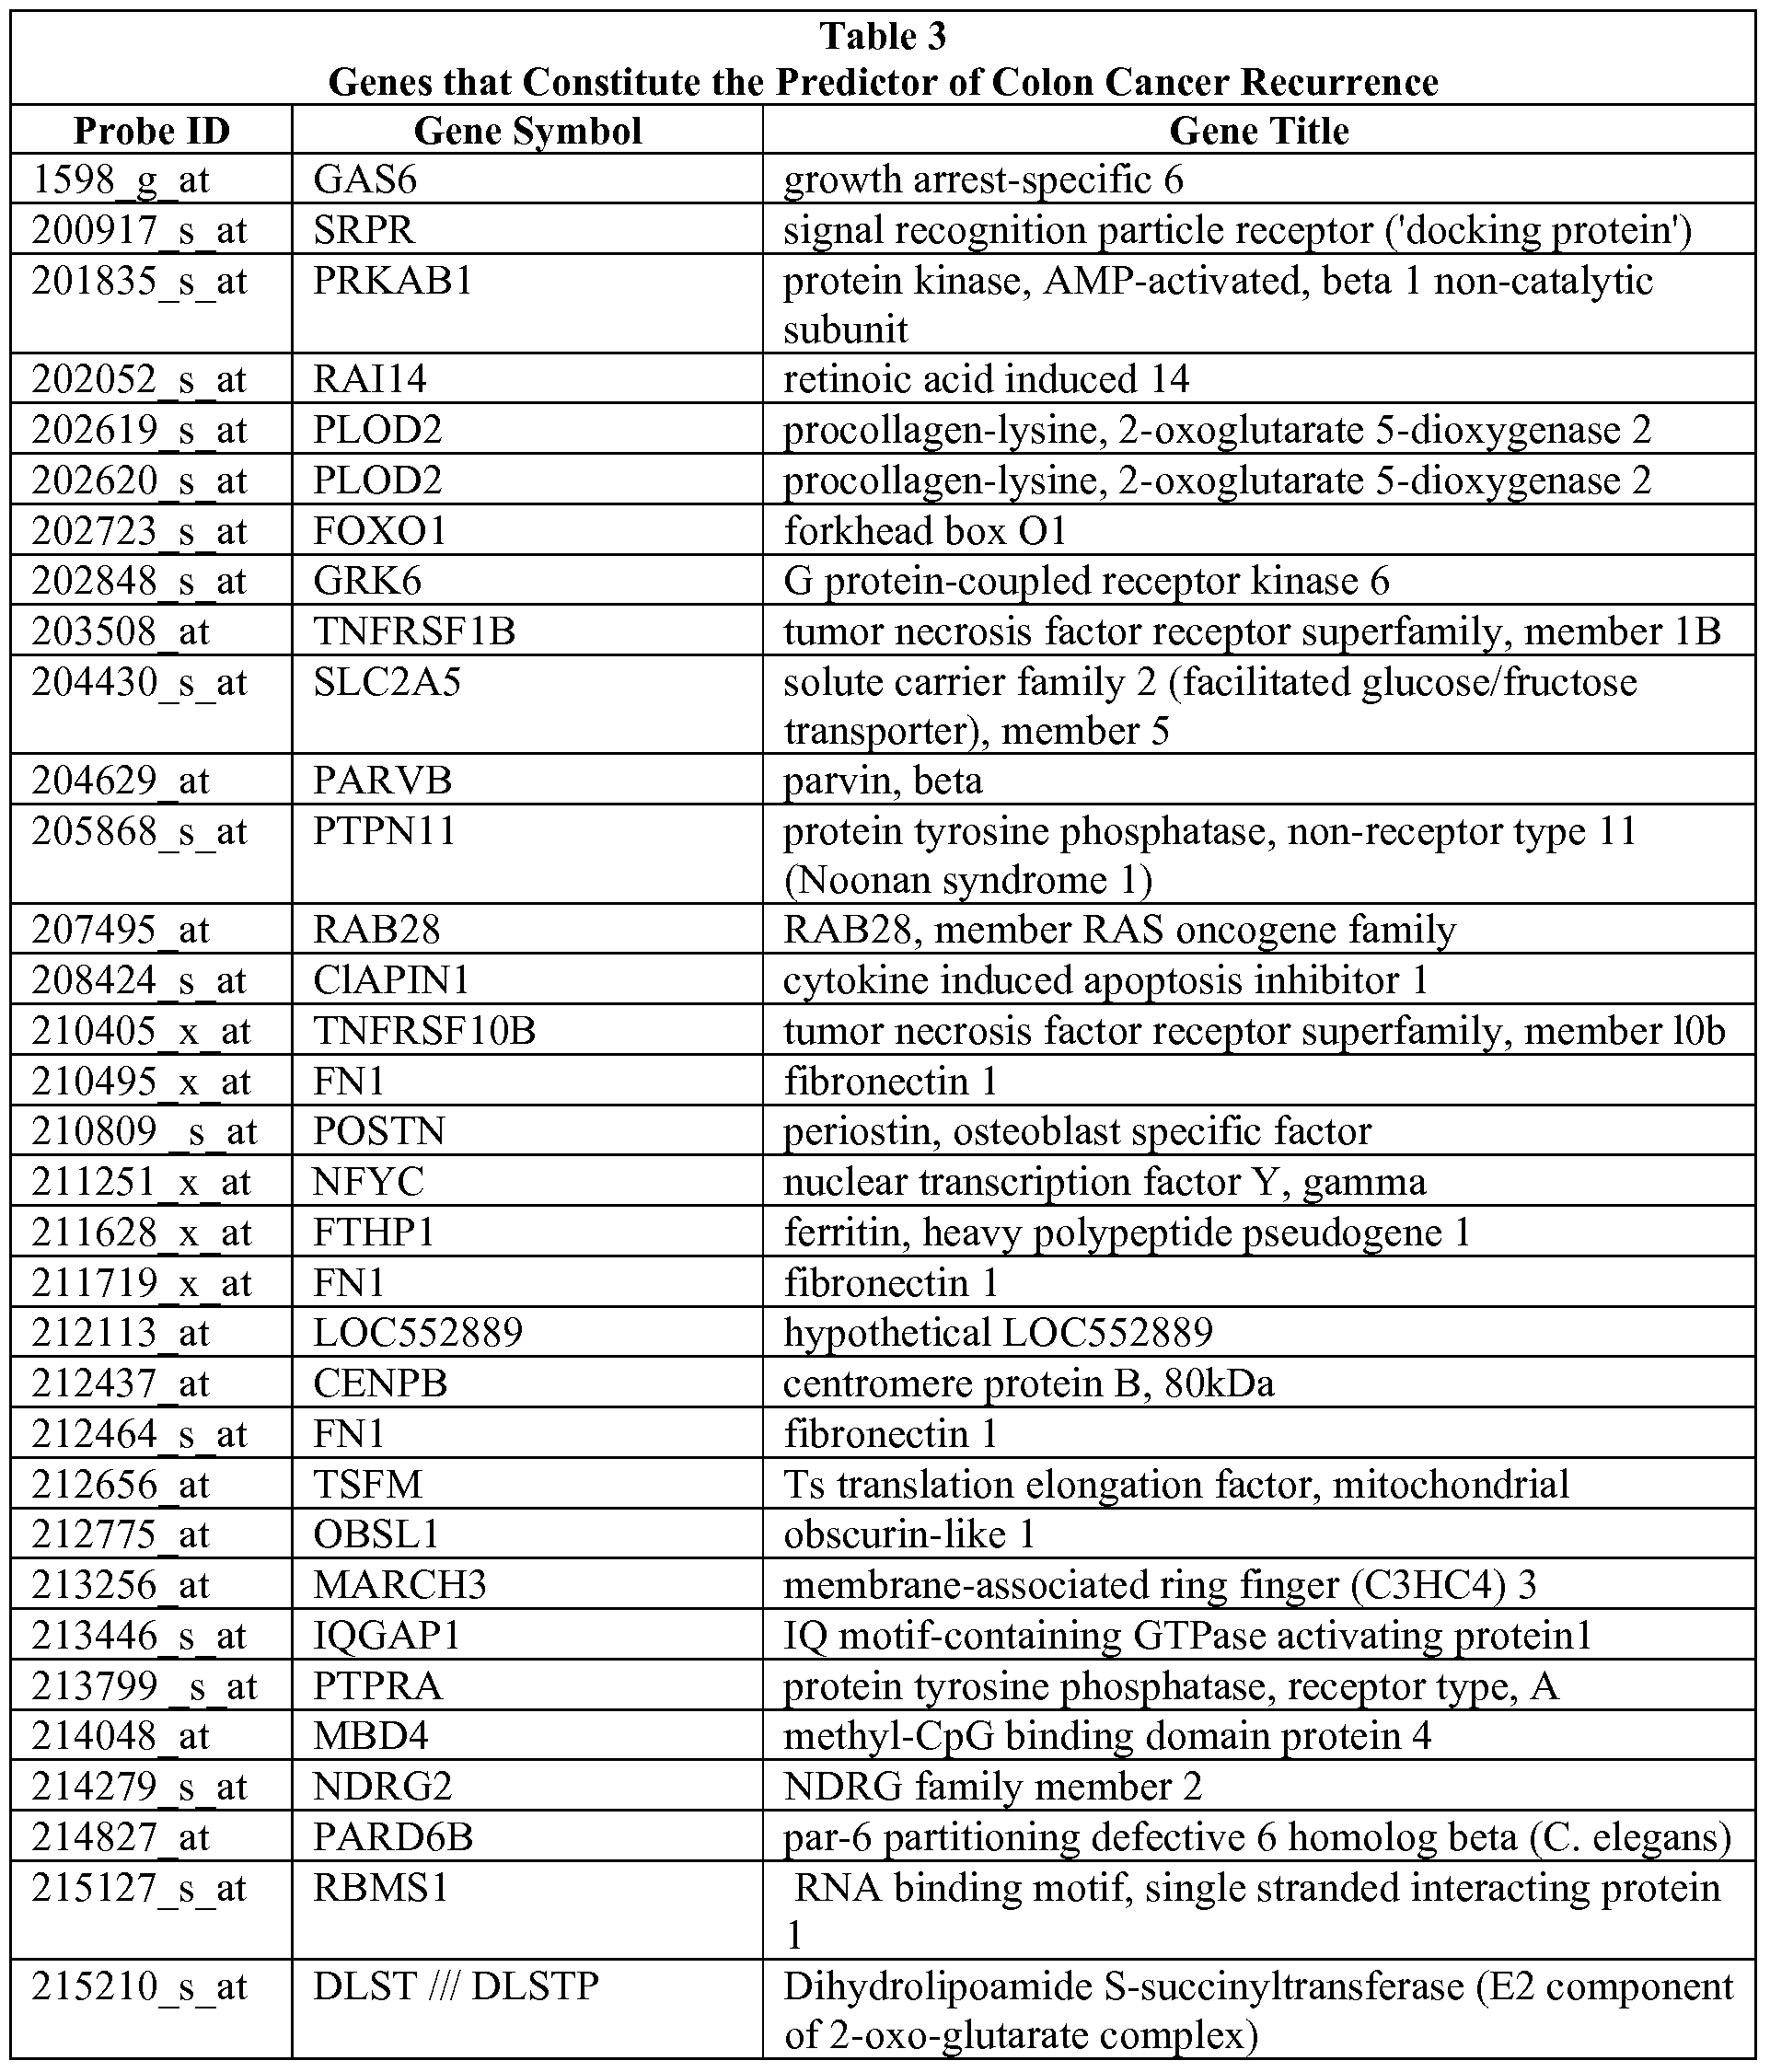
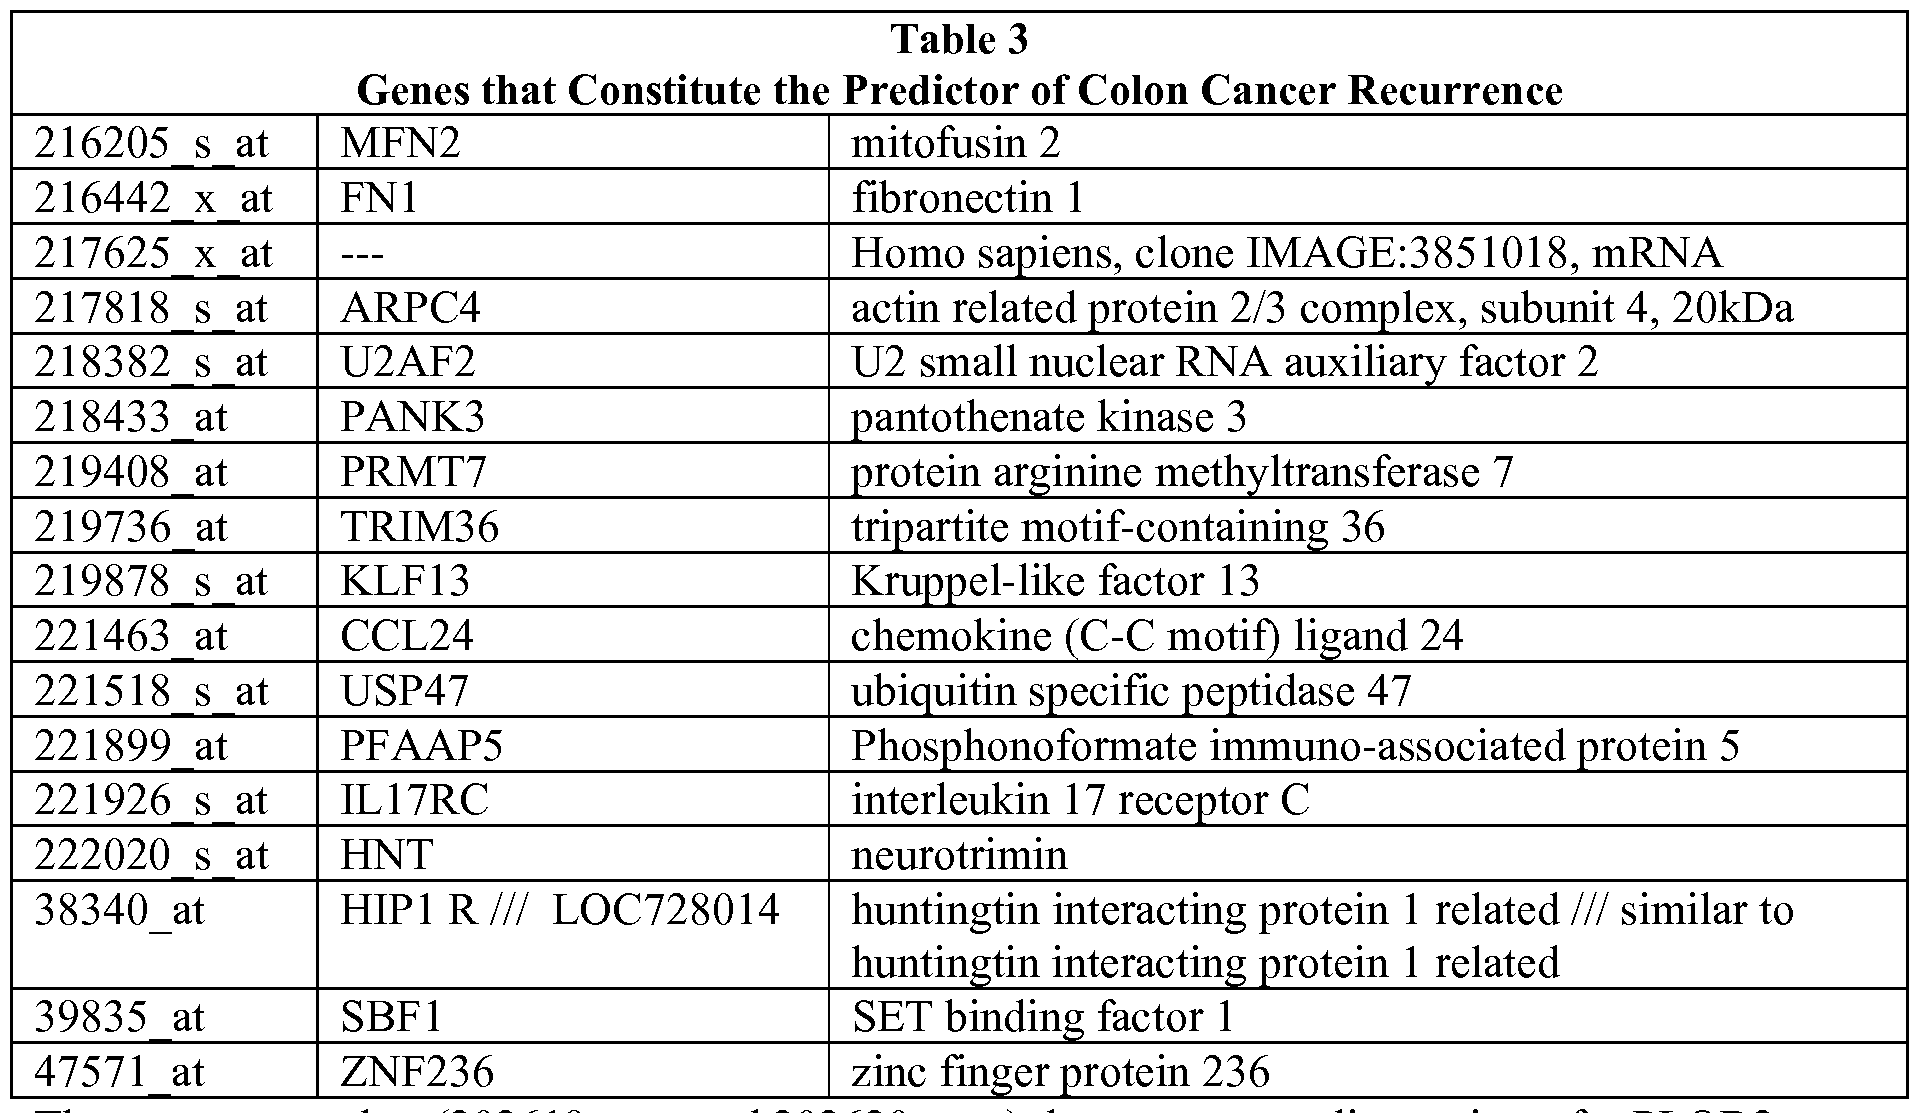
There are two probes (202619_s_at and 202620_s_at) that represent splice variants for PLOD2.
As an additional measure of validity in predicting colon cancer recurrence, we tested the accuracy of the metagene model in an independent dataset of patients with stage I/II colon cancer that was recently made available (15) (Table 2). In this cohort of 55 patients all followed for a minimum of 5 years post-resection, our model of recurrence correctly predicted 38/55 (69.1%) samples (using the predetermined cut-point); the mean recurrence score in the disease- free cohort was significantly different (P = 0.002, t test) than the mean recurrence score in those with disease recurrence (FIG. 5A).
To further confirm the prognostic capability of the metagene model, we applied the 50-gene model to an independent validation dataset comprising 73 colon cancer patients treated at the University Medical Center Gottingen, Germany (GSE 10402), using the predetermined Recurrence Score cut-point of 0.76. Importantly, the outcome was blinded to the investigator (C. R. A.) performing the analysis. In this independent blinded validation analysis, nearly all of the patients with recurrence were predicted by the model to recur resulting in a sensitivity of 90% (FIG. 5B). In a Kaplan-Meier survival analysis (FIG. 5C), statistically significant differences were seen between the cohorts predicted to recur (high recurrence score) and those predicted to be disease-free (low recurrence score). Importantly, almost all those predicted by the model to remain disease-free (low recurrence score) did so with only one case of clinical recurrence in that group (negative predictive value: 97%).
Although the overall accuracy was lower than anticipated (61%), this likely reflects the inclusion of patients in this cohort with more advanced disease (stage III) and fewer than three years of follow up; it is possible that some of these individuals will in fact recur if followed for a longer time period (5 years). In addition, RT-PCR validation of the top 10 differentially expressed candidate genes (CCL24, FNl, GAS6, PARD6B, HNT, PARVB, POSTN, SLC2A5, TNFRSFlB, and TRIM36) demonstrated that 9 of 10 genes (all except HNT) identified to be most differentially expressed in our genomic model could also be validated by using RT-PCR (FIG. 6). Finally, as confirmation that the 50-gene model is independently prognostic in early stage colon cancer, we performed univariate and multivariate analyses by using a Cox proportional hazards model. As seen in Table 4, a prediction of recurrence (based on the 50-gene model) was as an independent poor prognostic variable in both univariate and multivariate analyses (P = 0.01). These results demonstrate that the 50-gene model of disease recurrence has prognostic implications independent of traditional prognostic criteria such as age, gender, and stage of disease (tumor size and lymph node status).
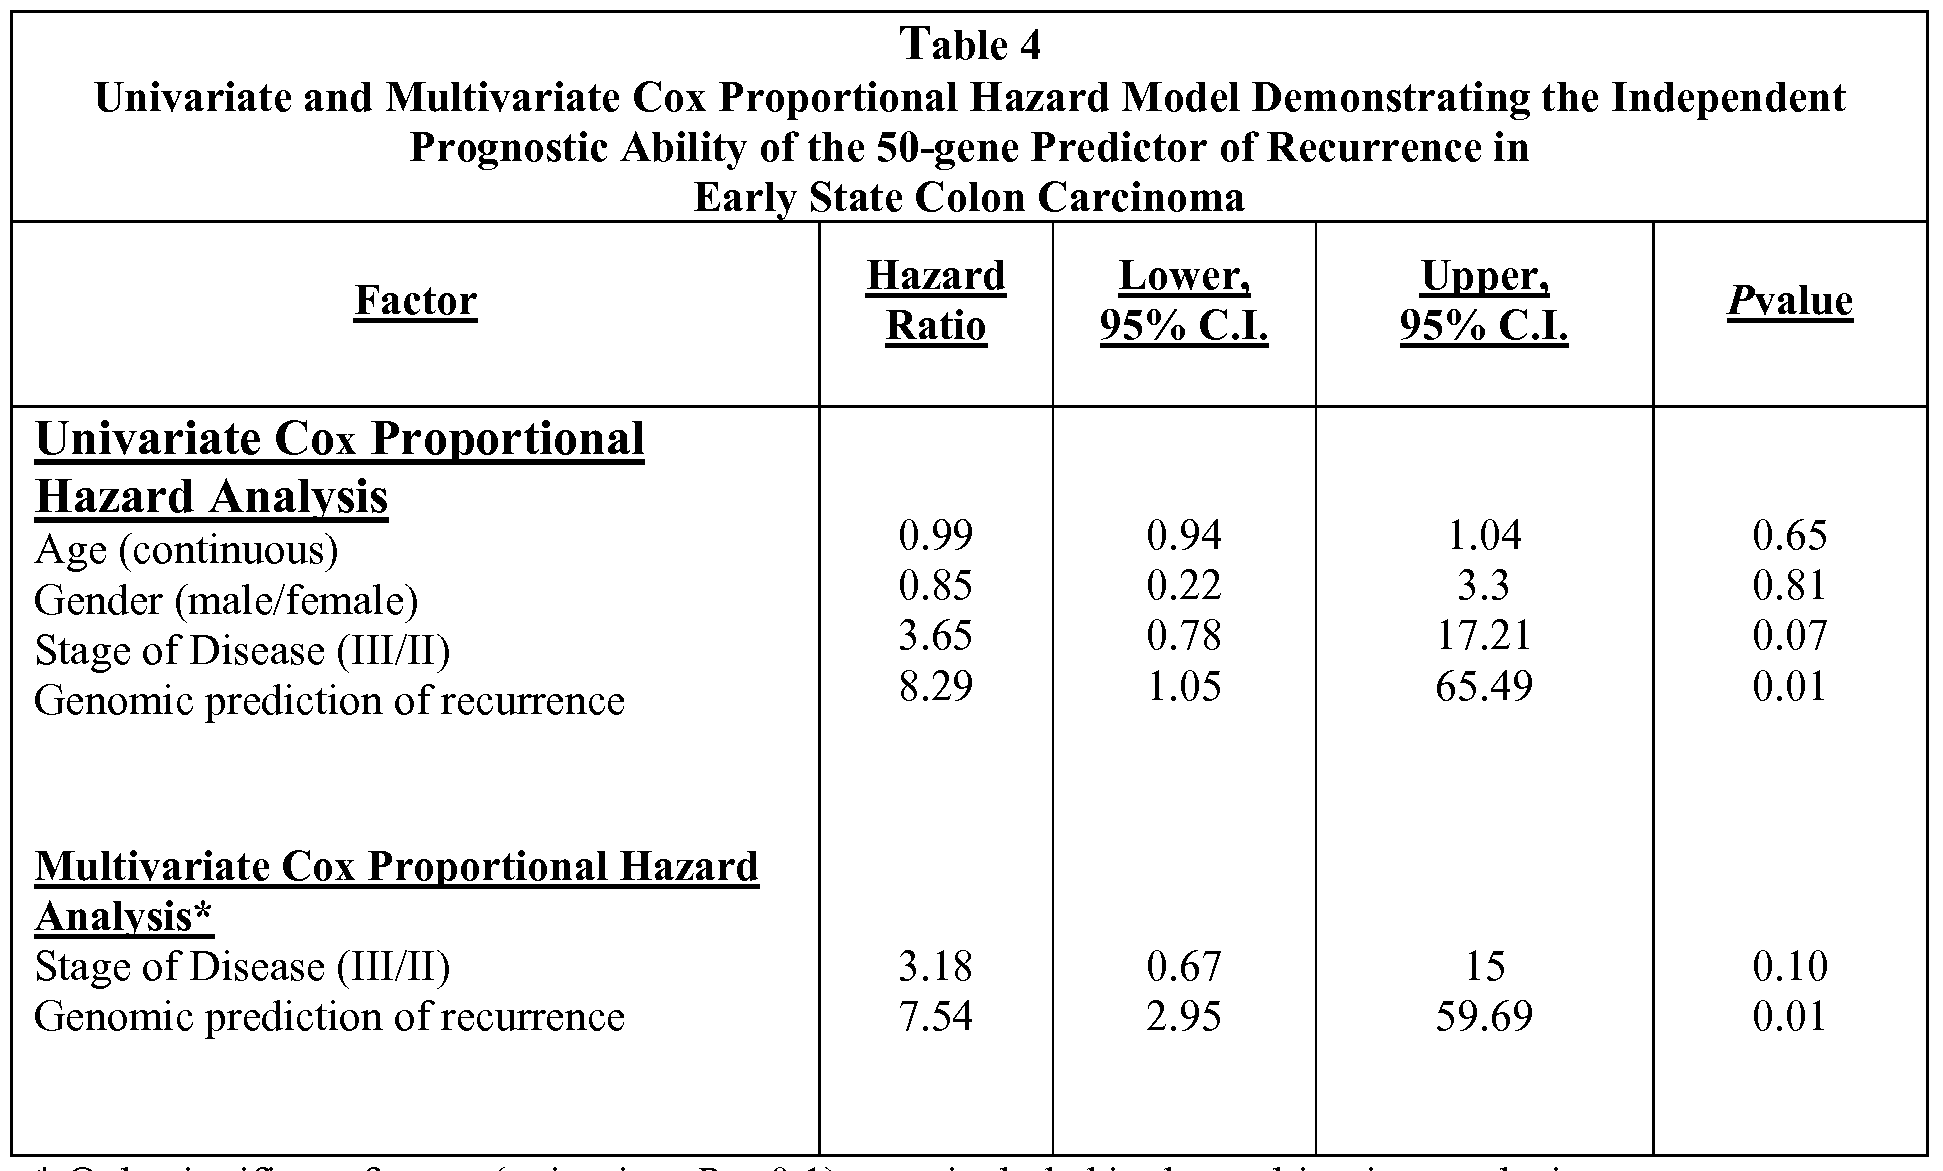
* Only significant factors (univariate P < 0.1) were included in the multivariate analysis.
Recurrence Signature Identifies Therapeutic Opportunities. The primary goal of improved prognosis, and in particular, the ability to identify patients at high risk for
recurrence, is the capacity to identify those patients in need of more effective therapy. Using gene expression methodologies to understand the molecular mechanisms involved in cancer progression may be helpful beyond prognosis because this knowledge may lead to the study of drugs that target relevant, deregulated pathways in an individual patient. More importantly, we may be able to identify specific, effective agents from a repertoire of currently existing drugs.
One source of information to guide this strategy is the Connectivity Map, a project developed at the Broad Institute, to assemble a reference collection of gene-expression profiles from cells that have been treated with a variety of drugs. This effort established links between gene expression profiles and drugs (20). We queried the Connectivity Map to identify drugs that might be connected to the 50-gene colon cancer recurrence signature (genes listed in Table 3, drugs identified by the Connectivity Map in FIG. 7. Four candidate drugs identified by this approach included Tretinoin (a retinol analog), the PBK inhibitor LY-294002, sulindac, and celecoxib.
Linking Gene Expression with Therapeutic Opportunities in Colon Cancer. To evaluate the potential therapeutic efficacy of the candidate agents (Retinol, LY-294002, sulindac, and celecoxib) identified by using the connectivity map analysis, we mapped the 'Recurrence Score' (using the 50-gene model) to a collection of 14 colon cancer cell lines so as to classify the cell- lines as representative of the high-recurrence risk phenotype (with high Recurrence Scores) or the low-recurrence risk phenotype (with low Recurrence Scores). FIG. 8 shows the individual cell lines classified by Recurrence Scores. FIG. 9A shows the stratification of the cell lines by recurrence score and their respective mutational events [KRAS, p53, BRAF, PI3K, CTNNB2 (beta-catenin), APC and CDKN2A], demonstrating that the risk categories determined by our model of recurrence do not segregate based on any one mutation and simulates the genetic heterogeneity seen in clinical practice.
In in vitro cell proliferation assays, colon cancer cell lines were treated with celecoxib, LY294002, retinol (used as a surrogate for tretinoin), and sulindac. The clinically relevant controls for these experiments were cytotoxic agents currently used in the treatment of colon cancer, i.e., 5-fluorouracil and oxaliplatin (24). Biologically relevant differences in
drug sensitivity (between cell lines with high and low Recurrence Scores) were observed for three of the candidate agents: celecoxib (P=OM), LY294002 (P= 0.008), and retinol (P = 0.01) (FIG. 9A). In comparison, traditional chemotherapy agents (5 -FU and oxaliplatin) did not show a significantly greater predilection for inhibiting growth in the cell lines with a high Recurrence Score. Linear regression analyses of the probability of recurrence phenotype/recurrence scores and sensitivity to an individual therapeutic agent in vitro (FIG. 10) revealed a significant correlation for COX2 (celecoxib) (P = 0.03) and PBkinase inhibition (LY294002) (P=O.02), suggesting that specific COX2 and PBKinase inhibitors could be valuable as initial agents in therapeutic intervention studies. Thus, celecoxib and LY294002 were chosen for follow-up experiments to evaluate the therapeutic potential of these agents to reverse the 'high risk' phenotype; again, 5-FU and oxaliplatin were used as controls.
In an effort to simulate high risk phenotype reversal in vitro with celecoxib and LY294002, we used colon cancer cell lines (HCT 15, HT29, WIDR, DLD-I, HCTl 16, and COLO-320) that exhibited high Recurrence Scores (FIG. 7). As shown in FIG. 9B, in multiple replicate experiments, treatment with LY294002 and celecoxib resulted in a significant reduction in the expression of the high recurrence phenotype as shown by the decrease in Recurrence
Score (P = 0.002, ANOVA). In comparison, the cell line experiments using 5-FU and oxaliplatin failed to show a significant reduction (P = 0.19) in the Recurrence Score after treatment (FIG. 9B and 9C). Although most of the cell lines did not demonstrate a significant reduction in Recurrence Score after exposure to traditional chemotherapy (FIG.
9C), two cell lines had a marked reduction in Recurrence Score after exposure to the traditional chemotherapy; this inconsistency across cell lines likely depicts the heterogeneity of response to 5-FU and oxaliplatin seen in actual clinical practice and highlights the need for a more a rational approach to therapy.
Methods
Patient Samples and Data. From publicly available gene expression data collections, all early stage colon cancer patients (stages I and II) with known survival outcomes were identified to constitute the initial training dataset (n=52) for the development of a genomic predictor of disease recurrence (http://people. genome. duke. edu/_eje2/supplemental/). Two independent datasets: an Affymetrix dataset (n = 55 E-MEXP- 1224), representing patients
with primarily stage II colon cancer and another plasmode blinded dataset (n = 73, GSE 10402) representing consecutive patients with early stage colon cancer treated at the University Medical Center Go" ttingen, Germany, were used to independently validate the 50-gene predictor. Table 2 describes the demographic features of the training and validation cohorts.
Metagene Predictor of Recurrence. To develop a metagene predictor for colon cancer recurrence in early stage disease, a training dataset was created by using samples from stage I and II colon cancer that were linked with clinical outcomes (GSE5206 and GSE2138) (n = 52). These datasets were merged by using the Distance-Weighted Discrimination (DWD) (30) (https://genome.unc.edu/pubsup/ dwd/) method to eliminate any systematic biases. The merged dataset was filtered, and 91 genes with significant recurrence effects (P<0.001)were selected for further analyses. Using Bayesian binary regression methodologies previously described (12, 13), a metagene predictor of recurrence was developed. A probit function enabled us to generate a probability of recurrence for each sample, referred to as the "Recurrence Score." An optimal threshold recurrence score value of 0.76 was chosen based on a receiver operated characteristic (ROC) analysis, and was used as the predefined 'cut-point', to dichotomize samples into low risk (Recurrence Score <0.76) and high risk (Recurrence Score > 0.76). The ability of the metagene model was investigated in the two independent datasets in a blinded fashion. For the dataset (n = 73) with available time to relapse, standard Kaplan-Meier curves and their significance levels (log-rank test) were generated by using GraphPad Prism version 4.03 for Windows (GraphPad). Univariate and multivariate analyses were performed by using Cox proportional hazard models, and P values reported are based on likelihood ratio tests, and analyses are performed by using the statistical package R (31). See SI Methods for complete details.
Colon Cancer Cell Lines. To classify cell lines, we measured genome-wide expression in the 14 colon cancer cell lines available through the ATCC, using the Affymetrix U133A Plus 2.0 GeneChip. Complete details of methods involved in growth of the colon cancer cell lines and the in vitro drug sensitivity assays are available in the SI Methods. Total RNA was extracted from the cells with RNeasy kits (Qiagen). TheRNAquality was assessed with the use of a bioanalyzer (Agilent 2100 model). Hybridization targets were prepared from the total RNA according to standard Affymetrix protocols. 'Recurrence Scores' were generated
for the cell lines and the predefined (from the training set) threshold value was then used to dichotomize the cell lines into low and high risk phenotypes. In vitro cell proliferation assays were used to demonstrate the mean percentage cell death when the highest concentration of drug (celecoxib, retinol, LY294002, sulindac, 5-fluorouracil, and oxaliplatin) was used in each cell line as the basis for comparisons of sensitivity, between high and low recurrence risk groups, for each of the drugs tested. Finally, in the cell lines with high Recurrence Scores, after treatment with targeted drugs, gene expression profiles were reassessed to determine if the high-risk phenotype had been reversed.
Real- Time RT-PCR Validation. The top 10 differentially expressed genes from among the 50-gene model were chosen for further validation by using realtime PCR. Briefly, the methods involved Taqman custom arrays. Total RNA extracted from each of the seven high risk and seven low risk cell lines are reverse transcribed into cDNA by using random primers. For PCR, Taqman gene expression assays (including 18s used as the manufacturing control) were used and run on the 7900HT Fast Real-Time PCR System with the Low Density Array Block. After PCR, gene targets were analyzed by assessing Ct values after normalization to GAPDH to compare quantitative expression values. Further details on patient selection, RNA extraction, preprocessing of gene expression data, and statistical analysis are available as SI Methods .
SI Methods
Development of Metagene Predictor. From publicly available gene expression data collections, all early stage colon cancer patients (stages I and II) with known survival outcomes were identified, which constituted the initial training data set (n = 52) for the development of a genomic predictor of disease recurrence. Two data sets were used for validation: an independent data set of 55 patients with stage I/II disease (1) and a plasmode data set (n _ 73, GSE 10402) representing consecutive patients with early stage colon cancer treated at the University Medical Center Go"ttingen, Germany, which was used to independently validate the 50-gene predictor in a blinded manner.
Before statistical modeling, data sets with appropriate clinical data were chosen for the training set. These include GSE5206 (n = 100) and GSE2138 (n = 20). Only early stage
(stages I and II) patient samples were identified and isolated from these two data sets. These subsets of patients from both data sets were later merged using the DWD method. The entire merged data set was rearranged based on patient recurrence score, and appropriate class labels were assigned a zero for all of the patients with no recurrence (n = 45) and a one for all of the patients with recurrence (n = 7) to create an initial training set that represents two distinct biological states. This training set was further filtered based on P values obtained from multiple t tests, and 91 specific genes with significant survival effects (P <0.001) were selected for Bayesian binary regression analyses. Bayesian fitting of binary probit regression models to the training data then permits an assessment of the relevance of the metagene signatures in within-sample classification, and estimation and uncertainty assessments for the binary regression weights mapping metagenes to probabilities. To guard against over-fitting given the disproportionate number of variables to samples, leave-one- out cross validation analysis was performed to test the stability and predictive capability of the model. Finally, a metagene predictor consisting of 50 genes was developed using the aforementioned methodologies. To understand the full meaning of the biology captured in the 50 genes, within the context of the entire biological system, GATHER (http://gather.genome.duke-.edu/) was used. GATHER is a tool that integrates various forms of available metadata to elucidate the biological context within molecular signatures produced from high-throughput data. GATHER also has the capacity to discover novel functions of gene groups by integrating annotations from evolutionary homologs and other genes related through protein interactions or literature networks. GATHER further annotates the characteristics of the genes with respect to data sets from multiple systems, helping synthesize evidence to develop or reinforce hypotheses. Finally, the accuracy with which GATHER can infer novel functions of signatures is interpreted through a Bayesian statistical model.
Validating the 50-Gene Classifier. First, an optimal threshold recurrence score value of 0.76 was chosen based on a receiver operated characteristic (ROC) analysis, and was used as the predefined 'cut-point', to dichotomize samples into low risk (Recurrence Score <0.76) and high risk (Recurrence Score <0.76).
Given a training set of expression vectors (of values across metagenes) representing two biological states (in this case, patient samples with recurrence and with no recurrence), a
binary probit regression model is estimated using Bayesian methods. Before applying these methods, the initial training set and the validation sets (obtained from refs. 1 and 2) were normalized using the DWD method. Standard Kaplan-Meier mortality curves and their statistical significance were generated from the predictive probability values of patients using Graph- Pad software. For the Kaplan-Meier survival analyses, the survival curves were compared using the log-rank test. This test generates a two-tailed P value testing the null hypothesis that the survival curves are identical in the overall populations. Therefore, the null hypothesis is that the populations have no differences in survival.
Univariate and Multivariate Analysis. In an effort to fully understand the prognostic significance of the 50-gene predictor for colon cancer recurrence, univariate and multivariate analyses were performed using Cox proportional hazard models. As seen in Table 4, only factors that were significant in a univariate analyses were used in the multivariate models. Analysis included continuous covariates for age, and dichotomous covariates for gender, stage of disease, and a prediction of recurrence (based on the 50-gene predictor). No adjustment for multiple testing was necessary. Hazard ratios and 95% confidence intervals are reported. P values are based on likelihood ratio tests, and analyses are performed using the statistical package R (3).
Cross-Platform Comparison. An in-house program that has been previously validated (4), Chip Comparer, was used to map probe sets
(http://tenero.duhs.duke.edu/genearray/perl/chip/chipcomparer.pl) across various generations and platforms of Affymetrix GeneChip (http://www.affymetrix.com) and spotted arrays. Also, where needed, to reduce the likelihood of batch effects, a normalizing algorithm, ComBat (http://statistics.byu.edu/ johnson/ComBat/) was applied (5). Because several different microarray platforms were used in the data sets (HG-Ul 33 A, HG-Ul 33 two plus, and HG-U95Av2), the probe sets should be matched to the identical genes. Each probe set ID in given Affymetrix gene chips were first mapped to the corresponding LocusID by parsing local copies of LocusLink and UniGene databases to identify any inherent relationship between the GenBank accession number associated with each probe set sequence and its corresponding LocusID. This was followed by matching probe sets from different gene chips that share the same LocusID.
ComBat Method. When combining data sets from different platforms and different experiments, non-biological experimental variation or "batch effects" are most commonly faced by researchers. It is inappropriate to combine data sets without adjusting for batch effects. To reduce the systematic differences from different data sets and integrate gene expression from all data sets, ComBat method (http://statistics.byu.edu/johnson/ ComBat/) was applied. ComBat method applies either parametric or non-parametric empirical Bayes framework for adjusting data for batch effects that is robust to outliers in a given data set. The location (mean) and scale (variance) model parameters are specifically estimated by pooling information across genes in each batch to shrink the batch effect parameter estimated toward the overall mean of the batch effect estimates. This method was applied to data sets consisting of normal colon samples and tumor samples separately.
Colon Cancer Cell Lines. Fourteen colon cancer cell lines (COLO- 320 HSR, DLD-I, HCTl 15, HCTl 16, HT29, LS174T, LS180, RKO, SW48, SW403, SWl 116, SW1417, SWl 463, and WiDr) that were commercially available were grown as recommended by the supplier (American Type Culture Collection). Culture media RPMI 1640 was used for COLO-320 HSR, HCT 15 and DLD-I; Leibovitz-15 (L-15) was used for SW1417, SW48, SWl 116, SW403 and SW1463; Modified Essential Eagle Medium was used for RKO, LS174T, LS180, and WiDr; McCoy 5A was used for HT-29 and HCT-1116. AU tissue culture media and were obtained from Sigma- Aldrich and was supplemented with 10% Fetal Bovine Serum (FBS). For the drug-sensitivity assays, celecoxib was obtained from LKT Laboratories Inc., the LY294002 was obtained from Cayman Chemical, and the retinol, and sulindac were obtained from Sigma- Aldrich. 5 -FU and oxaliplatin were obtained from the Duke University pharmacy. We hypothesized that cell lines with a high Recurrence Score would be more sensitive to treatment with targeted therapy. We also predicted that treatment would reverse the high risk phenotype in gene expression analysis. To classify cell lines, we measured genome-wide expression in the 14 colon cancer cell lines using the Affymetrix Ul 33 A Plus 2.0 GeneChip. Total RNA was extracted from the cells with RNeasy kits (Qiagen). The RNA quality was assessed with the use of a bioanalyzer (Agilent 2100 model). Hybridization targets were prepared from the total RNA according to standard Affymetrix protocols. 'Recurrence Scores' were generated for the cell lines and the predefined (from the training set) threshold value was then used to dichotomize the cell lines into low and high risk phenotypes. In vitro cell proliferation
assays were used to demonstrate the mean percent sensitivity when the highest concentration of drug (celecoxib, retinol, LY294002, sulindac, 5 -FU, and oxaliplatin) was used in each cell line as the basis for comparisons of sensitivity, between high and low recurrence risk groups, for each of the drugs tested. Finally, in the cell lines with high Recurrence Scores, 8 h after treatment with targeted drugs, gene expression profiles were re-assessed to determine if the high-risk phenotype had been reversed.
In Vitro Drug Sensitivity Assays. The cell proliferation assays for the 14 colon cancer cell lines profiled by gene array analyses included growth inhibition measurements using standard colorimetric assays. Cells were plated in 96-well assay plates at a density of 5,000 cells per well. After incubating for 24 h at 37°C, drugs were added to each well at specific concentrations. Cells were grown in the presence of drugs for an additional 96 h. Celecoxib was used at concentrations of 0.1, 5, 25, 50, and 100; LY294002, a PBKinase inhibitor was used at concentrations of 0.1, 1, 10, 20 and 200; retinol was used at concentrations of 0, 0.1, 1, 5, 10, and 50; sulindac was used at concentrations of 0, 0.1, 1, 10, 100, and 1,000; 5-FU and oxaliplatin were used at concentrations of 0, 0.1, 1, 5, 10, and 20. All concentrations were micromolar. Sensitivity to celecoxib, LY294002, retinol, sulindac, 5-FU, and oxaliplatin was determined by quantifying the percent reduction in growth at 96 h using the standard MTT Cell Proliferation Kit from Roche Applied Science. A Perkin-Elmer Victor 3 Multilabel Plate Reader was used to determine UV absorbance. All experiments were repeated at least three times.
Cell and RNA Preparation. Total RNA was extracted using the Qiashredder and Qiagen Rneasy Mini kits. Quality of the RNA was checked by an Agilent 2100 Bioanalyzer. The targets for Affymetrix DNA microarray analysis were prepared according to the manufacturer's instructions. Biotin-labeled cRNA, produced by in vitro transcription, was fragmented and hybridized to the Affymetrix HG-Ul 33 A Plus 2.0 GeneChip arrays at 45°C for 16 h and then washed and stained using the GeneChip Fluidics. The arrays were scanned by a GeneArray Scanner and patterns of hybridization were detected as light emitted from the fluorescent reporter groups incorporated into the target and hybridized to oligonucleotide probes. All analyses were performed in a MIAME (minimal information about a microarray experiment)- compliant fashion, as defined in the guidelines established by MGED.
RT-PCR Analysis. The top 10 differentially expressed genes from among the 50-gene model were chosen for further validation using real-time PCR. Briefly, the methods involved Taqman custom arrays, a 384-well micro fluidic card that enables 384 real-time PCR reactions to be performed simultaneously without the use of liquid-handling robots or multichannel pipettes. The array is designed for a two-step RT-PCR. In the reverse transcription (RT) stage, total RNA extracted from each of the seven high risk and seven low risk cell lines are reverse transcribed into cDNA using random primers from the High Capacity cDNA Reverse Transcription Kit. One thousand ng of total RNA were transcribed in a 25 μl reaction. After cDNA synthesis, 25 μl of RNase/DNase-free water was added. For each cell line, a total of four replicate samples were generated. For PCR, Taqman gene expression assays (including 18 s used as the manufacturing control) were preloaded into each of the wells of the array. Sample-specific PCR mix was generated by adding 50 μl of the Taqman Universal Master Mix to the 50 μl of cDNA plus water reactions. One hundred μl were pipetted into each port of the Taqman array and run on the 7900HT Fast Real-Time PCR System with the Low Density Array Block. After PCR, gene targets were analyzed by assessing Ct values after normalization to GAPDH to compare quantitative expression values between the low risk and high risk cell lines.
References:
1. Jemal A, et al. (2008) Cancer Statistics, 2008. CA Cancer J Clin 58:71-96.
2. Fearon ER, Vogelstein B (1990) A genetic model for colorectal tumorigenesis. Cell 61:759-767.
3. Vogelstein B, et al. (1988) Genetic alterations during colorectal-tumor development. N Engl J Med 319:525-532. 4. Sjoblom T, et al. (2006) The consensus coding sequences ofhumanbreast and colorectal cancers. Science 314:268-274.
5. WoodLD, et al. (2007) The genomic landscapes ofhumanbreast and colorectal cancers. Science 318:1108-1113.
6. Wood DA (1971) Clinical staging and end results classification: TNM system of clinical classification as applicable to carcinoma of the colon and rectum. Cancer 28: 109-114.
7. Rosell R, et al. (1997) Reduced survival in patients with stage-I non-small-cell lung cancer associated with DNA-replication errors. Int J Cancer 74:330-334.
8. Andre T, et al. (2007) Phase III study comparing a semimonthly with amonthly regimen of fluorouracil and leucovorin as adjuvant treatment for stage II and III colon cancer patients: Final results of GERCOR C96.1. J Clin Oncol 25:3732-3738.
9. Ho SB, et al. (2004) Quantification of colorectal cancer micrometastases in lymph nodes by nested and real-time reverse transcriptase-PCR analysis for carcinoembryonic antigen. Clin Cancer Res 10:5777- 5784.
10. BiId AH, et al. (2006) Oncogenic pathway signatures in human cancers as a guide to targeted therapies. Nature 439:353-357.
11. Huang E, et al. (2003) Gene expression predictors of breast cancer outcomes. Lancet 361:1590-1596.
12. Potti A, et al. (2006) A genomic strategy to refine prognosis in early-stage non-smallcell lung cancer. N Engl J Med 355:570-580.
13. Pittman J, et al. (2004) Integrated modeling of clinical and gene expression information for personalized prediction of disease outcomes. Proc Natl Acad Sci USA 101:8431- 8436.
14. Pittman J, Huang E, Nevins J, Wang Q, West M (2004) Bayesian analysis of binary prediction tree models for retrospectively sampled outcomes. Biostatistics 5:587-601.
15. Lin YH, et al. (2007) Multiple gene expression classifiers from different array platforms predict poor prognosis of colorectal cancer. Clin Cancer Res 13:498-507. 16. Bandres E, et al. (2007)Agene signature of 8 genes could identify the risk of recurrence and progression in Dukes' B colon cancer patients. Oncol Rep 17:1089-1094.
17. Barrier A, et al. (2006) Stage II colon cancer prognosis prediction by tumor gene expression profiling. J Clin Oncol 24:4685-4691.
18. Del Rio M, et al. (2007) Gene expression signature in advanced colorectal cancer patients select drugs and response for the use of leucovorin, fluorouracil, and irinotecan. J Clin Oncol 25:773-780.
19. Wang Y, et al. (2004) Gene expression profiles and molecular markers to predict recurrence of Dukes' B colon cancer. J Clin Oncol 22:1564-1571.
20. Lamb J, et al. (2006) The Connectivity Map: Using gene-expression signatures to connect small molecules, genes, and disease. Science 313: 1929-1935. 21. Arber N, et al. (2006) Celecoxib for the prevention of colorectal adenomatous polyps. N Engl J Med 355:885-895.
22. Bertagnolli MM, et al. (2006) Celecoxib for the prevention of sporadic colorectal adenomas. N Engl J Med 355:873-884.
23. Rostom A, et al. (2007) Nonsteroidal anti-inflammatory drugs and cyclooxygenase-2 inhibitors for primary prevention of colorectal cancer: A systematic review prepared for the U.S. Preventive Services
Task Force. Ann Intern Med 146:376-389.
24. Kuebler JP, et al. (2007) Oxaliplatin combined with weekly bolus fluorouracil and leucovorin as surgical adjuvant chemotherapy for stage II and III colon cancer: Results from NSABP C-07. J Clin Oncol 25:2198-2204. 25. Kohne CH, et al. (2008) Irinotecan combined with infusional 5-fluorouracil/folinic acid or capecitabine plus celecoxib or placebo in the first-line treatment of patients with metastatic colorectal cancer. EORTC study 40015. Ann Oncol 19:920-926.
26. El-Rayes BF, et al. (2008) Phase-II study of dose attenuated schedule of irinotecan, capecitabine, and celecoxib in advanced colorectal cancer. Cancer Chemother Pharmacol 61 :283-289.
27. Gradilone A, et al. (2008) Celecoxib upregulates multidrug resistance proteins in colon cancer: Lack of synergy with standard chemotherapy. Curr Cancer Drug Targets 8:414-420. 28. Perou CM, et al. (2000) Molecular portraits of human breast tumours. Nature 406:747- 752.
29. Ramaswamy S (2004) Translating cancer genomics into clinical oncology. N Engl JMed 350: 1814— 1816.
30. Benito M, et al. (2004) Adjustment of systematic microarray data biases. Bioinformatics 20: 105-114.
31. Ihaka R, Gentleman R (1996) R: A language for data analysis and graphics. J Compu Graph Stat 5:299-314.
32. Johnson WE, Li C, Rabinovic A (2007) Adjusting batch effects in microarray expression data by using empirical Bayes methods. Biostatistics 8: 118-127.
S 1. Lin YH, et al. (2007) Multiple gene expression classifiers from different array platforms predict poor prognosis of colorectal cancer. Clin Cancer Res 13:498-507. S2. Reid et al.
S4. Pittman J, Huang E, Nevins J, Wang Q, West M (2004) Bayesian analysis of binary prediction tree models for retrospectively sampled outcomes. Biostatistics 5:587-601.
Claims
1. A method for predicting the likelihood of recurrence of cancer in a subject comprising: determining the expression of a set of genes in a cancer cell from the subject, the set comprising at least five genes from the recurrence predictor set of Table 1; and comparing the expression of the set of genes to a reference, the results being predictive of a likelihood of recurrence of the cancer.
2. The method of claim 1, wherein the expression of the set of genes is determined by analyzing a nucleic acid sample from the cancer.
3. The method of claim 1, wherein the expression of the set of genes is determined by analyzing a protein sample from the cancer.
4. The method of claim 1 or 2, wherein expression of the set of genes is determined using a nucleic acid microarray.
5. The method of any of claims 1-4, wherein the set of genes comprises at least 10 genes from Table 1.
6. The method of any of claims 1-4, wherein the set of genes comprises at least 20 genes from Table 1.
7. The method of any of claims 1-4, wherein the set of genes comprises all the genes from Table 1.
8. The method of any of claims 1-7, wherein the cancer is a colon cancer.
9. The method of any of claims 1-8, wherein the comparison includes extracting a single dominant value of the expression of the set of genes in the reference using singular value decomposition (SVD) and determining the value of the recurrence predictor set in the cancer.
10. The method of any of claims 1-9, wherein the comparison includes applying one or more statistical models, each model producing a statistical probability of the likelihood of recurrence of the cancer.
11. The method of claim 10, wherein the statistical model is a binary regression model.
12. The method of claim 10, wherein the statistical model is a tree model, the tree model including one or more nodes, each node representing a metagene, each node including a statistical probability of likelihood of recurrence of the cancer.
13. The method of any of claims 1-12, wherein the method predicts recurrence with at least 70% accuracy.
14. A method of developing a treatment plan for an individual with colon cancer comprising using the predicted likelihood of recurrence of a cancer obtained by the method of any of claims 1-13 to develop a treatment plan.
15. The method of claim 14, further comprising comparing the expression of a set of genes in a colon cancer cell from the individual to a reference, the reference comprising at least five genes from chemotherapy responsivity predictor set of gene expression profiles predictive of responsivity to chemotherapeutic agents; and predicting responsiveness of the cancer to the chemotherapeutic agents.
16. The method of any of claims 14 or 15, wherein the treatment plan includes administering an effective amount of a chemotherapeutic agent to the individual with the cancer.
17. The method of any of claims 14-16, wherein the plan includes administering the chemotherapeutic agent before, after or concurrently with the administration of one or more alternative chemotherapeutic agents.
18. The method of claim 16 or 17, wherein the chemotherapeutic agent is selected from the group comprising retinol analogs, PI3K inhibitors, sulindac and COX2 inhibitors.
19. The method of any of claims 14-18, wherein the treatment plan has an estimated efficacy of at least 50%.
19. A kit comprising a gene chip for predicting the likelihood of recurrence of a cancer, the gene chip comprising nucleic acids capable of detecting at least five genes selected from Table 1 and instructions for predicting recurrence of a cancer.
20. A computer readable medium comprising gene expression profiles of reference cancers having known recurrence phenotypes and corresponding recurrence information, the gene expression profiles comprising at least five genes from Table 1.
Applications Claiming Priority (4)
| Application Number | Priority Date | Filing Date | Title |
|---|---|---|---|
| US11701008P | 2008-11-21 | 2008-11-21 | |
| US61/117,010 | 2008-11-21 | ||
| US11926108P | 2008-12-02 | 2008-12-02 | |
| US61/119,261 | 2008-12-02 |
Publications (1)
| Publication Number | Publication Date |
|---|---|
| WO2010060055A1 true WO2010060055A1 (en) | 2010-05-27 |
Family
ID=42198539
Family Applications (1)
| Application Number | Title | Priority Date | Filing Date |
|---|---|---|---|
| PCT/US2009/065570 Ceased WO2010060055A1 (en) | 2008-11-21 | 2009-11-23 | Predicting cancer risk and treatment success |
Country Status (1)
| Country | Link |
|---|---|
| WO (1) | WO2010060055A1 (en) |
Cited By (6)
| Publication number | Priority date | Publication date | Assignee | Title |
|---|---|---|---|---|
| US9920357B2 (en) | 2012-06-06 | 2018-03-20 | The Procter & Gamble Company | Systems and methods for identifying cosmetic agents for hair/scalp care compositions |
| US10072293B2 (en) | 2011-03-31 | 2018-09-11 | The Procter And Gamble Company | Systems, models and methods for identifying and evaluating skin-active agents effective for treating dandruff/seborrheic dermatitis |
| US10196691B2 (en) | 2011-01-25 | 2019-02-05 | Almac Diagnostics Limited | Colon cancer gene expression signatures and methods of use |
| US10214777B2 (en) | 2010-09-15 | 2019-02-26 | Almac Diagnostics Limited | Molecular diagnostic test for cancer |
| CN112365948A (en) * | 2020-10-27 | 2021-02-12 | 沈阳东软智能医疗科技研究院有限公司 | Cancer stage prediction system |
| CN112599190A (en) * | 2020-12-17 | 2021-04-02 | 重庆大学 | Method for identifying deafness related genes based on mixed classifier |
Citations (3)
| Publication number | Priority date | Publication date | Assignee | Title |
|---|---|---|---|---|
| WO2006124836A1 (en) * | 2005-05-13 | 2006-11-23 | Duke University | Gene expression signatures for oncogenic pathway deregulation |
| US20070172844A1 (en) * | 2005-09-28 | 2007-07-26 | University Of South Florida | Individualized cancer treatments |
| WO2007142936A2 (en) * | 2006-05-30 | 2007-12-13 | Duke University | Prediction of lung cancer tumor recurrence |
-
2009
- 2009-11-23 WO PCT/US2009/065570 patent/WO2010060055A1/en not_active Ceased
Patent Citations (3)
| Publication number | Priority date | Publication date | Assignee | Title |
|---|---|---|---|---|
| WO2006124836A1 (en) * | 2005-05-13 | 2006-11-23 | Duke University | Gene expression signatures for oncogenic pathway deregulation |
| US20070172844A1 (en) * | 2005-09-28 | 2007-07-26 | University Of South Florida | Individualized cancer treatments |
| WO2007142936A2 (en) * | 2006-05-30 | 2007-12-13 | Duke University | Prediction of lung cancer tumor recurrence |
Cited By (9)
| Publication number | Priority date | Publication date | Assignee | Title |
|---|---|---|---|---|
| US10214777B2 (en) | 2010-09-15 | 2019-02-26 | Almac Diagnostics Limited | Molecular diagnostic test for cancer |
| US10378066B2 (en) | 2010-09-15 | 2019-08-13 | Almac Diagnostic Services Limited | Molecular diagnostic test for cancer |
| US10196691B2 (en) | 2011-01-25 | 2019-02-05 | Almac Diagnostics Limited | Colon cancer gene expression signatures and methods of use |
| US10072293B2 (en) | 2011-03-31 | 2018-09-11 | The Procter And Gamble Company | Systems, models and methods for identifying and evaluating skin-active agents effective for treating dandruff/seborrheic dermatitis |
| US9920357B2 (en) | 2012-06-06 | 2018-03-20 | The Procter & Gamble Company | Systems and methods for identifying cosmetic agents for hair/scalp care compositions |
| CN112365948A (en) * | 2020-10-27 | 2021-02-12 | 沈阳东软智能医疗科技研究院有限公司 | Cancer stage prediction system |
| CN112365948B (en) * | 2020-10-27 | 2023-07-18 | 沈阳东软智能医疗科技研究院有限公司 | Cancer Staging Prediction System |
| CN112599190A (en) * | 2020-12-17 | 2021-04-02 | 重庆大学 | Method for identifying deafness related genes based on mixed classifier |
| CN112599190B (en) * | 2020-12-17 | 2024-04-05 | 重庆大学 | Method for identifying deafness-related genes based on mixed classifier |
Similar Documents
| Publication | Publication Date | Title |
|---|---|---|
| Lu et al. | A gene expression signature predicts survival of patients with stage I non-small cell lung cancer | |
| CN101356532B (en) | Gene-based algorithmic cancer prognosis | |
| CN103733065B (en) | Molecular diagnostic tests for cancer | |
| Wozniak et al. | Integrative genome-wide gene expression profiling of clear cell renal cell carcinoma in Czech Republic and in the United States | |
| Jansen et al. | Decreased expression of ABAT and STC2 hallmarks ER-positive inflammatory breast cancer and endocrine therapy resistance in advanced disease | |
| US20130332083A1 (en) | Gene Marker Sets And Methods For Classification Of Cancer Patients | |
| US11788148B2 (en) | Prognostic and treatment response predictive method | |
| Alsaleem et al. | A novel prognostic two-gene signature for triple negative breast cancer | |
| US20120323594A1 (en) | Prognostic and predictive gene signature for non-small cell lung cancer and adjuvant chemotherapy | |
| CN111187839B (en) | Application of m5C methylation-related regulatory genes in predicting the prognosis of liver cancer | |
| WO2007038792A2 (en) | Individualized cancer treatments | |
| EP3964589A1 (en) | Assessing colorectal cancer molecular subtype and uses thereof | |
| AU2015289758A1 (en) | Methods for evaluating lung cancer status | |
| Park et al. | Development and validation of a prognostic gene-expression signature for lung adenocarcinoma | |
| JP2015536667A (en) | Molecular diagnostic tests for cancer | |
| JP2016536001A (en) | Molecular diagnostic test for lung cancer | |
| JP5089993B2 (en) | Prognosis of breast cancer | |
| US20090177450A1 (en) | Systems and methods for predicting response of biological samples | |
| JP2010502227A (en) | Methods for predicting distant metastasis of lymph node-negative primary breast cancer using biological pathway gene expression analysis | |
| Khatri et al. | A transcriptomics-based meta-analysis combined with machine learning identifies a secretory biomarker panel for diagnosis of pancreatic adenocarcinoma | |
| EP2419540B1 (en) | Methods and gene expression signature for assessing ras pathway activity | |
| Wan et al. | Signaling pathway-based identification of extensive prognostic gene signatures for lung adenocarcinoma | |
| WO2010060055A1 (en) | Predicting cancer risk and treatment success | |
| Guo et al. | A qualitative signature for predicting pathological response to neoadjuvant chemoradiation in locally advanced rectal cancers | |
| Bhadresha et al. | A predictive biomarker panel for bone metastases: liquid biopsy approach |
Legal Events
| Date | Code | Title | Description |
|---|---|---|---|
| 121 | Ep: the epo has been informed by wipo that ep was designated in this application |
Ref document number: 09828361 Country of ref document: EP Kind code of ref document: A1 |
|
| NENP | Non-entry into the national phase |
Ref country code: DE |
|
| 122 | Ep: pct application non-entry in european phase |
Ref document number: 09828361 Country of ref document: EP Kind code of ref document: A1 |