WO2008077160A1 - Method and system for video quality estimation - Google Patents
Method and system for video quality estimation Download PDFInfo
- Publication number
- WO2008077160A1 WO2008077160A1 PCT/AT2006/000539 AT2006000539W WO2008077160A1 WO 2008077160 A1 WO2008077160 A1 WO 2008077160A1 AT 2006000539 W AT2006000539 W AT 2006000539W WO 2008077160 A1 WO2008077160 A1 WO 2008077160A1
- Authority
- WO
- WIPO (PCT)
- Prior art keywords
- content
- video
- quality estimation
- motion
- shot
- Prior art date
- Legal status (The legal status is an assumption and is not a legal conclusion. Google has not performed a legal analysis and makes no representation as to the accuracy of the status listed.)
- Ceased
Links
Classifications
-
- H—ELECTRICITY
- H04—ELECTRIC COMMUNICATION TECHNIQUE
- H04N—PICTORIAL COMMUNICATION, e.g. TELEVISION
- H04N17/00—Diagnosis, testing or measuring for television systems or their details
- H04N17/004—Diagnosis, testing or measuring for television systems or their details for digital television systems
Definitions
- the present invention refers to a method and a system for video quality estimation, in particular for low resolution video sequences.
- Such low resolution video sequences are typical in video streaming applications, e.g. in mobile video streaming applications .
- WO03/042922 A and WO03/101121 A an estimation of the objective quality of compressed video data is described where no access to the source data is gained.
- a picture type determination is carried, namely to determine whether the decoder video data is intra-coded; thereafter, a discrete cosine transform (DCT) is performed to obtain DCT coefficients, and an average quantisation error is determined on the basis of the variance of the DCT coefficients, and this quantisation error is used to calculate a peak signal to noise ratio (PSNR) .
- DCT discrete cosine transform
- temporal/spatial characteristics are derived from both a deteriorated video sequence and a reference video signal, and for quality estimation, the temporal/spatial characteristic amount is weighted according to the relationship between the deteriorated video and the user subjective evaluation value.
- Common resolutions are Quarter Common Intermediate Format (QCIF, 176x144 pixels) for cell phones, Common Intermediate Format (CIF, 352x288 pixels) and Standard Interchange Format (SIF, 320x240 pixels) for data cards and palmtops (PDA) .
- QCIF Quarter Common Intermediate Format
- CIF Common Intermediate Format
- SIF Standard Interchange Format
- 320x240 pixels data cards and palmtops
- the mandatory codec for UMTS (Universal Mobile Telecommunications System) streaming applications is H.263 but the 3GPP release No. 6 already supports a baseline profile of the H.264 /AVC codec.
- the appropriate encoder settings for UMTS streaming services differ for different streaming content types, and streaming application (resolution, codec) .
- bearers with 64-384 kbit/s are used for multimedia (audio and video) streaming.
- Mo- bile terminals have limited complexity and power, so the decoding of higher rate videos becomes quite a challenging task. It can be assumed that the maximum supported video bit-rates for the QCIF resolution are 105 kbit/s and for the CIF and SIF resolutions are 200 kbit/s.
- the present invention is based on the finding that complexity of video quality estimation may be kept low in the case that the video content character is estimated due to its content dependence of subjective video quality.
- the present invention provides a method and a system with the features as defined in the independent claims. Preferred and advantageous embodiments are defined in the dependent claims.
- the present technique a simple, efficient and fast estimation of video quality for low resolution video sequences typical in (mobile) video streaming applications is possible. Since the video quality experienced by users depends considerably on the the spatial (edges, colors, ...) and temporal (movement speed, direction, ... ) features of the video sequence, this invention is, according to a first aspect, based on a two-step approach to quality estimation. Firstly, shots between two scene changes are analysed and their content class is found. Secondly, based on the content class, frame rate and bit rate, the estimation of quality is carried out.
- the invention provides quality estimation simply based on motion character which is determined, by amount and direction of motion between two scene changes.
- the design of quality metric is based on content adaptive parameters allowing content-dependent video quality estimation, namely according to this specific aspect also without separately determining a respective content class.
- a particular feature of the invention with respect to obtaining fast and robust quality estimation is to use motion characteristics of the video sequence, and this motion characteristics can also be used when determining the respective content class.
- the motion characteristics can be based on motion vector statistics where, in principle, usable algorithms are known per se.
- bit rate and/or the frame rate of the video data are used for performing the quality estimation.
- uniformity of movement uniformity of movement, horizontalness of movement, zero motion vector ratio, mean motion vector size and/or the ratio of motion vector deviation may be used, definitions of the above-mentioned specific motion characteristics being given below.
- Z is the zero motion vector ratio within one shot
- S is the ratio of motion vector deviation within one shot
- N is the mean motion vector size within one shot and U is the uniformity of movement within one shot.
- MOS a+b-BR+c-Z+d-S e +f-N 2 +g-ln(U)+h-S-N wherein MOS is the mean opinion score
- BR is the bit rate
- Z is the zero motion vector ratio within one shot
- S is the ratio of motion vector deviation within one shot
- N is the mean motion vector size within one shot
- U is the uniformity of movement within one shot
- a, b, c, d, e, f, g and h are metric coefficients which are empirically determined.
- MOS f ( BR , FR , Content _ Class) wherein MOS is the mean opinion score, BR is the bit rate, and
- FR is the frame rate.
- such a system comprises a content classifier which is arranged for evaluating the content of the respective video sequence and determining an associated content class out of a group of predetermined content classes; furthermore, a metric module is provided which is arranged to perform quality estimation on the basis of known per se statistics for the associated content class.
- the metric module is arranged to perform quality estimation for the associated content class on the basis of bit rate and frame rate.
- the content classifier preferably comprises a scene change detector so that it is possible to determine the content class for each video shot or video frame.
- the content classifier comprises a motion vector calculation unit and a motion vector features extraction unit connected thereto, to base the determination of the content class on motion vector characteristics.
- the content classifier may comprise a color features extraction unit.
- the content classifier is arranged at the sender- side whereas the metric module is arranged at the receiver-side.
- a particular advantage of the present technique is that no reference picture is needed. Furthermore, the parameters of the respective models used for quality estimation may simply be obtained empirically, by tests with people.
- Fig. 1 schematically shows a design for a preferred content classifier as a part of the system of the present invention
- Fig. 2 shows in its parts Fig. 2A and Fig. 2B model ECDFs (ECDF - empirical cumulative distribution functions) vs. uniformity of movement (Fig. 2A) and zero motion vector ratio (Fig. 2B) for four content classes #1 to #4;
- ECDFs ECDF - empirical cumulative distribution functions
- Fig. 2A uniformity of movement
- Fig. 2B zero motion vector ratio
- Fig. 3 schematically shows a system for video quality estimation according to a preferred embodiment of the invention
- Fig. 4 illustrates principle component analyses (PCA) results for all (five) content classes with respect to two components 1 and 2;
- Fig. 5 illustrates a diagram showing the relationship between estimated MOS (MOS - Mean Opinion Score) vs. subjective MOS results
- Fig. 6 shows a diagram of PCA results similar to Fig. 4, but now for the embodiment where the results are valid for all content classes, that means that now specific content classes are de- termined before estimation/ and
- Fig. 7 illustrates a diagram similar to Fig. 5 with respect to the estimated and subjective MOS results for the case of Fig. 6.
- the compression parameters As well as the network settings so that they maximise the end-user quality. Thanks to its significant video compression gain the newest video coding standard H.264/AVC allows for providing video streaming for low bit and frame rates while preserving the perceptual quality. This is especially suitable for video applications in 3G wireless networks.
- Basis for such parameters and settings is an adequate estimation of video quality, and the present technique aims at an estimation of video quality, especially of mobile video streaming, at the user-level (perceptual quality of service) for any codec settings in 3G network or the like, and for any video content types. In particular, it is intended to recognise the most significant content types, to estimate the video quality of mobile video streaming at the user-level (perceptual quality of service) and to find most suitable codec settings for these frequent content types .
- the human visual perception of video content is determined by the character of the observed sequence. Therefore, at the present technique, it is preferred to distinguish different content characters/classes because they strongly influence the subjective quality.
- the character of a sequence can be described by the amount of the edges (spatial information) in the individual frames and by the type and direction of movement (temporal information) .
- the data rate of the video sequence to be examined is shared by the number of frames per second. Higher frame rates result in a lower amount of spatial information in individual frames and possibly in some compression artifacts. Thus, taking the data rate as an objective parameter, one can look either on the spatial information or on the temporal information. In the prior art, see e.g. Kusuma T.M.
- a content classifier 1 design is shown where an original video sequence is supplied at 2 to a scene change detector 3 to which a motion vector (MV) calculation unit 4, on the one hand, and a color features extraction unit 5, on the other hand, are connected.
- a motion vector features extraction unit 6 follows the motion vector calculation unit 4, and has its output connected to a content class estimation unit 7 which is connected also to the color features extraction unit 5, and provides at its output, at 8, the respective content classes.
- a video stream 2 can consist of a plurality of different scenes with different contents, spatial and temporal information (i.e. a typical video sequence of news consists of some shots of the moderator and diverse reportage shots of the described events) . Since each shot of a sequence can have a different content character, splitting a video into its basic temporal units - shots - is an initial step in the process of video content classification due to content of shots variation within one sequence.
- a shot is a series of video frames taken by one camera (e.g. zooming in or out an object, panning along a landscape etc.). Two consecutive shots are separated by a shot boundary, which can be abrupt or gradual.
- the most suitable low-complexity method for the present purpose is a scene change detection based on a dynamic threshold, as is per se known from Dimou A. et al., NN Scene Change Detection for H.264 Using Dynamic Threshold Techniques", Proc. of the 5 th EURA- SIP Conference on Speech and Image Processing, Multimedia Communications and Service, (2005) .
- the method can be tuned up for the present purpose: the coefficients of the thresholding function are modified, and ten upcoming frames are additionally taken into account.
- the scene change detector 3 works with precision and recall higher than 97%. Such accuracy is more than satisfying for the present purpose of content classification.
- Motion vector unit 4 The block from the current frame for which a matching block is sought is known as the target block. The relative difference in the locations between the matching block and the target block is known as the motion vector (MV) . If the matching block is found at the same location as the target block then the difference is zero, and the motion vector is known as zero vector.
- MV motion vector
- target block and matching block increases (approximately linearly) with the size of the blocks; smaller blocks better describe the actual motion in the frame.
- an increase of the objective accuracy does not always imply a better performance. It has been observed that, if the blocks are selected too small, the resulting motion vectors do not reflect anymore the motion as it is perceived by a viewer. Due to the -unavoidable presence of noise in video sequences, and the characteristics of the human visual system, it happens that movement is detected although a human observer does not see it. Such behavior is not desirable for the present technique. After several trials with videos of different character, it has been found that a block size of 8> ⁇ 8 pixels would be a good trade-off for QVGA resolution sequences. The 320x240 pixels are divided into 30 ⁇ 40 blocks, which gives a total number of 1200 MVs per frame.
- the second part of the process is block matching.
- Each block in the current frame is compared to a certain search region in the past frame in order to find a matching block. This operation can be performed only on the luminance component of the frame .
- a matching criterion has to be used to quantify the similarity between the target block and the candidate blocks. Because of its simplicity and good performance, it is preferred to use the sum of absolute differences (SAD) , computed as the pixel-wise sum of the absolute differences between the two blocks being compared:
- B n and B m are the two blocks of size NxM, and i and j denote pixel coordinates. If more than one SAD minimum is detected, priority is given to the matching block the position of which is most similar to that of the target block, or equival- ently, to the motion vector of smallest size.
- the static or dynamic character of a sequence is one of the main causes for the differences in perceived quality. It is intended to perform a classification not only in terms of "static sequences” and “dynamic sequences”, but also to investigate this aspect more in depth and determine typical levels of quantity of movement for every main content class.
- the overall amount of movement, or equivalently, the lack of movement in a frame can be easily estimated on the basis of the proportion of blocks with zero vectors, that is, blocks that do not move from one frame to the other. Therefore, the average proportion of static blocks in a sequence of frames is very useful when contents with typical different "levels" of overall movement are to be distinguished.
- the length of a respective motion vector indicates how far the block has moved from one frame to the next, and its angle provides the information in which direction this movement occurred. Therefore, the mean size of the motion vectors in a frame or sequence of frames is an indicator of how fast the overall movement happens. On the other hand, knowing exactly in which direction the movement is taking place seems rather useless, or redundant, respectively for the present estimation. On the other hand, detecting a main direction of movement that corresponds to a big proportion of motion vectors pointing in the same direction, is a valuable information. Thus, it can be assumed that the analysis of the distribution of sizes and angles of the motion vectors can give substantial information about the character of the motion in the sequence. A set of statistical calculations on the motion vectors has been implemented in order to study their level of significance and find out which features can be used to identify perceptual content types.
- content classification may be based on the following statistical and resolution-independent features of motion vectors within one shot (over all the frames of the analyzed sequence) :
- This ratio z is the percentage of zero motion vectors in a frame. It is the proportion of the frame that does not change at all (or changes very slightly) between two consecutive frames. It usually corresponds to the background if the camera is static within one shot .
- n the proportion of the mean size of the non-zero motion vectors within one frame normalized to the screen width, expressed in percentage is denoted. This parameter n determines the amount of the global motion.
- the parameter u is the percentage of motion vectors which point in the dominant direction (the most frequent direction of motion vectors) in the frame.
- the granularity of the direction may be set to 10 degrees.
- Horizontalness is defined as the percentage of motion vectors pointing in horizontal direction. Horizontal motion, vectors are from intervals (-l ⁇ ;l ⁇ ) or ( 170; 190) degrees.
- color features can be considered, compare unit 5. Color histograms provide additional information about the spatial sequence character because in different types of contents, the density and magnitude of colors differ as well. Soccer sequences for example contain a lot of varying green colors while cartoon sequences exhibit discrete saturated, colors. This characteristic has important consequences to the compression and transmission artifacts. Therefore, also the following parameter may be used:
- Greenness G is defined as the percentage of green pixels in a frame.
- the RGB color space may be down sampled to two bits per color component resulting in 64 colors. Five colors out of the 64 colors cover all variation of the green color.
- five content classes #1 to #5 are identified and based on the content features defined above. Furthermore, examples for decision algorithms for automatic content classification are now to be disclosed and evaluated.
- Content class #1 (e.g. news):
- the content class #1 includes sequences with a small moving region of interest (face) on a static background.
- the movement in the region of interests (ROI) is mainly determined only by eyes, mouth and face movements.
- the ROI covers up to approximately 15% of the screen surface.
- Content class #2 (e.g. soccer) : This content class #2 contains wide angle camera sequences with uniform camera movement (panning) .
- the camera is e.g. tracking a small rapid moving object (ball) on the uniformly colored (e.g. typically green) background.
- Content class #3 (e.g. cartoon): In this content class #3 object motion is dominant, and the background is usually static. The global motion is almost not present due to its artificial origin of the movies (no camera) . The movement object has no natural character.
- Content class #4 (e.g. panorama): This content class #4 includes global motion sequences taken with a wide angle panning camera. The camera movement is uniform and in a single direction.
- Content class #5 (rest) : The content class #5 contains a lot of global and local motion or fast scene changes. Scenes shorter than three seconds are also associated to this content class #5. The content class #5 covers scenes which do not fit any of the previous four classes.
- each of the described content classes is determined by unique statistical features of motion and color parameters (see Fig. 2) . Due to their unique statistical features of well defined content classes it is not necessary to perform M-ary hypothesis testing and it is sufficient to formulate a null hypothesis (HO) for each content class based on these statistical features separately. Since the distributions of investigated parameters do not fit well with any known distribution functions, the sequence is classified as content class number five. For the present hypothesis evaluation a method is preferred which is capable of working with empirical (sample) distributions.
- the most suitable is non-parametric and distribution-free: the Kolmogorov-Smirnov (KS) test, compare Bosch K., "Statizing- Taschenbuch", Oldenbourg Hor Hor Horsch. VIg., (1998).
- the KS test is used to determine whether two underlying probability distributions differ, or whether an underlying probability distribution differs from a hypothesized distribution, in either case based on finite samples.
- the two-sample KS test is one of the most useful and general nonparametric methods for comparing two samples, as it is sensitive to differences in both location and shape of the empirical cumulative distribution functions of the two samples. From the typical set of sequences for each content class the empirical cumulative distribution functions (ECDF) are obtained.
- ECDF empirical cumulative distribution functions
- model ECDFs were derived from a set of 142 typical sequences. Each content class is described with five model ECDFs (zero MV ratio, mean MV size, uniformity of movement, horizontalness of movement, greenness) , which correspond to their HO hypothesis, respectively. Furthermore, it is necessary to find the maximal deviation (D cc max) within one content class for all parameters (for each model ECDF). If F n (x) is the model ECDF and F(x) is the ECDF of the investigated sequence, the maximal difference D n between F n (x) and F(x) may be written as follows :
- the content class estimation is based on a binary hypothesis test within first four content classes.
- the KS test the ECDFs of the investigated sequence and all model ECDFs of the first four content classes are compared.
- the KS test compares five ECDF (of defined MV or color parameters) of defined content classes specified by the HO hypothesis with all five ECDFs of the investigated content. If the obtained D n for all parameters and of (the first four) content classes is smaller than D cc max for each parameter than the investigated sequence matches this content class.
- the content classifier 1 decides for the rest content class #5.
- the classifier 1 estimates the content on transmitter side from the original sequence.
- Fig. 2 examples of model ECDFs, as described above, of the uniformity of movement u (Fig. 2A) and of the zero MV ratio z (Fig. 2B) are shown with respect to content classes #1, #2, #3 and #4.
- the performance of the content classifier 1 was evaluated with two parameters. (1) False detection reflects the ratio of improper detection of a content class, in the case when bang- ated sequences belong to any other content class. (2) Good match reflects the ratio of successful classification of investigated sequences, when investigated sequences belong to any of the first four classes. It should be noted that in the tested sequences, almost only cuts have been present, and no gradual changes. The scene change detector 3 was sensitive on gradual shot boundaries (dissolve, fades or wipes) . As may be seen from the following Table I, the achieved precision of the content classifier 1 is 98%, what is a satisfying result for further quality estimation.
- MOS Mobile Opinion Score
- the test was performed with 36 test persons for two different sets of test sequences. The first set was used for metric design and the second for evaluation of the metric performance.
- the training test set was carried out with 26 test persons and the evaluation test set was carried out with 10 test persons.
- the training and evaluation tests were collected of different sets of five video sequences. The chosen group ranged different ages (between 20 and 30), gender, education and experience with image processing.
- test persons had not the original sequence as a reference, resulting in a higher variance.
- the test persons evaluated the video quality using a five grade MOS scale (1-bad, 2-poor, 3-fair, 4-good, 5-excellent) . According to experiences with previous psychovisual experiments, the subjective results are slightly different if they are displayed on UMTS handsets or PC monitors.
- the viewing distance from the PDA was not fixed, but selected by the test persons. It could, however, be noticed that all persons were comfortable to take the PDA at a distance of 20-30 cm.
- three training sequences were presented to the test persons. Test sequences were presented in an arbitrary order, with the additional condition that the same sequence (even differently degraded) did not appear in succession. Two runs of each test were taken. In order to avoid the learning effect, a break of half an hour between the first and the second run was- made. In the further processing of the results, the sequences were rejected which were evaluated with an individual standard deviation higher than one. Following this rule, 12.4% of the test results were excluded.
- a real time video qual- ity estimator 10 as schematically shown in Fig. 3 may be used.
- the estimation on the receiver-side 11 has to be based only on the compressed sequence without the original (uncompressed) sequence, and the information about content class is in parallel signalised, see path 12, with the video streaming, the latter being signalised at 13, in order to reduce processing complexity as much as possible.
- Such measurement setup allows for continuous real time video streaming quality measurement on both sides, user (receiver-side 11) and provider (sender-side 14) .
- Fig. 3 shows a content based video quality estimator system 10 with a content classifier 1 as shown in Fig. 1.
- An encoder 15 carries out data compression, to obtain a compressed video which is transmitted to the receiver 11 where it is decompressed by a decoder 16, and a metric module 17 is provided to receive BR and FR data as well as content class data, and to output mean opinion score (MOS) information (estimation) .
- MOS mean opinion score
- FR frame rate
- BR bit rate
- the PCA was carried out to verify further applicability of the objective parameters BR and FR for the metric design.
- the PCA was performed for all content classes separately.
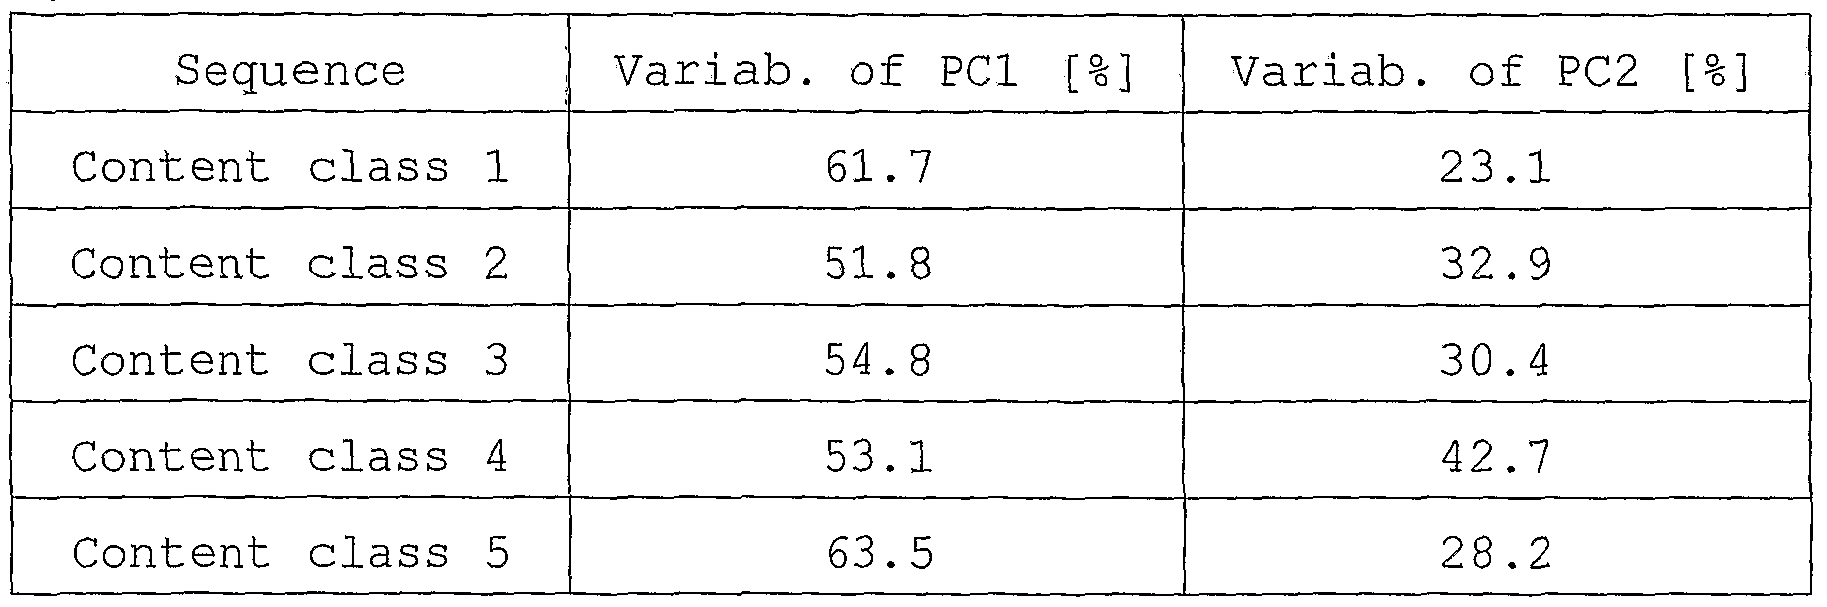
- the first two components proved to be sufficient for an adequate modeling of the variance of the data, see Table III which discloses the total variability of the first two components for all content classes: Table III
- the proposed low complexity metric may be based on two objective parameters BR and FR for each content class as follows:
- MOS f (BR , FR , Content _ Class) (3)
- VQEG "Final report from the Video Quality Experts Group on the validation of objective models of video quality assessment", http: //www. vqeq . orq/ , (2000) .
- the vector x corresponds to the average MOS values of the evaluation set (averaged over two runs of all 10 subjective evaluations for particular test sequence) for all tested encoded sequences.
- Vector y corresponds to the prediction made by the proposed metric.
- the dimension of x and y refers to N.
- the performance of the subjective video quality estimation compared to the subjective quality data is summarised in the following Table V, and is shown in Fig. 5. Obtained correlations with the evaluation set show very good performance of the proposed metric for all content classes except for content class number three, containing two and three dimensional cartoon movies. This feature increases variability of the MOS results within this content class and reduces the metric fitting performance.
- Table V The performance of the subjective video quality estimation compared to the subjective quality data is summarised in the following Table V, and is shown in Fig. 5. Obtained correlations with the evaluation set show very good performance of the proposed metric for all content classes except for content class number three, containing two and three dimensional cartoon movies. This feature increases variability of the MOS results within this
- the above-described content based perceptual quality metrics is well-suited for the most frequent content types for mobile video streaming services.
- the proposed method allows for a continuous quality measurement on both transceiver and receiver side, since it has a low processing complexity.
- the automatic content classification enables video quality estimation within one content class.
- the proposed automatic content classification recognizes with high accuracy the most frequent content types.
- classification based on hypothesis testing is a universal statistical method for content classification, which provides almost unlimited opportunities for the definition of new content classes. Therefore, it is sufficient to design content dependent low complexity metrics for each defined content type.
- the proposed metrics based on basic codec compression setting parameters have minimal complexity on the one hand and excellent prediction performance on the other hand.
- the present approach to video quality estimation allows for a reliable method which can be easily extended.
- video quality experienced by users depends on the spatial and temporal features of the video sequences, and most prior art techniques are based on spatial features.
- the present quality estimation is primarily based on character of motions, and the proposed reference-free universal metric is suited for various video content types and data compression settings, and is a powerful means for estimating the video quality experienced by a user, for low resolution video streaming services .
- the human visual perception of video content is determined by the character of the observed sequence which, in the prior art, has been described by spatial information.
- Such approaches come mainly from the quality estimation of still images.
- motion characteristics are used to characterise the sequence.
- speed of movement influencing at most the compression rate
- direction of movement temporary information
- the advantage of the temporal segmentation of video sequences and motion vectors is to estimate video quality within two cuts . Since the video sequences can contain different scenes - shots with different characteristics, each sequence firstly is segmented by the scene change detection based on a dynamic threshold.
- Z is defined as the percentage of zero motion vectors within one shot. It is the proportion of the frame that does not change at all (or changes very slightly) between two consecutive frames averaged over over all frames in the shot. It usually corresponds the background if the camera is static within one shot.
- S is defined as proportion of standard motion vector deviation within one shot to" Mean MV size N within one shot, expressed in percentage.
- the granularity of the direction is 10.
- PCA Principal Component Analysis
- MOS a+b-BR+c-Z+d-S e +f-N 2 +g-ln(U)+h-S-N (7)
- the metric coefficients a, b, c, d, e, f, g and h may be obtained with linear regression of proposed model with a training set (MOS values averaged over two runs of all 26 subjective evaluations for particular test sequence) .
- a Pearson and the Spearman rank correlation factor VQEG: "Final report from the Video Quality Experts Group on the validation of objective models of video quality assessment", http : / /www . vqeq . orq/ , (2000) , was used.
- the metric model was evaluated with evaluation set MOS values (MOS values averaged over two runs of all 10 subjective evaluations for particular test sequence) .
- the metric prediction performance on evaluation set by Pearson correlation is 0.8025 and by Spearman correlation is 0,9982.
- the proposed motion-based video quality metric for mobile video streaming services allows for continuous and reference- free quality measurement on both transceiver and receiver side.
- the proposed metric has good performance on contents with significantly different content characters .
Landscapes
- Engineering & Computer Science (AREA)
- Health & Medical Sciences (AREA)
- Biomedical Technology (AREA)
- General Health & Medical Sciences (AREA)
- Multimedia (AREA)
- Signal Processing (AREA)
- Testing, Inspecting, Measuring Of Stereoscopic Televisions And Televisions (AREA)
- Compression Or Coding Systems Of Tv Signals (AREA)
Abstract
The invention relates to a method for estimating the quality of a video sequence, e.g. in video streaming applications, wherein the content of the video sequence is evaluated, and one of a group of predetermined content classes is associated with the video sequence, whereafter the quality estimation is performed for that content class.
Description
Method and system for video quality estimation
Field of the invention
The present invention refers to a method and a system for video quality estimation, in particular for low resolution video sequences. Such low resolution video sequences are typical in video streaming applications, e.g. in mobile video streaming applications .
Background of the invention
In WO03/042922 A and WO03/101121 A, an estimation of the objective quality of compressed video data is described where no access to the source data is gained. After decompression of the video data using e.g. an MPEG decoder, a picture type determination is carried, namely to determine whether the decoder video data is intra-coded; thereafter, a discrete cosine transform (DCT) is performed to obtain DCT coefficients, and an average quantisation error is determined on the basis of the variance of the DCT coefficients, and this quantisation error is used to calculate a peak signal to noise ratio (PSNR) .
According to WO2006/043500 A, temporal/spatial characteristics are derived from both a deteriorated video sequence and a reference video signal, and for quality estimation, the temporal/spatial characteristic amount is weighted according to the relationship between the deteriorated video and the user subjective evaluation value.
In mobile video streaming, low resolutions and low bit-rates are used. Common resolutions are Quarter Common Intermediate Format (QCIF, 176x144 pixels) for cell phones, Common Intermediate Format (CIF, 352x288 pixels) and Standard Interchange Format (SIF, 320x240 pixels) for data cards and palmtops (PDA) . The mandatory codec for UMTS (Universal Mobile Telecommunications System) streaming applications is H.263 but the 3GPP release No. 6 already supports a baseline profile of the H.264 /AVC codec. The appropriate encoder settings for UMTS streaming services differ for different streaming content types, and streaming application (resolution, codec) . In UMTS, bearers with 64-384 kbit/s are used for multimedia (audio and video) streaming. Mo-
bile terminals have limited complexity and power, so the decoding of higher rate videos becomes quite a challenging task. It can be assumed that the maximum supported video bit-rates for the QCIF resolution are 105 kbit/s and for the CIF and SIF resolutions are 200 kbit/s.
In the last years, several objective metrics for perceptual video quality estimation were proposed. The proposed metrics can be subdivided into two main groups: human vision model based video metrics, compare for instance Winkler S. et al., "Video Quality Evaluation for Mobile Applications", Proc. of SPIE Conference on Visual Communications and Image Processing, vol. 5150
(2003), pp. 593-603, and metrics based only on the objective video parameters, see e.g. Kusuma T. M. et al . , "On the Development of a Reduced-Reference Perceptual Image Quality Metric", Proc. of the 2005 Systems Communications (ICW05) , (2005), pp. 178-184. The complexity of these methods is quite high, and significant computational power is necessary to calculate them. These metrics are designed for broadband broadcasting video services and do not consider mobile video streaming scenarios. Moreover, techniques are desirable that do not need the original
(non-compressed) sequence for the estimation of quality, so that complexity may be reduced and at the same time, the possibilities of the quality prediction deployment may be broadened. Hence, an objective measure of the video quality would be desirable which is simple enough to be calculated in real-time on transmitter side. The present invention is based on the finding that complexity of video quality estimation may be kept low in the case that the video content character is estimated due to its content dependence of subjective video quality.
Summary of the invention
Accordingly, it is an object of the present invention to provide a method and a system for video quality estimation where a fast, real-time estimation of low complexity is rendered possible.
To solve this problem, the present invention provides a method and a system with the features as defined in the independent claims. Preferred and advantageous embodiments are defined in the dependent claims.
With the present technique, a simple, efficient and fast estimation of video quality for low resolution video sequences typical in (mobile) video streaming applications is possible. Since the video quality experienced by users depends considerably on the the spatial (edges, colors, ...) and temporal (movement speed, direction, ... ) features of the video sequence, this invention is, according to a first aspect, based on a two-step approach to quality estimation. Firstly, shots between two scene changes are analysed and their content class is found. Secondly, based on the content class, frame rate and bit rate, the estimation of quality is carried out. To determine the respective content classes, a content classifier as well as an appropriate choice of the content classes and their characteristics are provided. Moreover, the design of quality metric is based on the mean opinion score obtained by a survey. The results of a comparison of the present technique with several common methods showed that the proposed approach provides powerful means of estimating the video quality experienced by users for low resolution video streaming services .
According to another aspect, the invention provides quality estimation simply based on motion character which is determined, by amount and direction of motion between two scene changes. The design of quality metric is based on content adaptive parameters allowing content-dependent video quality estimation, namely according to this specific aspect also without separately determining a respective content class.
When classifying the content of the video sequence, it is advantageous for increasing the accuracy to evaluate color features, too, when determining the respective content class. Furthermore, for efficiency reasons, it is useful that the respective content class is determined at the transmitter, and content class data are signalized to a receiver where the quality estimation is performed for that respective content class. In connection therewith, it is further useful for performing the quality estimation if only parameters available at the decoder on the receiver-side are used.
- A -
As already mentioned above, a particular feature of the invention with respect to obtaining fast and robust quality estimation is to use motion characteristics of the video sequence, and this motion characteristics can also be used when determining the respective content class. Here, the motion characteristics can be based on motion vector statistics where, in principle, usable algorithms are known per se.
As to the parameters used for performing the quality estimation, it is particularly advantageous if the bit rate and/or the frame rate of the video data are used for performing the quality estimation.
With respect to motion characteristics used for content-dependent quality estimation, uniformity of movement, horizontalness of movement, zero motion vector ratio, mean motion vector size and/or the ratio of motion vector deviation may be used, definitions of the above-mentioned specific motion characteristics being given below.
In particular, for direct quality estimation on the basis of content-dependent motion characteristics, it has been found that a non-linear model is particularly useful for performing the quality estimation. Here, it is preferred that the quality estimation is based on the equation MOS=f(BR5Z3S5N5U) , wherein MOS is the mean opinion score, BR is the bit rate
Z is the zero motion vector ratio within one shot, S is the ratio of motion vector deviation within one shot,
N is the mean motion vector size within one shot and U is the uniformity of movement within one shot.
A particularly advantageous universal metric for all contents based on defined motion parameters and on bit rate is possible if the quality estimation is based on the equation
MOS=a+b-BR+c-Z+d-Se+f-N2+g-ln(U)+h-S-N wherein MOS is the mean opinion score,
BR is the bit rate
Z is the zero motion vector ratio within one shot,
S is the ratio of motion vector deviation within one shot ,
N is the mean motion vector size within one shot, U is the uniformity of movement within one shot, and a, b, c, d, e, f, g and h are metric coefficients which are empirically determined.
In the case of content class determination, it is advantageous if the quality estimation is based on the equation
MOS = f ( BR , FR , Content _ Class) wherein MOS is the mean opinion score, BR is the bit rate, and
FR is the frame rate. Preferably, the quality estimation is based on the equation MOS=A+B-BR+-^+D-FR+-^ wherein A, B, C, D and E are metric coefficients which are empirically determined.
As far as the present system for estimating the quality of a video sequence, in particular video streaming applications, is concerned, it is preferred that such a system comprises a content classifier which is arranged for evaluating the content of the respective video sequence and determining an associated content class out of a group of predetermined content classes; furthermore, a metric module is provided which is arranged to perform quality estimation on the basis of known per se statistics for the associated content class. Preferably, the metric module is arranged to perform quality estimation for the associated content class on the basis of bit rate and frame rate. To be able to determine the respective content class in efficient manner, the content classifier preferably comprises a scene change detector so that it is possible to determine the content class for each video shot or video frame.
Preferably, the content classifier comprises a motion vector calculation unit and a motion vector features extraction unit connected thereto, to base the determination of the content class on motion vector characteristics. Furthermore, to enhance accuracy, the content classifier may comprise a color features
extraction unit.
Preferably, the content classifier is arranged at the sender- side whereas the metric module is arranged at the receiver-side.
A particular advantage of the present technique is that no reference picture is needed. Furthermore, the parameters of the respective models used for quality estimation may simply be obtained empirically, by tests with people.
Further objects, features and advantageous of the invention will become apparent from the following description in connection with the enclosed drawings referring to exemplary preferred embodiments of the invention to which, however, the invention should not be limited.
Brief description of the drawings
In the drawings,
Fig. 1 schematically shows a design for a preferred content classifier as a part of the system of the present invention;
Fig. 2 shows in its parts Fig. 2A and Fig. 2B model ECDFs (ECDF - empirical cumulative distribution functions) vs. uniformity of movement (Fig. 2A) and zero motion vector ratio (Fig. 2B) for four content classes #1 to #4;
Fig. 3 schematically shows a system for video quality estimation according to a preferred embodiment of the invention;
Fig. 4 illustrates principle component analyses (PCA) results for all (five) content classes with respect to two components 1 and 2;
Fig. 5 illustrates a diagram showing the relationship between estimated MOS (MOS - Mean Opinion Score) vs. subjective MOS results;
Fig. 6 shows a diagram of PCA results similar to Fig. 4, but now for the embodiment where the results are valid for all content classes, that means that now specific content classes are de-
termined before estimation/ and
Fig. 7 illustrates a diagram similar to Fig. 5 with respect to the estimated and subjective MOS results for the case of Fig. 6.
For streaming services it is essential to provide a required level of customer satisfaction, given by the perceived video stream guality. It is therefore important to choose the compression parameters as well as the network settings so that they maximise the end-user quality. Thanks to its significant video compression gain the newest video coding standard H.264/AVC allows for providing video streaming for low bit and frame rates while preserving the perceptual quality. This is especially suitable for video applications in 3G wireless networks. Basis for such parameters and settings is an adequate estimation of video quality, and the present technique aims at an estimation of video quality, especially of mobile video streaming, at the user-level (perceptual quality of service) for any codec settings in 3G network or the like, and for any video content types. In particular, it is intended to recognise the most significant content types, to estimate the video quality of mobile video streaming at the user-level (perceptual quality of service) and to find most suitable codec settings for these frequent content types .
The human visual perception of video content is determined by the character of the observed sequence. Therefore, at the present technique, it is preferred to distinguish different content characters/classes because they strongly influence the subjective quality. The character of a sequence can be described by the amount of the edges (spatial information) in the individual frames and by the type and direction of movement (temporal information) . The data rate of the video sequence to be examined is shared by the number of frames per second. Higher frame rates result in a lower amount of spatial information in individual frames and possibly in some compression artifacts. Thus, taking the data rate as an objective parameter, one can look either on the spatial information or on the temporal information. In the prior art, see e.g. Kusuma T.M. et al., "On the Development of a Reduced-Reference Perceptual Image Quality Metric", Proc. of the
2005 Systems Communications (ICW05), .(2005), pp. 178-184, the focus is given mainly on the spatial information. Such an approach comes mainly from the quality estimation of still images. However, especially in small resolutions and after applying compression, not only the speed of movement (which influences at most the compression rate) but also the type of the movement plays an important role in the user perception. Therefore, it is preferred to focus on the motion features of the video sequences that determine the perceived quality.
In Fig. 1, a content classifier 1 design is shown where an original video sequence is supplied at 2 to a scene change detector 3 to which a motion vector (MV) calculation unit 4, on the one hand, and a color features extraction unit 5, on the other hand, are connected. A motion vector features extraction unit 6 follows the motion vector calculation unit 4, and has its output connected to a content class estimation unit 7 which is connected also to the color features extraction unit 5, and provides at its output, at 8, the respective content classes.
In connection with the above, the following is a more detailed discussion of the structure and function of the content classifier 1:
1) Scene change detector 3: A video stream 2 can consist of a plurality of different scenes with different contents, spatial and temporal information (i.e. a typical video sequence of news consists of some shots of the moderator and diverse reportage shots of the described events) . Since each shot of a sequence can have a different content character, splitting a video into its basic temporal units - shots - is an initial step in the process of video content classification due to content of shots variation within one sequence. A shot is a series of video frames taken by one camera (e.g. zooming in or out an object, panning along a landscape etc.). Two consecutive shots are separated by a shot boundary, which can be abrupt or gradual. While an abrupt shot boundary (cut) is generated by simply attaching one shot to another without modifying them, a gradual shot boundary is the result of applying an editing effect to merge two shots.
The most suitable low-complexity method for the present purpose is a scene change detection based on a dynamic threshold, as is per se known from Dimou A. et al., NNScene Change Detection for H.264 Using Dynamic Threshold Techniques", Proc. of the 5th EURA- SIP Conference on Speech and Image Processing, Multimedia Communications and Service, (2005) . The method can be tuned up for the present purpose: the coefficients of the thresholding function are modified, and ten upcoming frames are additionally taken into account. The scene change detector 3 works with precision and recall higher than 97%. Such accuracy is more than satisfying for the present purpose of content classification.
2) Motion vector unit 4: The block from the current frame for which a matching block is sought is known as the target block. The relative difference in the locations between the matching block and the target block is known as the motion vector (MV) . If the matching block is found at the same location as the target block then the difference is zero, and the motion vector is known as zero vector.
The difference between target block and matching block increases (approximately linearly) with the size of the blocks; smaller blocks better describe the actual motion in the frame. On the other hand, an increase of the objective accuracy does not always imply a better performance. It has been observed that, if the blocks are selected too small, the resulting motion vectors do not reflect anymore the motion as it is perceived by a viewer. Due to the -unavoidable presence of noise in video sequences, and the characteristics of the human visual system, it happens that movement is detected although a human observer does not see it. Such behavior is not desirable for the present technique. After several trials with videos of different character, it has been found that a block size of 8><8 pixels would be a good trade-off for QVGA resolution sequences. The 320x240 pixels are divided into 30χ40 blocks, which gives a total number of 1200 MVs per frame.
The second part of the process, the rather time and resource consuming one, is block matching. Each block in the current
frame is compared to a certain search region in the past frame in order to find a matching block. This operation can be performed only on the luminance component of the frame . A matching criterion has to be used to quantify the similarity between the target block and the candidate blocks. Because of its simplicity and good performance, it is preferred to use the sum of absolute differences (SAD) , computed as the pixel-wise sum of the absolute differences between the two blocks being compared:

where Bn and Bm are the two blocks of size NxM, and i and j denote pixel coordinates. If more than one SAD minimum is detected, priority is given to the matching block the position of which is most similar to that of the target block, or equival- ently, to the motion vector of smallest size.
3) Extraction of sequence motion and color parameters (units 6; 5):
After obtaining the motion vectors, the information about the motion (motion features) in the sequence has to be extracted, and this is done in unit 6. The static or dynamic character of a sequence is one of the main causes for the differences in perceived quality. It is intended to perform a classification not only in terms of "static sequences" and "dynamic sequences", but also to investigate this aspect more in depth and determine typical levels of quantity of movement for every main content class. The overall amount of movement, or equivalently, the lack of movement in a frame, can be easily estimated on the basis of the proportion of blocks with zero vectors, that is, blocks that do not move from one frame to the other. Therefore, the average proportion of static blocks in a sequence of frames is very useful when contents with typical different "levels" of overall movement are to be distinguished.
The length of a respective motion vector indicates how far the block has moved from one frame to the next, and its angle provides the information in which direction this movement occurred. Therefore, the mean size of the motion vectors in a
frame or sequence of frames is an indicator of how fast the overall movement happens. On the other hand, knowing exactly in which direction the movement is taking place seems rather useless, or redundant, respectively for the present estimation. On the other hand, detecting a main direction of movement that corresponds to a big proportion of motion vectors pointing in the same direction, is a valuable information. Thus, it can be assumed that the analysis of the distribution of sizes and angles of the motion vectors can give substantial information about the character of the motion in the sequence. A set of statistical calculations on the motion vectors has been implemented in order to study their level of significance and find out which features can be used to identify perceptual content types.
Finally, content classification (see unit 7) may be based on the following statistical and resolution-independent features of motion vectors within one shot (over all the frames of the analyzed sequence) :
• Zero MV ratio z:
This ratio z is the percentage of zero motion vectors in a frame. It is the proportion of the frame that does not change at all (or changes very slightly) between two consecutive frames. It usually corresponds to the background if the camera is static within one shot .
• Mean MV size n:
By n, the proportion of the mean size of the non-zero motion vectors within one frame normalized to the screen width, expressed in percentage is denoted. This parameter n determines the amount of the global motion.
• Uniformity of movement u:
The parameter u is the percentage of motion vectors which point in the dominant direction (the most frequent direction of motion vectors) in the frame. For this purpose, the granularity of the direction may be set to 10 degrees.
• Horizontalness of movement h:
Horizontalness is defined as the percentage of motion vectors pointing in horizontal direction. Horizontal motion, vectors are from intervals (-lθ;lθ) or ( 170; 190) degrees.
In order to increase the accuracy of the content classifier 1, color features can be considered, compare unit 5. Color histograms provide additional information about the spatial sequence character because in different types of contents, the density and magnitude of colors differ as well. Soccer sequences for example contain a lot of varying green colors while cartoon sequences exhibit discrete saturated, colors. This characteristic has important consequences to the compression and transmission artifacts. Therefore, also the following parameter may be used:
• Greenness G :
Greenness G is defined as the percentage of green pixels in a frame. For this purpose the RGB color space may be down sampled to two bits per color component resulting in 64 colors. Five colors out of the 64 colors cover all variation of the green color.
Preferably, five content classes #1 to #5 are identified and based on the content features defined above. Furthermore, examples for decision algorithms for automatic content classification are now to be disclosed and evaluated.
For the mobile video streaming content classification, five most frequent content classes with different impact on the user perception may be defined as follows:
1) Content class #1 (e.g. news): The content class #1 includes sequences with a small moving region of interest (face) on a static background. The movement in the region of interests (ROI) is mainly determined only by eyes, mouth and face movements. The ROI covers up to approximately 15% of the screen surface.
2) Content class #2 (e.g. soccer) : This content class #2 contains wide angle camera sequences with uniform camera movement (panning) . The camera is e.g. tracking a small rapid moving object (ball) on the uniformly colored (e.g. typically green) background.
3) Content class #3 (e.g. cartoon): In this content class #3 object motion is dominant, and the background is usually static.
The global motion is almost not present due to its artificial origin of the movies (no camera) . The movement object has no natural character.
4) Content class #4 (e.g. panorama): This content class #4 includes global motion sequences taken with a wide angle panning camera. The camera movement is uniform and in a single direction.
5) Content class #5 (rest) : The content class #5 contains a lot of global and local motion or fast scene changes. Scenes shorter than three seconds are also associated to this content class #5. The content class #5 covers scenes which do not fit any of the previous four classes.
It would be possible to classify the content based on thresholds, however, this is a limited and not so accurate method for evaluating larger data sets, and it is preferred to use a more complex and reliable method based on hypothesis testing. Each of the described content classes is determined by unique statistical features of motion and color parameters (see Fig. 2) . Due to their unique statistical features of well defined content classes it is not necessary to perform M-ary hypothesis testing and it is sufficient to formulate a null hypothesis (HO) for each content class based on these statistical features separately. Since the distributions of investigated parameters do not fit well with any known distribution functions, the sequence is classified as content class number five. For the present hypothesis evaluation a method is preferred which is capable of working with empirical (sample) distributions. For this purpose the most suitable is non-parametric and distribution-free: the Kolmogorov-Smirnov (KS) test, compare Bosch K., "Statistik- Taschenbuch", Oldenbourg Wissensch. VIg., (1998). The KS test is used to determine whether two underlying probability distributions differ, or whether an underlying probability distribution differs from a hypothesized distribution, in either case based on finite samples. The two-sample KS test is one of the most useful and general nonparametric methods for comparing two samples, as it is sensitive to differences in both location and shape of the empirical cumulative distribution functions of the
two samples. From the typical set of sequences for each content class the empirical cumulative distribution functions (ECDF) are obtained. In a practical test, model ECDFs were derived from a set of 142 typical sequences. Each content class is described with five model ECDFs (zero MV ratio, mean MV size, uniformity of movement, horizontalness of movement, greenness) , which correspond to their HO hypothesis, respectively. Furthermore, it is necessary to find the maximal deviation (Dcc max) within one content class for all parameters (for each model ECDF). If Fn (x) is the model ECDF and F(x) is the ECDF of the investigated sequence, the maximal difference Dn between Fn (x) and F(x) may be written as follows :
Dn=maxx||Fn(x)-F(x)|| (2)
The content class estimation is based on a binary hypothesis test within first four content classes. With the KS test the ECDFs of the investigated sequence and all model ECDFs of the first four content classes are compared. The KS test compares five ECDF (of defined MV or color parameters) of defined content classes specified by the HO hypothesis with all five ECDFs of the investigated content. If the obtained Dn for all parameters and of (the first four) content classes is smaller than Dcc max for each parameter than the investigated sequence matches this content class.
If the ECDFs of the investigated sequence have not a fit with any of the first four content classes, the content classifier 1 (s. Fig. 1) decides for the rest content class #5. The classifier 1 estimates the content on transmitter side from the original sequence.
In Fig. 2, examples of model ECDFs, as described above, of the uniformity of movement u (Fig. 2A) and of the zero MV ratio z (Fig. 2B) are shown with respect to content classes #1, #2, #3 and #4.
The performance of the content classifier 1 was evaluated with two parameters. (1) False detection reflects the ratio of improper detection of a content class, in the case when investig-
ated sequences belong to any other content class. (2) Good match reflects the ratio of successful classification of investigated sequences, when investigated sequences belong to any of the first four classes. It should be noted that in the tested sequences, almost only cuts have been present, and no gradual changes. The scene change detector 3 was sensitive on gradual shot boundaries (dissolve, fades or wipes) . As may be seen from the following Table I, the achieved precision of the content classifier 1 is 98%, what is a satisfying result for further quality estimation.
Table 1:

For the tests, two sets of five video sequences each having ten- second duration and SIF resolution were selected. All sequences were encoded with an H.264 baseline profile Ib. For subjective quality testing, the frame rate (FR) and bit rate (BR) combinations shown in Table II were used. In total, there were 36 combinations .
Table II:
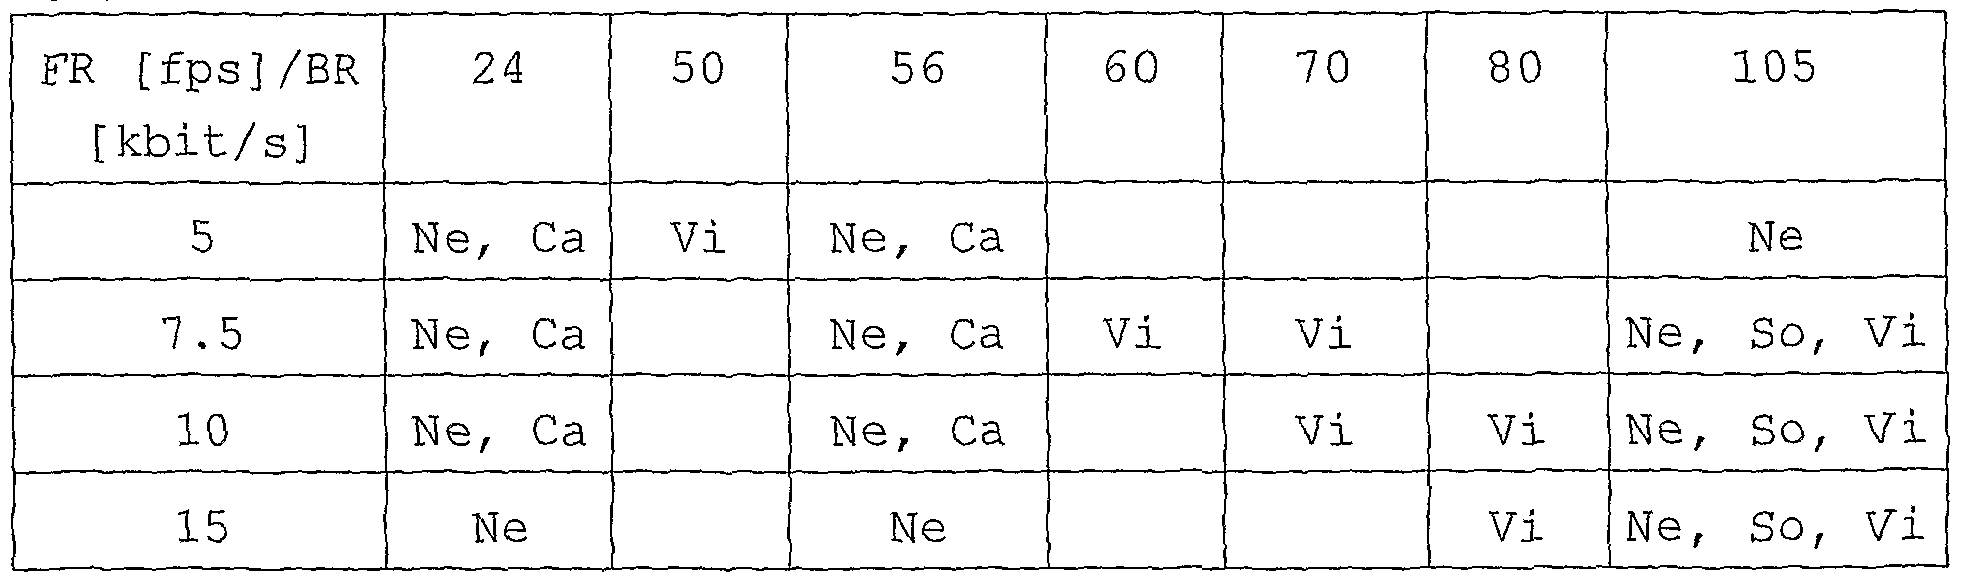
(Ne-News; Ca-Cartoon; So-Soccer; Pa-Panorama; Vi-Videoclip)
To obtain a MOS (Mean Opinion Score) , the test was performed
with 36 test persons for two different sets of test sequences. The first set was used for metric design and the second for evaluation of the metric performance. The training test set was carried out with 26 test persons and the evaluation test set was carried out with 10 test persons. The training and evaluation tests were collected of different sets of five video sequences. The chosen group ranged different ages (between 20 and 30), gender, education and experience with image processing.
The tests were consistent with the ITU-T Recommendation, compare ITU-T Recommendation P.910, "Subjective video quality assessment methods for multimedia applications" (1999), using the absolute category rating (ACR) method as it better imitates the real world streaming scenario. Thus, the test persons had not the original sequence as a reference, resulting in a higher variance. The test persons evaluated the video quality using a five grade MOS scale (1-bad, 2-poor, 3-fair, 4-good, 5-excellent) . According to experiences with previous psychovisual experiments, the subjective results are slightly different if they are displayed on UMTS handsets or PC monitors. Due to this experience, it seemed suitable not to follow in this only case ITU-T Recommendation in this point and in order to emulate real conditions of the UMTS service, all the sequences were displayed on a personal digital assistant PDA VPA IV UMTS/WLAN.
The viewing distance from the PDA was not fixed, but selected by the test persons. It could, however, be noticed that all persons were comfortable to take the PDA at a distance of 20-30 cm. At the beginning of the test session, three training sequences were presented to the test persons. Test sequences were presented in an arbitrary order, with the additional condition that the same sequence (even differently degraded) did not appear in succession. Two runs of each test were taken. In order to avoid the learning effect, a break of half an hour between the first and the second run was- made. In the further processing of the results, the sequences were rejected which were evaluated with an individual standard deviation higher than one. Following this rule, 12.4% of the test results were excluded.
For the video quality estimation proper, a real time video qual-
ity estimator 10 as schematically shown in Fig. 3 may be used. The estimation on the receiver-side 11 has to be based only on the compressed sequence without the original (uncompressed) sequence, and the information about content class is in parallel signalised, see path 12, with the video streaming, the latter being signalised at 13, in order to reduce processing complexity as much as possible. Such measurement setup allows for continuous real time video streaming quality measurement on both sides, user (receiver-side 11) and provider (sender-side 14) .
More in detail, Fig. 3 shows a content based video quality estimator system 10 with a content classifier 1 as shown in Fig. 1. An encoder 15 carries out data compression, to obtain a compressed video which is transmitted to the receiver 11 where it is decompressed by a decoder 16, and a metric module 17 is provided to receive BR and FR data as well as content class data, and to output mean opinion score (MOS) information (estimation) .
Due to limited processing power of the user equipments, it is advantageous to identify low complexity objective parameters. In order to keep the complexity as low as possible, the most suitable parameters are already provided: frame rate (FR) and bit rate (BR) . These parameters FR, BR are the codec compression settings and signalized during the initiation of the streaming session, requiring no computational complexity for estimation as they are known at both transceiver 14 and receiver 11. Furthermore, the influence of these two parameters on an investigated dataset for each content class may be described separately. For this purpose, a well known multivariate statistical method may be used, namely the Principal Component Analysis (PCA) , compare Krzanowski W.J., "Principles of Multivariate Analysis", Clarendon press (1988) . The PCA was carried out to verify further applicability of the objective parameters BR and FR for the metric design. The PCA was performed for all content classes separately. In the test case, the first two components proved to be sufficient for an adequate modeling of the variance of the data, see Table III which discloses the total variability of the first two components for all content classes:
Table III
The PCA results with respect to the first two components ("component 1" and "component 2") are illustrated in Fig. 4, and they show sufficient influence of BR and FR on the data set for all content classes.
The proposed low complexity metric may be based on two objective parameters BR and FR for each content class as follows:
MOS = f (BR , FR , Content _ Class) (3)
Herewith, one common model is proposed for all content classes. Therefore, the model has linear and hyperbolic elements, see equation (4) below, and the coefficients A, B, C, D, E vary substantially for the content classes CC (they can even have zero values) . On the other hand, rather good correlation was achieved with one offset and two non-zero coefficients, see following Table IV:
Table IV
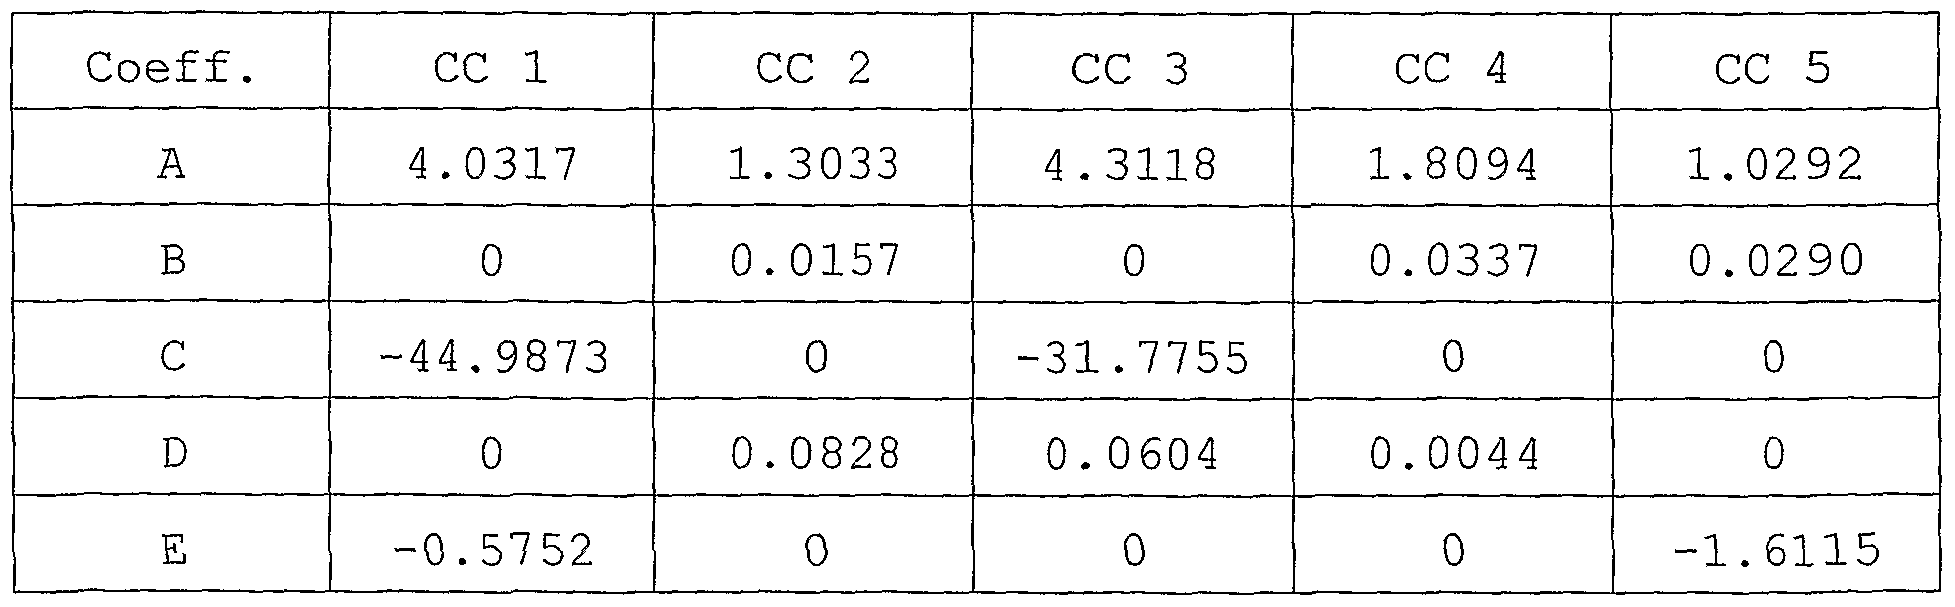
(CC - Content class)

The metric coefficients were obtained by a linear regression of the proposed model with the training set (MOS values averaged over two runs of all 25 subjective evaluations for particular test sequence) . To evaluate the quality of the fit of our proposed metric, a Pearson (linear) correlation factor:

and the Spearman rank correlation factor:
may be used; see also VQEG: "Final report from the Video Quality Experts Group on the validation of objective models of video quality assessment", http: //www. vqeq . orq/ , (2000) .
Here, the vector x corresponds to the average MOS values of the evaluation set (averaged over two runs of all 10 subjective evaluations for particular test sequence) for all tested encoded sequences. Vector y corresponds to the prediction made by the proposed metric. The dimension of x and y refers to N. The performance of the subjective video quality estimation compared to the subjective quality data is summarised in the following Table V, and is shown in Fig. 5. Obtained correlations with the evaluation set show very good performance of the proposed metric for all content classes except for content class number three, containing two and three dimensional cartoon movies. This feature increases variability of the MOS results within this content class and reduces the metric fitting performance.
Table V
Content type CC 1 CC 2 CC 3 CC 4 CC 5 r 0 .9277 0 .9018 0 .7559 0 9030 0 .9307 r1 0 .9964 0 .8863 0 .8409 0 9812 0 .9695
The above-described content based perceptual quality metrics is well-suited for the most frequent content types for mobile video streaming services. The proposed method allows for a continuous quality measurement on both transceiver and receiver side, since it has a low processing complexity. The automatic content classification enables video quality estimation within one content class. The proposed automatic content classification recognizes with high accuracy the most frequent content types. Moreover, classification based on hypothesis testing is a universal statistical method for content classification, which provides almost unlimited opportunities for the definition of new content classes. Therefore, it is sufficient to design content dependent low complexity metrics for each defined content type. The proposed metrics based on basic codec compression setting parameters have minimal complexity on the one hand and excellent prediction performance on the other hand. The present approach to video quality estimation allows for a reliable method which can be easily extended.
The above description refers to content class determination before performing the content class-dependent quality estimation. However, it has been found that it is also possible to estimate the video quality without specific content classification, by using a universal metric which, again, is reference-free, and which is based on content adaptive parameters, to obtain content-dependent video quality estimation on the basis of motion characteristics, as already referred to above in connection with content classification; however, such motion characteristics determined by amount and direction of motion between two scene changes can be used to directly estimate video quality, too.
As already mentioned, video quality experienced by users depends on the spatial and temporal features of the video sequences, and most prior art techniques are based on spatial features. Here,
the present quality estimation is primarily based on character of motions, and the proposed reference-free universal metric is suited for various video content types and data compression settings, and is a powerful means for estimating the video quality experienced by a user, for low resolution video streaming services .
As already mentioned, the human visual perception of video content is determined by the character of the observed sequence which, in the prior art, has been described by spatial information. Such approaches come mainly from the quality estimation of still images. At the present techniques, it is preferred that motion characteristics are used to characterise the sequence. In the small resolutions and after applying the compression, not only speed of movement (influencing at most the compression rate) but also the the type and direction of movement (temporal information) play an important role in the user perception. Therefore, this invention relies on motion features of the video sequences that determine the perceived quality.
The advantage of the temporal segmentation of video sequences and motion vectors is to estimate video quality within two cuts . Since the video sequences can contain different scenes - shots with different characteristics, each sequence firstly is segmented by the scene change detection based on a dynamic threshold.
With respect to the extraction of sequence motion parameters, the static or dynamic character of a sequence is one of the main reasons for the differences in perceived quality. After investigation of different sequences, following parameters may be chosen to represent the motion characteristics:
• Zero MV ratio within one shot Z:
Z is defined as the percentage of zero motion vectors within one shot. It is the proportion of the frame that does not change at all (or changes very slightly) between two consecutive frames averaged over over all frames in the shot. It usually corresponds the background if the camera is static within one shot.
• Mean MV size within one shot N:
This is the proportion of mean size of the non-zero motion vectors within one shot normalized to the screen width, expressed
in percentage. This parameter determines the amount of global motion.
• Ratio of MV deviation within one shot S:
S is defined as proportion of standard motion vector deviation within one shot to" Mean MV size N within one shot, expressed in percentage.
• Uniformity of movement within one shot U:
This is the percentage of motion vectors pointing in the dominant direction (the most frequent direction of MVs) within one shot. For this purpose, the granularity of the direction is 10.
Furthermore, it is advantageous to investigate influence of these motion parameters and the bit rate (BR) on the investigated content. For this purpose, a well known multivariate statistical method may be used, namely the Principal Component Analysis (PCA) . The PCA is carried out to verify further applicability of the motion characteristics and BR for metric design. In a test case, the first two components proved to be sufficient for an adequate modeling of the variance of the data. The variability of the first component is 42.1% and of the second component 20.6%. The PCA results as illustrated in Fig. 6 show sufficient influence of investigated parameters on the data set for all content classes .
In the test referred to above, the following frame rates 5fps; 7,5fps; lOfps; 15fps; and following bit rates 24kbit/s, 50kbit/s, 56kbit/s, 60kbit/s, 70kbit/s, 80kbit/s, 105kbit/s have been used in combinations. In total they were 36 combinations, but some combinations were excluded where the resulting video quality was clearly insufficient. To obtain a MOS (Mean Opinion Score) , it has been worked with 36 test persons (the training set with 26 and the evaluation set with 10 persons) for two different sets of test sequence. The training and evaluation tests were collected of different sets of five video sequences. The tests were consistent with the ITU-T Recommendation, using absolute category rating (ACR) method as it better imitates the real world streaming scenario.
It is now proposed one universal metric for all contents based on defined motion parameters and BR.
MOS=a+b-BR+c-Z+d-Se+f-N2+g-ln(U)+h-S-N (7)
The metric coefficients a, b, c, d, e, f, g and h may be obtained with linear regression of proposed model with a training set (MOS values averaged over two runs of all 26 subjective evaluations for particular test sequence) . To evaluate the quality of the fit of the proposed metrics for the given data, a Pearson and the Spearman rank correlation factor, VQEG: "Final report from the Video Quality Experts Group on the validation of objective models of video quality assessment", http : / /www . vqeq . orq/ , (2000) , was used. The metric model was evaluated with evaluation set MOS values (MOS values averaged over two runs of all 10 subjective evaluations for particular test sequence) . The metric prediction performance on evaluation set by Pearson correlation is 0.8025 and by Spearman correlation is 0,9982.
The obtained correlations with evaluation set - compare Fig. 7 - show very good performance of proposed metric for all contents.
Thus, the proposed motion-based video quality metric for mobile video streaming services, allows for continuous and reference- free quality measurement on both transceiver and receiver side.
Moreover, due to content dependency of the metric parameters, the proposed metric has good performance on contents with significantly different content characters .
Claims
1. A method for estimating the quality of a video sequence, e.g. in video streaming applications, characterised in that the content of the video sequence is evaluated, and one of a group of predetermined content classes is associated with the video sequence, whereafter the quality estimation is performed for that content class.
2. The method according to claim 1, characterised in that for determining the respective content class, color features are evaluated.
3. The method according to claim 1 or 2, characterised in that the respective content class is determined at a transmitter and content class data are signalized to a receiver, and in that the quality estimation for that content class is performed at the receiver.
4. The method according to claim 3, characterised in that for performing the quality estimation, only parameters available at a decoder at the receiver are used.
5. The method according to claim 1, characterised in that the respective content class is determined using motion characteristics of the video sequence.
6. A method for estimating the quality of a video sequence, e.g. in video streaming applications, characterised in that motion characteristics are extracted from the video sequence, and are used for the quality estimation.
7. The method according to claim 5 or 6, characterised in that the motion characteristics used for determining the content class are based on motion vector statistics.
8. The method according to anyone of claims 1 to 7, characterised in that the bit rate and/or the frame rate of the video data are used for performing the quality estimation.
9. The method according to anyone of claims 5, 7 or 8, characterised in that horizontalness of movement is used as a motion characteristic for the content class determination.
10. The method according to anyone of claims 5 to 9, characterised in that uniformity of movement is used as a motion characteristic for the content class determination, or the direct video quality estimation, respectively.
11. The method according to anyone of claims 7 to 10, characterised in that zero motion vector ratio defined as the percentage of zero motion vectors within one frame, or shot, respectively, is used as a motion characteristic for the content class determination, or the direct video quality estimation, respectively.
12. The method according to anyone of claims 7 to 11, characterised in that a mean motion vector size defined as the proportion of mean size of non-zero motion vectors within one frame, or shot, respectively, normalized to the screen width and expressed in percentage is used as a motion characteristic for the content class determination, or the direct video quality estimation, respectively.
13. The method according to anyone of claims 7 to 12, characterised in that the ratio of motion vector deviation within one shot, defined as the proportion of standard motion vector deviations within one shot to mean motion vector size within one shot, expressed in percentage, is used as a motion characteristic for the video quality estimation.
14. The method according to claims 8 and 10 to 13, characterised in that a non-linear model is used for the video quality estimation.
15. The method according to claim 14, characterised in that the quality estimation is based on the equation MOS=f(BR,Z5S?N,U) , wherein MOS is the mean opinion score,
BR is the bit rate
Z is the zero motion vector ratio within one shot,
S is the ratio of motion vector deviation within one shot ,
N is the mean motion vector size within one shot and U is the uniformity of movement within one shot.
16. The method according to claim 15, characterised in that the quality estimation is based on the equation
MOS=a+b-BR+c-Z-fd-Se+f-N2+g-ln(U)+h-S-N wherein a, b, c, d, e, f, g and h are metric coefficients which are empirically determined.
17. The method according to claims 8 and 10 to 13 , characterised in that the quality estimation is based on the equation
MOS = f (BR , FR , Content _ Class) wherein MOS is the mean opinion score, BR is the bit rate, and FR is the frame rate.
18. The method according to claim 17, characterised in that the quality estimation is based on the equation
MOS=A+B-BR+^D-FR+-^ wherein A, B, C, D and E are metric coefficients which are empirically determined.
19. Α system (10) for estimating the quality of a video sequence, e.g. in video streaming applications, characterised by a content classifier (1) arranged for evaluating the content of the video sequence and determining an associated content class and of a group of predetermined content classes, and by a metric module (17) arranged to .perform quality estimation for the associated content class.
20. The system according to claim 19, characterised in that the metric module (17) is arranged to perform quality estimation for the associated content class on the basis of bit rate and frame rate .
21. The system according to claim 19 or 20, characterised in that the content classifier (1) comprises a scene change detector (3) .
22. The system according to anyone of claims 19 to 21, charac-terised in that the content classifier (1) comprises a motion vector calculation unit (4) and a motion vector features extraction unit (6) connected thereto.
23. The system according to anyone of claims 19 to 22, characterised in that the content classifier (1) comprises a color features extraction unit (5) .
24. The system according to anyone of claims 19 to 23, characterised in that the content classifier (1) is arranged sender- side (14) whereas the metric module (17) is arranged receiver- side (11) .
Priority Applications (2)
| Application Number | Priority Date | Filing Date | Title |
|---|---|---|---|
| PCT/AT2006/000539 WO2008077160A1 (en) | 2006-12-22 | 2006-12-22 | Method and system for video quality estimation |
| ATA9561/2006A AT509032B1 (en) | 2006-12-22 | 2006-12-22 | METHOD AND SYSTEM FOR VIDEO QUALITY ASSESSMENT |
Applications Claiming Priority (1)
| Application Number | Priority Date | Filing Date | Title |
|---|---|---|---|
| PCT/AT2006/000539 WO2008077160A1 (en) | 2006-12-22 | 2006-12-22 | Method and system for video quality estimation |
Publications (1)
| Publication Number | Publication Date |
|---|---|
| WO2008077160A1 true WO2008077160A1 (en) | 2008-07-03 |
Family
ID=37884113
Family Applications (1)
| Application Number | Title | Priority Date | Filing Date |
|---|---|---|---|
| PCT/AT2006/000539 Ceased WO2008077160A1 (en) | 2006-12-22 | 2006-12-22 | Method and system for video quality estimation |
Country Status (2)
| Country | Link |
|---|---|
| AT (1) | AT509032B1 (en) |
| WO (1) | WO2008077160A1 (en) |
Cited By (6)
| Publication number | Priority date | Publication date | Assignee | Title |
|---|---|---|---|---|
| WO2010007286A3 (en) * | 2008-06-24 | 2010-03-11 | France Telecom | Method of referenceless measurement of the perceived quality of a signal and corresponding device |
| FR2943879A1 (en) * | 2009-03-30 | 2010-10-01 | Univ Nantes | METHOD AND APPARATUS FOR EVALUATING THE VISUAL QUALITY OF AN IMAGE OR IMAGE SEQUENCE USING OBJECTIVE INDICATORS AND CORRESPONDING COMPUTER PROGRAM. |
| US20150170350A1 (en) * | 2012-08-27 | 2015-06-18 | Thomson Licensing | Method And Apparatus For Estimating Motion Homogeneity For Video Quality Assessment |
| CN105357526A (en) * | 2015-11-13 | 2016-02-24 | 西安交通大学 | Compressed domain based mobile phone football video quality evaluation device and method considering scene classification |
| US20210058626A1 (en) * | 2016-12-12 | 2021-02-25 | Netflix, Inc. | Source-consistent techniques for predicting absolute perceptual video quality |
| CN114630111A (en) * | 2022-05-13 | 2022-06-14 | 电子科技大学 | A No-reference Compressed Video Quality Evaluation Method Based on Coding Information |
Citations (6)
| Publication number | Priority date | Publication date | Assignee | Title |
|---|---|---|---|---|
| US6011868A (en) * | 1997-04-04 | 2000-01-04 | Hewlett-Packard Company | Bitstream quality analyzer |
| WO2001091473A1 (en) * | 2000-05-26 | 2001-11-29 | British Telecommunications Public Limited Company | Method for testing video sequences |
| EP1189451A1 (en) * | 2000-09-13 | 2002-03-20 | Kabushiki Kaisha Toshiba | Digital video encoder |
| EP1427224A2 (en) * | 2002-12-03 | 2004-06-09 | British Broadcasting Corporation | Analysis of digital signals |
| WO2004075558A1 (en) * | 2003-02-06 | 2004-09-02 | Koninklijke Philips Electronics, N.V. | Optimizing scaleable video algorithm asset distribution utilizing quality indicators |
| US20050105802A1 (en) * | 2003-11-14 | 2005-05-19 | Hekstra Andries P. | Method and an arrangement for objective assessment of video quality |
-
2006
- 2006-12-22 WO PCT/AT2006/000539 patent/WO2008077160A1/en not_active Ceased
- 2006-12-22 AT ATA9561/2006A patent/AT509032B1/en active
Patent Citations (6)
| Publication number | Priority date | Publication date | Assignee | Title |
|---|---|---|---|---|
| US6011868A (en) * | 1997-04-04 | 2000-01-04 | Hewlett-Packard Company | Bitstream quality analyzer |
| WO2001091473A1 (en) * | 2000-05-26 | 2001-11-29 | British Telecommunications Public Limited Company | Method for testing video sequences |
| EP1189451A1 (en) * | 2000-09-13 | 2002-03-20 | Kabushiki Kaisha Toshiba | Digital video encoder |
| EP1427224A2 (en) * | 2002-12-03 | 2004-06-09 | British Broadcasting Corporation | Analysis of digital signals |
| WO2004075558A1 (en) * | 2003-02-06 | 2004-09-02 | Koninklijke Philips Electronics, N.V. | Optimizing scaleable video algorithm asset distribution utilizing quality indicators |
| US20050105802A1 (en) * | 2003-11-14 | 2005-05-19 | Hekstra Andries P. | Method and an arrangement for objective assessment of video quality |
Cited By (12)
| Publication number | Priority date | Publication date | Assignee | Title |
|---|---|---|---|---|
| WO2010007286A3 (en) * | 2008-06-24 | 2010-03-11 | France Telecom | Method of referenceless measurement of the perceived quality of a signal and corresponding device |
| FR2943879A1 (en) * | 2009-03-30 | 2010-10-01 | Univ Nantes | METHOD AND APPARATUS FOR EVALUATING THE VISUAL QUALITY OF AN IMAGE OR IMAGE SEQUENCE USING OBJECTIVE INDICATORS AND CORRESPONDING COMPUTER PROGRAM. |
| WO2010112472A1 (en) * | 2009-03-30 | 2010-10-07 | Universite De Nantes | Method and device for assessing the visual quality of an image or a sequence of images using objective indicators, and corresponding computer program |
| US20150170350A1 (en) * | 2012-08-27 | 2015-06-18 | Thomson Licensing | Method And Apparatus For Estimating Motion Homogeneity For Video Quality Assessment |
| EP2888875A4 (en) * | 2012-08-27 | 2016-03-16 | Thomson Licensing | METHOD AND APPARATUS FOR ESTIMATING MOTION HOMOGENEITY FOR EVALUATING VIDEO QUALITY |
| CN105357526A (en) * | 2015-11-13 | 2016-02-24 | 西安交通大学 | Compressed domain based mobile phone football video quality evaluation device and method considering scene classification |
| CN105357526B (en) * | 2015-11-13 | 2016-10-26 | 西安交通大学 | The mobile phone football video quality assessment device considering scene classification based on compression domain and method |
| US20210058626A1 (en) * | 2016-12-12 | 2021-02-25 | Netflix, Inc. | Source-consistent techniques for predicting absolute perceptual video quality |
| US11503304B2 (en) * | 2016-12-12 | 2022-11-15 | Netflix, Inc. | Source-consistent techniques for predicting absolute perceptual video quality |
| US11758148B2 (en) | 2016-12-12 | 2023-09-12 | Netflix, Inc. | Device-consistent techniques for predicting absolute perceptual video quality |
| CN114630111A (en) * | 2022-05-13 | 2022-06-14 | 电子科技大学 | A No-reference Compressed Video Quality Evaluation Method Based on Coding Information |
| CN114630111B (en) * | 2022-05-13 | 2022-10-14 | 电子科技大学 | No-reference compressed video quality evaluation method based on coding information |
Also Published As
| Publication number | Publication date |
|---|---|
| AT509032B1 (en) | 2014-02-15 |
| AT509032A5 (en) | 2014-02-15 |
| AT509032A2 (en) | 2011-05-15 |
Similar Documents
| Publication | Publication Date | Title |
|---|---|---|
| Ries et al. | Video Quality Estimation for Mobile H. 264/AVC Video Streaming. | |
| Ries et al. | Content based video quality estimation for H. 264/AVC video streaming | |
| JP5215288B2 (en) | Temporal quality metrics for video coding. | |
| Yang et al. | Perceptual temporal quality metric for compressed video | |
| KR20170135069A (en) | Method and apparatus for managing video frame based on QoE analysis | |
| Ries et al. | Motion based reference-free quality estimation for H. 264/AVC video streaming | |
| Aguiar et al. | Video quality estimator for wireless mesh networks | |
| Chen et al. | Hybrid distortion ranking tuned bitstream-layer video quality assessment | |
| Nemethova et al. | PSNR-based estimation of subjective time-variant video quality for mobiles | |
| Argyropoulos et al. | No-reference video quality assessment for SD and HD H. 264/AVC sequences based on continuous estimates of packet loss visibility | |
| Ries et al. | Performance evaluation of mobile video quality estimators | |
| Joskowicz et al. | A parametric model for perceptual video quality estimation | |
| WO2008077160A1 (en) | Method and system for video quality estimation | |
| Nur Yilmaz | A no reference depth perception assessment metric for 3D video | |
| Mustafa et al. | Perceptual quality assessment of video using machine learning algorithm | |
| CA2408435C (en) | Method for testing video sequences | |
| Alheraish et al. | A GACS modeling approach for MPEG broadcast video | |
| Arsenović et al. | Quality of Experience Assessment for HTTP Based Adaptive Video Streaming. | |
| Zhang et al. | Compressed-domain-based no-reference video quality assessment model considering fast motion and scene change | |
| Garcia et al. | Video streaming | |
| Zhang et al. | QoE models for online video streaming | |
| Zhang et al. | Overview of full-reference video quality metrics and their performance evaluations for videoconferencing application | |
| Martínez-Rach et al. | On the performance of video quality assessment metrics under different compression and packet loss scenarios | |
| Huang et al. | Perceptual evaluation of pre-processing for video transcoding | |
| Liu et al. | Perceptual quality measurement of video frames affected by both packet losses and coding artifacts |
Legal Events
| Date | Code | Title | Description |
|---|---|---|---|
| 121 | Ep: the epo has been informed by wipo that ep was designated in this application |
Ref document number: 06827966 Country of ref document: EP Kind code of ref document: A1 |
|
| DPE1 | Request for preliminary examination filed after expiration of 19th month from priority date (pct application filed from 20040101) | ||
| DPE1 | Request for preliminary examination filed after expiration of 19th month from priority date (pct application filed from 20040101) | ||
| NENP | Non-entry into the national phase |
Ref country code: DE |
|
| ENP | Entry into the national phase |
Ref document number: 95612006 Country of ref document: AT Kind code of ref document: A |
|
| 122 | Ep: pct application non-entry in european phase |
Ref document number: 06827966 Country of ref document: EP Kind code of ref document: A1 |