WO2001084254A2 - Apparatuses and processes for analyzing a system having false start events - Google Patents
Apparatuses and processes for analyzing a system having false start events Download PDFInfo
- Publication number
- WO2001084254A2 WO2001084254A2 PCT/US2001/014196 US0114196W WO0184254A2 WO 2001084254 A2 WO2001084254 A2 WO 2001084254A2 US 0114196 W US0114196 W US 0114196W WO 0184254 A2 WO0184254 A2 WO 0184254A2
- Authority
- WO
- WIPO (PCT)
- Prior art keywords
- simulation
- failure mode
- downtime
- false start
- loss event
- Prior art date
- Legal status (The legal status is an assumption and is not a legal conclusion. Google has not performed a legal analysis and makes no representation as to the accuracy of the status listed.)
- Ceased
Links
Classifications
-
- G—PHYSICS
- G05—CONTROLLING; REGULATING
- G05B—CONTROL OR REGULATING SYSTEMS IN GENERAL; FUNCTIONAL ELEMENTS OF SUCH SYSTEMS; MONITORING OR TESTING ARRANGEMENTS FOR SUCH SYSTEMS OR ELEMENTS
- G05B19/00—Programme-control systems
- G05B19/02—Programme-control systems electric
- G05B19/418—Total factory control, i.e. centrally controlling a plurality of machines, e.g. direct or distributed numerical control [DNC], flexible manufacturing systems [FMS], integrated manufacturing systems [IMS] or computer integrated manufacturing [CIM]
- G05B19/41885—Total factory control, i.e. centrally controlling a plurality of machines, e.g. direct or distributed numerical control [DNC], flexible manufacturing systems [FMS], integrated manufacturing systems [IMS] or computer integrated manufacturing [CIM] characterised by modeling, simulation of the manufacturing system
-
- G—PHYSICS
- G05—CONTROLLING; REGULATING
- G05B—CONTROL OR REGULATING SYSTEMS IN GENERAL; FUNCTIONAL ELEMENTS OF SUCH SYSTEMS; MONITORING OR TESTING ARRANGEMENTS FOR SUCH SYSTEMS OR ELEMENTS
- G05B17/00—Systems involving the use of models or simulators of said systems
- G05B17/02—Systems involving the use of models or simulators of said systems electric
-
- G—PHYSICS
- G05—CONTROLLING; REGULATING
- G05B—CONTROL OR REGULATING SYSTEMS IN GENERAL; FUNCTIONAL ELEMENTS OF SUCH SYSTEMS; MONITORING OR TESTING ARRANGEMENTS FOR SUCH SYSTEMS OR ELEMENTS
- G05B23/00—Testing or monitoring of control systems or parts thereof
- G05B23/02—Electric testing or monitoring
- G05B23/0205—Electric testing or monitoring by means of a monitoring system capable of detecting and responding to faults
- G05B23/0259—Electric testing or monitoring by means of a monitoring system capable of detecting and responding to faults characterized by the response to fault detection
- G05B23/0283—Predictive maintenance, e.g. involving the monitoring of a system and, based on the monitoring results, taking decisions on the maintenance schedule of the monitored system; Estimating remaining useful life [RUL]
-
- G—PHYSICS
- G06—COMPUTING OR CALCULATING; COUNTING
- G06Q—INFORMATION AND COMMUNICATION TECHNOLOGY [ICT] SPECIALLY ADAPTED FOR ADMINISTRATIVE, COMMERCIAL, FINANCIAL, MANAGERIAL OR SUPERVISORY PURPOSES; SYSTEMS OR METHODS SPECIALLY ADAPTED FOR ADMINISTRATIVE, COMMERCIAL, FINANCIAL, MANAGERIAL OR SUPERVISORY PURPOSES, NOT OTHERWISE PROVIDED FOR
- G06Q10/00—Administration; Management
- G06Q10/06—Resources, workflows, human or project management; Enterprise or organisation planning; Enterprise or organisation modelling
-
- G—PHYSICS
- G05—CONTROLLING; REGULATING
- G05B—CONTROL OR REGULATING SYSTEMS IN GENERAL; FUNCTIONAL ELEMENTS OF SUCH SYSTEMS; MONITORING OR TESTING ARRANGEMENTS FOR SUCH SYSTEMS OR ELEMENTS
- G05B2219/00—Program-control systems
- G05B2219/30—Nc systems
- G05B2219/32—Operator till task planning
- G05B2219/32348—Process reengineering, rethink manufacturing process, continuous improve
-
- G—PHYSICS
- G05—CONTROLLING; REGULATING
- G05B—CONTROL OR REGULATING SYSTEMS IN GENERAL; FUNCTIONAL ELEMENTS OF SUCH SYSTEMS; MONITORING OR TESTING ARRANGEMENTS FOR SUCH SYSTEMS OR ELEMENTS
- G05B2219/00—Program-control systems
- G05B2219/30—Nc systems
- G05B2219/32—Operator till task planning
- G05B2219/32349—Simulate effect of stoppages of production facilities, operate as function of simulation
-
- Y—GENERAL TAGGING OF NEW TECHNOLOGICAL DEVELOPMENTS; GENERAL TAGGING OF CROSS-SECTIONAL TECHNOLOGIES SPANNING OVER SEVERAL SECTIONS OF THE IPC; TECHNICAL SUBJECTS COVERED BY FORMER USPC CROSS-REFERENCE ART COLLECTIONS [XRACs] AND DIGESTS
- Y02—TECHNOLOGIES OR APPLICATIONS FOR MITIGATION OR ADAPTATION AGAINST CLIMATE CHANGE
- Y02P—CLIMATE CHANGE MITIGATION TECHNOLOGIES IN THE PRODUCTION OR PROCESSING OF GOODS
- Y02P90/00—Enabling technologies with a potential contribution to greenhouse gas [GHG] emissions mitigation
- Y02P90/02—Total factory control, e.g. smart factories, flexible manufacturing systems [FMS] or integrated manufacturing systems [IMS]
Definitions
- This invention was made under DOE CRADA No. LA95C01191.
- the present invention relates to the field of processes and apparatuses for analyzing a system, and, more particularly, to the field of processes and apparatuses for simulating and analyzing repairable systems, such as manufacturing systems, queuing systems, etc.
- Reliability is a measure of the probability that parts, components, products, or systems will perform their designed-for functions without failure in specified environments for desired periods at a given confidence level. Typically, reliability is expressed as a decimal fraction (e.g., 0.832).
- Reliability Engineering encompasses the theoretical and practical tools by which the probability and capability of parts, components, equipment, products, and systems to perform their required functions can be specified, predicted, tested, demonstrated, installed, and initialized. Powerful reliability engineering tools which enable the accurate prediction of the reliability of parts, components, and systems can provide a company with a significant competitive advantage. For example, accurate prediction of the reliability of a proposed or existing manufacturing or production line can decrease costs, increase speed to market of new products, and provide more predictable project outcomes. Accurate reliability prediction can also be used to identify and allocate resources for the implementation of process changes which can increase the reliability of a manufacturing system.
- Computer apparatuses and processes for analyzing a system incorporate steps of collecting data from a first system, wherein the first system has a plurality of failure modes and the data relates to the failure modes, parameterizing the data for use in a simulation of a second system, and executing a simulation of the second system.
- the step of executing the simulation also includes determining whether the second system will encounter a first false start event based upon the data collected from the first system.
- FIG. 1 is a schematic illustration of exemplary process in accordance with one aspect of the present invention
- Fig. 2 is a schematic illustration of an exemplary paper towel manufacturing system
- Fig. 3 is a schematic illustration of an illustrative hierarchy for the manufacturing system of Fig. 2;
- Fig. 4 is a plot of exemplary downtime system loss event data
- Fig. 5 is a schematic illustration of networked computers suitable for use with the present invention.
- Fig. 6 is a schematic illustration of a preferred architecture for a simulation made in accordance with the present invention.
- Figs. 7 to 9 are schematic illustrations of a preferred process implemented using the simulation of Fig. 6;
- Fig. 10 is a schematic illustration of a preferred process implemented for the accumulator of the simulation of Fig. 6.
- system is intended to refer to any set of components, processes, operations, or functions which deliver a product or service.
- exemplary systems include manufacturing and production systems, airline flight operations, maintenance operations, queuing operations (e.g., traffic control, reduction of waiting time in lines or queues such as bank teller windows, gas pump, grocery checkout, etc.), industrial and military asset deployment (e.g., troop deployments, air wing sizing, rental car and truck fleet sizing, warehouse and transportation logistics).
- loss event is intended to refer to any event which negatively affects the performance or function of a system or one of its components (e.g., system stops or component downtime, product quality decreases, increased operator intervention, idle trucks or cars, empty lines or queues), wherein each loss event has a cause and a failure mode associated therewith.
- failure mode is intended to refer to a description of how a system can fail to perform its intended function.
- Each failure mode can have associated therewith one or more causes; a downtime during which the failure mode has caused a system, or component thereof, to cease to perform its intended function; and an uptime until the next occurrence of a failure mode, during which time a system, or component thereof, is performing its intended function.
- failure is intended to refer to the reason why a failure mode occurs.
- life is intended to refer to the time from a starting point to the occurrence of an end point.
- CCFM channel failure mode
- the term "competing cause failure mode” is intended to refer to a failure mode which occurs according to its own distribution, which is independent of the distributions of other failure modes and where the competing cause failure mode's uptime terminates at the occurrence of any loss event.
- the uptime of each competing cause failure mode is regenerated after the occurrence of any loss event as if anew.
- CMFM cumulative cause failure mode
- the term "cumulative cause failure mode” is intended to refer to a failure mode which occurs according to its own distribution, which is independent of the distributions of other failure modes and where the cumulative cause failure mode's uptime is not affected by the occurrence of loss events unrelated to the subject cumulative cause failure mode. In simulations of the present invention, the uptime of each cumulative cause failure mode is only regenerated anew after its expiration.
- the term “false start event” is intended to refer to a loss event which occurs quickly relative to the expected life of a system (e.g., two minutes or less for a manufacturing system which may have an average expected life of twenty to thirty minutes) after a system, or component thereof, resumes acceptable operation.
- the term “series system” is intended to refer to a system which fails if any of its components fail.
- parallel system is intended to refer to a system which fails if all of its parallel components fail.
- time is intended to refer to the period of time or life of a system, or component thereof, during which it is performing its intended function.
- downtime is intended to refer to the period of time or life of a system, or component thereof, during which it is not performing its intended function due to a loss event.
- the term "availability" is intended to refer to ratio of total uptime for a system to the sum of the total uptime for a system plus the total downtime for a system.
- MTBF Mel Time Between Failures
- MTTR Mel Time To Repair
- parametric is intended to refer to the process of characterizing or fitting data according to a parametric equation (e.g., equations containing parameters of shape, scale, and location to describe data, such as Weibull equations, log-normal equations, normal equations, etc.).
- the process 20 begins at step 21 where a hierarchial level of the system is selected.
- the hierarchial level defines the system to be analyzed and represents the depth to which the components of a system are simulated.
- the present invention will be described herein with respect a system in the form of a manufacturing system and the machines which form part of the manufacturing system. More particularly, the present invention will be described herein with respect to a series towel manufacturing system 22 as schematically illustrated in Fig. 2.
- the manufacturing system 22 comprises a sheet roller 24 having wound thereabout a paper sheet 26 having a finite length.
- the sheet 26 passes through an embosser 28 which imprints a pattern upon the sheet 26.
- the sheet 26 is cut in the machine direction into discrete portions 32 at a first cutter 30.
- the portions 32 are wrapped about a cylindrical paper core at the core roller 34 after which the rolled portions 36 are deposited in an accumulator 38.
- the rolled portions 36 are next cut in the cross machine direction at the second cutter 40.
- the twice cut rolled portions 42 are delivered to a wrapper 44 which wraps a plurality of the rolled portions 42 in a polymeric film 46 which is drawn from a polymer roller 48.
- a plurality of sensors 50 are distributed throughout the manufacturing system 22 to detect loss events of the manufacturing system, as discussed more fully hereafter.
- Fig. 3 sets forth various illustrative hierarchies above and below that described for the manufacturing system 22 of Fig. 2.
- a higher hierarchial level might include a distribution network 52 comprising a plurality of manufacturing plants 54 (a parallel system), each of which have a plurality of the manufacturing systems 22, wherein the manufacturing systems 22 have a plurality of machines 56 (e.g., the roller 24) associated therewith and each machine 56 has a plurality of sub-components 58 (e.g., a roller bearing for the sheet roller 24).
- a distribution network 52 comprising a plurality of manufacturing plants 54 (a parallel system), each of which have a plurality of the manufacturing systems 22, wherein the manufacturing systems 22 have a plurality of machines 56 (e.g., the roller 24) associated therewith and each machine 56 has a plurality of sub-components 58 (e.g., a roller bearing for the sheet roller 24).
- the system hierarchy selected at step 21 is analyzed to identify its cumulative and competing failure modes and their causes.
- Set forth in Table 1 below is an illustrative listing of cumulative and competing failure modes and their causes for the manufacturing system 22.
- the sheet roller 24 has three failure modes: two cumulative cause failure modes and one competing cause failure mode. Whether a failure mode is cumulative or competing can be based upon the cause of the failure mode or rules of construction (e.g., all failure modes are competing unless identified otherwise). The rules of construction can be tailored according to the objectives or use of the simulation.
- the sheet jam failure mode is competing, because, sheet instabilities can cause a sheet jam anew after repair of any loss event.
- the belt failure and roller change (i.e., replacement of the roll because the sheet is depleted) failure modes are cumulative, because they are dependent upon the finite life of the belt and sheet irrespective of other unrelated loss events.
- the failure modes can have multiple causes (see, e.g., failure mode number 1 in Table 1) and downtime distributions. Further, the failure modes do not necessarily have a correspondence between the number of failure mode causes and the number of downtime distributions.
- the downtime distributions represent independent, identically distributed repair time characteristics for a single failure mode. For instance, the sheet jam failure mode has three downtime distributions, such as a short repair time period, a medium repair time period, and a long repair time period. Selection of the number of downtime distributions can be determined using methods known in the art, such as segmented regression wherein discontinuities between segments each represent a separate distribution.
- the probability C of falling within any given downtime distribution is determined by the ratio of the number of loss events within a downtime distribution over the total number of loss events for the subject failure mode. For example with reference to Fig. 4, an exemplary plot for the sheet jam competing cause failure mode of the sheet roller 24 is illustrated. The total number of loss events illustrated in Fig. 4 is 188. For the first downtime distribution 70, the number of loss events is 109 and therefore the probability C of a downtime occurring in the first downtime distribution 70 is 0.58. Similarly, the number of loss events for the second downtime distribution 73 is 76 and therefore the probability C of a downtime occurring in the second downtime distribution is 0.40.
- time-based system loss event data (e.g., uptimes, downtimes) is collected from the manufacturing system 22 and parametrically analyzed at steps 60 and 62 once the hierarchial level of the manufacturing system 22 has been selected.
- the collection of this system loss event data is used to characterize and quantify the failure modes of the manufacturing system 22.
- the system loss event data which is collected preferably includes failure mode causes, time stamps marking the beginning and end of uptime and downtime periods, and the absolute time of uptime periods and downtime periods.
- various detection techniques can be employed for collection of the data. Illustrative methods are set forth in Table 2 below.
- the system loss event data can be collected using the sensors 50 and/or programmable logic controllers (or PLCs).
- Illustrative system loss event data for the manufacturing system 22 is set forth below in Table 3. Enough data should be collected for each failure mode to establish a statistical sample. More preferably, at least about 3 events are recorded for each failure mode. Most preferably, between about 15 events and about 30 events are recorded for each failure mode.
- the system loss event data can also include other information, such as a date stamp. While Table 3 is directed to system loss event data for a manufacturing system, other data types can be monitored for other systems, such as idle time for queue systems (e.g., gas pump available but idle).
- the system loss event data can be parameterized using one of several statistical distribution/function types known in the art, such as an exponential distribution, a normal distribution, a Weibull distribution, or a log normal distribution.
- the Weibull distibution (in particular the Weibull Probability Density Function or PDF) is particularly useful for characterizing uptimes while downtimes are typically characterized according to a log normal distribution.
- False start events are preferably calculated according to the following equation:
- False start probability (P) 1 -(total number of false start events for a failure mode) (1) total number of loss events for the system
- a false start probability P of 0.97 means that 97% of the time, there is not a false start for this failure mode following any loss event for any failure mode.
- a typical Weibull PDF for uptime has the following form:
- Alpha and Beta constants are the customary Weibull constants (i.e., alpha is the scale parameter and beta is the shape parameter) known in the art. Equation (2) can be rearranged to the following form when solved for uptime:
- Equation (2) can be used to calculate uptimes based upon generation of a random probability, wherein a uniform random real number between zero and one is used for the probability of failure.
- Any log-normal equation known in the art having parameters sigma (i.e., the standard deviation of the log of the downtimes) and mu (i.e., the mean of the log of the downtimes), can be used to parameterize a downtime distribution.
- the uptime distributions for the failure modes of the manufacturing system 22, as set forth in Table 1 are parametrized using a Weibull PDF and the downtimes are characterized using a log-normal function, wherein the probability constant C represents the probabilities among the various downtime distributions.
- the summation of the constant C values of any single failure mode must equal one, because the downtime from any loss event must fall into one of the subject downtime distributions for the failure mode of that loss event.
- the false start probability of each failure mode is represented by a constant P.
- Illustrative alpha, beta, mu, sigma, and C and P constants for each failure mode are set forth below in Table 4.
- some of the failure modes have more than one downtime distribution. For example, a belt driven roller might fail because of failure of a driving belt. The roller might be quickly repaired if multiple belts are hung about the driving pulleys such that disassembly of the roller structure is not required for the repair and a short repair time occurs.
- a rate constant R which represents a steady state product rate value for a simulation object (e.g., 180 feet per minute of sheet feed for the sheet roller).
- a computer program modeling or simulating the manufacturing system 22 is constructed in accordance with another aspect of the present invention.
- the simulation program is executed or run on any general or special purpose computer or other digital processing apparatus, such as a desktop computer, a server and/or client computer interconnected by a network (for example, either via the Internet or an Intranet), a micro-computer, hand-held organizers and other forms of computers and computer systems as otherwise known in the art.
- Exemplary networked computers 1000 are illustrated schematically in Fig. 5.
- the computer preferably comprises a logic circuit (such as central processing unit 1030, microprocessor or other micro controller) capable of executing the simulation program.
- the simulation program can be provided as a program product, wherein the program product includes a signal bearing medium which can be configured to store data and/or machine readable instructions which cause the logic circuit to which it is connected to perform the simulation steps discussed hereafter.
- the signal bearing medium can be provided in the form of an optical disk, a magnetic disk, a magnetic hard drive (e.g., reference numeral 1010), a magnetic tape, RAM, ROM, or any other magnetic, optical, or other computer readable storage medium.
- the program product can be distributed with the instructions contained in other signal bearing media including digital and analog communication links (e.g., such as a wire or fiber portion of a local area network, a wire or fiber portion of a wide area network, a portion of a wireless network, etc.), a carrier wave or propagated signal, and other forms of transmission media.
- the computer also preferably comprises one or more input/output peripherals, such as a keyboard, mouse, touch screen, microphone, display monitor, printer, etc., which can be interconnected with the logic circuit via a system bus and adapter (e.g., display adapter 1040). While the step 148 of Fig. 1 is preferably computerized, it will be appreciated that the other steps (or portions thereof) of the process 20 can be implemented by or in combination with a digital processing apparatus.
- a preferred simulation program 80 comprises a plurality of simulation objects 82 and a controller 84, wherein each simulation object 82 represents a physical component of the modeled system (e.g., a plant, a manufacturing line, a machine, a component, a queue, etc.).
- the simulation program can be implemented using any one of a number of object oriented or non-object oriented programming languages known in the art (e.g., C, C++, EXCEL macros, etc.).
- the simulation objects each represent a machine 56 of the manufacturing system 22 and comprise instructions and/or data which describe the operation of that machine.
- the simulation objects 82 are interconnected with their corresponding upstream and downstream simulation objects such that a virtual representation of the manufacturing system 22 is arranged.
- the simulation objects 82 preferably send to their immediately adjacent upstream and downstream simulation objects the simulated rate (e.g., a linear rate in feet/minute of the sheet 26 between simulation object 1 and simulation object 2) and the simulated state of the simulation object (e.g., either stopped or operational).
- the controller 84 coordinates the simulation time (hereinafter "the current simulation time") among the various simulation objects 82.
- the coordination is accomplished by each simulation object transmitting its uptime and/or downtime to the controller 84 as each simulation object encounters a simulated loss event (e.g., a stop).
- a simulated loss event e.g., a stop
- the controller 84 advances the current simulation time according to the downtime or uptime calculated at a simulation object, as described more fully hereafter.
- an exemplary process 86 implemented in combination with a simulation object 82 in accordance with yet another aspect of the present invention will now be described.
- the steps of the process are described both generically for any simulation object 82 and by way of example to the sheet roller simulation object, although it will be appreciated that these steps can be similarly implemented for the other simulation objects 82 of the simulation 80. While the steps of the process 86 are described herein with respect to simulation objects, some steps implemented by the controller 84 are also incorporated into the process 86 for ease of discussion. It will be further appreciated that the steps of the process 86 and the arrangement of the simulation objects and controller can be modified, rearranged, combined, and separated as is known in the art without departing from the scope of this invention.
- the process 86 begins at step 88 where the parameters (e.g., constants P/C/R, Alpha, Beta, mu, sigma, etc.) for the uptime and downtime distributions, rates, and false start probabilities of the simulation object 82 are preferably read from an input file or the like.
- the parameters e.g., constants P/C/R, Alpha, Beta, mu, sigma, etc.
- a false start probability array is generated at step 89, wherein the array preferably has the structure set forth in Table 5 below.
- the first column is the false start probability constant P while the second column is the difference of one minus the false start probability P.
- the third column is the quotient of one minus the false start probability constant P over the sum of one minus the false start probability constant P from column 3.
- the fourth column is the running summation of the third column. TABLE 5
- a target false start probability is summed for the competing cause failure modes of the simulation object according to the following equation at step 90:
- Target false start probability 1- ⁇ (1- false start probabilities P) (4)
- a uniform random real number between zero and one is generated at step 94 and this uniform random real number is used to calculate an uptime for each cumulative cause failure mode for the subject simulation object 82 based upon equation (2) above.
- the sheet roller 24 has the roller change and belt failure cumulative cause failure modes, as listed in Tables 1 and 4.
- the illustrative alpha and beta values for failure mode number 2 listed in Table 4 are 63,400 and 15, respectively.
- this cumulative cause failure mode would have an uptime of 63,346 minutes, respectively, at step 94.
- These uptime values are preferably stored in an array or other data structure which is updated as the simulation 80 is executed.
- Steps 96 to 106 are next executed to calculate a competing cause failure mode false start error.
- a loss event counter storing the total number of simulated loss events (i.e., both competing cause and cumulative cause failure mode loss events) is incremented as each loss event is encountered. If the previous loss event for the simulation object was due to a competing cause failure mode and was a false start as indicated at step 98, step 100 is executed, wherein a counter summing the number of competing cause failure mode false starts is incremented by one. Otherwise directly execute step 102, wherein the simulation's false start event probability is calculated according to the following equation:
- Simulation false start prob. Total number of CCFM false start events (5)
- a corrected simulation false start probability is calculated at step 106 based upon the calculated error.
- Any error correction methodology known in the art can be employed to calculate the corrected simulation false start probability value (e.g., a binary search). While an error correction is described herein for simplicity with respect to false starts following a competing cause failure mode, it will be appreciated that an error correction could be similarly implemented for false starts following a cumulative cause failure mode.
- step 110 it is determined whether the previous loss event was due to a competing cause failure mode, or whether it was due to a cumulative cause failure mode. If it is due to competing cause failure mode, steps 112 and 114 are used to determine if there is a false start following the downtime (i.e., following the repair time) for the previous loss event while accounting for the corrected simulation false start probability determined at step 106. If the previous loss event is due to a cumulative cause failure mode, then steps 111 and 113 (Fig. 8) are executed. At step 111, a uniform random real number between zero and one is generated. If the uniform random real number is less than or equal to the false start probability P of the previous cumulative cause failure mode, as described at step 113, then there is a false start following this loss event.
- step 112 is next executed to determine if there is a competing cause false start event beginning with step 112, as also discussed more fully hereafter.
- steps 112 and 114 are performed.
- a uniform random real number between zero and one is generated at step 112 and if this uniform random real number is greater than or equal to the corrected simulation false start probability determined at step 106, then there is no false start following the previous loss event, then parallel paths A and B (Fig.
- the uniform random real number generated at step 114 is greater than the corrected false start probability determined at step 106 (i.e., there is a false start event following the previous loss event), then a new uniform random real number is generated at step 115 and this number is compared to the fourth column of the array generated at step 89 to determine which failure mode of the subject machine step has caused the false start. For example with reference to Table 5, if the uniform random real number generated at step 115 is 0.85, then failure mode number 3 would be used to determine the downtime for the false start event because 0.85 is greater than 0.7777 but less than 1. After determining which failure mode causes the false start event, the downtime process 116 (Fig. 9) is next executed to determine the downtime for the false start event.
- parallel path A calculates the uptimes for each competing cause failure mode of the subject simulation object while parallel path B generates the uptimes for each cumulative cause failure mode of the subject simulation object.
- a uniform random real number between zero and one is separately generated for each competing cause failure mode of the simulation object.
- Each uniform random real number is applied to equation (3), wherein equation (3) incorporates the alpha and beta for the failure mode corresponding with the generated uniform random real number.
- Table 6 lists the uniform random real number generated for each competing cause failure mode of the sheet roller 24.
- an uptime is calculated based upon the generated uniform random real number for a competing cause failure mode.
- the smallest competing cause failure mode simulation time is next selected at step 120 from among all the competing cause failure mode simulation times for the subject simulation object and this value is forwarded to step 132.
- the smallest uptime among the cumulative cause failure modes for the subject simulation object 82 is determined at steps 122 to 130.
- the system uptime is subtracted from the cumulative cause failure mode uptime of each cumulative cause failure mode and these new values are stored in the array.
- the new uptime is calculated which replaces the expired cumulative cause failure mode uptime in the array.
- the smallest cumulative cause failure mode uptime is next selected from among all the cumulative cause failure mode uptimes in the array for the subject simulation object 82 at step 130.
- the smallest uptime value between step 130 and step 120 is selected at step 132 to determine which competing cause failure mode or cumulative cause failure mode will cause the next loss event for the subject simulation object 82.
- this smallest failure mode uptime is sent to the controller 84 at step 133.
- the controller 84 selects the smallest failure mode uptime from among all the simulation objects (the "system uptime"), including from any accumulator product level loss events (discussed more fully hereafter as another preferred embodiment), and adds that uptime to the current simulation time, thereby advancing the simulation to the beginning of the loss event.
- the system uptime is returned to each simulation step.
- each simulation object determines whether its failure mode uptime determined at step 132 matches the returned system uptime. If it does, then execution passes to the downtime process 116 which is performed beginning with step 134 (i.e., that simulation object is the one encountering the loss event), as shown in Fig.
- steps 141 and 143 are performed wherein the simulation object enters a "wait or idle" state at step 141, wherein each simulation object awaits input from its adjacent simulation objects and/or the controller.
- updated rate and state information is sent to each adjacent simulation object at step 134, which generally for a loss event is a rate of zero and a state indicator that the subject simulation object 82 has stopped.
- the state indicators are merely used to coordinate events among the simulation objects.
- a uniform random real number between zero and one is generated at step 136, and this number is used at step 138 to select which downtime distribution will be used to calculate the downtime for the particular loss event by comparing each downtime constant C to the uniform random real number.
- the constants C are sequentially summed and the uniform random real number is compared to the range in between the summations to determine which downtime distribution to use. For example with reference to Tables 4, failure mode 1, and Table 7, if the uniform random real number generated at step 136 is 0.85, then the downtime distribution # 2 from Table 4 would be used to determine the downtime because 0.85 is greater than 0.6 but less than 0.95.
- a new uniform random real number between zero and one is generated. This uniform random real number is used with equation (4) to determine the downtime for the loss event at step 142 using the downtime distribution parameters for the downtime distribution determined at step 136.
- the downtime calculated at step 142 (the system downtime) is sent to the controller 84 at step 144.
- the controller adds the system downtime to the current simulation time (i.e., the simulation time is now advanced to the end to the repair period) and forwards the current simulation time to each of the simulation objects at step 144 (this information being received by the simulation objects at step 143).
- the rate and state for the subject simulation object 82 which caused the loss event are next updated and sent to the adjacent simulation objects at step 146, wherein generally the rate is set to the rate constant (e.g., 180 ft/minute for the sheet roller 24) and the state is updated to running. Execution, for all simulation objects 82 then resumes at point E of Fig. 6, wherein the false start probability error correction begins at step 96.
- the rate constant e.g. 180 ft/minute for the sheet roller 24
- An alternate preferred embodiment of the present invention incorporates the process 152 illustrated in Fig. 10 for simulation objects modeling storage or buffer components, such as the accumulator 38.
- Each accumulator has an empty product level value (i.e., the value at which there is no product in the accumulator), a current product level value (i.e., the current value for the amount of product in the accumulator), and a full product level value (i.e., the value at which the accumulator is completely filled with product and can accept no more).
- the difference between the rate of product into the accumulator and the rate of product out of the accumulator is calculated.
- the rate of product into the accumulator 38 of the manufacturing 22 is the difference between the rate constant for product delivered from the simulation object 82 representing the core roller 82 and the rate constant for the product received by the simulation object 82 representing the second cutter 40. If the difference is greater than zero at step 156, then step 158 is performed, wherein it is determined how long it is before the accumulator 38 is full by subtracting the full product level value from the current product level value and dividing this difference by the rate difference calculated at step 154. This value is then summed with the current simulation time received by the simulation object 82 for the accumulator at step 143 of Fig. 6 and sent to step 132.
- This accumulator level simulation time value (which represents a loss event) is then compared to the smallest competing cause and cumulative cause simulation times of step 132. Referring to step 160, if the rate difference is less than zero then step 162 is executed, whereat it is determined how long it is before the accumulator 38 is empty by subtracting the current product level value from the empty product level value and dividing this difference by the rate difference calculated at step 154. This value is then summed with the current simulation time received by the simulation object 82 for the accumulator at step 143 of Fig. 6 and sent to step 132. This accumulator level simulation time value (which represents a loss event) is then compared to the smallest competing cause and cumulative cause simulation times of step 132.
- step 164 is performed (i.e., the rate difference equals zero and the rate in equals the rate out), wherein the product level within the accumulator is constant and an accumulator level simulation time value of infinity is sent to step 132.
- a uniform random real number is generated at the fourth column to determine whether there is a false start for the competing cause failure modes under the simplified assumption that there is not a cumulative cause false start at startup.
- the same single random real number is used for each competing cause failure mode of a machine object (i.e., steps 112 and 114 of Fig. 7) step and a separate random real number is generated for each cumulative cause failure mode when appropriate (i.e., when step 111 of Fig. 7 is executed). If there is a false start as determined at steps 113 or 114 of Fig. 7, a "yes" is indicated in fifth column.
- a uniform random real number is generated for each failure mode and this uniform random real number is then used to generate an uptime.
- the smallest uptime for each simulation object is selected at the eighth column and then the smallest uptime for the system is selected at the ninth column.
- a uniform random real number is generated at the tenth column; however since there is only one downtime distribution, it is not does not affect which downtime distribution is selected.
- a random number is generated, which is then used to determine the downtime for failure mode number five.
- Uniform random real numbers are again generated at the fourth column for the false start probabilities (except the cumulative cause failure modes since the prior loss event was not due to a cumulative cause failure mode), and there are no false starts.
- New uptimes are generated for the competing cause failure modes only at seventh column based upon the uniform random real numbers listed in the sixth column.
- a new system uptime is selected at the tenth column (e.g., 5 minutes).
- the downtime for the false start event calculated at the fifth time step is added to the current simulation time at the first column of the fifth time.
- the uptime for each competing cause failure mode is generated at the seventh column based upon the uniform random real numbers of the sixth column. Since there was no system uptime between the fourth and sixth time steps, the uptimes for the cumulative cause failure modes remain the same as the uptimes of the third time step.
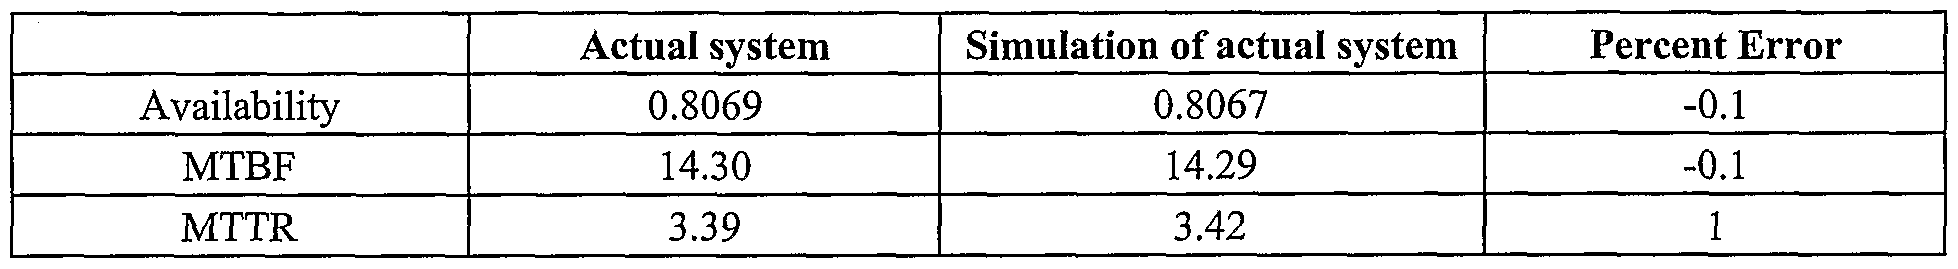
- the simulation 80 can be used to analyze the manufacturing system 22 and implement changes in the manufacturing system 22 to improve its reliability, as described at step 150. For instance, the size of the accumulator 38 might be changed, the rate constants for a machine might be adjusted, the arrangement of machines in the manufacturing system might be changed, the value of eliminating a failure mode, etc.
- the system data can be used to model a second, yet to be built, manufacturing system having similar system objects, perhaps arranged in a different manner, in order to predict and optimize the reliability of the second system prior to building it.
- the percent error i.e., the ratio of the actual value minus the simulated value over the actual value X 100
- the percent error is less than about 3%, and more preferably less about 2%.
- the error is less than about 1%.
- other values such as the number of loss events, the downtime by loss event, can be outputted from a simulation made in accordance with the present invention.
- the amount of the error can be further decreased by, for example, increasing the number of downtime distributions which are simulated.
Landscapes
- Engineering & Computer Science (AREA)
- General Physics & Mathematics (AREA)
- Physics & Mathematics (AREA)
- Automation & Control Theory (AREA)
- Business, Economics & Management (AREA)
- Entrepreneurship & Innovation (AREA)
- Manufacturing & Machinery (AREA)
- Strategic Management (AREA)
- Quality & Reliability (AREA)
- Human Resources & Organizations (AREA)
- Economics (AREA)
- Game Theory and Decision Science (AREA)
- General Business, Economics & Management (AREA)
- Development Economics (AREA)
- General Engineering & Computer Science (AREA)
- Marketing (AREA)
- Operations Research (AREA)
- Tourism & Hospitality (AREA)
- Educational Administration (AREA)
- Theoretical Computer Science (AREA)
- Management, Administration, Business Operations System, And Electronic Commerce (AREA)
- Debugging And Monitoring (AREA)
- Hardware Redundancy (AREA)
- Investigating Or Analysing Biological Materials (AREA)
- Test And Diagnosis Of Digital Computers (AREA)
- Selective Calling Equipment (AREA)
Abstract
Description


Claims
Priority Applications (4)
| Application Number | Priority Date | Filing Date | Title |
|---|---|---|---|
| CA002407775A CA2407775C (en) | 2000-05-04 | 2001-05-03 | Computer apparatuses and processes for analyzing a system having false start events |
| AU2001259385A AU2001259385A1 (en) | 2000-05-04 | 2001-05-03 | Apparatuses and processes for analyzing a system having false start events |
| DE60134014T DE60134014D1 (en) | 2000-05-04 | 2001-05-03 | DEVICE AND METHOD FOR ANALYZING A SYSTEM WITH FAULT START |
| EP01932900A EP1287410B1 (en) | 2000-05-04 | 2001-05-03 | Apparatuses and processes for analyzing a system having false start events |
Applications Claiming Priority (2)
| Application Number | Priority Date | Filing Date | Title |
|---|---|---|---|
| US20201000P | 2000-05-04 | 2000-05-04 | |
| US60/202,010 | 2000-05-04 |
Publications (2)
| Publication Number | Publication Date |
|---|---|
| WO2001084254A2 true WO2001084254A2 (en) | 2001-11-08 |
| WO2001084254A3 WO2001084254A3 (en) | 2002-07-18 |
Family
ID=22748196
Family Applications (1)
| Application Number | Title | Priority Date | Filing Date |
|---|---|---|---|
| PCT/US2001/014196 Ceased WO2001084254A2 (en) | 2000-05-04 | 2001-05-03 | Apparatuses and processes for analyzing a system having false start events |
Country Status (8)
| Country | Link |
|---|---|
| US (1) | US20020069044A1 (en) |
| EP (1) | EP1287410B1 (en) |
| AT (1) | ATE395646T1 (en) |
| AU (1) | AU2001259385A1 (en) |
| CA (1) | CA2407775C (en) |
| DE (1) | DE60134014D1 (en) |
| ES (1) | ES2306713T3 (en) |
| WO (1) | WO2001084254A2 (en) |
Cited By (3)
| Publication number | Priority date | Publication date | Assignee | Title |
|---|---|---|---|---|
| US7571089B2 (en) | 2006-08-23 | 2009-08-04 | Kimberly Clark Worldwide, Inc. | Method for simulating a system having multiple failure modes |
| WO2012013210A1 (en) * | 2010-07-30 | 2012-02-02 | Abb Technology Ag | Method and system for identification of indexes, for distributed control systems |
| CN111597682A (en) * | 2020-04-14 | 2020-08-28 | 新疆大学 | A Method for Predicting Remaining Life of Wind Turbine Gearbox Bearings |
Families Citing this family (8)
| Publication number | Priority date | Publication date | Assignee | Title |
|---|---|---|---|---|
| WO2002027418A2 (en) * | 2000-09-25 | 2002-04-04 | Motorwiz, Inc. | Model-based machine diagnostics and prognostics using theory of noise and communications |
| JP4044443B2 (en) * | 2001-04-27 | 2008-02-06 | 東京エレクトロン株式会社 | Semiconductor manufacturing equipment remote maintenance system, factory side client, vendor side server, storage medium, program, and semiconductor manufacturing equipment remote maintenance method |
| JP2003130048A (en) * | 2001-10-26 | 2003-05-08 | Nsk Ltd | Rolling bearing life prediction method, life prediction apparatus, rolling bearing selection apparatus using life prediction apparatus, program, and environmental coefficient determination method |
| JP2003203001A (en) * | 2001-12-28 | 2003-07-18 | Toshiba Corp | Log analysis method, log analysis program |
| US6807659B2 (en) * | 2002-09-26 | 2004-10-19 | International Business Machines Corporation | Robust delay metric for RC circuits |
| US20150026094A1 (en) * | 2013-07-18 | 2015-01-22 | Cisco Technology, Inc. | Reliability target system |
| JP6751231B2 (en) * | 2016-07-07 | 2020-09-02 | 富士通株式会社 | Job scheduler test program, job scheduler test method, and parallel processing device |
| KR102900438B1 (en) * | 2020-10-27 | 2025-12-15 | 제이에프이 스틸 가부시키가이샤 | Construction method of abnormality diagnosis model, abnormality diagnosis method, construction device of abnormality diagnosis model, and abnormality diagnosis device |
Family Cites Families (13)
| Publication number | Priority date | Publication date | Assignee | Title |
|---|---|---|---|---|
| US4472804A (en) * | 1981-04-09 | 1984-09-18 | Electric Power Research Institute, Inc. | Method and means for reliability and maintainability analysis |
| US5210704A (en) * | 1990-10-02 | 1993-05-11 | Technology International Incorporated | System for prognosis and diagnostics of failure and wearout monitoring and for prediction of life expectancy of helicopter gearboxes and other rotating equipment |
| JP3186866B2 (en) * | 1992-11-20 | 2001-07-11 | 株式会社東芝 | Method and apparatus for predicting deterioration / damage of structural member |
| US5465321A (en) * | 1993-04-07 | 1995-11-07 | The United States Of America As Represented By The Administrator Of The National Aeronautics And Space Administration | Hidden markov models for fault detection in dynamic systems |
| US6110214A (en) * | 1996-05-03 | 2000-08-29 | Aspen Technology, Inc. | Analyzer for modeling and optimizing maintenance operations |
| WO1998024042A1 (en) * | 1996-11-27 | 1998-06-04 | Sundstrand Corporation | Method of maintaining components subject to fatigue failure |
| JP2982741B2 (en) * | 1997-05-13 | 1999-11-29 | 日本電気株式会社 | Fault diagnosis device for integrated circuit and recording medium therefor |
| US6349237B1 (en) * | 1997-12-23 | 2002-02-19 | The Regents Of The University Of Michigan | Reconfigurable manufacturing system having a production capacity method for designing same and method for changing its production capacity |
| US6334095B1 (en) * | 1998-11-12 | 2001-12-25 | Jan Bryan Smith | Method for assessing plant capacity |
| US6505145B1 (en) * | 1999-02-22 | 2003-01-07 | Northeast Equipment Inc. | Apparatus and method for monitoring and maintaining plant equipment |
| WO2001084468A1 (en) * | 2000-05-04 | 2001-11-08 | The Regents Of The University Of California | Optimizing the availability of a buffered industrial process |
| US6611773B2 (en) * | 2000-11-28 | 2003-08-26 | Power Measurement Ltd. | Apparatus and method for measuring and reporting the reliability of a power distribution system with improved accuracy |
| US6671654B1 (en) * | 2000-11-28 | 2003-12-30 | Power Measurement Ltd. | Apparatus and method for measuring and reporting the reliability of a power distribution system |
-
2001
- 2001-05-03 DE DE60134014T patent/DE60134014D1/en not_active Expired - Lifetime
- 2001-05-03 ES ES01932900T patent/ES2306713T3/en not_active Expired - Lifetime
- 2001-05-03 WO PCT/US2001/014196 patent/WO2001084254A2/en not_active Ceased
- 2001-05-03 AT AT01932900T patent/ATE395646T1/en not_active IP Right Cessation
- 2001-05-03 AU AU2001259385A patent/AU2001259385A1/en not_active Abandoned
- 2001-05-03 EP EP01932900A patent/EP1287410B1/en not_active Expired - Lifetime
- 2001-05-03 CA CA002407775A patent/CA2407775C/en not_active Expired - Lifetime
- 2001-05-03 US US09/848,520 patent/US20020069044A1/en not_active Abandoned
Cited By (4)
| Publication number | Priority date | Publication date | Assignee | Title |
|---|---|---|---|---|
| US7571089B2 (en) | 2006-08-23 | 2009-08-04 | Kimberly Clark Worldwide, Inc. | Method for simulating a system having multiple failure modes |
| WO2012013210A1 (en) * | 2010-07-30 | 2012-02-02 | Abb Technology Ag | Method and system for identification of indexes, for distributed control systems |
| CN111597682A (en) * | 2020-04-14 | 2020-08-28 | 新疆大学 | A Method for Predicting Remaining Life of Wind Turbine Gearbox Bearings |
| CN111597682B (en) * | 2020-04-14 | 2023-03-31 | 新疆大学 | Method for predicting remaining life of bearing of gearbox of wind turbine |
Also Published As
| Publication number | Publication date |
|---|---|
| CA2407775A1 (en) | 2001-11-08 |
| ATE395646T1 (en) | 2008-05-15 |
| AU2001259385A1 (en) | 2001-11-12 |
| WO2001084254A3 (en) | 2002-07-18 |
| US20020069044A1 (en) | 2002-06-06 |
| ES2306713T3 (en) | 2008-11-16 |
| DE60134014D1 (en) | 2008-06-26 |
| CA2407775C (en) | 2007-09-25 |
| EP1287410A2 (en) | 2003-03-05 |
| EP1287410B1 (en) | 2008-05-14 |
Similar Documents
| Publication | Publication Date | Title |
|---|---|---|
| Zhang et al. | Digital twin enhanced dynamic job-shop scheduling | |
| US20060089920A1 (en) | Method and system for evaluating costs of various design and maintenance approaches | |
| US10521490B2 (en) | Equipment maintenance management system and equipment maintenance management method | |
| US8494826B2 (en) | Systems and methods for analyzing equipment failures and maintenance schedules | |
| CN101268427B (en) | Aggregation of asset usage indices within a processing plant | |
| CA2407775C (en) | Computer apparatuses and processes for analyzing a system having false start events | |
| CA2409753C (en) | Computer apparatuses and processes for analyzing a system having cumulative and competing cause failure modes | |
| CN101847007A (en) | Process for determining competing cause event probability and/or system availability during the simultaneous occurrence of multiple events | |
| KR102419234B1 (en) | Product quality analysis support system | |
| Sun et al. | Reliability modeling and analysis of serial-parallel hybrid multi-operational manufacturing system considering dimensional quality, tool degradation and system configuration | |
| CN119847070A (en) | Numerical control program control operation method and system | |
| Gusev et al. | Forecasting of maintenance indicators of complex technical systems during storage | |
| JP6975086B2 (en) | Quality evaluation method and quality evaluation equipment | |
| US20090018883A1 (en) | System for evaluating process implementation | |
| CN112580823A (en) | Data processing method and device, readable storage medium and electronic equipment | |
| Penn et al. | Optimizing the quality control station configuration | |
| CN119089573A (en) | Digital system and method for automobile parts based on digital twin | |
| CN116384876A (en) | Dynamic Inventory of Spare Parts Based on Wiener Process-Production Control Method, System and Medium | |
| Salsabila et al. | Throughput analysis on a multi-state manufacturing system by considering availability | |
| Raviv | An efficient algorithm for maximizing the expected profit from a serial production line with inspection stations and rework | |
| CN111837082B (en) | Ultrasonic flow meter prognostics using near real-time conditions | |
| CN119388585B (en) | On-line customization quartering system for gypsum board | |
| Kolisnyk et al. | Markov model for availability assessment of PLC in Industrial IoT considering subsystems failures | |
| CN117113886B (en) | Pressure prediction method and device | |
| Bagdia et al. | Upstream demand projection and performance mapping in supply chains |
Legal Events
| Date | Code | Title | Description |
|---|---|---|---|
| AK | Designated states |
Kind code of ref document: A2 Designated state(s): AE AG AL AM AT AT AU AZ BA BB BG BR BY BZ CA CH CN CO CR CU CZ CZ DE DE DK DK DM DZ EE EE ES FI FI GB GD GE GH GM HR HU ID IL IN IS JP KE KG KP KR KZ LC LK LR LS LT LU LV MA MD MG MK MN MW MX MZ NO NZ PL PT RO RU SD SE SG SI SK SK SL TJ TM TR TT TZ UA UG UZ VN YU ZA ZW |
|
| AL | Designated countries for regional patents |
Kind code of ref document: A2 Designated state(s): GH GM KE LS MW MZ SD SL SZ TZ UG ZW AM AZ BY KG KZ MD RU TJ TM AT BE CH CY DE DK ES FI FR GB GR IE IT LU MC NL PT SE TR BF BJ CF CG CI CM GA GN GW ML MR NE SN TD TG |
|
| 121 | Ep: the epo has been informed by wipo that ep was designated in this application | ||
| DFPE | Request for preliminary examination filed prior to expiration of 19th month from priority date (pct application filed before 20040101) | ||
| AK | Designated states |
Kind code of ref document: A3 Designated state(s): AE AG AL AM AT AT AU AZ BA BB BG BR BY BZ CA CH CN CO CR CU CZ CZ DE DE DK DK DM DZ EE EE ES FI FI GB GD GE GH GM HR HU ID IL IN IS JP KE KG KP KR KZ LC LK LR LS LT LU LV MA MD MG MK MN MW MX MZ NO NZ PL PT RO RU SD SE SG SI SK SK SL TJ TM TR TT TZ UA UG UZ VN YU ZA ZW |
|
| AL | Designated countries for regional patents |
Kind code of ref document: A3 Designated state(s): GH GM KE LS MW MZ SD SL SZ TZ UG ZW AM AZ BY KG KZ MD RU TJ TM AT BE CH CY DE DK ES FI FR GB GR IE IT LU MC NL PT SE TR BF BJ CF CG CI CM GA GN GW ML MR NE SN TD TG |
|
| WWE | Wipo information: entry into national phase |
Ref document number: 2407775 Country of ref document: CA |
|
| WWE | Wipo information: entry into national phase |
Ref document number: PA/A/2002/010862 Country of ref document: MX |
|
| WWE | Wipo information: entry into national phase |
Ref document number: 2001932900 Country of ref document: EP |
|
| WWP | Wipo information: published in national office |
Ref document number: 2001932900 Country of ref document: EP |
|
| NENP | Non-entry into the national phase |
Ref country code: JP |