WO1988006426A1 - Apparatus for measuring cardiac output - Google Patents
Apparatus for measuring cardiac output Download PDFInfo
- Publication number
- WO1988006426A1 WO1988006426A1 PCT/JP1988/000239 JP8800239W WO8806426A1 WO 1988006426 A1 WO1988006426 A1 WO 1988006426A1 JP 8800239 W JP8800239 W JP 8800239W WO 8806426 A1 WO8806426 A1 WO 8806426A1
- Authority
- WO
- WIPO (PCT)
- Prior art keywords
- cardiac output
- data
- blood
- value
- measuring
- Prior art date
- Legal status (The legal status is an assumption and is not a legal conclusion. Google has not performed a legal analysis and makes no representation as to the accuracy of the status listed.)
- Ceased
Links
Classifications
-
- A—HUMAN NECESSITIES
- A61—MEDICAL OR VETERINARY SCIENCE; HYGIENE
- A61B—DIAGNOSIS; SURGERY; IDENTIFICATION
- A61B5/00—Measuring for diagnostic purposes; Identification of persons
- A61B5/02—Detecting, measuring or recording for evaluating the cardiovascular system, e.g. pulse, heart rate, blood pressure or blood flow
- A61B5/026—Measuring blood flow
- A61B5/0275—Measuring blood flow using tracers, e.g. dye dilution
- A61B5/028—Measuring blood flow using tracers, e.g. dye dilution by thermo-dilution
-
- A—HUMAN NECESSITIES
- A61—MEDICAL OR VETERINARY SCIENCE; HYGIENE
- A61B—DIAGNOSIS; SURGERY; IDENTIFICATION
- A61B5/00—Measuring for diagnostic purposes; Identification of persons
- A61B5/02—Detecting, measuring or recording for evaluating the cardiovascular system, e.g. pulse, heart rate, blood pressure or blood flow
- A61B5/026—Measuring blood flow
- A61B5/0275—Measuring blood flow using tracers, e.g. dye dilution
-
- A—HUMAN NECESSITIES
- A61—MEDICAL OR VETERINARY SCIENCE; HYGIENE
- A61B—DIAGNOSIS; SURGERY; IDENTIFICATION
- A61B5/00—Measuring for diagnostic purposes; Identification of persons
- A61B5/74—Details of notification to user or communication with user or patient; User input means
- A61B5/7475—User input or interface means, e.g. keyboard, pointing device, joystick
-
- A—HUMAN NECESSITIES
- A61—MEDICAL OR VETERINARY SCIENCE; HYGIENE
- A61B—DIAGNOSIS; SURGERY; IDENTIFICATION
- A61B2560/00—Constructional details of operational features of apparatus; Accessories for medical measuring apparatus
- A61B2560/04—Constructional details of apparatus
-
- A—HUMAN NECESSITIES
- A61—MEDICAL OR VETERINARY SCIENCE; HYGIENE
- A61B—DIAGNOSIS; SURGERY; IDENTIFICATION
- A61B5/00—Measuring for diagnostic purposes; Identification of persons
- A61B5/02—Detecting, measuring or recording for evaluating the cardiovascular system, e.g. pulse, heart rate, blood pressure or blood flow
- A61B5/026—Measuring blood flow
- A61B5/029—Measuring blood output from the heart, e.g. minute volume
Definitions
- the present invention relates to an apparatus for measuring cardiac output used for performing a cardiac function test or the like.
- BACKGROUND ART Conventionally, an indicator dilution method has been used to measure cardiac output by right heart catheterization for cardiac function tests.
- the indicator dilution method is based on the thermodilution method, which determines the cardiac output from thermal diffusion, the dye dilution method, which determines the cardiac output from the change in illuminance due to the diffusion of the dye, and the resistance dilution caused by the diffusion of the electrolyte.
- electrolyte dilution method for obtaining cardiac output. This thermodilution method will be described.
- a catheter 4 is routed from the jugular vein, femoral vein, or cubital vein, and passed through the superior or inferior vena cava, right atrium, right ventricle, It is placed so that its tip is located in the pulmonary artery.
- the catheter 25 is arranged such that the discharge port 26 is located in the right atrium, and the thermistor 1 is located in the pulmonary artery.
- fluid that is higher or lower than the blood temperature is injected into the right atrium from the outlet 26. Upon entry, fluid is diffused and diluted in the right atrium and right ventricle.
- the temperature of this diluted liquid is detected by a thermistor 27 located in the pulmonary artery, and a dilution curve (a diagram of temperature change with respect to time) of the temperature is obtained (FIG. 17), and the area of the curve is obtained.
- thermodilution method As can be seen from the equation for calculating cardiac output, the amount of indicator liquid injected and its temperature greatly affect the accuracy of the calculated value.
- the liquid temperature T i is accurately measured in a thermistor, etc., and then the catheter 26 is primed to inject the indication liquid into the blood vessel.
- the liquid is cooled or heated at body temperature, causing errors in the measured values. That is, even if the indicator liquid set at the regular temperature is injected, the indicator liquid initially injected into the blood vessel is the indicator liquid cooled or heated at the above body temperature, and then the indicator liquid is set at the regular temperature. The indicated liquid is injected into the blood vessel.
- the cause of the measurement error is that the total heat capacity of the indicator liquid injected into the blood vessel is unknown, but this heat capacity mainly depends on the volume inside the catheter, The amount to be injected is determined by the temperature of the indicator liquid T i.
- the volume in the catheter is a factor that is neglected in the above Stewart No. and Milton formula, and is generally fixed according to the outer diameter (French size) of the catheter.
- a correction constant is obtained by estimating from the above-mentioned amount of liquid to be injected and the size of the catheter, and comparing with an experimentally-obtained cardiac output value to calculate a correction constant. To reduce the effects of the above-mentioned residual fluid to obtain a more accurate cardiac output.
- the correction constant obtained from the amount of liquid remaining in the catheter is merely a list of numerical values, and has no meaning to the measurer. Miscalculations at the time of calculation and errors in inputting the obtained correction constants to the measuring device have occurred.
- the indicator liquid is applied to a icing or warming solution maintained at a predetermined temperature. Therefore, if the experienced operator performs the measurement, or if absolutely accurate measurement of cardiac output is not required, the ice cream with the indicator liquid Alternatively, the temperature of the warming agent solution may be regarded as the indicating liquid temperature T i in some cases. Nevertheless, in the past, the indicator fluid temperature was measured each time, so that the cardiac output measurement was inefficient.
- the cardiac output measurement device using the dilution method although the data is necessary for the calculation, the device itself detects that the operator intends to perform the measurement without taking the trouble, The problem is to detect the designation and, if it is detected, to substitute the data that has been manually preset separately.
- thermodilution method but are also problems of indicator dilution in general.
- the cardiac output measurement method using the above-mentioned thermodilution method or indicator dilution method is continuous since the measurement of the cardiac output is performed intermittently every time the indicator liquid is injected. It cannot be used for measuring cardiac output. If measurement is performed frequently, the total amount of liquid to be injected increases, the burden on the subject increases, and at the same time, the risk of infection associated with the liquid injection operation increases.
- the present invention solves the problem of measuring the cardiac output with an easy-to-use and easy operation, for example, by causing a measurement error to occur, such as a residual indicator liquid amount inside a power meter.
- the present invention proposes a device for measuring cardiac output achieved by allowing correction terms that affect the measurement to be input as realistic numerical values for the measurer.
- a cardiac output measuring device for measuring cardiac output based on a thermodilution method
- an injecting means for injecting an indication liquid into a blood vessel
- Blood data detection means for outputting data related to blood diluted by the indicating liquid
- integration means for calculating a time integral of the blood data, and heat capacity of the indicating liquid injected by the injection means.
- Input means for manually setting and inputting data individually and independently; and, according to the thermodilution method, a cardiac output based on the integrated value and data related to the set and input heat capacity, Calculation of cardiac output Means.
- the set and input physical quantity is It becomes a realistic value for the measurer, and can eliminate input errors as in the past.
- the blood data detecting means includes a temperature sensor, and the blood data is data related to blood temperature.
- the infusion means includes a catheter
- the data relating to the heat capacity is the amount of the indicator liquid injected and / or the outer diameter of the catheter or the indicator liquid temperature.
- the present invention intends that the subject of the present invention, which is easy to use and can perform relatively simple measurement with relatively easy operation, is data required for calculation but does not need to be measured. This is detected by the device itself, and if it is detected, the operator is freed from complicated operations by substituting manually preset data.
- a configuration of the present invention for achieving the above object is to provide a cardiac output measuring device for measuring cardiac output based on a thermodilution method, comprising: Data setting means for manually setting the data related to the indicator liquid before being injected into the blood vessel; measuring means for measuring the data related to the indicator liquid before being injected into the blood vessel; Blood data detecting means for detecting blood data diluted by the injected indicator liquid; integrating means for integrating the blood data at each time; data set by the setting means and the measuring means. Selecting means for selecting one of the data obtained as described above, and cardiac output calculating means for calculating a cardiac output based on the selected one of the data and the integrated value. It is characterized by the following.
- the selecting means detects that the measurer intends to avoid the need to bother to measure, and when the detection is performed, the selecting means detects the intention.
- manually preset data can be used as a substitute, freeing the operator from complicated operations.
- the measuring means includes a measuring probe connected to the cardiac output measuring device, wherein the cardiac output measuring device comprises: Disconnection detecting means for detecting that the device is not connected to the output measuring device, and the selecting means inputs the indicated liquid data value from the input means only when detecting that the device is not connected. The selected data is selected. Therefore, although the data is necessary for the calculation, the apparatus itself can determine that the measurer intends to avoid the need to measure.
- the indicating liquid data includes: It is characterized by the temperature of the indicating liquid.
- the data setting means includes a numerical value input key, so that input of setting data is easy.
- the present invention has the problem that the measurement can be performed with ease and ease of operation, and relatively accurate measurement can be performed. This is achieved by proposing a cardiac output measurement device equipped with an automatic measurement start function that can further reduce the operator's operation burden.
- a configuration of the present invention for achieving the above object relates to a cardiac output measuring device for measuring cardiac output based on a dilution method, which relates to blood diluted with an indicator liquid injected into a blood vessel.
- Blood data detection means for outputting data; change amount calculation means for calculating the change amount of the blood data; comparison means for comparing whether the calculated change amount is equal to or greater than a predetermined value; If it is determined that there is, there are integrating means for starting integration of blood data at each time after that time, and cardiac output calculating means for calculating cardiac output based on the integrated value.
- the blood data detecting means has a temperature sensor, and the blood data is data related to a temperature of blood diluted by an indicating liquid injected into a blood vessel.
- the integration means starts integration of a difference value between the blood data and reference blood data determined before the determination time by the comparison means, And a stopping means for terminating the integration when the blood data substantially matches the reference blood data.
- the integration means starts integration of a difference value between the blood data and reference blood data determined before the determination time by the comparison means, It is characterized in that it includes a calculating means for integrating the difference every time, a means for detecting a peak value of the difference value, and a means for calculating an integration interval for terminating the integration based on the peak value.
- the cardiac output can be measured efficiently and without lowering the accuracy.
- the change calculating means calculates a difference between moving average values of the blood data over time. According to such a configuration, the detection of the integration start point can be accurately performed without being affected by noise, and therefore, the measurement accuracy of the cardiac output is improved.
- the present invention has a problem that it is easy to use and easy to operate, and relatively accurate measurement can be performed. , Its continuation 1 ⁇
- the configuration of the present invention for achieving this object includes a cardiac output measuring means for measuring an cardiac output based on a dilution method at least once to obtain an initial cardiac output value; A blood flow velocity measuring means for measuring a blood flow velocity value in the vicinity of a blood vessel position at which the cardiac output is measured by the cardiac output measuring means; a cardiac output value based on the dilution method; Function value calculating means for calculating a function value representing a relationship with a blood flow value corresponding to the output value measurement; and a blood flow value at each time measured by the blood flow measurement means and the function value. , A cardiac output calculating means for continuously calculating a cardiac output value at each time, and a recording means for recording the cardiac output value at each time in chronological order. This is achieved by proposing a quantity measurement and recording device.
- the dilution method is a thermodilution method, wherein the cardiac output measuring means is an opening for injecting the indicator liquid into a blood vessel, and is diluted with the indicator liquid.
- a force table consisting of a first thermistor for measuring the blood temperature at a downstream position of the blood, and integrating means for integrating the blood temperature data detected by the thermistor; It is characterized in that it includes a second self-heating type thermostat provided near the first thermostat of the force table. Therefore, one catheter can provide information for measuring initial cardiac output (blood temperature) and information for continuously measuring cardiac output (thermal equilibrium temperature). This can contribute to downsizing of the entire device.
- the device for measuring cardiac output comprises a first microprocessor for data collection, a second microprocessor for data processing, and a data processor between the two microprocessors.
- Communication means for exchanging the data wherein the first microprocessor converts the blood temperature data detected by the first thermocouple and the thermal equilibrium temperature data detected by the second thermostat. Collecting the data, passing the collected data to the second microprocessor by the communication means, processing the data collected by the second microprocessor, and obtaining the initial cardiac output value. And calculating the function value.
- the two microprocessors perform parallel processing, which contributes to faster data collection and data processing, and provides accurate cardiac output data to the measurer.
- the cardiac output calculating means includes means for compressing the calculated cardiac output within a predetermined time width, and storing the compressed cardiac output.
- the recording means records the compressed cardiac output. According to this configuration, long-term continuous measurement and long-term data recording are possible.
- Another object of the present invention is to solve the problem that relatively accurate measurement can be performed with easy operation and easy operation, and a function to know a relative change in cardiac output only by obtaining a blood flow velocity value.
- Heart with This is achieved by proposing a device for measuring stroke volume.
- the configuration of the present invention for achieving this object includes a blood flow velocity measuring means for measuring a blood flow velocity value, an input means for inputting an arbitrary numerical value, and each time measured by the blood flow velocity measuring means. And a cardiac output calculating means for continuously calculating a relative change of the cardiac output value with the passage of time based on the blood flow rate value and the arbitrary numerical value.
- the numerical value is a cross-sectional area value of a blood vessel.
- FIG. 1A, FIG. 1B, and FIG. 1C are a plan view, a front view, and a rear view, respectively, of a measuring apparatus according to an embodiment.
- FIGS. 2A, 2B, and 2C are an overall perspective view, a cross-sectional view of a main part, and a cross-sectional view of a catheter used in the measurement apparatus of the embodiment, respectively.
- FIGS. 3A and 3B are flow charts for explaining the operation procedure of the measuring apparatus of the embodiment.
- Figs. 4 and 5 show examples of the results output when the cardiac output was measured based on the thermodilution method using the apparatus of the embodiment.
- Figures 6 to 8 show examples of output when the results of continuous measurement are output.
- 9A and 9B are circuit diagrams of the main part of the measuring device, 1
- Fig. 10A and Fig. 10B are diagrams for explaining how RAM is managed in the measuring device.
- FIG. 11, FIG. 13A, FIG. 13B, FIG. 14A, FIG. 14B, and FIG. 15 are flow charts each showing a control procedure according to the embodiment.
- FIG. 12 is a diagram showing a table for storing the correction constant A
- FIGS. 16 and 17 are diagrams for explaining the principle of cardiac output measurement by the conventional thermodilution method
- Fig. 18 illustrates the operation for automatically starting the cardiac output measurement.
- FIG. 9 is a diagram showing experimental results when an experiment was performed using the apparatus of the embodiment.
- Figures 1 1 to 1C show a plan view, front view, and back view, respectively, of a continuous measurement and recording device for cardiac output to which the present invention is applied.
- Fig. 2A shows the appearance of the catheter connected to this measuring device
- Fig. 2B shows a cross-sectional view of the distal end portion of the catheter along the longitudinal direction
- Fig. 2C shows the catheter.
- FIG. 1A is a plan view of the apparatus 100.
- FIG. Reference numeral 50 denotes a recording device such as a known plotter. The plotter 50 outputs measurement results and the like. 5 2, 5 3
- This switch is used to specify the output mode on the plotter 50 when measuring the output value CO o.
- the switch 52 labeled "Thermodilution value” specifies that the cardiac output CO is to be output as a numerical value (as in Fig. 5).
- the switch 53 labeled "Thermo-dilution curve” specifies that the change in blood temperature T3 ⁇ 4 is output as a curve (Fig. 4).
- switches 52 and 53 are the initial cardiac output values CO.
- the switch described below is mainly used when measuring cardiac output continuously (“continuous measurement”), while it is used only when measuring (“intermittent measurement”). .
- Switches 57 and 58 specify the paper feed speed (2 Omm / hr and 1 OmmZ, respectively) of the printer 50.
- the switch 54 displayed as “Progress chart” is a switch for instructing the progress of 12 hours such as cardiac output CO x on the processor 50 (FIG. 8).
- output Suidzuchi 5 5 displayed data such as cardiac output C 0 X was continuously obtained which is stored in memory on only the plotter 5 0 past 3 0 min minute (the Figure 6, the (Fig. 7) This is the switch that instructs the user to perform the operation.
- the switch 80 marked "Memo" is a memo switch. 'When this switch is pressed, the recording paper is fed about 6 cm.
- Switch 5 6 labeled " ⁇ recording” is C 0 T
- v outputs a change in x or the like on the recording sheet in real time ( Figure 6, Figure 7) switch for instructing to.
- the “memory playback” mode records the stored data for the past 30 minutes.
- the measuring device 100 also measures the cardiac output measured in real time. Etc. are stored. So, in time, the record Past data recorded on paper and real-time data currently stored are close in time and coincide with each other. In such a case, the “playback” mode is not stopped, but automatically switched to the “continuous recording” mode described above.
- the switches 59, 60 (Fig. 1A), 61, 62 (Fig. 1B of the front view), etc. are used to manually input the desired data to the device 100 when it is desired to input it.
- the setting values input by these switches are, in order, the diameter of the force sensor (unit: French), the amount of the indicator liquid injected (unit: ml), and the body surface area of the subject (unit). : M 2 ), the initial CAL value (unit: LZ). The initial CAL value will be described later.
- press ⁇ if the value to be set is greater than the displayed value (displayed in the mouth), and press T if it is smaller.
- the switch 64 displayed as “C0NTINU0US” is a switch for setting the mode of the measuring apparatus to the continuous mode, and at the same time, when the continuous mode is set, the switch Z indicator 64 is turned on.
- "Switch 65 displayed as” SINGLEJ is a switch in single (intermittent) mode Z indica. It is mainly used to return from the continuous mode to the single mode when it is necessary to reset the above parameter S again. .
- This switch 65 lights when it is pressed to enter intermittent mode (SINGLE mode).
- Indicators 68 are 4-digit LEDs that digitally display cardiac output. Switches displaying "BLOOD” or “INJECTATE” 66, 67, the temperature displayed on the 3-digit LED display 69, or the blood temperature T b, is to specify whether the temperature of the instruction liquid.
- Z ENTRY ⁇ is displayed on the switch Z Indica 70.
- the switch / indicator 72 indicating “START” indicates that the preparation for the initial cardiac output CO 0 measurement by thermodilution is completed, and when this switch is pressed at that point, the switch ⁇ Start integration based on Eight Milton's equation.
- Indicator 7 1 is a bar graph, primarily, is intended to display the value of the blood temperature T b in real time.
- 73 and 74 connect the connector 15 of the catheter 4 (Fig. 2A) with a built-in blood temperature sensor and the connector 16 of the temperature probe 12 (Fig. 2A) for measuring the infusion fluid temperature, respectively.
- Connector for 63 is A power switch 78 is a display lamp indicating that the built-in battery is being used.
- Switch 75 in FIG. 1C is a switch for manually setting the infusate temperature.
- 76 is a connector of the RS232C interface for communicating with other external measuring devices
- 78 is a blood temperature Tb , blood flow velocity ⁇ ⁇ , cardiac output to other external measuring devices terminal for outputting an analog signal, such as CO x, 7 7 denotes a connector for the power cable contact ⁇ .
- FIGS. 1A to 1C and FIGS. 2A to 2C are listed as follows.
- the temperature probe 12 is used to measure the temperature of the indicator liquid. If the connector 16 of this probe 12 is not connected to the measuring device 100, this disconnection is detected. Enter the value preset on switch 75 ( Figure 1C) on the back of the instrument as the reading fluid temperature.
- Parameter S can be set manually via switch 62. Therefore, CO x can be continuously obtained from S and the blood flow velocity v x . Useful when you want to know the relative change in CO x .
- This device has a built-in battery (148 in Fig. 9) to protect stored data from failures such as power failures. When the output voltage of the battery 148 drops, the LED 78 flashes to alert the user.
- An external measuring device other than the measuring device 100 is provided with an analog output circuit (142, 151) for outputting the cardiac output CO x and the like as an analog signal from the terminal 78. .
- the external measurement device other than the measuring device 1 00 and outputs the CO x such as a digital signal by the RS 232 I Ntafe Ichisu Circuit (144).
- thermodilution shows blood temperature T b thermistor for measuring and a catheter incorporating a thermistor or the like for measuring the blood flow velocity V to a 2 A view.
- catheter 4 is configured to have 4 lumens.
- the catheter 4 has a pressure detection port 18 provided at the distal end, a balloon 17 made of a flexible elastic body attached at a position several mm behind the distal end so as to cover the entire distal end portion of the catheter tube, and a balloon 1 A balloon side hole 25 provided in the side wall of the balun inner tube for injecting or removing air (preferably carbon dioxide gas) to expand and contract 7, and 10 to 20 O from the tip
- Thermistor 1 is located at a distance of 1 mm
- the Summit 1 is located 10 to 15 mm further from it
- the Summit 2 is located 8.5 to 38 cm from the Thermistors 1 and 2.
- Thermistor 1 has blood flow velocity v. (Or v x ) used to measure the thermal equilibrium temperature.
- the thermistor 2 is used to measure the diluted blood temperature ⁇ ⁇ ⁇ necessary for measuring the initial cardiac output C 0 ⁇ by the thermodilution method.
- the discharge port 3 is for discharging the indicating liquid.
- the catheter 4 in Fig. 2 is connected to the jugular vein, femoral vein, or cubital vein, and is used in the superior or inferior vena cava, the right atrium, the right ventricle, and the pulmonary artery.
- the thermistor 2 is provided at the distal end side (that is, downstream of the blood flow) as viewed from the discharge port 3.
- the thermistor 2 is placed at the proximal end side of the catheter as viewed from the discharge port 3 Will be.
- FIG. 2B shows a cross-sectional view of a main part of the catheter 4.
- a pressure detection port 18, a balloon side hole 25 (FIG. 2A), thermistors 1 and 2, and a discharge port 3 communicate with the four lumens, respectively.
- These four lumens are the pulmonary arterial pressure lumen 19 that transmits the pressure of the pulmonary artery, the balloon lumen 20 that is an air passage for inflating and deflating the balloon 17, thermistors 1, 2, and their lead wires.
- These four lumens are independent of each other, and at the rear end of the catheter, as shown in Fig.
- a pulmonary artery pressure measurement tube 8 a balloon tube 6, a thermistor tube 13, and an indicator.
- a pulmonary artery pressure measurement tube 8 Connected to liquid injection tube 10.
- Each tube 8, 6, 10 has a connector 7, 9, 11 at its rear end.
- the thermistor tube 13 is connected to a connector 15, and lead wires 22 and 24 connected to the thermistors 1 and 2 are passed through the tube.
- Connector 15 is connected to connector 73 of device 100.
- FIG. 2B is an enlarged cross-sectional view of the portion of the thermistor 1, thermistor 2, and the part 17
- FIG. 2C is a cross-sectional view of the catheter tube 4 taken along the line H- ⁇ .
- the four-lumen structure of the main power Teether as shown in Fig. 2C, includes a balloon lumen-20, a pulmonary artery pressure lumen 19, an infusion lumen 23 (Fig. 2C), and a thermistor lumen 21.
- Consists of The balloon lumen 20 has a balloon side hole 25 and communicates with the balloon tube 6.
- the pulmonary artery pressure lumen 19 has a pressure detection port 18 and communicates with the pulmonary artery pressure measurement tube 8.
- the injection lumen 23 has a discharge port 3 at a position of 12 to 40 cm from the distal end of the catheter, and communicates with the indicator liquid injection tube 10 on the base side.
- the thermistor lumen 21 is located at a distance of 1 to 2 cm from the distal end, and at a distance of 1 to 1.5 cm further to the base from the distal end, and has side holes to which the thermistors 1 and 2 are attached, respectively. It has parts 26 and 27.
- the lumen 21 has built-in thermistor lead wires 22 and 24 from the thermistors 1 and 2, and communicates with the thermistor tube 13 on the base side. '
- the thermistor 1 is located on the downstream side in the blood flow direction of the thermistor 2 as a self-heating type of thermistor.
- the thermistor 2 is affected by the self-heating type thermistor 1. This is to make it difficult. Even so, Samista 1
- the diameter of the heat sink 1 may be different from that in Fig. 2A, and it may be located 10 to 15 mm further upstream in the blood flow direction from the heat sink 2. Good.
- the probe 12 shown in FIG. 2A is a probe for measuring the indicator liquid temperature, and a thermistor 12a is provided near the distal end thereof. A connector 16 for connecting to the connector 74 is provided.
- step S1 the injection solution temperature probe 1 and 2 are Connect to body 100.
- step S2 the temperature probe 12 is immersed in the injection instruction liquid in an ice-cooled container (in this embodiment, provided in the measuring device 100). This liquid is a saline solution or the like.
- step S3 the catheter 4 is introduced into the pulmonary artery in step S4.
- the catheter 4 is inserted through a vein or the like of the upper limb or lower limb and is placed in the pulmonary artery.
- step S5 the connectors of the catheter shown in FIG. 2A are connected to the device main body.
- the catheter 4 When these connectors are connected to the device, first, the catheter 4 is sequentially moved in the indwelling position of the blood vessel, so that the central venous pressure, the right atrial pressure, the right Check based on blood pressure values such as room pressure and pulmonary artery pressure and pressure waveform. After placing the catheter, the pulmonary artery pressure is measured, and the balloon 17 is inflated to occlude the pulmonary artery, and the pulmonary artery wedge pressure is determined. Thus, the catheter 4 is left at a predetermined position.
- step S6 a predetermined value is set by switches 59 to 61.
- Switch 62 is set when measuring relative CO x (discussed later), which is the initial cardiac output value C 0 from the thermodilution method described here. There is no need to make settings when measuring.
- step S7 the power of the measuring device is turned on. While confirming that there is no abnormal display (indicating device failure) in step S8, wait for the SINGLE indicator to turn on in step S9.
- the indicator lights up, the BL 0 0 D indicator Motor 66 is turned, the display 69 blood temperature T b in the pulmonary artery is displayed. If you want to know the temperature of the infusate at this point, press the INJE CTATE switch 67 and the display 69 will show the infusate temperature Ti.
- the bar graph indicator 7.1 at this point, the answer displaying the baseline blood temperature T b.
- the display of this ⁇ is after 30 seconds, automatically reverts to BLOOD display, is made a display of T b again on the display 69. In this way also automatically had to return to the display of ⁇ ⁇ , go-between and to the operator, Ru Der because the people of T b is more meaningful as information.
- step S10 it waits until START Indica Night 72 lights up. When this indica night lights, the initial cardiac output value C 0 by the thermodilution method. Means ready to start measurement.
- step S11 if necessary, the mode of the information to be output to the plotter 50 is selected by the switch 52 or 53.
- step S12 a liquid is injected into the blood vessel with the cock 11 opened.
- the measuring device After the liquid injection, the measuring device automatically reads the change of T b, to determine the optimal time of starting the integration. If the operator before the optimum point detection Press S TA RT switches Ma 2, starts integration of the pressed point or et T b. If the switch 72 is pressed, integrating the T b data from when the equipment itself is determined. The measurement and calculation of cardiac output by this thermal dilution method usually completes in about a dozen seconds, but the change during that time is stored in a predetermined memory (RAM 132 in Fig. 9). While being remembered, it is displayed on the display 69 and the bar graph display 71. Further, if the switch 53 has been pressed, a change in the blood temperature ⁇ ⁇ as shown in FIG. 4 is output to the plotter 50.
- the blood temperature T b is that taking a negative upward.
- the date, time, etc. are output together for the convenience of the measurer.
- the output example in FIG. 4 is an output speed of 30 Omm / min.
- the measurer determines that the obtained data such as C0 can provide reliability, he or she presses the ENTRY switch 70 to register the data (step S17). After a while, START INDIQUE ⁇ 2 lights up again. This completes the measurement of the initial cardiac output CO 0 by the thermodilution method. If you want to obtain more accurate CO, repeat the above steps S11 and below to obtain multiple measurement data. Press the ENTRY switch 70 for each measurement to register and register these registered COs. The average value is calculated from the values, and the initial cardiac output value C0. Determine the value.
- the next step is to start measuring CO x continuously. This is done simply by pressing the CONTINT NUOUS switch 64. When this switch 64 is pressed, the CONT I NU OUS indicator 64 lights up, and the entire measuring apparatus is in the continuous measurement mode. When the SI NGL E switch 65 is pressed, the measuring device returns to the intermittent mode.
- the entire circuit connection in the measuring apparatus 100 in a state where the catheter 4 and the infusate temperature probe 12 are connected is as shown in FIG.
- the measuring apparatus 100 comprises two electrically isolated measuring circuits 120 (FIG. 9A) and 130 (FIG. 9B).
- Circuit 120 is mainly for thermistor in catheter 4
- the electric signal (voltage) from the thermistor 12 a in the probe 1, 2 and the probe 12 is converted into temperature data and sent to the measurement recording circuit 130 via the optical communication circuit 108.
- the measurement recording circuit 130 obtains the initial cardiac output CO from the temperature data from the measurement circuit 120.
- the blood flow velocity v. (Or v x ), parameter S, continuous cardiac output CO x, etc. are calculated and displayed on the plotter 50 or displayed on various displays.
- the mouth CPU 105 controls the measurement circuit 120, and the main CP 133 controls the measurement recording circuit 130.
- the catheter-type sensor 150 in FIG. 9 uses the catheter 4 in FIG. 2A as a sensor.
- the sensor 150 includes a self-heating type thermistor 1 for detecting a thermal equilibrium temperature. And a thermistor 2 that detects the blood temperature in the pulmonary artery.
- This catheter type sensor 150 is introduced into the pulmonary artery by right heart catheterization in the same manner as described above.
- Connector 15 of sensor 15 ⁇ is connected to connector 73 of main body 100.
- the thermistor 2 is connected via a lead wire 24 to a constant voltage circuit 11'2 for driving the thermistor 2 and a blood temperature detecting circuit 113 for measuring blood temperature.
- the signal of the pulmonary artery blood temperature detected by the thermistor 2 is detected by the blood temperature detection circuit 113 as a voltage signal Eb .
- the thermistor 1 is connected to a thermistor temperature detecting circuit 115 and a constant current circuit 111 via a lead wire 22. Then, a predetermined current I c is supplied to the thermistor 1 from the constant current circuit 111 to be heated.
- the thermistor 12a in the infusate temperature probe 12 is driven by the constant voltage circuit 101, and its temperature change is detected by the circuit 102 as a voltage value Ei.
- the CPU 105 sets the output voltages E i, E t, and E b from the three thermistors 12 a, 1, and 2 to the infusion temperature T i and the resistance of the thermistor 1.
- R t temperature of thermistor 1 T t , blood Converting the liquid temperature T b.
- Mouth one local C PU 1 05 drives the analog switch 1 03 having a multiplexer function, split type EE t, the Eb 1 4 bit Bok of the A / D converter 1 04 by time, the voltage
- the values are sequentially taken into RAM 107 as digital values. These voltage values are converted to temperature data from the voltage-temperature conversion table stored in R0M106.
- the resistance value R t of thermistor 1 is
- Local CPU 1 05 these TR t, T t, the data such as T b via the optical communication line, and sends the measurement recording circuit 1 30.
- the communication control (for example, performed by a well-known polling selecting method) is performed by the local CPU 105 and the main CPU 133.
- the measurement recording circuit 1 30, by the simple communication control procedure receives the temperature Ti of the injection liquid, the resistance R t mono- thermistor 1, the temperature T t of the thermistor evening 1 ', the blood temperature T b, etc., Store in RAM I 32 in chronological order.
- the CPU 133 sets the initial cardiac output value CO based on the above data. , Blood flow velocity V. (Or v x ), intermittent cardiac output Calculate C 0 x.
- FIG. 10A shows the structure of the data stored in RAM 132.
- Capacity of the R AM is 4 area stores 30 minutes worth of data, such as T obtained by AZD converts every Oms b and (1 32 a), continuous at any time from these data cardiac output C Ox (1 32b) for storing the measured values for 30 minutes, etc., and for 12 hours (1, 32c) for the 1.5-minute average value of the continuously calculated CO x and other data. ) And at least can be stored.
- FIG. 10B shows three address counters 160, 161 and 162 for storing data in RAM 132 and the three areas (132a, 132b, 132). The correspondence with c) is shown.
- the data storage address counter (SC pointer) 160 points to the address used to store data from the measurement circuit 12 ⁇ in the RAM 132.
- Data read address counter (RC pointer) 16 1 is the initial cardiac output value C 0. For example, when calculating the data, read the data stored in RAM 132 and point to the address where the calculated value is stored.
- a data print address counter (PC pointer) 162 points data necessary for outputting data to the plotter 50.
- the use of three pointers in this way also allows data storage, data reading, data output, etc. to be performed independently and in parallel as subroutines. Because it is
- FIG. 11 shows a routine in which the main CPU 133 receives measurement data from the oral CPU 105 and stores it in the RAM 132. As described above, the SC pointer is used as the pointer at this time.
- Figures 13A and B show the initial cardiac output CO. It is a control routine of CPU133 for measuring the value. The control shown in Figs. 13A and 13B also includes an automatic measurement start function.
- step S40 the READY state of the measuring device is checked. This condition assumes that at least the entire device in ⁇ - de failures are not occurred, the state of the blood temperature T 3 ⁇ 4 detects the stable state. Stable state of the T b is executed to compute the variance of T data within a certain time width is determined depending on whether the dispersion is below a predetermined value. When this READY state is detected, as described above, the STAR indicator 72 lights up. In step S 4 ⁇ ⁇ , it is determined whether the START switch 72 has been pressed.
- step S50 the time t is read from the real time clock RTG 147, and in step S51, a pointer value according to the time t is set in the RC pointer 161, in step S52, the infusion liquid temperature T i From RAM I 32 know.
- step S 53 to one reading the T b from RAM 1 32 in accordance with RC pointer 1 6 1.
- step S54 a baseline (baseline) temperature Tb0 is detected from the data before the time. The detection of Tb0 is obtained, for example, from the average temperature of the state with small dispersion used for the determination of the READY state.
- stearyl-up S 5 5 AT b (first Figure 7) is calculated according to the following equation.
- ⁇ 3 ⁇ 4 T b0 -T 3 ⁇ 4
- the sign of blood temperature T b is positive in the temperature decreasing direction.
- step S 5 6 by adding this ⁇ T b, calculates the sigma ⁇ T b (integration).
- This ⁇ ⁇ is the ⁇ ⁇ , Milton equation
- step S57 it is determined whether or not the blood temperature has fallen for a predetermined time. That is, in step S 57, when the temperature descends .DELTA..tau ⁇ is smaller than a predetermined threshold value TH a, the still, and judged the indicated liquid does not arrive to the thermistor evening 2, in step S 58, the counter E Increment RT IM. When the state of ⁇ T b ⁇ TH a was continued until E RT IM to overflow, as more of some kind has been made, in the stearyl-up S 60, to display the error condition occurs. This indication is displayed on the display 68 together with the error code number as "Er".
- step S 5 7 step S of between up to a
- the integral ( ⁇ ⁇ ) is carried out at stearyl-up S 5 6, for blood temperature T b is T b0 and there is no difference, Ru is expected to be almost "0". Also, even if there is a noise-like change, the change is positive and negative, so the integral is "0".
- Step S 6 1 of T bmax is intended to store the maximum amount of temperature drop from T 0 that put in temperature drop initially is initialized to "0". If there is a temperature drop (until the peak is detected), in step S61,
- AT tmax is updated in step S62 .
- the temperature value AT bc (used in step S68), which is a measure for ending the integration operation, is updated.
- ATbc is set as the lower limit temperature that increases the measurement efficiency (shortens the integration interval) to the extent that the accuracy does not decrease too much. Since the peak temperature AT 3 ⁇ 4max is large and small and ⁇ is also affected, every time AT bmax is updated, step S 6 Three
- step S64 the RC pointer is incremented, new temperature data is pointed, the process returns to step S53, and the above-described control is repeated. In this way, integration is performed until a peak is detected.
- step S66 the determination of ⁇ 3 ⁇ 4 > ⁇ Tbmax in step S61 becomes ⁇ 0, so the process proceeds to step S66. In this step S66,
- TH b are predetermined threshold. As shown in FIG. 18, when the above relationship is satisfied, it can be considered that the peak has been exceeded, so the peak flag is set in step S67. This peak flag indicates that a peak has been detected at least once after the start of the measurement. In step S68, it is checked whether the blood temperature has risen (the curve has dropped) and ⁇ has reached the critical temperature AT bc at which integration stops.
- step S64 the process proceeds to step S64 , and returns to step S53 to continue integration.
- step S69 the process proceeds to step S69 to check the peak flag. Since the beak flag is set, the cardiac output C 0 of step S 70 or less. Proceed to the calculation of Here, the significance of the peak flag becomes clear. Ri by the influence of noise or the like, in Step S 6 8 While even once does not detect the peak, .DELTA..tau, may be a ⁇ AT bc. Therefore, AT bmax - ⁇ T b> when detecting the peak such that TH b only, P. Set this flag to prevent accidentally stopping an integration that was started once this flag was not set. If THa and THb are set to the same threshold, the peak flag and the related control (steps S66, S67, S69, S70) become unnecessary.
- ⁇ ⁇ is desirably approximately equal to 0 .
- the case where the START switch 72 is not pressed in step S41 means that the operator intends a manual start and the time until the START switch 72 is pressed, and the case where the operator intends an automatic start.
- Step S 43 This temperature monitoring is performed in step S43 and below, and whether the switch 72 is pressed is detected by an interrupt between step S42 and step S47.
- Step S 42-Steps When the above-mentioned interrupt occurs during the step S47, the control is forcibly moved to the aforementioned step S50.
- step S 42 reads the T b from RAM 1 32 in accordance with RC pointer 1 6 1.
- Step S 42- Step S 43- Step S 44- stearyl Uz loop flop S 42 is the change in T b
- the captured from a change in the moving average value of T b (Equation 1 6 samples)
- the moving amount of the moving average is one sample data. Once the required number of samples is obtained, every time one sampled data is read from the memory 1332, the total samples for averaging will be completed.
- step S45 the moving average value ⁇ , (n) is obtained.
- step S46 a difference from the previous moving average value ⁇ , ( ⁇ -1) is obtained.
- the difference is equal to or greater than the predetermined threshold value TH d, it is determined that the change in blood temperature due indicator liquid infusion, in step S 49, to calculate the time t of the change point. This is because the time at which the actual temperature change occurred is later than the time at which it was determined that the change occurred due to the time delay due to the moving average. Subsequent control is the same as that by the START switch 72 described above.
- step S 47 If moving, in step S 47, if a change is determined to be equal to or less than the threshold value TH d, step S mean value of the current at 48 T b (n) of the previous average value T b (n- 1) in the storage area I do.
- TH d is preferably about 0.1 ° C.
- t in step S49 in Fig. 13 ⁇ means the past data 2 seconds before Will be done.
- Banara becomes not necessary to store all the T b (k). Therefore, instead of the average value T b ( ⁇ ), it may be replaced with a real time value T 3 ⁇ 4 of the previous 2 seconds.
- the correction constant A ' was obtained by indexing, but in this embodiment, in order to improve the reliability of the operation by the operator, the correction constant A * is tabulated (FIG. 12) and the ROM 1 3 Stored in 1.
- the outer diameter Fr of the catheter 4 input from the switches 59, 60 and the nominal liquid injection amount Let m 1 be the address data. That is, the CPU 1333 reads the set values of the switches 59 and 60 through the IZO port 134, and reads these and the indicated liquid temperature into the above-mentioned address data for addressing the ROM 1331.
- the correction constant data to be stored in the above table is obtained in advance for the catheters of various sizes from the actual measurement results when the amount of the infusate is changed in various ways. If the catheter size and infusion volume used in the actual measurement by the thermodilution method include those that do not correspond to the above table, the corresponding correction constant A by linear interpolation from the closest one in the table 'Ask.
- step S68 ⁇ ⁇
- the calculation of the integral of T b is completed, based urchin I described above in Step S 7 1, an outer diameter F r of the catheter set and inputted from the switch 59.60, the instruction liquid amount m 1 and the like, R OM 1 3 Read the correction constant A 'from the table stored in 1 (Fig. 12).
- step S71 the above-mentioned steps ⁇ Initial cardiac output value CO based on Hamilton's equation. Is calculated.
- step S 72 to calculate the parameter S necessary to calculate the continuous cardiac output CO x.
- step S73 these values are output on the plotter 50, for example, as shown in FIGS.
- the heated thermistor 1 is placed in the blood having the blood flow velocity V, the heated thermistor 1 is cooled depending on the blood flow velocity V.
- the amount of heat cooled by the blood flow is as follows: blood temperature is T b , the heated thermistor temperature is T t , and the proportionality constant is K.
- the temperature of the thermistor 1 is maintained at a temperature such that the amount of heat generated by heating and the amount of heat to be cooled are equal.
- This temperature is the thermal equilibrium temperature. The above can be expressed by the following equation (2).
- equation (3) for obtaining the blood flow velocity v is derived.
- the blood flow velocity V is obtained from the data R t , T t obtained from the thermistor 1 and the blood temperature T b obtained from the thermistor 2. Since the heating thermistor 1 is driven by the constant current circuit 111, instead of detecting the resistance value, the potential difference E between both ends of the heating thermistor 1 lead wire. May be detected. The details of this case are described in the aforementioned Japanese Patent Application Laid-Open No. 61-125329. In addition, the constant current value I c can be handled by detecting the current of the constant current circuit 11 1, but it should be given to R 0 M 13 1 ⁇ as a constant term like the proportional constant K. Is also possible.
- the blood vessel cross-sectional area S is calculated from Equation (4) and the initial blood flow velocity value V, and this value S is held in the measurement recording circuit 130 as a calibration value (parameter). In this way, once the parameter S is required, the CPU 133 By multiplying the continuously measured blood flow velocity v x by the parameter S, a continuous cardiac output value CO x can be obtained. That is,
- Fig. 14 ⁇ shows the details of step S72 in Fig. 13 for calculating the parameter S.
- step S110 of FIG. 14A the local CPU 105 is instructed to heat the thermistor 1 via the optical communication path.
- step S112 the process waits for the thermostat 1 to reach a thermal equilibrium between heating and cooling.
- the mouth Ichiriki Le CPU, T t, R t, becoming Tb or the like is sent and stored by Furochiya one Bok first 1 diagram RAM 1 32 for two hours order. Therefore, the data in the RAM 132 is accessed by the RC pointer 161, according to the time t when a certain time has elapsed in step S113.
- step S114 the initial blood flow velocity v is calculated based on equation (3).
- step S115 the initial cardiac output value CO is calculated according to equation (4). And blood flow velocity v.
- the parameter S is obtained from the relationship with Thus, the continuous CO x measurement is ready.
- step S80 check whether the measuring device 100 is in the continuous mode. You. Enter this mode by pressing the CONTINUOUS switch 64.
- step S81 the local CPU 105 is instructed to heat the thermistor 1 via the optical communication path.
- step S82 it waits for the thermistor 1 to reach the thermal equilibrium between heating and cooling.
- T t , R t , Tb, etc. are sent from the local CPU, and are stored in the RAM 132 in chronological order according to the flowchart of FIG. Therefore, the data in the RAM 132 is accessed by the RC pointer 161, according to the time t when a certain time has elapsed. It calculates the blood flow velocity v x based on Sutedzupu in S 84 (3) expression.
- step S86 it is checked whether the discontinuous mode has been released. This is because the parameter S representing the blood vessel cross-sectional area usually changes with time. Therefore, even if the blood vessel cross-sectional area S is once held as a parameter, an accurate cardiac output may not be obtained due to a change in the blood vessel cross-sectional area S. Therefore, the initial cardiac output CO is measured by the thermodilution method as appropriate to prepare for the next continuous measurement of CO x .
- step S 88 1 for when you play the course of 2 hours ( Figure 8), calculates the average value of v x and C 0 X 1. 5 minutes. These values are stored in area 1 32 c in RAM I 32.
- step S 90 in order to calculate the next C_ ⁇ x, increments the RC pointer. 7 In this way, every time T t , R t , T b, etc. are sent, CO x, etc. can be calculated continuously. Thus, the cardiac output CO x was measured only by measuring the blood flow velocity v x .
- this measuring device In addition to recording the thermodilution curves and thermodilution values shown in Figs. 4 and 5, this measuring device also has a continuous record that outputs the measured values to the plotter 50 in parallel with the continuous measurement of COx.
- Function by switch 56
- Memory playback function by switch 55
- output function such as a progress chart output function that outputs to 50 (by switch 54).
- the output format for continuous recording and recording / reproducing is as shown in Fig. 6 (for paper feed speed of 10 ms) and Fig. 7 (for 20 ms sZ).
- Fig. 8 shows the output format of the progress chart.
- the indicator liquid injected into the blood vessel from the catheter 4 is contained in an ice-cooled container, it can be said that the temperature is almost determined by the ice-cooling temperature. Therefore, if the ice-cooling temperature is known (for example, zero degrees), that temperature may be considered as the indicated liquid temperature.
- the injection liquid temperature detection circuit 102 detects the current flowing through the thermistor 12a as zero.
- the local CPU 105 receives Ei corresponding to the zero current, the local CPU 105 sends a signal to that effect to the main CPU 133.
- CPU 105 converts the Ei corresponding to the zero current into an impossible value when converting it to the temperature Ti, and sends it to the main CPU133.
- CPU 133 can detect disconnection of temperature probe 12.
- Fig. 15 shows the control procedure.
- the local CPU 10 5 in the step S100 in FIG. It is determined whether or not T i sent from is data indicating that probe 12 is not connected. In a night showing the connection status If there is, in step S101, Ti in the RAM 132 is used for measurement. If not, in step S102, the data set in the switch 75 is taken in as Ti.
- the initial cardiac output value CO is actually measured by the thermodilution method. Obtain this C Oa and the initial blood flow velocity v.
- the characteristic is that the parameter S is obtained from the relationship between and, and thereafter, the cardiac output C 0 X is continuously obtained only by measuring the blood flow velocity VX at an arbitrary time. That is,
- the change in v x reflects the relative change in C 0 X. So, if we record the change in v x , it is the same as recording the relative change in C 0 X.
- the above-mentioned cardiac output CO is the same for the subjects, and if the measurer is familiar with the measurement, the approximate value is known. Therefore, in the measuring apparatus of the present embodiment, the approximate cardiac output CO is obtained from the switch 62 as the “initial CAL value”.
- the force meter 4 shown in Fig. 2A was connected to the measurement device shown in Figs. 9A and 9B, and this measurement system was applied to a circulation model circuit.
- the former model circuit is constant temperature It consists of a tank, a pump, etc.
- a catheter 4 was inserted through the right internal jugular vein of the dog and advanced to the pulmonary artery.
- An electromagnetic blood flow meter was used to compare the results of this measurement system.
- Fig. 19 shows the measurement results obtained by the circulation model circuit.
- the horizontal axis (X-axis) is the cardiac output (unit: LZmin) obtained by using an electromagnetic blood flow meter, and the vertical axis (Y-axis) is obtained by using this measurement system. If you have a high cardiac output,
- the continuous cardiac output measurement of the above-described embodiment is, as is clear from the above description, once the initial cardiac output CO is measured by any method, and then the parameter s is set. Measurement is maintained. After that, only the blood flow velocity v x is measured, and the characteristic is that the cardiac output CO is continuously obtained. Therefore, in the present invention, The initial cardiac output C 0 is not limited to the one that obtains the initial cardiac output C 0 by the measurement using the thermodilution method as in the above-described embodiment. Can be obtained. In this case, in the dye dilution method, the amount of the dye in the blood is measured by measuring the change in illuminance with, for example, an earlobe. By measuring the change, the cardiac output CO is obtained.
- the function of inputting the amount of data (eg, Fr, ml) based on the correction constant A 'in (1) can be applied to the indicator dilution method using a catheter in general.
- the automatic measurement start function in (2) is applied as it is to capture the change points of the illuminance change and the resistance value change.
- the continuous measurement function of the cardiac output in 4 is the initial cardiac output CO obtained by the general indicator dilution method. It is also applicable to calculate the parameter S based on the equation and then calculate CO x from the blood flow velocity v x at an arbitrary time.
- the following mechanism is proposed for detecting whether or not the temperature probe 12 is connected. That is, a biased projection is provided at a portion of the measuring device body where the connector 16 of the probe is connected. When connector 16 is connected, this protrusion is pushed and retracted. When the projection is pressed, the end of the projection is to be supplied to the measuring circuit 120, for example, a ground signal.
- the measuring circuit 120 can determine the connection / non-connection of the probe 12 based on the presence or absence of the ground signal.
- the protrusions are electrically insulated from the circuit 12 except for the ends. This makes the entire circuit 120 electrically This is to keep it floating.
- measurement of blood flow velocity by thermistor 1 not only detects thermal equilibrium under a constant current, that is, detects a change in resistance of the thermistor by voltage or the like, but also makes the temperature difference with blood temperature constant.
- the necessary current may be applied to the device and the current may be measured.
- the blood flow rate sensor is not limited to the short-time sensor, but may be other means.
Landscapes
- Health & Medical Sciences (AREA)
- Life Sciences & Earth Sciences (AREA)
- Engineering & Computer Science (AREA)
- Medical Informatics (AREA)
- Physics & Mathematics (AREA)
- Veterinary Medicine (AREA)
- Biophysics (AREA)
- Pathology (AREA)
- Public Health (AREA)
- Biomedical Technology (AREA)
- Heart & Thoracic Surgery (AREA)
- General Health & Medical Sciences (AREA)
- Molecular Biology (AREA)
- Surgery (AREA)
- Animal Behavior & Ethology (AREA)
- Physiology (AREA)
- Hematology (AREA)
- Cardiology (AREA)
- Measuring Pulse, Heart Rate, Blood Pressure Or Blood Flow (AREA)
Abstract
Description
明 系田 β 心 拍 出 量 の 測 定 装 置 技 術 分 野 ' 本発明は、 心機能検査等を行う場合に用いられる心拍出量の 測定装置に関するものである。 背 景 技 術 従来、 心機能検査のために右心カテーテル法によって心拍出 量を測定するには指示薬希釈法が用いられている。 この指示薬 希釈法には、 熱拡散から心拍出量を求める熱希釈法、 色素の拡 散による照度変化から心拍出量を求める色素希釈法、 更には電 解質の拡散による抵抗値変化から心拍出量を求める電解質希釈 法等がある。 この熱希釈法について説明する。 Technical Field of the Invention The present invention relates to an apparatus for measuring cardiac output used for performing a cardiac function test or the like. BACKGROUND ART Conventionally, an indicator dilution method has been used to measure cardiac output by right heart catheterization for cardiac function tests. The indicator dilution method is based on the thermodilution method, which determines the cardiac output from thermal diffusion, the dye dilution method, which determines the cardiac output from the change in illuminance due to the diffusion of the dye, and the resistance dilution caused by the diffusion of the electrolyte. There is an electrolyte dilution method for obtaining cardiac output. This thermodilution method will be described.
右心カテーテル法では、 第 1 6図に示すように、 頸静脈、 大 腿静脈、 若しくは肘帯静脈等よりカテーテル 4が導管され、 上 大静脈あるいは下大静脈、 右心房、 右心室を経て、 その先端が 肺動脈中に位置するように留置される。 カテーテル 2 5には、 吐出口 2 6が右心房に位置するように、 そして、 サーミス夕 1 が肺動脈に位置するように、 夫々配置されている。 いま、 吐出 口 2 6より血液温度より高温もしくは低温の液体が右心房に注
入されると、 液体は右心房, 右心室において拡散され、 希釈さ れる。 この希釈された液体の温度を肺動脈中に位置したサ一ミ スタ 2 7によって検知し、 その温度の希釈曲線 (時間に対する 温度変化の図) (第 1 7図) を得て、 その曲線の面積等からス チュワート ·八ミルトン法による下記の ( 1 ) 式によって心拍 出量を算出する。

こで、 Where
C O :心拍出量、 S i :注入液体の比重 C O: cardiac output, S i: specific gravity of infused liquid
C , :注入液体の比熱、 :注入液体量 C,: Specific heat of injected liquid,: Injected liquid amount
Τ ι :注入液体の温度、 Τ ¾ 血液の温度 Τ ι: Injected liquid temperature, Τ ¾ Blood temperature
S b :血液の比重、 c ¾ 血液の比熱 S b: Specific gravity of blood, c 比 Specific heat of blood
f CO f CO
厶 T b d t :熱希釈曲線の面積 厶T b dt: area thermodilution curve
である。 このスチュワート ·ノ、ミルトン法による心拍出量の計 算は比較的正確な結果を得るものとして周知なものであり、 こ の方法に基づいた心拍出量測定装置も市場に出ている。 It is. This calculation of the cardiac output by the Stewart-Noil and Milton method is well known to obtain relatively accurate results, and cardiac output measuring devices based on this method are also on the market.
しかし、 そのような従来の心拍出量測定装置は比較的高度な 熟練と煩雑な操作を必要とするものであり、 そのために、 今 や、 いかに使い易く、 容易な操作でもって、 且つ正確な測定が できるかが重要になってきている。 本出願の発明者達は、 この ようなニーズに応えるために希釈法、 特に熱希釈法により心拍 出量を求める場合に、 下記の①〜⑤に問題点を見出した。 ①:上記の熱希釈法では、 心拍出量を計算する式からも分る ように、 指示液体の注入量及びその温度が計算値の精度に大き く影響する。 ところで、 通常、 液体温度 T i はサーミス夕等で 正確に測定した上で、 カテーテル 2 6をプライミングして、 指 示液体を血管内に注入しているが、 注入するまでの間にこの指 示液体が体温で冷却若しくは加熱されてしまい、 測定値に誤差 を生ずる原因となる。 即ち、 正規の温度に設定された指示液体 を注入しても、 最初に血管中に注入される液体は、 上記の体温 で冷却若しくは加熱された指示液体であり、 その後に正規に温 度設定された指示液体が血管中に注入される。 測定誤差の原因 となるのは、 血管中に注入された指示液体のトータルの熱容量 が未知となってしまうことに起因するわけであるが、 この熱容 量は、 主に、 カテーテル内の容量, 注入しょうとする量 , 指示液体 T i の温度によって決定される。 カテーテル内の容量 は上記スチュワート · ノ、ミルトンの式では捨象されているファ クタであり、 一般的には、 カテーテルの外径 (フレンチサイ ズ) に応じて固定的である。 従来では、 上記の注入液体量, 力 テーテルサイズ等から見積りを行なって、 実験的に得られた心 拍出量値と比較することにより補正定数を求め、 この補正定数 を心拍出量の演算に効かして、 上記の残留液体の影響を減殺し て、 より正確な心拍出量を求めるようにしていた。 However, such a conventional cardiac output measuring device requires relatively high skill and complicated operation, so that it is now easy to use, easy to operate, and accurate. It is becoming important to be able to measure. The inventors of the present application have found the following problems (1) to (4) when obtaining cardiac output by a dilution method, particularly a thermodilution method, in order to meet such needs. ①: In the above thermodilution method, as can be seen from the equation for calculating cardiac output, the amount of indicator liquid injected and its temperature greatly affect the accuracy of the calculated value. By the way, usually, the liquid temperature T i is accurately measured in a thermistor, etc., and then the catheter 26 is primed to inject the indication liquid into the blood vessel. The liquid is cooled or heated at body temperature, causing errors in the measured values. That is, even if the indicator liquid set at the regular temperature is injected, the indicator liquid initially injected into the blood vessel is the indicator liquid cooled or heated at the above body temperature, and then the indicator liquid is set at the regular temperature. The indicated liquid is injected into the blood vessel. The cause of the measurement error is that the total heat capacity of the indicator liquid injected into the blood vessel is unknown, but this heat capacity mainly depends on the volume inside the catheter, The amount to be injected is determined by the temperature of the indicator liquid T i. The volume in the catheter is a factor that is neglected in the above Stewart No. and Milton formula, and is generally fixed according to the outer diameter (French size) of the catheter. Conventionally, a correction constant is obtained by estimating from the above-mentioned amount of liquid to be injected and the size of the catheter, and comparing with an experimentally-obtained cardiac output value to calculate a correction constant. To reduce the effects of the above-mentioned residual fluid to obtain a more accurate cardiac output.
ところが、 従来例におけるカテーテル内に残留している液体 の量から得られる上記補正定数は数値の羅列に過ぎず、 測定者 には何等の意味を有さない数値であるために、 上記補正定数を 求めるときの計算ミス、 更に、 この求めた補正定数を測定装置 に入力するときの入力ミス等が発生していた。 However, in the conventional example, the correction constant obtained from the amount of liquid remaining in the catheter is merely a list of numerical values, and has no meaning to the measurer. Miscalculations at the time of calculation and errors in inputting the obtained correction constants to the measuring device have occurred.
②:前述の ( 1 ) 式に示した熱希釈法に基づいた心拍出量の 測定では、 注入される指示液体の温度 T t を正確に測定するこ とが不可欠である。 何故なら、 上記式での (T b - T i )の項の みならず、 ①で説明した誤差要因となる残留液体の熱容量にも ②: In the measurement of cardiac output based on the thermodilution method shown in the above formula (1), it is essential to accurately measure the temperature T t of the indicator liquid to be injected. This is because not only the term (T b-T i) in the above equation, but also the heat capacity of the residual liquid, which is the error factor described in ①,
T i が関係するからである。 This is because T i is involved.
通常、 この指示液体は所定の温度に保たれている氷剤若しく は温剤溶液につけられる。 従って、 手慣れた測定者が測定を行 なう場合であれば 又は、 絶対的に正確な心拍出量の測定が必 要でない場合であれば、 上記の指示液体がつけられる氷剤若し くは温剤溶液の温度を指示液体温度 T i とみなしても構わない 場合がある。 それにもかかわらず、 従来ではその都度、 指示液 体温度を測定するようにしていたために、 心拍出量測定が非能 率なものとなっていた。 Typically, the indicator liquid is applied to a icing or warming solution maintained at a predetermined temperature. Therefore, if the experienced operator performs the measurement, or if absolutely accurate measurement of cardiac output is not required, the ice cream with the indicator liquid Alternatively, the temperature of the warming agent solution may be regarded as the indicating liquid temperature T i in some cases. Nevertheless, in the past, the indicator fluid temperature was measured each time, so that the cardiac output measurement was inefficient.
即ち、 希釈法による心拍出量測定装置おいて、 計算に必要な データであるけれども、 わざわざ測定しないでも済むと測定者 が意図していることを装置自身が検知し、 または操作者からの かかる指定を検知し、 その検知があった場合は、 別にマ二ユア ルでプリセヅ卜されたデータを代用して使うこととが課題とし て登場する。 That is, in the cardiac output measurement device using the dilution method, although the data is necessary for the calculation, the device itself detects that the operator intends to perform the measurement without taking the trouble, The problem is to detect the designation and, if it is detected, to substitute the data that has been manually preset separately.
③: また、 第 1 7図をみても分るように、 指示液体を注入す る動作と希釈曲線の面積 (積分) 計算に必要な血液データのサ ンプリング開始とは所定のタイミングで行なわないと、 例えば 血液温度が下降した後の大分時間が経過してから積分の計算を 開始してしまう等、 計算の誤差原因となる。 しかしながら従来 では、 指示液体注入場所と測定装置設置場所とが離さざるを得 ない場合が多く、 この場合に、 測定者を二人必要とし、 一方の 測定者が液体の注入後に、 測定装置に測定.開始、 即ち積分開始 を指示していたので、 常に測定誤差の発生の可能性がつきまと つていた。 また、 一人で行なう場合には短時間の内に 2つの操 作を手早く行なわなければならないという煩雑さがあった。 ③: As can be seen from Fig. 17, the operation of injecting the indicator liquid and the start of sampling of blood data necessary for calculating the area (integral) of the dilution curve must be performed at a predetermined timing. , For example This may cause calculation errors, such as starting the calculation of the integral a long time after the blood temperature has dropped. However, in the past, in many cases, the indicator liquid injection location and the measurement device installation location had to be separated from each other.In this case, two operators were required, and one operator measured the measurement device after injecting the liquid. Since the start, that is, the start of the integration, was instructed, there was always a possibility that a measurement error would occur. In addition, when performing alone, there was the complexity that two operations had to be performed quickly within a short time.
これらの誤差要因並びに煩雑さは、 熱希釈法に限られず、 指 示薬希釈全般の問題でもある。 These error factors and complications are not limited to the thermodilution method, but are also problems of indicator dilution in general.
④:一方、 上記した熱希釈法もしくは指示薬希釈法を用いた 心拍出量測定方法は、 心拍出量の測定が指示液体の注入毎に間 欠的に行なわれるものであるから、 連続的な心拍出量の計測に は使用できない。 また頻回にわたって測定しょうとすると、 注 入する液体の総量が増え、 被験者の負担が増大し、 それととも に、 液体注入操作に伴った感染の危険性も増大し、 好ましくな レ、。 ④: On the other hand, the cardiac output measurement method using the above-mentioned thermodilution method or indicator dilution method is continuous since the measurement of the cardiac output is performed intermittently every time the indicator liquid is injected. It cannot be used for measuring cardiac output. If measurement is performed frequently, the total amount of liquid to be injected increases, the burden on the subject increases, and at the same time, the risk of infection associated with the liquid injection operation increases.
かかる従来の単尧的な測定しか可能でない指示薬希釈法、 特 に熱希釈法に従った心拍出量測定に伴なう不利益を解消するた めに、 本発明の出願人は、 特願昭 5 9— 2 4 4 5 8 6号 (特閧 昭 6 1 — 1 2 5 3 2 9号) に、 連続的な心拍出量測定を可能に した全く新規な心拍出量の測定装置を提案した。 この連続測定 可能な心拍出量の測定装置により、 長時間の心拍出量の測定 と、 その連続的な記録が課題として登場した。 ⑤:更に、 上記の特願昭 5 9 - 2 4 4 5 8 6号は、 一度の熱 希釈法による心拍出量測定及び血流速の測定から、 心拍出量と 血流速との関係を求め、 以後この関係と血流速とから心拍出量 を演算することを要旨とする。 即ち、 心拍出量と血流速とは一 定の関係にあるから、 絶対的な心拍出量値を求めるのでなけれ ば、 血流速値を求めるのみで、 心拍出量の相対的な変化を知る ことが可能になるのである。 発 明 の 開 示 そこで、 本発明は、 使い易く、 容易な操作でもって、 心拍出 量測定を行なうという課題を、 測定誤差の原因となる例えば力 テ一テルの内部の残留指示液体量等に影響する補正項を、 測定 者にとって現実的な数値として入力できるようにすることによ り達成した心拍出量の測定装置を提案するところにある。 To eliminate the disadvantages associated with the conventional indicator dilution method which can only perform simple measurement, particularly the cardiac output measurement according to the thermodilution method, the applicant of the present invention filed a patent application A new type of cardiac output measurement device that enabled continuous cardiac output measurement in No. 5-19-24 (4) Suggested. With this continuous measurement of cardiac output measurement equipment, long-term cardiac output measurement and continuous recording have emerged as issues. ⑤: Furthermore, the above-mentioned Japanese Patent Application No. Sho 59-2444 586 describes that the cardiac output and the blood flow velocity can be determined by measuring the cardiac output and blood flow velocity by a single thermodilution method. The point is that the relationship is determined, and thereafter, the cardiac output is calculated from the relationship and the blood flow velocity. That is, since the cardiac output and the blood flow velocity are in a fixed relationship, if the absolute cardiac output value is not calculated, only the blood flow value is calculated, and the relative cardiac output is calculated. It will be possible to know the important changes. DISCLOSURE OF THE INVENTION Accordingly, the present invention solves the problem of measuring the cardiac output with an easy-to-use and easy operation, for example, by causing a measurement error to occur, such as a residual indicator liquid amount inside a power meter. The present invention proposes a device for measuring cardiac output achieved by allowing correction terms that affect the measurement to be input as realistic numerical values for the measurer.
即ち、 本発明に係る測定装置によれば、 熱希釈法に基づいて 心拍出量を測定する心拍出量の測定装置において、 血管中に指 示液体を注入する注入手段と、 この注入された指示液体により 希釈された血液に関連したデータを出力する血液データ検知手 段と、 上記血液データの時間積分を計算する積分手段と、 前記 注入手段により注入された指示液体の熱容量に関違したデ一タ をマニュアルで個々に独立して設定入力しうる入力手段と、 前 記熱希釈法に従い、 前記積分値と前記設定入力された熱容量に 関違したデーダとに基づいて心拍出量を演算する心拍出量演算 手段とからなる。 That is, according to the measuring device of the present invention, in a cardiac output measuring device for measuring cardiac output based on a thermodilution method, an injecting means for injecting an indication liquid into a blood vessel; Blood data detection means for outputting data related to blood diluted by the indicating liquid, integration means for calculating a time integral of the blood data, and heat capacity of the indicating liquid injected by the injection means. Input means for manually setting and inputting data individually and independently; and, according to the thermodilution method, a cardiac output based on the integrated value and data related to the set and input heat capacity, Calculation of cardiac output Means.
かかる構成によれば、 熱容量に関連した物理量、 例えばカテ 一テル内の残留指示液体量に影響するカテーテル外形、 指示液 体温度等を独立して設定入力できるために、 この設定入力され る物理量は測定者にとって現実的な数値となり、 従来あつたよ うな入力ミスをなくすことができる。 According to this configuration, since the physical quantity related to the heat capacity, for example, the outer shape of the catheter, the indicator liquid temperature, etc. which affects the amount of the remaining indicator liquid in the catheter can be set and input independently, the set and input physical quantity is It becomes a realistic value for the measurer, and can eliminate input errors as in the past.
本発明の 1つの態様によると、 前記血液データ検知手段は温 度センサを含み、 該血液デー夕は血液温度に関連したデータで ある。 According to one embodiment of the present invention, the blood data detecting means includes a temperature sensor, and the blood data is data related to blood temperature.
本発明の 1つの態様によると、 前記注入手段はカテーテルを 含み、 前記熱容量に関連したデータは、 前記指示液体の注入量 及び、 又は前記カテーテルの外径、 又は指示液体温度である。 これらのデータは希釈法においては測定精度に影響を与える重 要のファクタであり、 その入力ミスを簡単な操作でなくすこと ができることにより、 心拍出量測定操作が簡単になり、 且つ測 定精度が向上する。 According to one aspect of the invention, the infusion means includes a catheter, and the data relating to the heat capacity is the amount of the indicator liquid injected and / or the outer diameter of the catheter or the indicator liquid temperature. These data are important factors influencing the measurement accuracy in the dilution method, and the elimination of input errors can be eliminated by a simple operation, so that the cardiac output measurement operation can be simplified and the measurement accuracy can be improved. Is improved.
また、 本発明は、 使い易く、 容易な操作でもって、 且つ比較 的正確な測定ができるという課題を、 計算に必要なデータであ るけれども、 わざわざ測定しないでも済むと測定者が意図して いることを、 装置自身が検知し、 その検知があった場合は、 別 にマニュアルでプリセッ卜されたデータを代用して使うことに より、 操作者を煩雑な操作から開放する。 In addition, the present invention intends that the subject of the present invention, which is easy to use and can perform relatively simple measurement with relatively easy operation, is data required for calculation but does not need to be measured. This is detected by the device itself, and if it is detected, the operator is freed from complicated operations by substituting manually preset data.
かかる課題を達成するための本発明の構成は、 熱希釈法に基 づいて心拍出量を測定する心拍出量の測定装置において、 血管 中に注入する前の指示液体に閧違したデータをマニュアルで設 定するデータ設定手段と、 血管中に注入する前の指示液体に関 違したデータを測定して得る測定手段と、 血管中に注入された 指示液体により希釈された血液データを検知する血液デー夕検 知手段と、 各時刻における上記血液デ一タを積分する積分手段 と、 上記設定手段により設定されたデータと上記測定手段によ つて得られたデータとのいずれか一方を選択する選択手段と、 上記選択された一方のデータと前記積分値とに基づいて心拍出 量を演算する心拍出量演算手段とを備えたことを特徴とする。 かかる構成によれば、 計算に必要なデータであるけれども、 わ ざわざ測定しないでも済むと測定者が意図していることを選択 手段が検知し、 その検知があった場合は、 データ設定手段によ り別にマニュアルでプリセヅトされたデータを代用して使うこ とができ、 操作者を煩雑な操作から開放する。 A configuration of the present invention for achieving the above object is to provide a cardiac output measuring device for measuring cardiac output based on a thermodilution method, comprising: Data setting means for manually setting the data related to the indicator liquid before being injected into the blood vessel; measuring means for measuring the data related to the indicator liquid before being injected into the blood vessel; Blood data detecting means for detecting blood data diluted by the injected indicator liquid; integrating means for integrating the blood data at each time; data set by the setting means and the measuring means. Selecting means for selecting one of the data obtained as described above, and cardiac output calculating means for calculating a cardiac output based on the selected one of the data and the integrated value. It is characterized by the following. According to such a configuration, although the data is necessary for the calculation, the selecting means detects that the measurer intends to avoid the need to bother to measure, and when the detection is performed, the selecting means detects the intention. Separately, manually preset data can be used as a substitute, freeing the operator from complicated operations.
本発明の 1つの態様によると、 前記測定手段はこの心拍出量 の測定装置に接続される測定プローブを含み、 この心拍出量の 測定装置は、 前記指示液体データ検知手段が当該心拍出量の測 定装置に接続されていないことを検知する未接続検知手段とを 更に備え、 接続されていないことを検知したときのみ、 前記選 択手段は前記入力手段から指示液体データ値として入力された データを選択する事を特徴とする。 従って、 計算に必要なデー タであるけれども、 わざわざ測定しないでも済むと測定者が意 図していることを装置自身が判断できる。 According to one embodiment of the present invention, the measuring means includes a measuring probe connected to the cardiac output measuring device, wherein the cardiac output measuring device comprises: Disconnection detecting means for detecting that the device is not connected to the output measuring device, and the selecting means inputs the indicated liquid data value from the input means only when detecting that the device is not connected. The selected data is selected. Therefore, although the data is necessary for the calculation, the apparatus itself can determine that the measurer intends to avoid the need to measure.
本発明の 1つの態様によると、 前記指示液体データは、 前記 指示液体の温度である事を特徵とする。 According to one embodiment of the present invention, the indicating liquid data includes: It is characterized by the temperature of the indicating liquid.
本発明の 1つの態様によると、 前記データ設定手段は数値入 力キーを含む事を特徴とするので、 設定データの入力が容易で ある。 According to one aspect of the present invention, the data setting means includes a numerical value input key, so that input of setting data is easy.
また、 本発明は、 使い易く、 容易な操作でもって、 且つ比較 的正確な測定ができるという課題を、 積分開始の時刻を装置自 身が認識して自動的に開始し、 測定誤差を生じさせず、 更に測 定者の操作負担を軽減することのできる自動測定開始機能を備 えた心拍出量の測定装置を提案することにより実現する。 In addition, the present invention has the problem that the measurement can be performed with ease and ease of operation, and relatively accurate measurement can be performed. This is achieved by proposing a cardiac output measurement device equipped with an automatic measurement start function that can further reduce the operator's operation burden.
上記課題を達成するための本発明の構成は、 希釈法に基づい て心拍出量を測定する心拍出量の測定装置において、 血管中に 注入された指示液体により希釈された血液に関連したデータを 出力する血液データ検知手段と、 上記血液データの変化量を演 算する変化量演算手段と、 上記演算された変化量が所定値以上 か否かを比較する比較手段と、 所定値以上であると判定される と、 その時刻以降の各時刻における血液データの積分を開始す る積分手段と、 該積分値に基づいて心拍出量を演算する心拍出 量演算手段とからなる。 希釈法においては、 血液データの値の 変化があった時点からの血液データ値の積分が重要であり、 上 記の本発明の構成によれば、 血液データの変化を比較手段によ り監視して、 この変化が所定の条件を満足すれば積分を開始す るので、 操作者の手を煩わすこともなく心拍出量が得られ、 そ の上、 操作者に起因した誤差要因を心拍出量測定から払拭し た。 本発明の 1つの態様によると、 前記血液データ検知手段は温 度センサを有し、 前記血液データは、 血管中に注入された指示 液体により希釈された血液の温度に関連したデータである。 A configuration of the present invention for achieving the above object relates to a cardiac output measuring device for measuring cardiac output based on a dilution method, which relates to blood diluted with an indicator liquid injected into a blood vessel. Blood data detection means for outputting data; change amount calculation means for calculating the change amount of the blood data; comparison means for comparing whether the calculated change amount is equal to or greater than a predetermined value; If it is determined that there is, there are integrating means for starting integration of blood data at each time after that time, and cardiac output calculating means for calculating cardiac output based on the integrated value. In the dilution method, it is important to integrate the blood data value from the point in time when the blood data value changes, and according to the configuration of the present invention described above, the change in the blood data is monitored by the comparison means. When the change satisfies a predetermined condition, the integration is started, so that the cardiac output can be obtained without bothering the operator. It was wiped from the output measurement. According to one embodiment of the present invention, the blood data detecting means has a temperature sensor, and the blood data is data related to a temperature of blood diluted by an indicating liquid injected into a blood vessel.
本発明の 1つの態様によると、 前記積分手段は、 前記血液デ 一夕と上記比較手段による判定時刻以前において決定された所 定の基準血液データとの差分値の積分を開始し、 該差分値を時 ― 間の経過毎に積分する演算手段と、 前記血液データが前記基準 血液デー夕に略一致したときに積分を終了させる停止手段とを 含む事を特徵とする。 かかる構成によると、 希釈法の理論上で もっとも正確な心拍出量が測定できる。 According to one embodiment of the present invention, the integration means starts integration of a difference value between the blood data and reference blood data determined before the determination time by the comparison means, And a stopping means for terminating the integration when the blood data substantially matches the reference blood data. With this configuration, the most accurate cardiac output can be measured in theory of the dilution method.
本究明の 1つの態様によると、 前記積分手段は、 前記血液デ 一夕と上記比較手段による判定時刻以前において決定された所 定の基準血液データとの差分値の積分を開始し、 該差分値を時 間の経過毎に積分する演算手段と、 該差分値のピーク値を検出 する手段と、 このピーク値に基づいて積分を終了させる積分区 間を求める手段とを含む事を特徵とする。 かかる構成による と、 心拍出量が効率良く、 且つ精度を落さずに測定できる。 本発明の 1つの態様によると、 前記変化演算手段は、 血液デ 一夕の移動平均値の差分を演算する事を特徴とする。 かかる構 成によれば、 積分開始時点の検出をノイズに影響されることな く精度良く行なえ、 従って、 心拍出量の測定精度が向上する。 また、 本発明は、 使い易く、 容易な操作でもって、 且つ比較 的正確な測定ができるという課題を、 この連続測定可能な心拍 出量の測定装置により、 長時間の心拍出量の測定と、 その連続 1 ί According to one aspect of the present finding, the integration means starts integration of a difference value between the blood data and reference blood data determined before the determination time by the comparison means, It is characterized in that it includes a calculating means for integrating the difference every time, a means for detecting a peak value of the difference value, and a means for calculating an integration interval for terminating the integration based on the peak value. According to such a configuration, the cardiac output can be measured efficiently and without lowering the accuracy. According to one embodiment of the present invention, the change calculating means calculates a difference between moving average values of the blood data over time. According to such a configuration, the detection of the integration start point can be accurately performed without being affected by noise, and therefore, the measurement accuracy of the cardiac output is improved. In addition, the present invention has a problem that it is easy to use and easy to operate, and relatively accurate measurement can be performed. , Its continuation 1 ί
的な記録できるという測定装置を提案することにより達成す る。 This can be achieved by proposing a measuring device that can record data in a specific way.
かかる課題を達成するための本発明の構成は、 希釈法に基づ いた心拍出量の測定を少なくとも一回行なって初期心拍出量値 を求める心拍出量測定手段と、 この心拍出量測定手段により心 拍出量の測定が行なわれた血管位置近傍の血流速値を測定する 血流速測定手段と、 前記の希釈法に基づいた心拍出量値と、 該 心拍出量値の測定時に対応した血流速値との関係を表わす関数 値を演算する関数値演算手段と、 前記血流速測定手段により測 定された各時刻における血流速値と前記関数値とに基づいて、 各時刻における心拍出量値を連続的に演算する心拍出量演算手 段と、 上記各時刻における心拍出量値を時間順に記録する記録 手段とを有する心拍出量の測定記録装置を提案することにより 実現する。 The configuration of the present invention for achieving this object includes a cardiac output measuring means for measuring an cardiac output based on a dilution method at least once to obtain an initial cardiac output value; A blood flow velocity measuring means for measuring a blood flow velocity value in the vicinity of a blood vessel position at which the cardiac output is measured by the cardiac output measuring means; a cardiac output value based on the dilution method; Function value calculating means for calculating a function value representing a relationship with a blood flow value corresponding to the output value measurement; and a blood flow value at each time measured by the blood flow measurement means and the function value. , A cardiac output calculating means for continuously calculating a cardiac output value at each time, and a recording means for recording the cardiac output value at each time in chronological order. This is achieved by proposing a quantity measurement and recording device.
本発明の 1つの態様によると、 前記希釈法は熱希釈法であつ て、 前記心拍出量測定手段は、 指示液体を血管中に注入するた めの開口部と、 指示液体により希釈された血液温度を血液の下 流位置において測定する第 1のサーミス夕とからなる力テーテ ルと、 上記サーミスタにより検出された血液温度データを積分 する積分手段とを含み、 前記血流速測定手段は、 前記力テーテ ルの第 1のサ一ミスタ近傍に設けられた、 自己発熱型の第 2の サ一ミス夕を含む事を特徵とする。 従って、 1つのカテーテル で、 初期心拍出量測定のための情報 (血液温度) と、 連続的に 心拍出量を測定するための情報 (熱平衡温) とが得られるの で、 装置全体の小型化に寄与できる。 According to one embodiment of the present invention, the dilution method is a thermodilution method, wherein the cardiac output measuring means is an opening for injecting the indicator liquid into a blood vessel, and is diluted with the indicator liquid. A force table consisting of a first thermistor for measuring the blood temperature at a downstream position of the blood, and integrating means for integrating the blood temperature data detected by the thermistor; It is characterized in that it includes a second self-heating type thermostat provided near the first thermostat of the force table. Therefore, one catheter can provide information for measuring initial cardiac output (blood temperature) and information for continuously measuring cardiac output (thermal equilibrium temperature). This can contribute to downsizing of the entire device.
本発明の 1つの態様によると、 この心拍出量の測定装置は、 データ収集のための第 1のマイクロプロセッサと、 データ処理 のための第 2のマイクロプロセサと、 2つのマイクロプロセサ 間でデータをやり取りするコミュニュケーション手段とを含 み、 第 1のマイクロプロセサは前記第 1のサ一ミス夕によって 検出された血液温度データと、 前記第 2のサーミス夕によって 検出された熱平衡温データとを収集して、 前記コミュニュケー ション手段により、 これらの収集データを前記第 2のマイクロ プロセサに渡し、 この第 2のマイクロプロセサが収集されたデ 一夕をデータ処理して、 前記初期心拍出量値及び関数値とを演 算する事を特徵とする。 この構成によれば、 2つのマイクロプ 口セサが並行処理することになり、 データ収集とデータ処理の 高速化に寄与し、 精度のよい心拍出量データを測定者に提供す る。 According to one aspect of the invention, the device for measuring cardiac output comprises a first microprocessor for data collection, a second microprocessor for data processing, and a data processor between the two microprocessors. Communication means for exchanging the data, wherein the first microprocessor converts the blood temperature data detected by the first thermocouple and the thermal equilibrium temperature data detected by the second thermostat. Collecting the data, passing the collected data to the second microprocessor by the communication means, processing the data collected by the second microprocessor, and obtaining the initial cardiac output value. And calculating the function value. According to this configuration, the two microprocessors perform parallel processing, which contributes to faster data collection and data processing, and provides accurate cardiac output data to the measurer.
本発明の 1つの態様によると、 前記心拍出量演算手段は、 演 算された心拍出量の所定時間幅内のものを圧縮する手段と、 こ の圧縮された心拍出量を記憶するメモリを有し、 前記記録手段 はこの圧縮された心拍出量を記録する事を特徵とする。 この構 成によれば、 長時間の連続測定と、 その長時間のデータ記録が 可能となる。 According to one embodiment of the present invention, the cardiac output calculating means includes means for compressing the calculated cardiac output within a predetermined time width, and storing the compressed cardiac output. The recording means records the compressed cardiac output. According to this configuration, long-term continuous measurement and long-term data recording are possible.
また、 本発明は、 使い易く、 容易な操作でもって、 且つ比較 的正確な測定ができるという課題を、 血流速値を求めるのみ で、 心拍出量の相対的な変化を知ることできる機能を有する心 拍出量の測定装置を提案することにより達成する。 Another object of the present invention is to solve the problem that relatively accurate measurement can be performed with easy operation and easy operation, and a function to know a relative change in cardiac output only by obtaining a blood flow velocity value. Heart with This is achieved by proposing a device for measuring stroke volume.
かかる課題を達成するための本発明の構成は、 血流速値を測 定する血流速測定手段と、 任意の数値を入力する入力手段と、 前記血流速測定手段により測定された各時刻における血流速値 と前記任意の数値とに基づいて、 各時刻の経過に伴なう心拍出 量値の相対的変化を連続的に演算する心拍出量演算手段とを有 する。 The configuration of the present invention for achieving this object includes a blood flow velocity measuring means for measuring a blood flow velocity value, an input means for inputting an arbitrary numerical value, and each time measured by the blood flow velocity measuring means. And a cardiac output calculating means for continuously calculating a relative change of the cardiac output value with the passage of time based on the blood flow rate value and the arbitrary numerical value.
本発明の 1つの態様によると、 前記数値は血管の断面積値で ある事を特徴とする。 図面の簡単な説明 第 1 A図, 第 1 B図, 第 1 C図は夫々、 実施例に係る測定装 置の平面図, 正面図, 背面図、 According to one embodiment of the present invention, the numerical value is a cross-sectional area value of a blood vessel. BRIEF DESCRIPTION OF THE DRAWINGS FIG. 1A, FIG. 1B, and FIG. 1C are a plan view, a front view, and a rear view, respectively, of a measuring apparatus according to an embodiment.
第 2 A図, 第 2 B図, 第 2 C図は夫々、 実施例の測定装置に 用いられるカテーテルの全体斜視図、 要部断面図、 開口断面 図、 FIGS. 2A, 2B, and 2C are an overall perspective view, a cross-sectional view of a main part, and a cross-sectional view of a catheter used in the measurement apparatus of the embodiment, respectively.
第 3 A図, 第 3 B'図は実施例の測定装置の操作手順を説明し た手順図、 FIGS. 3A and 3B 'are flow charts for explaining the operation procedure of the measuring apparatus of the embodiment.
第 4図, 第 5図は実施例装置により熱希釈法に基づいて心拍 出量を測定したときの、 結果出力の例を示す図、 Figs. 4 and 5 show examples of the results output when the cardiac output was measured based on the thermodilution method using the apparatus of the embodiment.
第 6図〜第 8図は、 連続測定の結果を出力したときの出力例 を示す図、 Figures 6 to 8 show examples of output when the results of continuous measurement are output.
第 9 A図, 第 9 B図は測定装置の主要部分の回路図、 1 9A and 9B are circuit diagrams of the main part of the measuring device, 1
第 1 0 A図, 第 1 0 B図は測定装置内での R A M管理の様子 を説明する図、 Fig. 10A and Fig. 10B are diagrams for explaining how RAM is managed in the measuring device.
第 1 1図, 第 1 3 A図, 第 1 3 B図, 第 1 4 A , 第 1 4 B 図, 第 1 5図は夫々、 実施例に係る制御手順を示すフローチヤ 一卜、 FIG. 11, FIG. 13A, FIG. 13B, FIG. 14A, FIG. 14B, and FIG. 15 are flow charts each showing a control procedure according to the embodiment.
第 1 2図は補正定数 Aを格納するテーブルを示す図、 第 1 6図, 第 1 7図は従来の熱希釈法による心拍出量測定の 原理を説明する図、 FIG. 12 is a diagram showing a table for storing the correction constant A, FIGS. 16 and 17 are diagrams for explaining the principle of cardiac output measurement by the conventional thermodilution method,
第 1 8図は心拍出量測定を自動的に開始するための動作を説 明する図、 ' Fig. 18 illustrates the operation for automatically starting the cardiac output measurement.
第 Γ 9図は実施例装置を甩いて実験を行なったときの実験結 果を示す図である。 FIG. 9 is a diagram showing experimental results when an experiment was performed using the apparatus of the embodiment.
[以下余白] [Margins below]
ί 5 発明を実施するための最良の形態 以下添付図面に従って実施例を詳細に説明する。 BEST MODE FOR CARRYING OUT THE INVENTION Embodiments will be described below in detail with reference to the accompanying drawings.
〈実施例装置の外観〉 <Appearance of Example Device>
第 1 Α図〜第 1 C図に、 本発明を適用したところの心拍出量 の連続測定記録装置の夫々平面図, 正面図, 裏面図を示す。 そ して、 第 2 A図にこの測定装置に接続されるカテーテルの外観 を、 第 2 B図に、 このカテーテルの先端部分の長尺方向に沿つ た断面図を、 第 2 C図にカテーテルの閧ロ断面図を示す。 Figures 1 1 to 1C show a plan view, front view, and back view, respectively, of a continuous measurement and recording device for cardiac output to which the present invention is applied. Fig. 2A shows the appearance of the catheter connected to this measuring device, Fig. 2B shows a cross-sectional view of the distal end portion of the catheter along the longitudinal direction, and Fig. 2C shows the catheter. FIG.
この測定装置の原理は、 熱希釈法. 電解質希釈法, 色素希釈 法等の指示薬希釈法に基づいて初期心拍出量 C 0。 を測定し、 この心拍出量を測定したときの血流速 V。 を測定し、 その上 で、 この血流速 v。 を、 前記初期心拍出量 C O。 に結び付ける パラメータ Sを求める (ここで、 C O。 = v。 ' Sである) 。 このパラメータを求めた以降は、 任意の時刻における血流速 V x を測定するのみで、 この血流速 V x とパラメータ Sとか ら、 任意の時刻における心拍出量 C 0 X ( = V X ♦ S ) を求め る事ができる。 この初期心拍出量 C O。 を求める測定方法は、 上記指示薬希釈法であれば何でもよいが、 第 1 A図以下の実施 例においては、 特に熱希釈法に基づいている。 The principle of this measuring device is as follows: thermodilution method. Initial cardiac output C 0 based on indicator dilution methods such as electrolyte dilution method and dye dilution method. And the blood flow velocity V when this cardiac output was measured. Is measured, and then this blood flow velocity v. The initial cardiac output CO. Find the parameter S (where CO. = V. 'S). After obtaining this parameter, only the blood flow velocity V x at an arbitrary time is measured. From this blood flow velocity V x and the parameter S, the cardiac output C 0 X (= VX S). This initial cardiac output CO. Any method can be used as a measuring method for determining the above, as long as it is the indicator dilution method described above. In the examples shown in FIG.
第 1 A図〜第 1 C図に示した測定装置 1 0 0の外観説明を行 なう。 第 1 A図は装置 1 0 0の平面図である。 5 0は例えば周 知のプロッタ等の記録装置である。 このプロッタ 5 0により測 定結果等を出力する。 5 2 , 5 3は、 熱希釈法により初期心拍 出量値 C O o を測定するときの、 プロッタ 5 0上への出力態様 を指定するスイッチである。 『熱希釈数値』 と表示されたスィ ツチ 5 2は、 心拍出量 C Oを数値として (第 5図のように) 出 力することを指定する。 『熱希釈曲線』 と表示されたスイッチ 5 3は血液温度 T ¾ の変化等を曲線として出力することを指定 する (第 4図) 。 上述したように、 スイッチ 5 2 , 5 3は初期 心拍出量値 C O。 を測定 ( 『間欠測定』 ) するときのみに使わ れるのに対し、 次に説明するスィッチは、 主に心拍出量を連続 的に測定する ( 『連続測定』 ) ときの使われるものである。 The appearance of the measuring apparatus 100 shown in FIGS. 1A to 1C will be described. FIG. 1A is a plan view of the apparatus 100. FIG. Reference numeral 50 denotes a recording device such as a known plotter. The plotter 50 outputs measurement results and the like. 5 2, 5 3 This switch is used to specify the output mode on the plotter 50 when measuring the output value CO o. The switch 52 labeled "Thermodilution value" specifies that the cardiac output CO is to be output as a numerical value (as in Fig. 5). The switch 53 labeled "Thermo-dilution curve" specifies that the change in blood temperature T¾ is output as a curve (Fig. 4). As described above, switches 52 and 53 are the initial cardiac output values CO. The switch described below is mainly used when measuring cardiac output continuously (“continuous measurement”), while it is used only when measuring (“intermittent measurement”). .
スイッチ 5 7 , 5 8は、 プロヅタ 5 0の紙送り速度 (夫々、 2 O mm/時と 1 O mmZ分) を指定する。 『経過図』 と表示され たスィツチ 5 4は心拍出量 C O x 等の 1 2時間分の経過をプロ ヅタ 5 0上に出力 (第 8図) 指示するスイッチであり、 『記憶 再生』 と表示されたスィヅチ 5 5はメモリ内に記憶されている 連続的に得られた心拍出量 C 0 X 等のデータを過去 3 0分間分 だけプロッタ 5 0上に出力 (第 6図, 第 7図) することを指示 するスィッチである。 『メモ』 と表示されたスィツチ 8 0はメ モスイッチであり、 'このスィッチを押すと、 記録紙が 6 cmほど フィードされる。 『違続記録』 と表示されたスィッチ 5 6は C 0 T , v x 等の変化を実時間で記録紙上に出力 (第 6図, 第 7図) することを指示するスィッチである。 尚、 上記の 『記憶 再生』 モードは過去 3 0分間の記憶データを記録するものであ るが、 この 『再生』 中にも本測定装置 1 0 0は実時間で測定し た心拍出量等のデータを記憶していく。 従って、 やがて、 記録 紙上に記録されている過去のデータと、 現在記憶している実時 間のデータとが時間的に近接し一致する。 その場合は、 『再 生』 モードが停止されるのではなく、 前述の 『連続記録』 モー ドに自動的に切り替わるようにしている。 Switches 57 and 58 specify the paper feed speed (2 Omm / hr and 1 OmmZ, respectively) of the printer 50. The switch 54 displayed as “Progress chart” is a switch for instructing the progress of 12 hours such as cardiac output CO x on the processor 50 (FIG. 8). output Suidzuchi 5 5 displayed data such as cardiac output C 0 X was continuously obtained which is stored in memory on only the plotter 5 0 past 3 0 min minute (the Figure 6, the (Fig. 7) This is the switch that instructs the user to perform the operation. The switch 80 marked "Memo" is a memo switch. 'When this switch is pressed, the recording paper is fed about 6 cm. Switch 5 6 labeled "違続recording" is C 0 T, v outputs a change in x or the like on the recording sheet in real time (Figure 6, Figure 7) switch for instructing to. Note that the “memory playback” mode records the stored data for the past 30 minutes. During this “playback”, the measuring device 100 also measures the cardiac output measured in real time. Etc. are stored. So, in time, the record Past data recorded on paper and real-time data currently stored are close in time and coincide with each other. In such a case, the “playback” mode is not stopped, but automatically switched to the “continuous recording” mode described above.
スイッチ 5 9 , 6 0 (第 1 A図) , 6 1 , 6 2 (正面図の第 1 B図) 等は、 所望のデータを装置 1 0 0に入力したいとき に、 マニュアルでそのデー夕を設定するためのスイッチであつ て、 これらのスィッチによって入力される設定値は、 順に、 力 テーテル径 (単位 : フレンチ) 、 指示液体の注入量 (単位 : ml) 、 被測定者の体表面積 (単位 : m2)、 初期 C A L値 (単位 : LZ分) である。 初期 C A L値については後述する。 これら のデータ入力スィッチにおいて、 設定しょう とする値が表示さ れている値 (口の中に表示される) よ り も大のときは▲を押 し、 小のときは Tを押す。 The switches 59, 60 (Fig. 1A), 61, 62 (Fig. 1B of the front view), etc. are used to manually input the desired data to the device 100 when it is desired to input it. The setting values input by these switches are, in order, the diameter of the force sensor (unit: French), the amount of the indicator liquid injected (unit: ml), and the body surface area of the subject (unit). : M 2 ), the initial CAL value (unit: LZ). The initial CAL value will be described later. In these data entry switches, press ▲ if the value to be set is greater than the displayed value (displayed in the mouth), and press T if it is smaller.
『C0NTINU0US』 と表示されたスイッチ 64は、 測定装置のモ 一ドを連続モードにするスィッチであると同時に、 連続モード になると、 このスイッチ Zインディケ一夕 6 4が点灯する。 『 SINGLEJ と表示されたスィッチ 6 5はシングル (間欠) モード のスイッチ Zインディケ一夕で、 主に、 再度上記のパラメータ Sを設定し直したいときに、 連続モードからシングルモードに 復帰させるときに用いる。 このスイッチ 6 5は押されて間欠モ —ド ( S I N G L Eモード) になったときに点灯する。 表示器 6 8は心拍出量をデジタル的に表示する 4桁の L E Dである。 『 BLOOD 』 若しくは 『INJECTATE 』 と表示されているスィツチ 66, 67は、 3桁の L E D表示器 69に表示される温度を、 血液温度 Tb とするか、 指示液体の温度 とするのかを指定 するものである。 The switch 64 displayed as “C0NTINU0US” is a switch for setting the mode of the measuring apparatus to the continuous mode, and at the same time, when the continuous mode is set, the switch Z indicator 64 is turned on. "Switch 65 displayed as" SINGLEJ "is a switch in single (intermittent) mode Z indica. It is mainly used to return from the continuous mode to the single mode when it is necessary to reset the above parameter S again. . This switch 65 lights when it is pressed to enter intermittent mode (SINGLE mode). Indicators 68 are 4-digit LEDs that digitally display cardiac output. Switches displaying "BLOOD" or "INJECTATE" 66, 67, the temperature displayed on the 3-digit LED display 69, or the blood temperature T b, is to specify whether the temperature of the instruction liquid.
Γ ENTRY 』 と表示されているスィヅチ Zインディケ一夕 70 は、 熱希釈法による初期心拍出量値 CO。 の測定が終了し、 測 定装置 1 00がその C0。 をデータとして登録 (ENTRY) することが可能になったことを表示する。 この ENTRYイン ディケ一タ 70が点灯しているときに、 このスィヅチ 70を押 すと、 その初期心拍出量値 C0。 をデータとして登録する。 こ の C 00 の登録はパラメータ Sを求めるために行なわれるわけ であるが、 複数の CO。 の登録を予定しているのは、 より正確 な CO。 を求めるためであり、 即ち、 熱希釈法による初期心拍 出量値 C 0。 の測定を何回か行なって、 そのうちの信頼できそ うなデータを測定者が判断して登録することにより、 登録され たデータの平均値を初期値 C 0。 とするためである。 Z ENTRY 表示 is displayed on the switch Z Indica 70. Initial cardiac output value CO by thermodilution method. Measurement is completed, and the measuring device 100 sets its C0. Indicates that it is possible to register (ENTRY) as data. When this ENTRY indicator 70 is lit, pressing this switch 70 will set its initial cardiac output value C0. Is registered as data. This registration of C 00 is performed to obtain the parameter S, but multiple COs are registered. A more accurate CO is scheduled to be registered. That is, the initial cardiac output value C 0 by the thermodilution method. The average value of the registered data is set to the initial value C 0 by performing the measurement several times and determining the reliable data among them and registering it. This is because
『START』 と表示されたスイッチ/インディケ一夕 72 は、 熱希釈による初期心拍出量値 CO 0 測定の準備が完了した ことを表示し、 その時点でこのスィ-ツチを押すと、 スチユア一 卜 ♦八ミルトンの式に基づく積分を開始する。 The switch / indicator 72 indicating “START” indicates that the preparation for the initial cardiac output CO 0 measurement by thermodilution is completed, and when this switch is pressed at that point, the switch ♦ Start integration based on Eight Milton's equation.
表示器 7 1はバーグラフであり、 主に、 血液温度 Tb の値を リアルタイムに表示するものである。 73 , 74は、 夫々血液 温度センサを内蔵したカテーテル 4 (第 2 A図) のコネクタ 1 5、 注入液温度を測定するための温度プローブ 1 2 (第 2 A 図) のコネクタ 1 6を接続するためのコネクタである。 63は 電源スイッチであり、 7 8は内蔵のバヅテリが使用されている ことを示す表示ランプである。 Indicator 7 1 is a bar graph, primarily, is intended to display the value of the blood temperature T b in real time. 73 and 74 connect the connector 15 of the catheter 4 (Fig. 2A) with a built-in blood temperature sensor and the connector 16 of the temperature probe 12 (Fig. 2A) for measuring the infusion fluid temperature, respectively. Connector for 63 is A power switch 78 is a display lamp indicating that the built-in battery is being used.
第 1 C図のスイッチ 7 5はマニュアルで注入液温度を設定す るスィッチである。 7 6は外部の他の測定装置と通信するため の R S 2 3 2 Cインタ一フェースのコネクタ、 7 8は外部の 他の測定装置へ血液温度 T b ,血流速 ν χ , 心拍出量 C O x 等の アナログ信号を出力するための端子、 7 7は電源ケーブルを接 鐃するコネクタである。 Switch 75 in FIG. 1C is a switch for manually setting the infusate temperature. 76 is a connector of the RS232C interface for communicating with other external measuring devices, 78 is a blood temperature Tb , blood flow velocity ν χ , cardiac output to other external measuring devices terminal for outputting an analog signal, such as CO x, 7 7 denotes a connector for the power cable contact鐃.
〈測定装置 1 0 0の機能〉 <Functions of measuring device 100>
. この第 1 A図〜第 1 C図、 第 2 A図〜第 2 C図に示した実施 例装置 1 0 0の特徴を列挙すると、 The characteristics of the embodiment 100 shown in FIGS. 1A to 1C and FIGS. 2A to 2C are listed as follows.
①:初期値 C 0。 を測定するために熱希釈法により指示液体を 注入するときに、 カテーテル内に残留した指示液体による影響 を補正するために、 あらかじめ実験結果に基づいて定められた 値の表から測定者が求めていたことのかわりに、 前もって補正 定数をテーブル化して、 そのテーブルをアクセスするための予 備データとして、 測定者が、 指示液体を注入用のカテーテルの 外径サイズ (単位: フレンチ) を設定入力するスィッチ 5 9と 液体注入量 (単位: m 1 ) を設定入力するスィツチ 6 0とが本 測定装置に設けられている。 尚、 上記のカテーテル内に残留し た指示液体による影響は指示液体温度 T i にも依存する。 この ための T i は、 本実施例では、 後述するように、 温度測定プロ —ブ 1 2 (第 2 A図) のサ一ミス夕 1 2 aによって実際に測定 するか、 または、 その替りにマニュアルスィッチ 6 9 (第 1 B 図) によって設定入力するようにしている。 ①: Initial value C 0. When injecting the indicator liquid by the thermodilution method to measure the amount of indicator liquid, the operator must obtain from a table of values predetermined based on experimental results in order to correct the effect of the indicator liquid remaining in the catheter. Instead of this, the correction constants are tabulated in advance, and the operator sets and inputs the outer diameter size (unit: French) of the catheter for injecting the indicator liquid as preliminary data for accessing the table A switch 59 for setting and inputting a liquid injection amount (unit: m 1) is provided in the measuring apparatus. The influence of the indicator liquid remaining in the catheter also depends on the indicator liquid temperature T i. In this embodiment, Ti for this purpose is actually measured by the temperature measurement probe 12a of the temperature measurement probe 12 (FIG. 2A), as will be described later, or in place of it. Manual switch 6 9 (1st B (Fig.)
②:指示液体を血管内に注入した後の血液温度 Tb の変化を自 動的に認識する。 即ち、 上記スチュワート ·ノ\ミルトンの式 ( 1 ) に基づいた積分計算を正確に行なうために不可欠な積分開 始点 (血液温度 Τ¾ の変化点) を測定者の手を煩わすことなく a B 'き。。 ②: automatically recognizing the change in blood temperature T b after injection of the indicated liquid in the vessel. That, a B without troubling the measurer essential integration start point (change point of the blood temperature T ¾) to perform an integration calculation based on the Stewart-Bruno \ Milton of formula (1) precisely ' Come. .
③:指示液体の温度を測定するために、 温度プローブ 1 2を用 いるが、 このプローブ 1 2のコネクタ 1 6が測定装置 1 00に 接続されていないときは、 この未接続を検知して、 装置背面の スィヅチ 75 (第 1 C図) に前もって設定されている値を指示 液体温度 として入力する。 ③: The temperature probe 12 is used to measure the temperature of the indicator liquid. If the connector 16 of this probe 12 is not connected to the measuring device 100, this disconnection is detected. Enter the value preset on switch 75 (Figure 1C) on the back of the instrument as the reading fluid temperature.
④:一度、 熱希釈法により初期値 C 0。 を測定し、 パラメ一タ Sを求めると、 以降違続的に、 連続的な心拍出量 C 0 i,血液温 度 T¾,血流速 vx 等をメモリに記憶し、 必要に応じて記録紙上 に出力する。 その出力の態様は、 ④: Initial value C 0 once by thermodilution method. After measuring the parameter S, the continuous cardiac output C 0 i, blood temperature T ¾ , blood flow velocity v x, etc. are stored in memory intermittently, and Output on the chart paper. The output form is
( i ) :計測されていく C Ox 等を略実時間的にプロヅタ 5 0の記録紙上に出力する (第 6図, 第 7図) 。 これは 『連続 記録』 スィッチ 56を押すことによりなされる。 (i): The measured CO x and the like are output on recording paper of the printer 50 in substantially real time (FIGS. 6 and 7). This is done by pressing the "Continuous Recording" switch 56.
(ii) : メモリに記憶されていた過去 30分間の C◦ x 等の データを再生出力する (第 6図, 第 7図) 。 これは 『記憶再 生』 スイッチ 55を押すことにより行なわれる。 前述したよ うに、 この 『記憶再生』 モードは自動的に 『連続記録』 モー ドに移行する。 (ii): Reproduce and output data such as C◦ x for the past 30 minutes stored in the memory (Figs. 6 and 7). This is done by pressing the "play memory" switch 55. As described above, this “memory playback” mode automatically shifts to the “continuous recording” mode.
(iii) :過去 1 2時間の COx 等のデータを圧縮してプロヅ 夕 50上に再生出力する (第 8図) 。 これは、 『経過図』 ス イッチ 54を押すことにより行なわれる。 安静、 無騒音を必 要とする患者のデータを測定している時に、 収集したデータ をプロッタ 50で記録しないでプロッタのプリン卜騒音をた てず、 その替りにメモリに記憶しておき、 必要なときにスィ ヅチ 54を押して、 データを紙上に出力するものである。(iii): Compressed data such as CO x for the past 12 hours It is reproduced and output on the evening 50 (Fig. 8). This is done by pressing the "Plot" switch 54. When measuring the data of patients who require rest and noise, the collected data is not recorded by the plotter 50 and the plotter print noise is not recorded. When the switch 54 is pressed, the data is output on paper.
⑤: パラメータ Sをマニュアルでスィツチ 62を介して設定す ることができる。 従って、 この Sと血流速 vx とから連続的に C O x を求めることができる。 C O x の相対的変化を知りたい ときに役立つ。 ⑤: Parameter S can be set manually via switch 62. Therefore, CO x can be continuously obtained from S and the blood flow velocity v x . Useful when you want to know the relative change in CO x .
⑥:バーグラフ表示器 7 1により、 熱希釈法による初期心拍出 量値 C O。 を求めるとき等の血液温度 Tb の変化を目で確認で きる。 特に、 このバーグラフは、 温度変化を刻々変化して表示 する他に血液温度のベースライン (基準温度値 T 0) と、 最高 温度 T bmaxを固定して表示することができる。 ⑥: The initial cardiac output CO by the thermodilution method using the bar graph display 71. Kill the confirmation in the eyes the changes in blood temperature T b, such as when seeking. In particular, in addition to displaying the temperature change every moment, this bar graph can also be displayed by fixing the blood temperature base line (reference temperature value T 0 ) and the maximum temperature T bmax.
⑦:本装置は記憶されたデータを停電等の障害から保護するた めに、 バッテリー (第 9図の 1 48 ) を内蔵している。 このバ ッテリー 1 48の出力電圧が低下したときは、 L E D 78を点 滅などして注意を喚起している。 ⑦: This device has a built-in battery (148 in Fig. 9) to protect stored data from failures such as power failures. When the output voltage of the battery 148 drops, the LED 78 flashes to alert the user.
⑨ : 本測定装置 1 0 0以外の外部の測定装置に、 心拍出量 C O x 等をアナログ信号として端子 78から出力するためのァ ナログ出力回路 ( 1 42 , 1 5 1 ) を備えている。 ⑨: An external measuring device other than the measuring device 100 is provided with an analog output circuit (142, 151) for outputting the cardiac output CO x and the like as an analog signal from the terminal 78. .
⑩:本測定装置 1 00以外の外部の測定装置に、 R S 232ィ ンターフェ一スにより C O x 等をデジタル信号として出力する 回路 ( 1 4 4 ) を備えている。 ⑩: the external measurement device other than the measuring device 1 00, and outputs the CO x such as a digital signal by the RS 232 I Ntafe Ichisu Circuit (144).
〈カテーテルの構造〉 <Catheter structure>
熱希釈法に従って、 血液温度 T b を測定するためのサーミス タ、 そして血流速 Vを測定するためのサーミスタ等を内蔵する カテーテルを第 2 A図に示す。 同図において、 カテーテル 4は 4ルーメンを有するように構成される。 このカテーテル 4は、 先端に設けられた圧力検出口 1 8と、 カテーテルチューブ先端 部分全体を被覆する様に先端から数 m m後方位置に取付けられ た柔軟弾性体からなるバルーン 1 7と、 そのバルーン 1 7を膨 張, 収縮させる為に空気 (好ましくは、 二酸化炭素ガス) を注 入又は抜くためのバル一ン内チューブ側面に設けられたバルー ン側孔 2 5と、 先端から 1 0〜2 O m mの位置に設けられたサ 一ミスタ 1 と、 そこから更に 1 0〜 1 5 m m基部側に配置され たサ一ミス夕 2と、 さらにサーミス夕 1, 2より 8 . 5〜3 8 c mの範囲で離間し、 かつ、 先端より 1 2〜4 0 c mの範囲で 離間した位置に設けられた吐出口 3とを、 有する。 サ一ミスタ 1は血流速 v。 (または、 v x)を測定するための熱平衡温を測 定するために用いられる。 サーミスタ 2は熱希釈法により初期 心拍出量 C 0 α を測定するために必要なところの希釈された血 液温度 Τ を測定するために用いられる。 吐出口 3は指示液体 を吐出するためのものである。 According thermodilution shows blood temperature T b thermistor for measuring and a catheter incorporating a thermistor or the like for measuring the blood flow velocity V to a 2 A view. In the figure, catheter 4 is configured to have 4 lumens. The catheter 4 has a pressure detection port 18 provided at the distal end, a balloon 17 made of a flexible elastic body attached at a position several mm behind the distal end so as to cover the entire distal end portion of the catheter tube, and a balloon 1 A balloon side hole 25 provided in the side wall of the balun inner tube for injecting or removing air (preferably carbon dioxide gas) to expand and contract 7, and 10 to 20 O from the tip Thermistor 1 is located at a distance of 1 mm, the Summit 1 is located 10 to 15 mm further from it, and the Summit 2 is located 8.5 to 38 cm from the Thermistors 1 and 2. And a discharge port 3 provided at a position separated from the front end in a range of 12 to 40 cm from the front end. Thermistor 1 has blood flow velocity v. (Or v x ) used to measure the thermal equilibrium temperature. The thermistor 2 is used to measure the diluted blood temperature と こ ろ necessary for measuring the initial cardiac output C 0 α by the thermodilution method. The discharge port 3 is for discharging the indicating liquid.
尚、 第 2 Α図のカテーテル 4は、 頸静脈, 大腿静脈、 若しく は肘帯静脈より導管され、 上大静脈あるいは下大静脈、 更に右 心房, 右心室を経て肺動脈において使用するものであるため、 血液の流れ方向はカテーテル基端部側から先端側であることに 鑑み、 サーミスタ 2は、 吐出口 3からみてより先端側 (即ち、 血流の下流側) に設けられている。 一方、 末梢動脈より導管さ れ、 大動脈にて使用するカテーテルである場合には、 血流方向 は逆であるため、 吐出口 3からみてカテーテルの基端側に、 サ 一ミスタ 2が配置されることになる。 The catheter 4 in Fig. 2 is connected to the jugular vein, femoral vein, or cubital vein, and is used in the superior or inferior vena cava, the right atrium, the right ventricle, and the pulmonary artery. For, Considering that the direction of blood flow is from the catheter proximal end side to the distal end side, the thermistor 2 is provided at the distal end side (that is, downstream of the blood flow) as viewed from the discharge port 3. On the other hand, in the case of a catheter that is connected to the peripheral artery and used in the aorta, since the blood flow direction is opposite, the thermistor 2 is placed at the proximal end side of the catheter as viewed from the discharge port 3 Will be.
第 2 B図にカテーテル 4の要部断面図を示す。 同図におい て、 圧力検出口 1 8、 バルーン側孔 2 5 (第 2 A図) 、 サーミ スタ 1 , 2、 吐出口 3は、 それぞれ前記 4つのルーメンに連通 する。 これら 4つのルーメンとは、 肺動脈の圧力を伝える肺動 脈圧ルーメン 1 9、 バルーン 1 7を膨張, 収縮させる空気通路 であるバルーンルーメン 2 0、 サ一ミスタ 1 , 2並びにそれら のリ一ド線を収納するサーミスタルーメン 2 1、 希釈用の指示 液体を通す注入ルーメン 2 3である。 又、 これら 4つのルーメ ンは夫々独立しており、 さらにカテーテル後端部において、 第 2 A図に示すように、 肺動脈圧測定チューブ 8、 バルーンチュ ーブ 6、 サ一ミスタチューブ 1 3、 指示液注入チューブ 1 0と 接続されている。 それぞれのチューブ 8 , 6 , 1 0はその後端 にコネクタ 7 , 9 , 1 1を備えている。 サーミスタチューブ 1 3はコネクタ 1 5に接続されており、 このチューブ内には、 サ —ミスタ 1, 2に夫々接続されたリード線 2 2 , 2 4が通され ている。 コネクタ 1 5は装置 1 0 0のコネクタ 7 3に接続され る。 FIG. 2B shows a cross-sectional view of a main part of the catheter 4. In this figure, a pressure detection port 18, a balloon side hole 25 (FIG. 2A), thermistors 1 and 2, and a discharge port 3 communicate with the four lumens, respectively. These four lumens are the pulmonary arterial pressure lumen 19 that transmits the pressure of the pulmonary artery, the balloon lumen 20 that is an air passage for inflating and deflating the balloon 17, thermistors 1, 2, and their lead wires. A thermistor lumen 21 for storing the liquid, and an injection lumen 23 for passing the liquid for dilution. These four lumens are independent of each other, and at the rear end of the catheter, as shown in Fig. 2A, a pulmonary artery pressure measurement tube 8, a balloon tube 6, a thermistor tube 13, and an indicator. Connected to liquid injection tube 10. Each tube 8, 6, 10 has a connector 7, 9, 11 at its rear end. The thermistor tube 13 is connected to a connector 15, and lead wires 22 and 24 connected to the thermistors 1 and 2 are passed through the tube. Connector 15 is connected to connector 73 of device 100.
更に、 第 2 A図〜第 2 C図に示した実施例のカテーテルにつ — Further, the catheter of the embodiment shown in FIGS. —
いて詳細に説明する。 第 2 B図はサーミス夕 1、 サーミス夕 2 及びパル一ン 1 7の部位の拡大断面図であり、 第 2 C図はカテ —テルチューブ 4の H— ΠΓ 線断面図である。 前述した、 本力 テーテルの 4ルーメン構造は第 2 C図に示す如く、 バルーンル —メン 2 0と、 肺動脈圧ルーメン 1 9と、 注入ルーメン 2 3 (第 2 C図) と、 サーミスタルーメン 2 1 とからなっている。 バルーンルーメン 2 0は、 バルーン側孔 2 5を有して、 バル一 ンチューブ 6と連通する。 肺動脈圧ルーメン 1 9は、 圧力検出 口 1 8を有して肺動脈圧測定チューブ 8と連通する。 注入ルー メン 2 3は、 カテーテル先端より 1 2〜4 0 c mの位置に吐出 口 3を有して、 基部側において指示液注入チューブ 1 0と連通 する。 又、 サ一ミスタルーメン 2 1は、 先端部より 1〜2 c m 離れた位置、 並びに更にそこから基部側に 1〜 1 . 5 c m離れ た位置において、 それぞれサーミスタ 1、 サーミスタ 2を取付 けた側孔部 2 6 , 2 7を有する。 又、 ルーメン 2 1はサ一ミス タ 1, 2からのサーミスタリード線 2 2 , 2 4を内蔵してお り、 更に基部側に於いてはサーミスタチューブ 1 3と連通す る。 ' And will be described in detail. FIG. 2B is an enlarged cross-sectional view of the portion of the thermistor 1, thermistor 2, and the part 17 and FIG. 2C is a cross-sectional view of the catheter tube 4 taken along the line H-ΠΓ. As shown in Fig. 2C, the four-lumen structure of the main power Teether, as shown in Fig. 2C, includes a balloon lumen-20, a pulmonary artery pressure lumen 19, an infusion lumen 23 (Fig. 2C), and a thermistor lumen 21. Consists of The balloon lumen 20 has a balloon side hole 25 and communicates with the balloon tube 6. The pulmonary artery pressure lumen 19 has a pressure detection port 18 and communicates with the pulmonary artery pressure measurement tube 8. The injection lumen 23 has a discharge port 3 at a position of 12 to 40 cm from the distal end of the catheter, and communicates with the indicator liquid injection tube 10 on the base side. The thermistor lumen 21 is located at a distance of 1 to 2 cm from the distal end, and at a distance of 1 to 1.5 cm further to the base from the distal end, and has side holes to which the thermistors 1 and 2 are attached, respectively. It has parts 26 and 27. The lumen 21 has built-in thermistor lead wires 22 and 24 from the thermistors 1 and 2, and communicates with the thermistor tube 13 on the base side. '
尚、 上記サ一ミスタ 1を自己発熱型サ一ミス夕として、 サー ミスタ 2の血流方向に関して下流側に位置させることがより好 ましい。 即ち、 カテーテル 4にて心拍出量を測定する場合は、 サ一ミスタ 2により希釈された血流温度を正確に測定する必要 があり、 自己発熱型であるサーミスタ 1の影響をサーミスタ 2 が受けにくくするためである。 そうであっても、 サ一ミスタ 1 を肺動脈内に正しく位置させるために、 このサ一ミス夕 1を第 2 A図とは異ならせて、 サーミス夕 2から血流方向に関して更 に 1 0〜 1 5 mm上流側に位置させてもよい。 It is more preferable that the thermistor 1 is located on the downstream side in the blood flow direction of the thermistor 2 as a self-heating type of thermistor. In other words, when measuring cardiac output with the catheter 4, it is necessary to accurately measure the blood flow temperature diluted by the thermistor 2, and the thermistor 2 is affected by the self-heating type thermistor 1. This is to make it difficult. Even so, Samista 1 In order to properly position the blood vessel in the pulmonary artery, the diameter of the heat sink 1 may be different from that in Fig. 2A, and it may be located 10 to 15 mm further upstream in the blood flow direction from the heat sink 2. Good.
実施例のカテーテルで用いるサーミス夕 1の特性は B2S-45 = 3500 K、 R ( 37 ) = 1 000 Ωであり、 その大きさ は、 1. 1 81 X 0. 4 w X 0. 1 5 t (単位は mm) である。 サ一ミスタ 2の特性は、 B2S-S。 = 3500 K、 R (37) = 1 4 Κ Ω、 その大きさは 0. T S i x O. 1 w X 0. 1 5 で ある。 サーミスタ 1は 0. 0 1〜50ジュールの発熱量を発生 するのが好ましく、 これより高い発熱量は血液温を高く し、 若 しくは、 血管壁に触れた場合にそれを損傷させる可能性もあ り、 また低い発熱量では検出感度が小さくなるなどの理由によ り何れも好ましくない。 尚、 サーミスタ 2は、 B 25 -45 = 39 8〇 K、 R ( 37 ) = 40 Κ Ω、 その大きさは 0. 501 X 0. 1 6 w X 0. 1 5¾ であってもよい。 The characteristics of the thermistor 1 used in the catheter of the embodiment are B 2 S - 45 = 3500 K, R (37) = 1 000 Ω, and the size is 1.18 1 X 0.4 w X 0.1 5 t (unit is mm). Characteristics of mono- thermistor 2, B 2S - S. = 3500 K, R (37) = 14 Κ Ω, and its magnitude is 0. TS ix O. 1 w X 0.15. Thermistor 1 preferably produces a heating value of 0.01 to 50 Joules, with higher heating values increasing the blood temperature and possibly damaging blood vessel walls if touched. In addition, a low heat value is not preferable because the detection sensitivity is low. Incidentally, the thermistor 2, B 25 - 45 = 39 8_Rei K, R (37) = 40 Κ Ω, its magnitude may be 0. 50 1 X 0. 1 6 w X 0. 1 5 ¾ .
尚、 第 2 A図に示したプローブ 1 2は指示液温度測定用のプ ローブであり、 その先端付近には、 サーミスタ 1 2 aが設けら れており、 終端側に'は測定装置 1 00のコネクタ 74に接続す るためのコネクタ 1 6が設けられている。 The probe 12 shown in FIG. 2A is a probe for measuring the indicator liquid temperature, and a thermistor 12a is provided near the distal end thereof. A connector 16 for connecting to the connector 74 is provided.
〈測定装置の操作手順〉 <Operation procedure of measuring device>
本測定装置 1 00をよりよく理解するために、 第 1 A図, 第 1 B図, 第 3 A図, 第 3 B図を用いて、 操作者側からみたその 操作手順を説明する。 In order to better understand the measuring apparatus 100, the operation procedure as viewed from the operator side will be described with reference to FIGS. 1A, 1B, 3A and 3B.
先ず、 ステップ S 1で注入液温度プローブ 1 2を測定装置本 体 1 0 0に接続する。 ステヅプ S 2で、 温度プローブ 1 2を氷 冷した容器 (本実施例では、 測定装置 1 0 0内に設けられてい る) 内の注入指示液体中に漬ける。 この液体は生理食塩水等で ある。 ステップ S 3でカテーテル 4をプライミングした後に、 ステップ S 4で肺動脈まで揷入する。 カテーテル 4は、 上肢ま たは下肢の静脈等から揷入し、 肺動脈内に留置する。 次に、 ス テヅプ S 5で、 第 2 A図に示したカテーテルのコネクタ類を装 置本体に接続する。 これらのコネクタ類が装置に接続される と、 先ず、 カテーテル 4の血管内留置位置を順に移動すること により、 圧力検出口 1 8、 チューブ 8 , コネクタ 9を経た中心 静脈圧, 右房圧, 右室圧, 肺動脈圧等の血圧値及び圧力波形に 基づいて確認する。 カテーテル留置後は、 肺動脈圧を測定する と共に、 バルーン 1 7を膨らませて肺動脈を閉塞し、 肺動脈楔 入圧を求める。 こうして、 カテーテル 4を所定の位置に留置す る。 First, in step S1, the injection solution temperature probe 1 and 2 are Connect to body 100. In step S2, the temperature probe 12 is immersed in the injection instruction liquid in an ice-cooled container (in this embodiment, provided in the measuring device 100). This liquid is a saline solution or the like. After priming the catheter 4 in step S3, the catheter 4 is introduced into the pulmonary artery in step S4. The catheter 4 is inserted through a vein or the like of the upper limb or lower limb and is placed in the pulmonary artery. Next, in step S5, the connectors of the catheter shown in FIG. 2A are connected to the device main body. When these connectors are connected to the device, first, the catheter 4 is sequentially moved in the indwelling position of the blood vessel, so that the central venous pressure, the right atrial pressure, the right Check based on blood pressure values such as room pressure and pulmonary artery pressure and pressure waveform. After placing the catheter, the pulmonary artery pressure is measured, and the balloon 17 is inflated to occlude the pulmonary artery, and the pulmonary artery wedge pressure is determined. Thus, the catheter 4 is left at a predetermined position.
次にステヅプ S 6で、 スィッチ 5 9〜6 1により、 所定の値 を設定する。 スイッチ 6 2は、 相対的な C O x を測定 (後で説 明する) するときに設定するものであり、 今説明する熱希釈法 による初期心拍出量値 C 0。 を測定するときは、 その設定は必 要がない。 Next, in step S6, a predetermined value is set by switches 59 to 61. Switch 62 is set when measuring relative CO x (discussed later), which is the initial cardiac output value C 0 from the thermodilution method described here. There is no need to make settings when measuring.
ステップ S 7で測定装置の電源を投入する。 ステップ S 8で 異常な表示 (装置故障を示す) が無いことを確認しつつ、— ステ ヅプ S 9で S I N G L Eインディケ一夕 6 5の点灯を待つ。 ィ ンディケ一夕 6 5が点灯したときは、 B L 0 0 Dインディケ一 タ 66が点灯し、 表示器 69には肺動脈内の血液温度 Tb が表 示される。 この時点で注入液の温度を知りたいときは、. I N J E CTAT Eスィッチ 67を押すと、 表示器 69の表示は注入 液温度 Ti の表示となる。 この時点でのバーグラフ表示器 7.1 には、 血液温度 Tb の基線を表示している答である。 In step S7, the power of the measuring device is turned on. While confirming that there is no abnormal display (indicating device failure) in step S8, wait for the SINGLE indicator to turn on in step S9. When the indicator lights up, the BL 0 0 D indicator Motor 66 is turned, the display 69 blood temperature T b in the pulmonary artery is displayed. If you want to know the temperature of the infusate at this point, press the INJE CTATE switch 67 and the display 69 will show the infusate temperature Ti. The bar graph indicator 7.1 at this point, the answer displaying the baseline blood temperature T b.
尚、 この Ί の表示は、 30秒経過すると、 自動的に B L O O D表示に戻り、 表示器 69には再び Tb の表示がなされる。 このように自動的に Ί\ の表示に戻るようにしたのも、 操作者 にとつては、 Tb の方が情報としてより有意義であるからであ る。 The display of this Ί is after 30 seconds, automatically reverts to BLOOD display, is made a display of T b again on the display 69. In this way also automatically had to return to the display of Ί \, go-between and to the operator, Ru Der because the people of T b is more meaningful as information.
更にステップ S 1 0で、 STARTインディケ一夕 72が点 灯するのを待つ。 このインディケ一夕が点灯すると、 熱希釈法 による初期心拍出量値 C 0。 の測定開始の準備ができたことを 意味する。 ステップ S 1 1では、 必要により、 プロッタ 50に 出力する情報の態様をスイッチ 52又は 53で選択する。 ステ ヅプ S 1 2では、 コック 1 1 を闢いて液体を血管内に注入す る。 Further, in step S10, it waits until START Indica Night 72 lights up. When this indica night lights, the initial cardiac output value C 0 by the thermodilution method. Means ready to start measurement. In step S11, if necessary, the mode of the information to be output to the plotter 50 is selected by the switch 52 or 53. In step S12, a liquid is injected into the blood vessel with the cock 11 opened.
液体注入後は、 本測定装置は自動的に Tb の変化を読取り、 積分開始の最適時点を判断する。 もし、 この最適時点検出前に 操作者が S TA RTスイッチマ 2を押すと、 その押した時点か ら Tb の積分を開始する。 スイッチ 72が押されなければ、 装 置自身が判断した時点からの Tb データを積分する。 この熱希 釈法による心拍出量の測定計算は通常、 十数秒で終了するが、 その間の変化は、 所定のメモリ (第 9図の RAM 1 32 ) に記 憶されつつ、 表示器 69、 バーグラフ表示器 7 1 に表示され る。 更に、 スイッチ 53が押されていたのなら、 第 4図のよう な血液温度 Τ¾ の変化がプロッタ 50に出力される。 これらの 表示により、 操作者は装置の正常動作の遂行を確認できる。 第 4図において、 血液温度 Tb は上向きにマイナスを取ってい る。 尚、 このグラフ上には測定者の便のため、 日付, 時刻等を 合せて出力することになる。 尚、 第 4図の出力例は、 30 Omm /分の出力速度である。 After the liquid injection, the measuring device automatically reads the change of T b, to determine the optimal time of starting the integration. If the operator before the optimum point detection Press S TA RT switches Ma 2, starts integration of the pressed point or et T b. If the switch 72 is pressed, integrating the T b data from when the equipment itself is determined. The measurement and calculation of cardiac output by this thermal dilution method usually completes in about a dozen seconds, but the change during that time is stored in a predetermined memory (RAM 132 in Fig. 9). While being remembered, it is displayed on the display 69 and the bar graph display 71. Further, if the switch 53 has been pressed, a change in the blood temperature { } as shown in FIG. 4 is output to the plotter 50. These displays allow the operator to confirm the normal operation of the device. In Figure 4, the blood temperature T b is that taking a negative upward. In this graph, the date, time, etc. are output together for the convenience of the measurer. The output example in FIG. 4 is an output speed of 30 Omm / min.
熱希釈による心拍出量 CO。 の測定が終了すると、 表示器 6 8にその値をデジタルで表示すると共に、 スイッチ 52が押さ れていたのならば、 プロッタ 50により第 5図に示すように、 測定結果を出力する。 この第 5図では、 日付, 時刻の他に、 心 拍出量 C 0, スィヅチ 6 1から入力された体表面積 B S A, 血 液温度 BT ( = Tb ) . カテーテル外径 CAT (= F r ) 、 指 示液体注入量 I V ( = V . 心係数 C I ( = C 0 / B S A ) , 注入液温度 I T ( = T i), そして登録されるたことを示す 『* * ENTR Y* *』 の表示等が合せて記録されている。 初 期心拍出量 C O。 の測定終了は、 ENTRYインディケ一夕 7 0の点灯 (ステップ S 1 5 ) により確認できる。 Cardiac output from thermodilution CO. When the measurement is completed, the value is digitally displayed on the display 68, and if the switch 52 has been pressed, the measurement result is output by the plotter 50 as shown in FIG. In FIG. 5, in addition to the date and time, the cardiac output C 0, the body surface area BSA input from the switch 61, the blood temperature BT (= T b ) and the catheter outer diameter CAT (= F r) Indicated liquid injection volume IV (= V. Heart coefficient CI (= C 0 / BSA), Injected liquid temperature IT (= T i), and “* * ENTR Y * *” indicating that the liquid has been registered The end of the initial cardiac output CO. Measurement can be confirmed by turning on the ENTRY indica 70 (step S15).
測定者は、 この得られた C 0等のデータが信頼性を置けるも のと判断すれば、 このデータを登録するために、 ENT RYス イッチ 70を押す (ステップ S 1 7) 。 暫くすると、 再び S T A R Tインディケ一夕 Ί 2が点灯する。 これで、 熱希釈法によ る、 初期心拍出量 CO 0 の測定は終了する。 もし、 より正確な C Oを得たいのであれば、 上述したステツ プ S 1 1以下の操作を繰り返し、 複数の測定データを得る。 測 定毎に E N T R Yスィッチ 7 0を押し、 登録して、 これら登 録された複数の C O。 値から平均値を求め、 初期心拍出量値 C 0。 値を決定する。 If the measurer determines that the obtained data such as C0 can provide reliability, he or she presses the ENTRY switch 70 to register the data (step S17). After a while, START INDIQUE 夕 2 lights up again. This completes the measurement of the initial cardiac output CO 0 by the thermodilution method. If you want to obtain more accurate CO, repeat the above steps S11 and below to obtain multiple measurement data. Press the ENTRY switch 70 for each measurement to register and register these registered COs. The average value is calculated from the values, and the initial cardiac output value C0. Determine the value.
以上のようにして、 十分信頼できる初期心拍出量 C O。 のデ 一夕が得られたのならば、 次に、 いよいよ連続の C Ox 測定を 閧始する。 これは単に、 C ONT I NUOU Sスイッチ 64を 押すのみでなされる。 このスイッチ 64を押すと、 C O NT I NU O U Sインディケ一夕 64が点灯して、 測定装置全体は連 続測定モードになる。 尚、 S I NGL Eスィッチ 65が押され ると、 測定装置は再度、 間欠モードになる。 In this way, you can have a sufficiently reliable initial cardiac output CO. Once this data is obtained, the next step is to start measuring CO x continuously. This is done simply by pressing the CONTINT NUOUS switch 64. When this switch 64 is pressed, the CONT I NU OUS indicator 64 lights up, and the entire measuring apparatus is in the continuous measurement mode. When the SI NGL E switch 65 is pressed, the measuring device returns to the intermittent mode.
装置が連続測定モードになり、 連続記録スィツチ 5 6が押 されていると、 第 6図, 第 7図のように、 血液温度 B T ( = Tb ) . C O ( = C O x) , 血流速 v (= vx)がプロッタ 50上 に出力される。 第 6図は 1 OmraZ分の紙送り速度で、 第 7図は 2 0 ノ時の紙送り速度で出力したものである。 尚、 第 6図, 第 7図には図示していないが、 第 5図に示したような日付等の 諸データを、 グラフと共に併せて出力するようにしているのは 勿論である。 又、 第 7図の例では、 1 6時半頃に再度初期心拍 出量値 C 0。 値計測のための熱希釈法による測定を行なってい る。 この初期心拍出量 C O。 の再測定を行なったことをグラフ 上に明示するために、 本実施例の装置 1 00では、 第 7図に示 すように、 縦線を挿入している。 〈測定装置の構成〉 When the device is in the continuous measurement mode and the continuous recording switch 56 is pressed, the blood temperature BT (= Tb ) .CO (= COx) and the blood flow velocity as shown in FIGS. v (= v x ) is output on the plotter 50. Fig. 6 shows the paper feed speed for 1 OmraZ, and Fig. 7 shows the paper feed speed at 20 o'clock. Although not shown in FIGS. 6 and 7, it goes without saying that various data such as dates as shown in FIG. 5 are output together with the graph. In addition, in the example of FIG. 7, the initial cardiac output value C 0 is restored again at around 16:30. The measurement is performed by the thermodilution method for measuring the value. This initial cardiac output CO. In order to clearly show on the graph that re-measurement was performed, a vertical line is inserted in the apparatus 100 of the present embodiment as shown in FIG. <Configuration of measurement device>
カテーテル 4と注入液温度プローブ 1 2を接続された状態で の測定装置 1 0 0における回路接続の全体は第 9図に示す如く である。 この測定装置 1 0 0は電気的にアイソレーシヨンされ た 2つの測定回路 1 2 0 (第 9 A図) と 1 3 0 (第 9 B図) と からなる。 回路 1 2 0は主に、 カテーテル 4内のサーミスタ The entire circuit connection in the measuring apparatus 100 in a state where the catheter 4 and the infusate temperature probe 12 are connected is as shown in FIG. The measuring apparatus 100 comprises two electrically isolated measuring circuits 120 (FIG. 9A) and 130 (FIG. 9B). Circuit 120 is mainly for thermistor in catheter 4
1 , 2、 そしてプローブ 1 2内のサーミスタ 1 2 aからの電気 信号 (電圧) を温度データに変換して、 光通信回路 1 0 8を介 して、 測定記録回路 1 3 0に送る。 測定記録回路 1 3 0は、 測 定回路 1 2 0からの温度データから、 初期心拍出量値 C O。 、 血流速 v。 (または v x ) 、 パラメータ S、 連続心拍出量 C O x 等を演算し、 プロッタ 5 0に表示したり、 各種表示器に 表示するのを実行する。 測定回路 1 2 0の制御を行なうのは口 一カル C P U 1 0 5、 測定記録回路 1 3 0を制御するのはメイ ン C Pひ 1 3 3である。 The electric signal (voltage) from the thermistor 12 a in the probe 1, 2 and the probe 12 is converted into temperature data and sent to the measurement recording circuit 130 via the optical communication circuit 108. The measurement recording circuit 130 obtains the initial cardiac output CO from the temperature data from the measurement circuit 120. The blood flow velocity v. (Or v x ), parameter S, continuous cardiac output CO x, etc. are calculated and displayed on the plotter 50 or displayed on various displays. The mouth CPU 105 controls the measurement circuit 120, and the main CP 133 controls the measurement recording circuit 130.
[以下余白] 〈測定回路 1 2 0〉 [Margins below] <Measurement circuit 1 2 0>
さて、 第 9図のカテーテル型センサ 1 5 0は第 2 A図のカテ —テル 4をセンサとして用いるものであり、 センサ 1 5 0内に は、 熱平衡温を検出する自己発熱型のサーミス夕 1 と、 肺動脈 内の血液温度を検知するサーミス夕 2 とが内蔵されている。 こ のカテーテル型センサ 1 5 0は、 前述したのと同様の手法で、 右心カテーテル法によって肺動脈まで導入される。 センサ 1 5 〇のコネクタ 1 5は本体 1 0 0のコネクタ 7 3 と結合する。 サ 一ミスタ 2はリード線 2 4を介して、 サーミスタ 2を駆動する 定電圧回路 1 1 '2及び血液の温度を計る血液温度検知回路 1 1 3に接続されている。 The catheter-type sensor 150 in FIG. 9 uses the catheter 4 in FIG. 2A as a sensor. The sensor 150 includes a self-heating type thermistor 1 for detecting a thermal equilibrium temperature. And a thermistor 2 that detects the blood temperature in the pulmonary artery. This catheter type sensor 150 is introduced into the pulmonary artery by right heart catheterization in the same manner as described above. Connector 15 of sensor 15 〇 is connected to connector 73 of main body 100. The thermistor 2 is connected via a lead wire 24 to a constant voltage circuit 11'2 for driving the thermistor 2 and a blood temperature detecting circuit 113 for measuring blood temperature.
サーミスタ 2により検知された肺動脈血液温度の信号は血液 温度検知回路 1 1 3によって電圧信号 E b として検出される。 一方、 サーミスタ 1 は、 リード線 2 2を介して、 サーミスタ温 度検知回路 1 1 5及び定電流回路 1 1 1 に接続されている。 そ して、 定電流回路 1 1 1 よりサ一ミスタ 1 に所定の電流 I c が 供給され、 加熱される。 また、 サーミス夕 1 により検知された 温度信号は、 サーミ 'スタ温度検知回路 1 1 5に送られ、 この検 出回路 1 1 5により電圧 E t として検出される。 注入液温度プ ローブ 1 2内のサーミスタ 1 2 aは定電圧回路 1 0 1 により駆 動され、 その温度変化は回路 1 0 2により電圧値 E i として検 出される。 こう して、 口一カル C P U 1 0 5は、 3つのサーミ ス夕 1 2 a , 1 , 2からの出力電圧 E i , E t, E b を、 注入液の 温度 T i,サーミスタ 1の抵抗 R t , サ一ミスタ 1 の温度 T t ,血 液温度 Tb に変換する。 The signal of the pulmonary artery blood temperature detected by the thermistor 2 is detected by the blood temperature detection circuit 113 as a voltage signal Eb . On the other hand, the thermistor 1 is connected to a thermistor temperature detecting circuit 115 and a constant current circuit 111 via a lead wire 22. Then, a predetermined current I c is supplied to the thermistor 1 from the constant current circuit 111 to be heated. The temperature signal detected by the thermistor evening 1, Sami 'is sent to the static temperature sensing circuit 1 1 5, it is detected as a voltage E t by the circuit 1 1 5 out this detection. The thermistor 12a in the infusate temperature probe 12 is driven by the constant voltage circuit 101, and its temperature change is detected by the circuit 102 as a voltage value Ei. In this way, the CPU 105 sets the output voltages E i, E t, and E b from the three thermistors 12 a, 1, and 2 to the infusion temperature T i and the resistance of the thermistor 1. R t , temperature of thermistor 1 T t , blood Converting the liquid temperature T b.
この動作を更に詳しく説明する。 口一カル C PU 1 05は、 マルチプレクサ機能を有するアナログスィッチ 1 03を駆動し て、 時分割により E Et, Eb を 1 4ビッ卜の A/D変換器 1 04に入力して、 上記の電圧値を順にデジタル値で RAM 1 0 7内に取込む。 これらの電圧値は R 0 M 1 06内に格納された 電圧—温度変換テーブルから、 温度データに変換される。 又、 サーミスタ 1の抵抗値 Rt はThis operation will be described in more detail. Mouth one local C PU 1 05 drives the analog switch 1 03 having a multiplexer function, split type EE t, the Eb 1 4 bit Bok of the A / D converter 1 04 by time, the voltage The values are sequentially taken into RAM 107 as digital values. These voltage values are converted to temperature data from the voltage-temperature conversion table stored in R0M106. The resistance value R t of thermistor 1 is
![]()
![]()
により計算される。 ここで、 I c はサーミス夕に流れる電流で ある。 ローカルの C P U 1 05は、 これらの T R t, T t, Tb 等のデータを光通信線を介して、 測定記録回路 1 30に送る。 その通信制御 (例えば、 周知のポーリング セレクティング方 式により行なわれる) は、 ローカル CPU 1 05とメイン C P U 1 33とが行なう。 Is calculated by Here, I c is the current flowing in the thermistor. Local CPU 1 05, these TR t, T t, the data such as T b via the optical communication line, and sends the measurement recording circuit 1 30. The communication control (for example, performed by a well-known polling selecting method) is performed by the local CPU 105 and the main CPU 133.
尚、 AZDコンバータ 1 04を比較的高分解能の 1 4ビット のものを用いることにより、 後述するように高心拍出量領域ま で測定可能となった。 By using a relatively high resolution 14-bit AZD converter 104, it was possible to measure up to the high cardiac output region as described later.
〈測定記録回路 1 30〉 <Measurement recording circuit 1 30>
測定記録回路 1 30では、 この単純な通信制御手順により、 上記注入液の温度 Ti,サ一ミスタ 1の抵抗 Rt,サーミス夕 1'の 温度 Tt,血液温度 Tb 等を受信して、 時間順に RAM I 32に 格納する。 C P U 1 3 3は、 上記データに基づいて、 初期心 拍出量値 C O 。、 血流速 V。 (又は、 v x ) , 違続心拍出量 C 0 x を演算する。 The measurement recording circuit 1 30, by the simple communication control procedure receives the temperature Ti of the injection liquid, the resistance R t mono- thermistor 1, the temperature T t of the thermistor evening 1 ', the blood temperature T b, etc., Store in RAM I 32 in chronological order. The CPU 133 sets the initial cardiac output value CO based on the above data. , Blood flow velocity V. (Or v x ), intermittent cardiac output Calculate C 0 x.
RT C (リアルタイムクロック回路) 1 47は実時間をカウ ン卜し、 更に例えば L ED表示器 69における Ti 表示から 3 0秒後の T b 表示への表示変更等の時間監視に用いられる。 第 1 0 A図は R AM 1 32内に格納されたデータの構成を示 す。 本 R AMの容量は、 4 Oms毎に AZD変換して得た Tb 等のデータを 30分間分蓄える領域 ( 1 32 a ) と、 これらの データから任意の時刻における連続心拍出量 C Ox 等の測定値 を 30分間分だけ蓄える領域 ( 1 32 b) と、 連続的に計算し て得た C Ox 等のデータの 1. 5分間平均値を 1 2時間分蓄え る領域 ( 1 32 c) とを少なくとも格納できるだけある。 RT C (real time clock circuit) 1 47 real-time count down and Bok, used further for example, the time monitoring of the display change of the T b Display after 3 0 seconds Ti displayed in L ED indicator 69. FIG. 10A shows the structure of the data stored in RAM 132. Capacity of the R AM is 4 area stores 30 minutes worth of data, such as T obtained by AZD converts every Oms b and (1 32 a), continuous at any time from these data cardiac output C Ox (1 32b) for storing the measured values for 30 minutes, etc., and for 12 hours (1, 32c) for the 1.5-minute average value of the continuously calculated CO x and other data. ) And at least can be stored.
第 1 0 B図は、 R AM 1 32内のデータを格納するための 3 つのア ドレスカウンタ 1 60 , 1 6 1 , 1 62と前記 3つの領 域 ( 1 32 a , 1 32 b, 1 32 c) との対応を示す。 データ 格納アドレスカウンタ ( S Cポインタ) 1 60は、 測定回路 1 2 〇からのデータを R AM 1 32内に格納していく ときのアド レスをポイン トする。 データ読出アドレスカウンタ (R Cボイ ンタ) 1 6 1は、 初期心拍出量値 C 0。 の計算のとき等のため に、 R AM 1 32内に格納されているデ一夕を読出し、 更に計 算値を格納するときのアドレスをポイントする。 データプリン 卜ア ドレスカウンタ (P Cポインタ) 1 62は、 プロッタ 50 上にデータを出力するときに必要なデータをボイン卜する。 こ のように 3つのポインタを用いるのも、 データ格納、 データ読 出し、 データ出力等はサブルーチンとして独立して並行に行な われるからである。 FIG. 10B shows three address counters 160, 161 and 162 for storing data in RAM 132 and the three areas (132a, 132b, 132). The correspondence with c) is shown. The data storage address counter (SC pointer) 160 points to the address used to store data from the measurement circuit 12 〇 in the RAM 132. Data read address counter (RC pointer) 16 1 is the initial cardiac output value C 0. For example, when calculating the data, read the data stored in RAM 132 and point to the address where the calculated value is stored. A data print address counter (PC pointer) 162 points data necessary for outputting data to the plotter 50. The use of three pointers in this way also allows data storage, data reading, data output, etc. to be performed independently and in parallel as subroutines. Because it is
〈初期心拍出量値 CO。 の計算〉 <Initial cardiac output value CO. Calculation>
第 1 1図はメイン C P U 1 33が口一カル C P U 1 05から 測定データを受けとり、 R AM 1 32に格納するルーチンであ る。 前述したように、 このときのポインタとして S Cポインタ を用いる。 FIG. 11 shows a routine in which the main CPU 133 receives measurement data from the oral CPU 105 and stores it in the RAM 132. As described above, the SC pointer is used as the pointer at this time.
第 1 3 A, B図は初期心拍出量値 CO。 値を計測するための C P U 1 33の制御ル一チンである。 この第 1 3 A図, 第 1 3 B図の制御は自動測定開始機能も含んでいる。 Figures 13A and B show the initial cardiac output CO. It is a control routine of CPU133 for measuring the value. The control shown in Figs. 13A and 13B also includes an automatic measurement start function.
マ二エアルスタ一卜 Manners Start
先ず、 ステップ S 40で、 測定装置の READ Y状態を確認 する。 この状態は、 少なくとも装置全体で Λ—ド的な障害が発 生していないことを前提とし、 血液温度 T¾ が安定した状態を 検知した状態とする。 Tb の安定状態は、 一定の時間幅内の T データの分散を演算して、 この分散が所定値以下にあるか 否かによって判断する。 尚、 この R E A D Y状態を検知する と、 上述したように、 S T A RTインディケ一夕 72が点灯す る。 ステップ S 4 Γで、 STARTスィッチ 72が押されたか を判断する。 First, in step S40, the READY state of the measuring device is checked. This condition assumes that at least the entire device in Λ- de failures are not occurred, the state of the blood temperature T ¾ detects the stable state. Stable state of the T b is executed to compute the variance of T data within a certain time width is determined depending on whether the dispersion is below a predetermined value. When this READY state is detected, as described above, the STAR indicator 72 lights up. In step S 4 す る, it is determined whether the START switch 72 has been pressed.
もし、 押されていたのならば、 これは操作者によるマ二ユア ル測定開始指示である。 ステップ S 50で、 その時刻 tをリア ルタイムクロック RTG 147から読取り、 ステヅプ S 5 1で その時刻 tに従ったポインタ値を RCポインタ 1 6 1に設定す る ステップ S 52では、 注入液温度 T i を RAM I 32から 知る。 ステップ S 53では、 R Cポインタ 1 6 1 に従って R A M 1 32から Tb を 1つ読出す。 ステップ S 54では、 時刻 以前のデータから、 基線 (ベースライン) 温度 Tb0を検出す る。 この Tb0の検出は、 例えば、 上記 R E AD Y状態の判定に 使われた分散の少ない状態の例えば平均温度から求める。 ステ ップ S 5 5で ATb (第 1 7図) を次式に従って算出する。 If it has been pressed, this is the manual measurement start instruction by the operator. In step S50, the time t is read from the real time clock RTG 147, and in step S51, a pointer value according to the time t is set in the RC pointer 161, in step S52, the infusion liquid temperature T i From RAM I 32 know. In step S 53, to one reading the T b from RAM 1 32 in accordance with RC pointer 1 6 1. In step S54, a baseline (baseline) temperature Tb0 is detected from the data before the time. The detection of Tb0 is obtained, for example, from the average temperature of the state with small dispersion used for the determination of the READY state. In stearyl-up S 5 5 AT b (first Figure 7) is calculated according to the following equation.
ΔΤ¾ = Tb0-T¾ 尚、 ここで、 血液温度 Tb の符号は温度下降方向を正としてい る。 ステップ S 5 6では、 この厶 Tb を加算して、 ∑△ T b (積分) を計算する。 この∑ΔΊ\ が、 スチュヮー卜 ♦ ノ、ミル 卜ンの式の ΔΤ ¾ = T b0 -T ¾ Here, the sign of blood temperature T b is positive in the temperature decreasing direction. In step S 5 6, by adding this厶T b, calculates the sigma △ T b (integration). This ∑ΔΊ \ is the ♦ ス, Milton equation
( CO (CO
J o ΔΤ ¾ d t に相当する。 ステップ S 57は、 血液温度下降が一定時間経過 してもないかどうかを判断するものである。 即ち、 ステップ S 57で、 温度下降 ΔΤ^ が所定の閾値 T Ha よりも小さいとき は、 まだ、 サーミス夕 2にまで指示液体が到着していないと判 断して、 ステップ S 58で、 カウンタ E RT I Mをインクリメ ン 卜する。 厶 Tb ≤THa の状態が E RT I Mがオーバフロー するまで継続したときは、 何等かの以上があつたとして、 ステ ップ S 60で、 エラー状態発生の表示を行なう。 この表示は、 表示器 6 8にエラ一コード番号と共に " E r " と表示され る。 正常に装置が動作し、 指示薬が注入されていれば、 一定の時
間以内にステヅブ S 57では ZiTb >THa となる。 ΔΊ^ > T Ha までの間のステヅプ S 5 3〜ステップ S 5 7 =ステップ S
![]()
![]()
△ Tb >T Ha を検出したときはステップ S 6 1に進む。 第 1 8図を参照して説明する。 ステップ S 6 1は希釈曲線のピー クを検出する。 ステップ S 6 1の Tbmaxは、 温度下降中におけ る T 0からの最大温度降下量を記憶しておくもので、 当初は " 0" に初期化されている。 温度降下があると (ピークを検出す るまでは) 、 ステヅプ S 6 1で、△ T b> upon detection of the TH a, the process proceeds to step S 6 1. This will be described with reference to FIG. Step S61 detects a peak in the dilution curve. Step S 6 1 of T bmax is intended to store the maximum amount of temperature drop from T 0 that put in temperature drop initially is initialized to "0". If there is a temperature drop (until the peak is detected), in step S61,
![]()
![]()
であるから、 ステップ S 62で ATtmaxを更新する。 ステップ S 6 3では、 積分演算を終了する目安となる温度値 ATbc (ス テヅプ S 6 8で使われる) を更新する。 積分は理論的には長く 行なえば長く行なうほど精度は上昇する。 スチュワート ·ハミ ルトンのでも、 積分区間は無限大まである。 しかし、 積分区間 を長くとるこどは、 測定効率も上がらず、 また、 Tb0付近のノ ィズによる影響を受け易い。 ATbcは、 精度があまり下がらな い程度に測定効率を上げる (積分区間を短くする) ような下限 温度として設定される。 ピーク温度 AT¾maxが大小で、 ΔΤ も影響を受けるから、 ATbmaxが更新される毎にステップ S 6 3 Therefore , AT tmax is updated in step S62 . In step S63, the temperature value AT bc (used in step S68), which is a measure for ending the integration operation, is updated. The longer the integration, the longer the theory, the higher the accuracy. Even in Stewart Hamilton, the integration interval extends to infinity. However, if the integration interval is long, the measurement efficiency does not increase, and it is easily affected by noise near T b0 . ATbc is set as the lower limit temperature that increases the measurement efficiency (shortens the integration interval) to the extent that the accuracy does not decrease too much. Since the peak temperature AT ¾max is large and small and ΔΤ is also affected, every time AT bmax is updated, step S 6 Three
3で、 ΔΤ を更新する。 ステップ S 64では、 R Cポインタ をインク リメン トして、 新たな温度データをポイン ト し、 ステ ヅプ S 5 3に戻って、 前述の制御を繰返す。 こう して、 ピーク が検出されるまでの積分が行なわれる。 At 3, update ΔΤ. In step S64, the RC pointer is incremented, new temperature data is pointed, the process returns to step S53, and the above-described control is repeated. In this way, integration is performed until a peak is detected.
血液温度の降下が止まると、 ステップ S 6 1 での ΔΤ¾ >△ Tbmaxの判定は Ν 0となるのでステップ S 6 6に進む。 このス テツプ S 6 6で、When the drop in blood temperature stops, the determination of ΔΤ ¾ > △ Tbmax in step S61 becomes Ν0, so the process proceeds to step S66. In this step S66,
![]()
![]()
を調べる。 ここで、 THb は所定の閾値である。 第 1 8図に示 すように、 上記関係が満足するときは、 ピークを越したと考え ることができるから、 ステップ S 6 7で、 ピークフラグをセッ 卜する。 このピークフラグは、 測定閧始後に少なく とも一度ピ ークを検出したことを示す。 ステップ S 68では、 血液温度が 上昇して (曲線が下降して) 、 ΔΤ\ が積分を停止する臨界温 度 ATbcに達したかを調べる。 Find out. Here, TH b are predetermined threshold. As shown in FIG. 18, when the above relationship is satisfied, it can be considered that the peak has been exceeded, so the peak flag is set in step S67. This peak flag indicates that a peak has been detected at least once after the start of the measurement. In step S68, it is checked whether the blood temperature has risen (the curve has dropped) and ΔΤ has reached the critical temperature AT bc at which integration stops.
温度上昇 が未だ ATbcに至らないときは、 ステップ S 6 4に進んで、 更にステップ S 5 3に戻り積分を継続する。 温度上昇 ΔΤ^ が厶 T¾cると、 ステップ S 6 9に進み、 前記 ピークフラグを調べる。 ビークフラグはセッ トされているか ら、 ステップ S 7 0以下の心拍出量 C 0。 の演算に進む。 ここ で、 ピークフラグの意義が明らかとなる。 ノイズ等の影響に よ り、 一度もピークを検出しないうちにステップ S 6 8で、 ΔΤ, ≤ATbcとなることはあり得る。 そこで、 ATbmax— △ Tb > T Hb となるようなピークを検出したときのみ、 ピー クフラグをセットし、 このフラグがセットされないうちは、 一 度開始した積分を誤って停止しないようにする。 尚、 もし、 上 述の THa と THb とを同じ閾値に設定すれば、 ピークフラグ 及びそれに関連した制御 (ステップ S 66 , S 67 , S 69 , S 70 ) は必要なくなる。 If the temperature rise has not yet reached AT bc , the process proceeds to step S64 , and returns to step S53 to continue integration. When the temperature rise ΔΤ ^ is equal to Tc, the process proceeds to step S69 to check the peak flag. Since the beak flag is set, the cardiac output C 0 of step S 70 or less. Proceed to the calculation of Here, the significance of the peak flag becomes clear. Ri by the influence of noise or the like, in Step S 6 8 While even once does not detect the peak, .DELTA..tau, may be a ≤AT bc. Therefore, AT bmax - △ T b> when detecting the peak such that TH b only, P. Set this flag to prevent accidentally stopping an integration that was started once this flag was not set. If THa and THb are set to the same threshold, the peak flag and the related control (steps S66, S67, S69, S70) become unnecessary.
尚、 積分の精度を高くすることに重きを置くときは、 ΔΤ^ は厶丁 0に略等しいことが望ましい。 また、 ステップ S 70以 下の説明は自動スター卜の制御を説明した後に行なう。 When emphasizing the accuracy of integration, ΔΤ ^ is desirably approximately equal to 0 . The description of step S70 and subsequent steps will be made after the control of the automatic start is described.
こうして、 マニュアルスター卜時の初期心拍出量 C 0。 の演 算制御がなされる。 Thus, the initial cardiac output C 0 during manual start. Calculation control is performed.
自動スター卜 Automatic start
次にステヅプ S 4 1で、 S T A RTスイッチ 72が押されて いない場合を説明する。 この STARTスィッチ 72が押され ていない場合とは、 操作者がマニュアルスター卜を意図してい て、 STA RTスィヅチ 72が押されるまでの間の場合と、 操 作者が自動スタートを意図している場合の二通りある。 また、 この実施例では、 STARTスィヅチ 72が押されなくても、 温度 T¾ の所定の変化があれば、 自動スター卜を操作者が意図 していると判断する。 即ち、 STARTスイッチ 72が押され ていない間の温度 Tb の所定の変化を検出するまでは、 この温 度変化を監視しつつ、 スイッチ 72の押下も同時に監視する必 要がある。 この温度監視をステヅプ S 43以下で行ない、 スィ ツチ 72の押されたかの監視をステップ S 42〜ステップ S 4 7の間で割込みにより検知している。 ステップ S 42〜ステツ プ S 47の間で上記割込みが発生すると、 強制的に制御は前述 のステップ S 50に移る。 Next, the case where the START switch 72 is not pressed in step S41 will be described. The case where the START switch 72 is not pressed means that the operator intends a manual start and the time until the START switch 72 is pressed, and the case where the operator intends an automatic start. There are two ways. Further, in this embodiment, even without START Suidzuchi 72 is pressed, if there is a predetermined change in the temperature T ¾, determines that the automatic star Bok operator intended. That is, until it detects a predetermined change in the temperature T b during the START switch 72 is not depressed, while monitoring the temperature changes, depression of the switch 72 also needs to be monitored simultaneously. This temperature monitoring is performed in step S43 and below, and whether the switch 72 is pressed is detected by an interrupt between step S42 and step S47. Step S 42-Steps When the above-mentioned interrupt occurs during the step S47, the control is forcibly moved to the aforementioned step S50.
さて、 スィッチ 72が押されていないと、 ステップ S 42 で、 R Cポインタ 1 6 1に従って Tb を RAM 1 32から読出 す。 ステップ S 42—ステップ S 43—ステップ S 44—ステ ヅプ S 42のループは、 本実施例において Tb の変化を、 Tb の移動平均値 (サンプル数 1 6個) の変化からとらえているた めに、 その必要サンプル数をメモリ 1 3 2から得るためにあ る。 尚、 移動平均の移動量は 1つのサンプルデータである。 一 度必要サンプル数が揃うと、 それ以降は、 1つのサンプルデー タをメモリ 1 3 2から読出す毎に、 平均のための総サンプル が揃う ことになる。 ステップ S 4 5では、 この移動平均値 Τ , (n ) を求める。 ステップ S 4 6で、 前回の移動平均値 Τ,(η- 1 ) との差を求める。 この差が所定の閾値 THd 以上 であるときは、 指示液注入による血液温度の変化であると判断 して、 ステップ S 49で、 この変化時点の時刻 tを計算する。 移動平均をとつているための時間遅れにより、 実際の温度変化 があった時刻は、 変化があつたと判断された時刻よりも過去に なるからである。 以降の制御は前述の STARTスィッチ 72 による場合と同じである。 Now, when switch 72 is not pressed, in step S 42, reads the T b from RAM 1 32 in accordance with RC pointer 1 6 1. Step S 42- Step S 43- Step S 44- stearyl Uz loop flop S 42 is the change in T b In this embodiment, the captured from a change in the moving average value of T b (Equation 1 6 samples) In order to obtain the required number of samples from the memory 13 2 The moving amount of the moving average is one sample data. Once the required number of samples is obtained, every time one sampled data is read from the memory 1332, the total samples for averaging will be completed. In step S45, the moving average value Τ, (n) is obtained. In step S46, a difference from the previous moving average value Τ, (η-1) is obtained. When the difference is equal to or greater than the predetermined threshold value TH d, it is determined that the change in blood temperature due indicator liquid infusion, in step S 49, to calculate the time t of the change point. This is because the time at which the actual temperature change occurred is later than the time at which it was determined that the change occurred due to the time delay due to the moving average. Subsequent control is the same as that by the START switch 72 described above.
もし、 ステップ S 47で、 変化が閾値 THd 以下と判断され た場合は、 ステップ S 48で今回の平均値 Tb(n) を前回の平 均値 Tb(n— 1 ) 格納領域に移動する。 If moving, in step S 47, if a change is determined to be equal to or less than the threshold value TH d, step S mean value of the current at 48 T b (n) of the previous average value T b (n- 1) in the storage area I do.
ここで、 移動平均間隔 (上記例では、 4 Om s X 1 6個 = 6 4 0 m s ) と、 Tb (n) と Τ"η— 1 ) との時間差と、 閾値 Τ Here, the moving average interval (in the above example, 4 Oms x 16 = 6 40 ms), the time difference between Tb (n) and Τ "η-1), and the threshold Τ
Hd との関係について説明する。 第 1 3 A図の制御では、 時間 変化に対する温度変化 (=温度勾配) 、 The relationship with Hd will be described. In the control shown in Fig. 13A, the temperature change (= temperature gradient)
T¾ (n) - Τ"η - 1 ) T ¾ (n)-Τ "η-1)
ηと η— 1 との時間差 Time difference between η and η— 1
が T Hd を超えたか否かで、 心拍による希釈曲線の変化を検出 するようにしている。 nと n— 1との時間差は 6 4 O m sであ る。 ところで、 ノイズ等の影響を受けないで希釈曲線の変化を 検出するには、 T Hd は 0. 1 ° C程度が好ましい。 そして、 例えば人間の希釈曲線において、 0. 1 ° Cの変化が表われる には大体 2秒ほど必要となる。 そこで、 第 1 3 A図の制御を若 干変更する必要がある。 その変更とは次のようにする。 希釈曲 線温度 Tb の移動平均演算は毎 1 6サンプル (= 6 4 0 m s ) 毎に行なって、 メモリに記憶しておく。 このようにして演算記 憶した移動平均値を T ( k) と表わすと、 約 2秒前に求めて 記憶した移動平均値 Tb { Ά ) との差を 2秒で割って、 曲線勾 配を求め、 これと T Hd = 0. 1 ° Cとを比較するのである。 即ち、 There on whether exceeds TH d, and to detect the change of the dilution curve by heart. The time difference between n and n−1 is 64 O ms. By the way, in order to detect a change in the dilution curve without being affected by noise or the like, TH d is preferably about 0.1 ° C. For example, in a human dilution curve, it takes about 2 seconds for a change of 0.1 ° C to appear. Therefore, it is necessary to slightly change the control shown in Fig. 13A. The change is as follows. The moving average calculation of the dilution curve temperature Tb is performed every 16 samples (= 640 ms) and stored in the memory. When the moving average value thus calculated and stored is expressed as T (k), the difference from the moving average value Tb ( b ) obtained and stored about 2 seconds ago is divided by 2 seconds, and the curve slope is calculated. And compare this with TH d = 0.1 ° C. That is,
T"k ) 一 Τ (·β ) T "k) I (Τβ)
2秒 —— υ . 丄 2 seconds —— υ. 丄
ならば、 心拍による温度変化を認識したとするのである。 この ように、 2秒ほどの過去のデータから、 曲線勾配を見つけ、 積 分間隔を決定する場合には、 第 1 3 Α図のステップ S 49の t は、 2秒前の過去のデータを意味することとなる。 尚、 移動平均の演算サイクルと 2秒という時間間隔とが同期 しないために、 上記例では、 各 Tb ( k) を全て記憶しなけれ ばならなくなってしまう。 そこで、 平均値 Tb ( Ά ) の替り に、 2秒前の実時間値 T¾ でもって代用してもよい。 Then, it is assumed that the temperature change due to the heartbeat is recognized. In this way, when finding the curve gradient from the past data of about 2 seconds and determining the integration interval, t in step S49 in Fig. 13 意味 means the past data 2 seconds before Will be done. In order to moving average calculation cycle and the time interval of 2 seconds are not synchronized, in the above example, Banara becomes not necessary to store all the T b (k). Therefore, instead of the average value T b (Ά), it may be replaced with a real time value T ¾ of the previous 2 seconds.
かく して、 マニュアルスタート時、 及び自動スター卜時にお ける積分計算の制御が説明された。 Thus, the control of integral calculation during manual start and automatic start was explained.
補正係数のテーブル化 Tabulation of correction coefficients
, ステップ S 7 1の説明に戻る。 さて、 前述したように、 スチ ュワート ♦ノ、ミルトンの式によると、

ここで here
C〇 心拍出量、 S i :注入液体の比重 C〇 cardiac output, S i: specific gravity of infused liquid
C i 注入液体の比熱、 Vi 注入液体量 Specific heat of C i injection liquid, Vi injection liquid volume
T i 注入液体の温度、 Tb 血液の温度 T i Infusion liquid temperature, T b Blood temperature
s , 血液の比重、 c b 血液の比熱 s, specific gravity of blood, c b specific heat of blood
である, 上記式は
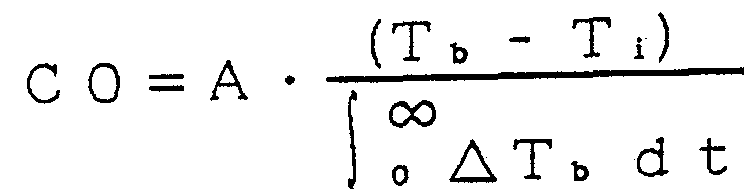
となる。 ここで、 '
![]()
![]()
である。 この定数 A中で、 S S ¾, C ¾, C i 等は固定である が、 注入液体量 Vi は、 正規の温度に設定された指示液体を血 管に注入してもカテーテル内に残留してしまい血液内に流出さ れないことによる影響を受ける。 即ち、 上記 V i はあくまでも 名目的な値に過ぎない。 また、 更に、 カテーテル内に残留する ^¾体量が問題となるのは、 血管内に注入される指示液体の熱量 が不明になるからである。 そして、 この熱量の絶対値は指示液 体の温度にも依存するから、 従来では、 前述したように、 カテ 一テルサイズ, 指示液体注入量 V i 等から、 予め実験的に定め られた表を索引して、 補正定数 A ' を求めていたが、 本実施例 においては操作者による操作の確実性の向上を目指して、 この 補正定数 A * をテーブル化 (第 1 2図) して R O M 1 3 1内に 格納している。 このテ一ブルから 1つの補正定数 A ' を引くと きは、 第 1 2図に示すように、 スイッチ 5 9, 6 0から入力さ れたカテーテル 4の外径 F r , 名目の液体注入量 m 1をァドレ スデータとする。 即ち、 C P U 1 3 3は、 スィヅチ 5 9 , 6 0 の設定値を I Z Oポー卜 1 3 4を介して読み取り、 これらと指 示液体温度 とを R O M 1 3 1をァドレッシングするための 上記ァドレスデータに変換する。 上記のテーブル内に格納する 補正定数データは、 前もって、 各種サイズのカテーテルについ て、 注入液量を色々変えたときの実測結果から求めておく。 も し、 熱希釈法による実際の測定で使用されるカテーテルサイズ 、 注入液量が、 上記テーブルに対応しないものを含むときは、 テーブル内に存在する近いものから線形補間により、 対応する 補正定数 A ' を求める。 It is. In this constant A, SS ¾ , C ¾ , C i, etc. are fixed. Even if injected into a tube, it is affected by the fact that it remains in the catheter and does not flow out into the blood. That is, the above V i is just a nominal value. Furthermore, the amount of ^ ¾ body remaining in the catheter becomes a problem because the amount of heat of the indicator liquid injected into the blood vessel becomes unknown. Since the absolute value of the heat quantity also depends on the temperature of the indicator liquid, conventionally, as described above, a table determined experimentally in advance based on the catheter size, the indicator liquid injection amount V i, etc. The correction constant A 'was obtained by indexing, but in this embodiment, in order to improve the reliability of the operation by the operator, the correction constant A * is tabulated (FIG. 12) and the ROM 1 3 Stored in 1. When one correction constant A ′ is subtracted from this table, as shown in FIG. 12, the outer diameter Fr of the catheter 4 input from the switches 59, 60 and the nominal liquid injection amount Let m 1 be the address data. That is, the CPU 1333 reads the set values of the switches 59 and 60 through the IZO port 134, and reads these and the indicated liquid temperature into the above-mentioned address data for addressing the ROM 1331. Convert to The correction constant data to be stored in the above table is obtained in advance for the catheters of various sizes from the actual measurement results when the amount of the infusate is changed in various ways. If the catheter size and infusion volume used in the actual measurement by the thermodilution method include those that do not correspond to the above table, the corresponding correction constant A by linear interpolation from the closest one in the table 'Ask.
フローチヤ一卜の説明に戻る。 ステップ S 6 8までで、 ∑△ Tb の積分の計算が終了すると、 ステップ S 7 1で上述したよ うに、 スィッチ 59. 60から設定入力されたカテーテルの外 径 F r, 指示液体量 m 1等に基づいて、 R OM 1 3 1 に格納さ れているテーブル (第 1 2図) から補正定数 A ' を読出す。 ス テツプ S 7 1で、 前述したスチュヮ一卜 ♦ ハミルトンの式に基 づいて、 初期心拍出量値 CO。 を計算する。 ステップ S 72で は、 連続的な心拍出量 C Ox を計算するのに必要なパラメータ Sを計算する。 ステップ S 73では、 これらの値を例えば、 第 4図. 第 5図のようにプロッタ 50上に出力する。 Return to the description of the flowchart. Up to step S68, ∑ △ The calculation of the integral of T b is completed, based urchin I described above in Step S 7 1, an outer diameter F r of the catheter set and inputted from the switch 59.60, the instruction liquid amount m 1 and the like, R OM 1 3 Read the correction constant A 'from the table stored in 1 (Fig. 12). In step S71, the above-mentioned steps ♦ Initial cardiac output value CO based on Hamilton's equation. Is calculated. In step S 72, to calculate the parameter S necessary to calculate the continuous cardiac output CO x. In step S73, these values are output on the plotter 50, for example, as shown in FIGS.
〈連続 C Ox の測定〉 <Continuous C Ox measurement>
先ず、 連続的に C Ox を計算できる原理を説明する。 サーミ スタ 1の抵抗値を Rt とし、 定電流回路 1 1 1 によってサーミ スタ 1 に与えられる電流値を I c とすると、 サーミスタ 1が加 熱され、 発生する単位時間あたりの熱量は : First, the principle on which CO x can be calculated continuously will be described. Assuming that the resistance value of the thermistor 1 is R t and the current value given to the thermistor 1 by the constant current circuit 111 is I c, the amount of heat generated per unit time by heating the thermistor 1 is:
I c2♦ R t I c 2 ♦ R t
になる。 いま、 血流速 Vなる血液中に、 加熱されたサーミスタ 1が置かれた場合、 加熱されたサ一ミスタ 1は血流速 Vに依存 して冷却される。 血流によ り冷却される熱量は、 血液温度を Tb 、 加熱されたサーミスタ温度を Tt 、 比例定数を Kとする ' と、 become. Now, when the heated thermistor 1 is placed in the blood having the blood flow velocity V, the heated thermistor 1 is cooled depending on the blood flow velocity V. The amount of heat cooled by the blood flow is as follows: blood temperature is T b , the heated thermistor temperature is T t , and the proportionality constant is K.
K · V ♦ ( T t 一 Tb ) K · V ♦ (T t-T b )
である。 さて、 サ一ミスタ 1の温度は、 加熱され発生する熱量 と冷却される熱量とが等しくなるような温度に保たれることに なる。 この温度が、 熱平衡温である。 上記のことを式で表わすと次の (2) 式になる。 It is. Now, the temperature of the thermistor 1 is maintained at a temperature such that the amount of heat generated by heating and the amount of heat to be cooled are equal. This temperature is the thermal equilibrium temperature. The above can be expressed by the following equation (2).
I c2♦ Rt = Κ · V · (Tt -Tb ) I c 2 ♦ R t = ΚVV (T t -T b )
(2) (2)
(2) 式から、 血流速 vを求める (3) 式が導かれる。 From equation (2), equation (3) for obtaining the blood flow velocity v is derived.
V = V =
( 1 / K ) ( I c2♦ R t ) / (Tt 一 T¾ ) (1 / K) (I c 2 ♦ R t) / (T t- T ¾ )
··♦·…… (3) ·· ♦ · …… (3)
即ち、 サーミスタ 1から得られるデータ Rt,Tt 、 そしてサ 一ミスタ 2から得られる血液温度 Tb とから、 血流速 Vが求め られる。 尚、 加熱サーミスタ 1は定電流回路 1 1 1によって駆 動されているため、 抵抗値を検出する代わりに加熱サーミス夕 1のリード線両端の電位差 E。 を検出しても良い。 この場合の 詳細については、 前述の特開昭 6 1 - 1 25329号に述べら れている。 又、 なお、 定電流値 I c は定電流回路 1 1 1の電流 を検出しても対応できるが、 比例定数 Kと同様に定数項とし て、 R 0 M 1 3 1內に与えておくことも可能である。 That is, the blood flow velocity V is obtained from the data R t , T t obtained from the thermistor 1 and the blood temperature T b obtained from the thermistor 2. Since the heating thermistor 1 is driven by the constant current circuit 111, instead of detecting the resistance value, the potential difference E between both ends of the heating thermistor 1 lead wire. May be detected. The details of this case are described in the aforementioned Japanese Patent Application Laid-Open No. 61-125329. In addition, the constant current value I c can be handled by detecting the current of the constant current circuit 11 1, but it should be given to R 0 M 13 1 內 as a constant term like the proportional constant K. Is also possible.
いま、 肺動脈の血管断面積を Sとした場合、 初期心拍出量値 C Oo と初期血流速値 v。 との間には (4) 式で示されるよう な関係がある。 Now, assuming that the blood vessel cross-sectional area of the pulmonary artery is S, the initial cardiac output value C Oo and the initial blood flow velocity value v. Has a relationship as shown in equation (4).
![]()
![]()
従って、 初期心拍出量値 C O。 と初期血流速値 Vとから、 (4) 式に従い血管断面積 Sを求め、 この値 Sを較正値 (パラ メータ) として計測記録回路 1 30内にホールドする。 このよ うに、 一度パラメ一タ Sが求められると、 CP U 1 33は、 連 続的に計測される血流速 vx に対して前記パラメータ Sを乗ず ることにより、 連続的な心拍出量値 C O x を得ることが可能と なる。 即ち、 Therefore, the initial cardiac output value CO. The blood vessel cross-sectional area S is calculated from Equation (4) and the initial blood flow velocity value V, and this value S is held in the measurement recording circuit 130 as a calibration value (parameter). In this way, once the parameter S is required, the CPU 133 By multiplying the continuously measured blood flow velocity v x by the parameter S, a continuous cardiac output value CO x can be obtained. That is,
C 0 = S ♦ V x C 0 = S ♦ V x
= ( S/K) · (I c2 · Rt)/(Tt -T¾ ) = (S / K) · (I c 2 · Rt) / (T t -T ¾ )
♦·· ( 5 ) ♦ · (5)
である。 It is.
■ 第 1 4 Α図は、 パラメータ Sを計算するための第 1 3図のス テツプ S 72の詳細である。 先ず、 第 1 4A図のステップ S 1 1 0で、 ローカル C P U 1 05に対して光通信路を介してサー ミスタ 1の加熱を指示する。 ステップ S 1 1 2では、 サ一ミス タ 1が加熱と冷却の熱平衡に達するのを待つ。 やがて、 口一力 ル C P Uからは、 Tt, Rt,Tb 等が送られてきて、 第 1 1図の フローチヤ一卜により RAM 1 32に時間順に格納する。 そこ で、 ステップ S 1 1 3で一定時間経過したときの時間 tに従つ て R Cポインタ 1 6 1により、 RAM 1 32内のデータをァク セスする。 ステップ S 1 1 4では (3) 式に基づいて初期血流 速 v。 を演算し、 ステップ S 1 1 5では (4) 式に従って、 初 期心拍出量値 C O。 と血流速 v。 との関係からパラメータ Sを 求める。 こう して、 連続的な C Ox 測定の準備が整った。 ■ Fig. 14 Α shows the details of step S72 in Fig. 13 for calculating the parameter S. First, in step S110 of FIG. 14A, the local CPU 105 is instructed to heat the thermistor 1 via the optical communication path. In step S112, the process waits for the thermostat 1 to reach a thermal equilibrium between heating and cooling. Eventually, the mouth Ichiriki Le CPU, T t, R t, becoming Tb or the like is sent and stored by Furochiya one Bok first 1 diagram RAM 1 32 for two hours order. Therefore, the data in the RAM 132 is accessed by the RC pointer 161, according to the time t when a certain time has elapsed in step S113. In step S114, the initial blood flow velocity v is calculated based on equation (3). In step S115, the initial cardiac output value CO is calculated according to equation (4). And blood flow velocity v. The parameter S is obtained from the relationship with Thus, the continuous CO x measurement is ready.
次に第 1 4 B図のフローチヤ一卜に従って、 C Ox を計算手 順を説明する。 この制御に入るまでに、 初期心拍出量 C O。 及 びパラメータ Sの測定が既に行なわれているものとする。 Next, the procedure for calculating C Ox will be described with reference to the flowchart of FIG. 14B. Before entering this control, the initial cardiac output C O. And the measurement of parameter S has already been performed.
ステヅプ S 80で測定装置 1 00が連続モードにあるか調べ る。 このモ一ドへは CONT I NUOUSスィッチ 64を押す ことにより移行する。 連続モードであれば、 ステップ S 8 1 で、 ローカル C P U 1 05に対して光通信路を介してサーミス タ 1の加熱を指示する。 ステップ S 82では、 サーミスタ 1が 加熱と冷却の熱平衡に達するのを待つ。 やがて、 ローカル CP Uからは、 Tt, Rt,Tb 等が送られてきて、 第 1 1図のフロー チヤ一卜により RAM 1 32に時間順に格納する。 そこで、 一 定時間経過したときの時間 tに従って RCボインタ 1 6 1によ り、 RAM 1 32内のデータをアクセスする。 ステヅプ S 84 では (3 ) 式に基づいて血流速 vx を演算する。 In step S80, check whether the measuring device 100 is in the continuous mode. You. Enter this mode by pressing the CONTINUOUS switch 64. In the continuous mode, in step S81, the local CPU 105 is instructed to heat the thermistor 1 via the optical communication path. In step S82, it waits for the thermistor 1 to reach the thermal equilibrium between heating and cooling. Eventually, T t , R t , Tb, etc. are sent from the local CPU, and are stored in the RAM 132 in chronological order according to the flowchart of FIG. Therefore, the data in the RAM 132 is accessed by the RC pointer 161, according to the time t when a certain time has elapsed. It calculates the blood flow velocity v x based on Sutedzupu in S 84 (3) expression.
ステップ S 86で、 違続モードが解除されていないかを確認 する。 これは、 血管断面積を表わすパラメータ Sは通常時間と ともに変化する。 従って、 一度血管断面積 Sをパラメータとし てホールドしても、 血管断面積 Sの変化によって、 正確な心拍 出量が得られなくなることが起こる。 そこで適宜に熱希釈法に より初期心拍出量 COを計測し、 次の連続的な CO x の計測に 備えるものである。 In step S86, it is checked whether the discontinuous mode has been released. This is because the parameter S representing the blood vessel cross-sectional area usually changes with time. Therefore, even if the blood vessel cross-sectional area S is once held as a parameter, an accurate cardiac output may not be obtained due to a change in the blood vessel cross-sectional area S. Therefore, the initial cardiac output CO is measured by the thermodilution method as appropriate to prepare for the next continuous measurement of CO x .
違続モードが解除されない限り、 ステップ S 87へ進み、 Unless the interruption mode is released, proceed to step S87,
C 0 V - S C 0 V-S
を演算する。 ステップ S 88では、 1 2時間分の経過を再生す る (第 8図) ときのために、 vx と C 0X の 1. 5分間の平均 値を演算する。 これらの値は、 RAM I 32内の領域 1 32 c に格納する。 そして、 ステップ S 90では、 次の C〇x を演算 するために、 R Cポインタを 1インクリメントする。 7 こうして、 Tt, Rt, Tb 等が送られてくる毎に、 C Ox 等を 連続的に演算することができる。 かくして、 血流速 vx のみの 測定で、 心拍出量 C Ox が測定できた。 Is calculated. In step S 88, 1 for when you play the course of 2 hours (Figure 8), calculates the average value of v x and C 0 X 1. 5 minutes. These values are stored in area 1 32 c in RAM I 32. In step S 90, in order to calculate the next C_〇 x, increments the RC pointer. 7 In this way, every time T t , R t , T b, etc. are sent, CO x, etc. can be calculated continuously. Thus, the cardiac output CO x was measured only by measuring the blood flow velocity v x .
〈データの記録〉 <Data recording>
本測定装置には、 第 4図, 第 5図の熱希釈曲線の記録及び熱 希釈数値の記録の他に、 C Ox の連続測定に並行しての測定値 をプロッタ 5 0に出力する連続記録機能 (スィッチ 5 6によ る) 、 過去 30分間の測定値をプロッタ 50に出力する記憶再 生機能 (スィッチ 55による) 、 過去 1 2時間の測定値 ( 3分 間毎の平均値) をプロッタ 50に出力する経過図出力機能 (ス イッチ 54による) 等の出力機能がある。 In addition to recording the thermodilution curves and thermodilution values shown in Figs. 4 and 5, this measuring device also has a continuous record that outputs the measured values to the plotter 50 in parallel with the continuous measurement of COx. Function (by switch 56), Memory playback function (by switch 55) that outputs measured values in the past 30 minutes to plotter 50, Plotter with measured values in the past 12 hours (average value every 3 minutes) There is an output function such as a progress chart output function that outputs to 50 (by switch 54).
連続記録及び記録再生による出力様式は、 第 6図 (紙送り速 度 1 0 m sノ分) 、 第 7図 ( 2 0 m sZ時) .に示す通りであ る。 The output format for continuous recording and recording / reproducing is as shown in Fig. 6 (for paper feed speed of 10 ms) and Fig. 7 (for 20 ms sZ).
第 8図に経過図の出力様式を示す。 この経過図では、 3時間 毎に C O (= C Ox ) と血液温度 BT ( = T¾ ) の値をグラフ と共に記録する。 Fig. 8 shows the output format of the progress chart. In this progress chart, the values of CO (= C Ox) and blood temperature BT (= T¾ ) are recorded every three hours together with the graph.
さて、 このような記録は連続モード (C O NT I NUO U S インディケ一タ 64が点灯しているとき) 行なわれるものであ るから、 プロッタ 50への出力と並行して、 ローカル C P U 1 0 5からのデータ取込み、 C Ox 等の演算 記憶等を行なわな くてはならない。 この制御のために、 RAM I 3 2へのァクセ スは、 第 1 0 B図に示すように、 プロッタ出力には P Cポイン タ 1 6 2を、 データ取込みには S Cポインタ 1 6 0を、 演算ノ 記憶には R Cポインタ 1 6 0を用いている。 Now, since such recording is performed in the continuous mode (when the CONT I NUO US indicator 64 is lit), the data is output from the local CPU 105 in parallel with the output to the plotter 50. Data must be fetched and operation and storage such as C Ox must be performed. For this control, access to RAM I32 is performed by PC pointer 162 for plotter output, SC pointer 166 for data capture, and arithmetic operation, as shown in Figure 10B. No The RC pointer 160 is used for storage.
〈指示液体温度の代用〉 <Substitute for the indicated liquid temperature>
カテ一テル 4から血管中に注入される指示液体は氷冷された 容器に入れられているので、 その温度は氷冷温度によってほと んど決定されるといってよい。 従って、 この氷冷温度が既知で あるとき (例えば、 零度) は、 その温度をもって指示液体温度 とみなして差.し支えない。 Since the indicator liquid injected into the blood vessel from the catheter 4 is contained in an ice-cooled container, it can be said that the temperature is almost determined by the ice-cooling temperature. Therefore, if the ice-cooling temperature is known (for example, zero degrees), that temperature may be considered as the indicated liquid temperature.
そのために、 本測定装置では温度プローブ 1 2が接続されて いないときは、 そのことを検知してスィヅチ 7 5にて設定され ている温度を液体温度 T i とみなして初期心拍出量 C 0。 の計 算に使う。 そこで、 温度プローブ 1 2のサ一ミスタ 1 2 aは定 電圧回路 1 0 1に接続されているから、 注入液体温度検知回路 1 0 2はサ一ミスタ 1 2 aに流れる電流を零と検出する。 この 零電流に対応する E i をローカル C P U 1 0 5が受けると、 こ の口一カル C P Uはメイン C P U 1 3 3に対して、 その旨の信 号を送る。 若しくは、 C P U 1 0 5はこの零電流に対応する E i を温度 T i に変換するときに有り得ない数値に変換して、 メイン C P U 1 3 3に送るようにする。 これらにより、 C P U 1 3 3は温度プローブ 1 2の未接続を検知できる。 Therefore, when the temperature probe 12 is not connected to the measurement device, the temperature is detected and the temperature set by the switch 75 is regarded as the liquid temperature T i, and the initial cardiac output C 0 is detected. . It is used to calculate Therefore, since the thermistor 12a of the temperature probe 12 is connected to the constant voltage circuit 101, the injection liquid temperature detection circuit 102 detects the current flowing through the thermistor 12a as zero. . When the local CPU 105 receives Ei corresponding to the zero current, the local CPU 105 sends a signal to that effect to the main CPU 133. Alternatively, CPU 105 converts the Ei corresponding to the zero current into an impossible value when converting it to the temperature Ti, and sends it to the main CPU133. As a result, CPU 133 can detect disconnection of temperature probe 12.
第 1 5図にこの制御手順を示す。 第 1 3図の、 メイン C P U 1 3 3が R AM 1 3 2内から T i を読出すというステップ S 5 2の代りに、 第 1 5図のステップ S 1 0 0で、 ローカル C P U 1 0 5から送られてきた T i はプローブ 1 2が未接続であるこ とを示すデータであるかを判断する。 接続状態を示すデ一夕で あれば、 ステヅプ S 1 0 1で、 この RAM 1 32内の T i を測 定に用いる。 未接続であれば、 ステップ S 1 02で、 スイッチ 75に設定されたデータを Ti として取込む。 Fig. 15 shows the control procedure. Instead of the step S52 in FIG. 13 in which the main CPU 133 reads T i from the RAM 1332, the local CPU 10 5 in the step S100 in FIG. It is determined whether or not T i sent from is data indicating that probe 12 is not connected. In a night showing the connection status If there is, in step S101, Ti in the RAM 132 is used for measurement. If not, in step S102, the data set in the switch 75 is taken in as Ti.
〈心拍出量の相対変化の測定〉 <Measurement of relative change in cardiac output>
以上述べてきた測定装置の実施例は、 熱希釈法により実際に 初期心拍出量値 C O。 を求め、 この C Oa と初期血流速 v。 と の関係からパラメ一夕 Sを求め、 以後は、 任意時刻の血流速 V X を測定するのみで、 連続的に心拍出量 C 0X が求められる ところに特徴がある。 即ち、 In the embodiment of the measuring apparatus described above, the initial cardiac output value CO is actually measured by the thermodilution method. Obtain this C Oa and the initial blood flow velocity v. The characteristic is that the parameter S is obtained from the relationship between and, and thereafter, the cardiac output C 0 X is continuously obtained only by measuring the blood flow velocity VX at an arbitrary time. That is,
C 0 X ∞ V X C 0 X ∞ V X
であり、 vx の変化は C 0X の相対的変化を反映する。 そこ で、 vx の変化を記録すれば、 それはそのまま C 0X の相対的 変化を記録したことになる。 一方、 上記心拍出量 C Oは被験者 が同じであり、 しかも測定者が測定に周知したものであればそ の大体の値が分っている。 そこで、 本実施例の測定装置では、 この大体の心拍出量 C Oをスィッチ 62から 「初期 C AL値」And the change in v x reflects the relative change in C 0 X. So, if we record the change in v x , it is the same as recording the relative change in C 0 X. On the other hand, the above-mentioned cardiac output CO is the same for the subjects, and if the measurer is familiar with the measurement, the approximate value is known. Therefore, in the measuring apparatus of the present embodiment, the approximate cardiac output CO is obtained from the switch 62 as the “initial CAL value”.
( = C 0。 ) として入力するようにし、 内部でこの C 0。 に基 づいてパラメータ Sを演算して、 熱希釈による初期心拍出量値 C 0。 の測定を省くことも可能なようにしている。 (= C0.) So that it is entered internally as C0. Calculates the parameter S based on the initial cardiac output C 0 due to thermodilution. Measurement can be omitted.
〈実験結果〉 <Experimental result>
第 9 A図, 第 9 B図に示した測定装置に第 2 A図に示した力 テ一テル 4を接続して、 この測定システムを、 1っは循璟モデ ル回路に適用して実験し、 1つは麻酔下の犬 ( 1 5 K gの雑種 成犬) による動物実験に用いた。 前者のモデル回路は、 恒温 槽, ポンプ等によって構成される。 後者の動物実験において は、 犬の右内頸静脈からカテーテル 4を挿入して肺動脈へ進め た。 本測定システムの結果を比較するために、 電磁血流計を用 いた。 循環モデル回路で得られた測定結果を第 1 9図に示す。 第 1 9図において、 横軸 (X軸) を電磁血流計を用いて得られ た心拍出量 (単位 LZm i n) とし、 縦軸 (Y軸) を本測定シ ステムを用いて得られた心拍出量とすると、 相僕関係は、 The force meter 4 shown in Fig. 2A was connected to the measurement device shown in Figs. 9A and 9B, and this measurement system was applied to a circulation model circuit. One was used for animal experiments with anesthetized dogs (adult dogs weighing 15 kg). The former model circuit is constant temperature It consists of a tank, a pump, etc. In the latter animal experiment, a catheter 4 was inserted through the right internal jugular vein of the dog and advanced to the pulmonary artery. An electromagnetic blood flow meter was used to compare the results of this measurement system. Fig. 19 shows the measurement results obtained by the circulation model circuit. In Fig. 19, the horizontal axis (X-axis) is the cardiac output (unit: LZmin) obtained by using an electromagnetic blood flow meter, and the vertical axis (Y-axis) is obtained by using this measurement system. If you have a high cardiac output,
Y = 0. 89 X + 0. 82 Y = 0.89 X + 0.82
であり、 相関係数は r = 0. 966 (サンプル数 = 1 8個) で あった。 一方、 動物実験における結果では、 相関関係は、 The correlation coefficient was r = 0.966 (the number of samples = 18). On the other hand, in the results of animal experiments, the correlation is
Y= l . 48 Χ-0. 78 Y = l. 48 Χ-0.78
であり、 相関係数は r = 0. 944 (サンプル数- 29個) で あった。 いずれの結果でも、 0〜4 L/m i nの領域で良好な 結果が得られた。 また、 0〜 10 LZm i nの高心拍出量領域 でも、 第 1 9図に示すように、 良い結果が確認された。 0〜 1 0 L/m i nの高心拍出量領域で良い結果が得られたのも、 A /Dコンバータ 1 04に 14ビヅ卜のものを使用したためと考 えられる。 The correlation coefficient was r = 0.944 (the number of samples-29). In each case, good results were obtained in the range of 0 to 4 L / min. Good results were also confirmed in the high cardiac output region of 0 to 10 LZmin, as shown in FIG. The reason why good results were obtained in the high cardiac output region of 0 to 10 L / min is probably because the A / D converter 104 used a 14-bit A / D converter.
<その他の希釈法への応用〉 <Application to other dilution methods>
上述した実施例の連続的な心拍出量測定は、 今までの説明か ら明らかなように、 一度、 初期心拍出量 COが何等かの方法で 測定されれば、 それから、 パラメータ sを測定 保持し、 以後 は、 血流速 vx を測定するのみで、 連続的に心拍出量 CO が 求められるところに特徴がある。 従って、 本発明においては、 上記実施例のような熱希釈法による測定で最初の心拍出量 C 0 を得るものに限られず、 例えば、 色素希釈法. 電解質希釈法等 によって最初の心拍出量 C 0。 を得るようにすることもでき る。 この場合、 色素希釈法では、 血液中の色素量は例えば耳た ぶ等で照度変化を測定することにより、 電解質希釈法では、 力 テ一テルに設けられた二本の電極により血液の抵抗値変化を測 定することにより、 心拍出量 C Oを得る。 The continuous cardiac output measurement of the above-described embodiment is, as is clear from the above description, once the initial cardiac output CO is measured by any method, and then the parameter s is set. Measurement is maintained. After that, only the blood flow velocity v x is measured, and the characteristic is that the cardiac output CO is continuously obtained. Therefore, in the present invention, The initial cardiac output C 0 is not limited to the one that obtains the initial cardiac output C 0 by the measurement using the thermodilution method as in the above-described embodiment. Can be obtained. In this case, in the dye dilution method, the amount of the dye in the blood is measured by measuring the change in illuminance with, for example, an earlobe. By measuring the change, the cardiac output CO is obtained.
即ち、 ①の補正定数 A ' のもととなるデータ量 (例えば、 F r , m l ) の入力機能は、 カテーテルを用いる指示薬希釈法 一般にも適用できる。 また、 ②の自動測定開始機能は、 上記の 照度変化、 抵抗値変化の変化点をとらえることにそのまま適用 される。 また、 ④の心拍出量の連続測定機能は一般的な指示薬 希釈法により得られた初期心拍出量 C O。 に基づいてパラメ一 夕 Sを求め、 その上で任意の時刻の血流速 v x から C O x を計 算することにも適用可能である。 In other words, the function of inputting the amount of data (eg, Fr, ml) based on the correction constant A 'in (1) can be applied to the indicator dilution method using a catheter in general. In addition, the automatic measurement start function in (2) is applied as it is to capture the change points of the illuminance change and the resistance value change. In addition, the continuous measurement function of the cardiac output in ④ is the initial cardiac output CO obtained by the general indicator dilution method. It is also applicable to calculate the parameter S based on the equation and then calculate CO x from the blood flow velocity v x at an arbitrary time.
更に他の変形, 修正として、 温度プローブ 1 2が接続されて いるか否かの検知として次のような機構を提案する。 即ち、 測 定装置本体のプローブのコネクタ 1 6を接続する部分に付勢さ れた突起を設ける。 コネクタ 1 6を接続すると、 この突起は押 されて引っ込む。 突起が押されると、 突起の端部が測定回路 1 2 0に、 例えば接地信号を与えるようにしておく。 測定回路 1 2 0は、 この接地信号の有無で、 プローブ 1 2の接続/未接続 を判断できる。 尚、 上記突起は、 その端部以外は回路 1 2 〇ど は電気的に絶縁されている。 これは、 回路 1 2 0全体を電気的 に浮かしておくためである。 As another modification or modification, the following mechanism is proposed for detecting whether or not the temperature probe 12 is connected. That is, a biased projection is provided at a portion of the measuring device body where the connector 16 of the probe is connected. When connector 16 is connected, this protrusion is pushed and retracted. When the projection is pressed, the end of the projection is to be supplied to the measuring circuit 120, for example, a ground signal. The measuring circuit 120 can determine the connection / non-connection of the probe 12 based on the presence or absence of the ground signal. The protrusions are electrically insulated from the circuit 12 except for the ends. This makes the entire circuit 120 electrically This is to keep it floating.
又他の変形例として、 サーミスタ 1による血液流速測定は定 電流下での熱平衡、 即ち、 サ一ミスタ抵抗変化を電圧などで検 出するのみならず、 血液温との温度格差を一定にするのに必要 な電流を流し、 その電流を測定してもよい。 つまり、 サーミス 夕温を生体に影響を及ぼさない上限 4 2 °Cにコントロールし て、 その電流を測定する方法などである。 また、 血液流速セン サはサ一ミス夕に限定されず、 他の手段でもよい。 As another modified example, measurement of blood flow velocity by thermistor 1 not only detects thermal equilibrium under a constant current, that is, detects a change in resistance of the thermistor by voltage or the like, but also makes the temperature difference with blood temperature constant. The necessary current may be applied to the device and the current may be measured. In other words, there is a method of measuring the current by controlling the thermistor temperature to the upper limit of 42 ° C which does not affect the living body. Further, the blood flow rate sensor is not limited to the short-time sensor, but may be other means.
尚、 当業者であれば、 上記実施例から種々の変形, 修正が可 能である。 従って、 本発明は、 上記実施例に限定されるもので はなく、 添付の請求の範囲に従って解釈されるべきであり、 こ の請求の範囲に均等なものは本発明に含まれる。 In addition, those skilled in the art can make various changes and modifications from the above embodiment. Therefore, the present invention is not limited to the above embodiments, but should be construed according to the appended claims, which are equivalent to the scope of the present invention.
Claims
Priority Applications (2)
| Application Number | Priority Date | Filing Date | Title |
|---|---|---|---|
| DE3853826T DE3853826T2 (en) | 1987-03-05 | 1988-03-04 | HEART FLOW MEASURING DEVICE. |
| EP88902239A EP0374248B1 (en) | 1987-03-05 | 1988-03-04 | Apparatus for measuring cardiac output |
Applications Claiming Priority (12)
| Application Number | Priority Date | Filing Date | Title |
|---|---|---|---|
| JP62/48826 | 1987-03-05 | ||
| JP62/48824 | 1987-03-05 | ||
| JP62/48825 | 1987-03-05 | ||
| JP62048821A JPS63216540A (en) | 1987-03-05 | 1987-03-05 | Apparatus for measuring heart rate output quantity |
| JP62048823A JPS63216536A (en) | 1987-03-05 | 1987-03-05 | Apparatus for measuring heart rate output quantity |
| JP62/48822 | 1987-03-05 | ||
| JP62048824A JPS63216537A (en) | 1987-03-05 | 1987-03-05 | Apparatus for measuring heart rate output quantity |
| JP62/48821 | 1987-03-05 | ||
| JP62/48823 | 1987-03-05 | ||
| JP62048825A JPS63216538A (en) | 1987-03-05 | 1987-03-05 | Apparatus for continuously measuring and recording heart rate output quantity |
| JP4882287 | 1987-03-05 | ||
| JP62048826A JPS63216539A (en) | 1987-03-05 | 1987-03-05 | Apparatus for continuously measuring relative change of heart rate output quantity |
Publications (1)
| Publication Number | Publication Date |
|---|---|
| WO1988006426A1 true WO1988006426A1 (en) | 1988-09-07 |
Family
ID=27550334
Family Applications (1)
| Application Number | Title | Priority Date | Filing Date |
|---|---|---|---|
| PCT/JP1988/000239 Ceased WO1988006426A1 (en) | 1987-03-05 | 1988-03-04 | Apparatus for measuring cardiac output |
Country Status (4)
| Country | Link |
|---|---|
| US (1) | US5046505A (en) |
| EP (3) | EP0374248B1 (en) |
| DE (3) | DE3856499T2 (en) |
| WO (1) | WO1988006426A1 (en) |
Cited By (2)
| Publication number | Priority date | Publication date | Assignee | Title |
|---|---|---|---|---|
| US5928155A (en) * | 1997-01-24 | 1999-07-27 | Cardiox Corporation | Cardiac output measurement with metabolizable analyte containing fluid |
| US6299583B1 (en) | 1998-03-17 | 2001-10-09 | Cardiox Corporation | Monitoring total circulating blood volume and cardiac output |
Families Citing this family (17)
| Publication number | Priority date | Publication date | Assignee | Title |
|---|---|---|---|---|
| US6387052B1 (en) | 1991-01-29 | 2002-05-14 | Edwards Lifesciences Corporation | Thermodilution catheter having a safe, flexible heating element |
| US5720293A (en) * | 1991-01-29 | 1998-02-24 | Baxter International Inc. | Diagnostic catheter with memory |
| US5217019A (en) * | 1991-12-27 | 1993-06-08 | Abbott Laboratories | Apparatus and method for continuously monitoring cardiac output |
| US5305760A (en) * | 1992-02-07 | 1994-04-26 | Interflo Medical Inc. | Method for rejecting electrical interference from physiological measurements |
| US5390679A (en) * | 1993-06-03 | 1995-02-21 | Eli Lilly And Company | Continuous cardiac output derived from the arterial pressure waveform using pattern recognition |
| EP0640978A3 (en) * | 1993-08-31 | 1998-10-07 | Ohmeda Inc. | Non-invasive software update apparatus |
| US5425375A (en) * | 1993-09-09 | 1995-06-20 | Cardiac Pathways Corporation | Reusable medical device with usage memory, system using same |
| GB9503787D0 (en) * | 1995-02-24 | 1995-04-12 | Monitoring Tech Ltd | A method of and apparatus for analysing a signal |
| US5620002A (en) * | 1995-12-22 | 1997-04-15 | Abbott Critical Care Systems | Method for correcting thermal drift in cardiac output determination |
| US6113548A (en) * | 1997-02-11 | 2000-09-05 | Deboisblanc; Bennet P. | Method and apparatus for estimation of beat-to-beat pulmonary wedge pressure |
| US6155984A (en) * | 1999-04-15 | 2000-12-05 | Transonic Systems, Inc. | Method and apparatus for measuring cardiac output through an arterial cannula |
| US6551250B2 (en) | 2001-03-29 | 2003-04-22 | Hassan Khalil | Transit time thermodilution guidewire system for measuring coronary flow velocity |
| US20060064059A1 (en) * | 2004-09-21 | 2006-03-23 | Mark Gelfand | Treatment of infarct expansion by partially occluding vena cava |
| US7998082B2 (en) | 2007-09-07 | 2011-08-16 | Pronk Technologies, Inc. | Thermo-dilution cardiac output measurement simulator |
| US9320642B1 (en) * | 2012-06-04 | 2016-04-26 | The Surgical Company International B.V. | Method of and system for selecting patient temperature regulation tools |
| SG11201908668YA (en) | 2017-03-21 | 2019-10-30 | Abiomed Inc | System and method for determining native cardiac output while continuing support to the heart with a catheter-mounted intracardiac blood pump having an imbedded thermistor |
| US20250020353A1 (en) * | 2023-07-12 | 2025-01-16 | Brandon Rodgers | Distributed air flow method and system |
Citations (6)
| Publication number | Priority date | Publication date | Assignee | Title |
|---|---|---|---|---|
| JPS51185A (en) * | 1974-05-24 | 1976-01-05 | Contraves Ag | Saamo dairyuushonhonyori shinzo jikan yoryoosadamerutameno chokusetsuhyojisochi |
| JPS5110690A (en) * | 1974-07-15 | 1976-01-28 | Daiya Med Syst | |
| JPS5455144A (en) * | 1977-10-12 | 1979-05-02 | Mitsui Constr | Method of and device for processing medical inspection data |
| JPS57182656A (en) * | 1981-05-06 | 1982-11-10 | Nissin Electric Co Ltd | Trigger device |
| JPS5761413B2 (en) * | 1979-04-13 | 1982-12-24 | Tadashi Akanuma | |
| JPS61125329A (en) * | 1984-11-21 | 1986-06-13 | テルモ株式会社 | Heart pulse output measuring apparatus |
Family Cites Families (24)
| Publication number | Priority date | Publication date | Assignee | Title |
|---|---|---|---|---|
| US3438253A (en) * | 1966-11-15 | 1969-04-15 | Frederick W Kuether | Thermal device for measuring direction and velocity of fluid flow |
| US3595079A (en) * | 1967-11-13 | 1971-07-27 | Univ Northwestern | Fluid flow velocity measuring apparatus |
| US3651318A (en) * | 1970-01-26 | 1972-03-21 | Jan A Czekajewski | Cardiac output computer |
| US3678922A (en) * | 1971-01-14 | 1972-07-25 | Univ Temple | Dilution method and apparatus for measurement of fluid flow rate |
| US3789831A (en) * | 1972-02-11 | 1974-02-05 | D Kopaniky | Thermoelectric probe apparatus for tissue fluid flow measurement |
| US3820530A (en) * | 1973-02-16 | 1974-06-28 | Gifford Instr Labor Inc | Cardiac output measuring method and apparatus |
| FR2291731A1 (en) * | 1974-11-20 | 1976-06-18 | Obermajer Wladimir | METHOD AND DEVICE FOR MEASURING HEART CAPACITY |
| US3995623A (en) * | 1974-12-23 | 1976-12-07 | American Hospital Supply Corporation | Multipurpose flow-directed catheter |
| US4015593A (en) * | 1975-03-24 | 1977-04-05 | Elings Virgil B | Apparatus and method for measuring cardiac output |
| US3987788A (en) * | 1975-07-09 | 1976-10-26 | American Hospital Supply Corporation | System for computing cardiac flow rates from thermodilution measurements |
| GB2032623A (en) * | 1978-04-10 | 1980-05-08 | Hewlett Packard Co | Derivation of Steady Values of Blood Pressures |
| US4240441A (en) * | 1978-10-10 | 1980-12-23 | The United States Of America As Represented By The Secretary Of The Navy | Carotid thermodilution catheter |
| US4230126A (en) * | 1978-11-20 | 1980-10-28 | Elings Virgil B | Apparatus and method for measuring extravascular lung water |
| US4380237A (en) * | 1979-12-03 | 1983-04-19 | Massachusetts General Hospital | Apparatus for making cardiac output conductivity measurements |
| US4407298A (en) * | 1981-07-16 | 1983-10-04 | Critikon Inc. | Connector for thermodilution catheter |
| US4572206A (en) * | 1982-04-21 | 1986-02-25 | Purdue Research Foundation | Method and apparatus for measuring cardiac output |
| US4502488A (en) * | 1983-01-13 | 1985-03-05 | Allied Corporation | Injection system |
| US4509526A (en) * | 1983-02-08 | 1985-04-09 | Lawrence Medical Systems, Inc. | Method and system for non-invasive ultrasound Doppler cardiac output measurement |
| US4542748A (en) * | 1983-03-07 | 1985-09-24 | American Hospital Supply Corp. | Apparatus and method for measuring cardiac output |
| NL189547C (en) * | 1983-04-12 | 1993-05-17 | Univ Erasmus | SYSTEM FOR DETERMINING THE CURRENT STRENGTH OF A PATIENT'S HEART. |
| US4621646A (en) * | 1983-12-15 | 1986-11-11 | The United States Of America As Represented By The Secretary Of The Army | Blood flow measuring method |
| US4632125A (en) * | 1984-01-13 | 1986-12-30 | American Hospital Supply Corp. | Right heart ejection fraction and cardiac output catheter |
| US4637401A (en) * | 1984-11-01 | 1987-01-20 | Johnston G Gilbert | Volumetric flow rate determination in conduits not directly accessible |
| JPS62207435A (en) * | 1986-03-07 | 1987-09-11 | テルモ株式会社 | Catheter for measuring cardiac output |
-
1988
- 1988-03-04 US US07/415,298 patent/US5046505A/en not_active Expired - Lifetime
- 1988-03-04 EP EP88902239A patent/EP0374248B1/en not_active Expired - Lifetime
- 1988-03-04 DE DE3856499T patent/DE3856499T2/en not_active Expired - Fee Related
- 1988-03-04 DE DE3853826T patent/DE3853826T2/en not_active Expired - Fee Related
- 1988-03-04 EP EP93119022A patent/EP0596539B1/en not_active Expired - Lifetime
- 1988-03-04 DE DE3856390T patent/DE3856390T2/en not_active Expired - Fee Related
- 1988-03-04 EP EP93119023A patent/EP0599314B1/en not_active Expired - Lifetime
- 1988-03-04 WO PCT/JP1988/000239 patent/WO1988006426A1/en not_active Ceased
Patent Citations (6)
| Publication number | Priority date | Publication date | Assignee | Title |
|---|---|---|---|---|
| JPS51185A (en) * | 1974-05-24 | 1976-01-05 | Contraves Ag | Saamo dairyuushonhonyori shinzo jikan yoryoosadamerutameno chokusetsuhyojisochi |
| JPS5110690A (en) * | 1974-07-15 | 1976-01-28 | Daiya Med Syst | |
| JPS5455144A (en) * | 1977-10-12 | 1979-05-02 | Mitsui Constr | Method of and device for processing medical inspection data |
| JPS5761413B2 (en) * | 1979-04-13 | 1982-12-24 | Tadashi Akanuma | |
| JPS57182656A (en) * | 1981-05-06 | 1982-11-10 | Nissin Electric Co Ltd | Trigger device |
| JPS61125329A (en) * | 1984-11-21 | 1986-06-13 | テルモ株式会社 | Heart pulse output measuring apparatus |
Non-Patent Citations (1)
| Title |
|---|
| See also references of EP0374248A4 * |
Cited By (2)
| Publication number | Priority date | Publication date | Assignee | Title |
|---|---|---|---|---|
| US5928155A (en) * | 1997-01-24 | 1999-07-27 | Cardiox Corporation | Cardiac output measurement with metabolizable analyte containing fluid |
| US6299583B1 (en) | 1998-03-17 | 2001-10-09 | Cardiox Corporation | Monitoring total circulating blood volume and cardiac output |
Also Published As
| Publication number | Publication date |
|---|---|
| EP0599314A2 (en) | 1994-06-01 |
| EP0599314A3 (en) | 1997-10-01 |
| DE3853826T2 (en) | 1995-10-12 |
| US5046505A (en) | 1991-09-10 |
| EP0596539B1 (en) | 2000-01-12 |
| DE3856390D1 (en) | 2000-02-17 |
| EP0596539A3 (en) | 1997-10-01 |
| EP0374248A1 (en) | 1990-06-27 |
| EP0599314B1 (en) | 2001-10-24 |
| DE3856499T2 (en) | 2002-07-11 |
| DE3856499D1 (en) | 2001-11-29 |
| DE3853826D1 (en) | 1995-06-22 |
| EP0374248A4 (en) | 1991-05-15 |
| DE3856390T2 (en) | 2000-07-27 |
| EP0374248B1 (en) | 1995-05-17 |
| EP0596539A2 (en) | 1994-05-11 |
Similar Documents
| Publication | Publication Date | Title |
|---|---|---|
| WO1988006426A1 (en) | Apparatus for measuring cardiac output | |
| JP2577984B2 (en) | Blood pressure measurement device | |
| JPS62207435A (en) | Catheter for measuring cardiac output | |
| JPH0562539B2 (en) | ||
| JPH0368690B2 (en) | ||
| CN102196766B (en) | Electronic sphygmomanometer | |
| US20070239041A1 (en) | Non-invasive Venous Pressure Measurement | |
| JPH02501272A (en) | Temperature probe used for diagnostics | |
| JPH0467856B2 (en) | ||
| JPH02185232A (en) | Bio-information measuring device | |
| US20110092830A1 (en) | method for automatic error detection in pressure measurement and an electronic sphygmomanometer | |
| CN114521874A (en) | Orthostatic hypotension measurement method and related equipment | |
| JP4949575B2 (en) | Physiological event detector and its operation program | |
| JPH0467857B2 (en) | ||
| US20080075143A1 (en) | Digital thermometers with audible feedback | |
| JPH0467854B2 (en) | ||
| CN113413553B (en) | Ultrasonic coupling liquid output method, device, equipment and storage medium | |
| JPH0467853B2 (en) | ||
| US20110190602A1 (en) | Method for measuring blood oxygen at a finger and finger-clipped oximeter | |
| JPH0467855B2 (en) | ||
| JP2008012230A (en) | Pulse wave output device and program | |
| CN114778631B (en) | Body index detection device and method | |
| JPS63216538A (en) | Apparatus for continuously measuring and recording heart rate output quantity | |
| US20090182238A1 (en) | Method of predicting a blood pressure trend by blood pressure measurements | |
| US20070073180A1 (en) | Apparatus, computer system and computer program for determining cardio-vascular parameters |
Legal Events
| Date | Code | Title | Description |
|---|---|---|---|
| AK | Designated states |
Kind code of ref document: A1 Designated state(s): US |
|
| AL | Designated countries for regional patents |
Kind code of ref document: A1 Designated state(s): BE DE FR GB IT NL SE |
|
| WWE | Wipo information: entry into national phase |
Ref document number: 1988902239 Country of ref document: EP |
|
| WWP | Wipo information: published in national office |
Ref document number: 1988902239 Country of ref document: EP |
|
| WWG | Wipo information: grant in national office |
Ref document number: 1988902239 Country of ref document: EP |