US8727992B2 - Ultrasonic doppler diagnostic apparatus, and method of controlling ultrasonic doppler diagnostic apparatus - Google Patents
Ultrasonic doppler diagnostic apparatus, and method of controlling ultrasonic doppler diagnostic apparatus Download PDFInfo
- Publication number
- US8727992B2 US8727992B2 US11/756,261 US75626107A US8727992B2 US 8727992 B2 US8727992 B2 US 8727992B2 US 75626107 A US75626107 A US 75626107A US 8727992 B2 US8727992 B2 US 8727992B2
- Authority
- US
- United States
- Prior art keywords
- flow velocity
- specimen
- diagnostic apparatus
- ultrasonic
- flow
- Prior art date
- Legal status (The legal status is an assumption and is not a legal conclusion. Google has not performed a legal analysis and makes no representation as to the accuracy of the status listed.)
- Active, expires
Links
- 238000000034 method Methods 0.000 title claims description 49
- 229940079593 drug Drugs 0.000 claims abstract description 52
- 239000003814 drug Substances 0.000 claims abstract description 52
- 230000017531 blood circulation Effects 0.000 claims abstract description 44
- 230000008859 change Effects 0.000 claims description 10
- 239000000284 extract Substances 0.000 claims description 9
- 230000002123 temporal effect Effects 0.000 claims description 9
- 238000000605 extraction Methods 0.000 claims description 3
- 238000009966 trimming Methods 0.000 claims 4
- 210000004351 coronary vessel Anatomy 0.000 description 33
- 238000010586 diagram Methods 0.000 description 29
- 230000005540 biological transmission Effects 0.000 description 25
- 239000000523 sample Substances 0.000 description 20
- 238000007689 inspection Methods 0.000 description 16
- 238000012545 processing Methods 0.000 description 15
- 238000001228 spectrum Methods 0.000 description 13
- 238000011156 evaluation Methods 0.000 description 9
- 238000005259 measurement Methods 0.000 description 9
- 238000013500 data storage Methods 0.000 description 8
- 238000012552 review Methods 0.000 description 8
- 230000007704 transition Effects 0.000 description 6
- 238000001514 detection method Methods 0.000 description 5
- 230000008901 benefit Effects 0.000 description 4
- 230000003111 delayed effect Effects 0.000 description 4
- 230000008569 process Effects 0.000 description 4
- 230000000630 rising effect Effects 0.000 description 4
- 230000005856 abnormality Effects 0.000 description 3
- 238000003745 diagnosis Methods 0.000 description 3
- 230000033001 locomotion Effects 0.000 description 3
- 230000004048 modification Effects 0.000 description 3
- 238000012986 modification Methods 0.000 description 3
- 230000002107 myocardial effect Effects 0.000 description 3
- 230000002463 transducing effect Effects 0.000 description 3
- 201000000057 Coronary Stenosis Diseases 0.000 description 2
- 206010020565 Hyperaemia Diseases 0.000 description 2
- OIRDTQYFTABQOQ-KQYNXXCUSA-N adenosine Chemical compound C1=NC=2C(N)=NC=NC=2N1[C@@H]1O[C@H](CO)[C@@H](O)[C@H]1O OIRDTQYFTABQOQ-KQYNXXCUSA-N 0.000 description 2
- 238000004458 analytical method Methods 0.000 description 2
- 238000013459 approach Methods 0.000 description 2
- 238000004364 calculation method Methods 0.000 description 2
- 238000012937 correction Methods 0.000 description 2
- 201000010099 disease Diseases 0.000 description 2
- 208000037265 diseases, disorders, signs and symptoms Diseases 0.000 description 2
- 210000005240 left ventricle Anatomy 0.000 description 2
- 230000002093 peripheral effect Effects 0.000 description 2
- 238000002360 preparation method Methods 0.000 description 2
- 208000022064 reactive hyperemia Diseases 0.000 description 2
- 210000005241 right ventricle Anatomy 0.000 description 2
- 238000010967 transthoracic echocardiography Methods 0.000 description 2
- 239000002126 C01EB10 - Adenosine Substances 0.000 description 1
- JRWZLRBJNMZMFE-UHFFFAOYSA-N Dobutamine Chemical compound C=1C=C(O)C(O)=CC=1CCNC(C)CCC1=CC=C(O)C=C1 JRWZLRBJNMZMFE-UHFFFAOYSA-N 0.000 description 1
- 229960005305 adenosine Drugs 0.000 description 1
- 239000000556 agonist Substances 0.000 description 1
- 210000002565 arteriole Anatomy 0.000 description 1
- 230000015572 biosynthetic process Effects 0.000 description 1
- 230000000747 cardiac effect Effects 0.000 description 1
- 238000006243 chemical reaction Methods 0.000 description 1
- 208000029078 coronary artery disease Diseases 0.000 description 1
- 230000003247 decreasing effect Effects 0.000 description 1
- IZEKFCXSFNUWAM-UHFFFAOYSA-N dipyridamole Chemical compound C=12N=C(N(CCO)CCO)N=C(N3CCCCC3)C2=NC(N(CCO)CCO)=NC=1N1CCCCC1 IZEKFCXSFNUWAM-UHFFFAOYSA-N 0.000 description 1
- 229960002768 dipyridamole Drugs 0.000 description 1
- 238000006073 displacement reaction Methods 0.000 description 1
- 229960001089 dobutamine Drugs 0.000 description 1
- 208000019622 heart disease Diseases 0.000 description 1
- 230000006872 improvement Effects 0.000 description 1
- 208000028867 ischemia Diseases 0.000 description 1
- 210000000056 organ Anatomy 0.000 description 1
- 230000036284 oxygen consumption Effects 0.000 description 1
- 230000000241 respiratory effect Effects 0.000 description 1
- 230000004044 response Effects 0.000 description 1
- 230000002889 sympathetic effect Effects 0.000 description 1
- 238000003786 synthesis reaction Methods 0.000 description 1
- 238000003325 tomography Methods 0.000 description 1
- 238000013175 transesophageal echocardiography Methods 0.000 description 1
- 238000002604 ultrasonography Methods 0.000 description 1
- 230000002541 vasodepressive effect Effects 0.000 description 1
- 239000002699 waste material Substances 0.000 description 1
Images


Classifications
-
- A—HUMAN NECESSITIES
- A61—MEDICAL OR VETERINARY SCIENCE; HYGIENE
- A61B—DIAGNOSIS; SURGERY; IDENTIFICATION
- A61B8/00—Diagnosis using ultrasonic, sonic or infrasonic waves
- A61B8/06—Measuring blood flow
Definitions
- the present invention relates to an ultrasonic Doppler diagnostic apparatus, and more particularly, it relates to an ultrasonic Doppler diagnostic apparatus used to diagnose the function of a specimen on the basis of a change in velocity information over time within the specimen, and to a method of controlling the ultrasonic Doppler diagnostic apparatus.
- a coronary flow reserve is used as an index indicating the ability to increase a coronary blood flow in accordance with an increase in myocardial oxygen consumption, and is shown by a ratio of a coronary blood flow value at peak coronary dilatation to a coronary blood flow at rest. If the blockage of the blood flow is cancelled after a temporary blockage of the coronary blood flow, reactive hyperemia is shown in which coronary arterioles and capillaries distend at the maximum in response to ischemia. This ratio of the peak coronary blood flow during the reactive hyperemia to the coronary blood flow value at rest is referred to as the coronary flow reserve.
- adenosine, dipyridamole, etc. have been used as coronary vasodepressors, and dobutamine, etc. have been used as sympathetic agonists, and the coronary flow reserve is evaluated from a ratio between coronary blood flow velocities before and after the load of these drugs.
- the coronary blood flow reserve is said to reflect the functional degree of coronary stenosis in coronary artery disease.
- One of the representative methods of evaluating such a coronary flow reserve is, for example, an intravascular Doppler method as disclosed in Japanese Patent No. 2863624.
- this method is an invasive method and thus has many restrictions.
- transesophageal echocardiography is implemented as means for noninvasively evaluating the coronary flow reserve.
- this is a noninvasive method, the burden on a patient is too heavy.
- noninvasive transthoracic echocardiography has recently been the most popular method.
- an operator extracts a long axis view of left ventricle through apex cordis approach in a B mode, and then gradually rotates a probe counterclockwise, thus starting a scan so that right ventricle is reduced and the anterior interventricular groove is extracted. Then, the transition is made to a color mode. In the color mode, a left anterior descending coronary artery (LAD) appears and disappears outside the anterior myocardial epicardium in the vicinity of the apex of heart.
- LAD left anterior descending coronary artery
- LAD left anterior descending coronary artery
- PWD pulse Doppler
- the operator saves a still image of the left anterior descending coronary artery before a drug load. Then, a drug is administered, and the operator continues an inspection (ultrasonic scan) while observing that there is no abnormality in the change of condition of the patient under the drug load. After several minutes, if the operator confirms a gradual increase in the velocity of blood flow in the left anterior descending coronary artery of the patient, the operator adjusts the velocity range and base line position of the apparatus accordingly.
- time is not constant which passes before the peak blood flow velocity is registered in the left anterior descending coronary artery after the drug load.
- the reason is that the time varies depending on the build, constitution, physical condition and condition of the disease of a patient, and it is impossible under the present situation for the operator to know when the patient registers the peak blood flow velocity value.
- the operator needs to frequently repeat the operation of saving still images because a current velocity waveform of the left anterior descending coronary artery being displayed on the monitor of the ultrasonic diagnostic apparatus may be registering the peak flow velocity value of the patient after the drug load.
- the operator continues to periodically save still images until the time when the peak flow velocity value seems to be registered (until the time when a decrease in the flow velocity value can be recognized), and then the operator terminates the inspection.
- an image before the drug load as shown in FIG. 1A (an LAD blood flow waveform a, an ECG waveform b) is read and selected from within the ultrasonic diagnostic apparatus, and a blood flow velocity value is found using a measurement function.
- a plurality of images after the drug load as shown in FIG. 1B are read, and an image is selected from those images which seems to register the peak flow velocity value, and then the peak flow velocity value is found in the same manner using the measurement function.
- the coronary flow reserve is found from those two data as shown in FIGS. 1A and 1B .
- the value of the coronary flow reserve can be found by B/A, where A is the velocity before the drug load (at rest), and B is the velocity after the drug load (at the peak flow velocity).
- the blood flow velocity value before the drug load remains stable, and is therefore relatively easy to select and measure in many cases.
- various velocity ranges and the base lines are often set, as shown in FIGS. 2A to 2D . Therefore, as shown in FIG. 3 , so much time is required and the throughput of the diagnosis is decreased in order for the operator to accurately extract an image registering the peak flow velocity value from a plurality of (N) images.
- Jpn. Pat. Appln. KOKAI Publication No. 2005-185731 has proposed an apparatus which founds shift amounts of the velocity range and the base line in image display and changes parameters by adjusting means for the velocity range and the base line.
- Still another method which performs multi-review display, displays acquired still images at a time, and extracts one from those still images, in order to increase the throughput of extracting an image indicating the peak flow velocity value from the plurality of still images after the drug load.
- a waveform obtained in accordance with the pulse Doppler method is displayed together with a cross-sectional image in a mode such as the B mode or color mode, so that an image indicating the waveform of the flow velocity is small as such. Therefore, it is often impossible to accurately select and extract the image indicating, for example, the peak flow velocity value.
- Methods of measuring the flow velocity value necessary for the evaluation of the coronary flow reserve include, for example, (i) a method implemented using the automatic tracing function, and (ii) a method which visually selects an image corresponding to the peak flow velocity value from a plurality of images arranged in the multi-review display and detects a velocity using the measurement function.
- these methods have problems such as lack of reliability in the accuracy of measurement due to the influence of clutter, and much time spent on the measurement of the flow velocity due to complicated operation methods.
- a first invention concerns an ultrasonic Doppler diagnostic apparatus provided with a display unit, the apparatus sending ultrasonic waves to a specimen, receiving a reflection signal of the ultrasonic waves from the specimen to detect a Doppler signal and obtain information on flow velocities in the specimen, and displaying the flow velocity information on the display unit, the apparatus comprising:
- an adjustment unit which adjusts the flow velocity information acquired at different time points to the same velocity range
- control unit which controls the display unit to display the flow velocity information adjusted to the same velocity range.
- a second invention concerns an ultrasonic Doppler diagnostic apparatus provided with a display unit, the apparatus sending ultrasonic waves to a specimen, receiving a reflection signal of the ultrasonic waves from the specimen to detect a Doppler signal and obtain information on flow velocities in the specimen, and displaying the flow velocity information on the display unit, the apparatus comprising:
- an extraction unit which extracts, in a plurality of heartbeats, a flow velocity value at one time point within one heartbeat in the flow velocity information
- control unit which controls the display unit to draw temporal changes in a plurality of flow velocity values extracted in the plurality of heartbeats.
- a third invention concerns a method of controlling an ultrasonic Doppler diagnostic apparatus, the method comprising the steps of: sending ultrasonic waves to a specimen;
- a fourth invention concerns a method of controlling an ultrasonic Doppler diagnostic apparatus, the method comprising the steps of: sending ultrasonic waves to a specimen;
- an ultrasonic Doppler diagnostic apparatus and a method of controlling the ultrasonic Doppler diagnostic apparatus, the ultrasonic Doppler diagnostic apparatus being equipped with a coronary flow reserve evaluation support system capable of reducing a burden on an operator in evaluating a coronary flow reserve by transthoracic echo and reducing time for diagnosing the coronary flow reserve to increase throughput.
- FIGS. 1A and 1B explain a conventional ultrasonic diagnostic apparatus, wherein FIG. 1A is a diagram showing an image of a blood flow waveform before a drug load, and FIG. 1B is a diagram showing an image of a peak flow velocity value after the drug load;
- FIGS. 2A to 2D are diagrams showing a plurality of captured images of blood flow waveforms
- FIG. 3 explains a search method according to the conventional ultrasonic diagnostic apparatus, and is a diagram showing an example of a plurality of captured images
- FIG. 4 is a diagram for explaining the measurement of the blood flow waveforms by a conventional automatic tracing function
- FIG. 5 is a diagram for explaining an example of the search method using a multi-review display according to the conventional ultrasonic diagnostic apparatus
- FIG. 6 is a block diagram showing the entire configuration of an ultrasonic Doppler diagnostic apparatus in a first embodiment of the present invention
- FIG. 7 is a block diagram showing the configurations of a transmission/reception unit and a data generating unit constituting the ultrasonic diagnostic apparatus in FIG. 6 ;
- FIG. 8 is a flowchart explaining the operation of the ultrasonic Doppler diagnostic apparatus in the first embodiment of the present invention.
- FIGS. 9A and 9B are diagrams explaining an example in which a plurality of captured images obtained by the ultrasonic Doppler diagnostic apparatus in the first embodiment of the present invention are displayed so that velocity ranges of these images are adjusted to a uniform velocity range;
- FIG. 10 is a diagram showing an example of a multi-review display, on a display unit 30 , of images showing the blood flow waveforms before the drug load and images of waveforms of the peak flow velocity value;
- FIGS. 11A and 11B show a coronary flow peak diastole velocity curve in a left anterior descending coronary artery (LAD) in which times are plotted on a horizontal axis and flow velocity values are plotted on a vertical axis
- FIG. 11A is a diagram shown in real-time display with an ordinary time axis in accordance with a pulse Doppler method
- FIG. 11B is a diagram showing one data for one heartbeat on a time axis in accordance with the pulse Doppler method
- FIG. 12 is a flowchart explaining the operation of the ultrasonic Doppler diagnostic apparatus in a second embodiment of the present invention.
- FIG. 13 is a diagram showing an example in which the display unit 30 displays a screen 110 for a real-time locus curve including an ECG waveform, a display screen 112 for the whole locus curve, and a display screen 114 for a left anterior descending coronary artery targeted for inspection;
- FIG. 14 is a diagram showing an example of a caution mark 118 such as “CFPDV PASS” indicating that the peak flow velocity value has been reached;
- FIG. 15 is a diagram showing one example of a coronary flow peak diastole velocity curve
- FIG. 16 is a diagram showing a locus curve of a coronary flow reserve (CFR) in a time direction, which indicates a ratio of the peak flow velocity value at every heartbeat of the moment to the flow velocity value in a steady state before the drug load in FIG. 15 ;
- CFR coronary flow reserve
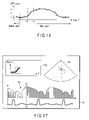
- FIG. 17 is a diagram showing one example in which the coronary flow peak diastole velocity curve is displayed together with image displays in a B mode, a color mode and a PWD mode;
- FIG. 18 is a diagram showing an example of a state (state where an ultrasonic scan has been terminated) after several minutes have passed from the state of the screen display shown in FIG. 17 ;
- FIG. 19 is a diagram showing an example of a state after completion of the scan displayed in a magnified form.
- FIG. 20 is a diagram showing an example of acquiring a flow velocity value at a time delayed by ⁇ t time using R waves as a trigger when an ECG signal is used.
- FIG. 6 is a block diagram showing the entire configuration of an ultrasonic Doppler diagnostic apparatus in the present embodiment
- FIG. 7 is a block diagram showing the configurations of a transmission/reception unit and a data generating unit constituting the ultrasonic diagnostic apparatus.
- an ultrasonic Doppler diagnostic apparatus 10 comprises an ultrasonic probe 20 , a transmission/reception unit 40 , a data generating unit 60 , a data processing/storage unit 90 , and a display unit 30 .
- the ultrasonic probe 20 sends/receives ultrasonic waves to/from an unshown specimen.
- the transmission/reception unit 40 sends/receives electric signals to/from the ultrasonic probe 20 .
- the data generating unit 60 processes the received signal obtained from the transmission/reception unit 40 , and generates B mode data, color Doppler data, and a Doppler spectrum.
- the data processing/storage unit 90 saves the data generated in the data generating unit 60 .
- the data processing/storage unit 90 also generates two-dimensional B mode image data, color Doppler image data and spectrum data, and uses this spectrum data to generate and save cine data.
- the display unit 30 displays the B mode image data, the color Doppler image data and the spectrum data generated in the data processing/storage unit 90 .
- the display unit 30 can also perform a multi-review display of a plurality of still images obtained in a data processing unit 28 during an inspection.
- the ultrasonic Doppler diagnostic apparatus 10 also comprises an acoustic output control unit 100 for controlling transmission acoustic outputs in ultrasound tomography and an ultrasonic Doppler spectrum method, a reference signal generating unit 12 , an input unit 32 , and a system control unit 36 .
- the ultrasonic Doppler diagnostic apparatus 10 is separately provided with an ECG unit 34 for collecting electrocardiographic waveforms of the specimen.
- the reference signal generating unit 12 generates continuous waves having a frequency substantially equal to the center frequency of ultrasonic pulses or a frequency (fo) of ultrasonic continuous waves, or rectangular waves, for the transmission/reception unit 40 or the data generating unit 60 .
- Specimen information, setting conditions, command signals, etc. are input to the input unit 32 by an operator.
- the system control unit 36 performs overall control of the respective units in the ultrasonic Doppler diagnostic apparatus 10 .
- the ultrasonic probe 20 brings its front surface into contact with the surface of the specimen to send/receive ultrasonic waves.
- This ultrasonic probe 20 has at its distal end a plurality of (N) small piezoelectric vibrators one-dimensionally arranged. These piezoelectric vibrators are electric acoustic transducing elements, and have a function of transducing electric pulses or continuous waves into transmission ultrasonic waves during transmission and transducing ultrasonic reflected waves (received ultrasonic waves) into an electric signal (reception signal) during reception.
- This ultrasonic probe 20 has a small and light configuration, and is connected to the transmission/reception unit 40 via an unshown cable.
- the ultrasonic probe 20 has adaptability to a sector scan, a linear scan, a convex scan, etc., and one of these scans is selected depending on a region to be diagnosed. A case will be described below where the ultrasonic probe 20 is used which is adapted to the sector scan aimed at the diagnosis of heart disease. However, the present invention is not limited to this method, and the ultrasonic probe 20 may be adapted to the linear scan or the convex scan.
- the transmission/reception unit 40 shown in FIG. 7 comprises a transmission unit 14 which generates a drive signal for emitting transmission ultrasonic waves from the ultrasonic probe 20 , and a reception unit 16 which receives reception ultrasonic waves from the ultrasonic probe 20 .
- the transmission unit 14 comprises a rate pulse generator 42 , a transmission delay circuit 44 and a drive circuit 46 .
- the rate pulse generator 42 generates rate pulses for dividing the continuous waves supplied from the reference signal generating unit 12 in order to decide a repetition cycle (Tr) of the transmission ultrasonic waves in a B mode method, a color Doppler method and a pulse Doppler method.
- the continuous waves supplied from the reference signal generating unit 12 are supplied as they are to the transmission delay circuit 44 at a subsequent stage in a continuous wave Doppler method.
- the transmission delay circuit 44 provides the rate pulses or continuous waves supplied from the rate pulse generator 42 with a delay time for converging the transmission ultrasonic waves to a predetermined depth to obtain a small beam width in transmission and with a delay time for emitting the transmission ultrasonic waves in a predetermined direction.
- the drive circuit 46 generates a drive signal for driving the piezoelectric vibrators incorporated in the ultrasonic probe 20 , on the basis of the rate pulses or continuous waves. This drive circuit 46 generates a drive signal on the basis of a control signal supplied from the acoustic output control unit 100 .
- the reception unit 16 comprises a preamplifier 48 , a reception delay circuit 50 and an adder 52 .
- the preamplifier 48 amplifies a small signal transduced to the electric signal (reception signal) by the piezoelectric vibrators, and secures an adequate S/N ratio.
- the reception delay circuit 50 provides an output of the preamplifier 48 with a delay time for converging the reception ultrasonic waves from a predetermined depth to obtain a small reception beam width and with a delay time for setting a strong reception directivity to the reception ultrasonic waves from a predetermined direction. Then, an output of the reception delay circuit 50 provided with the predetermined delay times is sent to the adder 52 for addition and synthesis (phasing addition).
- the transmission delay circuit 44 and the drive circuit 46 in the transmission unit 14 , and the preamplifier 48 and the reception delay circuit 50 in the reception unit 16 generally have about the same number of independent channels as the number of piezoelectric vibrators of the ultrasonic probe 20 .
- a first piezoelectric vibrator group obtained by dividing the N piezoelectric vibrators into half, and the transmission unit 14 connected to this piezoelectric vibrator group are used for sending waves, while a remaining second piezoelectric vibrator group, and the reception unit 16 connected to this piezoelectric vibrator group are used for receiving waves.
- the data generating unit 60 comprises a B mode data generator 22 , a Doppler signal detector 24 , a color Doppler data generator 26 , and a Doppler spectrum generator 28 .
- the B mode data generator 22 processes a reception signal output from the adder 52 of the reception unit 16 to generate B mode data.
- the Doppler signal detector 24 performs quadrature detection of the reception signal to detect a Doppler signal.
- the color Doppler data generator 26 processes the Doppler signal detected in the Doppler signal detector 24 to generate color Doppler data.
- the Doppler spectrum generator 28 analyses the frequency of the Doppler signal to generate a Doppler spectrum.
- the B mode data generator 22 comprises an envelope detector 58 , a logarithmic converter 62 , and an A/D converter 64 .
- the envelope detector 58 carries out envelope detection for a signal input to the B mode data generator 22 , that is, the reception signal output from the adder 52 of the reception unit 16 .
- the logarithmic converter 62 logarithmically converts the amplitude of a detection signal to relatively enhance weak signals.
- the A/D converter 64 converts an output signal of the logarithmic converter 62 into a digital signal, and generates B mode data.
- the Doppler signal detector 24 comprises a ⁇ /2 phase shifter 66 , mixers 68 - 1 and 68 - 2 , and LPFs (low pass filters) 70 - 1 and 70 - 2 .
- This Doppler signal detector 24 carries out quadrature phase detection of the reception signal supplied from the reception unit 16 of the transmission/reception unit 40 by an operation described later in order to detect the Doppler signal.
- the color Doppler data generator 26 comprises an A/D converter 72 constituted of two channels, a Doppler signal storage circuit 74 , an MTI filter 76 , and an autocorrelation calculator 78 .
- the A/D converter 72 converts Doppler signals output from the LPFs 70 - 1 and 70 - 2 in the Doppler signal detector 24 , that is, analog signals subjected to the quadrature phase detection into digital signals, and saves the digital signals in the Doppler signal storage circuit 74 .
- the MTI filter 76 which is a high pass digital filter reads the Doppler signals temporarily saved in the Doppler signal storage circuit 74 , and removes Doppler components (clutter components) attributed to respiratory movement, pulsating movement, etc. of organs from the Doppler signal.
- the autocorrelation calculator 78 calculates an autocorrelation value for the Doppler signals from which blood flow information alone has been extracted by the MTI filter 76 , and further calculates an average velocity value, variance value, etc. of the blood flow on the basis of the autocorrelation value.
- the Doppler spectrum generator 28 comprises a switching circuit 80 , a sample hold circuit (SH) 82 , a high pass filter (HPF) 84 , an A/D converter 86 , and an FFT analyzer 88 .
- the color Doppler data generator 26 carries out an FFT analysis for the Doppler signal obtained in the Doppler signal detector 24 .
- each of the SH 82 , the HPF 84 and the A/D converter 86 is constituted of two channels, and complex components of the Doppler signal output from the Doppler signal detector 24 , that is, actual components (I components) and virtual components (Q components) are supplied to each channel.
- the data processing/storage unit 90 comprises a data storage unit 26 and a data processing unit 28 .
- the data storage unit 26 sequentially saves the B mode data, the color Doppler data, and the Doppler spectrum generated per scanning direction in the data generating unit 60 , and then generates two-dimensional B mode image data, color Doppler image data and spectrum data. Further, the spectrum data is used to save cine data generated by the data processing unit 28 .
- the data processing unit 28 performs image processing and scan conversion for the B mode image data and the color Doppler image data, generates trace data for the peak frequency components of the spectrum data, and processes data, etc. generated by the control of the acoustic output control unit 100 . Further, the data processing unit 28 performs processing to erase the display of cross-sectional images in the modes such as the B mode and color modes which are unnecessary in the evaluation of the coronary flow reserve, and processing to only extract waveforms obtained in accordance with the pulse Doppler method. Such processing is performed to quickly extract an image showing the peak flow velocity value from a plurality of still images acquired during the inspection. In addition, all the images saved in the data storage unit 26 during the inspection are processed for the multi-review display of these images on the display unit 30 after the values of velocity ranges and the base line positions of these images are uniformed.
- step S 1 the operator places the ultrasonic probe 20 on the specimen, and extracts a long axis view of left ventricle through apex cordis approach in a B mode, and then gradually rotates the probe counterclockwise, thus starting a scan so that right ventricle is reduced and the anterior interventricular groove is extracted.
- step S 2 the transition is made to a color mode.
- the color mode the presence of a left anterior descending coronary artery (LAD) is confirmed which appears and disappears outside the anterior myocardial epicardium in the vicinity of the apex of heart and which is displayed in a warm color during diastole.
- LAD left anterior descending coronary artery
- step S 3 the transition is made to a pulse Doppler (PWD) mode, and the waveform of the left anterior descending coronary artery is confirmed.
- step S 4 a sample volume is applied to the blood flow therein to adjust the velocity of flow using in some cases an angle correction function.
- step S 5 the operator saves (captures) a still image of the left anterior descending coronary artery before a drug load (at rest) by the operation and setting with the input unit 32 .
- the still image is saved in the data storage unit 26 .
- a drug is administered in step S 6 , and the operator continues an inspection (ultrasonic scan) while observing that there is no abnormality in the change of condition of the patient under the drug load.
- the operator confirms on the display unit 30 a gradual increase in the velocity of blood flow in the left anterior descending coronary artery of the patient, in step S 7 .
- the operator adjusts the velocity range and base line position of the apparatus to a desired velocity range and base line position accordingly, through operation and input from the input unit 32 .
- step S 9 still images are periodically saved in the data storage unit 26 to obtain information on the peak blood flow velocity during the diastole of the left anterior descending coronary artery under the drug load.
- the blood flow velocity in the left anterior descending coronary artery immediately after the drug load is not different from that before the drug load, but the value of the flow velocity gradually rises with time.
- the peak blood flow velocity is registered, the value of the flow velocity gradually drops with time. After several minutes, the condition returns to the same as before the drug load.
- step S 10 the operator continues to periodically save still images until the time when the peak flow velocity value seems to be registered (until the time when a decrease in the flow velocity value can be recognized). Then, the operator terminates the inspection in step S 11 . Subsequently, in step S 12 , a plurality of still images acquired during the inspection are read from the data storage unit 26 to start the preparation for carrying out the evaluation of the coronary flow reserve.
- step S 13 Doppler image parts alone are trimmed in the data processing unit 28 from all of the (N) images saved in the data storage unit 26 in step S 5 (before the drug load) and in step S 9 (under the drug load), and then the velocity ranges and the base line positions of these images are adjusted to common levels.
- the images are adjusted by bringing different velocity ranges 30 cm/s, 40 cm/s, 50 cm/s and 60 cm/s as shown in FIG. 9A to the maximum velocity range 60 cm/s as shown in FIG. 9B , and the multi-review display of these images are shown on the display unit 30 .
- steps S 14 and S 15 the operator visually searches for an image indicating a waveform of the blood flow velocity before the drug load and an image indicating a waveform of the peak flow velocity value from a plurality of images displayed in the form of the multi-review on the display unit 30 as shown in FIG. 10 as a result of step S 13 .
- step S 16 a known measurement function in the ultrasonic Doppler diagnostic apparatus 10 is used to measure the peak diastole velocity with regard to the two images selected in steps S 14 and S 15 .
- step S 17 the coronary flow reserve (CFR) is found from the peak flow velocity value before the drug load and the peak flow velocity value after the drug load that have been obtained as described above. Then, the present sequence terminates.
- CFR coronary flow reserve
- the display of cross-sectional images in the modes such as the B mode and color modes which are unnecessary in the evaluation of the coronary flow reserve is erased, and a plurality of images obtained in accordance with the pulse Doppler method can be displayed in a large display area at a time, thereby making it possible to reduce the time of ascertaining which flow velocity is higher.
- FIGS. 9A and 9B an example has been shown in the captured images in FIGS. 9A and 9B in which the velocity ranges are adjusted to the uniform velocity range.
- the adjusted images can be similarly displayed in the case of adjusting the base line positions or adjusting both the velocity ranges and the base line positions.
- the display unit 30 only displays a locus curve in a time direction of the peak flow velocity value at every heartbeat of the blood flow in the left anterior descending coronary artery.
- the locus curve is displayed in real time on the display unit 30 together with image displays in a B mode, a color mode and a PWD mode in order to increase the throughput of the whole inspection when the coronary flow reserve (CFR) is found.
- CFR coronary flow reserve
- FIGS. 11A and 11B show a coronary flow peak diastole velocity curve in the left anterior descending coronary artery (LAD) in which times are plotted on a horizontal axis and flow velocity values are plotted on a vertical axis
- FIG. 11A is a diagram shown in real-time display with an ordinary time axis in accordance with a pulse Doppler method
- FIG. 11B is a diagram showing one data for one heartbeat on a time axis in accordance with the pulse Doppler method.
- the scale of the time axis of the locus curve shown in FIG. 11B only allows one data to be obtained for one heartbeat, and is therefore significantly different from the scale of the time axis indicated in accordance with the ordinary pulse Doppler method shown in FIG. 11A .
- black circles on the curve shown in FIG. 11B correspond to crosses on the curve shown in FIG. 11A .
- locus curve as shown in FIG. 11B is referred to here as a coronary flow peak diastole velocity curve.
- this locus curve has the following characteristics: the locus curve shows a substantially steady-state flow velocity value before a drug load, and the curve shows a gradual rise when several minutes has passed after the drug load, and the locus remains substantially flat in the vicinity of a point at which the peak flow velocity value is obtained, and then the curve shows a fall. If the locus curve is rising, it means that the peak flow velocity value has not been reached, so that a scan still needs to be continued. On the contrary, if the locus curve is falling, it is possible to judge that the peak flow velocity value has already been passed. This shows that the evaluation of the coronary flow reserve (CFR) is possible whenever the scan is interrupted. For example, the curve shown in FIG. 11B is still rising at current time Tn, and this therefore means that the peak flow velocity value has not been reached.
- CFR coronary flow reserve
- steps S 21 to S 29 in the flowchart in FIG. 12 are the same as steps S 1 to S 9 in the flowchart in FIG. 8 in the first embodiment described above. Therefore, steps S 21 to S 29 are not described here by referring to the corresponding step numbers.
- the display unit 30 displays a screen 110 for a real-time locus curve including an ECG waveform, a display screen 112 for the coronary flow peak diastole velocity curve, and a display screen 114 for a left anterior descending coronary artery targeted for inspection.
- a display screen 112 On the display screen 112 , if the peak flow velocity value changes from a rising state to a falling state, it is judged that the peak flow velocity value has already been reached.
- a caution mark (message) 118 such as “CFPDV PASS” as shown in FIG. 14 indicating that the peak flow velocity value has been reached may be shown in the display screen 112 to provide the operator with the information. That is, whether the passage of the CFPDV has been indicated is judged in step S 30 .
- the transition is made to step S 27 to repeat the observation described above.
- the passage indication 118 is given, the transition is made to step S 31 .
- step S 31 the above-mentioned calculation of the coronary flow reserve (CFR) is carried out, and the result of the calculation is displayed. Subsequently, the scan is terminated in step S 32 .
- CFR coronary flow reserve
- the locus and notification are displayed in such a manner together with the displays in the B mode, the color mode and the PWD mode, so that the operator can evaluate the coronary flow reserve in a simple and easy manner without looking away from the screen of the display unit 30 on which the operator is observing the ordinary pulse Doppler waveform. Moreover, it is possible to prevent much waste of time which has hitherto been produced to find the peak flow velocity value from a plurality of still images after completion of the scan.
- a delay time can be set in a steady state before a drug load, and the same setting of the delay time can also be applied after the drug load. While FIGS. 11A and 11B are explained above using the ECG signal, other biological signals may be used as the trigger signals.
- FIG. 15 is a diagram showing one example of a coronary flow peak diastole velocity curve.
- FIG. 16 shows a locus curve of the coronary flow reserve (CFR) in the time direction, which indicates a ratio of the peak flow velocity value at every heartbeat of the moment to the flow velocity value in a steady state before the drug load in FIG. 15 .
- This locus curve of the coronary flow reserve may be displayed in real time together with image displays in the B mode, the color mode and the PWD mode.
- FIG. 17 is a diagram showing one example in which the coronary flow peak diastole velocity curve is displayed together with the image displays in the B mode, the color mode and the PWD mode.
- the locus curve in the display screen 112 is still rising, so that it can be judged that the peak flow velocity value has not been reached.
- FIG. 18 is a diagram showing an example of a state (state where the ultrasonic scan has been terminated) after several minutes have passed from the state of the screen display shown in FIG. 17 .
- the state in FIG. 18 shows that there is no longer any change in the flow velocity due to the administration of the drug.
- FIG. 19 is a diagram showing an example of a state after completion of the scan displayed in a magnified form. This shows that a pointer is moved onto a coronary flow peak diastole velocity curve 112 a by the input unit 32 such that an image 110 a corresponding to the time indicated by the pointer is read onto the screen of the display unit 30 from moving images saved in the data storage unit 26 on the apparatus. This is carried out under the control of the system control unit 36 . Since the display of the locus of the coronary flow peak diastole velocity curve is a function of guidance for the measurement of the coronary flow reserve, the function of rereading and displaying the image by the indication of the pointer as described above is particularly effective in detailed checking after completion of the inspection (ultrasonic scan).
- FIG. 20 is a diagram showing an example of acquiring a flow velocity value at a time delayed by ⁇ t time using the R waves as a trigger when the ECG signal is used.
- the place delayed by ⁇ t time does not necessarily correspond to the peak flow velocity value due to, for example, fluctuations in heartbeats of the patient, so that the coronary flow peak diastole velocity curve may be drawn using a method of acquiring the peak flow velocity value from the R waves between ⁇ t1 time and ⁇ t2 time.
- the locus curve in the time direction of the peak flow velocity value at every heartbeat of the blood flow in the left anterior descending coronary artery is displayed in real time together with the image displays in the B mode, the color mode and the PWD mode in order to increase the throughput of the whole inspection when the coronary flow reserve is found, so that it is possible to know in real time the tendency of change in the peak flow velocity value at every heartbeat in the left anterior descending coronary artery after the drug load. Therefore, by taking a look at the tendency of the curve, it is possible for the operator to instantly judge whether or not the flow velocity value in the left anterior descending coronary artery of the patient after the drug load has already reached its peak.
Landscapes
- Health & Medical Sciences (AREA)
- Life Sciences & Earth Sciences (AREA)
- Engineering & Computer Science (AREA)
- Medical Informatics (AREA)
- Biophysics (AREA)
- Nuclear Medicine, Radiotherapy & Molecular Imaging (AREA)
- Pathology (AREA)
- Radiology & Medical Imaging (AREA)
- Hematology (AREA)
- Biomedical Technology (AREA)
- Heart & Thoracic Surgery (AREA)
- Physics & Mathematics (AREA)
- Molecular Biology (AREA)
- Surgery (AREA)
- Animal Behavior & Ethology (AREA)
- General Health & Medical Sciences (AREA)
- Public Health (AREA)
- Veterinary Medicine (AREA)
- Ultra Sonic Daignosis Equipment (AREA)
Abstract
Description
Claims (11)
Applications Claiming Priority (2)
| Application Number | Priority Date | Filing Date | Title |
|---|---|---|---|
| JP2006155065A JP4960021B2 (en) | 2006-06-02 | 2006-06-02 | Ultrasonic Doppler diagnostic device and control program for ultrasonic Doppler diagnostic device |
| JP2006-155065 | 2006-06-02 |
Publications (2)
| Publication Number | Publication Date |
|---|---|
| US20080009737A1 US20080009737A1 (en) | 2008-01-10 |
| US8727992B2 true US8727992B2 (en) | 2014-05-20 |
Family
ID=38852813
Family Applications (1)
| Application Number | Title | Priority Date | Filing Date |
|---|---|---|---|
| US11/756,261 Active 2031-09-22 US8727992B2 (en) | 2006-06-02 | 2007-05-31 | Ultrasonic doppler diagnostic apparatus, and method of controlling ultrasonic doppler diagnostic apparatus |
Country Status (3)
| Country | Link |
|---|---|
| US (1) | US8727992B2 (en) |
| JP (1) | JP4960021B2 (en) |
| CN (2) | CN101732074B (en) |
Cited By (1)
| Publication number | Priority date | Publication date | Assignee | Title |
|---|---|---|---|---|
| US20180374568A1 (en) * | 2017-06-23 | 2018-12-27 | Abiomed, Inc. | Systems and Methods for Capturing Data from a Medical Device |
Families Citing this family (24)
| Publication number | Priority date | Publication date | Assignee | Title |
|---|---|---|---|---|
| GB0416878D0 (en) * | 2004-07-29 | 2004-09-01 | Sensornet Ltd | Processing sensing measurements |
| CN100577111C (en) * | 2007-12-29 | 2010-01-06 | 中国人民解放军第四军医大学 | Method and device for displaying blood flow image using ultrasonic Doppler information |
| CN101744638A (en) * | 2008-11-28 | 2010-06-23 | Ge医疗系统环球技术有限公司 | Multifunctional ultrasonic imaging system |
| JP2010125118A (en) * | 2008-11-28 | 2010-06-10 | Toshiba Corp | Ultrasonic diagnostic apparatus and ultrasonic diagnostic apparatus control method |
| CN102370499B (en) * | 2010-08-26 | 2014-05-07 | 深圳迈瑞生物医疗电子股份有限公司 | Method and system for simultaneously displaying Doppler image, B-type image and colored blood flow image |
| CN102551791B (en) * | 2010-12-17 | 2016-04-27 | 深圳迈瑞生物医疗电子股份有限公司 | A kind of ultrasonic imaging method and device |
| CN103156636B (en) * | 2011-12-15 | 2016-05-25 | 深圳迈瑞生物医疗电子股份有限公司 | A kind of supersonic imaging device and method |
| US20130184580A1 (en) * | 2012-01-13 | 2013-07-18 | General Electric Company | Color flow image and spectrogram ultrasound signal sharing |
| US8911373B2 (en) * | 2012-04-03 | 2014-12-16 | B-K Medical Aps | Vector flow ultrasound imaging |
| US20150222838A1 (en) * | 2012-09-19 | 2015-08-06 | Konica Minolta, Inc. | Ultrasound diagnostic device, ultrasound diagnostic device control method, and ultrasound diagnostic device control apparatus |
| CN102988092B (en) * | 2012-11-02 | 2014-10-08 | 中国人民解放军总医院 | Quantitative limiting device of blood flow |
| JP6199045B2 (en) * | 2013-02-28 | 2017-09-20 | 東芝メディカルシステムズ株式会社 | Ultrasonic diagnostic equipment |
| JP5877816B2 (en) * | 2013-05-27 | 2016-03-08 | 日立アロカメディカル株式会社 | Ultrasonic image capturing apparatus and ultrasonic image capturing method |
| KR102243024B1 (en) | 2014-03-12 | 2021-04-21 | 삼성메디슨 주식회사 | Method and ultrasound apparatus for displaying a diffusion boundary of medicine |
| CN107233109B (en) * | 2016-12-08 | 2023-08-08 | 成都优途科技有限公司 | Doppler ultrasonic blood flow detection system and detection method thereof |
| US10499883B2 (en) * | 2017-02-17 | 2019-12-10 | General Electric Company | Methods and systems for spatial color flow for diagnostic medical imaging |
| CN108498118B (en) * | 2017-02-28 | 2021-08-03 | 佳能医疗系统株式会社 | Ultrasonic image diagnostic apparatus, medical image processing apparatus, and medical image processing program |
| KR102578072B1 (en) * | 2017-12-11 | 2023-09-14 | 삼성메디슨 주식회사 | Ultrasound diagnositic apparatus and controlling mehtod of the same |
| WO2019155226A1 (en) * | 2018-02-07 | 2019-08-15 | Norwegian University Of Science And Technology (Ntnu) | Ultrasound blood-flow monitoring |
| CN112040874B (en) * | 2018-04-25 | 2024-03-01 | 富士胶片株式会社 | Ultrasonic system and control method for ultrasonic system |
| CN110575198B (en) * | 2018-06-08 | 2022-07-01 | 佳能医疗系统株式会社 | Analysis device and analysis method |
| CN108814649B (en) * | 2018-07-05 | 2024-04-05 | 河南省计量测试科学研究院 | Doppler ultrasonic diagnostic apparatus blood flow waveform die body and calibration method |
| CN113330516A (en) * | 2019-01-22 | 2021-08-31 | 费森尤斯医疗保健控股公司 | System and method for generating anonymous acoustic fingerprints |
| JP7600627B2 (en) * | 2020-11-04 | 2024-12-17 | コニカミノルタ株式会社 | ULTRASONIC DIAGNOSTIC APPARATUS, CONTROL METHOD FOR ULTRASONIC DIAGNOSTIC APPARATUS, AND CONTROL PROGRAM FOR ULTRASONIC DIAGNOSTIC APPARATUS |
Citations (10)
| Publication number | Priority date | Publication date | Assignee | Title |
|---|---|---|---|---|
| US4205687A (en) * | 1977-07-29 | 1980-06-03 | Diagnostic Electronics Corporation | Color coded blood flow velocity display equipment |
| JPH04176447A (en) | 1990-11-13 | 1992-06-24 | Toshiba Corp | Ultrasonic diagnostic apparatus |
| US5287753A (en) * | 1992-05-02 | 1994-02-22 | Advanced Technology Laboratories, Inc. | Continuous display of peak and mean blood flow velocities |
| JPH0926336A (en) | 1995-07-13 | 1997-01-28 | Yokogawa Electric Corp | Panel recorder |
| JPH11290323A (en) | 1998-04-09 | 1999-10-26 | Matsushita Electric Ind Co Ltd | Cardiac function examining device |
| JP2000229082A (en) | 1999-02-10 | 2000-08-22 | Toshiba Corp | Doppler ultrasonograph |
| US20040019278A1 (en) * | 2000-05-26 | 2004-01-29 | Kenneth Abend | Device and method for mapping and tracking blood flow and determining parameters of blood flow |
| JP2004313551A (en) | 2003-04-17 | 2004-11-11 | Hitachi Medical Corp | Cardiac motion display method and image diagnostic apparatus |
| JP2005185731A (en) * | 2003-12-26 | 2005-07-14 | Toshiba Corp | Doppler ultrasonography apparatus |
| JP4176447B2 (en) | 2002-10-23 | 2008-11-05 | 三菱重工業株式会社 | Fuel cell |
Family Cites Families (2)
| Publication number | Priority date | Publication date | Assignee | Title |
|---|---|---|---|---|
| US20030045797A1 (en) * | 2001-08-28 | 2003-03-06 | Donald Christopher | Automatic optimization of doppler display parameters |
| CN1541623A (en) * | 2003-10-22 | 2004-11-03 | 王作军 | Ultrasonic Doppler diagnosis system with automatic following function |
-
2006
- 2006-06-02 JP JP2006155065A patent/JP4960021B2/en active Active
-
2007
- 2007-05-31 US US11/756,261 patent/US8727992B2/en active Active
- 2007-06-01 CN CN2009102252345A patent/CN101732074B/en active Active
- 2007-06-01 CN CNB2007101065408A patent/CN100571638C/en active Active
Patent Citations (11)
| Publication number | Priority date | Publication date | Assignee | Title |
|---|---|---|---|---|
| US4205687A (en) * | 1977-07-29 | 1980-06-03 | Diagnostic Electronics Corporation | Color coded blood flow velocity display equipment |
| JPH04176447A (en) | 1990-11-13 | 1992-06-24 | Toshiba Corp | Ultrasonic diagnostic apparatus |
| JP2863624B2 (en) | 1990-11-13 | 1999-03-03 | 株式会社東芝 | Ultrasound diagnostic equipment |
| US5287753A (en) * | 1992-05-02 | 1994-02-22 | Advanced Technology Laboratories, Inc. | Continuous display of peak and mean blood flow velocities |
| JPH0926336A (en) | 1995-07-13 | 1997-01-28 | Yokogawa Electric Corp | Panel recorder |
| JPH11290323A (en) | 1998-04-09 | 1999-10-26 | Matsushita Electric Ind Co Ltd | Cardiac function examining device |
| JP2000229082A (en) | 1999-02-10 | 2000-08-22 | Toshiba Corp | Doppler ultrasonograph |
| US20040019278A1 (en) * | 2000-05-26 | 2004-01-29 | Kenneth Abend | Device and method for mapping and tracking blood flow and determining parameters of blood flow |
| JP4176447B2 (en) | 2002-10-23 | 2008-11-05 | 三菱重工業株式会社 | Fuel cell |
| JP2004313551A (en) | 2003-04-17 | 2004-11-11 | Hitachi Medical Corp | Cardiac motion display method and image diagnostic apparatus |
| JP2005185731A (en) * | 2003-12-26 | 2005-07-14 | Toshiba Corp | Doppler ultrasonography apparatus |
Non-Patent Citations (1)
| Title |
|---|
| Japanese Office Action issued Aug. 9, 2011, in Patent Application No. 2006-155065 (with English-language translation). |
Cited By (3)
| Publication number | Priority date | Publication date | Assignee | Title |
|---|---|---|---|---|
| US20180374568A1 (en) * | 2017-06-23 | 2018-12-27 | Abiomed, Inc. | Systems and Methods for Capturing Data from a Medical Device |
| US11217344B2 (en) * | 2017-06-23 | 2022-01-04 | Abiomed, Inc. | Systems and methods for capturing data from a medical device |
| US12217850B2 (en) | 2017-06-23 | 2025-02-04 | Abiomed, Inc. | Systems and methods for capturing data from a medical device |
Also Published As
| Publication number | Publication date |
|---|---|
| CN101081170A (en) | 2007-12-05 |
| JP4960021B2 (en) | 2012-06-27 |
| US20080009737A1 (en) | 2008-01-10 |
| CN101732074A (en) | 2010-06-16 |
| CN101732074B (en) | 2012-07-18 |
| JP2007319540A (en) | 2007-12-13 |
| CN100571638C (en) | 2009-12-23 |
Similar Documents
| Publication | Publication Date | Title |
|---|---|---|
| US8727992B2 (en) | Ultrasonic doppler diagnostic apparatus, and method of controlling ultrasonic doppler diagnostic apparatus | |
| US6884216B2 (en) | Ultrasound diagnosis apparatus and ultrasound image display method and apparatus | |
| US7871379B2 (en) | Ultrasonic diagnostic apparatus and method of ultrasonic measurement | |
| JP3410843B2 (en) | Ultrasound diagnostic equipment | |
| JP3707882B2 (en) | Ultrasonic diagnostic equipment | |
| JP3392482B2 (en) | Cardiac function test system | |
| US6770034B2 (en) | Ultrasonic diagnostic apparatus | |
| US9044196B2 (en) | Automated heart rate detection for 3D ultrasonic fetal imaging | |
| JP4189405B2 (en) | Ultrasonic diagnostic equipment | |
| JP3713303B2 (en) | Ultrasonic diagnostic equipment | |
| CN114025671B (en) | VTI measuring device and method | |
| JP4801912B2 (en) | Ultrasonic diagnostic equipment | |
| EP1514516A1 (en) | Ultrasonic diagnostic equipment and image processing apparatus | |
| JP3746121B2 (en) | Medical diagnostic imaging equipment | |
| JP2006102489A (en) | Ultrasonic doppler diagnostic apparatus and measuring method of diagnostic parameter | |
| JP2003126090A (en) | In vivo signal measurement device and ultrasonic diagnostic system | |
| WO2006043529A1 (en) | Ultrasonographic device | |
| JP4443863B2 (en) | Medical image apparatus, ultrasonic diagnostic apparatus, medical image data processing method, and software recording medium | |
| JP4497873B2 (en) | Ultrasonic Doppler diagnostic device | |
| JP4679141B2 (en) | Ultrasonic diagnostic apparatus and method for displaying ultrasonic diagnostic image | |
| JP3558586B2 (en) | Ultrasound diagnostic equipment | |
| JP2005095675A (en) | Ultrasonic diagnostic equipment |
Legal Events
| Date | Code | Title | Description |
|---|---|---|---|
| AS | Assignment |
Owner name: KABUSHIKI KAISHA TOSHIBA, JAPAN Free format text: ASSIGNMENT OF ASSIGNORS INTEREST;ASSIGNORS:TAKIMOTO, MASAO;KATAGUCHI, MUNEKI;KAKEE, AKIHIRO;AND OTHERS;REEL/FRAME:019363/0129 Effective date: 20070508 Owner name: TOSHIBA MEDICAL SYSTEMS CORPORATION, JAPAN Free format text: ASSIGNMENT OF ASSIGNORS INTEREST;ASSIGNORS:TAKIMOTO, MASAO;KATAGUCHI, MUNEKI;KAKEE, AKIHIRO;AND OTHERS;REEL/FRAME:019363/0129 Effective date: 20070508 |
|
| STCF | Information on status: patent grant |
Free format text: PATENTED CASE |
|
| FEPP | Fee payment procedure |
Free format text: PAYOR NUMBER ASSIGNED (ORIGINAL EVENT CODE: ASPN); ENTITY STATUS OF PATENT OWNER: LARGE ENTITY |
|
| AS | Assignment |
Owner name: TOSHIBA MEDICAL SYSTEMS CORPORATION, JAPAN Free format text: ASSIGNMENT OF ASSIGNORS INTEREST;ASSIGNOR:KABUSHIKI KAISHA TOSHIBA;REEL/FRAME:038891/0693 Effective date: 20160316 |
|
| MAFP | Maintenance fee payment |
Free format text: PAYMENT OF MAINTENANCE FEE, 4TH YEAR, LARGE ENTITY (ORIGINAL EVENT CODE: M1551) Year of fee payment: 4 |
|
| MAFP | Maintenance fee payment |
Free format text: PAYMENT OF MAINTENANCE FEE, 8TH YEAR, LARGE ENTITY (ORIGINAL EVENT CODE: M1552); ENTITY STATUS OF PATENT OWNER: LARGE ENTITY Year of fee payment: 8 |