US11305284B2 - Determining a bulk concentration of a target in a sample using a digital assay with compartments having nonuniform volumes - Google Patents
Determining a bulk concentration of a target in a sample using a digital assay with compartments having nonuniform volumes Download PDFInfo
- Publication number
- US11305284B2 US11305284B2 US16/200,447 US201816200447A US11305284B2 US 11305284 B2 US11305284 B2 US 11305284B2 US 201816200447 A US201816200447 A US 201816200447A US 11305284 B2 US11305284 B2 US 11305284B2
- Authority
- US
- United States
- Prior art keywords
- compartments
- target
- sample
- bulk concentration
- volume
- Prior art date
- Legal status (The legal status is an assumption and is not a legal conclusion. Google has not performed a legal analysis and makes no representation as to the accuracy of the status listed.)
- Active, expires
Links
Images


Classifications
-
- B—PERFORMING OPERATIONS; TRANSPORTING
- B01—PHYSICAL OR CHEMICAL PROCESSES OR APPARATUS IN GENERAL
- B01L—CHEMICAL OR PHYSICAL LABORATORY APPARATUS FOR GENERAL USE
- B01L3/00—Containers or dishes for laboratory use, e.g. laboratory glassware; Droppers
- B01L3/50—Containers for the purpose of retaining a material to be analysed, e.g. test tubes
- B01L3/508—Containers for the purpose of retaining a material to be analysed, e.g. test tubes rigid containers not provided for above
- B01L3/5082—Test tubes per se
-
- C—CHEMISTRY; METALLURGY
- C12—BIOCHEMISTRY; BEER; SPIRITS; WINE; VINEGAR; MICROBIOLOGY; ENZYMOLOGY; MUTATION OR GENETIC ENGINEERING
- C12Q—MEASURING OR TESTING PROCESSES INVOLVING ENZYMES, NUCLEIC ACIDS OR MICROORGANISMS; COMPOSITIONS OR TEST PAPERS THEREFOR; PROCESSES OF PREPARING SUCH COMPOSITIONS; CONDITION-RESPONSIVE CONTROL IN MICROBIOLOGICAL OR ENZYMOLOGICAL PROCESSES
- C12Q1/00—Measuring or testing processes involving enzymes, nucleic acids or microorganisms; Compositions therefor; Processes of preparing such compositions
- C12Q1/68—Measuring or testing processes involving enzymes, nucleic acids or microorganisms; Compositions therefor; Processes of preparing such compositions involving nucleic acids
- C12Q1/6813—Hybridisation assays
- C12Q1/6816—Hybridisation assays characterised by the detection means
-
- C—CHEMISTRY; METALLURGY
- C23—COATING METALLIC MATERIAL; COATING MATERIAL WITH METALLIC MATERIAL; CHEMICAL SURFACE TREATMENT; DIFFUSION TREATMENT OF METALLIC MATERIAL; COATING BY VACUUM EVAPORATION, BY SPUTTERING, BY ION IMPLANTATION OR BY CHEMICAL VAPOUR DEPOSITION, IN GENERAL; INHIBITING CORROSION OF METALLIC MATERIAL OR INCRUSTATION IN GENERAL
- C23C—COATING METALLIC MATERIAL; COATING MATERIAL WITH METALLIC MATERIAL; SURFACE TREATMENT OF METALLIC MATERIAL BY DIFFUSION INTO THE SURFACE, BY CHEMICAL CONVERSION OR SUBSTITUTION; COATING BY VACUUM EVAPORATION, BY SPUTTERING, BY ION IMPLANTATION OR BY CHEMICAL VAPOUR DEPOSITION, IN GENERAL
- C23C2/00—Hot-dipping or immersion processes for applying the coating material in the molten state without affecting the shape; Apparatus therefor
- C23C2/50—Controlling or regulating the coating processes
- C23C2/51—Computer-controlled implementation
-
- B—PERFORMING OPERATIONS; TRANSPORTING
- B01—PHYSICAL OR CHEMICAL PROCESSES OR APPARATUS IN GENERAL
- B01L—CHEMICAL OR PHYSICAL LABORATORY APPARATUS FOR GENERAL USE
- B01L2200/00—Solutions for specific problems relating to chemical or physical laboratory apparatus
- B01L2200/06—Fluid handling related problems
- B01L2200/0673—Handling of plugs of fluid surrounded by immiscible fluid
-
- B—PERFORMING OPERATIONS; TRANSPORTING
- B01—PHYSICAL OR CHEMICAL PROCESSES OR APPARATUS IN GENERAL
- B01L—CHEMICAL OR PHYSICAL LABORATORY APPARATUS FOR GENERAL USE
- B01L2200/00—Solutions for specific problems relating to chemical or physical laboratory apparatus
- B01L2200/18—Transport of container or devices
-
- B—PERFORMING OPERATIONS; TRANSPORTING
- B01—PHYSICAL OR CHEMICAL PROCESSES OR APPARATUS IN GENERAL
- B01L—CHEMICAL OR PHYSICAL LABORATORY APPARATUS FOR GENERAL USE
- B01L2300/00—Additional constructional details
- B01L2300/06—Auxiliary integrated devices, integrated components
- B01L2300/0627—Sensor or part of a sensor is integrated
- B01L2300/0663—Whole sensors
-
- B—PERFORMING OPERATIONS; TRANSPORTING
- B01—PHYSICAL OR CHEMICAL PROCESSES OR APPARATUS IN GENERAL
- B01L—CHEMICAL OR PHYSICAL LABORATORY APPARATUS FOR GENERAL USE
- B01L2300/00—Additional constructional details
- B01L2300/08—Geometry, shape and general structure
- B01L2300/0832—Geometry, shape and general structure cylindrical, tube shaped
-
- B—PERFORMING OPERATIONS; TRANSPORTING
- B01—PHYSICAL OR CHEMICAL PROCESSES OR APPARATUS IN GENERAL
- B01L—CHEMICAL OR PHYSICAL LABORATORY APPARATUS FOR GENERAL USE
- B01L2400/00—Moving or stopping fluids
- B01L2400/04—Moving fluids with specific forces or mechanical means
- B01L2400/0403—Moving fluids with specific forces or mechanical means specific forces
- B01L2400/0433—Moving fluids with specific forces or mechanical means specific forces vibrational forces
-
- C—CHEMISTRY; METALLURGY
- C12—BIOCHEMISTRY; BEER; SPIRITS; WINE; VINEGAR; MICROBIOLOGY; ENZYMOLOGY; MUTATION OR GENETIC ENGINEERING
- C12Q—MEASURING OR TESTING PROCESSES INVOLVING ENZYMES, NUCLEIC ACIDS OR MICROORGANISMS; COMPOSITIONS OR TEST PAPERS THEREFOR; PROCESSES OF PREPARING SUCH COMPOSITIONS; CONDITION-RESPONSIVE CONTROL IN MICROBIOLOGICAL OR ENZYMOLOGICAL PROCESSES
- C12Q1/00—Measuring or testing processes involving enzymes, nucleic acids or microorganisms; Compositions therefor; Processes of preparing such compositions
- C12Q1/68—Measuring or testing processes involving enzymes, nucleic acids or microorganisms; Compositions therefor; Processes of preparing such compositions involving nucleic acids
- C12Q1/6844—Nucleic acid amplification reactions
-
- G—PHYSICS
- G01—MEASURING; TESTING
- G01N—INVESTIGATING OR ANALYSING MATERIALS BY DETERMINING THEIR CHEMICAL OR PHYSICAL PROPERTIES
- G01N33/00—Investigating or analysing materials by specific methods not covered by groups G01N1/00 - G01N31/00
- G01N33/18—Water
Definitions
- one or more embodiments relate generally to techniques for determining a bulk concentration of a target in a source from a digital assay including compartments of disparate volumes formed in a barrier phase.
- a government agency may want to determine a bulk concentration of a pathogen (e.g., anthrax or another infectious agent, virus, or parasite), toxin (e.g., botulinum), or other poison (e.g., heavy metals such as lead and mercury, or chemical agents such as a nerve agent) in a municipal water supply, or may want to determine a bulk concentration of an irritant (e.g., pollen or smog), in the air.
- a pathogen e.g., anthrax or another infectious agent, virus, or parasite
- toxin e.g., botulinum
- other poison e.g., heavy metals such as lead and mercury, or chemical agents such as a nerve agent
- an irritant e.g., pollen or smog
- the bulk concentration is typically expressed as a ratio of the number of “pieces” (e.g., particles, molecules, cells, atoms) of the target per unit volume, or as a normalized ratio of the number of units of a volume occupied by the target to a reference number of units of the volume (e.g., parts per million).
- pieces e.g., particles, molecules, cells, atoms
- FIG. 1 is a diagram that illustrates an example of an analog technique for determining a bulk concentration ⁇ T of a target 10 in a source 12 .
- the target 10 may be the polio virus or bacteria (e.g., E Coli or other coliform bacteria) and the source 12 may be a municipal water supply.
- one or more samples 14 are taken from the source 12 .
- the sample 14 may be about 10 milliliters (mL) of water from a strategically selected location 16 (e.g., in the middle of the body of water, or near an input port where the water is drawn into a water-treatment facility).
- each sample 14 is treated with a substance, such as a reagent, that causes the sample to exhibit one or more phenomena each having a respective level related to the concentration of the target 10 in the sample.
- a reagent added to a sample 14 can bind with the molecules of the target 10 , and cause the sample to exhibit a color having an intensity, saturation, hue, or shade that is related to the concentration of the target in the sample, where the color can be caused by the bound reagent absorbing one or more wavelengths of light, luminescing one or more wavelengths of light, or absorbing one or more first wavelengths of light and luminescing one or more second wavelengths of light.
- a technician (not shown in FIG. 1 ) illuminates the sample with a light source designed for activating the reagent to exhibit a color.
- a human technician (not shown in FIG. 1 ) considers the one or more exhibited phenomena for one or more samples 14 and makes an estimation ⁇ circumflex over ( ⁇ ) ⁇ T of the actual bulk concentration ⁇ T of the target 10 in the source 12 . For example, if a sample 14 exhibits a lighter shade of green (left end of a shade chart 16 ), then the technician estimates the bulk concentration ⁇ T of the target 10 in the sample 12 as “low;” conversely, if the sample exhibits a darker shade of green (right end of the shade chart), then the technician estimates the bulk concentration ⁇ T of the target 10 in the sample 14 as “high.”
- the technician considers the respective shade of green of each of one or more additional samples 14 , and, based on his/her perception of the shades of green, effectively averages the shades of green for all considered samples to arrive at a final estimate of the bulk concentration ⁇ T . For example, the technician may characterize the bulk concentration ⁇ T as “high,” “medium,” “low,” “dangerous,” or “
- a technician compares each of one or more phenomena exhibited by one or more samples 14 to a respective chart, which quantifies the bulk concentration ⁇ T of the target 10 in the source 12 relative to a level of a respective phenomenon, and makes an estimation ⁇ right arrow over ( ⁇ ) ⁇ T of the bulk concentration ⁇ T in response to the one or more charts.
- the chart 16 includes four shades of green that are each associated with a corresponding value ⁇ T_1 - ⁇ T_4 of the bulk concentration ⁇ T , where the association between a shade of green and corresponding value ⁇ T_n was previously determined using one or more test sources having known values of the bulk concentration ⁇ T of the target 10 .
- the technician compares the shade of each sample 14 with the four shades of green in the chart 16 . If, per the example shown in FIG. 1 , the shade of the sample 14 is between two of the shades (here the sample is between the two leftmost shades) in the chart 16 , then, based on his/her perception of how “close” the shade of the sample is to each of the two shades, the technician interpolates the bulk concentration ⁇ T as having an estimated value ⁇ circumflex over ( ⁇ ) ⁇ T_Interpolated that lies between the values ⁇ T_1 and ⁇ T_2 associated with the two shades in the chart (this color-shade interpolation is similar to the color-shade interpolation that one performs to determine the pH and alkalinity levels of water in a swimming pool or spa).
- the technician may compare, to the chart 16 , the respective shade of green of each of one or more additional samples 14 , and average the interpolated values of the bulk concentration obtained from all compared samples to arrive at a final estimated value ⁇ circumflex over ( ⁇ ) ⁇ T_Interpolated of the bulk concentration ⁇ T of the target 10 .
- FIG. 2 is a diagram that illustrates a digital technique for determining a bulk concentration ⁇ T of a target 10 in a source 12 .
- a digital assay 20 is formed by dividing sample into compartments (also called droplets if the compartments are of a liquid) 22 , each of which is small enough (e.g., ⁇ ⁇ 100 picoliters (pL)) such that some compartments include the target 10 , and some compartments do not include the target.
- the number of compartments 22 in the digital assay 20 can range from tens to thousands depending on the application and the amount of precision desired.
- the technique is a digital technique because what is considered is whether a compartment 22 does include at least one target 10 (an “on” compartment) or does not include at least one target (an “off” compartment).
- a reagent is added to each compartment 22 , and binds to any molecule of the target 10 in the compartment (in this example, “at least one target” means at least one molecule of the target or, said another way, means at least one target molecule). If the compartment 22 turns any shade of green (i.e., the compartment includes at least one target), then the compartment is an “on” compartment; conversely, if the compartment does not turn green (i.e., the compartment lacks any target), then the compartment is an “off” compartment.
- Algorithms exist for generating an estimate ⁇ T of the bulk concentration ⁇ T of the target 10 in the source 12 in response to characteristics exhibited by a digital assay, the characteristics including the number of “on” compartments 22 , the number of “off” compartments, and the aggregate volume of the compartments.
- compartments 22 are relatively small, low-cost, portable equipment often generates the compartments having significantly different volumes, where the largest compartment volume in the digital assay 20 is, for example, approximately ten or more times the smallest compartment volume.
- a digital assay having compartments with such disparate volumes is called a “polydisperse digital assay.”
- a digital assay 30 has compartments 32 with approximately equal volumes, and such a digital assay is called a “monodisperse digital assay.”
- equipment for generating a monodisperse digital assay can be expensive, bulky, and slow.
- Such equipment can cost US$150,000 or more; therefore, such equipment is often unattainable by charitable and other organizations with limited funds. Consequently, such organizations send out their samples to a lab for analysis, and typically wait a significant amount of time (e.g., a few weeks to a few months) for an estimate ⁇ circumflex over ( ⁇ ) ⁇ T of the bulk concentration ⁇ T .
- such equipment can be on the order of 6 feet ⁇ 6 feet ⁇ 2 feet; therefore, it is often unsuitable for on-site applications (e.g., on the bank of a reservoir, at a well for drinking water).
- such a system includes a compartment-generating device, a compartment detector, and electronic computing circuitry.
- the device is configured to generate compartments of a digital assay, at least one of the compartments having a respective volume that is different from a respective volume of each of at least another one of the compartments.
- the detector is configured to determine a number of the compartments each having a respective concentration of a target that is greater than a threshold concentration.
- the electronic circuitry is configured to determine a bulk concentration of the target in a source of the sample in response to the number.
- these improvements flow from the system being configured to implement an algorithm that allows for accurately estimating the bulk concentration ⁇ T of a target in a source from a polydisperse digital assay.
- FIG. 1 is a diagram that illustrates an analog technique for determining a bulk concentration of a target in a source.
- FIG. 2 is diagram that illustrates two digital techniques for determining a bulk concentration of a target in a source.
- FIG. 3 is a diagram that illustrates a digital technique for determining a bulk concentration of a target in a source, according to an embodiment.
- FIG. 4 is a diagram of a system configured to implement the digital technique illustrated by FIG. 3 , according to an embodiment.
- FIG. 5 is a flow chart of the digital technique illustrated by FIG. 3 and implemented by the system of FIG. 4 , according to an embodiment.
- FIG. 6 is a flow chart of the digital technique illustrated by FIG. 3 and implemented by the system of FIG. 4 , according to another embodiment.
- FIG. 7 is a flow chart of a technique for characterizing the polydisperse digital assay of FIGS. 3-4 , according to an embodiment.
- FIG. 8 is a flow chart of the digital technique illustrated by FIG. 3 and implemented by FIG. 4 , according to yet another embodiment.
- FIG. 9 is a diagram of a polydisperse digital assay and a residual barrier phase, according to an embodiment.
- FIG. 10 is a diagram of a portable kit for determining a bulk concentration of a target in a source using the digital technique illustrated by FIG. 3 , according to an embodiment.
- FIG. 11 is a diagram of the computer of FIG. 4 , according to an embodiment.
- FIG. 3 is a diagram that illustrates a digital technique for determining a bulk concentration ⁇ T of a target 10 in a source 12 , according to an embodiment. For example, one can use the digital technique to obtain an accurate estimate ⁇ circumflex over ( ⁇ ) ⁇ T of the bulk concentration ⁇ T .
- a container 40 such as a clear test tube of glass or plastic, holds a polydisperse digital assay 42 of compartments 44 suspended in a barrier phase 46 , according to an embodiment in which a dark compartment is “on” and a light compartment is “off.”
- each compartment 44 is a respective droplet of a liquid, such as water
- the barrier phase 46 is another liquid, such as an oil, in which the droplets are suspended.
- the combination of the droplets 44 and the liquid barrier phase 46 is an emulsion.
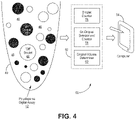
- FIG. 4 is a diagram of the container 40 , the polydisperse digital assay 42 and the barrier phase 46 within the container, and a system 50 configured to determine the bulk concentration ⁇ T of the target 10 ( FIG. 3 ) in the source 12 ( FIG. 3 ) in response to at least some of the droplets 44 of the polydisperse digital assay, according to an embodiment.
- the system 50 includes a droplet analyzer 52 and a computing device 54 .
- Both the droplet analyzer 52 and computing device 54 include electronic circuitry that is hardwired, or is configured by software or firmware, to perform the respective functions and operates described below.
- the droplet analyzer 52 includes an “on”-droplet detector and counter 56 , a droplet counter 58 , and a droplet-volume determiner 60 .
- the “on”-droplet detector and counter 56 includes electronic circuitry and one more optical sensors configured to detect, and to determine the number of, “on” droplets 44 in the polydisperse digital assay 42 .
- the droplet counter 58 includes electronic circuitry and one or more optical sensors (one or more of which may be shared with the on-droplet detector and counter 56 ) configured to determine the total number of “on” and “off” droplets 44 in the polydisperse digital assay 42 .
- the droplet-volume detector 60 includes electronic circuitry and one or more optical sensors (one or more of which may be shared with the “on”-droplet detector and counter 56 or the droplet counter 58 ) configured to measure, or otherwise to determine, the respective volume of each of the droplets 44 .
- the computing device 54 can be any suitable computer, such a laptop, a tablet, or a smart phone, that includes one or more microprocessors or microcontrollers.
- FIG. 5 is a flow chart 70 of an algorithm for determining a bulk concentration ⁇ T of a target 10 in a source 12 , according to an embodiment.
- both the compartments 44 and the barrier phase 46 are liquids such that the compartments 44 are droplets suspended in the liquid barrier phase.
- a technician (not shown in FIGS. 3-5 ) generates the droplets 44 of different volumes (e.g., in a range of approximately 1 pL-100 s pL) from a sample of the source 12 to form the polydisperse digital assay 42 .
- the technician adds an indicated volume of the barrier-phase liquid 46 , such as an oil, to the container 40 , adds an indicated sample volume of the source 10 to the barrier-phase liquid in the container, plugs the top of the container, and shakes the container to form an emulsion of the droplets 44 suspended in the barrier-phase liquid.
- the container 40 includes a measurement line (not shown in FIGS.
- the technician uses a measurement device, such as an “eye” dropper, to obtain and measure the volume of the sample.
- the container 40 may include another measurement line (not shown in FIGS. 3-5 ), higher up on the container than the barrier-phase measurement line, to indicate the volume of the sample to be added after the barrier-phase liquid is added.
- the technician adds to the container 40 , before the technician shakes it, a reagent for rendering target-carrying droplets 44 luminescent as described above in conjunction with FIGS. 1-2 .
- the technician can generate the polydisperse digital assay 42 in a matter of a few ones to tens of seconds, and in no more than a few minutes even if the time for setting up the system 50 and obtaining the sample is included.
- the “on”-droplet detector and counter 56 determines the number a of “on” droplets 44 in the polydisperse digital assay 42 .
- the counter 56 can include a combination illumination device and image-capture device, such as a light source and a small camera, which the technician holds up near, or against, the container 40 .
- the illumination device illuminates the droplets 44 so that droplets including the target luminesce a color having shades respectively corresponding to the concentrations of the target in the droplets.
- the technician then presses a button on the device, or a virtual button displayed by the computer 54 , to capture an image of the droplets 44 in the container while the droplets including the target are luminescing.
- the computer 54 analyzes the image, detects the droplets 44 , and determines whether each detected droplet 44 is “on” or “off” by determining, for each droplet, whether the number of targets (or, said another way, the number of the target) within the droplet exceeds a threshold number (e.g., one target molecule, five target molecules, ten target molecules). For example, an optical signal that the target luminesces has a property (e.g., intensity, color, color shade) indicative of the number of targets within a droplet 44 , and the computer 54 determines whether the number of targets within the droplet exceeds the threshold number by determining whether the property of the target-related optical signal exceeds (or is below) a signal-property threshold.
- a threshold number e.g., one target molecule, five target molecules, ten target molecules.
- the computer 54 compares a shade of the color (e.g., green), or an opacity, of a droplet 44 to a threshold shade or opacity, determines that the droplet is “on” if the level of the shade or opacity is greater than or equal to the threshold, and determine that the droplet is “off” if the level of the shade or opacity is less than the threshold.
- the technician uses the “on”-droplet detector and counter 56 to capture multiple images of the droplets 44 from different orientations relative to the container 40 so that the computer 54 is able to detect droplets that might otherwise be obscured by other droplets in a single image.
- the computer 54 generates an estimate ⁇ circumflex over ( ⁇ ) ⁇ T of the bulk concentration ⁇ T of the target 10 in the source 12 in response to the number a of “on” droplets 44 in the container 40 .
- the computer 54 executes one or more equations to solve for ⁇ circumflex over ( ⁇ ) ⁇ T in response to a.
- the system 50 and the algorithm that the system implements, provide one or more advantages over existing systems and techniques for determining a bulk concentration of a target in a source.
- the container 40 and the barrier phase 46 are configured to provide inexpensive, on-site, and fast generation of the digital assay 42 .
- the system 50 is configured to provide inexpensive, on-site, and fast estimation of the bulk concentration ⁇ T of the target 10 in the source 12 even in response to a polydisperse digital assay 42 having compartments 44 of disparate volumes.
- alternate embodiments of the system 50 and of the above-described algorithm are contemplated.
- one or more steps can be added to the algorithm, and one or more of the above-described steps can be omitted from the algorithm.
- one or more components can be added to the system 50 , and one or more of the above-described components can be omitted from the system.
- a reagent may be omitted if, for example, the target luminesces without the reagent, or if the system 50 can determine, in a manner that does not involve use of a reagent, whether the number of targets in a compartment 44 exceeds the threshold number by determining whether a property of a target-related signal (e.g., color, color shade) exceeds a signal-property threshold.
- the computer 54 may perform one or more functions and operations attributed to the droplet analyzer 52 , and the droplet analyzer may perform one or more functions and operations attributed to the computer.
- a cloud server may complement, or replace, the computer 54 .
- the system 50 and the above-described algorithm yield similar results and advantages for a monodisperse digital assay.
- embodiments described below in conjunction with FIGS. 6-10 may be applicable to the system 50 and to the above-described algorithm.
- FIG. 6 is a flow chart 80 of a digital-variable-volume (DVV) algorithm for determining a bulk concentration ⁇ T of a target 10 ( FIG. 3 ) in a source 12 ( FIG. 3 ), according to an embodiment.
- the DVV algorithm is suitable for situations in which the system 50 includes the droplet-volume determiner 60 , or in which the respective volumes of the “on” droplets 44 , and the aggregate volume of all the droplets, otherwise can be determined.
- both the compartments 44 and the barrier phase 46 are liquids such that the compartments 44 are droplets suspended in the barrier phase to form an emulsion.
- a technician (not shown in FIGS. 3-4 and 6 ) generates the droplets 44 of disparate volumes (e.g., in a range of approximately 1 pL-100 s pL) from a sample of the source 12 to form the polydisperse digital assay 42 .
- the technician may form the polydisperse digital assay 42 using a method that is the same as, or that is similar to, the “shake-and-bake” method described above in conjunction with step 72 of FIG. 5 .
- the “on”-droplet detector and counter 56 determines the number a of “on” droplets 44 in the polydisperse digital assay 42 .
- the “on”-droplet detector and counter 56 may determine the number a using a method that is the same as, or that is similar to, the method described above in conjunction with step 74 of FIG. 5 .
- the droplet-volume determiner 60 determines the respective volume v i of each of the detected “on” droplets 44 , and, if necessary, determines the aggregate volume V Total of the droplets 44 by summing the respective volumes of the detected “on” and “off” droplets. For example, to determine the respective volume v i of each of the a “on” droplets 44 , the determiner 60 analyzes the one or more images that the system 50 captured at the step 84 using a conventional droplet-volume-determining algorithm.
- the determiner 60 To determine the aggregate volume V Total , the determiner 60 also determines the volumes of the “off” droplets 44 in the same way that the determiner determines the volumes v i of the “on” droplets, sums the volumes of the “off” droplets with the volumes v i of the “on” droplets, and sets V Total equal to the determined sum.
- the droplet-volume determiner 60 is configured to operate as described above but is part of, or is otherwise included in, the computer 54 instead of the droplet analyzer 52 .
- the technician enters into the computer 54 the volume of the sample, and the computer sets V Total equal to the entered sample volume.
- the computer 54 solves for the estimated bulk concentration ⁇ circumflex over ( ⁇ ) ⁇ T of the target 10 in the source 12 according to the following equation:
- each “on” droplet 44 would contain one and only one of the target such that the computer 54 could determine the estimated bulk concentration ⁇ circumflex over ( ⁇ ) ⁇ T from the number a of “on” droplets 44 divided by the volume V Total of the sample 14 , where a would also equal the number of targets in the sample.
- each “on” droplet 44 may contain more than one of the target 10 , determining the estimated bulk concentration ⁇ circumflex over ( ⁇ ) ⁇ T from a/V Total may lead to an error caused by an undercounting of the number of the target in the sample 14 .
- the computer 54 is configured to use equation (1) to estimate the bulk concentration ⁇ T of the target in the source 12 .
- equation (1) For each “on” droplet 44 , equation (1) includes a respective expression for the probability that the droplet includes at least one of the target, the probability being dependent on, and, therefore, the respective expression including, the respective volume of the droplet.
- equation (1) not only effectively accounts for the possibility that each of one or more of the “on” droplets 44 contains more than one of the target 10 , equation (1) also effectively accounts for a larger “on” droplet 44 being more likely than a smaller “on” droplet to contain more than one of the target.
- the system 50 and the DVV algorithm that the system 50 is configured to implement, provide one or more advantages over existing systems and techniques.
- the container 40 and binary phase 46 provide for inexpensive, on-site, and fast generation of the digital assay 42 .
- the system 50 provides for inexpensive, on-site, fast, and accurate estimation of a bulk concentration ⁇ T of a target 10 in a source 12 even in response to a polydisperse digital assay 42 having droplets 44 of disparate volumes.
- alternate embodiments of the system 50 and the DVV algorithm are contemplated.
- the technician may count the number a of “on” droplets and enter the number a into the computer 54 .
- the technician may use a device, such as a ruler or microscope, to estimate the volumes v i , and then enter these volumes into the computer 54 .
- the system 50 and the above-described algorithm yield similar results and advantages for a monodisperse digital assay.
- alternate embodiments described above in conjunction with FIGS. 3-5 and below in conjunction with FIGS. 7-11 may be applicable to the system 50 and the DVV algorithm.
- FIG. 7 is a flow chart 100 of an algorithm for characterizing the volumes of the compartments (e.g., droplets) 44 generated with the container 40 and barrier phase 46 of FIG. 4 , according to an embodiment.
- the compartments e.g., droplets
- FIG. 8 is a flow chart 110 of a digital-variable-volume-approximation (DVVA) algorithm for determining a bulk concentration ⁇ T of a target 10 ( FIG. 3 ) in a source 12 ( FIG. 3 ), according to an embodiment.
- the DVVA algorithm is suitable for situations in which the system 50 lacks the droplet-volume determiner 60 , or in which the respective volumes of the “on” droplets 44 , and the aggregate volume of all the droplets, are otherwise unknown.
- compartment-volume characterizing algorithm is described, according to an embodiment in which the compartments 44 are droplets.
- a technician (not shown in FIG. 3-4 or 7 ) generates a set of test droplets of different volumes (e.g., in a range of approximately 1 pL-100 pL) from a test sample that is similar to a sample of the source 12 of FIG. 3 to form a test polydisperse digital assay; for example, if the intended source 12 is a body of water, then the technician may use a sample of water.
- a technician (not shown in FIG. 3-4 or 7 ) generates a set of test droplets of different volumes (e.g., in a range of approximately 1 pL-100 pL) from a test sample that is similar to a sample of the source 12 of FIG. 3 to form a test polydisperse digital assay; for example, if the intended source 12 is a body of water, then the technician may use a sample of water.
- the technician adds an indicated volume of the barrier-phase liquid 46 , such as an oil, to the container 40 , adds an indicated volume of the test sample to the barrier-phase liquid in the container, plugs the top of the container, and shakes the container to form an emulsion of test droplets suspended in the barrier-phase liquid.
- the container 40 may include a measurement line (not shown in FIG. 3-4 or 7 ) to indicate the volume of the barrier-phase liquid to be added, and the technician may use a measurement device, such as an “eye” dropper, to add an indicated volume of the test sample.
- the container may include another measurement line (not shown in FIG. 3-4 or 7 ), higher up on the container than the barrier-phase measurement line, to indicate the volume of the test sample to be added after the barrier-phase liquid is added.
- the droplet counter 58 determines the number m of test droplets
- the droplet-volume determiner 60 determines a respective volume v i_characterized for each of the m test droplets.
- the computer 54 stores the number m of test droplets, and stores the volumes v i_characterized of the test droplets, in a memory (not shown in FIG. 3 ).
- the number m and the corresponding volumes v i_characterized can be stored in another memory from which the computer 54 is configured to download the values of m and v i_characterized .
- the theory behind generating the characterized number m and the characterized volumes v i_characterized is that similar containers, sample substances, and barrier phases will generate similar values for m and v i_characterized such that the values of m and v i_characterized can be used to determine a bulk concentration ⁇ T of the target 10 ( FIG. 3 ) in the sample 12 ( FIG. 3 ) in situations where the volumes v i of the actual droplets 44 cannot be determined or are otherwise unknown.
- the statistical dependence between the actual droplet volumes v i and the characterized droplet volumes v i_characterized is high enough that, as described below, the number m and volumes v i_characterized of the test droplets can be used to determine the actual bulk concentration ⁇ T of the target 10 in the source 12 in a situation where the volumes v i of the actual droplets 44 are unknown.
- the steps 102 - 106 can be repeated any suitable number of times to generate sets of test values for m and v i_characterized , and the computer 54 , or a similar computer, can calculate the final values of m and v i_characterized by interpolating values from one or more of the sets of test values.
- both the compartments 44 and the barrier phase 46 are liquids such that the compartments 44 are droplets suspended in the barrier phase to form an emulsion.
- a technician (not shown in FIGS. 3-4 and 8 ) generates the droplets 44 of disparate volumes (e.g., in a range of approximately 1 pL-100 pL) from a sample of the source 12 to form the polydisperse digital assay 42 .
- the technician may form the polydisperse digital assay 42 using a method that is the same as, or similar to, the “shake-and-bake” method described above in conjunction with step 72 of FIG. 5 .
- the “on”-droplet detector and counter 56 determines the number a of “on” droplets 44 in the polydisperse digital assay 42 .
- the on-droplet detector and counter 56 may determine the number a using a method that is the same as, or similar to, the method described above in conjunction with step 74 of FIG. 5 .
- the droplet counter 58 determines the number n of all droplets 44 (i.e., the sum of the “on” and “off” droplets) in the polydisperse digital assay 42 in the container 40 .
- the droplet counter 58 analyzes the one or more images that the system 50 captured at the step 114 using a conventional droplet-counting algorithm.
- the droplet counter 58 operates in a similar manner but is part of, or is included in, the computer 54 instead of being part of, or included in, the droplet analyzer 52 .
- the computer 54 solves for the estimated bulk concentration ⁇ circumflex over ( ⁇ ) ⁇ T of the target 10 in the source 12 according to the following equation:
- the system 50 and the DVVA algorithm that the system is configured to implement, provide one or more advantages over existing systems and techniques.
- the container 40 and barrier phase 46 provide for inexpensive, on-site, and fast generation of the digital assay 42 .
- the system 50 provides for inexpensive, on-site, and fast estimation of a bulk concentration ⁇ T of the target 10 in the source 12 even in response to a polydisperse digital assay 42 having droplets 44 of disparate volumes that are unknown.
- a n 1 - ⁇ - ⁇ ⁇ ⁇ e - ⁇ ⁇ T ⁇ v ⁇ f ⁇ ( v ) ⁇ dv ( 3 )
- FIG. 9 is a diagram of the polydisperse digital assay 42 in the container 40 , according another embodiment.
- the droplets may “float” over a residual region 120 of the barrier phase that is devoid of droplets as shown in FIG. 9 .
- the droplets may “sink” to the bottom of the container 40 such that the residual region 120 of the barrier phase that is devoid of droplets “floats” over the droplets (the residual region “floating” over the droplets is not shown in FIG. 9 ).
- FIG. 10 is a diagram of a digital-assay-generator-and-analyzer kit 130 , according to an embodiment.
- the combination of the kit 130 , a portable computer (e.g., laptop, tablet, smart phone), and one or more of the algorithms described above in conjunction with FIGS. 5-8 provides for inexpensive, on-site, and fast generation of the digital assay 42 , and provides for inexpensive, on-site, and fast estimation of a bulk concentration ⁇ T of a target 10 ( FIG. 3 ) in a source 12 ( FIG. 3 ) in spite of the polydisperse digital assay having droplets 44 of disparate volumes that may be unknown.
- the kit 130 may cost approximately $30-$100
- the amount of the barrier phase 46 required to generate each digital assay 42 may cost approximately $1 or less
- the combined weight of the kit 130 and the computer 54 may be approximately 3 pounds (lbs.) to 10 lbs.
- the total test time (from collection of a sample 14 to the computer 54 rendering an estimated bulk concentration ⁇ circumflex over ( ⁇ ) ⁇ T ) may be approximately 20 minutes to 80 minutes.
- the kit 130 includes a container stopper 132 , a re-openable and re-closable package (e.g., a screw-top bottle) 134 of the barrier phase 46 , a re-openable and re-closable optional package (e.g., a screw-top bottle) 136 of a reagent, a dropper 138 , and a non-transitory computer-readable medium 140 .
- the stopper 132 is configured to form a liquid-tight seal at the opening of the container 40 to allow shaking of the container to form the polydisperse digital assay 42 .
- the dropper 138 allows a technician to transfer the barrier phase 46 and the reagent from their respective packages 134 and 136 to the container 40 , and allows a technician to obtain a liquid sample (e.g., water) from a source (e.g., reservoir) and to transfer the sample to the container.
- a liquid sample e.g., water
- a source e.g., reservoir
- the computer-readable medium is a suitable non-volatile memory that stores program instructions that, when executed by a portable computer, cause the computer to implement one of the algorithms described above in conjunction with FIGS. 5-8 .
- kit 130 may include a carrying case in which all of the other system components may be stored and carried.
- the kit 130 may include a carrying case in which all of the other system components may be stored and carried.
- embodiments describe above in conjunction with FIGS. 1-9 and below in conjunction with FIG. 11 may be applicable to the kit 130 .
- FIG. 11 is a block diagram of the computer 54 of FIG. 4 , according to an embodiment.
- the computer 54 includes computing circuitry 150 , one or more input devices 152 , one or more output devices 154 , and one or more data-storage devices 156 .
- the computing circuitry 150 includes circuitry that is configured to perform various functions and operations, such as the functions and operations described above in conjunction with FIGS. 3-8 and 10 .
- the computing circuitry 150 includes a microprocessor or microcontroller that is hardwired or configured with firmware, or that executes software, to perform the above-described functions and operations.
- the one or more input devices 152 are configured to allow an operator or device to provide data or other information or signals to the computer 54 .
- Examples of an input device 152 include a keyboard, mouse, touch screen, audible or voice-recognition component, the droplet analyzer 52 ( FIG. 4 ), and so on
- the one or more output devices 154 are configured to provide data from the computing circuitry 150 to an operator or device in a suitable form, or to perform a function or operation under control of the computing circuitry 150 .
- Examples of an output device 154 include a printer, video display, audio output components, the droplet analyzer 52 ( FIG. 4 ), and so on.
- the one or more data-storage devices 156 are configured to store data on or to retrieve data from volatile or non-volatile storage media (not shown).
- Examples of a data-storage device 156 include a magnetic disk, a FLASH memory, other types of solid state memory such as a random-access memory (RAM, SRAM, DRAM, USB “stick”), a ferro-electric memory, a tape drive, an optical disk like a compact disk and a digital versatile disk (DVDs), and so on.
- the computer 54 may omit one or more of the above-described devices, and may include one or more other devices.
- the targets molecules, cells, etc.
- a compartment with one or more targets gives a signal (e.g., fluorescent intensity after nucleic acid amplification), and is called an “on” compartment.
- a compartment without targets does not provide a signal, and is called an “off” compartment.
- Targets are distributed into compartments following the Poisson distribution.
- An assay system such as the system 50 of FIG. 4 , can detect and count the number of “on” compartments (but not the number of targets per compartment).
- the digital-variable-volume (DVV) and digital-variable-volume-approximation (DVVA) methods are based on maximum likelihood estimation; the concentration estimate is the one that maximizes the likelihood of observing a certain experimental result.
- the choice of maximum likelihood estimation was inspired by its use in multivolume digital PCR (where each assay utilizes a handful of predetermined, precisely controlled volumes), which has been inspired by limiting dilution assays for microorganism counting. In particular, an important feature is that results from different volumes are readily combined by way of multiplying the likelihoods.
- Table 1 The terms relevant to the descriptions of the DVV and DVVA methods are described in Table 1.
- Equation (a) the probability that a particular compartment turns “on” given the volume and bulk concentration. It is the same as the probability of having more than one target in the compartment, based on the Poisson distribution with the mean of v ⁇ T . This probability is useful in subsequent derivation steps.
- the likelihood l( ⁇ T ) of observing a certain assay result, i.e., particular numbers of “on” and “off” compartments (a and b, respectively) with the associated volumes is the product of individual likelihoods calculated using equation (a).
- ⁇ T The value of ⁇ T that maximizes l( ⁇ T ) is then found.
- the calculation of the standard error is also more appropriate for ⁇ than for ⁇ T because the distribution of A is less skewed. Therefore, the goal is now finding the ⁇ value that maximizes L( ⁇ ).
- the expression for L( ⁇ ) and the first and second derivatives are shown below.
- Equation (d) the root of the first derivative (equation (d)) is determined, i.e., equation (1), which is repeated below, is solved.
- This ⁇ ⁇ circumflex over ( ⁇ ) ⁇ can be used to calculate the confidence interval. Calculating ⁇ ⁇ circumflex over ( ⁇ ) ⁇ using the expected Fisher information is not feasible because the volume distribution is unknown. In fact, to implement the DVV technique, the volume distribution is not required and need not be the same from one experiment to another.
- the probability a compartment turns ON can be calculated using the volume distribution (specified by the probability density function ⁇ (v)).
- ⁇ (v) has been chosen to follow the gamma distribution or truncated normal distribution.
- ⁇ (v) may not be described by a simple function.
- M a set of pre-measured volumes
- a set of separately measured volumes, M is used instead of ⁇ (v).
- the likelihood function can then be obtained using the binomial distribution (for the case of a ON compartments out of n compartments with the probability of p on ( ⁇ ).
- the loglikelihood function can be calculated with the change of variable ⁇ ln( ⁇ T ), and subsequently, its first and second derivatives.
- Equation (2) the root of L′( ⁇ ) is found (equation (2), which is repeated below), and it is verified that it corresponds to a maximum by checking the sign of the second derivative (equation (m)).
- equation (2) can be obtained by using a/n to estimate p ON ( ⁇ T ).
- ⁇ ⁇ circumflex over ( ⁇ ) ⁇ is calculated using the expected Fisher information, ⁇ L′′( ⁇ ) .
- the second derivative, L′′( ⁇ ) is a linear function of
- Example 1 includes a system, comprising: a device configured to generate compartments of a sample, at least one of the compartments having a respective volume that is different from a respective volume of each of at least another one of the compartments; a detector configured to determine a number of the compartments each having a respective number of a target that is greater than a threshold number of the target; and electronic circuitry configured to determine a bulk concentration of the target in a source of the sample in response to the determined number of the compartments.
- Example 2 includes the system of Example 1 wherein the device includes a container configured to generate the compartments of the sample in a barrier phase in response to the container moving.
- Example 3 includes the system of any of Examples 1-2 wherein the device includes a container configured to generate the compartments of the sample in a liquid in response to a shaking of the container.
- Example 4 includes the system of any of Examples 1-3 wherein the device includes a container configured to generate the compartments of the sample as droplets of the sample in an oil in response to a shaking of the container.
- Example 5 includes the system of any of Examples 1-4 wherein the device includes a container configured to generate the compartments of the sample as droplets of the sample in a barrier phase in response to a shaking of the container, the droplets each have a viscosity, the barrier phase having a viscosity that is greater than the viscosity of the droplets.
- Example 6 includes the system of any of Examples 1-5 wherein the detector is configured to determine the number of the compartments each having a respective number of the target that is greater than the threshold number of the target in response to a wavelength of electromagnetic energy at which each of the number of the compartments luminesces.
- Example 7 includes the system of any of Examples 1-6 wherein the detector is configured to determine the number of the compartments each having a respective number of the target that is greater than the threshold number of the target in response to a wavelength of electromagnetic energy that each of the number of the compartments absorbs.
- Example 8 includes the system of any of Examples 1-7 wherein the detector is configured to determine the number of the compartments each having a respective number of the target that is greater than the threshold number of the target in response to a wavelength of electromagnetic energy that each of the number of the compartments passes.
- Example 9 includes the system of any of Examples 1-8 wherein the detector is configured to determine the number of the compartments each having a respective number of the target that is greater than the threshold number of the target in response to a wavelength of electromagnetic energy that each of the number of the compartments blocks.
- Example 10 includes the system of any of Examples 1-9 wherein the electronic circuitry is configured to determine a bulk concentration of the target in a source of the sample in response to a respective measured volume of each of the number of compartments.
- Example 11 includes the system of any of Examples 1-10 wherein the electronic circuitry is configured to determine a bulk concentration of the target in a source of the sample in response to a sum of a respective measured volume of each of the compartments.
- Example 12 includes the system of any of Examples 1-11 wherein the electronic circuitry is configured to determine a bulk concentration of the target in a source of the sample in response to a number of the compartments.
- Example 13 includes the system of any of Examples 1-12 wherein the electronic circuitry is configured to determine a bulk concentration of the target in a source of the sample in response to a number of other compartments.
- Example 14 includes the system of any of Examples 1-13 wherein the electronic circuitry is configured to determine a bulk concentration of the target in a source of the sample in response to a respective measured volume of each of other compartments.
- Example 15 includes the system of any of Examples 1-14 wherein the electronic circuitry is configured to determine a bulk concentration of the target in a source of the sample in response to a number of other compartments and a respective measured volume of each of the other compartments.
- Example 16 includes the system of any of Examples 1-15 wherein the electronic circuitry is configured to determine a bulk concentration of the target in a source of the sample in response to a probability density function of compartment volume.
- Example 17 includes a system, comprising: a barrier-phase liquid; a container configured to receive the barrier-phase liquid, to receive a sample including a target, and to generate compartments of the sample suspended in the barrier-phase liquid in response to a shaking of the container, at least one of the compartments having a respective volume that is different from a respective volume of each of at least another one of the compartments; and a detector configured to determine a number of the compartments each having a respective number of the target that is greater than a threshold number of the target.
- Example 18 includes the system of Example 17 wherein the barrier-phase liquid includes an oil.
- Example 19 includes the system of any of Examples 17-18 wherein the container includes a clear tube.
- Example 20 includes the system of any of Examples 17-19 wherein the detector includes an electronic detector.
- Example 21 includes the system of any of Examples 17-20 wherein the detector is configured to determine a number of the compartments.
- Example 22 includes the system of any of Examples 17-21, further comprising an apparatus configured to obtain the sample from a source including the target.
- Example 23 includes the system of any of Examples 17-22, further comprising a computer-readable medium storing instructions that, when executed by a computing circuit, cause the computing circuit to determine a bulk concentration of the target in a source of the sample in response to the number of the compartments each having a respective number of the target that is greater than a threshold number of the target.
- Example 24 includes a method, comprising: generating compartments of a sample, at least one of the compartments having a respective volume that is different from a respective volume of each of at least another one of the compartments; determining a number of the compartments each having a respective number of a target that is greater than a threshold number of the target; and determining a bulk concentration of the target in a source of the sample in response to the number of the compartments.
- Example 25 includes the method of Example 24 wherein generating the compartments includes generating the compartments suspended in a barrier phase by shaking a container that includes the sample and the barrier phase.
- Example 26 includes the method of any of Examples 24-25 wherein generating the compartments includes generating droplets suspended in a liquid by shaking a container that includes the sample and the liquid.
- Example 27 includes the method of any of Examples 24-26 wherein determining the number of compartments each having a respective number of the target that is greater than the threshold number of the target includes determining the number of compartments in response to a wavelength of electromagnetic energy at which each of the number of the compartments luminesces.
- Example 28 includes the method of any of Examples 24-27 wherein determining the number of the compartments each having a respective number of the target that is greater than the threshold number of the target includes determining the number of compartments in response to a wavelength of electromagnetic energy that each of the number of the compartments absorbs.
- Example 29 includes the method of any of Examples 24-28 wherein determining the number of the compartments each having a respective number of the target that is greater than the threshold number of the target includes determining the number of compartments in response to a wavelength of electromagnetic energy that each of the number of the compartments passes.
- Example 30 includes the method of any of Examples 24-29 wherein determining the number of the compartments each having a respective number of the target that is greater than the threshold number of the target includes determining the number of compartments in response to a wavelength of electromagnetic energy that each of the number of the compartments blocks.
- Example 31 includes the method of any of Examples 24-30 wherein determining the bulk concentration of the target in the source of the sample includes determining the bulk concentration in response to a respective measured volume of each of the number of compartments.
- Example 32 includes the method of any of Examples 24-31 wherein determining the bulk concentration of the target in the source of the sample includes determining the bulk concentration in response to a sum of a respective measured volume of each of the compartments.
- Example 33 includes the method of any of Examples 24-32 wherein determining the bulk concentration of the target in the source of the sample includes determining the bulk concentration in response to a number of the compartments.
- Example 34 includes the method of any of Examples 24-33 wherein determining the bulk concentration of the target in the source of the sample includes determining the bulk concentration in response to a number of other compartments.
- Example 35 includes the method of any of Examples 24-34 wherein determining the bulk concentration of the target in the source of the sample includes determining the bulk concentration in response to a respective measured volume of each of other compartments.
- Example 36 includes the method of any of Examples 24-35 wherein determining the bulk concentration of the target in the source of the sample includes determining the bulk concentration in response to a number of other compartments and a respective measured volume of each of the other compartments.
- Example 37 includes the method of any of Examples 24-36 wherein determining the bulk concentration of the target in the source of the sample includes determining the bulk concentration in response to a probability density function of compartment volume.
- Example 38 includes a tangible non-transitory computer-readable medium storing instructions that, when executed by a computing circuit, cause the computing circuit: to determine a number of compartments of a sample each having a respective number of a target that is greater than a threshold number of the target, at least one of the compartments having a respective volume that is different from a respective volume of each of at least another one of the compartments; and to determine a bulk concentration of the target in a source of the sample in response to the determined number of compartments.
- any of one, more, or all of the above-described operations and functions can be performed by electronic circuitry that is hardwire configured to perform one or more operations or functions, that is configured to execute program instructions to perform one or more operations or functions, that is configured with firmware, or otherwise configured, to perform one or more operations or functions, or that is configured with a combination of two or more of the aforementioned configurations.
- one or more of the components of the computer 54 of FIG. 11 can include such electronic circuitry.
- one or more components of a described apparatus or system may have been omitted from the description for clarity or another reason.
- one or more components of a described apparatus or system that have been included in the description may be omitted from the apparatus or system.
- one or more steps of a described method may have been omitted from the description for clarity or another reason.
- one or more steps of a described methods that have been included in the description may be omitted from the method.
Landscapes
- Chemical & Material Sciences (AREA)
- Health & Medical Sciences (AREA)
- Organic Chemistry (AREA)
- Engineering & Computer Science (AREA)
- Life Sciences & Earth Sciences (AREA)
- Analytical Chemistry (AREA)
- General Health & Medical Sciences (AREA)
- Chemical Kinetics & Catalysis (AREA)
- Zoology (AREA)
- Wood Science & Technology (AREA)
- Proteomics, Peptides & Aminoacids (AREA)
- Clinical Laboratory Science (AREA)
- Hematology (AREA)
- Microbiology (AREA)
- Genetics & Genomics (AREA)
- Molecular Biology (AREA)
- Biotechnology (AREA)
- Biophysics (AREA)
- Physics & Mathematics (AREA)
- Biochemistry (AREA)
- Bioinformatics & Cheminformatics (AREA)
- General Engineering & Computer Science (AREA)
- Immunology (AREA)
- Computer Hardware Design (AREA)
- Materials Engineering (AREA)
- Mechanical Engineering (AREA)
- Metallurgy (AREA)
- Automatic Analysis And Handling Materials Therefor (AREA)
- Investigating Or Analysing Biological Materials (AREA)
- Investigating Or Analysing Materials By Optical Means (AREA)
- Sampling And Sample Adjustment (AREA)
Abstract
Description
A derivation and explanation of equation (1) is included below.
where m is the characterized number of droplets and each vi_characterized is the characterized volume of a respective one of the m droplets as described above in conjunction with
| TABLE 1 |
| Definitions of mathematical symbols. |
| Symbol | Definition | ||
| {circumflex over (x)} | Estimator of a particular parameter | ||
| denoted as x | |||
| |
Expectation of the quantity x over a | ||
| certain distribution | |||
| λT | Bulk concentration (number of | ||
| targets/unit volume) | |||
| {circumflex over (λ)}T | Estimator of λT (inferred from the | ||
| assay result) | |||
| Λ ≡ ln(λT) | Natural log of bulk concentration | ||
| {circumflex over (Λ)} | Estimator of Λ (inferred from the | ||
| assay result) | |||
|
|
Standard error of {circumflex over (Λ)} | ||
| Λ0 | A with smallest |
||
| N | Total number of compartments | ||
| Vtotal | Total volume of compartments | ||
| A | Number of ON compartments | ||
| A ≡ {v1, v2, . . . , va} | Set of volumes of ON compartments | ||
| b ≡ n - a | Number of OFF compartments | ||
|
|
Total Volume of OFF compartments | ||
| M | Number of pre-measured (test or | ||
| characterization) volumes | |||
| M ≡ {v1, v2, . . . , vm} | Set of pre-measured (test or | ||
| characterization) volumes | |||
| f(v) | Volume probability density function | ||
| μv | Mean volume | ||
| σv | Standard deviation of volume | ||
| μlnV | Geometric mean of volume | ||
| W | Product logarithm function (also | ||
| known as Lambert W function) | |||
Digital Variable Volume (DVV)
Πi=1 a p each(λT ,v i)Πi=1 b[1−p each(λT ,v i)]=Πi=1 a(1−e −v
p on(λT)=∫ƒ(v)p each(λT ,v)dv=∫ƒ(v)(1−e −vλ
((equation (2)).
can be plugged into equation (k), and the subsequent result can be plugged into equation (l) to obtain the following expression for
Claims (16)
Priority Applications (7)
| Application Number | Priority Date | Filing Date | Title |
|---|---|---|---|
| US16/200,447 US11305284B2 (en) | 2018-11-26 | 2018-11-26 | Determining a bulk concentration of a target in a sample using a digital assay with compartments having nonuniform volumes |
| PCT/US2019/062367 WO2020112456A1 (en) | 2018-11-26 | 2019-11-20 | Determining a bulk concentration of a target in a sample using a digital assay with compartments having nonuniform volumes |
| CN201980077639.0A CN113167697B (en) | 2018-11-26 | 2019-11-20 | Digital experiment using compartments with non-uniform volumes to determine the volume concentration of a target in a sample |
| EP19890189.4A EP3887796A4 (en) | 2018-11-26 | 2019-11-20 | DETERMINATION OF THE MASS CONCENTRATION OF A TARGET IN A SAMPLE BY DIGITAL ASSAY WITH COMPARTMENTS HAVING NON-UNIFORM VOLUMES |
| JP2021529411A JP7266679B2 (en) | 2018-11-26 | 2019-11-20 | Determination of Bulk Concentrations of Targets in Samples Using Digital Analysis with Compartments with Non-Uniform Volumes |
| US17/689,539 US11577247B2 (en) | 2018-11-26 | 2022-03-08 | Determining a bulk concentration of a target in a sample using a digital assay with compartments having nonuniform volumes |
| US18/151,011 US12097499B2 (en) | 2018-11-26 | 2023-01-06 | Determining a bulk concentration of a target in a sample using a digital assay with compartments having nonuniform volumes |
Applications Claiming Priority (1)
| Application Number | Priority Date | Filing Date | Title |
|---|---|---|---|
| US16/200,447 US11305284B2 (en) | 2018-11-26 | 2018-11-26 | Determining a bulk concentration of a target in a sample using a digital assay with compartments having nonuniform volumes |
Related Child Applications (1)
| Application Number | Title | Priority Date | Filing Date |
|---|---|---|---|
| US17/689,539 Continuation US11577247B2 (en) | 2018-11-26 | 2022-03-08 | Determining a bulk concentration of a target in a sample using a digital assay with compartments having nonuniform volumes |
Publications (2)
| Publication Number | Publication Date |
|---|---|
| US20200164364A1 US20200164364A1 (en) | 2020-05-28 |
| US11305284B2 true US11305284B2 (en) | 2022-04-19 |
Family
ID=70771275
Family Applications (3)
| Application Number | Title | Priority Date | Filing Date |
|---|---|---|---|
| US16/200,447 Active 2040-01-26 US11305284B2 (en) | 2018-11-26 | 2018-11-26 | Determining a bulk concentration of a target in a sample using a digital assay with compartments having nonuniform volumes |
| US17/689,539 Active 2038-11-26 US11577247B2 (en) | 2018-11-26 | 2022-03-08 | Determining a bulk concentration of a target in a sample using a digital assay with compartments having nonuniform volumes |
| US18/151,011 Active US12097499B2 (en) | 2018-11-26 | 2023-01-06 | Determining a bulk concentration of a target in a sample using a digital assay with compartments having nonuniform volumes |
Family Applications After (2)
| Application Number | Title | Priority Date | Filing Date |
|---|---|---|---|
| US17/689,539 Active 2038-11-26 US11577247B2 (en) | 2018-11-26 | 2022-03-08 | Determining a bulk concentration of a target in a sample using a digital assay with compartments having nonuniform volumes |
| US18/151,011 Active US12097499B2 (en) | 2018-11-26 | 2023-01-06 | Determining a bulk concentration of a target in a sample using a digital assay with compartments having nonuniform volumes |
Country Status (5)
| Country | Link |
|---|---|
| US (3) | US11305284B2 (en) |
| EP (1) | EP3887796A4 (en) |
| JP (1) | JP7266679B2 (en) |
| CN (1) | CN113167697B (en) |
| WO (1) | WO2020112456A1 (en) |
Citations (7)
| Publication number | Priority date | Publication date | Assignee | Title |
|---|---|---|---|---|
| WO2009048673A2 (en) | 2007-07-26 | 2009-04-16 | University Of Chicago | Stochastic confinement to detect, manipulate, and utilize molecules and organisms |
| US20140106359A1 (en) | 2012-10-15 | 2014-04-17 | Bio-Rad Laboratories, Inc. | Digital telomerase assay |
| US9428793B2 (en) | 2011-01-20 | 2016-08-30 | University Of Washington Through Its Center For Commercialization | Methods and systems for performing digital measurements |
| US20160312274A1 (en) | 2015-04-24 | 2016-10-27 | Life Technologies Corporation | Methods and systems for volume variation modeling in digital pcr |
| US20170175174A1 (en) * | 2014-04-08 | 2017-06-22 | University Of Washington Through Its Center For Commercialization | Methods and apparatus for performing digital assays using polydisperse droplets |
| JP2017207282A (en) | 2016-05-16 | 2017-11-24 | 日本電信電話株式会社 | Constituent concentration measurement device and constituent concentration measurement method |
| US20180321137A1 (en) | 2015-11-06 | 2018-11-08 | California Institute Of Technology | Devices and methods for direct visual detection and readout of single nucleic acid molecules |
Family Cites Families (13)
| Publication number | Priority date | Publication date | Assignee | Title |
|---|---|---|---|---|
| US20130017551A1 (en) | 2011-07-13 | 2013-01-17 | Bio-Rad Laboratories, Inc. | Computation of real-world error using meta-analysis of replicates |
| US9417190B2 (en) | 2008-09-23 | 2016-08-16 | Bio-Rad Laboratories, Inc. | Calibrations and controls for droplet-based assays |
| DE102009001860A1 (en) * | 2009-03-25 | 2010-09-30 | Endress + Hauser Conducta Gesellschaft für Mess- und Regeltechnik mbH + Co. KG | Method for determining a number of drops |
| CN104053784B (en) * | 2011-11-17 | 2017-04-19 | 好奇诊断有限责任公司 | Method For Performing Quantitation Assays |
| US8912007B2 (en) * | 2013-01-22 | 2014-12-16 | Tecan Trading Ag | Optical measuring apparatus and method for the analysis of samples contained in liquid drops |
| CN107364237B (en) * | 2013-04-26 | 2019-09-10 | 科迪华公司 | For the method and apparatus to pad-ink the drop measurement and control of deposits fluid in precision tolerances |
| EP3024948B1 (en) | 2013-07-25 | 2020-01-15 | Bio-rad Laboratories, Inc. | Genetic assays for detecting viral recombination rate |
| WO2016160812A1 (en) | 2015-03-31 | 2016-10-06 | White Dog Labs, Inc. | Method of producing bioproducts |
| US10450598B2 (en) * | 2015-09-11 | 2019-10-22 | Illumina, Inc. | Systems and methods for obtaining a droplet having a designated concentration of a substance-of-interest |
| WO2017117490A1 (en) * | 2015-12-30 | 2017-07-06 | Bio-Rad Laboratories, Inc. | Droplet assay system with automatic calibration |
| EP3299470B1 (en) * | 2016-09-23 | 2019-10-30 | Roche Diagniostics GmbH | A method for reducing quantification errors caused by reaction volume deviations in digital polymerase chain reaction |
| CN107844683B (en) * | 2017-10-17 | 2020-05-12 | 领航基因科技(杭州)有限公司 | Method for calculating concentration of digital PCR (polymerase chain reaction) liquid drops |
| WO2019089996A1 (en) * | 2017-11-03 | 2019-05-09 | University Of Washington | Digital nucleic acid amplification using encoded particles |
-
2018
- 2018-11-26 US US16/200,447 patent/US11305284B2/en active Active
-
2019
- 2019-11-20 EP EP19890189.4A patent/EP3887796A4/en active Pending
- 2019-11-20 WO PCT/US2019/062367 patent/WO2020112456A1/en not_active Ceased
- 2019-11-20 JP JP2021529411A patent/JP7266679B2/en active Active
- 2019-11-20 CN CN201980077639.0A patent/CN113167697B/en active Active
-
2022
- 2022-03-08 US US17/689,539 patent/US11577247B2/en active Active
-
2023
- 2023-01-06 US US18/151,011 patent/US12097499B2/en active Active
Patent Citations (8)
| Publication number | Priority date | Publication date | Assignee | Title |
|---|---|---|---|---|
| WO2009048673A2 (en) | 2007-07-26 | 2009-04-16 | University Of Chicago | Stochastic confinement to detect, manipulate, and utilize molecules and organisms |
| US20100227767A1 (en) | 2007-07-26 | 2010-09-09 | Boedicker James Q | Stochastic confinement to detect, manipulate, and utilize molecules and organisms |
| US9428793B2 (en) | 2011-01-20 | 2016-08-30 | University Of Washington Through Its Center For Commercialization | Methods and systems for performing digital measurements |
| US20140106359A1 (en) | 2012-10-15 | 2014-04-17 | Bio-Rad Laboratories, Inc. | Digital telomerase assay |
| US20170175174A1 (en) * | 2014-04-08 | 2017-06-22 | University Of Washington Through Its Center For Commercialization | Methods and apparatus for performing digital assays using polydisperse droplets |
| US20160312274A1 (en) | 2015-04-24 | 2016-10-27 | Life Technologies Corporation | Methods and systems for volume variation modeling in digital pcr |
| US20180321137A1 (en) | 2015-11-06 | 2018-11-08 | California Institute Of Technology | Devices and methods for direct visual detection and readout of single nucleic acid molecules |
| JP2017207282A (en) | 2016-05-16 | 2017-11-24 | 日本電信電話株式会社 | Constituent concentration measurement device and constituent concentration measurement method |
Non-Patent Citations (32)
| Title |
|---|
| "Dolomite Microfluidics Control Particle Production", Dolomite, accessed from the web on Feb. 14, 2019, pp. 1-4, www.dolomite-microfluidics.com. |
| Basu, "Digital Assays Part I: Partitioning Statistics and Digital PCR", Micro- and Nanotechnologies for Quantitative Biology and Medicine, 2017, pp. 369-386, vol. 22(4), Society for Laboratory Automation and Screening Technology. |
| Basu, "Digital Assays Part II: Digital Protein and Cell Assays", Micro- and Nanotechnologies for Quantitative Biology and Medicine, 2017, pp. 387-405, vol. 22(4), Society for Laboratory Automation and Screening Technology. |
| Biorad, "Droplet Digital PCR Applications Guide", published no later than Oct. 9, 2018—actual published date not available, pp. 1-145, Bio-Rad Laboratories, Inc. |
| Boedicker et al., "Detecting bacteria and determining their susceptibility to antibiotics by stochastic confinement in nanoliter droplets using plug-based microfluidics", Lab Chip, Aug. 2008, pp. 1-15, National Institute of Health. |
| Boxall et al., "Measurement and Calibration of Droplet Size Distributions in Water-in-Oil Emulsions by Particle Video Microscope and a Focused Beam Reflectance Method", Ind. Eng. Chem. Res., published on web Dec. 18, 2009, pp. 1412-1418, American Chemical Society. |
| Byrnes et al., "Polydisperse emulsion digital assay to enhance time to detection and extend dynamic range in bacterial cultures enabled by a statistical framework", Analyst, 2018, pp. 2828-2836, The Royal Society of Chemistry. |
| Byrnes et al., "Simple Polydisperse Droplet Emulsion Polymerase Chain Reaction with Statistical Volumetric Correction Compared with Micrfluidic Droplet Digital Polymerase Chain Reation", Analytical Chemistry, Jul. 9, 2018, pp. 9374-9380, American Chemical Society. |
| Chern et al., "Comparison of quantitative PCR assays for Escherichia coli targeting ribosomal RNA and single copy genes", Letters in Applied Microbiology, accepted Dec. 22, 2010, pp. 298-306, The Society for Applied Microbiology. |
| Chunyk et al., "A Multi-site In-depth Evaluation of the Quanterix Simoa from a User's Perspective", The AAPS Journal, Dec. 1, 2017, pp. 1-12, America Association of Pharmaceutical Scientists. |
| Cochran, "Estimation of Bacterial Densities by Means of the ‘Most Probable Number’", Biometrics, Jun. 1950, pp. 105-116, vol. 6, No. 2, International Biometric Society. |
| Dong et al., "Comparison of four digital PCT platforms for accurate quantification of DNA copy of number of a certified plasmid DNA reference material", Scientific Reports, Aug. 25, 2015, pp. 1-11, www.nature.com/scientificreports. |
| Du et al., "SlipChip", Lab Chip, May 15, 2009, pp. 2286-2292, The Royal Society of Chemistry. |
| Efron et al., "Assessing the accuracy of the maximum likelihood estimator" Observed versus expected Fisher information, Biometrika, Dec. 1978, pp. 457-482 (excluding cover page), vol. 65, No. 3, Biometrika Trust. |
| Fazekas, "The Evaluation of Limiting Dilution Assays", Journal of Immunological Methods, 1982, pp. R11-R23, Elsevier Biomedical Press. |
| Greene, "Econometric Analysis, 7th Edition, International Edition", New York University, 2012, pp. 1-1241, Pearson Education Limited. |
| Gupta et al., "Nanoemulsions: formation, properties and applications", Soft Matter, 2016, pp. 2826-2841, The Royal Society of Chemistry. |
| Huggett et al., "Considerations for Digital PCR as an Accurate Molecular Diagnostic Tool", Clinical Chemistry, 2015, pp. 79-88, American Association for Clinical Chemistry. |
| Huggett et al., "The Digital MIQE Guidelines: Minimum Information for Publication of Quantitative Digital PCR Experiments", Special Report, 2013, pp. 892-902, Clinical Chemistry. |
| Kosir et al., "Droplet volume variability as a critical factor for accuracy of absolute quantification using droplet digital PCR", Anal. Bioanal. Chem., Sep. 18, 2017, pp. 6689-6697, CrossMark. |
| Kruetz et al., "Theoretical Design and Analysis of Multivolume Digital Assays with Wide Dynamic Range Validated Experimentally with Microfluidic Digital PCR", Analytical Chemistry, Oct. 7, 2011, pp. 8158-8168, American Chemical Society. |
| Lechevallier et al., "Proceedings of COMPSTAT' 2010", 19th International Conference on Computational Statistics, Aug. 22-27, 2010, pp. 1-30, Physica-Verlag. |
| Life Science Technologies, "New Products", AAAS/Science Business Office Feature, accessed from www.science.sciencemag.org on Feb. 14, 2019, p. 280, sciencemag.org. |
| Majumdar, et al., "Poisson Plus Quantification for Digital PCR Systems", Scientific Reports, Aug. 29, 2017, pp. 1-10, www.nature.com/scientificreports/. |
| Morley, "Digital PCR: A brief history", Biomolecular Detection and Quantification, Aug. 15, 2014, pp. 1-2, Elsevier. |
| PCT International Search Report; International App. No. PCT/US2019/062367; dated Mar. 10, 2020 pp. 1-4. |
| Rissin et al., "Single-Molecule enzyme-linked immunosorbent assay detects serum proteins at subfemtomolar concentrations", National Biotechnology, Jun. 2010, pp. 1-21. |
| Stilla, "Crystal Digital PCR The NAICA System Workflow", no later than Dec. 31, 2017, pp. 1-5. |
| Sykes et al., "Quantitation of Targets for PCR by Use of Limiting Dilution", Research Report, 1992, pp. 444-449, vol. 13, No. 3, BioTechniques. |
| Tellinghuisen, "Partition Volume Variability in Digital Polymerase Chain Reaction Methods: Polydispersity Causes Bias but Can Improve Precision", Analytical Chemistry, Nov. 15, 2016, pp. 12183-12187, American Chemical Society. |
| Ushikubo et al., "Stability mechanisms of liquid water-in-oil emulsions", Faculty of Food Engineering, accepted Nov. 12, 2012, pp. 145-153, Elsevier. |
| Vynck et al., "Reducing Bias in Digital PCT Quantification Experiments: The Importance of Appropriately Modeling Volume Variability", Analytical Chemistry, May 9, 2018, pp. 1-23, American Chemical Society. |
Also Published As
| Publication number | Publication date |
|---|---|
| US12097499B2 (en) | 2024-09-24 |
| CN113167697A (en) | 2021-07-23 |
| EP3887796A4 (en) | 2022-08-03 |
| US20230149932A1 (en) | 2023-05-18 |
| CN113167697B (en) | 2024-08-06 |
| JP7266679B2 (en) | 2023-04-28 |
| JP2022516222A (en) | 2022-02-25 |
| WO2020112456A1 (en) | 2020-06-04 |
| US20220193661A1 (en) | 2022-06-23 |
| US20200164364A1 (en) | 2020-05-28 |
| EP3887796A1 (en) | 2021-10-06 |
| US11577247B2 (en) | 2023-02-14 |
Similar Documents
| Publication | Publication Date | Title |
|---|---|---|
| Luka et al. | Portable device for the detection of colorimetric assays | |
| Liu et al. | Overcoming challenges in single particle inductively coupled plasma mass spectrometry measurement of silver nanoparticles | |
| US10371639B2 (en) | Detecting fluorescent material in a stained particle by comparison with an unstained particle over a plurality of frequency bands and by estimating a linear combination of base vectors | |
| US10429311B2 (en) | Methods and systems for analyzing a liquid medium | |
| CN103930886A (en) | Computation of real-world error using META-analysis of replicates | |
| CN113227755A (en) | Assay accuracy improvement | |
| US12097499B2 (en) | Determining a bulk concentration of a target in a sample using a digital assay with compartments having nonuniform volumes | |
| Floor et al. | Combined uncertainty estimation for the determination of the dissolved iron amount content in seawater using flow injection with chemiluminescence detection | |
| Harlaux et al. | Capabilities of sequential and quasi-simultaneous LA-ICPMS for the multi-element analysis of small quantity of liquids (pl to nl): insights from fluid inclusion analysis | |
| WO2021102942A1 (en) | Random emulsification digital absolute quantitative analysis method and device | |
| US20230121472A1 (en) | Detecting an analyte in a medium | |
| Janzen et al. | The effect of alcohols as the third component on diffusion in mixtures of aromatics and ketones | |
| US20250130159A1 (en) | A device for detecting particles in fluid and a process for detecting said particles | |
| US8760646B2 (en) | Method and apparatus for measuring size of microparticles | |
| Kurta et al. | Fluctuation X-ray scattering from nanorods in solution reveals weak temperature-dependent orientational ordering | |
| Snook et al. | Furthering the Capabilities of Diffusive-Gradient Passive Samplers for Per-and Polyfluoroalkyl Substances | |
| US20240280459A1 (en) | Evaluation apparatus and evaluation method | |
| Fairuz et al. | Parameter estimation methods for bivariate copula in financial application | |
| Smith et al. | Sample to answer visualization pipeline for low-cost point-of-care blood cell counting | |
| EP4654158A1 (en) | Improved immunoassay | |
| Stancheva et al. | quantitative chemical analysis based on computer processing image of the turbid solution | |
| EP3709302A1 (en) | Material sample, display method, and estimation method | |
| CN121037694A (en) | Autofocusing methods, electronic devices, and storage media based on micro-flow cells | |
| Brown et al. | Observation of a physical matrix effect during cold vapour generation measurement of mercury in emissions samples | |
| US20180024114A1 (en) | System for measuring total hemoglobin in blood and method of doing the same |
Legal Events
| Date | Code | Title | Description |
|---|---|---|---|
| FEPP | Fee payment procedure |
Free format text: ENTITY STATUS SET TO UNDISCOUNTED (ORIGINAL EVENT CODE: BIG.); ENTITY STATUS OF PATENT OWNER: LARGE ENTITY |
|
| AS | Assignment |
Owner name: TOKITAE LLC, WASHINGTON Free format text: ASSIGNMENT OF ASSIGNORS INTEREST;ASSIGNORS:HUYNH, TOAN;WEIGL, BERNHARD HANS;BYRNES, SAMANTHA A.;AND OTHERS;SIGNING DATES FROM 20181226 TO 20190117;REEL/FRAME:048104/0334 |
|
| STPP | Information on status: patent application and granting procedure in general |
Free format text: NON FINAL ACTION MAILED |
|
| STPP | Information on status: patent application and granting procedure in general |
Free format text: RESPONSE TO NON-FINAL OFFICE ACTION ENTERED AND FORWARDED TO EXAMINER |
|
| STPP | Information on status: patent application and granting procedure in general |
Free format text: FINAL REJECTION MAILED |
|
| STPP | Information on status: patent application and granting procedure in general |
Free format text: DOCKETED NEW CASE - READY FOR EXAMINATION |
|
| STPP | Information on status: patent application and granting procedure in general |
Free format text: NOTICE OF ALLOWANCE MAILED -- APPLICATION RECEIVED IN OFFICE OF PUBLICATIONS |
|
| STPP | Information on status: patent application and granting procedure in general |
Free format text: AWAITING TC RESP, ISSUE FEE PAYMENT VERIFIED |
|
| STPP | Information on status: patent application and granting procedure in general |
Free format text: PUBLICATIONS -- ISSUE FEE PAYMENT VERIFIED |
|
| STCF | Information on status: patent grant |
Free format text: PATENTED CASE |
|
| FEPP | Fee payment procedure |
Free format text: MAINTENANCE FEE REMINDER MAILED (ORIGINAL EVENT CODE: REM.); ENTITY STATUS OF PATENT OWNER: LARGE ENTITY |