[go: up one dir, main page]

US10739798B2 - Incipient temperature excursion mitigation and control - Google Patents

Incipient temperature excursion mitigation and control Download PDF

Info

Publication number
US10739798B2
US10739798B2 US15/972,974 US201815972974A US10739798B2 US 10739798 B2 US10739798 B2 US 10739798B2 US 201815972974 A US201815972974 A US 201815972974A US 10739798 B2 US10739798 B2 US 10739798B2
Authority
US
United States
Prior art keywords
temperature
reactor
catalyst bed
cause
data associated
Prior art date
Legal status (The legal status is an assumption and is not a legal conclusion. Google has not performed a legal analysis and makes no representation as to the accuracy of the status listed.)
Active, expires
Application number
US15/972,974
Other versions
US20180364747A1 (en
Inventor
Jorge Charr
Donald Eizenga
Raul A. Ohaco
Ralph P. Davis
Christina L. Haasser
James W. Harris
Kevin Carnes
Daliah Papoutsis
Current Assignee (The listed assignees may be inaccurate. Google has not performed a legal analysis and makes no representation or warranty as to the accuracy of the list.)
Honeywell UOP LLC
Original Assignee
UOP LLC
Priority date (The priority date is an assumption and is not a legal conclusion. Google has not performed a legal analysis and makes no representation as to the accuracy of the date listed.)
Filing date
Publication date
Application filed by UOP LLC filed Critical UOP LLC
Priority to US15/972,974 priority Critical patent/US10739798B2/en
Priority to EP18821040.5A priority patent/EP3642678A4/en
Priority to PCT/US2018/038286 priority patent/WO2018236869A1/en
Priority to CN201880040522.0A priority patent/CN110753888A/en
Assigned to UOP LLC reassignment UOP LLC ASSIGNMENT OF ASSIGNORS INTEREST (SEE DOCUMENT FOR DETAILS). Assignors: DAVIS, RALPH P., HARRIS, JAMES W., CARNES, KEVIN, EIZENGA, DONALD, PAPOUTSIS, DALIAH, CHARR, Jorge, HAASSER, CHRISTINA L., OHACO, RAUL A.
Publication of US20180364747A1 publication Critical patent/US20180364747A1/en
Application granted granted Critical
Publication of US10739798B2 publication Critical patent/US10739798B2/en
Active legal-status Critical Current
Adjusted expiration legal-status Critical

Links

Images

Classifications

    • BPERFORMING OPERATIONS; TRANSPORTING
    • B01PHYSICAL OR CHEMICAL PROCESSES OR APPARATUS IN GENERAL
    • B01JCHEMICAL OR PHYSICAL PROCESSES, e.g. CATALYSIS OR COLLOID CHEMISTRY; THEIR RELEVANT APPARATUS
    • B01J8/00Chemical or physical processes in general, conducted in the presence of fluids and solid particles; Apparatus for such processes
    • B01J8/001Controlling catalytic processes
    • GPHYSICS
    • G05CONTROLLING; REGULATING
    • G05DSYSTEMS FOR CONTROLLING OR REGULATING NON-ELECTRIC VARIABLES
    • G05D23/00Control of temperature
    • G05D23/19Control of temperature characterised by the use of electric means
    • G05D23/1927Control of temperature characterised by the use of electric means using a plurality of sensors
    • G05D23/193Control of temperature characterised by the use of electric means using a plurality of sensors sensing the temperaure in different places in thermal relationship with one or more spaces
    • G05D23/1932Control of temperature characterised by the use of electric means using a plurality of sensors sensing the temperaure in different places in thermal relationship with one or more spaces to control the temperature of a plurality of spaces
    • G05D23/1934Control of temperature characterised by the use of electric means using a plurality of sensors sensing the temperaure in different places in thermal relationship with one or more spaces to control the temperature of a plurality of spaces each space being provided with one sensor acting on one or more control means
    • BPERFORMING OPERATIONS; TRANSPORTING
    • B01PHYSICAL OR CHEMICAL PROCESSES OR APPARATUS IN GENERAL
    • B01JCHEMICAL OR PHYSICAL PROCESSES, e.g. CATALYSIS OR COLLOID CHEMISTRY; THEIR RELEVANT APPARATUS
    • B01J19/00Chemical, physical or physico-chemical processes in general; Their relevant apparatus
    • B01J19/0006Controlling or regulating processes
    • B01J19/0013Controlling the temperature of the process
    • BPERFORMING OPERATIONS; TRANSPORTING
    • B01PHYSICAL OR CHEMICAL PROCESSES OR APPARATUS IN GENERAL
    • B01JCHEMICAL OR PHYSICAL PROCESSES, e.g. CATALYSIS OR COLLOID CHEMISTRY; THEIR RELEVANT APPARATUS
    • B01J19/00Chemical, physical or physico-chemical processes in general; Their relevant apparatus
    • B01J19/0006Controlling or regulating processes
    • B01J19/002Avoiding undesirable reactions or side-effects, e.g. avoiding explosions, or improving the yield by suppressing side-reactions
    • BPERFORMING OPERATIONS; TRANSPORTING
    • B01PHYSICAL OR CHEMICAL PROCESSES OR APPARATUS IN GENERAL
    • B01JCHEMICAL OR PHYSICAL PROCESSES, e.g. CATALYSIS OR COLLOID CHEMISTRY; THEIR RELEVANT APPARATUS
    • B01J19/00Chemical, physical or physico-chemical processes in general; Their relevant apparatus
    • B01J19/0006Controlling or regulating processes
    • B01J19/0033Optimalisation processes, i.e. processes with adaptive control systems
    • CCHEMISTRY; METALLURGY
    • C10PETROLEUM, GAS OR COKE INDUSTRIES; TECHNICAL GASES CONTAINING CARBON MONOXIDE; FUELS; LUBRICANTS; PEAT
    • C10GCRACKING HYDROCARBON OILS; PRODUCTION OF LIQUID HYDROCARBON MIXTURES, e.g. BY DESTRUCTIVE HYDROGENATION, OLIGOMERISATION, POLYMERISATION; RECOVERY OF HYDROCARBON OILS FROM OIL-SHALE, OIL-SAND, OR GASES; REFINING MIXTURES MAINLY CONSISTING OF HYDROCARBONS; REFORMING OF NAPHTHA; MINERAL WAXES
    • C10G45/00Refining of hydrocarbon oils using hydrogen or hydrogen-generating compounds
    • C10G45/72Controlling or regulating
    • CCHEMISTRY; METALLURGY
    • C10PETROLEUM, GAS OR COKE INDUSTRIES; TECHNICAL GASES CONTAINING CARBON MONOXIDE; FUELS; LUBRICANTS; PEAT
    • C10GCRACKING HYDROCARBON OILS; PRODUCTION OF LIQUID HYDROCARBON MIXTURES, e.g. BY DESTRUCTIVE HYDROGENATION, OLIGOMERISATION, POLYMERISATION; RECOVERY OF HYDROCARBON OILS FROM OIL-SHALE, OIL-SAND, OR GASES; REFINING MIXTURES MAINLY CONSISTING OF HYDROCARBONS; REFORMING OF NAPHTHA; MINERAL WAXES
    • C10G47/00Cracking of hydrocarbon oils, in the presence of hydrogen or hydrogen- generating compounds, to obtain lower boiling fractions
    • C10G47/36Controlling or regulating
    • BPERFORMING OPERATIONS; TRANSPORTING
    • B01PHYSICAL OR CHEMICAL PROCESSES OR APPARATUS IN GENERAL
    • B01JCHEMICAL OR PHYSICAL PROCESSES, e.g. CATALYSIS OR COLLOID CHEMISTRY; THEIR RELEVANT APPARATUS
    • B01J2208/00Processes carried out in the presence of solid particles; Reactors therefor
    • B01J2208/00008Controlling the process
    • B01J2208/00017Controlling the temperature
    • B01J2208/00026Controlling or regulating the heat exchange system
    • B01J2208/00035Controlling or regulating the heat exchange system involving measured parameters
    • B01J2208/00044Temperature measurement
    • B01J2208/00061Temperature measurement of the reactants
    • BPERFORMING OPERATIONS; TRANSPORTING
    • B01PHYSICAL OR CHEMICAL PROCESSES OR APPARATUS IN GENERAL
    • B01JCHEMICAL OR PHYSICAL PROCESSES, e.g. CATALYSIS OR COLLOID CHEMISTRY; THEIR RELEVANT APPARATUS
    • B01J2208/00Processes carried out in the presence of solid particles; Reactors therefor
    • B01J2208/00008Controlling the process
    • B01J2208/00017Controlling the temperature
    • B01J2208/00026Controlling or regulating the heat exchange system
    • B01J2208/00035Controlling or regulating the heat exchange system involving measured parameters
    • B01J2208/0007Pressure measurement
    • BPERFORMING OPERATIONS; TRANSPORTING
    • B01PHYSICAL OR CHEMICAL PROCESSES OR APPARATUS IN GENERAL
    • B01JCHEMICAL OR PHYSICAL PROCESSES, e.g. CATALYSIS OR COLLOID CHEMISTRY; THEIR RELEVANT APPARATUS
    • B01J2208/00Processes carried out in the presence of solid particles; Reactors therefor
    • B01J2208/00008Controlling the process
    • B01J2208/00017Controlling the temperature
    • B01J2208/00026Controlling or regulating the heat exchange system
    • B01J2208/00035Controlling or regulating the heat exchange system involving measured parameters
    • B01J2208/00088Flow rate measurement
    • BPERFORMING OPERATIONS; TRANSPORTING
    • B01PHYSICAL OR CHEMICAL PROCESSES OR APPARATUS IN GENERAL
    • B01JCHEMICAL OR PHYSICAL PROCESSES, e.g. CATALYSIS OR COLLOID CHEMISTRY; THEIR RELEVANT APPARATUS
    • B01J2208/00Processes carried out in the presence of solid particles; Reactors therefor
    • B01J2208/00008Controlling the process
    • B01J2208/00017Controlling the temperature
    • B01J2208/00106Controlling the temperature by indirect heat exchange
    • B01J2208/00168Controlling the temperature by indirect heat exchange with heat exchange elements outside the bed of solid particles
    • BPERFORMING OPERATIONS; TRANSPORTING
    • B01PHYSICAL OR CHEMICAL PROCESSES OR APPARATUS IN GENERAL
    • B01JCHEMICAL OR PHYSICAL PROCESSES, e.g. CATALYSIS OR COLLOID CHEMISTRY; THEIR RELEVANT APPARATUS
    • B01J2208/00Processes carried out in the presence of solid particles; Reactors therefor
    • B01J2208/00008Controlling the process
    • B01J2208/00017Controlling the temperature
    • B01J2208/00327Controlling the temperature by direct heat exchange
    • BPERFORMING OPERATIONS; TRANSPORTING
    • B01PHYSICAL OR CHEMICAL PROCESSES OR APPARATUS IN GENERAL
    • B01JCHEMICAL OR PHYSICAL PROCESSES, e.g. CATALYSIS OR COLLOID CHEMISTRY; THEIR RELEVANT APPARATUS
    • B01J2219/00Chemical, physical or physico-chemical processes in general; Their relevant apparatus
    • B01J2219/00049Controlling or regulating processes
    • B01J2219/00245Avoiding undesirable reactions or side-effects
    • B01J2219/00259Preventing runaway of the chemical reaction
    • B01J2219/00261Predicting runaway of the chemical reaction
    • BPERFORMING OPERATIONS; TRANSPORTING
    • B01PHYSICAL OR CHEMICAL PROCESSES OR APPARATUS IN GENERAL
    • B01JCHEMICAL OR PHYSICAL PROCESSES, e.g. CATALYSIS OR COLLOID CHEMISTRY; THEIR RELEVANT APPARATUS
    • B01J2219/00Chemical, physical or physico-chemical processes in general; Their relevant apparatus
    • B01J2219/00049Controlling or regulating processes
    • B01J2219/00245Avoiding undesirable reactions or side-effects
    • B01J2219/00259Preventing runaway of the chemical reaction
    • B01J2219/00263Preventing explosion of the chemical mixture
    • BPERFORMING OPERATIONS; TRANSPORTING
    • B01PHYSICAL OR CHEMICAL PROCESSES OR APPARATUS IN GENERAL
    • B01JCHEMICAL OR PHYSICAL PROCESSES, e.g. CATALYSIS OR COLLOID CHEMISTRY; THEIR RELEVANT APPARATUS
    • B01J2219/00Chemical, physical or physico-chemical processes in general; Their relevant apparatus
    • B01J2219/00049Controlling or regulating processes
    • B01J2219/00245Avoiding undesirable reactions or side-effects
    • B01J2219/00268Detecting faulty operations

Definitions

  • the present disclosure is related to a method and system for managing the operation of a plant, such as a chemical plant or a petrochemical plant or a refinery, and more particularly to a method for improving on-stream reliability by preventing and mitigating temperature related emergency shutdowns of an operating plant.
  • Typical plants may be those that provide hydrocarbon cracking, hydrotreating, isomerization, exothermic process plants, and/or other process units where potentially exothermic reactions take place.
  • Other units may include units with depressure systems.
  • Industrial process control and automation systems are often used for large and complex industrial processes.
  • Industrial processes are typically implemented using large numbers of devices, such as pumps, valves, compressors, or other industrial equipment used to implement various aspects of the industrial processes. With these large numbers of devices, improving detection and prevention of equipment or process malfunctions can increase efficiency and safety of an operation of a plant or refinery.
  • One or more embodiments may include a system for preventing temperature excursion in a reactor.
  • the system may include a reactor.
  • the system may include a heater.
  • the system may include a catalyst bed.
  • the system may include a sensor configured to measure data associated with the catalyst bed.
  • the system may include an analysis platform.
  • the analysis platform may include one or more processors and memory.
  • the memory may store executable instructions that, when executed, cause the analysis platform to: receive the data associated with the catalyst bed; analyze the data associated with the catalyst bed; determine, based on analyzing the data associated with the catalyst bed, whether a temperature of the reactor is above a threshold; and based on determining that the temperature of the reactor is above the threshold, send a message to a control system associated with the reactor, the message configured to cause an action to reduce the temperature of the reactor.
  • One or more embodiments may include non-transitory computer-readable media storing executable instructions that, when executed by one or more processors, cause a system including a reactor, a heater, a catalyst bed, and a sensor, to receive, from the sensor, data measured by the sensor and associated with the catalyst bed; analyze the data associated with the catalyst bed; determine, based on analyzing the data associated with the catalyst bed, whether a temperature of the reactor is above a threshold; and based on determining that the temperature of the reactor is above the threshold, send a message to a control system associated with the reactor, the message configured to cause an action to reduce the temperature of the reactor.
  • One or more embodiments may include a method including receiving, by a computing device and from a sensor configured to measure data associated with a catalyst bed associated with a reactor, data measured by the sensor and associated with the catalyst bed; analyzing, by the computing device, the data associated with the catalyst bed; determining, by the computing device, based on analyzing the data associated with the catalyst bed, whether a temperature of the reactor is above a threshold; and based on determining that the temperature of the reactor is above the threshold, sending, by the computing device, a message to a control system associated with the reactor, the message configured to cause an action to reduce the temperature of the reactor.
  • FIG. 1 depicts one possible illustrative arrangement for a catalytic hydrocracking process in accordance with one or more example embodiments
  • FIGS. 2-1 to 2-6 depicts an illustrative arrangement of sensors in a hydrocracking reactor in accordance with one or more example embodiments
  • FIG. 3 depicts an illustrative arrangement of thermocouples in a reactor in accordance with one or more example embodiments
  • FIG. 4 depicts an illustrative flow diagram of the enhanced control system in accordance with one or more example embodiments
  • FIG. 5A depicts an illustrative computing environment for managing the operation of one or more pieces of equipment in a plant in accordance with one or more example embodiments
  • FIG. 5B depicts an illustrative data collection computing platform for collecting data related to the operation of one or more pieces of equipment in a plant in accordance with one or more example embodiments;
  • FIG. 5C depicts an illustrative data analysis computing platform for analyzing data related to the operation of one or more pieces of equipment in a plant in accordance with one or more example embodiments;
  • FIG. 5D depicts an illustrative control computing platform for controlling one or more pieces of equipment in a plant in accordance with one or more example embodiments
  • FIG. 5E depicts an illustrative remote device for analyzing data related to the operation of one or more pieces of equipment in a plant in accordance with one or more example embodiments
  • FIGS. 6A and 6B depict an illustrative flow diagram of one or more steps that one or more devices may perform in controlling one or more aspects of a plant operation in accordance with one or more example embodiments;
  • FIGS. 7 and 8 depict illustrative graphical user interfaces related to one or more aspects of a plant operation in accordance with one or more example embodiments
  • FIG. 9 depicts an illustrative computing environment for implementing temperature excursion mitigation in accordance with one or more example embodiments.
  • FIG. 10 depicts an illustrative multi-stage approach to temperature excursion mitigation in accordance with one or more example embodiments.
  • references herein to a “plant” or “system” are to be understood to refer to any of various types of chemical and petrochemical manufacturing or refining facilities.
  • References herein to a plant “operators” are to be understood to refer to and/or include, without limitation, plant planners, managers, engineers, technicians, technical advisors, specialists (e.g., in instrumentation, pipe fitting, and welding), shift personnel, and others interested in, starting up, overseeing, monitoring operations of, and shutting down, the plant.
  • Refining processes produce desirable products, such as Lube oil base stock, Kerosene fuel, diesel fuel and other products known as middle distillates, as well as lower boiling hydrocarbon liquids, such as LPG, naphtha and gasoline.
  • desirable products such as Lube oil base stock, Kerosene fuel, diesel fuel and other products known as middle distillates, as well as lower boiling hydrocarbon liquids, such as LPG, naphtha and gasoline.
  • LPG low boiling hydrocarbon liquids
  • naphtha e.g., naphtha and gasoline.
  • heavy petroleum fractions may be catalytically hydrocracked into lighter, more valuable products.
  • feedstocks most often subjected to hydrocracking are the gas oils and heavy atmospheric and vacuum gas oils recovered from crude oil by distillation and catalytically or thermally cracked gas oils. These feedstocks are converted to lower molecular weight products. Simultaneously with the hydrocracking, sulfur, nitrogen, and oxygen compounds are almost completely removed and olefins are saturated, thereby giving products which are a mixture of essentially pure paraffins, naphthenes, and aromatics.
  • the hydrocracking reactions proceed to a desired conversion as the feed is processed over several fixed beds of catalyst at elevated hydrogen pressure and temperature.
  • Reactive feeds may include Light Cycle Oil (LCO) and Coker Gas Oil (CGO)—heavy (HCGO) or light (LCGO). Less reactive feeds may include straight run Vacuum Gas Oil (VGO).
  • the process makes use of two groups of reactions, hydrotreating and hydrocracking, to make clean, saturated, high value products.
  • the hydrotreating reactions remove contaminants from the feed and product streams, while the hydrocracking reactions create usable lighter molecular weight products.
  • the primary hydrotreating reactions are sulfur and nitrogen removal as well as olefin saturation.
  • the products of these reactions are the corresponding contaminant-free hydrocarbon, along with H2S and NH3.
  • Other treating reactions include oxygen, metals and halide removal, and aromatic saturation.
  • the reactions are typically carried out at elevated pressures and temperatures in a hydrogen atmosphere.
  • FIG. 1 shows one typical arrangement for an Enhanced two stage hydrotreating/hydrocracking system 100 . It is noted that FIG. 1 depicts a simplified version for illustrative purposes and further equipment such as additional heaters, exchangers, valves, instrumentation, and the like, will be present in fully operating systems.
  • Fresh feed (e.g., vacuum gas oil) 102 enters the system via feed surge drum 104 . From the bottom of the surge drum the feed flows to the suction of the reactor charge pump 106 . Hydrogen 114 may be added to the fresh feed stream before entering the heater 108 . (Alternatively, the fresh feed may be combined with the hydrogen before the combined feed exchangers.)
  • feed surge drum 104 From the bottom of the surge drum the feed flows to the suction of the reactor charge pump 106 .
  • Hydrogen 114 may be added to the fresh feed stream before entering the heater 108 . (Alternatively, the fresh feed may be combined with the hydrogen before the combined feed exchangers.)
  • the combined feed and hydrogen stream exchanges heat with the reactor effluent and is further heated in a combined feed heater 108 .
  • feed and recycle gas are heated separately by exchange with reactor effluent, for example.
  • the recycle gas may be further heated in a recycle gas heater and then joins with the feed at the reactor inlet.
  • the feedstock enters a two-stage reactor system with catalytic reactor 110 and catalytic reactor 112 .
  • Reactors 110 and 112 each may be divided into individual catalyst beds supported on a beam and grid support system.
  • the support system may be separated from the next bed of catalyst by a quench gas distributor, a reactant mixing chamber and a vapor/liquid distribution tray. The reactants flow downward through the catalyst beds.
  • a typical high conversion recycle operation unit incorporates a hot separator 116 .
  • the hot separator vapor is normally cooled by exchange with the recycle gas stream. It may also be cooled by exchange with the liquid feed stream. The vapor is then further cooled in an air cooler 140 before entering the cold separator 118 .
  • the liquid hydrocarbon and water are allowed to settle in the separator.
  • the water is sent to sour water treating facilities.
  • the hydrocarbon liquid leaves the cold separator 118 and flows into the cold flash drum 122 where the liquid is depressured. As it flows across a level control valve, dissolved hydrogen, H2S, and light hydrocarbons are flashed off. Vapor is removed from the cold flash drum on pressure control.
  • the hot separator liquid is routed to a hot flash drum 120 where dissolved hydrogen, H2S, and light hydrocarbon are flashed off.
  • the flashed vapor from the hot flash drum is cooled via cooler 142 and then joins with the hydrocarbon liquid from the cold separator before entering the cold flash drum. Both hot and cold flash drum hydrocarbon liquids flow separately into the fractionation section.
  • the feed to the fractionation section will contain several species from hydrogen and hydrogen sulfide through the heaviest components, and this stream will be separated into the desired products such as light gases, LPG, gasoline, kerosene, diesel oil, and unconverted oil from the fractionator column bottoms.
  • the gas After separation of the gas and liquid phases in the cold separator, the gas leaves from the top of the cold separator 118 and flows to the suction of the recycle gas compressor 126 .
  • the recycle gas will be first sent to an amine scrubber 124 to remove H2S.
  • the recycle gas compressor 126 may be reciprocating or centrifugal.
  • recycle gas After the recycle compressor discharge, some recycle gas will be split off the main stream for use as quench gas between catalyst beds of reactors 110 and 112 . Separate quench gas streams are used to reduce reactor interbed temperatures before each catalyst bed. Quench flow is regulated by reactor bed inlet temperature, either by direct temperature control or by cascading through quench gas flow controller.
  • the bulk of the recycle gas is normally joined by the makeup gas 128 .
  • the makeup gas joins the recycle gas before the recycle gas compressor. From this point, until it returns to the cold separator, the gas flows along with the liquid through the reactor circuit in the same manner previously described.
  • the makeup gas 128 for the unit is a hydrogen rich gas normally coming from a hydrogen plant.
  • the makeup gas compressors will then compress the gas from supply pressure up to the reactor circuit pressure. From the discharge of the last stage of compression, the makeup gas typically joins the recycle gas at the discharge of the recycle gas compressor and flows to the reactors as described above. As hydrogen is consumed in the reactors, the pressure in the cold separator will start to decrease. This will in turn call for more makeup gas.
  • Hydrocracking, hydrotreating, isomerization, or a number of different exothermic systems may be subject to reactor temperature excursions.
  • Depressuring the unit at the high rate is undesirable as it can cause extended downtime of the unit as well as associated refinery units, a loss in production, potential damage to the reactors, reactor internals, catalyst beds and the reactor effluent air coolers and environmental flaring of hydrocarbons and sulfur compounds.
  • a shutdown or a depressuring event typically results in approximately five days of loss of production, which can result in significant revenue losses.
  • aspects of the disclosure provide an enhanced control system that provides early warnings of impending undesirable events, direct or indirect manipulation of certain process variables to reduce undesirable outcomes, and/or direct or indirect manipulation of certain process variables that may place the unit in a “safe park” state to avoid the high temperature trip, depressurization, and/or associated operating risks and losses.
  • An automated system may take control actions to restore normal operations or bring the process to a safe operating condition from which it can be easily restarted.
  • the control actions may be triggered based on the detection of predefined patterns on key variables.
  • control actions may be focused on reducing catalyst bed temperatures to prevent the runaway reaction from occurring.
  • control actions may be focused on the bed where temperature elevation is detected and the beds immediately above and below as needed to direct available quench gas to where it is needed the most.
  • An automated system may eliminate operator hesitation and inconsistencies on executing recommended emergency procedures.
  • the implementation of this system may allow for identifying and programmatically taking actions to mitigate the progression of a temperature excursion, thus preventing the emergency shutdown logic from triggering, which in turns avoids costly downtime and production losses.
  • This system may be implemented on catalytic conversion units where exothermic reactions take place, for example, in potentially exothermic process units, such as hydrocracking units.
  • FIG. 9 An illustrative diagram of an example system 900 for implementing early warnings of undesirable events is depicted in FIG. 9 .
  • One or more elements of this example system may be similar to and/or include one or more elements or similar elements to those described elsewhere herein (such as in connection with FIGS. 5A-5E ).
  • the system 900 for implementing early warnings of undesirable events at a process plant 902 may include one or more of a distributed control system 904 , advanced process control 906 , process historian 908 , temperature excursion mitigation system 912 , emergency shutdown system 914 , and/or operator console human-machine interface 916 .
  • the system 900 may be reliable, safe, and robust.
  • the system 900 may include a fault-tolerant system with one or more processors, self diagnostics, redundant power supplies, and/or one or more certifications (e.g., TÜV AK 6 Certification).
  • Distributed control system 904 may be a local or remote control system that receives sensor data from one or more pieces of equipment in the process plant 902 , and transmits control information to control operation of the one or more pieces of equipment in the process plant 902 .
  • Distributed control system 904 may be similar to, integrate, or be integrated in, for example, in a control platform (e.g., control platform 506 , described herein).
  • Distributed control system 904 may be a hydroprocessing unit distributed control system.
  • Advanced process control 906 may be associated with one or more closed loop optimization processes or services.
  • Process historian 908 may be associated with one or more open loop optimization processes or services 910 (e.g., connected performance services, process reliability advisor, process optimization advisor).
  • the one or more open loop optimization processes or services 910 e.g., connected performance services
  • Temperature excursion mitigation system 912 may be focused on closed loop risk mitigation. For example, temperature excursion mitigation system 912 may send electronic communication that changes or resets one or more process settings to mitigate temperature excursion (e.g., electronic communication that changes a digital controller set point). Temperature excursion mitigation system 912 may be similar to, integrate, or be integrated in, for example, in a data analysis platform (e.g., data analysis platform 504 , described herein). Temperature excursion mitigation system 912 may be implemented on a Programmable Logic Controller (PLC) platform, or other suitable control solver platform, that communicates with distributed control system 904 .
  • PLC Programmable Logic Controller
  • Temperature excursion mitigation system 912 may implement at least one algorithm that monitors process variables measurements on a regular basis to detect the conditions that can potentially lead to a temperature excursion. Upon detection and verification of such condition(s), control actions may be sent to the distributed control system 904 in the form of single shot or repetitive commands via a communication protocol, and/or user notification alerts and/or alarms may be issued (e.g., via the distributed control system 904 ).
  • Emergency shutdown system 914 may perform or trigger emergency shutdown of process plant 902 or of one or more pieces of equipment in process plant 902 .
  • Operator console human-machine interface 916 may include one or more devices (e.g., computer, terminal, tablet, laptop, smartphone) that include one or more graphical user interfaces (e.g., dashboard) for interacting with a human operator.
  • the one or more graphical user interfaces may provide information on operations of process plant 902 , such as operation information, warnings (e.g., warnings of potential temperature excursions, warnings of imminent temperature excursions, warnings of ongoing temperature excursions), alerts, or the like.
  • the one or more graphical user interfaces may receive user input and cause one or more changes (e.g., via distributed control system 904 ) to the operation of process plant 902 or one or more pieces of equipment in process plant 902 (e.g., to stop or mitigate a temperature excursion).
  • the temperature excursion mitigation system 912 may include a dedicated human-machine interface (e.g., computer, terminal, control panel, tablet, laptop, smartphone), that includes one or more graphical user interfaces for interacting with a human operator to change system configuration parameters and/or monitor the system performance.
  • a dedicated human-machine interface e.g., computer, terminal, control panel, tablet, laptop, smartphone
  • a multi-stage (e.g., two, three, four stages) approach may be utilized to mitigate a potential temperature excursion.
  • a multi-staged approach is depicted in FIG. 10 .
  • the multi-staged process may include use of a stability gauge 1002 , an excursion mitigation level 1 response 1004 , an excursion mitigation level 2 response 1006 , and an emergency shutdown 1008 .
  • a system may use an algorithm to determine if a temperature excursion is possible, likely, imminent, or occurring, and may enter one or more stages of the multi-stage approach based on one or more temperature excursion factors surpassing various thresholds (e.g., two different thresholds corresponding to two different stages).
  • various thresholds e.g., two different thresholds corresponding to two different stages.
  • a stage may include use of a stability gauge 1002 (e.g., similar to stability gauge 800 depicted in FIG. 8 ), which may allow for indication of causes and/or areas of concern.
  • One or more objectives of the stability-gauge stage may include leaving control with operators as long as possible, providing a gauge to assist the operators, combining one or more (e.g., all) the process variables the operator should be watching onto one or more graphical user interfaces, and/or to maintain production (e.g., of a product of a plant) as long as possible.
  • the stability gauge may include one gauge combining key process variables.
  • a stability gauge may be associated with a process plant 902 , or may be associated with one or more pieces of equipment in process plant 902 .
  • One or more pieces of equipment in process plant 902 may be associated with one or more stability gauges.
  • one or more devices may include an algorithm to determine unit stability and/or areas of concern.
  • the algorithm may determine unit stability and/or areas of concern using one or more process variables, such as, for example, reactor temperatures (e.g., radial temperature, axial temperature, rate of change, hot spots), LHSV (e.g., feed rate), feed stock type (e.g., reactive feeds), quench gas rates, spare quench capacity, makeup gas consumption, unit pressure, and/or the like.
  • the algorithm may apply a weighting to one or more of the process variables when determining unit stability and/or areas of concern.
  • One or more of the process variables and/or a result of the algorithm may be displayed as a stability gauge (e.g., stability gauge 800 ).
  • one or more aspects of the present disclosure may include a stability gauge, based on a weighted algorithm, to alert when the unit is moving away from a stable state and is becoming more susceptible to a temperature runaway.
  • a stage may include an excursion mitigation level 1 stage (e.g., excursion mitigation level 1 stage 1004 ) to re-establish control.
  • Excursion mitigation level 1 stage may have objectives, for example, such as the system recognizing a risk of an excursion, automating an action in response (e.g., to eliminate hesitation), and/or taking limited action to attempt to intervene and reestablish control.
  • One or more secondary goals may include maintaining production.
  • an automated action may include, for example, removing reactive feed stocks. Another automated action may include maintaining a constant feed rate. Another automated action may include reducing charge heater outlet temperature. For example, an automated action may include ramping down charge heater outlet temperature controller setpoint to decrease temperature by an amount (e.g., 5° F., 10° F., 15° F., 20° F., or the like) at a rate (e.g., 0.1° F., 0.2° F., 0.3° F., 0.4° F., 0.5° F., 0.6° F., 0.7° F., or the like per second) in one shot or multiple repetitions.
  • an amount e.g., 5° F., 10° F., 15° F., 20° F., or the like
  • a rate e.g., 0.1° F., 0.2° F., 0.3° F., 0.4° F., 0.5° F., 0.6° F., 0.7° F., or the like per second
  • Another automated action may include reducing temperature in reactor bed N with elevated temperatures.
  • an automated action may include ramping down reactor cracking bed N inlet temperature controller setpoint to decrease temperature by an amount (e.g., 5° F., 10° F., 15° F., 20° F., or the like) at a rate (e.g., 0.1° F., 0.2° F., 0.3° F., 0.4° F., 0.5° F., 0.6° F., 0.7° F., or the like per second) in one shot or multiple repetitions.
  • an amount e.g., 5° F., 10° F., 15° F., 20° F., or the like
  • a rate e.g., 0.1° F., 0.2° F., 0.3° F., 0.4° F., 0.5° F., 0.6° F., 0.7° F., or the like per second
  • an automated action may include reducing the temperature in other reactor beds.
  • an automated action may include ramping down reactor cracking bed N+1 (e.g., the reactor bed immediately below) inlet temperature controller setpoint to decrease temperature by an amount (e.g., 5° F., 10° F., 15° F., 20° F., or the like) at a rate (e.g., 0.1° F., 0.2° F., 0.3° F., 0.4° F., 0.5° F., 0.6° F., 0.7° F., or the like per second) in one shot or multiple repetitions.
  • an amount e.g., 5° F., 10° F., 15° F., 20° F., or the like
  • a rate e.g., 0.1° F., 0.2° F., 0.3° F., 0.4° F., 0.5° F., 0.6° F., 0.7° F., or the like per second
  • An automated action may include activating one or more alerts or alarms (e.g., alerting that temperature excursion control scheme Level 1 is activated).
  • An automated action may include shedding a higher-level control scheme.
  • An automated action may include resetting the setting of one or more of the more reactive feed flow controllers (e.g., a reactive feed flow controller, such as Light Cycle Oil (LCO) flow controller, Coker Gas Oil (CGO) flow controller) to reduce flow by a predefined percentage.
  • An automated action may include compensating for feed reduction (e.g., LCO/CGO feed reduction) with less reactive feed, such as Straight Run Vacuum Gas Oil (VGO) and/or VGO from Storage to maintain level in the feed surge drum.
  • LCO Light Cycle Oil
  • CGO Coker Gas Oil
  • an indicator and/or alert may indicate that the excursion mitigation level 1 stage is complete.
  • a stage may include an excursion mitigation level 2 stage (e.g., excursion mitigation level 2 stage 1006 ) to provide a safe park for a unit.
  • a safe park may significantly improve startup/shutdown operations, especially after an excursion.
  • Excursion mitigation level 2 stage may have objectives such as, for example, recognizing that an excursion is imminent, automating an action in response (e.g., to eliminate hesitation), placing the unit in a safe state, leaving the unit in a condition where restart can be fast and easy, and/or avoiding depressuring of the unit.
  • an automated action may include, for example, activating one or more alerts or alarms (e.g., alerting that temperature excursion control scheme phase 2 is activated).
  • An automated action may include ramping charge heater outlet temperature down to a predefined temperature (e.g., to 300° F., 400° F., 500° F., 600° F., or the like).
  • An automated action may include checking operation at and/or near minimum burner pressure.
  • An automated action may include bypassing a combined feed exchanger, which may be done while avoiding a high temperature shutdown on a reactor effluent air cooler.
  • An automated action may include ramping down combined feed heat exchangers outlet temperature controller setpoint to decrease temperature at a rate (e.g., 100° F., 200° F., 300° F., 400° F., 500° F., 600° F., or the like per hour) until reaching a threshold temperature (e.g., 300° F., 400° F., 500° F., 600° F., or the like). If the temperature reaches a reactor effluent air cooler inlet pretrip point, an alert and/or alarm may be triggered and/or sent.
  • a rate e.g., 100° F., 200° F., 300° F., 400° F., 500° F., 600° F., or the like per hour
  • a threshold temperature e.g., 300° F., 400° F., 500° F., 600° F., or the like.
  • the ramp down of combined feed from combined feed exchangers outlet temperature controller setpoint may be paused and/or the bypass valves may be directly manipulated by the excursion mitigation system through an internal control algorithm to prevent the temperature from reaching the trip point.
  • High reactor effluent air coolers 140 and/or 142 inlet temperatures alarm may be generated while the ramp down is paused. After the alarm is reset, ramp may resume. For example, the ramp may resume and alarm be reset by reactor effluent air cooler inlet pretrip reset.
  • Another automated action may include ramping all reactor temperatures (e.g., in a particular unit or in an entire plant) down to a particular temperature (e.g., to 300° F., 400° F., 500° F., 600° F., or the like).
  • a particular temperature e.g., to 300° F., 400° F., 500° F., 600° F., or the like.
  • an automated action may include ramping down all the reactor beds inlet temperature controllers setpoints to decrease the temperature at a rate e.g., 100° F., 200° F., 300° F., 400° F., 500° F., 600° F., or the like per hour) until reaching a threshold temperature (e.g., 300° F., 400° F., 500° F., 600° F., or the like).
  • the ramp down of all reactors beds inlet temperature controllers may be paused.
  • An alarm e.g., low recycle gas flow alarm
  • the ramp may resume and the alarm be reset by recycle gas flow pretrip reset.
  • Another automated action may include reducing a pressure of the unit by a particular percentage (e.g., 5%, 6%, 7%, 8%, 9%, 10%, or the like) of operating pressure.
  • an automated action may include reducing temperature in one or more other reactor catalyst beds.
  • an automated action may include ramping down reactor cracking bed N and N+1 inlet temperature controller setpoint to decrease temperature first by an amount (e.g., 30° F., 40° F., 50° F., 60° F., or the like) at a rate (e.g., 0.1° F., 0.2° F., 0.3° F., 0.4° F., 0.5° F., 0.6° F., 0.7° F., or the like per second), and the continue to decrease the temperature until reaching a temperature (e.g., 300° F., 400° F., 500° F., 600° F., or the like) at a rate (e.g., 100° F., 200° F., 300° F., 400° F., 500° F., 600° F., or the like per hour).
  • a temperature e.g., 300° F., 400° F., 500° F., 600° F.
  • Another automated action may include ramping down a reactor's all other catalyst beds inlet temperature controller setpoint to decrease temperature until reaching a temperature (e.g., 300° F., 400° F., 500° F., 600° F., or the like) at a rate (e.g., 100° F., 200° F., 300° F., 400° F., 500° F., 600° F., or the like per hour).
  • a temperature e.g., 300° F., 400° F., 500° F., 600° F., or the like
  • a rate e.g., 100° F., 200° F., 300° F., 400° F., 500° F., 600° F., or the like per hour.
  • an indicator and/or alert may indicate that the excursion mitigation level 2 stage is complete.
  • Another automated action may include reducing the temperature of other reactor beds.
  • an automated action may include ramping down reactor cracking bed N ⁇ 1 inlet temperature controller setpoint to decrease temperature by an amount (e.g., 5° F., 10° F., 15° F., 20° F., or the like) at a rate (e.g., 0.1° F., 0.2° F., 0.3° F., 0.4° F., 0.5° F., 0.6° F., 0.7° F., or the like per second).
  • an amount e.g., 5° F., 10° F., 15° F., 20° F., or the like
  • a rate e.g., 0.1° F., 0.2° F., 0.3° F., 0.4° F., 0.5° F., 0.6° F., 0.7° F., or the like per second.
  • a final stage may include an emergency shutdown stage (e.g., emergency shutdown stage 1008 ).
  • a system may include an emergency interlock system (e.g., emergency shutdown system 914 ).
  • the emergency shutdown stage may allow for an automated or manual shutdown of a unit, plant, or process to avoid or mitigate damage or a disaster.
  • the emergency shutdown stage may be simple, easy to maintain, and/or avoid spurious shutdowns.
  • the emergency shutdown stage may include depressuring to flare.
  • some systems may use reactor models to adjust process control signals in a more predictive vs. reactive way, or to control ramping rates (e.g., for startup).
  • the present system may analyze operating data and apply experience-based control algorithms focused on excursion prevention and mitigation. Aspects of the present system may reduce unplanned shutdowns, eliminate associated flaring, eliminate associated equipment damage, eliminate associated production losses, and/or shorten time needed to regain full production.
  • the proper operation of the reactor unit may depend on the careful selection and control of the processing conditions. There are many process variables that may affect catalytic conversion process units performance including operating severity, product yields and quality, and catalyst life. By careful monitoring and control of these process variables, the unit can operate to its full potential. Monitoring also helps to collect data that can be correlated and used to predict behavior or problems in systems used in the same plant or in other plants and/or processes.
  • the amount of conversion which takes place in the reactors may be determined by several variables; the type of feedstock, the amount of time the feed is in the presence of catalyst, the partial pressure of hydrogen in the catalyst bed, and, the temperature of the catalyst and reactants. Generally, the higher the temperature, the faster the rate of reaction and therefore, the higher the conversion.
  • a system may include a heater minimum firing mode. This feature may avoid burner flameout, which could lead to hazardous conditions in the heater fire box.
  • a system may include an auto quench.
  • An auto quench may be programmed to quench the beds requiring additional quench while staying within the constraints set to keep the required flow to the other beds.
  • a system may include bed temperature control (e.g., bed outlet control, WABT control).
  • bed temperature control e.g., bed outlet control, WABT control
  • a refiner may set a temperature controller's setpoint based on the highest temperature in the bed.
  • a system may include conversion control. This may be used (e.g., for two-stage units) to determine how to set conversion per pass. Balancing the conversion between the stages may improve operations.
  • FIG. 5A depicts an illustrative computing system that may be implemented at one or more components, pieces of equipment (e.g., catalytic reactors), and/or plants.
  • FIG. 5A - FIG. 5E (hereinafter collectively “ FIG. 5 ”), show, by way of illustration, various components of the illustrative computing system in which aspects of the disclosure may be practiced. It is to be understood that other components may be used, and structural and functional modifications may be made, in one or more other embodiments without departing from the scope of the present disclosure.
  • various connections between elements are discussed in the following description, and these connections are general and, unless specified otherwise, may be direct or indirect, wired or wireless, and/or combination thereof, and that the specification is not intended to be limiting in this respect.
  • FIG. 5A depicts an illustrative operating environment in which various aspects of the present disclosure may be implemented in accordance with example embodiments.
  • the computing system environment 500 illustrated in FIG. 5A is only one example of a suitable computing environment and is not intended to suggest any limitation as to the scope of use or functionality contained in the disclosure.
  • the computing system environment 500 may include various sensor, measurement, and data capture systems, a data collection platform 502 , a data analysis platform 504 , a control platform 506 , one or more networks, one or more remote devices, and/or one or more other elements.
  • the numerous elements of the computing system environment of FIG. 5A may be communicatively coupled through one or more networks.
  • the numerous platforms, devices, sensors, and/or components of the computing system environment may be communicatively coupled through a private network.
  • the sensors be positioned on various components in the plant and may communicate wirelessly or wired with one or more platforms illustrated in FIG. 5A .
  • the private network 514 may include, in some examples, a network firewall device to prevent unauthorized access to the data and devices on the private network.
  • the private network 514 may be isolated from external access through physical means, such as a hard-wired network with no external, direct-access point.
  • the data communicated on the private network 514 may be optionally encrypted for further security.
  • the private network may experience large bandwidth usage and be technologically designed and arranged to accommodate for such technological issues.
  • the computing system environment 500 may also include a public network 516 that may be accessible to remote devices.
  • the remote device may be located not in the proximity (e.g., more than one mile away) of the various sensor, measurement, and data capture systems illustrated in FIG. 5A .
  • the remote device may be physically located inside a plant, but restricted from access to the private network 514 ; in other words, the adjective “remote,” need not necessarily require the device to be located at a great distance from the sensor systems and other components.
  • FIG. 5A illustrates logical block diagrams of numerous platforms and devices
  • the disclosure is not so limited.
  • one or more of the logical boxes in FIG. 5 may be combined into a single logical box or the functionality performed by a single logical box may be divided across multiple existing or new logical boxes.
  • aspects of the functionality performed by the data collection platform may be incorporated into one or each of the sensor devices illustrated in FIG. 5A .
  • the data collection may occur local to the sensor device, and the enhanced sensor system may communicate directly with one or more of the control platform and/or data analysis platform.
  • FIG. 5A Such an embodiment is contemplated by FIG. 5A .
  • the enhanced sensor system may measure values common to a sensor, but may also filter the measurements such just those values that are statistically relevant or of-interest to the computing system environment are transmitted by the enhanced sensor system.
  • the enhanced sensor system may include a processor (or other circuitry that enables execution of computer instructions) and a memory to store those instructions and/or filtered data values.
  • the processor may be embodied as an application-specific integrated circuit (ASIC), FPGA, or other hardware- or software-based module for execution of instructions.
  • ASIC application-specific integrated circuit
  • FPGA field-programmable gate array
  • one or more sensors illustrated in FIG. 5A may be combined into an enhanced, multi-purpose sensor system. Such a combined sensor system may provide economies of scale with respect to hardware components such as processors, memories, communication interfaces, and others.
  • the data collection platform 502 and data analysis platform 504 may reside on a single server computer and be depicted as a single, combined logical box on a system diagram.
  • a data store may be illustrated in FIG. 5A separate and apart from the data collection platform 502 and data analysis platform 504 to store a large amount of values collected from sensors and other components.
  • the data store may be embodied in a database format and may be made accessible to the public network 516 ; meanwhile, the control platform 506 , data collection platform 502 , and data analysis platform 504 may be restricted to the private network 514 and left inaccessible to the public network 516 .
  • the data collected from a plant may be shared with users (e.g., engineers, data scientists, others), a company's employees, and even third parties (e.g., subscribers to the company's data feed) without compromising potential security requirements related to operation of a plant.
  • the data store may be accessible to one or more users and/or remote devices over the public network 516 .
  • process measurements from various sensor and monitoring devices may be used to monitor conditions in, around, and on process equipment (e.g., catalytic reactors).
  • Such sensors may include, but are not limited to, pressure sensors 528 , differential pressure sensors, pressure drop sensors 534 , flow sensors 531 , temperature sensors 526 including thermocouples, thermal cameras 527 , and skin thermocouples, capacitance sensors, weight sensors, gas chromatographs 523 , hydrogen analyzers, sulfur analyzers, density analyzers, moisture sensors 524 , ultrasonic sensors 525 , position sensors (e.g., valve position sensors 532 ), timing sensors (e.g., timers 522 ), vibration sensors 529 , microphones 530 , level sensors 536 , liquid level (hydraulic fluid) sensors, cycle count sensors 533 , and/or other sensors 535 (e.g., sensors commonly found in the refining and petrochemical industry).
  • process laboratory measurements may be taken using equipment such as gas chromatographs 523 and/or liquid chromatographs, and may include, for example, distillation measurements, density measurements, cetane measurements and octane measurements, and/or other laboratory measurements.
  • system operational measurements also can be taken to correlate the system operation to the measurements of the one or more reactor units.
  • Temperatur sensors may transmit signals to a processor or a hub that collects the data and sends to a processor.
  • temperature and pressure measurements may be sent to a hub (e.g., data collection platform 502 ).
  • temperature sensors may include thermocouples, fiber optic temperature measurement, thermal cameras, and/or infrared cameras. Skin thermocouples may be applied to supports, walls, or other locations inside of or near a catalytic reactor unit. Alternatively, thermal (infrared) cameras may be used to detect temperature (e.g., hot spots) in all aspects of the equipment.
  • a shielded (insulated) tube skin thermocouple assembly may be used to obtain accurate measurements.
  • a magnetic skin thermocouple may allow for installation without welding onto the reactor. Alternatively or additionally, clips and/or pads may be utilized for ease of replacement.
  • Daily Thermetrics CatTracker or Gayesco Flex-R multipoint thermocouples may be used for special catalyst bed temperature measurement.
  • Sensors may be also used throughout a plant to detect and monitor various issues such as maldistribution, thermal stresses, and temperature excursion.
  • flow sensors 531 may be used in flow paths such as the inlet to the path, outlet from the path, or within the path. If multiple feed pipes are utilized, the flow sensors 531 may be placed in corresponding positions in each of the pipes. Flow may be determined by pressure-drop across a known resistance, such as by using pressure taps.
  • Other types of flow sensors 531 include, but are not limited to, ultrasonic sensors 525 , turbine meter, hot wire anemometer, vane meter, KármánTM, vortex sensor, membrane sensor (membrane has a thin film temperature sensor printed on the upstream side, and one on the downstream side), tracer, radiographic imaging (e.g., identify two-phase vs.
  • an orifice plate in front of or integral to each tube or channel pitot tube, thermal conductivity flow meter, anemometer, internal pressure flow profile, and/or measure cross tracer (measuring when the flow crosses one plate and when the flow crosses another plate).
  • Sensor data, process measurements, and/or calculations made using the sensor data or process measurements may be used to monitor and/or improve the performance and reliability of the process unit or the performance of the equipment and parts making up the equipment, as discussed in further detail below.
  • sensor data may be used to detect that a desirable or an undesirable chemical reaction (e.g., a temperature excursion) is taking place within a particular piece of equipment, and one or more actions may be taken to encourage or inhibit the chemical reaction (e.g., to slow, stop, or mitigate the temperature excursion).
  • Chemical sensors may be used to detect the presence of one or more chemicals or components in the streams, such as corrosive species, oxygen, hydrogen, sulfur, and/or water (moisture). Chemical sensors may utilize gas chromatographs, liquid chromatographs, distillation measurements, density measurements, and/or octane measurements.
  • Monitoring the equipment and processes includes collecting data that can be correlated and used to predict behavior or problems in other plants and/or processes.
  • Data collected from the various sensors e.g., measurements such as temperature, pressure, flow, pressure drop, thermal performance, vessel skin temperature
  • Process changes or operating conditions may be able to be altered to preserve the equipment or the catalyst until the next scheduled maintenance period.
  • sensor data collected e.g., by the data collection platform 502
  • data analysis e.g., by the data analysis platform 504
  • sensor data may be used for process simulation and reconciliation of sensor data.
  • the resulting, improved process simulation may provide a stream of physical properties that are used to calculate heat flow, etc. These calculations may lead to thermal and/or pressure-drop performance prediction calculations for specific equipment or the process, and comparisons of equipment or process predictions to observations from the operating data (e.g., predicted/expected outlet temperature and pressure vs. measured outlet temperature and pressure). This may be used for identification of conditions leading to temperature excursion, and/or other issues that eventually lead to a potential control changes and/or recommendation etc.
  • Corrective action may be taken based on determining this process and/or equipment information.
  • One or more inputs or controls relating to a process may be adjusted as part of the corrective action.
  • computing system environment 500 may include transmitters and deviation alarms. These may be programmed to set off an alarm, which may be audible and/or visual. In one or more embodiments, an alert may be transmitted to one or more devices (e.g., remote device 518 , 520 , client portal 508 , dashboard 510 , 512 ).
  • devices e.g., remote device 518 , 520 , client portal 508 , dashboard 510 , 512 ).
  • Sensor data may be collected by a data collection platform 502 .
  • the sensors may interface with the data collection platform 502 via wired or wireless transmissions.
  • Sensor data (e.g., temperature data) may be collected continuously or at periodic intervals (e.g., every second, every five seconds, every ten seconds, every minute, every five minutes, every ten minutes, every hour, every two hours, or another interval).
  • Data may be collected at different locations at different intervals. For example, data at a known hot spot may be collected at a first interval, and data at a spot that is not a known hot spot may be collected at a second interval.
  • data for a catalyst bed with a history of temperature excursions may be collected at a different rate than data for a catalyst bed without history of temperature excursions.
  • the data collection platform 502 may continuously or periodically (e.g., every second, every minute, every hour, every day, once a week, once a month, etc.) transmit collected sensor data to a data analysis platform 504 , which may be nearby (e.g. local to) or remote from the data collection platform 502 .
  • the computing system environment 500 of FIG. 5A includes logical block diagrams of numerous platforms and devices that are further elaborated upon in FIG. 5B , FIG. 5C , FIG. 5D , and FIG. 5E .
  • FIG. 5B is an illustrative data collection platform 502 .
  • FIG. 5C is an illustrative data analysis platform 504 .
  • FIG. 5D is an illustrative control platform 506 .
  • FIG. 5E is an illustrative remote device 518 .
  • These platforms and devices of FIG. 5 include one or more processing units (e.g., processors) to implement the methods and functions of certain aspects of the present disclosure in accordance with the example embodiments.
  • the processors may include general-purpose microprocessors and/or special-purpose processors designed for particular computing system environments or configurations.
  • the processors may execute computer-executable instructions in the form of software and/or firmware stored in the memory of the platform or device.
  • Examples of well-known computing systems, environments, and/or configurations that may be suitable for use with the disclosed embodiments include, but are not limited to, programmable logic controllers, distributed control systems, personal computers (PCs), server computers, hand-held or laptop devices, smart phones, multiprocessor systems, microprocessor-based systems, programmable consumer electronics, network PCs, minicomputers, mainframe computers, distributed computing environments that include any of the above systems or devices, and the like.
  • the platform and/or devices in FIG. 5 may include one or more memories include any of a variety of computer-readable media.
  • Computer-readable media may be any available media that may be accessed by the data collection platform, may be non-transitory, and may include volatile and nonvolatile, removable and non-removable media implemented in any method or technology for storage of information such as computer-readable instructions, object code, data structures, database records, program modules, or other data.
  • Examples of computer-readable media may include random access memory (RAM), read only memory (ROM), electronically erasable programmable read only memory (EEPROM), flash memory or other memory technology, compact disk read-only memory (CD-ROM), digital versatile disks (DVD) or other optical disk storage, magnetic cassettes, magnetic tape, magnetic disk storage or other magnetic storage devices, or any other medium that can be used to store the desired information and that can be accessed by the data collection platform.
  • the memories in the platform and/or devices may further store modules that may include compiled software code that causes the platform, device, and/or overall system to operate in a technologically improved manner as disclosed herein.
  • the memories may store software used by a computing platform, such as operating system, application programs, and/or associated database.
  • the platform and/or devices in FIG. 5 may include one or more communication interfaces including, but not limited to, a microphone, keypad, touch screen, and/or stylus through which a user of a computer (e.g., a remote device) may provide input, and may also include a speaker for providing audio output and a video display device for providing textual, audiovisual and/or graphical output.
  • the communication interfaces may include a network controller for electronically communicating (e.g., wirelessly or wired) over a public network or private network with one or more other components on the network.
  • the network controller may include electronic hardware for communicating over network protocols, including TCP/IP, UDP, Ethernet, RTU, and other protocols.
  • one or more sensor devices in FIG. 5A may be enhanced by incorporating functionality that may otherwise be found in a data collection platform 502 .
  • These enhanced sensor systems may provide further filtering of the measurements and readings collected from their sensor devices. For example, with some of the enhanced sensor systems in the operating environment illustrated in FIG. 5A , an increased amount of processing may occur at the sensor so as to reduce the amount of data needing to be transferred over a private network in real-time to a computing platform.
  • the enhanced sensor system may filter at the sensor itself the measured/collected/captured data and only particular, filtered data may be transmitted to the data collection platform for storage and/or analysis.
  • a data collection platform 502 may comprise a processor 560 , one or more memories 562 , and communication interfaces 568 .
  • the memory 562 may comprise a database 564 for storing data records of various values collected from one or more sources.
  • a data collection module 566 may be stored in the memory 562 and assist the processor 560 in the data collection platform 502 in communicating with, via the communications interface 568 , one or more sensor, measurement, and data capture systems, and processing the data received from these sources.
  • the data collection module 566 may comprise computer-executable instructions that, when executed by the processor 560 , cause the data collection platform 502 to perform one or more of the steps disclosed herein.
  • the data collection module 566 may be a hybrid of software-based and/or hardware-based instructions to perform one or more of the steps disclosed herein. In some examples, the data collection module 566 may assist an enhanced sensor system with further filtering the measurements and readings collected from the sensor devices.
  • FIG. 5B the elements of FIG. 5B are illustrated as logical block diagrams, the disclosure is not so limited. In particular, one or more of the logical boxes in FIG. 5B may be combined into a single logical box or the functionality performed by a single logical box may be divided across multiple existing or new logical boxes. Moreover, some logical boxes that are visually presented as being inside of another logical box may be moved such that they are partially or completely residing outside of that logical box. For example, while the database 564 in FIG.
  • FIG. 5B contemplates that the database 564 may be stored in a standalone data store communicatively coupled to the data collection module 566 and processor 560 of the data collection platform 502 via the communications interface 568 of the data collection platform 502 .
  • Data collection platform 502 may include or be in communication with one or more data historians.
  • the data historian may be implemented as one or more software modules, one or more virtual machines, or one or more hardware elements (e.g., servers).
  • the data historian may collect data at regular intervals (e.g., every minute, every two minutes, every ten minutes, every thirty minutes).
  • the data historian may include or be in communication with an instance of remote data collection hardware and/or software, such as, for example, Honeywell Uniformance Scout Express.
  • the remote data collection may be implemented as one or more software modules, one or more virtual machines, or one or more hardware elements (e.g., servers).
  • the Uniformance Scout Express may work with or in place of the data collection module and/or the data historian to handle one or more aspects of data replication.
  • the data collection module 566 may assist the processor 560 in the data collection platform 502 in communicating with, via the communications interface 568 , and processing data received from other sources, such as data feeds from third-party servers and manual entry at the field site from a dashboard graphical user interface.
  • a data analysis platform 504 may comprise a processor 570 , one or more memories 572 , and communication interfaces 582 .
  • the memory 572 may comprise a database 574 for storing data records of various values collected from one or more sources.
  • the database 574 may be the same database as that depicted in FIG. 5B and the data analysis platform 504 may communicatively couple with the database via the communication interface 582 of the data analysis platform 504 .
  • At least one advantage of sharing a database between the two platforms is the reduced memory requirements due to not duplicating the same or similar data.
  • the data analysis platform 504 may include a data service.
  • the data service may comprise computer-executable instructions that, when executed by the processor, cause the data analysis platform to perform one or more of the steps disclosed herein.
  • the data service may be a virtual machine.
  • the data service may be a hybrid of software-based and/or hardware-based instructions to perform one or more of the steps disclosed herein.
  • the data analysis platform 504 may include a data historian.
  • the data historian may comprise computer-executable instructions that, when executed by the processor, cause the data analysis platform to perform one or more of the steps disclosed herein.
  • the data historian may be a virtual machine.
  • the data historian may be a hybrid of software-based and/or hardware-based instructions to perform one or more of the steps disclosed herein.
  • the data historian may collect data at regular intervals (e.g., every minute, every two minutes, every ten minutes, every thirty minutes).
  • the data analysis platform 504 may include a data lake.
  • the data lake may comprise computer-executable instructions that, when executed by the processor, cause the data analysis platform to perform one or more of the steps disclosed herein.
  • the data lake may be a virtual machine.
  • the data lake may be a hybrid of software-based and/or hardware-based instructions to perform one or more of the steps disclosed herein.
  • the data lake may perform relational data storage.
  • the data lake may provide data in a format that may be useful for processing data and/or performing data analytics.
  • the data analysis platform 504 may include a calculations service.
  • the calculations service may comprise computer-executable instructions that, when executed by the processor, cause the data analysis platform to perform one or more of the steps disclosed herein.
  • the calculations service may be a virtual machine.
  • the calculations service may be a hybrid of software-based and/or hardware-based instructions to perform one or more of the steps disclosed herein.
  • the calculations service may collect data, perform calculations, and/or provide key performance indicators.
  • the calculations service may implement, for example, process dynamic modeling software or tools (e.g., UniSim).
  • the data analysis platform 504 may include a utility service.
  • the utility service may comprise computer-executable instructions that, when executed by the processor, cause the data analysis platform to perform one or more of the steps disclosed herein.
  • the utility service may be a virtual machine.
  • the utility service may be a hybrid of software-based and/or hardware-based instructions to perform one or more of the steps disclosed herein.
  • the utility service may take information from the calculations service and put the information into the data lake.
  • the utility service may provide data aggregation service, such as taking all data for a particular range, normalizing the data (e.g., determining an average), and combining the normalized data into a file to send to another system or module.
  • One or more components of the data analysis platform 504 may assist the processor in the data analysis platform in processing and analyzing the data values stored in the database.
  • the data analysis platform may perform statistical analysis, predictive analytics, and/or machine learning on the data values in the database to generate predictions and models.
  • the data analysis platform may analyze sensor data to monitor for, predict, and prevent determine temperature excursion in the equipment of a plant.
  • the data analysis platform 504 may compare temperature data from different times and dates to determine if changes are occurring. Such comparisons may be made on a monthly, weekly, daily, hourly, real-time, or some other basis.
  • the analysis unit may be partially or fully automated.
  • the system is performed by a computer system, such as a third-party computer system, local to or remote from the plant and/or the plant planning center.
  • the system may receive signals and parameters via the communication network, and display in real time related performance information on an interactive display device accessible to an operator or user.
  • the platform allows two or more users to work with the same information, thereby creating a collaborative environment for sharing best practices or for troubleshooting.
  • the method may provide accurate prediction and optimization results due to fully configured models.
  • the recommendation module 578 in the data analysis platform may coordinate with the data analysis module 576 to generate recommendations for adjusting one or more parameters for the operation of the plant environment depicted in FIG. 5A .
  • the recommendation module 578 may communicate the recommendation to the command module 580 , which may generate command codes that may be transmitted, via the communications interface, to cause adjustments or halting/starting of one or more operations in the plant environment.
  • the command codes may be transmitted to a control platform for processing and/or execution.
  • the command codes may be directly communicated, either wirelessly or in a wired fashion, to physical components at the plant such that the physical components comprise an interface to receive the commands and execute on them.
  • FIG. 5C Although the elements of FIG. 5C are illustrated as logical block diagrams, the disclosure is not so limited. In particular, one or more of the logical boxes in FIG. 5C may be combined into a single logical box or the functionality performed by a single logical box may be divided across multiple existing or new logical boxes. Moreover, some logical boxes that are visually presented as being inside of another logical box may be moved such that they are partially or completely residing outside of that logical box. For example, while the database is visually depicted in FIG. 5C as being stored inside one or more memories in the data analysis platform, FIG. 5C contemplates that the database may be stored in a standalone data store communicatively coupled to the data analysis module 576 and processor of the data analysis platform via the communications interface of the data analysis platform.
  • the databases from multiple plant locations may be shared and holistically analyzed to identify one or more trends and/or patterns in the operation and behavior of the plant and/or plant equipment.
  • a distributed database arrangement may be provided where a logical database may simply serve as an interface through which multiple, separate databases may be accessed.
  • a computer with predictive analytic capabilities may access the logical database to analyze, recommend, and/or predict the behavior of one or more aspects of plants and/or equipment.
  • the data values from a database from each plant may be combined and/or collated into a single database where predictive analytic engines may perform calculations and prediction models.
  • a control platform 506 may comprise a processor 584 , one or more memories 586 , and communication interfaces 592 .
  • the memory 586 may comprise a database 588 for storing data records of various values transmitted from a user interface, computing device, or other platform.
  • the values may comprise parameter values for the process or the particular equipment at the plant.
  • some illustrative equipment at the plant that may be configured and/or controlled by the control platform 506 may include, but is not limited to, one or more valves, one or more pumps, and/or one or more automatic control loop.
  • a control module 590 may be stored in the memory 586 and assist the processor 584 in the control platform 506 in receiving, storing, and transmitting the data values stored in the database 588 .
  • the control module 590 may comprise computer-executable instructions that, when executed by the processor 584 , cause the control platform 506 to perform one or more of the steps disclosed herein.
  • the control module 590 may be a hybrid of software-based and/or hardware-based instructions to perform one or more of the steps disclosed herein.
  • a real-time component to the system such that the system processes and responds in a timely manner.
  • Numerous embodiments contemplate a real-time or near real-time responsiveness in analyzing and generating alerts, such as those generated or received by the alert module in FIG. 5E .
  • a remote device 518 may comprise a processor 593 , one or more memories 594 , and communication interfaces 599 .
  • the memory 594 may comprise a database 595 for storing data records of various values entered by a user or received through the communications interface 599 .
  • an alert module 596 , command module 597 , and/or dashboard module 598 may be stored in the memory 594 and assist the processor 593 in the remote device 518 in processing and analyzing the data values stored in the database 595 .
  • the aforementioned modules may comprise computer-executable instructions that, when executed by the processor, cause the remote device to perform one or more of the steps disclosed herein.
  • the aforementioned modules may be a hybrid of software-based and/or hardware-based instructions to perform one or more of the steps disclosed herein.
  • the aforementioned modules may generate or receive alerts 596 based on values received through the communications interface. The values may indicate a dangerous condition or even merely a warning condition due to odd sensor readings.
  • the command module 597 in the remote device 518 may generate a command that, when transmitted through the communications interface to the platforms at the plant, causes adjusting of one or more parameter operations of the plant environment depicted in FIG. 5A .
  • the dashboard module 598 may display a graphical user interface to a user of the remote device to enable the user to enter desired parameters and/or commands.
  • command module may transmit these parameters/commands to the command module to generate the appropriate resulting command codes that may be then transmitted, via the communications interface, to cause adjustments or halting/starting of one or more operations in the plant environment.
  • the command codes may be transmitted to a control platform for processing and/or execution.
  • the command codes may be directly communicated, either wirelessly or in a wired fashion, to physical components at the plant such that the physical components comprise an interface to receive the commands and execute them.
  • the remote device 518 may comprise a desktop computer, a smartphone, a wireless device, a tablet computer, a laptop computer, and/or the like.
  • the remote device 518 may be physically located locally or remotely, and may be connected by one of communications links to the public network that is linked via a communications link to the private network.
  • the network used to connect the remote device 518 may be any suitable computer network including the Internet, an intranet, a wide-area network (WAN), a local-area network (LAN), a wireless network, a digital subscriber line (DSL) network, a frame relay network, an asynchronous transfer mode (ATM) network, a virtual private network (VPN), or any combination of any of the same.
  • WAN wide-area network
  • LAN local-area network
  • DSL digital subscriber line
  • ATM asynchronous transfer mode
  • VPN virtual private network
  • Communications links may be any communications links suitable for communicating between workstations and server, such as network links, dial-up links, wireless links, hard-wired links, as well as network types developed in the future, and the like.
  • Various well-known protocols such as transmission control protocol/Internet protocol (TCP/IP), Ethernet, file transfer protocol (FTP), hypertext transfer protocol (HTTP) and the like may be used, and the system can be operated in a client-server configuration to permit a user to retrieve web pages from a web-based server. Any of various conventional web browsers can be used to display and manipulate data on web pages.
  • FIG. 5E Although the elements of FIG. 5E are illustrated as logical block diagrams, the disclosure is not so limited. In particular, one or more of the logical boxes in FIG. 5E may be combined into a single logical box or the functionality performed by a single logical box may be divided across multiple existing or new logical boxes. Moreover, some logical boxes that are visually presented as being inside of another logical box may be moved such that they are partially or completely residing outside of that logical box. For example, while the database is visually depicted in FIG. 5E as being stored inside one or more memories in the remote device, FIG. 5E contemplates that the database may be stored in a standalone data store communicatively coupled, via the communications interface, to the modules stored at the remote device and processor of the remote device.
  • FIGS. 6A-6B depict illustrative system flow diagrams in accordance with one or more embodiments described herein.
  • data collection platform may collect sensor data (e.g., related to a heater).
  • data collection platform may transmit sensor data to data analysis platform.
  • data analysis platform may analyze data. For example, data analysis platform may determine whether a temperature excursion is occurring or likely to occur.
  • data analysis platform may update one or more dashboards—such as, for example, a dashboard (e.g., dashboard 512 ) in communication with data analysis platform (e.g., data analysis platform 504 ) or a dashboard (e.g., dashboard 510 ) in communication with a client portal (e.g., client portal 508 ).
  • a dashboard e.g., dashboard 512
  • data analysis platform e.g., data analysis platform 504
  • dashboard e.g., dashboard 510
  • client portal e.g., client portal 508
  • data analysis platform may send an alert, such as to remote device 1 and/or remote device 2 .
  • the control platform may receive a command, such as from remote device 1 , remote device 2 , and/or data analysis platform.
  • the data analysis platform may receive the command from remote device 1 and/or remote device 2 .
  • the data analysis platform may use the analyzed data to determine the command to send to the control platform.
  • data analysis platform may perform additional analysis based on additional data and/or the received command from remote device 1 and/or remote device 2 before sending a command to control platform.
  • the control platform may cause an adjustment to an operating parameter.
  • the adjustment to the operating parameter may be based on the command received from data analysis platform, remote device 1 , and/or remote device 2 .
  • the adjustment to the operating parameter may be related to one or more pieces of equipment (e.g., one or more reactor units, heaters, or the like, experiencing a temperature excursion or exhibiting warning signs of a potential temperature excursion) associated with sensors that collected the sensor data in step 601 .
  • a flow rate may be increased or decreased
  • a pressure may be increased or decreased
  • a feed rate may be increased or decreased
  • a valve may be opened or closed
  • a process may be started, stopped, extended, or shortened, or the like.
  • FIG. 7 depicts an illustrative graphical user interface 700 of an application that may be used for providing information received from one or more sensors or determined based on analyzing information received from one or more sensors, according to one or more embodiments described herein.
  • the graphical user interface may be displayed on the Human Machine Interface of the Distributed Control System or Programmable Logic Controller or as part of a smartphone application (e.g., running on a remote device, such as remote device 1 or remote device 2 ), a desktop application, a web application (e.g., that runs in a web browser), a web site, an application running on a plant computer, or the like.
  • the graphical user interface 700 may include one or more visual representations of data (e.g., chart, graph, etc.) that shows information about a plant, a particular piece of equipment (e.g., one or more reactor units) in a plant, or a process performed by a plant or a particular piece or combination of equipment in the plant.
  • a graph may show information about an operating condition, an efficiency, a production level, or the like.
  • the graphical user interface may include a description of the equipment, the combination of equipment, or the plant to which the visual display of information pertains.
  • the graphical user interface 700 may display the information for a particular time or period of time (e.g., the last five minutes, the last ten minutes, the last hour, the last two hours, the last 12 hours, the last 24 hours, etc.).
  • the graphical user interface may be adjustable to show different ranges of time, automatically or based on user input.
  • the graphical user interface 700 may include one or more buttons that allow one or more actions.
  • the graphical user interface may include a button (e.g., an “Actions” button) that, when pressed, shows one or more available actions.
  • the graphical user interface may include a button (e.g., a “Change View” button) that, when pressed, changes one or more views of one or more elements of the graphical user interface.
  • the graphical user interface may include a button (e.g., a “Settings” button) that, when pressed, shows one or more settings of the application of which the graphical user interface is a part.
  • the graphical user interface may include a button (e.g., a “Refresh Data” button) that, when pressed, refreshes data displayed by the graphical user interface.
  • data displayed by the graphical user interface may be refreshed in real time, according to a preset schedule (e.g., every five seconds, every ten seconds, every minute, etc.), and/or in response to a received refresh request.
  • the graphical user interface may include a button (e.g., a “Send Data” button) that, when pressed, allows sending data to one or more other devices.
  • the data may be sent via email, SMS, text message, iMessage, FTP, cloud sharing, AirDrop, or via some other method.
  • the interface may receive a selection of one or more pieces of data, graphics, charts, graphs, elements of the display, or the like, to share or send.
  • the graphical user interface may include a button (e.g., an “Analyze Data” button) that, when pressed, causes one or more data analysis functions to be performed.
  • the interface may receive additional input about the desired data analysis, such as desired input, desired output, desired granularity, desired time to complete the data analysis, desired time of input data, or the like.
  • the system may consist of a multi-stage approach, such as a three-stage approach, to mitigate a potential temperature excursion.
  • the three stages can be used together, or individually.
  • the first stage may include an advisory stability monitor (e.g., Stability Gauge 1002 ), based on a weighted algorithm, to alert and advise when the unit is moving away from a stable state and is becoming more susceptible to a temperature runaway.
  • the second and/or third stage may be part of a customized Temperature Excursion Mitigation Control System.
  • Excursion Mitigation Level 1 1004 may return operation to safe parameters with minimal or no loss of production.
  • Temperature Excursion Mitigation Level 2 1006 may include a larger response to place the unit into a safe state and prevent depressuring the unit.
  • the goal of the three-stage approach is to avoid activation of the Emergency Shutdown 1008 system, which leads to depressuring of the unit to flare.
  • the three stages can be used together, or individually, to monitor process conditions, advising of the risk of a temperature excursion when conditions are indicative of the beginning stages, and to automate the response to the situation, thus limiting the progression and severity of the excursion.
  • the advisory stability monitor (e.g., Stability Gauge 1002 ) functions with process indicators to determine the stability of the process unit.
  • the advisory stability monitor uses a weighted algorithm to determine the stability of the unit (weighted based on how much operations deviate from a stable state and how quickly the rate of change is occurring).
  • the advisory stability monitor (e.g., Stability Gauge 1002 ) may provide a stability gauge 404 to allow an instant assessment of the process conditions and the risk of a temperature excursion.
  • the stability gauge may be weighted in value from 0 to 100 with predefined regions, for example, from 0 to 33 may be the green, stable area, 33 to 66 may be the yellow, concern area and 66 to 99 may be the red, danger area. As operating conditions change, the stability gauge may change to indicate whether there are any issues or areas of concern.
  • the advisory stability monitor may provide a continuous assessment of risk, and may indicate whether the risk is decreasing or still increasing when operations parameters are changed.
  • the stability monitor may also provide one or more options to trend and graph certain variables used in the algorithm, as shown in FIG. 7 . These trends can aid in monitoring the unit and help to identify the variables that are causing the instability to aid in determining whether the variables are increasing or decreasing in instability over a period of time.
  • the advisory stability monitor may use an algorithm based on operating conditions (variables) in the plant including, for example, Feed flowrate (F); Makeup Gas Consumption (M); Quench flowrate (Q1, Q2, Q3, etc.); Quench Capacity (C); Pressure (P); Reactive Feed Ratio (A); Recycle Gas Purity (H); Recycle Gas flowrate (R); Gas to oil ratio (G); Axial Temperature (X1, X2, X3, X4 etc.); Radial Temperature (D1, D2, D3, D4, etc.); WABT (W1, W2 etc.); Reactor Bed Temperatures (T); Reactor Bed Inlet Temperatures (I); Light Ends Make (L); Conversion (S).
  • F Feed flowrate
  • M Makeup Gas Consumption
  • Q1, Q2, Q3, etc. Quench Capacity
  • Pressure Pressure
  • Reactive Feed Ratio A
  • Recycle Gas Purity H
  • Recycle Gas flowrate R
  • Gas to oil ratio G
  • FIG. 3 depicts an illustrative cross section of an example vertical reactor. Thermocouples 310 may be placed in different positions on the horizontal plane, as indicated. As depicted in FIG.
  • thermocouples may be placed at various heights along the catalyst beds.
  • a temperature profile plot may be used to evaluate performance of catalyst, effectiveness of quench, and reactor flow patterns.
  • a temperature profile can be constructed by plotting the catalyst temperature versus distance into the catalyst bed (or more accurately versus weight percent of catalyst).
  • FIG. 4 depicts an illustrative example flowchart that, in one or more embodiments, may include one or more depicted steps for operation of an advisory stability monitor (e.g., Stability Gauge 410 ), in conjunction with the Temperature Excursion Mitigation Control System and the Depressuring Emergency Interlock Shutdown System. Some embodiments may include every step, omit certain steps, repeat certain steps, or include additional steps.
  • an advisory stability monitor e.g., Stability Gauge 410
  • Some embodiments may include every step, omit certain steps, repeat certain steps, or include additional steps.
  • An advisory stability monitor (e.g., Stability Gauge 410 ) may constantly and/or periodically receive and assess one or more process indicators 420 . Normal operating conditions may be indicated 402 . Block 410 advises that the reactor temperature has increased from normal and into a cautionary state and action should be taken per established procedures.
  • a stability gauge e.g., stability gauge 800 , stability gauge 1002
  • the stability gauge might not work based on temperature threshold values, but rather may trend away from historical average (stable states).
  • the advisory stability monitor (e.g., Stability Gauge 410 ) continues to monitor and assess the process indicators. As the reactor temperatures rise, the stability monitor may alert to take appropriate action before the automated sequences disrupt production. If the reactor temperatures continue to rise and reach a preset temperature Level 1 trip point, then the Temperature Excursion Mitigation Control System may advise that Temperature Excursion Level 1 (block 412 ) has been reached and automatic actions are being taken. Such actions may include one or more of the following: remove/reduce more reactive feedstock; increase less reactive feed; lower charge heater outlet temperature; and lower the controlled temperature in the reactor bed with an elevated temperature and in the following reactor bed. The objective of Level 1 is to attempt to return operations to safe parameters with minimal or no loss of production.
  • the advisory stability monitor (e.g., Stability Gauge 410 ) continues to monitor and assess the process indicators. As the reactor temperatures rise, the stability monitor may alert to take appropriate action before the automated sequences disrupt production. If the reactor temperatures reach a preset temperature Level 2 trip point, then the Temperature Excursion Mitigation Control System may advise that Temperature Excursion Level 2 (block 414 ) has been reached and automatic actions are being taken. This phase places the unit in a safe state, reducing temperatures and pressures, to allow for an easy and expedient restart of the unit.
  • Stability Gauge 410 continues to monitor and assess the process indicators. As the reactor temperatures rise, the stability monitor may alert to take appropriate action before the automated sequences disrupt production. If the reactor temperatures reach a preset temperature Level 2 trip point, then the Temperature Excursion Mitigation Control System may advise that Temperature Excursion Level 2 (block 414 ) has been reached and automatic actions are being taken. This phase places the unit in a safe state, reducing temperatures and pressures, to allow for an easy and expedient restart
  • Such actions may include one or more of the following: ramp the charge heater outlet temperature down to a lower temperature (e.g., 300° F., 400° F., 500° F., 600° F., or the like); ramp the combined feed exchanger outlet temperature down to a lower temperature (e.g., 300° F., 400° F., 500° F., 600° F., or the like); ramp all reactor bed temperatures down to a lower temperature (e.g., 300° F., 400° F., 500° F., 600° F., or the like); reduce a pressure of the unit by a particular percentage (e.g., 5%, 6%, 7%, 8%, 9%, 10%, or the like) of operating pressure.
  • a lower temperature e.g., 300° F., 400° F., 500° F., 600° F., or the like
  • ramp the combined feed exchanger outlet temperature e.g., 300° F., 400° F., 500° F., 600° F., or the
  • the objective of Level 2 may be to attempt to prevent a depressuring event that may result in extended downtime of the unit as well as associated refinery units, a loss in production, potential damage to the reactors, reactor internals, catalyst beds and the reactor effluent air coolers and environmental flaring of hydrocarbons and sulfur compounds.
  • Another objective of Level 2 may be to place the unit in a safe state that will also allow for an easy and expedient restart of the unit.
  • the Emergency Interlock Shutdown (block 416 ) System may take automatic actions. Such actions may include high rate depressure of the reactor and/or a complete shutdown of the process unit.
  • the Emergency Interlock Shutdown System may already be part of typical design and will remain as the fail safe action to protect the equipment, environment, and prevent loss of life.
  • the examples described herein, including the examples in the preceding paragraph, may be implemented in a graphical user interface, such as illustrated in FIG. 7 and FIG. 8 , through underlying automated rules.
  • the advisory stability monitor e.g., Stability Gauge 410 , Stability Gauge 1002
  • Stability Gauge 410 may trend toward caution and danger and the system may suggest to decrease the catalyst temperature first before reducing the feed rate in response to entry of the command to reduce the feed rate.
  • Such an embodiment may be implemented through software and/or hardware that serves as an interface to the controls that adjust the various variables and parameters of a reactor unit and/or plant.
  • Other examples include enforcement of a desired sequence of events before a particular requested action may be executed.
  • the rate at which an inputted change may occur may be regulated and monitored in a closed feedback loop by the computerized system.
  • the inputted command may be entered by a human operator, but in other instances the command may be automatically generated or input from a local or remote system.
  • an alarm e.g., a visual and/or audible alarm
  • the alarm could be an alarm at a plant, an alarm that is sent to one or more devices, an alarm that shows on a web page or dashboard, or the like.
  • the control platform may take one or more actions, which may be triggered, requested, or recommended by data analysis platform.
  • the data analysis platform may trigger an alert to one or more remote devices (e.g., remote device 1 , remote device 2 ).
  • the alert may include information about the problem.
  • the alert may provide information about one or more determined correlations between the problem and a particular operating condition or combination of operating conditions.
  • the alert may include one or more recommendations for and/or commands causing adjustments to operating conditions, such as adjustments to flows, pressures, temperatures, valves, nozzles, drains, or the like.
  • a remote device may send a command for a particular action (e.g., a corrective action) to be taken, which may or may not be based on the alert.
  • the data analysis platform may send a command for a particular action to be taken, whether or not an alert was sent to or a command was sent by the remote device.
  • the command may cause one or more actions to be taken, which may prevent equipment (e.g., reactor) damage, avoid failure, or the like.
  • the plant process variables used in the algorithm may include, but are not limited to, for example, Feed flowrate (F); Makeup Gas Consumption (M); Quench flowrate (Q1, Q2, Q3, etc.); Quench Capacity (C); Pressure (P); Reactive Feed Ratio (A); Recycle Gas Purity (H); Recycle Gas flowrate (R); Gas to oil ratio (G); Axial Temperature (X1, X2, X3, X4 etc.); Radial Temperature (D1, D2, D3, D4, etc.); WABT (W1, W2 etc.); Reactor Bed Temperatures (T); Reactor Bed Inlet Temperatures (I); Light Ends Make (L); Conversion (S).
  • F Feed flowrate
  • M Makeup Gas Consumption
  • Q1, Q2, Q3, etc. Quench Capacity
  • Pressure P
  • Reactive Feed Ratio A
  • Recycle Gas Purity H
  • Recycle Gas flowrate R
  • Gas to oil ratio G
  • Axial Temperature X1,
  • Initial numbers generally will be based on design recommendations (e.g., Feed change of more than 2%, 3%, 4,%, 5%, 6%, 10%, 15%, etc.; Quench increase by more than 5%, 7%, 10%, 12%, 15%, 20%, 25%, etc.; Cracked feedstock ratio increase by X %), which can be adjusted to avoid nuisance alarms and customize to each unique unit.
  • a method for weighting the changes in the process variables and defining the stability of the unit is described below in a simplified version of the algorithm that exemplifies how and why variables will be used to measure the stability of the unit in order to provide a gauge.
  • Decreases to the feed rate may be preceded by a change in reactor temperatures such that temperatures are lowered before feed rate is changed.
  • ⁇ F may be indicated on a summary display and may be graphed and trended on the variable display that may assist in assessing which variable is leading to instability and whether the change in that variable is increasing or decreasing over the hourly average.
  • Another factor may be used to measure instability due to increases in feed rate.
  • the algorithm for determining and weighting feed rate increases will be similar to the algorithm above.
  • ⁇ M may be indicated on a summary display and may be graphed and trended on the variable display that may assist in assessing which variable is leading to instability and whether the change in that variable is increasing or decreasing over the hourly average.
  • Another factor may be used to measure instability due to a decrease in Makeup Gas Rate.
  • the algorithm for determining and weighting Makeup Gas Rate decreases will be similar to the algorithm above.
  • Quench Rate increases may be indicated on a summary display and may be graphed and trended on the variable display that may assist in assessing which variable is leading to instability and whether the change in that variable is increasing or decreasing over the hourly average.
  • a further display may graph and trend all the various ⁇ Q1, ⁇ Q2, . . . ⁇ Qn such that the specific catalyst beds with higher instability can be identified.
  • the valve may be open all the way. Alternatively, in some embodiments, the valve may be open less than all the way (e.g., 95%, 90%, 85%, 80%, 75%, 70%, 65%, 60%, 55%, 50%, 45%, 40%, 35%, 30%, 25%, 20%, 15%, 10%, 5%, 1%).
  • a quench valve position may be determined from a quench valve position sensor, which may read and send a position of a particular quench valve of a reactor. In one or more embodiments, a quench valve might not have a quench valve position sensor.
  • quench valve Even if a quench valve does not have a quench valve position sensor, the quench valve might be set by sending a command indicating a position that the quench valve should be set to. A quench valve position may be determined from the command sent to the quench valve.
  • Quench capacity may be defined as the available valve opening remaining, such that if the valve opening is at a first percentage, the available remaining capacity is a second percentage (e.g., 100%—first percentage). Thus, for example, if the valve opening is at 75%, then the available remaining capacity is 25%. Similarly, if the valve opening is at 65%, then the available remaining capacity is 35%. If the valve opening is at 45%, then the available remaining capacity is 55%.
  • the stability factor for Quench capacity may be calculated based on a percent of quench control valve opening. Different benchmarks (e.g., normal operation, caution, danger) may be set. For example, if the quench control valve opening moves above 50%, the stability gauge may indicate caution, and if the quench control valve opening moves above 65%, the stability gauge may indicate danger. In another embodiment, if the quench control valve opening moves above 60%, the stability gauge may indicate caution, and if the quench control valve opening moves above 75%, the stability gauge may indicate danger. In another embodiment, if the quench control valve opening moves above 30%, the stability gauge may indicate caution, and if the quench control valve opening moves above 50%, the stability gauge may indicate danger. The stability gauge may weight the instability by using only the valve with the least capacity.
  • Different benchmarks e.g., normal operation, caution, danger
  • Quench Capacity may be indicated on a summary display and may be graphed and trended on the variable display that may assist in assessing which variable is leading to instability and whether the change in that variable is increasing or decreasing over the hourly average.
  • a further display may graph and trend all the various C1, C2, . . . Cn such that the specific valves with least capacity can be identified.
  • Decreases in pressure indicate that more makeup gas is being consumed than can be replenished to maintain pressure in the unit. This is an indication that reactions may be increasing.
  • Pressure decreases may be indicated on a summary display and may be graphed and trended on the variable display that may assist in assessing which variable is leading to instability and whether the change in that variable is increasing or decreasing over the hourly average.
  • Reactive Feed Ratio ( ⁇ A) and Design Reactive Feed Ratio (U) may be indicated on a summary display and may be graphed and trended on the variable display that may assist in assessing which variable is leading to instability and whether the change in that variable is increasing or decreasing over the hourly average.
  • Recycle Gas Purity indicates that the unit may be moving into areas of instability. Decreases in Recycle Gas Purity indicates that reactions in the beds may be increasing and more light ends are being produced. Increasing Recycle Gas Purity increases the partial pressure of the unit and may result in changes to the conversion or increased hydrotreating reactions.
  • Recycle Gas Purity ⁇ H increase and ⁇ H decrease may be indicated on a summary display and may be graphed and trended on the variable display that may assist in assessing which variable is leading to instability and whether the change in that variable is increasing or decreasing over the hourly average.
  • a decrease in Recycle Gas rate can cause instability.
  • J included in the algorithm is a parameter, J, which considers the unit design Recycle Gas rate. As the operating Recycle Gas rate nears the design rate, the stability gauge will increase in trending toward danger.
  • Recycle Gas rate ( ⁇ R) and Design Recycle Gas rate (J) may be indicated on a summary display and may be graphed and trended on the variable display that may assist in assessing which variable is leading to instability and whether the change in that variable is increasing or decreasing over the hourly average.
  • a decrease in Gas to Oil Ratio can indicate instability.
  • Gas to Oil Ratio may be indicated on a summary display and may be graphed and trended on the variable display that may assist in assessing which variable is leading to instability and whether the change in that variable is increasing or decreasing over the hourly average.
  • B tempsx may be a unique, adjustable bias for each reactor bed, so hydrotreating and cracking beds can be tuned and customized as required.
  • the stability gauge may weight the instability by using only the temperature with the largest increase.
  • Reactor Bed Temperatures may be indicated on a summary display and may be graphed and trended on the variable display that may assist in assessing which variable is leading to instability and whether the change in that variable is increasing or decreasing over the hourly average.
  • the axial bed temperature and/or the average of the axial bed temperatures in a bed may be indicated on a summary display and may be graphed and trended on the variable display that may assist in assessing which variable is leading to instability and whether the change in that variable is increasing or decreasing over the hourly average.
  • a further display may graph and trend all the various Z1, Z2, . . . Zn such that the axial bed rises with the largest increase can be identified.
  • the stability gauge may weight the instability by using only the radial bed with the largest increase.
  • D and/or Y may be indicated on a summary display and may be graphed and trended on the variable display that may assist in assessing which variable is leading to instability and whether the change in that variable is increasing or decreasing over the hourly average.
  • a further display may graph and trend all the various ⁇ D1, ⁇ D2, . . . ⁇ Dn such that the axial bed rises with the largest increase can be identified.
  • the WABT is measurement of the weighted average bed temperatures and will be used to indicate instability in individual reactor beds.
  • the algorithm for increasing the WABT may be:
  • ⁇ W may be indicated on a summary display and may be graphed and trended on the variable display that may assist in assessing which variable is leading to instability and whether the change in that variable is increasing or decreasing over the hourly average.
  • Light Ends Make (L) is visible in the Separator off gas flow rate, the Stripper Off gas flow rate and the Receiver Liquid level and Receiver Liquid flow rate.
  • Increasing Light Ends Make indicates that reactions may be increasing, conversion is higher and temperatures may be increasing.
  • Light Ends Make may be indicated on a summary display and may be graphed and trended on the variable display that may assist in assessing which variable is leading to instability and whether the change in that variable is increasing or decreasing over the hourly average.
  • Increasing conversion is visible in a decreasing Product Fractionator Bottoms Level or the Product Fractionator Bottoms flow rate, depending on the flow scheme.
  • Increasing conversion is a lagging indicator that increasing instability.
  • ⁇ S Conversion Increase
  • the individual bed stability gauge may use the same equations as defined above for each parameter but may combine only the factors listed above that are applicable to each bed.
  • the individual bed stability gauge may be based on an algorithm to weight each individual bed temperature, as well as the axial and radial temperature rise, and combine those factors with weighted amounts for the quench flowrate and available quench capacity for the bed.
  • the individual bed stability gauge may be graphed and trended on the variable display.
  • the display may depict one or more individual bed stabilities, and/or whether the stability of each individual bed is increasing or decreasing over the hourly average.
  • FIG. 8 depicts an illustrative graphical user interface of a stability gauge of a dashboard display that may display information received from one or more sensors or determined based on analyzing information received from one or more sensors, according to one or more embodiments described herein.
  • One or more examples of stability algorithms described herein may form the underlying calculations for effecting the display of a stability gauge and/or resulting automated actions on the plant and/or equipment (e.g., reactor unit).
  • the stability gauge may consider other temperature measurements in its final display of an indication zone. For example, measurements of one or more of an axial bed temperature (X) and radial bed temperature (D) may be used in adjusting the stability gauge indicator from one zone to another zone, or in micro-adjusting the stability gauge indicator within the same zone.
  • the Z variable may be indicated on a summary display and may be graphed on the variable display that may assist in assessing which variable is leading to instability and whether the change in that variable is increasing or decreasing over the hourly average.
  • the Y variable may be indicated on a summary display and may be graphed on the variable display that may assist in assessing which variable is leading to instability and whether the change in that variable is increasing or decreasing over the hourly average.
  • ⁇ W may be indicated on a summary display and may be graphed on the variable display that may assist in assessing which variable is leading to instability and whether the change in that variable is increasing or decreasing over the hourly average.
  • the stability gauge illustrated in FIG. 8 may adjust its indicator along the spectrum of zones.
  • the stability gauge may monitor process conditions indicative of the beginning stages of a temperature excursion and automate a response to the situation, thus limiting the progression and severity of the excursion.
  • the Temperature Excursion Mitigation System may take automated actions to alleviate possible excursions.
  • automatic actions/response include, but are not limited to one or more of the following: remove or reduce reactive feedstock; increase less reactive feed; lower temperature in the charge heater; and/or lower temperature in the reactor bed in alarm and the following bed.
  • the plant may be equipped with the numerous wired and wireless communication and control capabilities described herein.
  • the flow rate of various feeds may be increased or decreased through automated valve controls that open and/or close based on commands sent from a control platform illustrated in FIG. 5A .
  • the commands may be generated based on analysis being performed by the data analysis platform and/or data collection platform, as illustrated in FIG. 5A .
  • a command module, as illustrated in FIG. 5C may collate the sequence of bytes appropriate to control components of the reactor unit, for example, to alleviate possible excursions.
  • Sensor information may be gathered by one or more sensors and transmitted to data collection platform.
  • Data collection platform may transmit the collected sensor data to data analysis platform, which may be at a plant or remote from a plant (e.g., in the cloud).
  • a data processing platform may receive (e.g., from one or more sensors) one or more operational parameters, which may be used alone or in combination for determining the efficiency of the reactor unit.
  • the data processing platform may use one or more design parameters, alone or in combination, for determining the status of the reactor unit.
  • a design parameter may be a level at which the reactor unit was designed to operate at, below, or above. For example, a reactor unit may be designed to operate within a particular temperature range (e.g., the operating temperature should never exceed a metallurgical limit of the reactor).
  • the timestamp of a calculated attribute may match the timestamp of the raw data used for the calculation.
  • a calculated attribute may use one or more results of one or more other calculated attributes; therefore, the order in which the attributes are calculated may be relevant.
  • raw values may be checked for bad values. If bad values are detected, the data processing platform may either skip calculation or replace the bad value with NULL, as appropriate for subsequent calculations. For averages, a provision may be made to skip bad/null values and/or timestamps.
  • some units of measurement for variables may be specified. Some variables may be dimensionless, and therefore might not have a defined unit of measurement.

Landscapes

  • Chemical & Material Sciences (AREA)
  • Organic Chemistry (AREA)
  • Chemical Kinetics & Catalysis (AREA)
  • Engineering & Computer Science (AREA)
  • Oil, Petroleum & Natural Gas (AREA)
  • General Chemical & Material Sciences (AREA)
  • Automation & Control Theory (AREA)
  • Remote Sensing (AREA)
  • Physics & Mathematics (AREA)
  • General Physics & Mathematics (AREA)
  • Testing And Monitoring For Control Systems (AREA)
  • Production Of Liquid Hydrocarbon Mixture For Refining Petroleum (AREA)

Abstract

Systems and methods are disclosed for detecting temperature excursion in a chemical plant or petrochemical plant or refinery. Aspects of the disclosure provide an enhanced control system for a reactor, such as in hydroprocessing. The enhanced control system may provide early warnings of impending undesirable events, directly or indirectly manipulate certain process variables to reduce undesirable outcomes, and/or directly or indirectly manipulate of certain process variables so as to place a reactor unit in a “safe park” state. This may avoid a high temperature trip, depressuration, associated operating risks, allow for faster recovery from temperature excursions, and/or avoid unplanned emergency shutdowns of the reactor, chemical process, plant, or refinery.

Description

CROSS REFERENCE TO RELATED APPLICATION
This application claims the benefit under 35 U.S.C. 119(e) of U.S. Provisional Patent Application No. 62/522,612, filed Jun. 20, 2017, which is incorporated by reference herein.
TECHNICAL FIELD
The present disclosure is related to a method and system for managing the operation of a plant, such as a chemical plant or a petrochemical plant or a refinery, and more particularly to a method for improving on-stream reliability by preventing and mitigating temperature related emergency shutdowns of an operating plant. Typical plants may be those that provide hydrocarbon cracking, hydrotreating, isomerization, exothermic process plants, and/or other process units where potentially exothermic reactions take place. Other units may include units with depressure systems.
BACKGROUND
Industrial process control and automation systems are often used for large and complex industrial processes. Industrial processes are typically implemented using large numbers of devices, such as pumps, valves, compressors, or other industrial equipment used to implement various aspects of the industrial processes. With these large numbers of devices, improving detection and prevention of equipment or process malfunctions can increase efficiency and safety of an operation of a plant or refinery.
SUMMARY
The following summary presents a simplified description of certain features. The summary is not an extensive overview and is not intended to identify key or critical elements.
One or more embodiments may include a system for preventing temperature excursion in a reactor. The system may include a reactor. The system may include a heater. The system may include a catalyst bed. The system may include a sensor configured to measure data associated with the catalyst bed. The system may include an analysis platform. The analysis platform may include one or more processors and memory. The memory may store executable instructions that, when executed, cause the analysis platform to: receive the data associated with the catalyst bed; analyze the data associated with the catalyst bed; determine, based on analyzing the data associated with the catalyst bed, whether a temperature of the reactor is above a threshold; and based on determining that the temperature of the reactor is above the threshold, send a message to a control system associated with the reactor, the message configured to cause an action to reduce the temperature of the reactor.
One or more embodiments may include non-transitory computer-readable media storing executable instructions that, when executed by one or more processors, cause a system including a reactor, a heater, a catalyst bed, and a sensor, to receive, from the sensor, data measured by the sensor and associated with the catalyst bed; analyze the data associated with the catalyst bed; determine, based on analyzing the data associated with the catalyst bed, whether a temperature of the reactor is above a threshold; and based on determining that the temperature of the reactor is above the threshold, send a message to a control system associated with the reactor, the message configured to cause an action to reduce the temperature of the reactor.
One or more embodiments may include a method including receiving, by a computing device and from a sensor configured to measure data associated with a catalyst bed associated with a reactor, data measured by the sensor and associated with the catalyst bed; analyzing, by the computing device, the data associated with the catalyst bed; determining, by the computing device, based on analyzing the data associated with the catalyst bed, whether a temperature of the reactor is above a threshold; and based on determining that the temperature of the reactor is above the threshold, sending, by the computing device, a message to a control system associated with the reactor, the message configured to cause an action to reduce the temperature of the reactor.
Other technical features may be readily apparent to one skilled in the art from the following figures, descriptions, and claims.
BRIEF DESCRIPTION OF DRAWINGS
The present disclosure is illustrated by way of example and not limited in the accompanying figures in which like reference numerals indicate similar elements and in which:
FIG. 1 depicts one possible illustrative arrangement for a catalytic hydrocracking process in accordance with one or more example embodiments;
FIGS. 2-1 to 2-6 depicts an illustrative arrangement of sensors in a hydrocracking reactor in accordance with one or more example embodiments;
FIG. 3 depicts an illustrative arrangement of thermocouples in a reactor in accordance with one or more example embodiments;
FIG. 4 depicts an illustrative flow diagram of the enhanced control system in accordance with one or more example embodiments;
FIG. 5A depicts an illustrative computing environment for managing the operation of one or more pieces of equipment in a plant in accordance with one or more example embodiments;
FIG. 5B depicts an illustrative data collection computing platform for collecting data related to the operation of one or more pieces of equipment in a plant in accordance with one or more example embodiments;
FIG. 5C depicts an illustrative data analysis computing platform for analyzing data related to the operation of one or more pieces of equipment in a plant in accordance with one or more example embodiments;
FIG. 5D depicts an illustrative control computing platform for controlling one or more pieces of equipment in a plant in accordance with one or more example embodiments;
FIG. 5E depicts an illustrative remote device for analyzing data related to the operation of one or more pieces of equipment in a plant in accordance with one or more example embodiments;
FIGS. 6A and 6B depict an illustrative flow diagram of one or more steps that one or more devices may perform in controlling one or more aspects of a plant operation in accordance with one or more example embodiments;
FIGS. 7 and 8 depict illustrative graphical user interfaces related to one or more aspects of a plant operation in accordance with one or more example embodiments;
FIG. 9 depicts an illustrative computing environment for implementing temperature excursion mitigation in accordance with one or more example embodiments; and
FIG. 10 depicts an illustrative multi-stage approach to temperature excursion mitigation in accordance with one or more example embodiments.
DETAILED DESCRIPTION
In the following description of various illustrative embodiments, reference is made to the accompanying drawings, which form a part hereof, and in which is shown, by way of illustration, various embodiments in which aspects of the disclosure may be practiced. It is to be understood that other embodiments may be utilized, and structural and functional modifications may be made, without departing from the scope of the present disclosure.
It is noted that various connections between elements are discussed in the following description. It is noted that these connections are general and, unless specified otherwise, may be direct or indirect, wired or wireless, and that the specification is not intended to be limiting in this respect.
References herein to a “plant” or “system” are to be understood to refer to any of various types of chemical and petrochemical manufacturing or refining facilities. References herein to a plant “operators” are to be understood to refer to and/or include, without limitation, plant planners, managers, engineers, technicians, technical advisors, specialists (e.g., in instrumentation, pipe fitting, and welding), shift personnel, and others interested in, starting up, overseeing, monitoring operations of, and shutting down, the plant.
Refining processes produce desirable products, such as Lube oil base stock, Kerosene fuel, diesel fuel and other products known as middle distillates, as well as lower boiling hydrocarbon liquids, such as LPG, naphtha and gasoline. For example, heavy petroleum fractions may be catalytically hydrocracked into lighter, more valuable products.
In one example of a catalytic exothermic refining process where the present disclosure can be applied, feedstocks most often subjected to hydrocracking are the gas oils and heavy atmospheric and vacuum gas oils recovered from crude oil by distillation and catalytically or thermally cracked gas oils. These feedstocks are converted to lower molecular weight products. Simultaneously with the hydrocracking, sulfur, nitrogen, and oxygen compounds are almost completely removed and olefins are saturated, thereby giving products which are a mixture of essentially pure paraffins, naphthenes, and aromatics. The hydrocracking reactions proceed to a desired conversion as the feed is processed over several fixed beds of catalyst at elevated hydrogen pressure and temperature. Reactive feeds may include Light Cycle Oil (LCO) and Coker Gas Oil (CGO)—heavy (HCGO) or light (LCGO). Less reactive feeds may include straight run Vacuum Gas Oil (VGO).
The process makes use of two groups of reactions, hydrotreating and hydrocracking, to make clean, saturated, high value products. The hydrotreating reactions remove contaminants from the feed and product streams, while the hydrocracking reactions create usable lighter molecular weight products. The primary hydrotreating reactions are sulfur and nitrogen removal as well as olefin saturation. The products of these reactions are the corresponding contaminant-free hydrocarbon, along with H2S and NH3. Other treating reactions include oxygen, metals and halide removal, and aromatic saturation. The reactions are typically carried out at elevated pressures and temperatures in a hydrogen atmosphere.
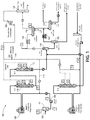
There are many hydrotreating/hydrocracking systems including single stage and two stage systems. FIG. 1 shows one typical arrangement for an Enhanced two stage hydrotreating/hydrocracking system 100. It is noted that FIG. 1 depicts a simplified version for illustrative purposes and further equipment such as additional heaters, exchangers, valves, instrumentation, and the like, will be present in fully operating systems.
Fresh feed (e.g., vacuum gas oil) 102 enters the system via feed surge drum 104. From the bottom of the surge drum the feed flows to the suction of the reactor charge pump 106. Hydrogen 114 may be added to the fresh feed stream before entering the heater 108. (Alternatively, the fresh feed may be combined with the hydrogen before the combined feed exchangers.)
The combined feed and hydrogen stream exchanges heat with the reactor effluent and is further heated in a combined feed heater 108. (Alternatively, feed and recycle gas are heated separately by exchange with reactor effluent, for example. The recycle gas may be further heated in a recycle gas heater and then joins with the feed at the reactor inlet.)
After heating, the feedstock enters a two-stage reactor system with catalytic reactor 110 and catalytic reactor 112. Reactors 110 and 112 each may be divided into individual catalyst beds supported on a beam and grid support system. The support system may be separated from the next bed of catalyst by a quench gas distributor, a reactant mixing chamber and a vapor/liquid distribution tray. The reactants flow downward through the catalyst beds.
After exiting the reactor 112, the product stream is separated from the reaction byproducts and excess recycle gas. A typical high conversion recycle operation unit incorporates a hot separator 116.
The hot separator vapor is normally cooled by exchange with the recycle gas stream. It may also be cooled by exchange with the liquid feed stream. The vapor is then further cooled in an air cooler 140 before entering the cold separator 118. The liquid hydrocarbon and water are allowed to settle in the separator. The water is sent to sour water treating facilities. The hydrocarbon liquid leaves the cold separator 118 and flows into the cold flash drum 122 where the liquid is depressured. As it flows across a level control valve, dissolved hydrogen, H2S, and light hydrocarbons are flashed off. Vapor is removed from the cold flash drum on pressure control. The hot separator liquid is routed to a hot flash drum 120 where dissolved hydrogen, H2S, and light hydrocarbon are flashed off. The flashed vapor from the hot flash drum is cooled via cooler 142 and then joins with the hydrocarbon liquid from the cold separator before entering the cold flash drum. Both hot and cold flash drum hydrocarbon liquids flow separately into the fractionation section.
The feed to the fractionation section will contain several species from hydrogen and hydrogen sulfide through the heaviest components, and this stream will be separated into the desired products such as light gases, LPG, gasoline, kerosene, diesel oil, and unconverted oil from the fractionator column bottoms.
After separation of the gas and liquid phases in the cold separator, the gas leaves from the top of the cold separator 118 and flows to the suction of the recycle gas compressor 126. In some cases the recycle gas will be first sent to an amine scrubber 124 to remove H2S. The recycle gas compressor 126 may be reciprocating or centrifugal.
After the recycle compressor discharge, some recycle gas will be split off the main stream for use as quench gas between catalyst beds of reactors 110 and 112. Separate quench gas streams are used to reduce reactor interbed temperatures before each catalyst bed. Quench flow is regulated by reactor bed inlet temperature, either by direct temperature control or by cascading through quench gas flow controller.
The bulk of the recycle gas is normally joined by the makeup gas 128. In some cases, the makeup gas joins the recycle gas before the recycle gas compressor. From this point, until it returns to the cold separator, the gas flows along with the liquid through the reactor circuit in the same manner previously described.
The makeup gas 128 for the unit is a hydrogen rich gas normally coming from a hydrogen plant. The makeup gas compressors will then compress the gas from supply pressure up to the reactor circuit pressure. From the discharge of the last stage of compression, the makeup gas typically joins the recycle gas at the discharge of the recycle gas compressor and flows to the reactors as described above. As hydrogen is consumed in the reactors, the pressure in the cold separator will start to decrease. This will in turn call for more makeup gas.
In each of the reactions described above, hydrogen is consumed and heat is released. All the major reactions are exothermic and result in a temperature rise across the reactors. The saturation of olefins generates the greatest amount of heat. Pressures generally range from 105-190 kg/cm2g (1500-2700 psig), and temperatures from 290-455° C. (550-850° F.).
Problems Encountered
Hydrocracking, hydrotreating, isomerization, or a number of different exothermic systems may be subject to reactor temperature excursions. As the reactants flow downward through the catalyst beds, chemical reactions occur. All the major chemical reactions which take place are exothermic; hence the temperature increases as the feed and recycle gas proceed through the catalyst beds. It is important that the temperature increase (delta T) be controlled carefully at all times. It is possible to generate more heat from the reactions than the flowing streams can remove from the reactors. If this happens, the temperature may increase very rapidly causing a temperature excursion or a temperature runaway. A temperature runaway is a very serious situation since extremely high temperatures can be generated within a short period of time. These high temperatures can cause damage to the catalyst, coking, and/or structural damage to the reactors or other equipment (e.g., reactor internals, reactor supports, piping, effluent exchangers), which result in expensive shutdowns and repairs of the reactor, the hydrocracking unit, or even other refinery units. In other instances, high temperatures may result in loss of containment (e.g., explosion, fire), environmental release of chemicals (e.g., hydrocarbons, sulfur compounds), and/or injury or death. It is important, therefore, to know if temperatures are rising above designed temperatures.
One cause of temperature excursion is uneven flow distribution. The gas and liquid reactants must be evenly (homogenously) distributed across the cross-sectional area of the reactor as they enter the catalyst bed and should flow down through the catalyst bed contacting all catalyst completely. If the flow distribution is not homogenous, less catalyst is available to promote reaction and higher temperatures are required to reach the desired conversion. This can lead to shortened catalyst life, catalyst “hot spots”, catalyst temperatures which are in excess of the design temperature limit of the reactor vessel, damage to the vessel wall, and unstable temperature control. In some extreme cases, a local temperature runaway can develop which can go well over 540° C. (1000° F.). High localized temperatures can lead to increased coking and fusion of the catalyst.
Other causes of temperature excursions are feed composition changes causing increased cracking and heat release in catalyst beds, or changes in feed rate or recycle gas rate. To protect the reactors from damage due to extremely high temperatures, the unit should be depressured at the recommended high rate.
Depressuring the unit at the high rate is undesirable as it can cause extended downtime of the unit as well as associated refinery units, a loss in production, potential damage to the reactors, reactor internals, catalyst beds and the reactor effluent air coolers and environmental flaring of hydrocarbons and sulfur compounds.
A shutdown or a depressuring event typically results in approximately five days of loss of production, which can result in significant revenue losses.
Enhanced Control
Aspects of the disclosure provide an enhanced control system that provides early warnings of impending undesirable events, direct or indirect manipulation of certain process variables to reduce undesirable outcomes, and/or direct or indirect manipulation of certain process variables that may place the unit in a “safe park” state to avoid the high temperature trip, depressurization, and/or associated operating risks and losses.
An automated system may take control actions to restore normal operations or bring the process to a safe operating condition from which it can be easily restarted. The control actions may be triggered based on the detection of predefined patterns on key variables.
The control actions (e.g., increase quench to reduce temperature in the reactor beds) may be focused on reducing catalyst bed temperatures to prevent the runaway reaction from occurring. For example, the control actions may be focused on the bed where temperature elevation is detected and the beds immediately above and below as needed to direct available quench gas to where it is needed the most.
An automated system may eliminate operator hesitation and inconsistencies on executing recommended emergency procedures. The implementation of this system may allow for identifying and programmatically taking actions to mitigate the progression of a temperature excursion, thus preventing the emergency shutdown logic from triggering, which in turns avoids costly downtime and production losses. This system may be implemented on catalytic conversion units where exothermic reactions take place, for example, in potentially exothermic process units, such as hydrocracking units.
An illustrative diagram of an example system 900 for implementing early warnings of undesirable events is depicted in FIG. 9. One or more elements of this example system may be similar to and/or include one or more elements or similar elements to those described elsewhere herein (such as in connection with FIGS. 5A-5E). The system 900 for implementing early warnings of undesirable events at a process plant 902 (e.g., hydrocracking plant) may include one or more of a distributed control system 904, advanced process control 906, process historian 908, temperature excursion mitigation system 912, emergency shutdown system 914, and/or operator console human-machine interface 916.
The system 900 may be reliable, safe, and robust. The system 900 may include a fault-tolerant system with one or more processors, self diagnostics, redundant power supplies, and/or one or more certifications (e.g., TÜV AK 6 Certification).
Distributed control system 904 may be a local or remote control system that receives sensor data from one or more pieces of equipment in the process plant 902, and transmits control information to control operation of the one or more pieces of equipment in the process plant 902. Distributed control system 904 may be similar to, integrate, or be integrated in, for example, in a control platform (e.g., control platform 506, described herein). Distributed control system 904 may be a hydroprocessing unit distributed control system.
Advanced process control 906 may be associated with one or more closed loop optimization processes or services.
Process historian 908 may be associated with one or more open loop optimization processes or services 910 (e.g., connected performance services, process reliability advisor, process optimization advisor). The one or more open loop optimization processes or services 910 (e.g., connected performance services) may provide long term reliability and/or optimization (e.g., recommend changes) of one or more pieces of equipment in process plant 902.
Temperature excursion mitigation system 912 may be focused on closed loop risk mitigation. For example, temperature excursion mitigation system 912 may send electronic communication that changes or resets one or more process settings to mitigate temperature excursion (e.g., electronic communication that changes a digital controller set point). Temperature excursion mitigation system 912 may be similar to, integrate, or be integrated in, for example, in a data analysis platform (e.g., data analysis platform 504, described herein). Temperature excursion mitigation system 912 may be implemented on a Programmable Logic Controller (PLC) platform, or other suitable control solver platform, that communicates with distributed control system 904. Temperature excursion mitigation system 912 may implement at least one algorithm that monitors process variables measurements on a regular basis to detect the conditions that can potentially lead to a temperature excursion. Upon detection and verification of such condition(s), control actions may be sent to the distributed control system 904 in the form of single shot or repetitive commands via a communication protocol, and/or user notification alerts and/or alarms may be issued (e.g., via the distributed control system 904).
Emergency shutdown system 914 may perform or trigger emergency shutdown of process plant 902 or of one or more pieces of equipment in process plant 902.
Operator console human-machine interface 916 may include one or more devices (e.g., computer, terminal, tablet, laptop, smartphone) that include one or more graphical user interfaces (e.g., dashboard) for interacting with a human operator. The one or more graphical user interfaces may provide information on operations of process plant 902, such as operation information, warnings (e.g., warnings of potential temperature excursions, warnings of imminent temperature excursions, warnings of ongoing temperature excursions), alerts, or the like. The one or more graphical user interfaces may receive user input and cause one or more changes (e.g., via distributed control system 904) to the operation of process plant 902 or one or more pieces of equipment in process plant 902 (e.g., to stop or mitigate a temperature excursion). The temperature excursion mitigation system 912 may include a dedicated human-machine interface (e.g., computer, terminal, control panel, tablet, laptop, smartphone), that includes one or more graphical user interfaces for interacting with a human operator to change system configuration parameters and/or monitor the system performance.
In one or more embodiments, a multi-stage (e.g., two, three, four stages) approach may be utilized to mitigate a potential temperature excursion. One example of a multi-staged approach is depicted in FIG. 10. In the depicted example, the multi-staged process may include use of a stability gauge 1002, an excursion mitigation level 1 response 1004, an excursion mitigation level 2 response 1006, and an emergency shutdown 1008. A system (e.g., temperature excursion mitigation system 912) may use an algorithm to determine if a temperature excursion is possible, likely, imminent, or occurring, and may enter one or more stages of the multi-stage approach based on one or more temperature excursion factors surpassing various thresholds (e.g., two different thresholds corresponding to two different stages).
A stage may include use of a stability gauge 1002 (e.g., similar to stability gauge 800 depicted in FIG. 8), which may allow for indication of causes and/or areas of concern. One or more objectives of the stability-gauge stage may include leaving control with operators as long as possible, providing a gauge to assist the operators, combining one or more (e.g., all) the process variables the operator should be watching onto one or more graphical user interfaces, and/or to maintain production (e.g., of a product of a plant) as long as possible. In one or more embodiments, the stability gauge may include one gauge combining key process variables. A stability gauge may be associated with a process plant 902, or may be associated with one or more pieces of equipment in process plant 902. One or more pieces of equipment in process plant 902 may be associated with one or more stability gauges.
In one or more embodiments, one or more devices (e.g., temperature excursion mitigation system 912) may include an algorithm to determine unit stability and/or areas of concern. In one or more embodiments, the algorithm may determine unit stability and/or areas of concern using one or more process variables, such as, for example, reactor temperatures (e.g., radial temperature, axial temperature, rate of change, hot spots), LHSV (e.g., feed rate), feed stock type (e.g., reactive feeds), quench gas rates, spare quench capacity, makeup gas consumption, unit pressure, and/or the like. In one or more embodiments, the algorithm may apply a weighting to one or more of the process variables when determining unit stability and/or areas of concern. One or more of the process variables and/or a result of the algorithm may be displayed as a stability gauge (e.g., stability gauge 800).
Thus, one or more aspects of the present disclosure may include a stability gauge, based on a weighted algorithm, to alert when the unit is moving away from a stable state and is becoming more susceptible to a temperature runaway.
A stage may include an excursion mitigation level 1 stage (e.g., excursion mitigation level 1 stage 1004) to re-establish control. Excursion mitigation level 1 stage may have objectives, for example, such as the system recognizing a risk of an excursion, automating an action in response (e.g., to eliminate hesitation), and/or taking limited action to attempt to intervene and reestablish control. One or more secondary goals may include maintaining production.
In one or more embodiments, an automated action may include, for example, removing reactive feed stocks. Another automated action may include maintaining a constant feed rate. Another automated action may include reducing charge heater outlet temperature. For example, an automated action may include ramping down charge heater outlet temperature controller setpoint to decrease temperature by an amount (e.g., 5° F., 10° F., 15° F., 20° F., or the like) at a rate (e.g., 0.1° F., 0.2° F., 0.3° F., 0.4° F., 0.5° F., 0.6° F., 0.7° F., or the like per second) in one shot or multiple repetitions.
Another automated action may include reducing temperature in reactor bed N with elevated temperatures. For example, an automated action may include ramping down reactor cracking bed N inlet temperature controller setpoint to decrease temperature by an amount (e.g., 5° F., 10° F., 15° F., 20° F., or the like) at a rate (e.g., 0.1° F., 0.2° F., 0.3° F., 0.4° F., 0.5° F., 0.6° F., 0.7° F., or the like per second) in one shot or multiple repetitions.
Another automated action may include reducing the temperature in other reactor beds. For example, an automated action may include ramping down reactor cracking bed N+1 (e.g., the reactor bed immediately below) inlet temperature controller setpoint to decrease temperature by an amount (e.g., 5° F., 10° F., 15° F., 20° F., or the like) at a rate (e.g., 0.1° F., 0.2° F., 0.3° F., 0.4° F., 0.5° F., 0.6° F., 0.7° F., or the like per second) in one shot or multiple repetitions.
An automated action may include activating one or more alerts or alarms (e.g., alerting that temperature excursion control scheme Level 1 is activated). An automated action may include shedding a higher-level control scheme. An automated action may include resetting the setting of one or more of the more reactive feed flow controllers (e.g., a reactive feed flow controller, such as Light Cycle Oil (LCO) flow controller, Coker Gas Oil (CGO) flow controller) to reduce flow by a predefined percentage. An automated action may include compensating for feed reduction (e.g., LCO/CGO feed reduction) with less reactive feed, such as Straight Run Vacuum Gas Oil (VGO) and/or VGO from Storage to maintain level in the feed surge drum.
When all timers expire, temperature ramps have finished, and all steps are completed, an indicator and/or alert may indicate that the excursion mitigation level 1 stage is complete.
A stage may include an excursion mitigation level 2 stage (e.g., excursion mitigation level 2 stage 1006) to provide a safe park for a unit. A safe park may significantly improve startup/shutdown operations, especially after an excursion. Excursion mitigation level 2 stage may have objectives such as, for example, recognizing that an excursion is imminent, automating an action in response (e.g., to eliminate hesitation), placing the unit in a safe state, leaving the unit in a condition where restart can be fast and easy, and/or avoiding depressuring of the unit.
In one or more embodiments, an automated action may include, for example, activating one or more alerts or alarms (e.g., alerting that temperature excursion control scheme phase 2 is activated). An automated action may include ramping charge heater outlet temperature down to a predefined temperature (e.g., to 300° F., 400° F., 500° F., 600° F., or the like). An automated action may include checking operation at and/or near minimum burner pressure.
An automated action may include bypassing a combined feed exchanger, which may be done while avoiding a high temperature shutdown on a reactor effluent air cooler.
An automated action may include ramping down combined feed heat exchangers outlet temperature controller setpoint to decrease temperature at a rate (e.g., 100° F., 200° F., 300° F., 400° F., 500° F., 600° F., or the like per hour) until reaching a threshold temperature (e.g., 300° F., 400° F., 500° F., 600° F., or the like). If the temperature reaches a reactor effluent air cooler inlet pretrip point, an alert and/or alarm may be triggered and/or sent. Alternatively or additionally, the ramp down of combined feed from combined feed exchangers outlet temperature controller setpoint may be paused and/or the bypass valves may be directly manipulated by the excursion mitigation system through an internal control algorithm to prevent the temperature from reaching the trip point. High reactor effluent air coolers 140 and/or 142 inlet temperatures alarm may be generated while the ramp down is paused. After the alarm is reset, ramp may resume. For example, the ramp may resume and alarm be reset by reactor effluent air cooler inlet pretrip reset.
Another automated action may include ramping all reactor temperatures (e.g., in a particular unit or in an entire plant) down to a particular temperature (e.g., to 300° F., 400° F., 500° F., 600° F., or the like). For example, an automated action may include ramping down all the reactor beds inlet temperature controllers setpoints to decrease the temperature at a rate e.g., 100° F., 200° F., 300° F., 400° F., 500° F., 600° F., or the like per hour) until reaching a threshold temperature (e.g., 300° F., 400° F., 500° F., 600° F., or the like). In one or more embodiments, if the recycle gas flow goes below a pretrip point (which may be set above the recycle gas low flow shutdown trip point), then the ramp down of all reactors beds inlet temperature controllers may be paused. An alarm (e.g., low recycle gas flow alarm) may be generated while the ramp down is paused. The ramp may resume and the alarm be reset by recycle gas flow pretrip reset.
Another automated action may include reducing a pressure of the unit by a particular percentage (e.g., 5%, 6%, 7%, 8%, 9%, 10%, or the like) of operating pressure.
Another automated action may include reducing temperature in one or more other reactor catalyst beds. For example, an automated action may include ramping down reactor cracking bed N and N+1 inlet temperature controller setpoint to decrease temperature first by an amount (e.g., 30° F., 40° F., 50° F., 60° F., or the like) at a rate (e.g., 0.1° F., 0.2° F., 0.3° F., 0.4° F., 0.5° F., 0.6° F., 0.7° F., or the like per second), and the continue to decrease the temperature until reaching a temperature (e.g., 300° F., 400° F., 500° F., 600° F., or the like) at a rate (e.g., 100° F., 200° F., 300° F., 400° F., 500° F., 600° F., or the like per hour).
Another automated action may include ramping down a reactor's all other catalyst beds inlet temperature controller setpoint to decrease temperature until reaching a temperature (e.g., 300° F., 400° F., 500° F., 600° F., or the like) at a rate (e.g., 100° F., 200° F., 300° F., 400° F., 500° F., 600° F., or the like per hour).
When all timers expire, temperature ramps have finished, conditions have normalized (e.g., no longer in danger of a runaway), and all steps are completed, an indicator and/or alert may indicate that the excursion mitigation level 2 stage is complete.
Another automated action may include reducing the temperature of other reactor beds. For example, an automated action may include ramping down reactor cracking bed N−1 inlet temperature controller setpoint to decrease temperature by an amount (e.g., 5° F., 10° F., 15° F., 20° F., or the like) at a rate (e.g., 0.1° F., 0.2° F., 0.3° F., 0.4° F., 0.5° F., 0.6° F., 0.7° F., or the like per second).
A final stage may include an emergency shutdown stage (e.g., emergency shutdown stage 1008). A system may include an emergency interlock system (e.g., emergency shutdown system 914). The emergency shutdown stage may allow for an automated or manual shutdown of a unit, plant, or process to avoid or mitigate damage or a disaster. The emergency shutdown stage may be simple, easy to maintain, and/or avoid spurious shutdowns. The emergency shutdown stage may include depressuring to flare.
In conjunction with or in addition to the multi-stage approach described herein, some systems may use reactor models to adjust process control signals in a more predictive vs. reactive way, or to control ramping rates (e.g., for startup). In one or more embodiments, the present system may analyze operating data and apply experience-based control algorithms focused on excursion prevention and mitigation. Aspects of the present system may reduce unplanned shutdowns, eliminate associated flaring, eliminate associated equipment damage, eliminate associated production losses, and/or shorten time needed to regain full production.
The proper operation of the reactor unit may depend on the careful selection and control of the processing conditions. There are many process variables that may affect catalytic conversion process units performance including operating severity, product yields and quality, and catalyst life. By careful monitoring and control of these process variables, the unit can operate to its full potential. Monitoring also helps to collect data that can be correlated and used to predict behavior or problems in systems used in the same plant or in other plants and/or processes.
The amount of conversion which takes place in the reactors may be determined by several variables; the type of feedstock, the amount of time the feed is in the presence of catalyst, the partial pressure of hydrogen in the catalyst bed, and, the temperature of the catalyst and reactants. Generally, the higher the temperature, the faster the rate of reaction and therefore, the higher the conversion.
In one or more embodiments, a system may include a heater minimum firing mode. This feature may avoid burner flameout, which could lead to hazardous conditions in the heater fire box.
In one or more embodiments, a system may include an auto quench. An auto quench may be programmed to quench the beds requiring additional quench while staying within the constraints set to keep the required flow to the other beds.
In one or more embodiments, a system may include bed temperature control (e.g., bed outlet control, WABT control). For example, a refiner may set a temperature controller's setpoint based on the highest temperature in the bed.
In one or more embodiments, a system may include conversion control. This may be used (e.g., for two-stage units) to determine how to set conversion per pass. Balancing the conversion between the stages may improve operations.
Sensor Data Collection and Processing
The system may include one or more computing devices or platforms for collecting, storing, processing, and analyzing data from one or more sensors. FIG. 5A depicts an illustrative computing system that may be implemented at one or more components, pieces of equipment (e.g., catalytic reactors), and/or plants. FIG. 5A-FIG. 5E (hereinafter collectively “FIG. 5”), show, by way of illustration, various components of the illustrative computing system in which aspects of the disclosure may be practiced. It is to be understood that other components may be used, and structural and functional modifications may be made, in one or more other embodiments without departing from the scope of the present disclosure. Moreover, various connections between elements are discussed in the following description, and these connections are general and, unless specified otherwise, may be direct or indirect, wired or wireless, and/or combination thereof, and that the specification is not intended to be limiting in this respect.
FIG. 5A depicts an illustrative operating environment in which various aspects of the present disclosure may be implemented in accordance with example embodiments. The computing system environment 500 illustrated in FIG. 5A is only one example of a suitable computing environment and is not intended to suggest any limitation as to the scope of use or functionality contained in the disclosure. The computing system environment 500 may include various sensor, measurement, and data capture systems, a data collection platform 502, a data analysis platform 504, a control platform 506, one or more networks, one or more remote devices, and/or one or more other elements. The numerous elements of the computing system environment of FIG. 5A may be communicatively coupled through one or more networks. For example, the numerous platforms, devices, sensors, and/or components of the computing system environment may be communicatively coupled through a private network. The sensors be positioned on various components in the plant and may communicate wirelessly or wired with one or more platforms illustrated in FIG. 5A. The private network 514 may include, in some examples, a network firewall device to prevent unauthorized access to the data and devices on the private network. Alternatively, the private network 514 may be isolated from external access through physical means, such as a hard-wired network with no external, direct-access point. The data communicated on the private network 514 may be optionally encrypted for further security. Depending on the frequency of collection and transmission of sensor measurements and other data to the data collection platform, the private network may experience large bandwidth usage and be technologically designed and arranged to accommodate for such technological issues. Moreover, the computing system environment 500 may also include a public network 516 that may be accessible to remote devices. In some examples, the remote device may be located not in the proximity (e.g., more than one mile away) of the various sensor, measurement, and data capture systems illustrated in FIG. 5A. In other examples, the remote device may be physically located inside a plant, but restricted from access to the private network 514; in other words, the adjective “remote,” need not necessarily require the device to be located at a great distance from the sensor systems and other components.
Although the computing system environment 500 of FIG. 5A illustrates logical block diagrams of numerous platforms and devices, the disclosure is not so limited. In particular, one or more of the logical boxes in FIG. 5 may be combined into a single logical box or the functionality performed by a single logical box may be divided across multiple existing or new logical boxes. For example, aspects of the functionality performed by the data collection platform may be incorporated into one or each of the sensor devices illustrated in FIG. 5A. As such, the data collection may occur local to the sensor device, and the enhanced sensor system may communicate directly with one or more of the control platform and/or data analysis platform. Such an embodiment is contemplated by FIG. 5A. Moreover, in such an embodiment, the enhanced sensor system may measure values common to a sensor, but may also filter the measurements such just those values that are statistically relevant or of-interest to the computing system environment are transmitted by the enhanced sensor system. As a result, the enhanced sensor system may include a processor (or other circuitry that enables execution of computer instructions) and a memory to store those instructions and/or filtered data values. The processor may be embodied as an application-specific integrated circuit (ASIC), FPGA, or other hardware- or software-based module for execution of instructions. In another example, one or more sensors illustrated in FIG. 5A may be combined into an enhanced, multi-purpose sensor system. Such a combined sensor system may provide economies of scale with respect to hardware components such as processors, memories, communication interfaces, and others.
In yet another example, the data collection platform 502 and data analysis platform 504 may reside on a single server computer and be depicted as a single, combined logical box on a system diagram. Moreover, a data store may be illustrated in FIG. 5A separate and apart from the data collection platform 502 and data analysis platform 504 to store a large amount of values collected from sensors and other components. The data store may be embodied in a database format and may be made accessible to the public network 516; meanwhile, the control platform 506, data collection platform 502, and data analysis platform 504 may be restricted to the private network 514 and left inaccessible to the public network 516. As such, the data collected from a plant may be shared with users (e.g., engineers, data scientists, others), a company's employees, and even third parties (e.g., subscribers to the company's data feed) without compromising potential security requirements related to operation of a plant. The data store may be accessible to one or more users and/or remote devices over the public network 516.
Referring to FIG. 5A, process measurements from various sensor and monitoring devices may be used to monitor conditions in, around, and on process equipment (e.g., catalytic reactors). Such sensors may include, but are not limited to, pressure sensors 528, differential pressure sensors, pressure drop sensors 534, flow sensors 531, temperature sensors 526 including thermocouples, thermal cameras 527, and skin thermocouples, capacitance sensors, weight sensors, gas chromatographs 523, hydrogen analyzers, sulfur analyzers, density analyzers, moisture sensors 524, ultrasonic sensors 525, position sensors (e.g., valve position sensors 532), timing sensors (e.g., timers 522), vibration sensors 529, microphones 530, level sensors 536, liquid level (hydraulic fluid) sensors, cycle count sensors 533, and/or other sensors 535 (e.g., sensors commonly found in the refining and petrochemical industry). Further, process laboratory measurements may be taken using equipment such as gas chromatographs 523 and/or liquid chromatographs, and may include, for example, distillation measurements, density measurements, cetane measurements and octane measurements, and/or other laboratory measurements. In one or more embodiments, system operational measurements also can be taken to correlate the system operation to the measurements of the one or more reactor units.
Other sensors may transmit signals to a processor or a hub that collects the data and sends to a processor. For example, temperature and pressure measurements may be sent to a hub (e.g., data collection platform 502). In one example, temperature sensors may include thermocouples, fiber optic temperature measurement, thermal cameras, and/or infrared cameras. Skin thermocouples may be applied to supports, walls, or other locations inside of or near a catalytic reactor unit. Alternatively, thermal (infrared) cameras may be used to detect temperature (e.g., hot spots) in all aspects of the equipment. A shielded (insulated) tube skin thermocouple assembly may be used to obtain accurate measurements. For example, a magnetic skin thermocouple may allow for installation without welding onto the reactor. Alternatively or additionally, clips and/or pads may be utilized for ease of replacement. As another example, Daily Thermetrics CatTracker or Gayesco Flex-R multipoint thermocouples may be used for special catalyst bed temperature measurement.
Sensors may be also used throughout a plant to detect and monitor various issues such as maldistribution, thermal stresses, and temperature excursion.
Furthermore, flow sensors 531 may be used in flow paths such as the inlet to the path, outlet from the path, or within the path. If multiple feed pipes are utilized, the flow sensors 531 may be placed in corresponding positions in each of the pipes. Flow may be determined by pressure-drop across a known resistance, such as by using pressure taps. Other types of flow sensors 531 include, but are not limited to, ultrasonic sensors 525, turbine meter, hot wire anemometer, vane meter, Kármán™, vortex sensor, membrane sensor (membrane has a thin film temperature sensor printed on the upstream side, and one on the downstream side), tracer, radiographic imaging (e.g., identify two-phase vs. single-phase region of channels), an orifice plate in front of or integral to each tube or channel, pitot tube, thermal conductivity flow meter, anemometer, internal pressure flow profile, and/or measure cross tracer (measuring when the flow crosses one plate and when the flow crosses another plate).
Sensor data, process measurements, and/or calculations made using the sensor data or process measurements may be used to monitor and/or improve the performance and reliability of the process unit or the performance of the equipment and parts making up the equipment, as discussed in further detail below. For example, sensor data may be used to detect that a desirable or an undesirable chemical reaction (e.g., a temperature excursion) is taking place within a particular piece of equipment, and one or more actions may be taken to encourage or inhibit the chemical reaction (e.g., to slow, stop, or mitigate the temperature excursion). Chemical sensors may be used to detect the presence of one or more chemicals or components in the streams, such as corrosive species, oxygen, hydrogen, sulfur, and/or water (moisture). Chemical sensors may utilize gas chromatographs, liquid chromatographs, distillation measurements, density measurements, and/or octane measurements.
Monitoring the equipment and processes includes collecting data that can be correlated and used to predict behavior or problems in other plants and/or processes. Data collected from the various sensors (e.g., measurements such as temperature, pressure, flow, pressure drop, thermal performance, vessel skin temperature) may be correlated with external data, such as environmental or weather data. Process changes or operating conditions may be able to be altered to preserve the equipment or the catalyst until the next scheduled maintenance period. At a high level, sensor data collected (e.g., by the data collection platform 502) and data analysis (e.g., by the data analysis platform 504) may be used together, for example, for process simulation, equipment simulation, and/or other tasks. For example, sensor data may be used for process simulation and reconciliation of sensor data. The resulting, improved process simulation may provide a stream of physical properties that are used to calculate heat flow, etc. These calculations may lead to thermal and/or pressure-drop performance prediction calculations for specific equipment or the process, and comparisons of equipment or process predictions to observations from the operating data (e.g., predicted/expected outlet temperature and pressure vs. measured outlet temperature and pressure). This may be used for identification of conditions leading to temperature excursion, and/or other issues that eventually lead to a potential control changes and/or recommendation etc.
Corrective action may be taken based on determining this process and/or equipment information. One or more inputs or controls relating to a process may be adjusted as part of the corrective action. These and other details about the equipment, sensors, processing of sensor data, and actions taken based on sensor data are described in further detail below.
In addition, computing system environment 500 may include transmitters and deviation alarms. These may be programmed to set off an alarm, which may be audible and/or visual. In one or more embodiments, an alert may be transmitted to one or more devices (e.g., remote device 518, 520, client portal 508, dashboard 510, 512).
Systems Facilitating Sensor Data Collection
Sensor data may be collected by a data collection platform 502. The sensors may interface with the data collection platform 502 via wired or wireless transmissions. Sensor data (e.g., temperature data) may be collected continuously or at periodic intervals (e.g., every second, every five seconds, every ten seconds, every minute, every five minutes, every ten minutes, every hour, every two hours, or another interval). Data may be collected at different locations at different intervals. For example, data at a known hot spot may be collected at a first interval, and data at a spot that is not a known hot spot may be collected at a second interval. In another example, data for a catalyst bed with a history of temperature excursions may be collected at a different rate than data for a catalyst bed without history of temperature excursions. The data collection platform 502 may continuously or periodically (e.g., every second, every minute, every hour, every day, once a week, once a month, etc.) transmit collected sensor data to a data analysis platform 504, which may be nearby (e.g. local to) or remote from the data collection platform 502.
The computing system environment 500 of FIG. 5A includes logical block diagrams of numerous platforms and devices that are further elaborated upon in FIG. 5B, FIG. 5C, FIG. 5D, and FIG. 5E. FIG. 5B is an illustrative data collection platform 502. FIG. 5C is an illustrative data analysis platform 504. FIG. 5D is an illustrative control platform 506. FIG. 5E is an illustrative remote device 518. These platforms and devices of FIG. 5 include one or more processing units (e.g., processors) to implement the methods and functions of certain aspects of the present disclosure in accordance with the example embodiments. The processors may include general-purpose microprocessors and/or special-purpose processors designed for particular computing system environments or configurations. For example, the processors may execute computer-executable instructions in the form of software and/or firmware stored in the memory of the platform or device. Examples of well-known computing systems, environments, and/or configurations that may be suitable for use with the disclosed embodiments include, but are not limited to, programmable logic controllers, distributed control systems, personal computers (PCs), server computers, hand-held or laptop devices, smart phones, multiprocessor systems, microprocessor-based systems, programmable consumer electronics, network PCs, minicomputers, mainframe computers, distributed computing environments that include any of the above systems or devices, and the like.
In addition, the platform and/or devices in FIG. 5 may include one or more memories include any of a variety of computer-readable media. Computer-readable media may be any available media that may be accessed by the data collection platform, may be non-transitory, and may include volatile and nonvolatile, removable and non-removable media implemented in any method or technology for storage of information such as computer-readable instructions, object code, data structures, database records, program modules, or other data. Examples of computer-readable media may include random access memory (RAM), read only memory (ROM), electronically erasable programmable read only memory (EEPROM), flash memory or other memory technology, compact disk read-only memory (CD-ROM), digital versatile disks (DVD) or other optical disk storage, magnetic cassettes, magnetic tape, magnetic disk storage or other magnetic storage devices, or any other medium that can be used to store the desired information and that can be accessed by the data collection platform. The memories in the platform and/or devices may further store modules that may include compiled software code that causes the platform, device, and/or overall system to operate in a technologically improved manner as disclosed herein. For example, the memories may store software used by a computing platform, such as operating system, application programs, and/or associated database.
Furthermore, the platform and/or devices in FIG. 5 may include one or more communication interfaces including, but not limited to, a microphone, keypad, touch screen, and/or stylus through which a user of a computer (e.g., a remote device) may provide input, and may also include a speaker for providing audio output and a video display device for providing textual, audiovisual and/or graphical output. The communication interfaces may include a network controller for electronically communicating (e.g., wirelessly or wired) over a public network or private network with one or more other components on the network. The network controller may include electronic hardware for communicating over network protocols, including TCP/IP, UDP, Ethernet, RTU, and other protocols.
In some examples, one or more sensor devices in FIG. 5A may be enhanced by incorporating functionality that may otherwise be found in a data collection platform 502. These enhanced sensor systems may provide further filtering of the measurements and readings collected from their sensor devices. For example, with some of the enhanced sensor systems in the operating environment illustrated in FIG. 5A, an increased amount of processing may occur at the sensor so as to reduce the amount of data needing to be transferred over a private network in real-time to a computing platform. The enhanced sensor system may filter at the sensor itself the measured/collected/captured data and only particular, filtered data may be transmitted to the data collection platform for storage and/or analysis.
Referring to FIG. 5B, in one example, a data collection platform 502 may comprise a processor 560, one or more memories 562, and communication interfaces 568. The memory 562 may comprise a database 564 for storing data records of various values collected from one or more sources. In addition, a data collection module 566 may be stored in the memory 562 and assist the processor 560 in the data collection platform 502 in communicating with, via the communications interface 568, one or more sensor, measurement, and data capture systems, and processing the data received from these sources. In some embodiments, the data collection module 566 may comprise computer-executable instructions that, when executed by the processor 560, cause the data collection platform 502 to perform one or more of the steps disclosed herein. In other embodiments, the data collection module 566 may be a hybrid of software-based and/or hardware-based instructions to perform one or more of the steps disclosed herein. In some examples, the data collection module 566 may assist an enhanced sensor system with further filtering the measurements and readings collected from the sensor devices. Although the elements of FIG. 5B are illustrated as logical block diagrams, the disclosure is not so limited. In particular, one or more of the logical boxes in FIG. 5B may be combined into a single logical box or the functionality performed by a single logical box may be divided across multiple existing or new logical boxes. Moreover, some logical boxes that are visually presented as being inside of another logical box may be moved such that they are partially or completely residing outside of that logical box. For example, while the database 564 in FIG. 5B is illustrated as being stored inside one or more memories 562 in the data collection platform 502, FIG. 5B contemplates that the database 564 may be stored in a standalone data store communicatively coupled to the data collection module 566 and processor 560 of the data collection platform 502 via the communications interface 568 of the data collection platform 502.
Data collection platform 502 may include or be in communication with one or more data historians. The data historian may be implemented as one or more software modules, one or more virtual machines, or one or more hardware elements (e.g., servers). The data historian may collect data at regular intervals (e.g., every minute, every two minutes, every ten minutes, every thirty minutes). The data historian may include or be in communication with an instance of remote data collection hardware and/or software, such as, for example, Honeywell Uniformance Scout Express. The remote data collection may be implemented as one or more software modules, one or more virtual machines, or one or more hardware elements (e.g., servers). In one or more embodiments, the Uniformance Scout Express may work with or in place of the data collection module and/or the data historian to handle one or more aspects of data replication.
In addition, the data collection module 566 may assist the processor 560 in the data collection platform 502 in communicating with, via the communications interface 568, and processing data received from other sources, such as data feeds from third-party servers and manual entry at the field site from a dashboard graphical user interface.
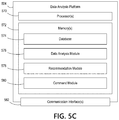
Referring to FIG. 5C, in one example, a data analysis platform 504 may comprise a processor 570, one or more memories 572, and communication interfaces 582. The memory 572 may comprise a database 574 for storing data records of various values collected from one or more sources. Alternatively, the database 574 may be the same database as that depicted in FIG. 5B and the data analysis platform 504 may communicatively couple with the database via the communication interface 582 of the data analysis platform 504. At least one advantage of sharing a database between the two platforms is the reduced memory requirements due to not duplicating the same or similar data.
The data analysis platform 504 may include a data service. In some embodiments, the data service may comprise computer-executable instructions that, when executed by the processor, cause the data analysis platform to perform one or more of the steps disclosed herein. In other embodiments, the data service may be a virtual machine. In some embodiments, the data service may be a hybrid of software-based and/or hardware-based instructions to perform one or more of the steps disclosed herein.
Also, the data analysis platform 504 may include a data historian. In some embodiments, the data historian may comprise computer-executable instructions that, when executed by the processor, cause the data analysis platform to perform one or more of the steps disclosed herein. In other embodiments, the data historian may be a virtual machine. In some embodiments, the data historian may be a hybrid of software-based and/or hardware-based instructions to perform one or more of the steps disclosed herein. The data historian may collect data at regular intervals (e.g., every minute, every two minutes, every ten minutes, every thirty minutes).
Additionally, the data analysis platform 504 may include a data lake. In some embodiments, the data lake may comprise computer-executable instructions that, when executed by the processor, cause the data analysis platform to perform one or more of the steps disclosed herein. In other embodiments, the data lake may be a virtual machine. In some embodiments, the data lake may be a hybrid of software-based and/or hardware-based instructions to perform one or more of the steps disclosed herein. The data lake may perform relational data storage. The data lake may provide data in a format that may be useful for processing data and/or performing data analytics.
Moreover, the data analysis platform 504 may include a calculations service. In some embodiments, the calculations service may comprise computer-executable instructions that, when executed by the processor, cause the data analysis platform to perform one or more of the steps disclosed herein. In other embodiments, the calculations service may be a virtual machine. In some embodiments, the calculations service may be a hybrid of software-based and/or hardware-based instructions to perform one or more of the steps disclosed herein. The calculations service may collect data, perform calculations, and/or provide key performance indicators. The calculations service may implement, for example, process dynamic modeling software or tools (e.g., UniSim).
Furthermore, the data analysis platform 504 may include a utility service. In some embodiments, the utility service may comprise computer-executable instructions that, when executed by the processor, cause the data analysis platform to perform one or more of the steps disclosed herein. In other embodiments, the utility service may be a virtual machine. In some embodiments, the utility service may be a hybrid of software-based and/or hardware-based instructions to perform one or more of the steps disclosed herein. The utility service may take information from the calculations service and put the information into the data lake. The utility service may provide data aggregation service, such as taking all data for a particular range, normalizing the data (e.g., determining an average), and combining the normalized data into a file to send to another system or module.
One or more components of the data analysis platform 504 may assist the processor in the data analysis platform in processing and analyzing the data values stored in the database. In some embodiments, the data analysis platform may perform statistical analysis, predictive analytics, and/or machine learning on the data values in the database to generate predictions and models. For example, the data analysis platform may analyze sensor data to monitor for, predict, and prevent determine temperature excursion in the equipment of a plant. The data analysis platform 504 may compare temperature data from different times and dates to determine if changes are occurring. Such comparisons may be made on a monthly, weekly, daily, hourly, real-time, or some other basis.
The analysis unit may be partially or fully automated. In one embodiment, the system is performed by a computer system, such as a third-party computer system, local to or remote from the plant and/or the plant planning center. The system may receive signals and parameters via the communication network, and display in real time related performance information on an interactive display device accessible to an operator or user. The platform allows two or more users to work with the same information, thereby creating a collaborative environment for sharing best practices or for troubleshooting. The method may provide accurate prediction and optimization results due to fully configured models.
Referring to FIG. 5C, the recommendation module 578 in the data analysis platform may coordinate with the data analysis module 576 to generate recommendations for adjusting one or more parameters for the operation of the plant environment depicted in FIG. 5A. In some embodiments, the recommendation module 578 may communicate the recommendation to the command module 580, which may generate command codes that may be transmitted, via the communications interface, to cause adjustments or halting/starting of one or more operations in the plant environment. The command codes may be transmitted to a control platform for processing and/or execution. In an alternative embodiment, the command codes may be directly communicated, either wirelessly or in a wired fashion, to physical components at the plant such that the physical components comprise an interface to receive the commands and execute on them.
Although the elements of FIG. 5C are illustrated as logical block diagrams, the disclosure is not so limited. In particular, one or more of the logical boxes in FIG. 5C may be combined into a single logical box or the functionality performed by a single logical box may be divided across multiple existing or new logical boxes. Moreover, some logical boxes that are visually presented as being inside of another logical box may be moved such that they are partially or completely residing outside of that logical box. For example, while the database is visually depicted in FIG. 5C as being stored inside one or more memories in the data analysis platform, FIG. 5C contemplates that the database may be stored in a standalone data store communicatively coupled to the data analysis module 576 and processor of the data analysis platform via the communications interface of the data analysis platform. Furthermore, the databases from multiple plant locations may be shared and holistically analyzed to identify one or more trends and/or patterns in the operation and behavior of the plant and/or plant equipment. In such a crowdsourcing-type example, a distributed database arrangement may be provided where a logical database may simply serve as an interface through which multiple, separate databases may be accessed. As such, a computer with predictive analytic capabilities may access the logical database to analyze, recommend, and/or predict the behavior of one or more aspects of plants and/or equipment. In another example, the data values from a database from each plant may be combined and/or collated into a single database where predictive analytic engines may perform calculations and prediction models.
Referring to FIG. 5D, in one example, a control platform 506 may comprise a processor 584, one or more memories 586, and communication interfaces 592. The memory 586 may comprise a database 588 for storing data records of various values transmitted from a user interface, computing device, or other platform. The values may comprise parameter values for the process or the particular equipment at the plant. For example, some illustrative equipment at the plant that may be configured and/or controlled by the control platform 506 may include, but is not limited to, one or more valves, one or more pumps, and/or one or more automatic control loop. In addition, a control module 590 may be stored in the memory 586 and assist the processor 584 in the control platform 506 in receiving, storing, and transmitting the data values stored in the database 588. In some embodiments, the control module 590 may comprise computer-executable instructions that, when executed by the processor 584, cause the control platform 506 to perform one or more of the steps disclosed herein. In other embodiments, the control module 590 may be a hybrid of software-based and/or hardware-based instructions to perform one or more of the steps disclosed herein.
In a plant environment such as illustrated in FIG. 5A, if sensor data is outside of a safe range, this may be cause for immediate danger. As such, there may be a real-time component to the system such that the system processes and responds in a timely manner. Numerous embodiments contemplate a real-time or near real-time responsiveness in analyzing and generating alerts, such as those generated or received by the alert module in FIG. 5E.
Referring to FIG. 5E, in one example, a remote device 518 may comprise a processor 593, one or more memories 594, and communication interfaces 599. The memory 594 may comprise a database 595 for storing data records of various values entered by a user or received through the communications interface 599. In addition, an alert module 596, command module 597, and/or dashboard module 598 may be stored in the memory 594 and assist the processor 593 in the remote device 518 in processing and analyzing the data values stored in the database 595. In some embodiments, the aforementioned modules may comprise computer-executable instructions that, when executed by the processor, cause the remote device to perform one or more of the steps disclosed herein. In other embodiments, the aforementioned modules may be a hybrid of software-based and/or hardware-based instructions to perform one or more of the steps disclosed herein. In some embodiments, the aforementioned modules may generate or receive alerts 596 based on values received through the communications interface. The values may indicate a dangerous condition or even merely a warning condition due to odd sensor readings. The command module 597 in the remote device 518 may generate a command that, when transmitted through the communications interface to the platforms at the plant, causes adjusting of one or more parameter operations of the plant environment depicted in FIG. 5A. In some embodiments, the dashboard module 598 may display a graphical user interface to a user of the remote device to enable the user to enter desired parameters and/or commands. These parameters/commands may be transmitted to the command module to generate the appropriate resulting command codes that may be then transmitted, via the communications interface, to cause adjustments or halting/starting of one or more operations in the plant environment. The command codes may be transmitted to a control platform for processing and/or execution. In an alternative embodiment, the command codes may be directly communicated, either wirelessly or in a wired fashion, to physical components at the plant such that the physical components comprise an interface to receive the commands and execute them.
Although FIG. 5E is not so limited, in some embodiments the remote device 518 may comprise a desktop computer, a smartphone, a wireless device, a tablet computer, a laptop computer, and/or the like. The remote device 518 may be physically located locally or remotely, and may be connected by one of communications links to the public network that is linked via a communications link to the private network. The network used to connect the remote device 518 may be any suitable computer network including the Internet, an intranet, a wide-area network (WAN), a local-area network (LAN), a wireless network, a digital subscriber line (DSL) network, a frame relay network, an asynchronous transfer mode (ATM) network, a virtual private network (VPN), or any combination of any of the same. Communications links may be any communications links suitable for communicating between workstations and server, such as network links, dial-up links, wireless links, hard-wired links, as well as network types developed in the future, and the like. Various well-known protocols such as transmission control protocol/Internet protocol (TCP/IP), Ethernet, file transfer protocol (FTP), hypertext transfer protocol (HTTP) and the like may be used, and the system can be operated in a client-server configuration to permit a user to retrieve web pages from a web-based server. Any of various conventional web browsers can be used to display and manipulate data on web pages.
Although the elements of FIG. 5E are illustrated as logical block diagrams, the disclosure is not so limited. In particular, one or more of the logical boxes in FIG. 5E may be combined into a single logical box or the functionality performed by a single logical box may be divided across multiple existing or new logical boxes. Moreover, some logical boxes that are visually presented as being inside of another logical box may be moved such that they are partially or completely residing outside of that logical box. For example, while the database is visually depicted in FIG. 5E as being stored inside one or more memories in the remote device, FIG. 5E contemplates that the database may be stored in a standalone data store communicatively coupled, via the communications interface, to the modules stored at the remote device and processor of the remote device.
FIGS. 6A-6B depict illustrative system flow diagrams in accordance with one or more embodiments described herein. As shown in FIG. 6A, in step 601, data collection platform may collect sensor data (e.g., related to a heater). In step 602, data collection platform may transmit sensor data to data analysis platform. In step 603, data analysis platform may analyze data. For example, data analysis platform may determine whether a temperature excursion is occurring or likely to occur. In step 604, data analysis platform may update one or more dashboards—such as, for example, a dashboard (e.g., dashboard 512) in communication with data analysis platform (e.g., data analysis platform 504) or a dashboard (e.g., dashboard 510) in communication with a client portal (e.g., client portal 508).
As shown in FIG. 6B, in step 605, data analysis platform may send an alert, such as to remote device 1 and/or remote device 2. In step 606, the control platform may receive a command, such as from remote device 1, remote device 2, and/or data analysis platform. In some embodiments, the data analysis platform may receive the command from remote device 1 and/or remote device 2. In some embodiments, the data analysis platform may use the analyzed data to determine the command to send to the control platform. In some embodiments, data analysis platform may perform additional analysis based on additional data and/or the received command from remote device 1 and/or remote device 2 before sending a command to control platform. In step 607, the control platform may cause an adjustment to an operating parameter. The adjustment to the operating parameter may be based on the command received from data analysis platform, remote device 1, and/or remote device 2. The adjustment to the operating parameter may be related to one or more pieces of equipment (e.g., one or more reactor units, heaters, or the like, experiencing a temperature excursion or exhibiting warning signs of a potential temperature excursion) associated with sensors that collected the sensor data in step 601. For example, a flow rate may be increased or decreased, a pressure may be increased or decreased, a feed rate may be increased or decreased, a valve may be opened or closed, a process may be started, stopped, extended, or shortened, or the like.
Dashboard of Stability Gauge
FIG. 7 depicts an illustrative graphical user interface 700 of an application that may be used for providing information received from one or more sensors or determined based on analyzing information received from one or more sensors, according to one or more embodiments described herein. The graphical user interface may be displayed on the Human Machine Interface of the Distributed Control System or Programmable Logic Controller or as part of a smartphone application (e.g., running on a remote device, such as remote device 1 or remote device 2), a desktop application, a web application (e.g., that runs in a web browser), a web site, an application running on a plant computer, or the like.
The graphical user interface 700 may include one or more visual representations of data (e.g., chart, graph, etc.) that shows information about a plant, a particular piece of equipment (e.g., one or more reactor units) in a plant, or a process performed by a plant or a particular piece or combination of equipment in the plant. For example, a graph may show information about an operating condition, an efficiency, a production level, or the like. The graphical user interface may include a description of the equipment, the combination of equipment, or the plant to which the visual display of information pertains.
The graphical user interface 700 may display the information for a particular time or period of time (e.g., the last five minutes, the last ten minutes, the last hour, the last two hours, the last 12 hours, the last 24 hours, etc.). The graphical user interface may be adjustable to show different ranges of time, automatically or based on user input.
The graphical user interface 700 may include one or more buttons that allow one or more actions. For example, the graphical user interface may include a button (e.g., an “Actions” button) that, when pressed, shows one or more available actions. The graphical user interface may include a button (e.g., a “Change View” button) that, when pressed, changes one or more views of one or more elements of the graphical user interface. The graphical user interface may include a button (e.g., a “Settings” button) that, when pressed, shows one or more settings of the application of which the graphical user interface is a part. The graphical user interface may include a button (e.g., a “Refresh Data” button) that, when pressed, refreshes data displayed by the graphical user interface. In some aspects, data displayed by the graphical user interface may be refreshed in real time, according to a preset schedule (e.g., every five seconds, every ten seconds, every minute, etc.), and/or in response to a received refresh request. The graphical user interface may include a button (e.g., a “Send Data” button) that, when pressed, allows sending data to one or more other devices. For example, the data may be sent via email, SMS, text message, iMessage, FTP, cloud sharing, AirDrop, or via some other method. The interface may receive a selection of one or more pieces of data, graphics, charts, graphs, elements of the display, or the like, to share or send. The graphical user interface may include a button (e.g., an “Analyze Data” button) that, when pressed, causes one or more data analysis functions to be performed. In some aspects, the interface may receive additional input about the desired data analysis, such as desired input, desired output, desired granularity, desired time to complete the data analysis, desired time of input data, or the like.
Detecting and Preventing Temperature Excursion
Aspects of the disclosure are directed to a system that predicts, detects, and/or adjusts process conditions before a temperature excursion can occur forcing a shutdown of the process unit. Referring to FIG. 10, the system may consist of a multi-stage approach, such as a three-stage approach, to mitigate a potential temperature excursion. The three stages can be used together, or individually. The first stage may include an advisory stability monitor (e.g., Stability Gauge 1002), based on a weighted algorithm, to alert and advise when the unit is moving away from a stable state and is becoming more susceptible to a temperature runaway. The second and/or third stage may be part of a customized Temperature Excursion Mitigation Control System. Excursion Mitigation Level 1 1004 may return operation to safe parameters with minimal or no loss of production. Temperature Excursion Mitigation Level 2 1006, may include a larger response to place the unit into a safe state and prevent depressuring the unit. The goal of the three-stage approach is to avoid activation of the Emergency Shutdown 1008 system, which leads to depressuring of the unit to flare. The three stages can be used together, or individually, to monitor process conditions, advising of the risk of a temperature excursion when conditions are indicative of the beginning stages, and to automate the response to the situation, thus limiting the progression and severity of the excursion.
The advisory stability monitor (e.g., Stability Gauge 1002) functions with process indicators to determine the stability of the process unit. The advisory stability monitor uses a weighted algorithm to determine the stability of the unit (weighted based on how much operations deviate from a stable state and how quickly the rate of change is occurring).
The advisory stability monitor (e.g., Stability Gauge 1002) may provide a stability gauge 404 to allow an instant assessment of the process conditions and the risk of a temperature excursion. The stability gauge may be weighted in value from 0 to 100 with predefined regions, for example, from 0 to 33 may be the green, stable area, 33 to 66 may be the yellow, concern area and 66 to 99 may be the red, danger area. As operating conditions change, the stability gauge may change to indicate whether there are any issues or areas of concern. The advisory stability monitor may provide a continuous assessment of risk, and may indicate whether the risk is decreasing or still increasing when operations parameters are changed. The stability monitor may also provide one or more options to trend and graph certain variables used in the algorithm, as shown in FIG. 7. These trends can aid in monitoring the unit and help to identify the variables that are causing the instability to aid in determining whether the variables are increasing or decreasing in instability over a period of time.
The advisory stability monitor may use an algorithm based on operating conditions (variables) in the plant including, for example, Feed flowrate (F); Makeup Gas Consumption (M); Quench flowrate (Q1, Q2, Q3, etc.); Quench Capacity (C); Pressure (P); Reactive Feed Ratio (A); Recycle Gas Purity (H); Recycle Gas flowrate (R); Gas to oil ratio (G); Axial Temperature (X1, X2, X3, X4 etc.); Radial Temperature (D1, D2, D3, D4, etc.); WABT (W1, W2 etc.); Reactor Bed Temperatures (T); Reactor Bed Inlet Temperatures (I); Light Ends Make (L); Conversion (S).
Exemplary positions of process indicators are shown in FIG. 1 and numbered 1-17 enclosed in boxes:
    • 1. Feed to the Unit (flowrate)
    • 2. Makeup Gas consumption (flowrate)
    • 3. Quench flowrate
    • 4. Quench flowrate
    • 5. Quench flowrate
    • 6. Quench flowrate
    • 7. Quench flowrate
    • 8. Quench flowrate
    • 9. Quench flowrate
    • 10. Separator Pressure
    • 11. Feed type (ratio of cracked feed to VGO) (determined by flowrate)
    • 12. Recycle Gas Purity—hydrogen analyzer
    • 13. Recycle Gas Flowrate
    • 14. Second stage Feed (flowrate)
    • 15. Second stage Recycle Gas Flowrate
    • 16. Reactor temperatures—not shown—reactors may have many temperature indicators—referred to as bed temperatures
    • 17. Hydrogen to hydrocarbon ratio is a calculation of hydrogen purity*Recycle gas rate divided by the feed rate. E.G., Items [12*(13+3+4+5+6+7)]/1
In order to properly monitor the reactions as the reactants pass through the catalyst bed, it is not sufficient to just measure the temperature of the flowing stream at the inlet and outlet of the reactor. It is necessary to observe the temperature at the inlet, outlet, and radially throughout the catalyst bed. A bed thermocouple measures the temperature at one point in a large cross-sectional area. The reactors may be equipped with many bed thermocouples at regular intervals in the reactors in order to monitor the reactions. The exact location and distance between bed thermocouples will depend upon the depth and diameter of the catalyst bed. FIG. 3 depicts an illustrative cross section of an example vertical reactor. Thermocouples 310 may be placed in different positions on the horizontal plane, as indicated. As depicted in FIG. 2, thermocouples may be placed at various heights along the catalyst beds. A temperature profile plot may be used to evaluate performance of catalyst, effectiveness of quench, and reactor flow patterns. A temperature profile can be constructed by plotting the catalyst temperature versus distance into the catalyst bed (or more accurately versus weight percent of catalyst).
There will be a maximum temperature at which the catalyst and reactors can safely operate. This maximum temperature depends on the type of catalyst system employed. The maximum allowable operating temperature will also be determined by the metallurgical limit of the reactors and should never be exceeded.
FIG. 4 depicts an illustrative example flowchart that, in one or more embodiments, may include one or more depicted steps for operation of an advisory stability monitor (e.g., Stability Gauge 410), in conjunction with the Temperature Excursion Mitigation Control System and the Depressuring Emergency Interlock Shutdown System. Some embodiments may include every step, omit certain steps, repeat certain steps, or include additional steps.
An advisory stability monitor (e.g., Stability Gauge 410) may constantly and/or periodically receive and assess one or more process indicators 420. Normal operating conditions may be indicated 402. Block 410 advises that the reactor temperature has increased from normal and into a cautionary state and action should be taken per established procedures. For example, a stability gauge (e.g., stability gauge 800, stability gauge 1002) may provide a first level of messaging to encourage operator action to resolve an issue. In one or more embodiments, the stability gauge might not work based on temperature threshold values, but rather may trend away from historical average (stable states).
The advisory stability monitor (e.g., Stability Gauge 410) continues to monitor and assess the process indicators. As the reactor temperatures rise, the stability monitor may alert to take appropriate action before the automated sequences disrupt production. If the reactor temperatures continue to rise and reach a preset temperature Level 1 trip point, then the Temperature Excursion Mitigation Control System may advise that Temperature Excursion Level 1 (block 412) has been reached and automatic actions are being taken. Such actions may include one or more of the following: remove/reduce more reactive feedstock; increase less reactive feed; lower charge heater outlet temperature; and lower the controlled temperature in the reactor bed with an elevated temperature and in the following reactor bed. The objective of Level 1 is to attempt to return operations to safe parameters with minimal or no loss of production.
The advisory stability monitor (e.g., Stability Gauge 410) continues to monitor and assess the process indicators. As the reactor temperatures rise, the stability monitor may alert to take appropriate action before the automated sequences disrupt production. If the reactor temperatures reach a preset temperature Level 2 trip point, then the Temperature Excursion Mitigation Control System may advise that Temperature Excursion Level 2 (block 414) has been reached and automatic actions are being taken. This phase places the unit in a safe state, reducing temperatures and pressures, to allow for an easy and expedient restart of the unit. Such actions may include one or more of the following: ramp the charge heater outlet temperature down to a lower temperature (e.g., 300° F., 400° F., 500° F., 600° F., or the like); ramp the combined feed exchanger outlet temperature down to a lower temperature (e.g., 300° F., 400° F., 500° F., 600° F., or the like); ramp all reactor bed temperatures down to a lower temperature (e.g., 300° F., 400° F., 500° F., 600° F., or the like); reduce a pressure of the unit by a particular percentage (e.g., 5%, 6%, 7%, 8%, 9%, 10%, or the like) of operating pressure. The objective of Level 2 may be to attempt to prevent a depressuring event that may result in extended downtime of the unit as well as associated refinery units, a loss in production, potential damage to the reactors, reactor internals, catalyst beds and the reactor effluent air coolers and environmental flaring of hydrocarbons and sulfur compounds. Another objective of Level 2 may be to place the unit in a safe state that will also allow for an easy and expedient restart of the unit.
If the reactor temperatures reach the temperature shutdown trip point, then the Emergency Interlock Shutdown (block 416) System may take automatic actions. Such actions may include high rate depressure of the reactor and/or a complete shutdown of the process unit. The Emergency Interlock Shutdown System may already be part of typical design and will remain as the fail safe action to protect the equipment, environment, and prevent loss of life.
In the various steps, temperature runaways (excursions) can be avoided by
  • 1) Not exceeding average temperature rise (average outlet temperature-average inlet temperature) or maximum temperature rise (maximum bed temperature-minimum bed temperature) across any one catalyst bed as designed for the reactor and type of catalyst;
  • 2) When making changes in feed rate, increasing feed rate first, then increasing catalyst temperature; or decreasing catalyst temperature first, then decreasing feed rate;
  • 3) Making catalyst temperature increases gradually and smoothly (depends on age of the catalyst and severity of the operation); 4) If any upsets in flows are observed (loss of liquid recycle, for example), immediately reducing reactor inlet temperatures.
The examples described herein, including the examples in the preceding paragraph, may be implemented in a graphical user interface, such as illustrated in FIG. 7 and FIG. 8, through underlying automated rules. For example, when a plant may be changing the feed rate, if an attempt is made to reduce the feed rate before decreasing the catalyst temperature, the advisory stability monitor (e.g., Stability Gauge 410, Stability Gauge 1002) may trend toward caution and danger and the system may suggest to decrease the catalyst temperature first before reducing the feed rate in response to entry of the command to reduce the feed rate. Such an embodiment may be implemented through software and/or hardware that serves as an interface to the controls that adjust the various variables and parameters of a reactor unit and/or plant. Other examples include enforcement of a desired sequence of events before a particular requested action may be executed. In another example, the rate at which an inputted change may occur may be regulated and monitored in a closed feedback loop by the computerized system. In some examples, the inputted command may be entered by a human operator, but in other instances the command may be automatically generated or input from a local or remote system.
In some aspects, if the advisory stability monitor (e.g., Stability Gauge 410, Stability Gauge 1002) determines one or more conditions that may indicate a problem, an alarm (e.g., a visual and/or audible alarm) may be triggered. The alarm could be an alarm at a plant, an alarm that is sent to one or more devices, an alarm that shows on a web page or dashboard, or the like.
In some aspects, if a problem is detected, the control platform may take one or more actions, which may be triggered, requested, or recommended by data analysis platform. Alternatively or additionally, the data analysis platform may trigger an alert to one or more remote devices (e.g., remote device 1, remote device 2). The alert may include information about the problem. The alert may provide information about one or more determined correlations between the problem and a particular operating condition or combination of operating conditions. The alert may include one or more recommendations for and/or commands causing adjustments to operating conditions, such as adjustments to flows, pressures, temperatures, valves, nozzles, drains, or the like.
In some aspects, a remote device may send a command for a particular action (e.g., a corrective action) to be taken, which may or may not be based on the alert. In some aspects, the data analysis platform may send a command for a particular action to be taken, whether or not an alert was sent to or a command was sent by the remote device. The command may cause one or more actions to be taken, which may prevent equipment (e.g., reactor) damage, avoid failure, or the like.
Stability Monitor Algorithm
An algorithm for weighting the changes in the process variables to determine the stability of the unit is described below. This is a simplified version to exemplify how and why variables may be used to measure the stability of the unit in order to provide a gauge. The plant process variables used in the algorithm may include, but are not limited to, for example, Feed flowrate (F); Makeup Gas Consumption (M); Quench flowrate (Q1, Q2, Q3, etc.); Quench Capacity (C); Pressure (P); Reactive Feed Ratio (A); Recycle Gas Purity (H); Recycle Gas flowrate (R); Gas to oil ratio (G); Axial Temperature (X1, X2, X3, X4 etc.); Radial Temperature (D1, D2, D3, D4, etc.); WABT (W1, W2 etc.); Reactor Bed Temperatures (T); Reactor Bed Inlet Temperatures (I); Light Ends Make (L); Conversion (S).
Stability={[(ΔF−B feed)*K feed]−[(ΔI crackingx −B crackingIx)*K crackingIx]}+[(ΔM−B makeup)*K makeup]+[(ΔQ−B quench)*K quench)*K quench]+[C*K qcapacity]+[(ΔP−B pressure)*K pressure]+[(ΔA−B reactratio)*K reactratio]+U*K u+[(ΔH increase −B hpurityincrease)*K hpurityincrease]+[(ΔH decrease −B hpuritydecrease)*K hpuritydecrease]+[(ΔR−B recycle)*K recycle]+J*K J+[(ΔG−B GOratio)*K GOratio]+[(ΔT−B tempx)*K temp]+Z*K z +YK Y+[(ΔW x −B WABTx)*K WABTx]}+[(ΔL−B Lightends)*K Lightends]+[(ΔS−B conversion)*K Conversion]
Gain (K) Constants and % Biases (B)
All the variables will have Gain (K) constants and % Biases (B) so the system may be tuned and/or weighting adjusted. Initial numbers generally will be based on design recommendations (e.g., Feed change of more than 2%, 3%, 4,%, 5%, 6%, 10%, 15%, etc.; Quench increase by more than 5%, 7%, 10%, 12%, 15%, 20%, 25%, etc.; Cracked feedstock ratio increase by X %), which can be adjusted to avoid nuisance alarms and customize to each unique unit.
Factors in the Equation, i.e. [(ΔX−BX)*KX]
In certain aspects, if the factors in the equation, i.e. [(ΔX−BX)*KX], are negative, then those factors will go to zero and the system will not take credit in the stability measurement for variables moving to a safer state, unless defined. Only variables moving towards instability will be included in the stability measurement.
Examples of Various Stability Algorithms
A method for weighting the changes in the process variables and defining the stability of the unit is described below in a simplified version of the algorithm that exemplifies how and why variables will be used to measure the stability of the unit in order to provide a gauge.
(F) Feed Flowrate Decreased
Decreases to the feed rate may be preceded by a change in reactor temperatures such that temperatures are lowered before feed rate is changed. An equation for the change in feed rate may be: ΔF={[(F60min−Factual))/F60min]*100} if ΔF is >B % then the unit stability, unless the reactor bed inlet temperatures in the cracking beds, variable I, have also decreased, may increase in trending toward caution or danger. So an algorithm for decreasing the feed rate may be:
    • ΔF is the % change in the feed rate, scaled from 0 to 100
    • ΔIcracking is the reactor bed inlet temperatures, scaled from 0 to 100
      ΔF={[(F 60min −F actual))/F 60min]*100}
      ΔI crackingx={[(I cracking60minx −I crackingactualx)/I cracking60minx]*100}−(include one for each cracking bed)
      Stability={[(ΔF−B feed)*K feed]−[(ΔI crackingx −B crackingIx)*K crackingIx]}+other variables explained below
ΔF may be indicated on a summary display and may be graphed and trended on the variable display that may assist in assessing which variable is leading to instability and whether the change in that variable is increasing or decreasing over the hourly average.
Another factor may be used to measure instability due to increases in feed rate. The algorithm for determining and weighting feed rate increases will be similar to the algorithm above.
(M) Makeup Gas Consumption Increase
Changes in Makeup Gas Rate indicate that more makeup gas is being consumed and reactions may be increasing. The stability factor for Makeup Gas consumption may be calculated based on a change in makeup gas rate over a period of time, ΔM={[(Mactual−M60min)/M60min]*100}, such that if ΔM is >Bmakeup% , then the stability gauge will increase in trending toward caution or danger.
    • ΔM is the % change in the Makeup Gas Rate, scaled from 0 to 100
      ΔM={[(M actual −M 60min)/M 60min]*100}
      Stability={[(ΔF−B feed)*K feed]−[(ΔI crackingx −B crackingIx)*K crackingIx]}+[(ΔM−B makeup)*K makeup]+other variables explained below
ΔM may be indicated on a summary display and may be graphed and trended on the variable display that may assist in assessing which variable is leading to instability and whether the change in that variable is increasing or decreasing over the hourly average.
Another factor may be used to measure instability due to a decrease in Makeup Gas Rate. The algorithm for determining and weighting Makeup Gas Rate decreases will be similar to the algorithm above.
(Q) Quench Rates Increase
Increases in the Quench Gas Rate indicate that there is a higher temperature rise in the bed above and reactions in that bed may be increasing. The stability factor for Quench Gas Rates may be calculated based on a change in Quench Gas Rate for each reactor bed over a period of time, ΔQ={[(Qactual−Q60min)/Q60min]*100}, such that if ΔQ is >Bquench%, then the stability gauge will increase in trending toward caution or danger. As any of the several catalyst beds may become independently unstable, the stability gauge may weight the instability by using only the quench with the largest increase.
    • ΔQ is the % change in Quench Gas Flow Rate, scaled from 0 to 100
    • Each reactor bed will have its own ΔQn (ΔQ1, ΔQ2, . . . ΔQn)
      ΔQ1={[(Q1actual −Q160min)/Q160min]*100},
      ΔQ=Maximum(ΔQ1,ΔQ2, . . . ΔQn)
      Stability={[(ΔF−B feed)*K feed]−[(ΔI crackingx −B crackingIx)*K crackingIx]}+[(ΔM−B makeup)*K makeup]+[(ΔQ−B quench)*K quench]+other variables explained below
Quench Rate increases (ΔQ) may be indicated on a summary display and may be graphed and trended on the variable display that may assist in assessing which variable is leading to instability and whether the change in that variable is increasing or decreasing over the hourly average. A further display may graph and trend all the various ΔQ1, ΔQ2, . . . ΔQn such that the specific catalyst beds with higher instability can be identified.
(C) Quench Capacity
It is important to monitor the quench control valve opening to determine the reserve quench available, in case of an upset. In some embodiments, the valve may be open all the way. Alternatively, in some embodiments, the valve may be open less than all the way (e.g., 95%, 90%, 85%, 80%, 75%, 70%, 65%, 60%, 55%, 50%, 45%, 40%, 35%, 30%, 25%, 20%, 15%, 10%, 5%, 1%). In one or more embodiments, a quench valve position may be determined from a quench valve position sensor, which may read and send a position of a particular quench valve of a reactor. In one or more embodiments, a quench valve might not have a quench valve position sensor. Even if a quench valve does not have a quench valve position sensor, the quench valve might be set by sending a command indicating a position that the quench valve should be set to. A quench valve position may be determined from the command sent to the quench valve. Quench capacity may be defined as the available valve opening remaining, such that if the valve opening is at a first percentage, the available remaining capacity is a second percentage (e.g., 100%—first percentage). Thus, for example, if the valve opening is at 75%, then the available remaining capacity is 25%. Similarly, if the valve opening is at 65%, then the available remaining capacity is 35%. If the valve opening is at 45%, then the available remaining capacity is 55%. Decreasing Quench Capacity indicates that there is a higher temperature rise in the bed above and reactions in that bed may be increasing. The stability factor for Quench capacity may be calculated based on a percent of quench control valve opening. Different benchmarks (e.g., normal operation, caution, danger) may be set. For example, if the quench control valve opening moves above 50%, the stability gauge may indicate caution, and if the quench control valve opening moves above 65%, the stability gauge may indicate danger. In another embodiment, if the quench control valve opening moves above 60%, the stability gauge may indicate caution, and if the quench control valve opening moves above 75%, the stability gauge may indicate danger. In another embodiment, if the quench control valve opening moves above 30%, the stability gauge may indicate caution, and if the quench control valve opening moves above 50%, the stability gauge may indicate danger. The stability gauge may weight the instability by using only the valve with the least capacity.
    • Vopening is the quench valve percent open
    • Vqvalve is the expected nominal valve position and will be customized based on the installed quench valve trim
    • Each reactor bed will have its own Cn and Vn factors
    • Cn is scaled from 0 to 100
      V1percent=(V1opening −V1qvalve)V1qvalve
      C1=V1percent*66.66/(1−V1qvalve)+33.33
    • If V1percent is negative, then C1=0
      C=Maximum(C1,C2, . . . Cn)
      Stability={[(ΔF−B feed)*K feed]−[(ΔI crackingx −B crackingIx)*K crackingIx]}+[(ΔM−B makeup)*K makeup]+[(ΔQ−B quench)*K quench]+[C*K qcapacity]+other variables explained below
Quench Capacity (C) may be indicated on a summary display and may be graphed and trended on the variable display that may assist in assessing which variable is leading to instability and whether the change in that variable is increasing or decreasing over the hourly average. A further display may graph and trend all the various C1, C2, . . . Cn such that the specific valves with least capacity can be identified.
(P) Pressure Decreases
Decreases in pressure indicate that more makeup gas is being consumed than can be replenished to maintain pressure in the unit. This is an indication that reactions may be increasing. The stability factor for Pressure decreasing may be calculated based on a change in pressure over a period of time. So the equation for the change in pressure may be as follows: ΔP={[(P60min−Pactual))/P60min]*100} if ΔP is >Bpressure % then the unit stability may increase in trending toward caution or danger:
    • ΔP is the % change in operating pressure scaled from 0 to 100
      ΔP={[(P 60min −P actual))/P 60min]*100}
      Stability={[(ΔF−B feed)*K feed]−[(ΔI crackingx −B crackingIx)*K crackingIx]}+[(ΔM−B makeup)*K makeup]+[(ΔQ−B quench)*K quench]+[C*K qcapacity]+[(ΔP−B pressure)*K pressure]+other variables explained below
Pressure decreases (ΔP) may be indicated on a summary display and may be graphed and trended on the variable display that may assist in assessing which variable is leading to instability and whether the change in that variable is increasing or decreasing over the hourly average.
Other factors may be calculated to measure instability due to an increase in pressure, as an increment in the hydrogen partial pressure in the unit will change reaction rates. The algorithm for determining and weighting pressure increases will be similar to the algorithm above.
(A) Ratio of Reactive Feed Increases
Increases to the Reactive Feed Ratio indicate that reactions in the beds may be increasing. The stability factor for the Reactive Feed Ratio may be calculated based on a change in the ratio over a period of time, ΔA={[(Aactual−A60min)/A60min]*100}, such that if ΔA is >Breactratio%, then the stability gauge will increase in trending toward caution and danger. Also, included in the algorithm is a parameter, U, which considers the unit design Reactive Feed Ratio. As the operating Reactive Feed Ratio nears the design ratio, the stability gauge will increase in trending toward danger.
    • ΔA is the % change in Reactive Feed Ratio, scaled from 0 to 100
      ΔA={[(A actual −A 60min)/A 60min]*100},
    • Adesign=the design reactive feed ratio−Bdesignreactratio
    • If Adesign is negative then it goes to 0
      U={[(A actual −A design)/A design]*100}+65
    • If (Aactual−Adesign) is negative, then U=0
      Stability={[(ΔF−B feed)*K feed]−[(ΔI crackingx −B crackingIx)*K crackingIx]}+[(ΔM−B makeup)*K makeup]+[(ΔQ−B quench)*K quench]+[C*K qcapacity]+[(ΔP−B pressure)*K pressure]+[(ΔA−B reactratio)*K reactratio]+U*K u+other variables explained below
Reactive Feed Ratio (ΔA) and Design Reactive Feed Ratio (U) may be indicated on a summary display and may be graphed and trended on the variable display that may assist in assessing which variable is leading to instability and whether the change in that variable is increasing or decreasing over the hourly average.
(H) Recycle Gas Purity
Increases or decreases in Recycle Gas Purity indicates that the unit may be moving into areas of instability. Decreases in Recycle Gas Purity indicates that reactions in the beds may be increasing and more light ends are being produced. Increasing Recycle Gas Purity increases the partial pressure of the unit and may result in changes to the conversion or increased hydrotreating reactions. The stability factor for Recycle Gas Purity may be calculated based on a change in purity over a period of time, ΔH={[(H60min−Hactual)/H60min]*100}, such that if ΔH is >Bhpurity%, then stability gauge will increase in trending toward caution and danger.
    • ΔHincrease is the % change in Recycle Gas Purity, scaled from 0 to 100
      ΔH increase={[(H actual −H 60min)/H 60min]*100},
    • ΔHdecrease is the % change in Recycle Gas Purity, scaled from 0 to 100
      ΔH decrease={[(H 60min −H actual)/H 60min]*100},
      Stability={[(ΔF−B feed)*K feed]−[(ΔI crackingx −B crackingIx)*K crackingIx]}+[(ΔM−B makeup)*K makeup]+[(ΔQ−B quench)*K quench]+[C*K qcapacity]+[(ΔP−B pressure)*K pressure]+[(ΔA−B reactratio)*K reactratio]+U*K u+[(ΔH increase −B hpurityincrease)*K hpurityincrease]+[(ΔH decrease −B hpuritydecrease)*K hpuritydecrease]+other variables explained below
Recycle Gas Purity ΔHincrease and ΔHdecrease may be indicated on a summary display and may be graphed and trended on the variable display that may assist in assessing which variable is leading to instability and whether the change in that variable is increasing or decreasing over the hourly average.
(R) Recycle Gas Rate
A decrease in Recycle Gas rate can cause instability. The stability factor for the Recycle Gas rate may be calculated based on a change in flow over a period of time, ΔR={[(R60min−Ractual)/R60min]*100}, such that if ΔR is >Brecycle%, then the stability gauge will increase in trending toward caution. Also, included in the algorithm is a parameter, J, which considers the unit design Recycle Gas rate. As the operating Recycle Gas rate nears the design rate, the stability gauge will increase in trending toward danger.
    • ΔR is the % change in Recycle Gas rate, scaled from 0 to 100
      ΔR={[(R 60min −R actual)/R 60min]*100},
    • Rdesign=the design Recycle Gas rate (unique to each unit)
      J=[((((0.75*R design)−R actual)/R design)*100)+65]
    • If ((0.75*Rdesign)−Ractual) is negative, then J=0
      Stability={[(ΔF−B feed)*K feed]−[(ΔI crackingx −B crackingIx)*K crackingIx]}+[(ΔM−B makeup)*K makeup]+[(ΔQ−B quench)*K quench]+[C*K qcapacity]+[(ΔP−B pressure)*K pressure]+[(ΔA−B reactratio)*K reactratio]+U*K u+[(ΔH increase −B hpurityincrease)*K hpurityincrease]+[(ΔH decrease −B hpuritydecrease)*K hpuritydecrease]+[(ΔR−B recycle)*K recycle]+J*K J+other variables explained below
Recycle Gas rate (ΔR) and Design Recycle Gas rate (J) may be indicated on a summary display and may be graphed and trended on the variable display that may assist in assessing which variable is leading to instability and whether the change in that variable is increasing or decreasing over the hourly average.
(G) Gas to Oil Ratio
A decrease in Gas to Oil Ratio can indicate instability. The stability factor for Gas to Oil Ratio may be calculated based on a change in the ratio over a period of time, ΔG={[(G60min−Gactual)/G60min]*100}, such that if ΔG is >BGOratio%, then stability gauge will increase in trending toward caution and danger.
    • ΔG is the % change in Gas to Oil Ratio, scaled from 0 to 100
      ΔG={[(G 60min −G actual)/G 60min]*100},
    • Gdesign=the design Gas to Oil Ratio (unique to each unit)−Bdesigngasoilratio
      E={[(G design −G actual)/G design]*100}+65
    • If (Gactual−Gdesign) is negative, then E=0
      Stability={[*ΔF−B feed)*K feed]−[(ΔI crackingx −B crackingIx)*K crackingIx]}+[(ΔM−B makeup)*K makeup]+[(ΔQ−B quench)*K quench]+[C*K qcapacity]+[(ΔP−B pressure)*K pressure]+[(ΔA−B reactratio)*K reactratio]+U*K u+[(ΔH increase −B hpurityincrease)*K hpurityincrease]+[(ΔH decrease −B hpuritydecrease)*K hpuritydecrease]+[(ΔR−B recycle)*K recycle]+J*K J+[(ΔG−B GOratio)*K GOratio]+E*K E+other variables explained below
Gas to Oil Ratio (ΔG) may be indicated on a summary display and may be graphed and trended on the variable display that may assist in assessing which variable is leading to instability and whether the change in that variable is increasing or decreasing over the hourly average.
(T) Reactor Bed Temperatures
Increases to the Reactor Bed Temperatures indicate that reactions in the beds may be increasing. The stability factor for Reactor Bed Temperatures may be calculated based on a change in temperature over a period of time, ΔT={(Tactual−T60min)}, such that if ΔT is >Btemps, then the stability gauge will increase in trending toward caution and danger. Btempsx, may be a unique, adjustable bias for each reactor bed, so hydrotreating and cracking beds can be tuned and customized as required. The stability gauge may weight the instability by using only the temperature with the largest increase.
    • ΔT is the change in temperature, scaled from 0 to 100
    • Each reactor bed thermocouple will have its own ΔTn
      ΔT1=(T1actual −T160min),
      ΔT=Maximum(ΔT1,ΔT2, . . . ΔTn)
      Stability={[(ΔF−B feed)*K feed]−[(ΔI crackingx −B crackingIx)*K crackingIx]}+[(ΔM−B makeup)*K makeup]+[(ΔQ−B quench)*K quench]+[C*K qcapacit]+[(ΔP−B pressure)*K pressure]+[(ΔA−B reactratio)*K reactratio]+U*K u+[(ΔH increase −B hpurityincrease)*K hpurityincrease]+[(ΔH decrease −B hpuritydecrease)*K hpuritydecrease]+[(ΔR−B recycle)*K recycle]+J*K J+[(ΔG−B GOratio)*K GOratio]+E*K E+[(ΔT−B tempx)*K temp]+other variables explained below
Reactor Bed Temperatures may be indicated on a summary display and may be graphed and trended on the variable display that may assist in assessing which variable is leading to instability and whether the change in that variable is increasing or decreasing over the hourly average.
(X) Axial Bed Temperatures Increasing
Increases to the Axial Reactor Bed Temperatures indicate that reactions in the beds may be increasing. The stability factor for Axial Reactor Bed Temperatures may be calculated based on the recommended average and Maximum Bed Temperature Rise, ΔX=(Xoutlet−Xinlet), such that if ΔX is >Baverage_xtemps, then stability gauge will start to increase in trending toward yellow, caution, and if ΔX is >Bmaximum_xtemps, then the stability gauge will start to increase in trending toward red, danger. The stability gauge may weight the instability by using only the axial bed with the largest increase.
    • ΔX is the Axial Reactor Bed Temperature, scaled from 0 to 100
    • Each reactor bed will have its own ΔXn and Zn
      ΔXn=(Xn outlet −Xn inlet),
    • Bnaverage_xtemps=based on Process Control Guidelines for catalyst type
    • Bnmaximum_xtemps=based on Process Control Guidelines for catalyst type
      Zn average={[(ΔXn−Bn average_xtemps)*K average_xtemps]+33}
    • If (ΔXn−Bnaverage_xtemps), is negative, the term Znaverage goes to 0
      Zn maximum={[(ΔXn−Bn maximum_xtemps)*K maximum_xtemps]+66}
    • If (ΔXn−Bnmaximum_xtemps) is negative, the term Znmaximum goes to 0
      Z=Maximum(Z1average +Z1maximum ,Z2average +Z2maximum ,Zn average +Zn maximum)
      Stability={[(ΔF−B feed)*K feed]−[(ΔI crackingx −B crackingIx)*K crackingIx]}+[(ΔM−B makeup)*K makeup]+[(ΔQ−B quench)*K quench]+[C*K qcapacity]+[(ΔP−B pressure)*K pressure]+[(ΔA−B reactratio)*K reactratio]+U*K u+[(ΔH increase −B hpurityincrease)*K hpurityincrease]+[(ΔH decrease −B hpuritydecrease)*K hpuritydecrease]+[(ΔR−B recycle)*K recycle]+J*K J+[(ΔG−B GOratio)*K GOratio]+E*K E+[(ΔT−B tempx)*K temp]+Z*K z+other variables explained below
The axial bed temperature and/or the average of the axial bed temperatures in a bed may be indicated on a summary display and may be graphed and trended on the variable display that may assist in assessing which variable is leading to instability and whether the change in that variable is increasing or decreasing over the hourly average. A further display may graph and trend all the various Z1, Z2, . . . Zn such that the axial bed rises with the largest increase can be identified.
(D) Radial Bed Temperatures Increasing
Increases to the Radial Reactor Bed Temperatures, D, indicate that reactions in the beds may be increasing. The stability factor for Radial Reactor Bed Temperatures may be calculated based on the recommended Radial Temperatures Spread, ΔD=(Dhighest−Dlowest), such that if ΔD is >Bradialspread, then stability gauge will start to increase in trending toward caution and then toward danger. The stability gauge may weight the instability by using only the radial bed with the largest increase.
    • ΔD is the Radial Reactor Bed Temperature, scaled from 0 to 100
    • Each reactor bed will have its own ΔDn
      ΔDn=(Dn highest −Dn lowest)
    • (ΔDn−Bnradialspread) cannot be negative
    • Bnradialspread=based on Process Control Guidelines for catalyst type
      Y=Maximum[ΔD1−B1radialspread),(ΔD2−B2radialspread), . . . (ΔDn−Bn radialspread)]*K radialspread
      Stability={[(ΔF−B feed)*K feed]−[(ΔI crackingx −B crackingIx)*K crackingIx]}+[(ΔM−B makeup)*K makeup]+[(ΔQ−B quench)*K quench]+[C*K qcapacity]+[(ΔP−B pressure)*K pressure]+[(ΔA−B reactratio)*K reactratio]+U*K u+[(ΔH increase −B hpurityincrease)*K hpurityincrease]+[(ΔH decrease −B hpuritydecrease)*K hpuritydecrease]+[(ΔR−B recycle)*K recycle]+J*K J+[(ΔG−B GOratio)*K GOratio]+E*K E+[(ΔT−B tempx)*K temp]+Z*K z +Y*K Y+other variables explained below
D and/or Y may be indicated on a summary display and may be graphed and trended on the variable display that may assist in assessing which variable is leading to instability and whether the change in that variable is increasing or decreasing over the hourly average. A further display may graph and trend all the various ΔD1, ΔD2, . . . ΔDn such that the axial bed rises with the largest increase can be identified.
(W) Weighted Average Bed Temperature (WABT)
The WABT is measurement of the weighted average bed temperatures and will be used to indicate instability in individual reactor beds. The equation for the change in WABT may be as follows: ΔW={[(Wactual−W60min)/W60min]*100} if ΔWWABTx is >B %, then the unit stability may increase in trending toward caution or danger. The algorithm for increasing the WABT may be:
    • ΔW is the % change in WABT, scaled from 0 to 100
    • Each reactor bed will have its own ΔW
      ΔW={[(W actual −W 60min)/W 60min]*100}
      Stability={[(ΔF−B feed)*K feed]−[(ΔI crackingx −B crackingIx)*K crackingIx]}+[(ΔM−B makeup)*K makeup]+[(ΔQ−B quench)*K quench]+[C*K qcapacity]+[(ΔP−B pressure)*K pressure]+[(ΔA−B reactratio)*K reactratio]+U*K u+[(ΔH increase −B hpurityincrease)*K hpurityincrease]+[(ΔH decrease −B hpuritydecrease)*K hpuritydecrease]+[(ΔR−B recycle)*K recycle]+J*K J+[(ΔG−B GOratio)*K GOratio]+[(ΔT−B tempx)*K temp]+Z*K z +YK Y+[(ΔW x −B WABTx)*K WABTx]}+other variables explained below
ΔW may be indicated on a summary display and may be graphed and trended on the variable display that may assist in assessing which variable is leading to instability and whether the change in that variable is increasing or decreasing over the hourly average.
(L) Light Ends Make Increases
Changes in Light Ends Make (L) is visible in the Separator off gas flow rate, the Stripper Off gas flow rate and the Receiver Liquid level and Receiver Liquid flow rate. Increasing Light Ends Make indicates that reactions may be increasing, conversion is higher and temperatures may be increasing. The stability factor for Light Ends Make may be calculated based on a change in Light Ends Make over a period of time, ΔL={[(Lactual−L60min)/L60min]*100}, such that if ΔL is >BLightends%, then the stability gauge will increase in trending toward caution or danger.
    • ΔL is the % change in Light Ends Make, scaled from 0 to 100
      ΔL={[(L actual −L 60min)/L 60min]*100}
      Stability={[(ΔF−B feed)*K feed]−[(ΔI crackingx −B crackingIx)*K crackingIx]}+[(ΔM−B makeup)*K makeup]+[(ΔQ−B quench)*K quench]+[C*K qcapacity]+[(ΔP−B pressure)*K pressure]+[(ΔA−B reactratio)*K reactratio]+U*K u+[(ΔH increase −B hpurityincrease)*K hpurityincrease]+[(ΔH decrease −B hpuritydecrease)*K hpuritydecrease]+[(ΔR−B recycle)*K recycle]+J*K J+[(ΔG−B GOratio)*K GOratio]+[(ΔT−B tempx)*K temp]+Z*K z +YK Y+[(ΔW x −B WABTx)*K WABTx]}+[(ΔL−B Lightends)*K Lightends]+other variables explained below
Light Ends Make (ΔL) may be indicated on a summary display and may be graphed and trended on the variable display that may assist in assessing which variable is leading to instability and whether the change in that variable is increasing or decreasing over the hourly average.
(S) Conversion Increases
Increasing conversion (S) is visible in a decreasing Product Fractionator Bottoms Level or the Product Fractionator Bottoms flow rate, depending on the flow scheme. Increasing conversion is a lagging indicator that increasing instability. The stability factor for conversion may be calculated based on a change in conversion over a period of time, ΔS={[(S60min−Sactual)/S60min]*100}, such that if ΔS is >Bconversion%, then the stability gauge will increase in trending toward caution or danger.
    • ΔS is the % change in Conversion, scaled from 0 to 100
      ΔS={[(S 60min −S actual)/S 60min]*100},
      Stability={[(ΔF−B feed)*K feed]−[(ΔI crackingx −B crackingIx)*K crackingIx]}+[(ΔM−B makeup)*K makeup]+[(ΔQ−B quench)*K quench]+[C*K qcapacity]+[(ΔP−B pressure)*K pressure]+[(ΔA−B reactratio)*K reactratio]+U*K u+[(ΔH increase −B hpurityincrease)*K hpurityincrease]+[(ΔH decrease −B hpuritydecrease)*K hpuritydecrease]+[(ΔR−B recycle)*K recycle]+J*K J+[(ΔG−B GOratio)*K GOratio]+[(ΔT−B tempx)*K temp]+Z*K z +YK Y+[(ΔW x −B WABTx)*K WABTx]}+[(ΔL−B Lightends)*K Lightends]+[(ΔS−B conversion)*K Conversion]
Conversion Increase (ΔS) may also be graphed and trended on the variable display that may assist in assessing which variable is leading to instability and whether the change in that variable is increasing or decreasing over the hourly average.
Individual Reactor Bed Stability Gauge
Individual bed stability may be calculated, trended and indicated. The variables applicable to each reactor bed stability gauge include:
    • Quench flowrate (to bed below) Q1, Q2, Q3, etc.
    • Quench Capacity (to bed below) C1, C2, C3 etc.
    • Axial temperature rise X1, X2, X3, X4, etc.
    • Radial Temperature D1, D2, D3, D4, etc.
    • Temperatures T1, T2, . . . TnTn
    • Reactor Bed Inlet Temperatures I1, I2, I3, I4, etc.
The individual bed stability gauge may use the same equations as defined above for each parameter but may combine only the factors listed above that are applicable to each bed. The individual bed stability gauge may be based on an algorithm to weight each individual bed temperature, as well as the axial and radial temperature rise, and combine those factors with weighted amounts for the quench flowrate and available quench capacity for the bed. The individual bed stability gauge may be graphed and trended on the variable display. The display may depict one or more individual bed stabilities, and/or whether the stability of each individual bed is increasing or decreasing over the hourly average.
Illustrative Embodiments of a Stability Gauge Interface
FIG. 8 depicts an illustrative graphical user interface of a stability gauge of a dashboard display that may display information received from one or more sensors or determined based on analyzing information received from one or more sensors, according to one or more embodiments described herein. One or more examples of stability algorithms described herein may form the underlying calculations for effecting the display of a stability gauge and/or resulting automated actions on the plant and/or equipment (e.g., reactor unit).
For example, building off the examples provided above, the stability gauge may display an indication of a green zone when, inter alia, the reactor bed temperature is within the desired limits. But if the reactor bed temperature (denoted as T) measurements increase, this may be an indication that the reactions in the beds may be increasing. T may be calculated based on a change in temperature over a period of time, ΔT={(Tactual−T60min)}, such that if ΔT is >Btemps, then the stability gauge will increase in trending toward caution and danger. When this occurs, the visual indication on the stability gauge may transition from a green zone to an amber/yellow zone, or from an amber/yellow zone to a red zone. Notably, Btempsx, may be a unique, adjustable bias for each reactor unit/bed, and as such, may be tuned and customized as desired. Examples of illustrative stability algorithm with appropriate weighting and factors are described herein.
Moreover, the stability gauge may consider other temperature measurements in its final display of an indication zone. For example, measurements of one or more of an axial bed temperature (X) and radial bed temperature (D) may be used in adjusting the stability gauge indicator from one zone to another zone, or in micro-adjusting the stability gauge indicator within the same zone. In the case of axial bed temperature changes in measurement, the Z variable may be indicated on a summary display and may be graphed on the variable display that may assist in assessing which variable is leading to instability and whether the change in that variable is increasing or decreasing over the hourly average. In the case of radial bed temperature changes in measurement, the Y variable may be indicated on a summary display and may be graphed on the variable display that may assist in assessing which variable is leading to instability and whether the change in that variable is increasing or decreasing over the hourly average. In the case of a weighted average bed temperature change, ΔW may be indicated on a summary display and may be graphed on the variable display that may assist in assessing which variable is leading to instability and whether the change in that variable is increasing or decreasing over the hourly average. In each instance, the stability gauge illustrated in FIG. 8 may adjust its indicator along the spectrum of zones.
The stability gauge may monitor process conditions indicative of the beginning stages of a temperature excursion and automate a response to the situation, thus limiting the progression and severity of the excursion. In particular, in some examples, when the indicator of the stability gauge is outside of the green zone, the Temperature Excursion Mitigation System may take automated actions to alleviate possible excursions. Some examples of automatic actions/response that may be taken, include, but are not limited to one or more of the following: remove or reduce reactive feedstock; increase less reactive feed; lower temperature in the charge heater; and/or lower temperature in the reactor bed in alarm and the following bed. To implement these automated responses, the plant may be equipped with the numerous wired and wireless communication and control capabilities described herein. For example, the flow rate of various feeds may be increased or decreased through automated valve controls that open and/or close based on commands sent from a control platform illustrated in FIG. 5A. The commands may be generated based on analysis being performed by the data analysis platform and/or data collection platform, as illustrated in FIG. 5A. A command module, as illustrated in FIG. 5C, may collate the sequence of bytes appropriate to control components of the reactor unit, for example, to alleviate possible excursions.
Sensor Systems—Detection and Analysis
Sensor information may be gathered by one or more sensors and transmitted to data collection platform. Data collection platform may transmit the collected sensor data to data analysis platform, which may be at a plant or remote from a plant (e.g., in the cloud).
One or more calculations may be performed for reactor unit remote monitoring service. These calculations may assist in alerting and helping diagnose the status of one or more reactor units and/or other components used in a plant. A data processing platform may receive (e.g., from one or more sensors) one or more operational parameters, which may be used alone or in combination for determining the efficiency of the reactor unit. The data processing platform may use one or more design parameters, alone or in combination, for determining the status of the reactor unit. A design parameter may be a level at which the reactor unit was designed to operate at, below, or above. For example, a reactor unit may be designed to operate within a particular temperature range (e.g., the operating temperature should never exceed a metallurgical limit of the reactor).
In some instances, the timestamp of a calculated attribute may match the timestamp of the raw data used for the calculation. In some instances, a calculated attribute may use one or more results of one or more other calculated attributes; therefore, the order in which the attributes are calculated may be relevant. Meanwhile, in some embodiments, raw values may be checked for bad values. If bad values are detected, the data processing platform may either skip calculation or replace the bad value with NULL, as appropriate for subsequent calculations. For averages, a provision may be made to skip bad/null values and/or timestamps. Moreover, some units of measurement for variables may be specified. Some variables may be dimensionless, and therefore might not have a defined unit of measurement.
Aspects of the disclosure have been described in terms of illustrative embodiments thereof. Numerous other embodiments, modifications, and variations within the scope and spirit of the appended claims will occur to persons of ordinary skill in the art from a review of this disclosure. For example, one or more of the steps illustrated in the illustrative figures may be performed in other than the recited order, and one or more depicted steps may be optional in accordance with aspects of the disclosure.

Claims (16)

What is claimed is:
1. A system for preventing temperature excursion in a reactor, the system comprising: a reactor;
a heater;
a catalyst bed;
a sensor configured to measure data associated with the catalyst bed;
an analysis platform comprising:
one or more processors; and
memory storing executable instructions that, when executed, cause the analysis platform to:
receive the data associated with the catalyst bed; store the data associated with the catalyst bed; analyze the data associated with the catalyst bed;
determine, based on analyzing the data associated with the catalyst bed, whether a temperature of the reactor is trending away from a historical average temperature of the reactor;
send a message to a control system associated with the reactor, the message configured to cause an action to reduce the temperature of the reactor;
determine, based on analyzing the data associated with the catalyst bed, whether the temperature of the reactor is above a first point;
based on determining that the temperature of the reactor is above the first point, send a first message to cause a first action to reduce the temperature of the reactor;
determine, based on analyzing the data associated with the catalyst bed, whether the temperature of the reactor is above a second point different from the first point; and
based on determining that the temperature of the reactor is above the first point and that the first action was taken for a first time for a period of time, or based on determining that a rate of change of the temperature of the reactor is above a threshold rate of change, send a second message to cause a repeat of the first action to reduce the temperature of the reactor.
2. The system of claim 1, wherein the reactor is an exothermic reactor.
3. The system of claim 1, wherein the reactor is a hydrocracker.
4. The system of claim 1, wherein the reactor is a hydrotreater.
5. The system of claim 1, wherein the sensor configured to measure the data associated with the catalyst bed is a temperature sensor configured to measure a temperature of the catalyst bed at one or more of an inlet of the catalyst bed, a middle of the catalyst bed, or an outlet of the catalyst bed.
6. The system of claim 1, wherein the executable instructions, when executed, cause the analysis platform to:
based on determining that the temperature of the reactor is above the first point, send a message to cause one or more of removing a reactive feed stock, maintaining a constant feed rate, or reducing an outlet temperature of the heater.
7. The system of claim 1, wherein the executable instructions, when executed, cause the analysis platform to:
based on determining that the temperature of the reactor is above the first point, and that one or more temperature controllers for a catalyst bed where a temperature deviation was detected are not available, send a message to cause an action to reduce a temperature of a catalyst bed directly above the catalyst bed where the temperature deviation was detected.
8. The system of claim 1, wherein the executable instructions, when executed, cause the analysis platform to:
based on determining that the temperature of the reactor is above the second point, send a message to cause a second action to reduce the temperature of the reactor.
9. The system of claim 8, wherein the executable instructions, when executed, cause the analysis platform to:
based on determining that the temperature of the reactor is above the second point, send a message to cause one or more of ramping a temperature of the heater down to a predetermined temperature, ramping an inlet temperature for all the catalyst beds, bypassing a combined feed exchanger, or reducing an operating pressure of a unit comprising the reactor.
10. The system of claim 1, wherein the executable instructions, when executed, cause the analysis platform to:
send an alert message to a remote device, the alert message indicating that the temperature of the reactor is above a threshold.
11. The system of claim 1, wherein the executable instructions, when executed, cause the analysis platform to:
determine one or more of a feed flow rate, a makeup gas consumption flow rate, a quench flow rate, a separator pressure, a feed type, a recycle gas purity, a second stage feed flow rate, a second stage recycle gas flow rate, or a hydrogen to hydrocarbon ratio; and
adjust the display of the stability gauge based on the one or more of the feed flow rate, the makeup gas consumption flow rate, the quench flow rate, the separator pressure, the feed type, the recycle gas purity, the second stage feed flow rate, the second stage recycle gas flow rate, or the hydrogen to hydrocarbon ratio.
12. The system of claim 1, wherein the executable instructions, when executed, cause the analysis platform to:
adjust the display of the stability gauge that indicates the risk level that the reactor experiences the temperature excursion to display a normal risk level, an approaching risk level, or an at-risk risk level.
13. The system of claim 1, wherein the executable instructions, when executed, cause the analysis platform to:
based on determining that the temperature of the reactor is trending away from the historical average temperature of the reactor, adjust a display of a stability gauge that indicates a risk level that the reactor experiences a temperature excursion.
14. A system for preventing temperature excursion in a reactor, the system comprising: a reactor;
a heater;
a catalyst bed;
a sensor configured to measure data associated with the catalyst bed;
an analysis platform comprising:
one or more processors; and
memory storing executable instructions that, when executed, cause the analysis platform to:
receive the data associated with the catalyst bed; store the data associated with the catalyst bed; analyze the data associated with the catalyst bed;
determine, based on analyzing the data associated with the catalyst bed, whether a temperature of the reactor is trending away from a historical average temperature of the reactor;
send a message to a control system associated with the reactor, the message configured to cause an action to reduce the temperature of the reactor;
determine, based on analyzing the data associated with the catalyst bed, whether the temperature of the reactor is above a first point;
based on determining that the temperature of the reactor is above the first point, send a message to cause a first action to reduce the temperature of the reactor;
determine, based on analyzing the data associated with the catalyst bed, whether the temperature of the reactor is above a second point different from the first point; and
based on determining that the temperature of the reactor is above the second point, send a message to cause a second action to reduce the temperature of the reactor.
15. The system of claim 14, wherein the executable instructions, when executed, cause the analysis platform to:
based on determining that the temperature of the reactor is above the second point, send a message to cause one or more of ramping a temperature of the heater down to a predetermined temperature, ramping an inlet temperature for all the catalyst beds, bypassing a combined feed exchanger, or reducing an operating pressure of a unit comprising the reactor.
16. A system for preventing temperature excursion in a reactor, the system comprising: a reactor;
a heater;
a catalyst bed;
a sensor configured to measure data associated with the catalyst bed;
an analysis platform comprising:
one or more processors; and
memory storing executable instructions that, when executed, cause the analysis platform to:
receive the data associated with the catalyst bed; store the data associated with the catalyst bed; analyze the data associated with the catalyst bed;
determine, based on analyzing the data associated with the catalyst bed, whether a temperature of the reactor is trending away from a historical average temperature of the reactor;
send a message to a control system associated with the reactor, the message configured to cause an action to reduce the temperature of the reactor;
determine, based on analyzing the data associated with the catalyst bed, whether the temperature of the reactor is above a first point; and,
based on determining that the temperature of the reactor is above the first point, and that one or more temperature controllers for a catalyst bed where a temperature deviation was detected are not available, send a message to cause an action to reduce a temperature of a catalyst bed directly above the catalyst bed where the temperature deviation was detected.
US15/972,974 2017-06-20 2018-05-07 Incipient temperature excursion mitigation and control Active 2038-10-12 US10739798B2 (en)

Priority Applications (4)

Application Number Priority Date Filing Date Title
US15/972,974 US10739798B2 (en) 2017-06-20 2018-05-07 Incipient temperature excursion mitigation and control
EP18821040.5A EP3642678A4 (en) 2017-06-20 2018-06-19 REDUCTION OF A BEGINNING EXCEEDING TEMPERATURE AND CONTROL
PCT/US2018/038286 WO2018236869A1 (en) 2017-06-20 2018-06-19 MITIGATION AND REGULATION OF BIRD TEMPERATURE EXCURSION
CN201880040522.0A CN110753888A (en) 2017-06-20 2018-06-19 Initial temperature excursion mitigation and control

Applications Claiming Priority (2)

Application Number Priority Date Filing Date Title
US201762522612P 2017-06-20 2017-06-20
US15/972,974 US10739798B2 (en) 2017-06-20 2018-05-07 Incipient temperature excursion mitigation and control

Publications (2)

Publication Number Publication Date
US20180364747A1 US20180364747A1 (en) 2018-12-20
US10739798B2 true US10739798B2 (en) 2020-08-11

Family

ID=64658128

Family Applications (1)

Application Number Title Priority Date Filing Date
US15/972,974 Active 2038-10-12 US10739798B2 (en) 2017-06-20 2018-05-07 Incipient temperature excursion mitigation and control

Country Status (4)

Country Link
US (1) US10739798B2 (en)
EP (1) EP3642678A4 (en)
CN (1) CN110753888A (en)
WO (1) WO2018236869A1 (en)

Cited By (1)

* Cited by examiner, † Cited by third party
Publication number Priority date Publication date Assignee Title
US20220127173A1 (en) * 2020-10-26 2022-04-28 Northwest A&F University System and method for total volume treatment of landfill leachate and use thereof

Families Citing this family (37)

* Cited by examiner, † Cited by third party
Publication number Priority date Publication date Assignee Title
US9864823B2 (en) 2015-03-30 2018-01-09 Uop Llc Cleansing system for a feed composition based on environmental factors
US10545487B2 (en) 2016-09-16 2020-01-28 Uop Llc Interactive diagnostic system and method for managing process model analysis
US10678272B2 (en) 2017-03-27 2020-06-09 Uop Llc Early prediction and detection of slide valve sticking in petrochemical plants or refineries
US10754359B2 (en) 2017-03-27 2020-08-25 Uop Llc Operating slide valves in petrochemical plants or refineries
US10794644B2 (en) 2017-03-28 2020-10-06 Uop Llc Detecting and correcting thermal stresses in heat exchangers in a petrochemical plant or refinery
US10670353B2 (en) 2017-03-28 2020-06-02 Uop Llc Detecting and correcting cross-leakage in heat exchangers in a petrochemical plant or refinery
US10844290B2 (en) 2017-03-28 2020-11-24 Uop Llc Rotating equipment in a petrochemical plant or refinery
US10752845B2 (en) 2017-03-28 2020-08-25 Uop Llc Using molecular weight and invariant mapping to determine performance of rotating equipment in a petrochemical plant or refinery
US10794401B2 (en) 2017-03-28 2020-10-06 Uop Llc Reactor loop fouling monitor for rotating equipment in a petrochemical plant or refinery
US10663238B2 (en) 2017-03-28 2020-05-26 Uop Llc Detecting and correcting maldistribution in heat exchangers in a petrochemical plant or refinery
US11130111B2 (en) 2017-03-28 2021-09-28 Uop Llc Air-cooled heat exchangers
US11037376B2 (en) 2017-03-28 2021-06-15 Uop Llc Sensor location for rotating equipment in a petrochemical plant or refinery
US10752844B2 (en) 2017-03-28 2020-08-25 Uop Llc Rotating equipment in a petrochemical plant or refinery
US10816947B2 (en) 2017-03-28 2020-10-27 Uop Llc Early surge detection of rotating equipment in a petrochemical plant or refinery
US10670027B2 (en) 2017-03-28 2020-06-02 Uop Llc Determining quality of gas for rotating equipment in a petrochemical plant or refinery
US11396002B2 (en) 2017-03-28 2022-07-26 Uop Llc Detecting and correcting problems in liquid lifting in heat exchangers
US10962302B2 (en) 2017-03-28 2021-03-30 Uop Llc Heat exchangers in a petrochemical plant or refinery
US10695711B2 (en) 2017-04-28 2020-06-30 Uop Llc Remote monitoring of adsorber process units
US11365886B2 (en) 2017-06-19 2022-06-21 Uop Llc Remote monitoring of fired heaters
US10913905B2 (en) 2017-06-19 2021-02-09 Uop Llc Catalyst cycle length prediction using eigen analysis
US10739798B2 (en) 2017-06-20 2020-08-11 Uop Llc Incipient temperature excursion mitigation and control
US11130692B2 (en) 2017-06-28 2021-09-28 Uop Llc Process and apparatus for dosing nutrients to a bioreactor
US10994240B2 (en) 2017-09-18 2021-05-04 Uop Llc Remote monitoring of pressure swing adsorption units
US11194317B2 (en) 2017-10-02 2021-12-07 Uop Llc Remote monitoring of chloride treaters using a process simulator based chloride distribution estimate
US11676061B2 (en) 2017-10-05 2023-06-13 Honeywell International Inc. Harnessing machine learning and data analytics for a real time predictive model for a FCC pre-treatment unit
US11105787B2 (en) 2017-10-20 2021-08-31 Honeywell International Inc. System and method to optimize crude oil distillation or other processing by inline analysis of crude oil properties
US10901403B2 (en) 2018-02-20 2021-01-26 Uop Llc Developing linear process models using reactor kinetic equations
US10734098B2 (en) 2018-03-30 2020-08-04 Uop Llc Catalytic dehydrogenation catalyst health index
US10851048B2 (en) * 2018-11-13 2020-12-01 Covestro Deutschland Ag Process for preparing an isocyanate by partly adiabatically operated phosgenation of the corresponding amine
US10953377B2 (en) 2018-12-10 2021-03-23 Uop Llc Delta temperature control of catalytic dehydrogenation process reactors
CA3155648A1 (en) * 2019-09-24 2021-04-01 Iowa Corn Promotion Board Continuous, carbohydrate to ethylene glycol processes
FR3104715B1 (en) * 2019-12-16 2021-12-03 Air Liquide Method for non-destructive testing of the aging of a reforming reactor.
CN112327805B (en) * 2020-10-30 2022-03-04 网络通信与安全紫金山实验室 Control system stability analysis method and device and computer readable storage medium
DE102022209657A1 (en) * 2022-09-14 2024-03-14 Siemens Aktiengesellschaft Monitoring exothermic reactions in a reactor
CN118939041B (en) * 2024-10-14 2025-02-07 余姚市欧贝电器有限公司 A barbecue machine temperature data intelligent processing system
CN118963457B (en) * 2024-10-18 2025-04-01 山东尚核电力科技有限公司 A temperature automatic control system for a reactor used for treating waste resin by molten salt oxidation
CN119633434A (en) * 2024-12-31 2025-03-18 山东鲁维工程设计有限公司 A method and system for purifying and recovering coking waste gas

Citations (222)

* Cited by examiner, † Cited by third party
Publication number Priority date Publication date Assignee Title
GB1134439A (en) 1966-10-19 1968-11-20 Shell Int Research Method and composition for detecting odorants in gaseous fuels
US4159239A (en) 1973-09-20 1979-06-26 Mobil Oil Corporation Catalytic cracking process
US4267458A (en) 1972-04-26 1981-05-12 Westinghouse Electric Corp. System and method for starting, synchronizing and operating a steam turbine with digital computer control
US4284494A (en) 1978-05-01 1981-08-18 Engelhard Minerals & Chemicals Corporation Control of emissions in FCC regenerator flue gas
US4362614A (en) 1981-04-30 1982-12-07 Uop Inc. Mercaptan extraction process with recycled alkaline solution
US4380146A (en) 1977-01-12 1983-04-19 Westinghouse Electric Corp. System and method for accelerating and sequencing industrial gas turbine apparatus and gas turbine electric power plants preferably with a digital computer control system
US4385985A (en) 1981-04-14 1983-05-31 Mobil Oil Corporation FCC Reactor with a downflow reactor riser
US4411773A (en) 1980-12-18 1983-10-25 Mobil Oil Corporation Heat balance in FCC process and apparatus with downflow reactor riser
EP0181744A1 (en) 1984-10-31 1986-05-21 Potash Corporation Of Saskatchewan Mining Limited Gravity pipe transport system
US4709546A (en) 1985-04-20 1987-12-01 Mtu Motoren-Und Turbinen-Union Gmbh Cooled gas turbine operable with a controlled cooling air quantity
US4775460A (en) 1987-12-24 1988-10-04 Uop, Inc. Hydrocracking process with feed pretreatment
US4795545A (en) 1987-09-17 1989-01-03 Uop Inc. Process for pretreatment of light hydrocarbons to remove sulfur, water, and oxygen-containing compounds
US4902469A (en) 1986-05-05 1990-02-20 Westinghouse Electric Corp. Status tree monitoring and display system
WO1990010083A1 (en) 1989-02-28 1990-09-07 Aktieselskabet Faxe Kalkbrud A method for controlling and/or monitoring biological processes
US5077252A (en) 1990-07-17 1991-12-31 Mobil Oil Corporation Process for control of multistage catalyst regeneration with partial co combustion
US5227121A (en) 1989-11-02 1993-07-13 Combustion Engineering, Inc. Advanced nuclear plant control room complex
US5582684A (en) 1992-01-09 1996-12-10 Stfi Method of determining degree of reduction in a sulfate liquor using IR and UV spectroscopy
US5605435A (en) 1994-05-06 1997-02-25 Ingersoll-Rand Company Method and apparatus to achieve passive damping of flow disturbances in a centrifugal compressor to control compressor surge
US5616214A (en) 1995-09-12 1997-04-01 Pulp And Paper Research Institute Of Canada Determination of sodium sulfide and sulfidity in green liquors and smelt solutions
US5642296A (en) 1993-07-29 1997-06-24 Texas Instruments Incorporated Method of diagnosing malfunctions in semiconductor manufacturing equipment
US5666297A (en) 1994-05-13 1997-09-09 Aspen Technology, Inc. Plant simulation and optimization software apparatus and method using dual execution models
US5817517A (en) 1995-02-08 1998-10-06 Exxon Research And Engineering Company Method of characterizing feeds to catalytic cracking process units
US6038540A (en) 1994-03-17 2000-03-14 The Dow Chemical Company System for real-time economic optimizing of manufacturing process control
US6081230A (en) 1994-11-29 2000-06-27 Xanavi Informatics Corporation Navigation system furnished with means for estimating error of mounted sensor
US6230486B1 (en) 1998-12-17 2001-05-15 Honda Giken Kogyo Kabushiki Kaisha Plant control system
US6266605B1 (en) 1998-12-17 2001-07-24 Honda Giken Kogyo Kabushiki Plant control system
US6271845B1 (en) 1998-05-29 2001-08-07 Hewlett Packard Company Method and structure for dynamically drilling down through a health monitoring map to determine the health status and cause of health problems associated with network objects of a managed network environment
WO2001060951A1 (en) 2000-02-16 2001-08-23 Indian Oil Corporation Limited A multi stage selective catalytic cracking process and a system for producing high yield of middle distillate products from heavy hydrocarbon feedstocks
US6392114B1 (en) 1999-12-30 2002-05-21 Uop Llc Solid catalyst alkylation process with regeneration section and hydrogen fractionation zone
US20020123864A1 (en) 2001-03-01 2002-09-05 Evren Eryurek Remote analysis of process control plant data
US20020179495A1 (en) 1991-03-08 2002-12-05 Heyse John V. Apparatus for hydrocarbon processing
US20030036052A1 (en) 1999-07-09 2003-02-20 Regents Of The University Of California Sensor for analyzing components of fluids
US20030105775A1 (en) 2001-11-30 2003-06-05 Mitsubishi Denki Kabushiki Kaisha Plant management system
US20030147351A1 (en) 2001-11-30 2003-08-07 Greenlee Terrill L. Equipment condition and performance monitoring using comprehensive process model based upon mass and energy conservation
US20030223918A1 (en) 2001-03-23 2003-12-04 Cammy Neal E. FCC process and apparatus with automatic catalyst recycle control
US20040079392A1 (en) 2002-10-28 2004-04-29 Kuechler Keith H. Process and apparatus for mitigating compressor fouling in a compressor system
US20040099572A1 (en) 2002-11-26 2004-05-27 Martin Evans FCC catalyst injection system having closed loop control
US20040109788A1 (en) 2002-07-12 2004-06-10 Lixiong Li Apparatus and method for continuous depyrogenation and production of sterile water for injection
US20040122936A1 (en) 2002-12-20 2004-06-24 Ge Mortgage Holdings, Llc Methods and apparatus for collecting, managing and presenting enterprise performance information
US20040122273A1 (en) 2002-12-19 2004-06-24 Kabin Jeffrey Alan Method and apparatus for controlling effluent composition in oxygenates to olefins conversion
US6760716B1 (en) 2000-06-08 2004-07-06 Fisher-Rosemount Systems, Inc. Adaptive predictive model in a process control system
US20040148144A1 (en) 2003-01-24 2004-07-29 Martin Gregory D. Parameterizing a steady-state model using derivative constraints
US20040147036A1 (en) 2001-05-23 2004-07-29 Karl-Dieter Krenn Means and method for determining the content of sulfurous acid in liquids
US6772044B1 (en) 2000-04-13 2004-08-03 Honeywell International Inc. Sensor placement and control design for distributed parameter systems
US20040204913A1 (en) 2003-04-09 2004-10-14 Peter Mueller Optimizing service system
US20040204775A1 (en) 2001-03-01 2004-10-14 Keyes Marion A. Economic calculations in process control system
US20040220778A1 (en) 2001-08-02 2004-11-04 Kanehisa Imai Remote maintenance system and stock management system
US20050027721A1 (en) 2002-04-03 2005-02-03 Javier Saenz System and method for distributed data warehousing
US20050029163A1 (en) 2003-08-04 2005-02-10 Warren Letzsch Process and apparatus for controlling catalyst temperature in a catalyst stripper
US20050098033A1 (en) 2003-11-12 2005-05-12 Kiran Mallavarapu Control of a hydrogen purifying pressure swing adsorption unit in fuel processor module for hydrogen generation
US20050133211A1 (en) 2003-12-19 2005-06-23 Osborn Mark D. Heat exchanger performance monitoring and analysis method and system
US20050216209A1 (en) 2002-11-26 2005-09-29 Intercat Equipment, Inc. Method for monitoring a FCC catalyst injection system
US6983227B1 (en) 1995-01-17 2006-01-03 Intertech Ventures, Ltd. Virtual models of complex systems
US6982032B2 (en) 2001-01-09 2006-01-03 Aqua-Nova Llc Apparatus and method for biological treatment of environmental contaminants and waste
US20060020423A1 (en) 2004-06-12 2006-01-26 Fisher-Rosemount Systems, Inc. System and method for detecting an abnormal situation associated with a process gain of a control loop
WO2006044408A1 (en) 2004-10-14 2006-04-27 Shell Internationale Research Maatschappij B.V. A method and apparatus for monitoring and controlling the stability of a burner of a fired heater
US20060133412A1 (en) 2004-12-22 2006-06-22 Rockwell Automation Technologies, Inc. Integration of control and business applications using integration servers
US7067333B1 (en) 2002-06-28 2006-06-27 Advanced Micro Devices, Inc. Method and apparatus for implementing competing control models
US7133807B2 (en) 2001-01-22 2006-11-07 Tokyo Electron Limited Apparatus productivity improving system and its method
US20060252642A1 (en) 2005-05-06 2006-11-09 Kanazirev Vladislav I Scavengers for removal of acid gases from fluid streams
US20060259163A1 (en) 2000-03-10 2006-11-16 Smiths Detection Inc. Temporary expanding integrated monitoring network
US7151966B1 (en) 2002-06-04 2006-12-19 Rockwell Automation Technologies, Inc. System and methodology providing open interface and distributed processing in an industrial controller environment
US20070020154A1 (en) 2005-07-19 2007-01-25 Intercat Equipment, Inc. Catalyst withdrawal apparatus and method for regulating catalyst inventory in a fluid catalyst cracking unit
US20070059838A1 (en) 2005-09-13 2007-03-15 Pavilion Technologies, Inc. Dynamic constrained optimization of chemical manufacturing
US20070059159A1 (en) 2005-09-13 2007-03-15 Gas Turbine Efficiency Ab System and method for augmenting power output from a gas turbine engine
US20070091824A1 (en) 2005-10-21 2007-04-26 Honeywell International Inc. Wireless transmitter initiated communication systems
US20070091825A1 (en) 2005-10-21 2007-04-26 Honeywell International Inc. Wireless transmitter initiated communication methods
US7246039B2 (en) 2002-07-19 2007-07-17 Selex Communications Limited Fault diagnosis system
US20070185664A1 (en) 2006-01-30 2007-08-09 Nissan Motor Co., Ltd. Abnormal noise correction verification apparatus
US20070192078A1 (en) 2006-02-14 2007-08-16 Edsa Micro Corporation Systems and methods for real-time system monitoring and predictive analysis
US20070212790A1 (en) 2006-03-13 2007-09-13 Marathon Petroleum Company Llc Method for monitoring feeds to catalytic cracking units by near-infrared spectroscopy
US20070250292A1 (en) 2006-04-21 2007-10-25 Perry Alagappan Application of abnormal event detection technology to delayed coking unit
US20070260656A1 (en) 2006-05-05 2007-11-08 Eurocopter Method and apparatus for diagnosing a mechanism
US20070271452A1 (en) 2006-05-19 2007-11-22 Honeywell International Inc. Method and computer product to increase accuracy of time-based software verification for sensor networks
JP2008031940A (en) 2006-07-31 2008-02-14 Isuzu Motors Ltd Method for estimating catalyst deterioration quantity and device for estimating catalyst deterioration quantity
US20080086322A1 (en) 2006-10-05 2008-04-10 Daniel John Wallace Method for automatic asset classification
US20080130902A1 (en) 2006-04-10 2008-06-05 Honeywell International Inc. Secure wireless instrumentation network system
US20080154434A1 (en) 2006-12-20 2008-06-26 Galloway Douglas B Catalytic Alloy Hydrogen Sensor Apparatus and Process
US7415357B1 (en) 2007-03-07 2008-08-19 Honeywell International Inc. Automated oil well test classification
US20080282606A1 (en) 2007-04-16 2008-11-20 Plaza John P System and process for producing biodiesel
US20090064295A1 (en) 2007-09-04 2009-03-05 Honeywell International Inc. System, method, and apparatus for on-demand limited security credentials in wireless and other communication networks
US20090059786A1 (en) 2007-09-04 2009-03-05 Honeywell International Inc. Method and apparatus for dynamic assignment of quality of service parameters in a communication network
US20090060192A1 (en) 2007-09-04 2009-03-05 Honeywell International Inc. Method and apparatus for providing security in wireless communication networks
WO2009046095A1 (en) 2007-10-01 2009-04-09 Iconics, Inc. Visualization of process control data
US7567887B2 (en) 2004-09-10 2009-07-28 Exxonmobil Research And Engineering Company Application of abnormal event detection technology to fluidized catalytic cracking unit
US20090204245A1 (en) 2001-08-10 2009-08-13 Rockwell Automation Technologies, Inc. System and method for dynamic multi-objective optimization of machine selection, integration and utilization
US20090201899A1 (en) 2008-02-08 2009-08-13 Honeywell International Inc. Apparatus and method for routing data in wireless networks
US20090245286A1 (en) 2008-04-01 2009-10-01 Honeywell International Inc. Method and apparatus for physical layer routing in a wireless device
US20090268674A1 (en) 2008-04-23 2009-10-29 Honeywell International Inc. Apparatus and method for medium access control in wireless communication networks
US20090281677A1 (en) 2008-05-12 2009-11-12 Energy And Power Solutions, Inc. Systems and methods for assessing and optimizing energy use and environmental impact
US20100014599A1 (en) 2008-07-16 2010-01-21 Honeywell International Inc. Apparatus and method for modifying transmissions on specified wireless channels to reduce interference with higher-priority transmitters
US20100108567A1 (en) 2008-04-30 2010-05-06 Xyleco, Inc. Processing biomass and petroleum containing materials
US20100125347A1 (en) 2008-11-19 2010-05-20 Harris Corporation Model-based system calibration for control systems
US20100152900A1 (en) 2008-10-10 2010-06-17 Exxonmobil Research And Engineering Company Optimizing refinery hydrogen gas supply, distribution and consumption in real time
US7742833B1 (en) 2006-09-28 2010-06-22 Rockwell Automation Technologies, Inc. Auto discovery of embedded historians in network
US20100158764A1 (en) 2008-12-18 2010-06-24 Hedrick Brian W Apparatus for Improving Flow Properties of Crude Petroleum
US20100230324A1 (en) 2006-11-07 2010-09-16 Saudi Arabian Oil Company Control of Fluid Catalytic Cracking Process for Minimizing Additive Usage in the Desulfurization of Petroleum Feedstocks
US20100262900A1 (en) 2009-04-13 2010-10-14 Honeywell International Inc. Utilizing spreadsheet user interfaces with flowsheets of a cpi simulation system
US7836941B2 (en) 2006-05-19 2010-11-23 Exxonmobil Research And Engineering Company Mitigation of in-tube fouling in heat exchangers using controlled mechanical vibration
US7925979B2 (en) 2000-09-15 2011-04-12 Invensys Systems, Inc. Extensible manufacturing/process control information portal server
US20110112659A1 (en) 2009-11-12 2011-05-12 Honeywell International Inc. System identification in automated process control
US20110152590A1 (en) 2009-12-17 2011-06-23 Uop Llc Solid catalyst hydrocarbon alkylation using stacked moving bed radial flow reactors
US20110152591A1 (en) 2009-12-17 2011-06-23 Uop Llc Solid catalyst hydrocarbon conversion process using stacked moving bed reactors
US7979192B2 (en) 2006-03-31 2011-07-12 Morrison Brian D Aircraft-engine trend monitoring system
US8050889B2 (en) 2006-05-09 2011-11-01 Hsb Solomon Associates, Llc Performance analysis system and method
US8055371B2 (en) 2002-10-08 2011-11-08 Invensys Systems, Inc. Services portal
US20110311014A1 (en) 2010-06-21 2011-12-22 Chevron Phillips Chemical Company Lp System and method for closed relief of a polyolefin loop reactor system
US20120029966A1 (en) 2010-07-30 2012-02-02 Accenture Global Services Gmbh Monitoring and evaluating the production of a conversion facility
US8128808B2 (en) 2008-06-12 2012-03-06 H R D Corporation Process for hydrodesulfurization, hydrodenitrogenation, hydrofinishing, or amine production
US20120083933A1 (en) 2010-09-30 2012-04-05 General Electric Company Method and system to predict power plant performance
US20120095808A1 (en) 2010-10-15 2012-04-19 Invensys Systems Inc. System and Method for Process Predictive Simulation
US20120104295A1 (en) 2010-10-29 2012-05-03 TapcoEnpro International Actuator control device and method
US20120121376A1 (en) 2008-10-07 2012-05-17 Wilhelmus Hermanus Huis In Het Veld Method of controlling a compressor and apparatus therefor
US20120123583A1 (en) 2010-11-16 2012-05-17 Mks Instruments, Inc. Controlling a Discrete-Type Manufacturing Process with a Multivariate Model
US8204717B2 (en) 2009-04-01 2012-06-19 Honeywell International Inc. Cloud computing as a basis for equipment health monitoring service
US20120197616A1 (en) 2011-01-28 2012-08-02 Honeywell Spol S.R.O. System for modeling parallel working units for advanced process control
US20120259583A1 (en) 2009-06-22 2012-10-11 Johnson Controls Technology Company Automated fault detection and diagnostics in a building management system
US8354081B2 (en) 2003-04-04 2013-01-15 Texaco, Inc. Portable fuel processor apparatus and enclosure and method of installing same
US20130029587A1 (en) 2011-07-26 2013-01-31 Honeywell International Inc. Determining a deployment of a wireless network
US20130031960A1 (en) 2011-08-03 2013-02-07 John Crane Inc. Seal gas monitoring and control system
US20130079899A1 (en) 2011-09-23 2013-03-28 Honeywell International Inc. Control That Estimates Delayed Manipulated Variables
US20130090088A1 (en) 2011-10-11 2013-04-11 Tangome, Inc. Seamlessly authenticating device users
US20130094422A1 (en) 2011-10-12 2013-04-18 Honeywell International Inc. Antenna selection diversity scheme for zigbee or other wireless devices and related apparatus and method
US20130172643A1 (en) 2010-07-08 2013-07-04 Indian Oil Corporation Ltd. Two stage fluid catalytic cracking process and apparatus
US20130253898A1 (en) 2012-03-23 2013-09-26 Power Analytics Corporation Systems and methods for model-driven demand response
US20130270157A1 (en) 2012-04-16 2013-10-17 Marcello Ferrara Method, apparatus and chemical products for treating petroleum equipment
US20130311437A1 (en) 2012-05-16 2013-11-21 Honeywell Internatioanl Inc. System and method for performance monitoring of a population of equipment
US20130327052A1 (en) 2012-06-12 2013-12-12 Genalta Power Inc. Exhaust system for gas turbines
US20140008035A1 (en) 2012-07-05 2014-01-09 Honeywell International Inc. Environmental control systems and techniques for monitoring heat exchanger fouling
US8630962B2 (en) 2008-10-09 2014-01-14 Hitachi, Ltd. Error detection method and its system for early detection of errors in a planar or facilities
US20140026598A1 (en) 2012-07-25 2014-01-30 Johnson Controls Technology Company Methods and controllers for providing a surge map for the monitoring and control of chillers
US20140074273A1 (en) 2012-09-10 2014-03-13 Honeywell International Inc. Handheld device rendering of plant model portion based on task
WO2014042508A1 (en) 2012-09-12 2014-03-20 Universiti Sains Malaysia Wireless production monitoring system
US20140114039A1 (en) 2012-10-18 2014-04-24 Chevron Phillips Chemical Company Lp System and method for catalyst preparation
US20140131027A1 (en) 2012-11-09 2014-05-15 Rolls-Royce Plc Heat exchange arrangement
US20140163275A1 (en) 2011-05-24 2014-06-12 Chiyoda Corporation Producing method of monocyclic aromatic hydrocarbons and monocyclic aromatic hydrocarbon production plant
EP2746884A1 (en) 2012-12-24 2014-06-25 Air Products And Chemicals, Inc. Apparatus and methods to monitor and control cyclic process units in a steady plant environment
US20140179968A1 (en) 2011-05-24 2014-06-26 Chiyoda Corporation Producing method of monocyclic aromatic hydrocarbons and monocyclic aromatic hydrocarbon production plant
US20140212978A1 (en) 2013-01-28 2014-07-31 Fisher-Rosemount Systems, Inc. Systems and methods to monitor operating processes
WO2014123993A1 (en) 2013-02-05 2014-08-14 Yokogawa Corporation Of America System, method and apparatus for determining properties of product or process streams
US8815152B2 (en) 2008-06-13 2014-08-26 Alt Bioscience, Llc Device for rapid determination of disease-associated thiol compounds
US20140262949A1 (en) * 2013-03-18 2014-09-18 Allan G. Kem Method for automated temperature control of reactor system
US20140294683A1 (en) 2013-03-28 2014-10-02 Uop Llc Apparatus for a Radial-Flow Reactor and Method for Assembly Thereof
US20140296058A1 (en) 2013-03-27 2014-10-02 Uop Llc Dehydrogenation reactor catalyst collector with hot hydrogen stripping zone
US20140294684A1 (en) 2013-03-28 2014-10-02 Uop Llc Apparatus for a Radial-Flow Reactor and Method for Assembly Thereof
EP2801937A1 (en) 2013-05-09 2014-11-12 Rockwell Automation Technologies, Inc. Industrial device and system attestation in a cloud platform
US20140337256A1 (en) 2013-05-08 2014-11-13 Vigilent Corporation Influence learning in an environmentally managed system
US8926737B2 (en) 2008-11-28 2015-01-06 Shell Oil Company Process for producing purified natural gas
US20150059714A1 (en) 2013-09-05 2015-03-05 GM Global Technology Operations LLC Method of Operating an Internal Combustion Engine with a Turbocharger
US20150060331A1 (en) 2011-04-07 2015-03-05 Uop Llc Method for multi-staged hydroprocessing using quench
US20150078970A1 (en) 2013-09-18 2015-03-19 Uop Llc Catalyst retainer for radial flow reactor
US20150077263A1 (en) 2012-03-01 2015-03-19 Nuovo Pignone Srl Method and system for condition monitoring of a group of plants
US20150098862A1 (en) 2013-10-07 2015-04-09 Uop Llc Radial Flow Process and Apparatus
US20150158789A1 (en) 2013-12-06 2015-06-11 Paul F. Keusenkothen Methods and Systems for Producing Liquid Hydrocarbons
US20150185716A1 (en) 2013-12-31 2015-07-02 General Electric Company Methods and systems for enhancing control of power plant generating units
US20150276208A1 (en) 2014-03-26 2015-10-01 Rockwell Automation Technologies, Inc. Cloud-level analytics for boiler networks
US20150284641A1 (en) 2012-11-07 2015-10-08 Baozhen Shi Method and apparatus for controlling catalyst in reaction zones and purifying and cooling regenerated catalyst
US20150330571A1 (en) 2012-11-23 2015-11-19 L'air Liquide, Societe Anonyme Pour L'etude Et L'exploitation Des Procedes Georges Claude Method and device for filling a tank with liquefied gas
US20160033941A1 (en) 2014-07-31 2016-02-04 General Electric Company System and method for maintaining the health of a control system
US20160048119A1 (en) 2014-08-13 2016-02-18 Fisher-Rosemount Systems, Inc. Model predictive control using wireless process signals
US20160098234A1 (en) 2014-10-07 2016-04-07 Videojet Technologies Inc. System and method for remotely servicing an industrial printer
US20160098037A1 (en) 2014-10-06 2016-04-07 Fisher-Rosemount Systems, Inc. Data pipeline for process control system anaytics
US20160122663A1 (en) 2014-11-03 2016-05-05 Uop Llc Integrated hydrotreating and slurry hydrocracking process
US20160147204A1 (en) 2014-11-26 2016-05-26 General Electric Company Methods and systems for enhancing control of power plant generating units
US20160237910A1 (en) 2013-10-29 2016-08-18 Mitsubishi Hitachi Power Systems, Ltd. Temperature control device, gas turbine, temperature control method, and program
US20160260041A1 (en) 2015-03-03 2016-09-08 Uop Llc System and method for managing web-based refinery performance optimization using secure cloud computing
US20160291584A1 (en) 2015-03-30 2016-10-06 Uop Llc System and method for tuning process models
US20160292188A1 (en) 2015-03-30 2016-10-06 Uop Llc Data cleansing system and method for inferring a feed composition
US20160292325A1 (en) 2015-03-30 2016-10-06 Uop Llc Advanced data cleansing system and method
US20160313653A1 (en) 2013-12-05 2016-10-27 Asml Netherlands B.V. Method and Apparatus for Measuring a Structure on a Substrate, Models for Error Correction, Computer Program Products for Implementing such Methods and Apparatus
US20160363315A1 (en) 2013-12-31 2016-12-15 Clearsign Combustion Corporation Method and apparatus for extending flammability and stability limits in a combustion reaction
US20170009932A1 (en) 2015-07-08 2017-01-12 Ilseong Eng Co., Ltd. Automatic emergency lifting or lowering system for operational deployment facility
US9580341B1 (en) 2012-09-22 2017-02-28 Biotta LLC Biological two-stage contaminated water treatment system and process
US20170058213A1 (en) 2014-02-25 2017-03-02 Saudi Basic Industries Corporation A method of controlling the supply and allocation of hydrogen gas in a hydrogen system of a refinery integrated iwth olefins and aromatics plants
US20170082320A1 (en) 2015-09-22 2017-03-23 A.O. Smith Corporation Dual sensor combustion system
US20170107188A1 (en) 2014-03-31 2017-04-20 Nippon Shokubai Co., Ltd. Process for producing ethylene oxide
WO2017079058A1 (en) 2015-11-02 2017-05-11 Heartland Technology Partners Llc Apparatus for concentrating wastewater and for creating custom brines
US9751817B2 (en) 2014-03-07 2017-09-05 Uop Llc Combined reactor effluent and regenerant recirculation for detergent alkylation process
US20170284410A1 (en) 2016-04-01 2017-10-05 Fisher-Rosemount Systems, Inc. Methods and apparatus for detecting and preventing compressor surge
US20170315543A1 (en) 2015-03-30 2017-11-02 Uop Llc Evaluating petrochemical plant errors to determine equipment changes for optimized operations
US20170323038A1 (en) 2015-03-30 2017-11-09 Uop Llc Cleansing system for a feed composition based on environmental factors
US20170352899A1 (en) 2014-08-20 2017-12-07 Nissan Motor Co., Ltd Fuel cell system and control method for fuel cell system
US20180046155A1 (en) 2015-03-30 2018-02-15 Uop Llc Identifying and implementing refinery or petrochemical plant process performance improvements
US20180081344A1 (en) 2016-09-16 2018-03-22 Uop Llc Interactive petrochemical plant diagnostic system and method for chemical process model analysis
US20180122021A1 (en) 2015-03-03 2018-05-03 Uop Llc Chemical refinery performance optimization
US9968899B1 (en) 2017-04-28 2018-05-15 Uop Llc Catalyst transfer pipe plug detection
US20180155638A1 (en) 2016-11-21 2018-06-07 Saudi Arabian Oil Company Process and system for conversion of crude oil to petrochemicals and fuel products integrating steam cracking and conversion of naphtha into chemical rich reformate
US20180155642A1 (en) 2016-11-21 2018-06-07 Saudi Arabian Oil Company Process and system for conversion of crude oil to petrochemicals and fuel products integrating steam cracking, fluid catalytic cracking, and conversion of naphtha into chemical rich reformate
US20180197350A1 (en) 2017-01-10 2018-07-12 Honeywell International Inc. Aircraft maintenance systems and methods for ecs fouling predictions
US20180275690A1 (en) 2017-03-27 2018-09-27 Uop Llc Operating slide valves in petrochemical plants or refineries
US20180275691A1 (en) 2017-03-27 2018-09-27 Uop Llc Early prediction and detection of slide valve sticking in petrochemical plants or refineries
US20180275692A1 (en) 2017-03-27 2018-09-27 Uop Llc Measuring and determining hot spots in slide valves for petrochemical plants or refineries
US20180286141A1 (en) 2017-03-28 2018-10-04 Uop Llc Sensor location for rotating equipment in a petrochemical plant or refinery
US20180280914A1 (en) 2017-03-28 2018-10-04 Uop Llc Detecting and correcting problems in liquid lifting in heat exchangers
US20180283811A1 (en) 2017-03-28 2018-10-04 Uop Llc Strain gauges and detecting pre-leakage in heat exchangers in a petrochemical plant or refinery
US20180283816A1 (en) 2017-03-28 2018-10-04 Uop Llc Detecting and correcting cross-leakage in heat exchangers in a petrochemical plant or refinery
US20180282633A1 (en) 2017-03-28 2018-10-04 Uop Llc Rotating equipment in a petrochemical plant or refinery
US20180283815A1 (en) 2017-03-28 2018-10-04 Uop Llc Detecting and correcting maldistribution in heat exchangers in a petrochemical plant or refinery
US20180283392A1 (en) 2017-03-28 2018-10-04 Uop Llc Determining quality of gas for rotating equipment in a petrochemical plant or refinery
US20180283812A1 (en) 2017-03-28 2018-10-04 Uop Llc Detecting and correcting vibration in heat exchangers
US20180283368A1 (en) 2017-03-28 2018-10-04 Uop Llc Determining quality of gas for rotating equipment in a petrochemical plant or refinery
US20180282634A1 (en) 2017-03-28 2018-10-04 Uop Llc Rotating equipment in a petrochemical plant or refinery
US20180280917A1 (en) 2017-03-28 2018-10-04 Uop Llc Air-cooled heat exchangers
US20180283818A1 (en) 2017-03-28 2018-10-04 Uop Llc Detecting and correcting fouling in heat exchangers
US20180283813A1 (en) 2017-03-28 2018-10-04 Uop Llc Wet-cooled heat exchanger
US20180283404A1 (en) 2017-03-28 2018-10-04 Uop Llc Reactor loop fouling monitor for rotating equipment in a petrochemical plant or refinery
US20180282635A1 (en) 2017-03-28 2018-10-04 Uop Llc Using molecular weight and invariant mapping to determine performance of rotating equipment in a petrochemical plant or refinery
US20180284705A1 (en) 2017-03-28 2018-10-04 Uop Llc Early surge detection of rotating equipment in a petrochemical plant or refinery
US10107295B1 (en) 2014-05-21 2018-10-23 Marion Brecheisen Pump system and method
US20180311609A1 (en) 2017-04-28 2018-11-01 Uop Llc Remote monitoring of adsorber process units
US20180364747A1 (en) 2017-06-20 2018-12-20 Uop Llc Incipient temperature excursion mitigation and control
US20180362862A1 (en) 2017-06-19 2018-12-20 Uop Llc Catalyst Cycle Length Prediction Using Eigen Analysis
US20180363914A1 (en) 2017-06-19 2018-12-20 Uop Llc Remote monitoring of fired heaters
US20190002318A1 (en) 2017-06-28 2019-01-03 Uop Llc Process and apparatus for dosing nutrients to a bioreactor
US20190003978A1 (en) 2017-06-28 2019-01-03 Uop Llc Process and apparatus to detect mercaptans in a caustic stream
US20190083920A1 (en) 2017-09-18 2019-03-21 Uop Llc Remote Monitoring of Pressure Swing Adsorption Units
US20190102966A1 (en) 2016-03-21 2019-04-04 Envirofit International, Inc. Methods and systems of liquefied petroleum gas distribution
US20190101907A1 (en) 2017-10-02 2019-04-04 Uop Llc Remote Monitoring of Chloride Treaters Using a Process Simulator Based Chloride Distribution Estimate
US20190101336A1 (en) 2017-03-28 2019-04-04 Uop Llc Heat exchangers in a petrochemical plant or refinery
US20190101342A1 (en) 2017-03-28 2019-04-04 Uop Llc Detecting and correcting thermal stresses in heat exchangers in a petrochemical plant or refinery
US20190108454A1 (en) 2017-10-05 2019-04-11 Honeywell International Inc. Harnessing machine learning & data analytics for a real time predictive model for a fcc pre-treatment unit
US20190120810A1 (en) 2017-10-20 2019-04-25 Honeywell International Inc. System and method to optimize crude oil distillation or other processing by inline analysis of crude oil properties

Family Cites Families (9)

* Cited by examiner, † Cited by third party
Publication number Priority date Publication date Assignee Title
US7569136B2 (en) * 1997-06-24 2009-08-04 Ackerson Michael D Control system method and apparatus for two phase hydroprocessing
KR100763841B1 (en) * 2006-03-28 2007-10-05 한국에너지기술연구원 Carbon nanotube synthesis method using ultrasonic vaporization
JP5078426B2 (en) * 2007-05-10 2012-11-21 Jx日鉱日石エネルギー株式会社 Carbon monoxide remover and hydrogen production equipment
EP2331914B1 (en) * 2008-09-24 2018-02-21 Huntsman Petrochemical LLC Temperature control method of a catalytic bed using probability distribution
US9223301B2 (en) * 2010-04-19 2015-12-29 Honeywell International Inc. Active cloud point controller for refining applications and related method
CA2709722A1 (en) * 2010-07-15 2012-01-15 Alakh Prasad Integrated biogas cleaning a system to remove water, siloxanes, sulfur, oxygen, chlorides, and volatile organic compounds
US9696074B2 (en) * 2014-01-03 2017-07-04 Woodward, Inc. Controlling refrigeration compression systems
US9579619B2 (en) * 2015-01-28 2017-02-28 Chevron Phillips Chemical Company Lp Temperature control for polymerizing particulate polyolefin
CN106833784A (en) * 2017-04-16 2017-06-13 淄博赢信达知识产权咨询服务有限公司 Using radial direction samming H2The selexol process technique of S direct oxidation reactors

Patent Citations (262)

* Cited by examiner, † Cited by third party
Publication number Priority date Publication date Assignee Title
GB1134439A (en) 1966-10-19 1968-11-20 Shell Int Research Method and composition for detecting odorants in gaseous fuels
US4267458A (en) 1972-04-26 1981-05-12 Westinghouse Electric Corp. System and method for starting, synchronizing and operating a steam turbine with digital computer control
US4159239A (en) 1973-09-20 1979-06-26 Mobil Oil Corporation Catalytic cracking process
US4380146A (en) 1977-01-12 1983-04-19 Westinghouse Electric Corp. System and method for accelerating and sequencing industrial gas turbine apparatus and gas turbine electric power plants preferably with a digital computer control system
US4284494A (en) 1978-05-01 1981-08-18 Engelhard Minerals & Chemicals Corporation Control of emissions in FCC regenerator flue gas
US4411773A (en) 1980-12-18 1983-10-25 Mobil Oil Corporation Heat balance in FCC process and apparatus with downflow reactor riser
US4385985A (en) 1981-04-14 1983-05-31 Mobil Oil Corporation FCC Reactor with a downflow reactor riser
US4362614A (en) 1981-04-30 1982-12-07 Uop Inc. Mercaptan extraction process with recycled alkaline solution
EP0181744A1 (en) 1984-10-31 1986-05-21 Potash Corporation Of Saskatchewan Mining Limited Gravity pipe transport system
US4709546A (en) 1985-04-20 1987-12-01 Mtu Motoren-Und Turbinen-Union Gmbh Cooled gas turbine operable with a controlled cooling air quantity
US4902469A (en) 1986-05-05 1990-02-20 Westinghouse Electric Corp. Status tree monitoring and display system
US4795545A (en) 1987-09-17 1989-01-03 Uop Inc. Process for pretreatment of light hydrocarbons to remove sulfur, water, and oxygen-containing compounds
US4775460A (en) 1987-12-24 1988-10-04 Uop, Inc. Hydrocracking process with feed pretreatment
WO1990010083A1 (en) 1989-02-28 1990-09-07 Aktieselskabet Faxe Kalkbrud A method for controlling and/or monitoring biological processes
US5227121A (en) 1989-11-02 1993-07-13 Combustion Engineering, Inc. Advanced nuclear plant control room complex
US5077252A (en) 1990-07-17 1991-12-31 Mobil Oil Corporation Process for control of multistage catalyst regeneration with partial co combustion
US20020179495A1 (en) 1991-03-08 2002-12-05 Heyse John V. Apparatus for hydrocarbon processing
US5582684A (en) 1992-01-09 1996-12-10 Stfi Method of determining degree of reduction in a sulfate liquor using IR and UV spectroscopy
US5642296A (en) 1993-07-29 1997-06-24 Texas Instruments Incorporated Method of diagnosing malfunctions in semiconductor manufacturing equipment
US6038540A (en) 1994-03-17 2000-03-14 The Dow Chemical Company System for real-time economic optimizing of manufacturing process control
US5605435A (en) 1994-05-06 1997-02-25 Ingersoll-Rand Company Method and apparatus to achieve passive damping of flow disturbances in a centrifugal compressor to control compressor surge
US5666297A (en) 1994-05-13 1997-09-09 Aspen Technology, Inc. Plant simulation and optimization software apparatus and method using dual execution models
US6081230A (en) 1994-11-29 2000-06-27 Xanavi Informatics Corporation Navigation system furnished with means for estimating error of mounted sensor
US6983227B1 (en) 1995-01-17 2006-01-03 Intertech Ventures, Ltd. Virtual models of complex systems
US5817517A (en) 1995-02-08 1998-10-06 Exxon Research And Engineering Company Method of characterizing feeds to catalytic cracking process units
US5616214A (en) 1995-09-12 1997-04-01 Pulp And Paper Research Institute Of Canada Determination of sodium sulfide and sulfidity in green liquors and smelt solutions
US6271845B1 (en) 1998-05-29 2001-08-07 Hewlett Packard Company Method and structure for dynamically drilling down through a health monitoring map to determine the health status and cause of health problems associated with network objects of a managed network environment
US6230486B1 (en) 1998-12-17 2001-05-15 Honda Giken Kogyo Kabushiki Kaisha Plant control system
US6266605B1 (en) 1998-12-17 2001-07-24 Honda Giken Kogyo Kabushiki Plant control system
US20030036052A1 (en) 1999-07-09 2003-02-20 Regents Of The University Of California Sensor for analyzing components of fluids
US6392114B1 (en) 1999-12-30 2002-05-21 Uop Llc Solid catalyst alkylation process with regeneration section and hydrogen fractionation zone
WO2001060951A1 (en) 2000-02-16 2001-08-23 Indian Oil Corporation Limited A multi stage selective catalytic cracking process and a system for producing high yield of middle distillate products from heavy hydrocarbon feedstocks
US8352049B2 (en) 2000-03-10 2013-01-08 Smiths Detection Inc. Temporary expanding integrated monitoring network
US20060259163A1 (en) 2000-03-10 2006-11-16 Smiths Detection Inc. Temporary expanding integrated monitoring network
US7313447B2 (en) 2000-03-10 2007-12-25 Smiths Detection Inc. Temporary expanding integrated monitoring network
US7006889B2 (en) 2000-04-13 2006-02-28 Honeywell International Inc. Sensor placement and control design for distributed parameter systems
US20040220689A1 (en) 2000-04-13 2004-11-04 Anoop Mathur Sensor placement and control design for distributed parameter systems
US6772044B1 (en) 2000-04-13 2004-08-03 Honeywell International Inc. Sensor placement and control design for distributed parameter systems
US6760716B1 (en) 2000-06-08 2004-07-06 Fisher-Rosemount Systems, Inc. Adaptive predictive model in a process control system
US7925979B2 (en) 2000-09-15 2011-04-12 Invensys Systems, Inc. Extensible manufacturing/process control information portal server
US6982032B2 (en) 2001-01-09 2006-01-03 Aqua-Nova Llc Apparatus and method for biological treatment of environmental contaminants and waste
US7133807B2 (en) 2001-01-22 2006-11-07 Tokyo Electron Limited Apparatus productivity improving system and its method
US6795798B2 (en) 2001-03-01 2004-09-21 Fisher-Rosemount Systems, Inc. Remote analysis of process control plant data
US20020123864A1 (en) 2001-03-01 2002-09-05 Evren Eryurek Remote analysis of process control plant data
US20040204775A1 (en) 2001-03-01 2004-10-14 Keyes Marion A. Economic calculations in process control system
US20030223918A1 (en) 2001-03-23 2003-12-04 Cammy Neal E. FCC process and apparatus with automatic catalyst recycle control
US20040147036A1 (en) 2001-05-23 2004-07-29 Karl-Dieter Krenn Means and method for determining the content of sulfurous acid in liquids
US20040220778A1 (en) 2001-08-02 2004-11-04 Kanehisa Imai Remote maintenance system and stock management system
US20090204245A1 (en) 2001-08-10 2009-08-13 Rockwell Automation Technologies, Inc. System and method for dynamic multi-objective optimization of machine selection, integration and utilization
US20030105775A1 (en) 2001-11-30 2003-06-05 Mitsubishi Denki Kabushiki Kaisha Plant management system
US20030147351A1 (en) 2001-11-30 2003-08-07 Greenlee Terrill L. Equipment condition and performance monitoring using comprehensive process model based upon mass and energy conservation
US20050027721A1 (en) 2002-04-03 2005-02-03 Javier Saenz System and method for distributed data warehousing
US7151966B1 (en) 2002-06-04 2006-12-19 Rockwell Automation Technologies, Inc. System and methodology providing open interface and distributed processing in an industrial controller environment
US7067333B1 (en) 2002-06-28 2006-06-27 Advanced Micro Devices, Inc. Method and apparatus for implementing competing control models
US20040109788A1 (en) 2002-07-12 2004-06-10 Lixiong Li Apparatus and method for continuous depyrogenation and production of sterile water for injection
US7246039B2 (en) 2002-07-19 2007-07-17 Selex Communications Limited Fault diagnosis system
US8055371B2 (en) 2002-10-08 2011-11-08 Invensys Systems, Inc. Services portal
US20040079392A1 (en) 2002-10-28 2004-04-29 Kuechler Keith H. Process and apparatus for mitigating compressor fouling in a compressor system
US20050216209A1 (en) 2002-11-26 2005-09-29 Intercat Equipment, Inc. Method for monitoring a FCC catalyst injection system
US20040099572A1 (en) 2002-11-26 2004-05-27 Martin Evans FCC catalyst injection system having closed loop control
US20040122273A1 (en) 2002-12-19 2004-06-24 Kabin Jeffrey Alan Method and apparatus for controlling effluent composition in oxygenates to olefins conversion
US20040122936A1 (en) 2002-12-20 2004-06-24 Ge Mortgage Holdings, Llc Methods and apparatus for collecting, managing and presenting enterprise performance information
US20040148144A1 (en) 2003-01-24 2004-07-29 Martin Gregory D. Parameterizing a steady-state model using derivative constraints
US8354081B2 (en) 2003-04-04 2013-01-15 Texaco, Inc. Portable fuel processor apparatus and enclosure and method of installing same
US20040204913A1 (en) 2003-04-09 2004-10-14 Peter Mueller Optimizing service system
US20050029163A1 (en) 2003-08-04 2005-02-10 Warren Letzsch Process and apparatus for controlling catalyst temperature in a catalyst stripper
US20050098033A1 (en) 2003-11-12 2005-05-12 Kiran Mallavarapu Control of a hydrogen purifying pressure swing adsorption unit in fuel processor module for hydrogen generation
US20050133211A1 (en) 2003-12-19 2005-06-23 Osborn Mark D. Heat exchanger performance monitoring and analysis method and system
US20060020423A1 (en) 2004-06-12 2006-01-26 Fisher-Rosemount Systems, Inc. System and method for detecting an abnormal situation associated with a process gain of a control loop
US7567887B2 (en) 2004-09-10 2009-07-28 Exxonmobil Research And Engineering Company Application of abnormal event detection technology to fluidized catalytic cracking unit
WO2006044408A1 (en) 2004-10-14 2006-04-27 Shell Internationale Research Maatschappij B.V. A method and apparatus for monitoring and controlling the stability of a burner of a fired heater
US20060133412A1 (en) 2004-12-22 2006-06-22 Rockwell Automation Technologies, Inc. Integration of control and business applications using integration servers
US20060252642A1 (en) 2005-05-06 2006-11-09 Kanazirev Vladislav I Scavengers for removal of acid gases from fluid streams
US20070020154A1 (en) 2005-07-19 2007-01-25 Intercat Equipment, Inc. Catalyst withdrawal apparatus and method for regulating catalyst inventory in a fluid catalyst cracking unit
US20070059159A1 (en) 2005-09-13 2007-03-15 Gas Turbine Efficiency Ab System and method for augmenting power output from a gas turbine engine
US20070059838A1 (en) 2005-09-13 2007-03-15 Pavilion Technologies, Inc. Dynamic constrained optimization of chemical manufacturing
US20070091825A1 (en) 2005-10-21 2007-04-26 Honeywell International Inc. Wireless transmitter initiated communication methods
US20070091824A1 (en) 2005-10-21 2007-04-26 Honeywell International Inc. Wireless transmitter initiated communication systems
US8811231B2 (en) 2005-10-21 2014-08-19 Honeywell International Inc. Wireless transmitter initiated communication systems
US8644192B2 (en) 2005-10-21 2014-02-04 Honeywell International Inc. Wireless transmitter initiated communication methods
US20070185664A1 (en) 2006-01-30 2007-08-09 Nissan Motor Co., Ltd. Abnormal noise correction verification apparatus
US20070192078A1 (en) 2006-02-14 2007-08-16 Edsa Micro Corporation Systems and methods for real-time system monitoring and predictive analysis
WO2007095585A2 (en) 2006-02-14 2007-08-23 Edsa Micro Corporation Systems and methods for real-time system monitoring and predictive analysis
US20070212790A1 (en) 2006-03-13 2007-09-13 Marathon Petroleum Company Llc Method for monitoring feeds to catalytic cracking units by near-infrared spectroscopy
US7979192B2 (en) 2006-03-31 2011-07-12 Morrison Brian D Aircraft-engine trend monitoring system
US7936878B2 (en) 2006-04-10 2011-05-03 Honeywell International Inc. Secure wireless instrumentation network system
US20080130902A1 (en) 2006-04-10 2008-06-05 Honeywell International Inc. Secure wireless instrumentation network system
US20070250292A1 (en) 2006-04-21 2007-10-25 Perry Alagappan Application of abnormal event detection technology to delayed coking unit
US20070260656A1 (en) 2006-05-05 2007-11-08 Eurocopter Method and apparatus for diagnosing a mechanism
US8050889B2 (en) 2006-05-09 2011-11-01 Hsb Solomon Associates, Llc Performance analysis system and method
US7877596B2 (en) 2006-05-19 2011-01-25 Honeywell International Inc. Method and computer product to increase accuracy of time-based software verification for sensor networks
US7836941B2 (en) 2006-05-19 2010-11-23 Exxonmobil Research And Engineering Company Mitigation of in-tube fouling in heat exchangers using controlled mechanical vibration
US20070271452A1 (en) 2006-05-19 2007-11-22 Honeywell International Inc. Method and computer product to increase accuracy of time-based software verification for sensor networks
JP2008031940A (en) 2006-07-31 2008-02-14 Isuzu Motors Ltd Method for estimating catalyst deterioration quantity and device for estimating catalyst deterioration quantity
US7742833B1 (en) 2006-09-28 2010-06-22 Rockwell Automation Technologies, Inc. Auto discovery of embedded historians in network
US20080086322A1 (en) 2006-10-05 2008-04-10 Daniel John Wallace Method for automatic asset classification
US20100230324A1 (en) 2006-11-07 2010-09-16 Saudi Arabian Oil Company Control of Fluid Catalytic Cracking Process for Minimizing Additive Usage in the Desulfurization of Petroleum Feedstocks
US20080154434A1 (en) 2006-12-20 2008-06-26 Galloway Douglas B Catalytic Alloy Hydrogen Sensor Apparatus and Process
US20080217005A1 (en) 2007-03-07 2008-09-11 Honeywell International, Inc. Automated oil well test classification
US7415357B1 (en) 2007-03-07 2008-08-19 Honeywell International Inc. Automated oil well test classification
US20080282606A1 (en) 2007-04-16 2008-11-20 Plaza John P System and process for producing biodiesel
US20090060192A1 (en) 2007-09-04 2009-03-05 Honeywell International Inc. Method and apparatus for providing security in wireless communication networks
US8280057B2 (en) 2007-09-04 2012-10-02 Honeywell International Inc. Method and apparatus for providing security in wireless communication networks
US8428067B2 (en) 2007-09-04 2013-04-23 Honeywell International Inc. Method and apparatus for dynamic assignment of quality of service parameters in a communication network
US8458778B2 (en) 2007-09-04 2013-06-04 Honeywell International Inc. System, method, and apparatus for on-demand limited security credentials in wireless and other communication networks
US20090059786A1 (en) 2007-09-04 2009-03-05 Honeywell International Inc. Method and apparatus for dynamic assignment of quality of service parameters in a communication network
US20090064295A1 (en) 2007-09-04 2009-03-05 Honeywell International Inc. System, method, and apparatus for on-demand limited security credentials in wireless and other communication networks
WO2009046095A1 (en) 2007-10-01 2009-04-09 Iconics, Inc. Visualization of process control data
US20090201899A1 (en) 2008-02-08 2009-08-13 Honeywell International Inc. Apparatus and method for routing data in wireless networks
US8111619B2 (en) 2008-02-08 2012-02-07 Honeywell International Inc. Apparatus and method for routing data in wireless networks
US8571064B2 (en) 2008-04-01 2013-10-29 Honeywell International Inc. Method and apparatus for physical layer routing in a wireless device
US20090245286A1 (en) 2008-04-01 2009-10-01 Honeywell International Inc. Method and apparatus for physical layer routing in a wireless device
US7995526B2 (en) 2008-04-23 2011-08-09 Honeywell International Inc. Apparatus and method for medium access control in wireless communication networks
US20090268674A1 (en) 2008-04-23 2009-10-29 Honeywell International Inc. Apparatus and method for medium access control in wireless communication networks
US20100108567A1 (en) 2008-04-30 2010-05-06 Xyleco, Inc. Processing biomass and petroleum containing materials
US20090281677A1 (en) 2008-05-12 2009-11-12 Energy And Power Solutions, Inc. Systems and methods for assessing and optimizing energy use and environmental impact
US8128808B2 (en) 2008-06-12 2012-03-06 H R D Corporation Process for hydrodesulfurization, hydrodenitrogenation, hydrofinishing, or amine production
US8815152B2 (en) 2008-06-13 2014-08-26 Alt Bioscience, Llc Device for rapid determination of disease-associated thiol compounds
US20100014599A1 (en) 2008-07-16 2010-01-21 Honeywell International Inc. Apparatus and method for modifying transmissions on specified wireless channels to reduce interference with higher-priority transmitters
US8385436B2 (en) 2008-07-16 2013-02-26 Honeywell International Inc. Apparatus and method for modifying transmissions on specified wireless channels to reduce interference with higher-priority transmitters
US20120121376A1 (en) 2008-10-07 2012-05-17 Wilhelmus Hermanus Huis In Het Veld Method of controlling a compressor and apparatus therefor
US8630962B2 (en) 2008-10-09 2014-01-14 Hitachi, Ltd. Error detection method and its system for early detection of errors in a planar or facilities
US20100152900A1 (en) 2008-10-10 2010-06-17 Exxonmobil Research And Engineering Company Optimizing refinery hydrogen gas supply, distribution and consumption in real time
US20100125347A1 (en) 2008-11-19 2010-05-20 Harris Corporation Model-based system calibration for control systems
US8926737B2 (en) 2008-11-28 2015-01-06 Shell Oil Company Process for producing purified natural gas
US20100158764A1 (en) 2008-12-18 2010-06-24 Hedrick Brian W Apparatus for Improving Flow Properties of Crude Petroleum
US8204717B2 (en) 2009-04-01 2012-06-19 Honeywell International Inc. Cloud computing as a basis for equipment health monitoring service
US20100262900A1 (en) 2009-04-13 2010-10-14 Honeywell International Inc. Utilizing spreadsheet user interfaces with flowsheets of a cpi simulation system
US9053260B2 (en) 2009-04-13 2015-06-09 Honeywell International Inc. Utilizing spreadsheet user interfaces with flowsheets of a CPI simulation system
US20120259583A1 (en) 2009-06-22 2012-10-11 Johnson Controls Technology Company Automated fault detection and diagnostics in a building management system
US8244384B2 (en) 2009-11-12 2012-08-14 Honeywell International Inc. System identification in automated process control
US20110112659A1 (en) 2009-11-12 2011-05-12 Honeywell International Inc. System identification in automated process control
US20110152590A1 (en) 2009-12-17 2011-06-23 Uop Llc Solid catalyst hydrocarbon alkylation using stacked moving bed radial flow reactors
US20110152591A1 (en) 2009-12-17 2011-06-23 Uop Llc Solid catalyst hydrocarbon conversion process using stacked moving bed reactors
US20110311014A1 (en) 2010-06-21 2011-12-22 Chevron Phillips Chemical Company Lp System and method for closed relief of a polyolefin loop reactor system
US20130172643A1 (en) 2010-07-08 2013-07-04 Indian Oil Corporation Ltd. Two stage fluid catalytic cracking process and apparatus
US20120029966A1 (en) 2010-07-30 2012-02-02 Accenture Global Services Gmbh Monitoring and evaluating the production of a conversion facility
US20120083933A1 (en) 2010-09-30 2012-04-05 General Electric Company Method and system to predict power plant performance
US20120095808A1 (en) 2010-10-15 2012-04-19 Invensys Systems Inc. System and Method for Process Predictive Simulation
US20120104295A1 (en) 2010-10-29 2012-05-03 TapcoEnpro International Actuator control device and method
US20120123583A1 (en) 2010-11-16 2012-05-17 Mks Instruments, Inc. Controlling a Discrete-Type Manufacturing Process with a Multivariate Model
US20120197616A1 (en) 2011-01-28 2012-08-02 Honeywell Spol S.R.O. System for modeling parallel working units for advanced process control
US9134717B2 (en) 2011-01-28 2015-09-15 Honeywell International Inc. System for modeling parallel working units for advanced process control
US20150060331A1 (en) 2011-04-07 2015-03-05 Uop Llc Method for multi-staged hydroprocessing using quench
US20140179968A1 (en) 2011-05-24 2014-06-26 Chiyoda Corporation Producing method of monocyclic aromatic hydrocarbons and monocyclic aromatic hydrocarbon production plant
US20140163275A1 (en) 2011-05-24 2014-06-12 Chiyoda Corporation Producing method of monocyclic aromatic hydrocarbons and monocyclic aromatic hydrocarbon production plant
US8923882B2 (en) 2011-07-26 2014-12-30 Honeywell International Inc. Determining a deployment of a wireless network
US20130029587A1 (en) 2011-07-26 2013-01-31 Honeywell International Inc. Determining a deployment of a wireless network
US20130031960A1 (en) 2011-08-03 2013-02-07 John Crane Inc. Seal gas monitoring and control system
US9176498B2 (en) 2011-09-23 2015-11-03 Honeywell International Inc. Control that estimates delayed manipulated variables
US20130079899A1 (en) 2011-09-23 2013-03-28 Honeywell International Inc. Control That Estimates Delayed Manipulated Variables
US20130090088A1 (en) 2011-10-11 2013-04-11 Tangome, Inc. Seamlessly authenticating device users
US9166667B2 (en) 2011-10-12 2015-10-20 Honeywell International Inc. Antenna selection diversity scheme for zigbee or other wireless devices and related apparatus and method
US20130094422A1 (en) 2011-10-12 2013-04-18 Honeywell International Inc. Antenna selection diversity scheme for zigbee or other wireless devices and related apparatus and method
US20150077263A1 (en) 2012-03-01 2015-03-19 Nuovo Pignone Srl Method and system for condition monitoring of a group of plants
US20130253898A1 (en) 2012-03-23 2013-09-26 Power Analytics Corporation Systems and methods for model-driven demand response
US20130270157A1 (en) 2012-04-16 2013-10-17 Marcello Ferrara Method, apparatus and chemical products for treating petroleum equipment
US20130311437A1 (en) 2012-05-16 2013-11-21 Honeywell Internatioanl Inc. System and method for performance monitoring of a population of equipment
US20130327052A1 (en) 2012-06-12 2013-12-12 Genalta Power Inc. Exhaust system for gas turbines
US20140008035A1 (en) 2012-07-05 2014-01-09 Honeywell International Inc. Environmental control systems and techniques for monitoring heat exchanger fouling
US20140026598A1 (en) 2012-07-25 2014-01-30 Johnson Controls Technology Company Methods and controllers for providing a surge map for the monitoring and control of chillers
US20140074273A1 (en) 2012-09-10 2014-03-13 Honeywell International Inc. Handheld device rendering of plant model portion based on task
US9354631B2 (en) 2012-09-10 2016-05-31 Honeywell International Inc. Handheld device rendering of plant model portion based on task
WO2014042508A1 (en) 2012-09-12 2014-03-20 Universiti Sains Malaysia Wireless production monitoring system
US9580341B1 (en) 2012-09-22 2017-02-28 Biotta LLC Biological two-stage contaminated water treatment system and process
US20140114039A1 (en) 2012-10-18 2014-04-24 Chevron Phillips Chemical Company Lp System and method for catalyst preparation
US20150284641A1 (en) 2012-11-07 2015-10-08 Baozhen Shi Method and apparatus for controlling catalyst in reaction zones and purifying and cooling regenerated catalyst
US20140131027A1 (en) 2012-11-09 2014-05-15 Rolls-Royce Plc Heat exchange arrangement
US20150330571A1 (en) 2012-11-23 2015-11-19 L'air Liquide, Societe Anonyme Pour L'etude Et L'exploitation Des Procedes Georges Claude Method and device for filling a tank with liquefied gas
EP2746884A1 (en) 2012-12-24 2014-06-25 Air Products And Chemicals, Inc. Apparatus and methods to monitor and control cyclic process units in a steady plant environment
US20140212978A1 (en) 2013-01-28 2014-07-31 Fisher-Rosemount Systems, Inc. Systems and methods to monitor operating processes
US20140309756A1 (en) 2013-02-05 2014-10-16 Yokogawa Corporation Of America System, Method and Apparatus for Determining Properties of Product or Process Streams
WO2014123993A1 (en) 2013-02-05 2014-08-14 Yokogawa Corporation Of America System, method and apparatus for determining properties of product or process streams
US20140262949A1 (en) * 2013-03-18 2014-09-18 Allan G. Kem Method for automated temperature control of reactor system
US20140296058A1 (en) 2013-03-27 2014-10-02 Uop Llc Dehydrogenation reactor catalyst collector with hot hydrogen stripping zone
US20140294684A1 (en) 2013-03-28 2014-10-02 Uop Llc Apparatus for a Radial-Flow Reactor and Method for Assembly Thereof
US20140294683A1 (en) 2013-03-28 2014-10-02 Uop Llc Apparatus for a Radial-Flow Reactor and Method for Assembly Thereof
US20140337256A1 (en) 2013-05-08 2014-11-13 Vigilent Corporation Influence learning in an environmentally managed system
EP2801937A1 (en) 2013-05-09 2014-11-12 Rockwell Automation Technologies, Inc. Industrial device and system attestation in a cloud platform
US20140337277A1 (en) 2013-05-09 2014-11-13 Rockwell Automation Technologies, Inc. Industrial device and system attestation in a cloud platform
US20150059714A1 (en) 2013-09-05 2015-03-05 GM Global Technology Operations LLC Method of Operating an Internal Combustion Engine with a Turbocharger
US20150078970A1 (en) 2013-09-18 2015-03-19 Uop Llc Catalyst retainer for radial flow reactor
US20150098862A1 (en) 2013-10-07 2015-04-09 Uop Llc Radial Flow Process and Apparatus
US20160237910A1 (en) 2013-10-29 2016-08-18 Mitsubishi Hitachi Power Systems, Ltd. Temperature control device, gas turbine, temperature control method, and program
US20160313653A1 (en) 2013-12-05 2016-10-27 Asml Netherlands B.V. Method and Apparatus for Measuring a Structure on a Substrate, Models for Error Correction, Computer Program Products for Implementing such Methods and Apparatus
US20150158789A1 (en) 2013-12-06 2015-06-11 Paul F. Keusenkothen Methods and Systems for Producing Liquid Hydrocarbons
US20160363315A1 (en) 2013-12-31 2016-12-15 Clearsign Combustion Corporation Method and apparatus for extending flammability and stability limits in a combustion reaction
US20150185716A1 (en) 2013-12-31 2015-07-02 General Electric Company Methods and systems for enhancing control of power plant generating units
US20170058213A1 (en) 2014-02-25 2017-03-02 Saudi Basic Industries Corporation A method of controlling the supply and allocation of hydrogen gas in a hydrogen system of a refinery integrated iwth olefins and aromatics plants
US9751817B2 (en) 2014-03-07 2017-09-05 Uop Llc Combined reactor effluent and regenerant recirculation for detergent alkylation process
US20150276208A1 (en) 2014-03-26 2015-10-01 Rockwell Automation Technologies, Inc. Cloud-level analytics for boiler networks
US20170107188A1 (en) 2014-03-31 2017-04-20 Nippon Shokubai Co., Ltd. Process for producing ethylene oxide
US10107295B1 (en) 2014-05-21 2018-10-23 Marion Brecheisen Pump system and method
US20160033941A1 (en) 2014-07-31 2016-02-04 General Electric Company System and method for maintaining the health of a control system
US20160048119A1 (en) 2014-08-13 2016-02-18 Fisher-Rosemount Systems, Inc. Model predictive control using wireless process signals
US20170352899A1 (en) 2014-08-20 2017-12-07 Nissan Motor Co., Ltd Fuel cell system and control method for fuel cell system
US20160098037A1 (en) 2014-10-06 2016-04-07 Fisher-Rosemount Systems, Inc. Data pipeline for process control system anaytics
US20160098234A1 (en) 2014-10-07 2016-04-07 Videojet Technologies Inc. System and method for remotely servicing an industrial printer
US20160122663A1 (en) 2014-11-03 2016-05-05 Uop Llc Integrated hydrotreating and slurry hydrocracking process
US20160147204A1 (en) 2014-11-26 2016-05-26 General Electric Company Methods and systems for enhancing control of power plant generating units
US20180122021A1 (en) 2015-03-03 2018-05-03 Uop Llc Chemical refinery performance optimization
WO2016141128A1 (en) 2015-03-03 2016-09-09 Uop Llc Managing web-based refinery performance optimization
US20160260041A1 (en) 2015-03-03 2016-09-08 Uop Llc System and method for managing web-based refinery performance optimization using secure cloud computing
US20170315543A1 (en) 2015-03-30 2017-11-02 Uop Llc Evaluating petrochemical plant errors to determine equipment changes for optimized operations
US20190041813A1 (en) 2015-03-30 2019-02-07 Uop Llc Identifying and implementing refinery or petrochemical plant process performance improvements
US10180680B2 (en) 2015-03-30 2019-01-15 Uop Llc Tuning system and method for improving operation of a chemical plant with a furnace
US20160292188A1 (en) 2015-03-30 2016-10-06 Uop Llc Data cleansing system and method for inferring a feed composition
US20170323038A1 (en) 2015-03-30 2017-11-09 Uop Llc Cleansing system for a feed composition based on environmental factors
US20160291584A1 (en) 2015-03-30 2016-10-06 Uop Llc System and method for tuning process models
US9864823B2 (en) 2015-03-30 2018-01-09 Uop Llc Cleansing system for a feed composition based on environmental factors
US20180046155A1 (en) 2015-03-30 2018-02-15 Uop Llc Identifying and implementing refinery or petrochemical plant process performance improvements
US20160292325A1 (en) 2015-03-30 2016-10-06 Uop Llc Advanced data cleansing system and method
US10095200B2 (en) 2015-03-30 2018-10-09 Uop Llc System and method for improving performance of a chemical plant with a furnace
US20180121581A1 (en) 2015-03-30 2018-05-03 Uop Llc Cleansing system for a feed composition based on environmental factors
US20170009932A1 (en) 2015-07-08 2017-01-12 Ilseong Eng Co., Ltd. Automatic emergency lifting or lowering system for operational deployment facility
US20170082320A1 (en) 2015-09-22 2017-03-23 A.O. Smith Corporation Dual sensor combustion system
WO2017079058A1 (en) 2015-11-02 2017-05-11 Heartland Technology Partners Llc Apparatus for concentrating wastewater and for creating custom brines
US20190102966A1 (en) 2016-03-21 2019-04-04 Envirofit International, Inc. Methods and systems of liquefied petroleum gas distribution
US20170284410A1 (en) 2016-04-01 2017-10-05 Fisher-Rosemount Systems, Inc. Methods and apparatus for detecting and preventing compressor surge
US10222787B2 (en) 2016-09-16 2019-03-05 Uop Llc Interactive petrochemical plant diagnostic system and method for chemical process model analysis
US20180082569A1 (en) 2016-09-16 2018-03-22 Uop Llc Interactive diagnostic system and method for managing process model analysis
US20180081344A1 (en) 2016-09-16 2018-03-22 Uop Llc Interactive petrochemical plant diagnostic system and method for chemical process model analysis
US20190155259A1 (en) 2016-09-16 2019-05-23 Uop Llc Interactive Petrochemical Plant Diagnostic System and Method for Chemical Process Model Analysis
US20180155638A1 (en) 2016-11-21 2018-06-07 Saudi Arabian Oil Company Process and system for conversion of crude oil to petrochemicals and fuel products integrating steam cracking and conversion of naphtha into chemical rich reformate
US20180155642A1 (en) 2016-11-21 2018-06-07 Saudi Arabian Oil Company Process and system for conversion of crude oil to petrochemicals and fuel products integrating steam cracking, fluid catalytic cracking, and conversion of naphtha into chemical rich reformate
US20180197350A1 (en) 2017-01-10 2018-07-12 Honeywell International Inc. Aircraft maintenance systems and methods for ecs fouling predictions
US20180275692A1 (en) 2017-03-27 2018-09-27 Uop Llc Measuring and determining hot spots in slide valves for petrochemical plants or refineries
US20180275691A1 (en) 2017-03-27 2018-09-27 Uop Llc Early prediction and detection of slide valve sticking in petrochemical plants or refineries
US20180275690A1 (en) 2017-03-27 2018-09-27 Uop Llc Operating slide valves in petrochemical plants or refineries
US20180284705A1 (en) 2017-03-28 2018-10-04 Uop Llc Early surge detection of rotating equipment in a petrochemical plant or refinery
US20180283815A1 (en) 2017-03-28 2018-10-04 Uop Llc Detecting and correcting maldistribution in heat exchangers in a petrochemical plant or refinery
US20180283368A1 (en) 2017-03-28 2018-10-04 Uop Llc Determining quality of gas for rotating equipment in a petrochemical plant or refinery
US20180282634A1 (en) 2017-03-28 2018-10-04 Uop Llc Rotating equipment in a petrochemical plant or refinery
US20180280917A1 (en) 2017-03-28 2018-10-04 Uop Llc Air-cooled heat exchangers
US20180283818A1 (en) 2017-03-28 2018-10-04 Uop Llc Detecting and correcting fouling in heat exchangers
US20180283813A1 (en) 2017-03-28 2018-10-04 Uop Llc Wet-cooled heat exchanger
US20180283404A1 (en) 2017-03-28 2018-10-04 Uop Llc Reactor loop fouling monitor for rotating equipment in a petrochemical plant or refinery
US20180282635A1 (en) 2017-03-28 2018-10-04 Uop Llc Using molecular weight and invariant mapping to determine performance of rotating equipment in a petrochemical plant or refinery
US20190101336A1 (en) 2017-03-28 2019-04-04 Uop Llc Heat exchangers in a petrochemical plant or refinery
US20180283392A1 (en) 2017-03-28 2018-10-04 Uop Llc Determining quality of gas for rotating equipment in a petrochemical plant or refinery
US20180283816A1 (en) 2017-03-28 2018-10-04 Uop Llc Detecting and correcting cross-leakage in heat exchangers in a petrochemical plant or refinery
US20190151814A1 (en) 2017-03-28 2019-05-23 Uop Llc Detecting and correcting vibration in heat exchangers
US20180280914A1 (en) 2017-03-28 2018-10-04 Uop Llc Detecting and correcting problems in liquid lifting in heat exchangers
US20180286141A1 (en) 2017-03-28 2018-10-04 Uop Llc Sensor location for rotating equipment in a petrochemical plant or refinery
US20180283811A1 (en) 2017-03-28 2018-10-04 Uop Llc Strain gauges and detecting pre-leakage in heat exchangers in a petrochemical plant or refinery
US10328408B2 (en) 2017-03-28 2019-06-25 Uop Llc Detecting and correcting fouling in heat exchangers
US20180283812A1 (en) 2017-03-28 2018-10-04 Uop Llc Detecting and correcting vibration in heat exchangers
US20180282633A1 (en) 2017-03-28 2018-10-04 Uop Llc Rotating equipment in a petrochemical plant or refinery
US20190101342A1 (en) 2017-03-28 2019-04-04 Uop Llc Detecting and correcting thermal stresses in heat exchangers in a petrochemical plant or refinery
US10183266B2 (en) 2017-03-28 2019-01-22 Uop Llc Detecting and correcting vibration in heat exchangers
US20190015806A1 (en) 2017-04-28 2019-01-17 Uop Llc Catalyst Transfer Pipe Plug Detection
US20180311609A1 (en) 2017-04-28 2018-11-01 Uop Llc Remote monitoring of adsorber process units
US9968899B1 (en) 2017-04-28 2018-05-15 Uop Llc Catalyst transfer pipe plug detection
US20180363914A1 (en) 2017-06-19 2018-12-20 Uop Llc Remote monitoring of fired heaters
US20180362862A1 (en) 2017-06-19 2018-12-20 Uop Llc Catalyst Cycle Length Prediction Using Eigen Analysis
US20180364747A1 (en) 2017-06-20 2018-12-20 Uop Llc Incipient temperature excursion mitigation and control
US20190003978A1 (en) 2017-06-28 2019-01-03 Uop Llc Process and apparatus to detect mercaptans in a caustic stream
US20190002318A1 (en) 2017-06-28 2019-01-03 Uop Llc Process and apparatus for dosing nutrients to a bioreactor
US20190083920A1 (en) 2017-09-18 2019-03-21 Uop Llc Remote Monitoring of Pressure Swing Adsorption Units
US20190101907A1 (en) 2017-10-02 2019-04-04 Uop Llc Remote Monitoring of Chloride Treaters Using a Process Simulator Based Chloride Distribution Estimate
US20190108454A1 (en) 2017-10-05 2019-04-11 Honeywell International Inc. Harnessing machine learning & data analytics for a real time predictive model for a fcc pre-treatment unit
US20190120810A1 (en) 2017-10-20 2019-04-25 Honeywell International Inc. System and method to optimize crude oil distillation or other processing by inline analysis of crude oil properties

Non-Patent Citations (15)

* Cited by examiner, † Cited by third party
Title
2001 Control systems of chemical and technological processes, Bespalov A. V. et al, pp. 508-509.
Bespalov A. V. et al., Control systems of chemical and technological processes, pp. 508-509 (2001) (Russian).
Chistof Huber, Density and Concentration Measurement Application for Novel MEMS-based Micro Densitometer for Gas, [online], 2016, [retrieved on Jun. 19, 2019]. Retrieved from <https://www.ama-science.org/proceedings/getFile/ZwZ1 BD==> (Year: 2016).
Daniel Goebel, Dry Gas Seal Contamination During Operation and Pressurization Hold, [online], Feb. 2016, [retrieved on Jun. 19, 2019]. Retrieved from <https ://core.ac.uk/download/pdf/84815277. pdf> (Year: 2016).
Dec. 27, 2018-PCT/U.S. Notice of Publication-App 2018/038286.
Dec. 27, 2018—PCT/U.S. Notice of Publication—App 2018/038286.
EnergyMEDOR®, Product brochure (Nov. 2014).
Lotters, Real-time Composition Determination of Gas Mixtures, [online], 2015, [retrieved on Jun. 19, 2019]. Retrieved from <https:// www .ama-science.org/proceedings/getFile/ZwNOZj==> (Year: 2015).
Maybeck, Peter S., "Stochastic models, estimation, and control," vol. 1, Academic Press (1979), 19 pages.
Nov. 29, 2018-PCT/U.S. International Search Report-App 2018/038286.
Nov. 29, 2018—PCT/U.S. International Search Report—App 2018/038286.
Nov. 29, 2018-PCT/U.S. Notification of Transmittal of the International Search Report-App 2018/038286.
Nov. 29, 2018—PCT/U.S. Notification of Transmittal of the International Search Report—App 2018/038286.
Oct. 4, 2018-PCT/U.S. Notification of Receipt of Search Copy-App 2018/038286.
Oct. 4, 2018—PCT/U.S. Notification of Receipt of Search Copy—App 2018/038286.

Cited By (1)

* Cited by examiner, † Cited by third party
Publication number Priority date Publication date Assignee Title
US20220127173A1 (en) * 2020-10-26 2022-04-28 Northwest A&F University System and method for total volume treatment of landfill leachate and use thereof

Also Published As

Publication number Publication date
EP3642678A1 (en) 2020-04-29
CN110753888A (en) 2020-02-04
WO2018236869A1 (en) 2018-12-27
EP3642678A4 (en) 2021-03-03
US20180364747A1 (en) 2018-12-20

Similar Documents

Publication Publication Date Title
US10739798B2 (en) Incipient temperature excursion mitigation and control
US10913905B2 (en) Catalyst cycle length prediction using eigen analysis
US10663238B2 (en) Detecting and correcting maldistribution in heat exchangers in a petrochemical plant or refinery
US11396002B2 (en) Detecting and correcting problems in liquid lifting in heat exchangers
US10328408B2 (en) Detecting and correcting fouling in heat exchangers
US10670353B2 (en) Detecting and correcting cross-leakage in heat exchangers in a petrochemical plant or refinery
US10518240B2 (en) Detecting and correcting vibration in heat exchangers
US11194317B2 (en) Remote monitoring of chloride treaters using a process simulator based chloride distribution estimate
US9968899B1 (en) Catalyst transfer pipe plug detection
US10794644B2 (en) Detecting and correcting thermal stresses in heat exchangers in a petrochemical plant or refinery
US10684631B2 (en) Measuring and determining hot spots in slide valves for petrochemical plants or refineries
US20180283811A1 (en) Strain gauges and detecting pre-leakage in heat exchangers in a petrochemical plant or refinery
US20180283813A1 (en) Wet-cooled heat exchanger
US8121817B2 (en) Abnormal event detection using principal component analysis
US20080082295A1 (en) Abnormal situation prevention in a coker heater
RU2764214C1 (en) Evaluation of the service life of the cyclone based on the remaining thickness of the abrasion-resistant lining
US10953377B2 (en) Delta temperature control of catalytic dehydrogenation process reactors
US20140262949A1 (en) Method for automated temperature control of reactor system
US20200103836A1 (en) Generating actionable plant tasks from two or more operational data sources

Legal Events

Date Code Title Description
FEPP Fee payment procedure

Free format text: ENTITY STATUS SET TO UNDISCOUNTED (ORIGINAL EVENT CODE: BIG.); ENTITY STATUS OF PATENT OWNER: LARGE ENTITY

AS Assignment

Owner name: UOP LLC, ILLINOIS

Free format text: ASSIGNMENT OF ASSIGNORS INTEREST;ASSIGNORS:CHARR, JORGE;EIZENGA, DONALD;OHACO, RAUL A.;AND OTHERS;SIGNING DATES FROM 20180427 TO 20180607;REEL/FRAME:046283/0563

STPP Information on status: patent application and granting procedure in general

Free format text: DOCKETED NEW CASE - READY FOR EXAMINATION

STPP Information on status: patent application and granting procedure in general

Free format text: NON FINAL ACTION MAILED

STPP Information on status: patent application and granting procedure in general

Free format text: NOTICE OF ALLOWANCE MAILED -- APPLICATION RECEIVED IN OFFICE OF PUBLICATIONS

STPP Information on status: patent application and granting procedure in general

Free format text: PUBLICATIONS -- ISSUE FEE PAYMENT RECEIVED

STCF Information on status: patent grant

Free format text: PATENTED CASE

MAFP Maintenance fee payment

Free format text: PAYMENT OF MAINTENANCE FEE, 4TH YEAR, LARGE ENTITY (ORIGINAL EVENT CODE: M1551); ENTITY STATUS OF PATENT OWNER: LARGE ENTITY

Year of fee payment: 4