KR20100042293A - System and methods for continuous, online monitoring of a chemical plant or refinery - Google Patents
System and methods for continuous, online monitoring of a chemical plant or refinery Download PDFInfo
- Publication number
- KR20100042293A KR20100042293A KR1020107005743A KR20107005743A KR20100042293A KR 20100042293 A KR20100042293 A KR 20100042293A KR 1020107005743 A KR1020107005743 A KR 1020107005743A KR 20107005743 A KR20107005743 A KR 20107005743A KR 20100042293 A KR20100042293 A KR 20100042293A
- Authority
- KR
- South Korea
- Prior art keywords
- data
- continuous
- model
- time
- near real
- Prior art date
- Legal status (The legal status is an assumption and is not a legal conclusion. Google has not performed a legal analysis and makes no representation as to the accuracy of the status listed.)
- Withdrawn
Links
Images


Classifications
-
- G—PHYSICS
- G05—CONTROLLING; REGULATING
- G05B—CONTROL OR REGULATING SYSTEMS IN GENERAL; FUNCTIONAL ELEMENTS OF SUCH SYSTEMS; MONITORING OR TESTING ARRANGEMENTS FOR SUCH SYSTEMS OR ELEMENTS
- G05B23/00—Testing or monitoring of control systems or parts thereof
- G05B23/02—Electric testing or monitoring
- G05B23/0205—Electric testing or monitoring by means of a monitoring system capable of detecting and responding to faults
- G05B23/0208—Electric testing or monitoring by means of a monitoring system capable of detecting and responding to faults characterized by the configuration of the monitoring system
- G05B23/0216—Human interface functionality, e.g. monitoring system providing help to the user in the selection of tests or in its configuration
-
- G—PHYSICS
- G05—CONTROLLING; REGULATING
- G05B—CONTROL OR REGULATING SYSTEMS IN GENERAL; FUNCTIONAL ELEMENTS OF SUCH SYSTEMS; MONITORING OR TESTING ARRANGEMENTS FOR SUCH SYSTEMS OR ELEMENTS
- G05B23/00—Testing or monitoring of control systems or parts thereof
- G05B23/02—Electric testing or monitoring
- G05B23/0205—Electric testing or monitoring by means of a monitoring system capable of detecting and responding to faults
- G05B23/0218—Electric testing or monitoring by means of a monitoring system capable of detecting and responding to faults characterised by the fault detection method dealing with either existing or incipient faults
- G05B23/0221—Preprocessing measurements, e.g. data collection rate adjustment; Standardization of measurements; Time series or signal analysis, e.g. frequency analysis or wavelets; Trustworthiness of measurements; Indexes therefor; Measurements using easily measured parameters to estimate parameters difficult to measure; Virtual sensor creation; De-noising; Sensor fusion; Unconventional preprocessing inherently present in specific fault detection methods like PCA-based methods
-
- G—PHYSICS
- G05—CONTROLLING; REGULATING
- G05B—CONTROL OR REGULATING SYSTEMS IN GENERAL; FUNCTIONAL ELEMENTS OF SUCH SYSTEMS; MONITORING OR TESTING ARRANGEMENTS FOR SUCH SYSTEMS OR ELEMENTS
- G05B23/00—Testing or monitoring of control systems or parts thereof
- G05B23/02—Electric testing or monitoring
- G05B23/0205—Electric testing or monitoring by means of a monitoring system capable of detecting and responding to faults
- G05B23/0218—Electric testing or monitoring by means of a monitoring system capable of detecting and responding to faults characterised by the fault detection method dealing with either existing or incipient faults
- G05B23/0224—Process history based detection method, e.g. whereby history implies the availability of large amounts of data
- G05B23/024—Quantitative history assessment, e.g. mathematical relationships between available data; Functions therefor; Principal component analysis [PCA]; Partial least square [PLS]; Statistical classifiers, e.g. Bayesian networks, linear regression or correlation analysis; Neural networks
-
- G—PHYSICS
- G05—CONTROLLING; REGULATING
- G05B—CONTROL OR REGULATING SYSTEMS IN GENERAL; FUNCTIONAL ELEMENTS OF SUCH SYSTEMS; MONITORING OR TESTING ARRANGEMENTS FOR SUCH SYSTEMS OR ELEMENTS
- G05B23/00—Testing or monitoring of control systems or parts thereof
- G05B23/02—Electric testing or monitoring
- G05B23/0205—Electric testing or monitoring by means of a monitoring system capable of detecting and responding to faults
- G05B23/0218—Electric testing or monitoring by means of a monitoring system capable of detecting and responding to faults characterised by the fault detection method dealing with either existing or incipient faults
- G05B23/0243—Electric testing or monitoring by means of a monitoring system capable of detecting and responding to faults characterised by the fault detection method dealing with either existing or incipient faults model based detection method, e.g. first-principles knowledge model
- G05B23/0254—Electric testing or monitoring by means of a monitoring system capable of detecting and responding to faults characterised by the fault detection method dealing with either existing or incipient faults model based detection method, e.g. first-principles knowledge model based on a quantitative model, e.g. mathematical relationships between inputs and outputs; functions: observer, Kalman filter, residual calculation, Neural Networks
-
- G—PHYSICS
- G05—CONTROLLING; REGULATING
- G05B—CONTROL OR REGULATING SYSTEMS IN GENERAL; FUNCTIONAL ELEMENTS OF SUCH SYSTEMS; MONITORING OR TESTING ARRANGEMENTS FOR SUCH SYSTEMS OR ELEMENTS
- G05B23/00—Testing or monitoring of control systems or parts thereof
- G05B23/02—Electric testing or monitoring
- G05B23/0205—Electric testing or monitoring by means of a monitoring system capable of detecting and responding to faults
- G05B23/0259—Electric testing or monitoring by means of a monitoring system capable of detecting and responding to faults characterized by the response to fault detection
- G05B23/0267—Fault communication, e.g. human machine interface [HMI]
-
- G—PHYSICS
- G05—CONTROLLING; REGULATING
- G05B—CONTROL OR REGULATING SYSTEMS IN GENERAL; FUNCTIONAL ELEMENTS OF SUCH SYSTEMS; MONITORING OR TESTING ARRANGEMENTS FOR SUCH SYSTEMS OR ELEMENTS
- G05B23/00—Testing or monitoring of control systems or parts thereof
- G05B23/02—Electric testing or monitoring
- G05B23/0205—Electric testing or monitoring by means of a monitoring system capable of detecting and responding to faults
- G05B23/0259—Electric testing or monitoring by means of a monitoring system capable of detecting and responding to faults characterized by the response to fault detection
- G05B23/0283—Predictive maintenance, e.g. involving the monitoring of a system and, based on the monitoring results, taking decisions on the maintenance schedule of the monitored system; Estimating remaining useful life [RUL]
-
- G—PHYSICS
- G06—COMPUTING OR CALCULATING; COUNTING
- G06Q—INFORMATION AND COMMUNICATION TECHNOLOGY [ICT] SPECIALLY ADAPTED FOR ADMINISTRATIVE, COMMERCIAL, FINANCIAL, MANAGERIAL OR SUPERVISORY PURPOSES; SYSTEMS OR METHODS SPECIALLY ADAPTED FOR ADMINISTRATIVE, COMMERCIAL, FINANCIAL, MANAGERIAL OR SUPERVISORY PURPOSES, NOT OTHERWISE PROVIDED FOR
- G06Q50/00—Information and communication technology [ICT] specially adapted for implementation of business processes of specific business sectors, e.g. utilities or tourism
- G06Q50/10—Services
-
- G—PHYSICS
- G05—CONTROLLING; REGULATING
- G05B—CONTROL OR REGULATING SYSTEMS IN GENERAL; FUNCTIONAL ELEMENTS OF SUCH SYSTEMS; MONITORING OR TESTING ARRANGEMENTS FOR SUCH SYSTEMS OR ELEMENTS
- G05B2219/00—Program-control systems
- G05B2219/30—Nc systems
- G05B2219/31—From computer integrated manufacturing till monitoring
- G05B2219/31477—Display correlated data so as to represent the degree of correlation
-
- G—PHYSICS
- G05—CONTROLLING; REGULATING
- G05B—CONTROL OR REGULATING SYSTEMS IN GENERAL; FUNCTIONAL ELEMENTS OF SUCH SYSTEMS; MONITORING OR TESTING ARRANGEMENTS FOR SUCH SYSTEMS OR ELEMENTS
- G05B2219/00—Program-control systems
- G05B2219/30—Nc systems
- G05B2219/31—From computer integrated manufacturing till monitoring
- G05B2219/31478—Display all processes together or select only one
Landscapes
- Engineering & Computer Science (AREA)
- Physics & Mathematics (AREA)
- General Physics & Mathematics (AREA)
- Automation & Control Theory (AREA)
- Mathematical Physics (AREA)
- Evolutionary Computation (AREA)
- Artificial Intelligence (AREA)
- Human Computer Interaction (AREA)
- Business, Economics & Management (AREA)
- Tourism & Hospitality (AREA)
- Human Resources & Organizations (AREA)
- General Business, Economics & Management (AREA)
- Strategic Management (AREA)
- Theoretical Computer Science (AREA)
- Primary Health Care (AREA)
- Marketing (AREA)
- General Health & Medical Sciences (AREA)
- Economics (AREA)
- Health & Medical Sciences (AREA)
- Testing And Monitoring For Control Systems (AREA)
- Automatic Analysis And Handling Materials Therefor (AREA)
Abstract
연속적인 화학 공정 설비에서 복수의 작업을 연속해서 온라인 모니터링하기 위한 실시간에 가까운 시스템 및 방법이 개시된다. 작업을 모니터하는 방법은 오프라인에서 선택된 공정 특이적 실제 공정 데이터를 사용하여 개발한 다변량 통계 모델을 기반으로 한다. 이러한 모델은 화학적 제조 설비 또는 정제소의 연속 작업을 원거리 위치에서 실시간으로 모니터하는 온라인 모니터링 시스템에 의해 사용된다. 이러한 실시간 모니터링은 복수의 작업 중 하나 이상이 정상 작업 매개변수 내에서 작동하는지를 측정할 수 있게 해준다. 이러한 실시간 연속적인 모니터링 시스템은 연속 생산 공정 내의 급박한 고장 또는 장애 지점을 예상하거나 또는 연속 화학 제조 공정에서 발생할 수 있는 파괴적 공정 고정을 최소화하는데 사용될 수 있다. 예상 공정 고장과 가장 관련성이 있는 공정 변수 또는 "태그"는 상기 모델 시스템에 의해 동정될 수 있어, 값비싼 생산 정지시간을 야기할 수 있는 실제 공정 고장 발생을 방지하도록 적당한 제어 작용을 취할 수 있다. A near real-time system and method is disclosed for continuously online monitoring of a plurality of operations in a continuous chemical process facility. The method of monitoring work is based on a multivariate statistical model developed using process specific actual process data selected offline. This model is used by an online monitoring system that monitors the continuous operation of a chemical manufacturing facility or refinery in real time at a remote location. This real-time monitoring allows you to measure whether one or more of the multiple jobs is operating within normal job parameters. Such real-time continuous monitoring systems can be used to anticipate imminent failure or failure points in a continuous production process or to minimize disruptive process fixation that may occur in a continuous chemical manufacturing process. Process variables or “tags” that are most relevant to expected process failures can be identified by the model system, so that appropriate control actions can be taken to prevent the occurrence of actual process failures that can result in costly downtime.
Description
본 발명은 화학 플랜트 또는 정제소의 연속적인 온라인 모니터링을 위한 방법, 더 상세하게는 화학 플랜트, 정제소 및 이와 유사한 생산 설비의 연속 작업 동안, 공정의 장애 또는 다른 위험 발생을 예측 및/또는 예방하기 위해 일시적인 작업을 모니터링하는 실시간에 가까운 시스템 및 방법에 관한 것이다.The present invention provides a method for the continuous on-line monitoring of a chemical plant or refinery, more specifically during the continuous operation of a chemical plant, refinery and similar production equipment, to provide temporary and predictive measures for predicting and / or preventing the occurrence of process failures or other hazards. It relates to a near real-time system and method of monitoring work.
현대 화학 플랜트 및 정제소의 모니터링은 일반적으로 다양한 공정 변수가 측정 및 기록되는 시스템을 수반한다. 이러한 시스템은 종종 데이터를 대량 생산하고, 이 중에서 비교적 소량만이 유해하거나 다른 바람직하지 않은 결과를 야기할 수 있는 플랜트의 이상 상태를 실제로 추적하여 검출하는데 사용된다. 이러한 이상 상태는 다양한 공정 변수들에 대해 모여진 정보를 더 많이 이용할 수 있다면 더 빠르게 검출할 수 있을 것이다.Monitoring of modern chemical plants and refineries generally involves a system in which various process variables are measured and recorded. Such systems are often used to mass produce data, of which only relatively small amounts are actually used to track down and detect abnormal conditions in the plant that can cause harmful or other undesirable consequences. Such anomalies will be detected faster if more aggregated information is available for various process variables.
공정 모니터링은 제조업자들이 품질 향상, 생산 증가 및 비용 감소를 동시에 달성하기 위해 노력하는 바, 관심이 증가하고 있는 분야이다. 이러한 모니터링은 일반적으로 작업 또는 플랜트의 개별적인 분리된 구성요소를 수반한다. 다변량 통계 분석 방법은 본 명세서에 기술된 바와 같이 적용될 때, 전체 제조 플랜트 내의 모든 관련 공정에서 모여진 다량의 데이터를 취급할 수 있다.Process monitoring is an area of increasing interest as manufacturers strive to simultaneously achieve quality improvements, increased production and reduced costs. Such monitoring usually involves individual separate components of the work or plant. Multivariate statistical analysis methods, when applied as described herein, can handle large amounts of data gathered at all relevant processes within an entire manufacturing plant.
화학 생산 산업 외에, 예컨대 강철, 목재 제품 및 펄프/종이 산업과 같은 제조 산업은 관련 공정들에서 모여진 다량의 데이터에 상기 다변량 통계 분석 방법을 적용하기 시작했다. 이러한 한 예는, 제강 플랜트의 한 구역에서 성형 후 고형화된 강철 외피의 파열을 야기할 수 있는 이상에 대해 주조 공정을 모니터하기 위해 다변량 통계 모니터링, 구체적으로 주요 성분 분석(Principal Component Analysis; PCA)을 이용하는 미국 특허 6,564,119에 기술되어 있다. 온라인 모니터링의 다른 예는 미국 특허 6,607,577 B2에서 찾아볼 수 있다. 이 경우에, 다변량 통계 모델은 고온 금속 탈황 공정에서 시약 사용량을 결정하는데 사용되었다. 이 시스템은 컴퓨터에서 수행되었고, 적응 PLS(Projection to Latent Structures) 모델을 이용하여 목표 황 농도를 충족하는데 필요한 탈황 시약의 양을 추정했다.In addition to the chemical production industry, manufacturing industries, such as the steel, wood products and pulp / paper industries, have begun to apply the multivariate statistical analysis method to large amounts of data gathered in related processes. One such example is multivariate statistical monitoring, specifically Principal Component Analysis (PCA), to monitor the casting process for abnormalities that may cause rupture of the solidified steel shell after molding in a section of the steelmaking plant. It is described in US Pat. No. 6,564,119. Another example of online monitoring can be found in US Pat. No. 6,607,577 B2. In this case, a multivariate statistical model was used to determine reagent usage in the hot metal desulfurization process. The system was run on a computer and an adaptive Projection to Latent Structures (PLS) model was used to estimate the amount of desulfurization reagent needed to meet the target sulfur concentration.
또한, 배취식(batch) 공정 모니터링 및 결함(fault) 진단을 위한 다변량 통계 공정 제어(SPC) 모니터링 기술의 사용은 특허문헌 및 과학전문지에 소개되었다. 맥그리거와 그의 동료들[Chemometrics Intell. Lab. Systems, Vol. 51(1); pp. 125-137(2000)]은 다변량 SPC 기술 및 멀티블록 PLS 알고리듬을 이용한 공정 개발 및 최적화를 위해 배취식 및 반배취식 공정 변동 궤도를 분석하는 신규 방법을 제안했다. 미국 특허 6,885,907 B1(Zhang et al.)은 연속 강철 주조 공정에서 일시적인 작업을 온라인 모니터링하는 실시간에 가까운 시스템 및 방법을 소개한다. 다른 다수의 문헌들도 산업 생산 설비에서 특정 공정을 모니터링하는 다수의 통계 알고리듬과 시도들을 제안하고 있다.In addition, the use of multivariate statistical process control (SPC) monitoring techniques for batch process monitoring and fault diagnosis has been introduced in the patent literature and scientific journals. McGregor and his colleagues [Chemometrics Intell. Lab. Systems, Vol. 51 (1); pp. 125-137 (2000) proposed a new method for analyzing batch and semibatch process variation trajectories for process development and optimization using multivariate SPC technology and multiblock PLS algorithms. US Pat. No. 6,885,907 B1 (Zhang et al.) Introduces a near real-time system and method for online monitoring of temporary work in a continuous steel casting process. Many other documents also suggest a number of statistical algorithms and attempts to monitor specific processes in industrial production facilities.
공정 데이터와 관련된 특정 통계 분석 방법은 배취식 공정 모니터링을 이용해서 플랜트 또는 정제소 내의 개별 공정들에 적용되었지만, 다변량 통계 방법의 개발과 성공적인 사용에 대한 장애는 전체 화학 제조 플랜트 또는 정제소에서 연속 방식의 수행을 방해했다. 이러한 장애는 플랜트의 한 섹션만이 모니터될 때 수반되는 도전을 뛰어넘어, 다양한 종류의 혼란 또는 불균형이 플랜트 전반의 다수의 위치에서 발생할 수 있는 바, 통계 분석에 사용할 수 있는 데이터가 거의 없거나 전혀 없을 때 문제의 위치 및 확인을 매우 어렵게 만든다. 따라서, 화학 플랜트 또는 정제소의 거의 전체에서의 통합 공정을 연속적이며 거의 실시간으로 모니터링하는 방법이 필요한 실정이다. 또한, 시작부터 끝까지 플랜트 내의 단위조작들 간에 통합된 연속적인 온라인 모니터링 시스템도 필요한 실정이다.Although certain statistical analysis methods relating to process data have been applied to individual processes in a plant or refinery using batch process monitoring, the obstacle to the development and successful use of multivariate statistical methods is the continuous performance of the entire chemical manufacturing plant or refinery. Disturbed. These obstacles go beyond the challenges associated with monitoring only one section of the plant, with little or no data available for statistical analysis, as various kinds of confusion or imbalance can occur in multiple locations throughout the plant. It makes the location and identification of problems very difficult. Therefore, there is a need for a continuous and near real-time method of monitoring the integration process in almost the entire chemical plant or refinery. There is also a need for a continuous on-line monitoring system integrated between unit operations in the plant from start to finish.
본 발명은 개략적으로 화학 생산 플랜트 또는 화학 제조 공정, 예컨대 산화에틸렌/에틸렌 글리콜 생산 등을 모니터하여, 제조 공정 동안 실시간으로 또는 거의 실시간으로 문제를 예측하기 위한 실시간에 가까운 연속 시스템 및 방법에 관한 것이다. The present invention relates generally to near real-time continuous systems and methods for monitoring chemical production plants or chemical manufacturing processes such as ethylene oxide / ethylene glycol production and the like to predict problems in real time or near real time during the manufacturing process.
본 발명의 한 관점에 따르면, 화학 생산 설비에서 작업을 연속해서 거의 실시간으로 모니터링하는 방법으로, 선택된 다수의 공정 변수들의 사실적인 공정 데이터를 회수하는 단계, 공정 변수들의 PLS 분석을 이용해서 다변량 통계 모델을 개발하는 단계, 이 모델의 모니터링 한계를 측정하는 단계, 모델을 확인하는 단계, 및 이 모델을 생산 공정 내의 모든 공유 공정들을 연결하여, 연속 모니터링을 위해 상기 모델을 온라인으로 실행시키는 단계를 포함하는 방법을 제공한다. According to one aspect of the invention, a method of continuously monitoring a job in a chemical production facility in near real time, recovering realistic process data of a plurality of selected process variables, multivariate statistical model using PLS analysis of process variables Developing a model, measuring a monitoring limit of the model, identifying a model, and connecting all the shared processes in the production process to run the model online for continuous monitoring. Provide a method.
이하 도면은 본 명세서의 일부로서, 본 발명의 특정 관점을 더 상세하게 입증하기 위한 것이다. 본 발명은 이러한 하나 이상의 도면과 함께 본 명세서에 제시된 특정 양태들의 상세한 설명을 참조로 하면 더 잘 이해될 것이다.
도 1은 본 발명의 전체 시스템의 모식도이다.
도 2는 본 발명의 한 관점에 따라 연속해서 또는 거의 연속해서 작업하는 산업 공정에서 작업의 모니터링에 적용된, 모델 제작, 실행 및 온라인 모니터링을 위한 방법의 블록 다이아그램이다.
도 3은 본 발명의 모델 제작 및 개발 모듈에서 선택된 사실적인 데이터에 적용되는 단계들을 개략한 흐름도이다.
도 4는 본 발명의 한 관점에 따라, 온라인 시스템의 기본 구성요소들을 예시한 모식도이다.
도 5는 본 발명의 한 관점에 따라 공정 정보의 구성 및 흐름을 예시한 모식도이다.
도 6은 본 발명의 방법에 따라 작업하는 산업 생산 설비의 전형적인 전체보기(overview) 화상 맵 화면을 예시한 것이다.
도 7은 개별 플랜트 섹션의 예시적인 다변량 전체보기 스크린을 예시한 것이다.
도 8a 내지 8c는 도 7에 도시된 X-일관성(XCon 또는 SPEx)에 대한 다변량 통계 공정 제어(MSPC) 플롯, 범위 기여 선택 옵션, 및 상대적 기여 선택 옵션을 예시한 것이다.
도 9는 각 모델 태그의 기여를 나타내는, 도 8b 그래프에서 선택된 시간 범위에 대한 기여 막대 플롯을 설명한 것이다.
도 10은 도 9의 기여 막대 플롯으로부터 선택된 태그의 예시적인 시간 추세를 예시한 것이다.
도 11은 화학 생산 플랜트에서 본 발명의 모니터링 시스템을 실행시키기 위한 개략적인 컴퓨터 네트워크 시스템 구성이다.
여기에 개시된 본 발명은 다양한 변형과 대안적 형태들에 민감하지만, 몇몇 특정 양태들만이 도면에 예시적으로 도시해서 이하에 더 상세하게 설명될 것이다. 도면과 이러한 특정 양태들의 상세한 설명은 본 발명의 구상의 범위 또는 영역 또는 첨부되는 청구의 범위를 임의의 방식으로 제한하려는 것이 아니다. 오히려, 도면과 상세한 설명은 본 발명의 개념을 당업자에게 예증하고, 당업자가 본 발명의 개념을 만들어 이용할 수 있도록 한 것이다.The following drawings, as part of this specification, are intended to demonstrate in more detail certain aspects of the invention. The present invention will be better understood with reference to the detailed description of specific aspects presented herein in conjunction with one or more of these drawings.
1 is a schematic diagram of the entire system of the present invention.
2 is a block diagram of a method for model building, execution and online monitoring, applied to the monitoring of work in an industrial process working continuously or nearly continuously in accordance with an aspect of the present invention.
3 is a flow diagram that outlines the steps applied to the factual data selected in the model building and development module of the present invention.
4 is a schematic diagram illustrating the basic components of an online system, in accordance with an aspect of the present invention.
5 is a schematic diagram illustrating a configuration and flow of process information according to an aspect of the present invention.
6 illustrates a typical overview image map screen of an industrial production facility working in accordance with the method of the present invention.
7 illustrates an exemplary multivariate overview screen of individual plant sections.
8A-8C illustrate multivariate statistical process control (MSPC) plots, range contribution selection options, and relative contribution selection options for X-consistency (XCon or SPEx) shown in FIG. 7.
9 illustrates the contribution bar plot for the time range selected in the FIG. 8B graph, showing the contribution of each model tag.
FIG. 10 illustrates an exemplary time trend of a tag selected from the contribution bar plot of FIG. 9.
11 is a schematic computer network system configuration for implementing the monitoring system of the present invention in a chemical production plant.
While the invention disclosed herein is susceptible to various modifications and alternative forms, only a few specific aspects are illustrated in the drawings and will be described in greater detail below. The drawings and detailed description of these specific aspects are not intended in any way to limit the scope or scope of the inventive concept or the appended claims. Rather, the drawings and detailed description illustrate the concept of the invention to those skilled in the art, and enable those skilled in the art to make and use the concept of the invention.
이하에는 본 명세서에 개시된 본 발명을 포함하는 하나 이상의 예시적 양태를 제시한다. 실제 실행 시의 모든 특징들이 분명히 하기 위해 본 출원에 기술되거나 제시되지는 않았다. 물론, 본 발명을 포함한 실제 양태의 개발에 있어서, 시스템 관련, 비지니스 관련, 정부 관련 및 다른 제한들의 준수와 같이, 실행 시마다 때때로 달라지는 개발자의 목표를 달성하기 위해서는 수많은 실행 특이적 결정이 이루어져야 한다. 개발자의 노력은 복잡하고 시간 소모적일 수 있지만, 이러한 노력은 본 발명의 유익을 가지는 당업자들에게는 통상적인 일일 것이다.The following presents one or more exemplary embodiments incorporating the invention disclosed herein. Not all features in actual practice have been described or presented in this application for clarity. Of course, in the development of practical aspects including the present invention, numerous implementation specific decisions must be made to achieve the developer's goals, which vary from time to time, such as system-related, business-related, government-related and other restrictions. Developer efforts can be complex and time consuming, but such efforts will be common to those skilled in the art having the benefit of the present invention.
본 발명은 공정 모니터링 시스템의 개발을 위해 X 스페이스와 Y 스페이스의 변동들을 모형화하는 주요 성분 분석(PCA), 부분 최소 면적(PLS) 및 관련 방법, 및 이의 조합법과 같은 다변량 통계 분석 기술을 이용해서 화학 플랜트 작업과 같은 연속 산업 작업의 온라인 모니터링을 위한 실시간에 가까운 시스템이다. 본 명세서에 기술된 다변량 모델 시스템은 전체 공정을 연속해서 모니터하는데 필요한 만큼 공정의 매개변수를 공유할 수 있다. 공정 모니터링 시스템은 적당한 공정 컴퓨터 시스템에 의해 실행될 수 있고, 공정의 불필요한 정지시간과 같은 공정 문제, 결함 및 생산성 감소를 예측하고 방지하는데 유용하다.The present invention utilizes multivariate statistical analysis techniques such as principal component analysis (PCA), partial minimum area (PLS) and related methods, and combinations thereof to model the variation of X and Y spaces for the development of process monitoring systems. It is a near real-time system for on-line monitoring of continuous industrial work such as plant work. The multivariate model system described herein can share process parameters as needed to continuously monitor the entire process. Process monitoring systems can be implemented by a suitable process computer system and are useful for predicting and preventing process problems, such as unnecessary downtime of a process, defects and productivity reductions.
이제 도면을 살펴보면, 도 1은 본 발명의 연속 온라인 모니터링 시스템의 개략도이다. 도시된 바와 같이, 시스템(10)은 다수의 센서, 또는 분석 지점(12)을 포함하고, 이들은 데이터 엑세스 또는 분석 스테이션(14), 예컨대 DCS(Distributed Control System, 예컨대 Honeywell 제품)으로 전달된다. 분석 지점(12)은 온도 및 압력 데이터에서부터 연속 작업하는 화학 플랜트, 정제소 등의 일부를 선택하는 동안 방출 스트림, 양자, 전자 및 이의 유사물을 모니터링하여 수득되는 정보까지의 범위일 수 있다. 이러한 정보는 그 다음 전자적으로 또는 일부 적당한 매뉴얼 수단에 의해, 공정 히스토리언, 데이터 싱크 등을 포함하는 데이터 운영 시스템(16)으로 전달된다. 데이터 운영 시스템(16)은 또한 이하에 더 상세하게 설명되는 공정 모니터링을 위한 다변량 통계 모델을 포함할 수 있다. 데이터의 연속 온라인 모니터링의 출력 데이터는 동의 및 결정(18)을 산출한다. 더 상세하게는, 연속 산업 공정의 실시간에 가까운 다변량 모델화는 다양한 사람-기계 경계면(HMI), 예컨대 컴퓨터에서 공정 모니터링 출력 데이터를 산출한다. 도 1에 예시된 다양한 출력 데이터 및 작용, A1, A2 및 A3은 전반적인 공정 제어 모니터 및 상태 업데이터, 경고 발생(예컨대, 온도가 규정된 특정 범위 아래일 때), 다양한 반응 작용(예, 유속 조정, 응축기 정지, 또는 경고에 대한 수동 조치)을 포함할 수 있다.Referring now to the drawings, FIG. 1 is a schematic diagram of a continuous on-line monitoring system of the present invention. As shown, the
앞에서 제안한 분석 지점(12)과 관련해서, 본 발명의 또 다른 관점에 따르면, 추가적인 공정 제어 및 이에 따른 작업비의 감소는 다수의 분석 샘플링 포트를 모니터되고 있는 생산 플랜트 내의 다양한 전략적 위치(예컨대, 제조 공정 중의 특정 공정 또는 단계의 초기, 중간 및/또는 말기)에 다수의 분석 샘플링 포트를 설치하고, 이 포트를 연속적인 실시간에 가까운 모니터링을 위한 중앙 분석 스테이션에 연결하여 수득할 수 있다. 기존의 실제 증명된 분석 기술을 이용해서 선택한 분석들을 자주 수행할 수 있고, 수득된 데이터는 당해의 온라인 모니터링 시스템 및 방법에 연결시켜 통합시킬 수 있다. 분석 데이터 샘플링 포트는 수동 샘플링 포트일 수 있지만, 본 발명에 따른 분석 포트는 제조 공정 전반의 특정 위치에 매립된 분석 지점일 수 있고, 이러한 매립 포트는 분석 데이터를 적당한 방식으로 샘플링 및 전달할 수 있다. 이러한 정보의 전달은 와이어를 통해 전자로서, 광학 섬유를 통해 광자로서, 하나 이상의 모세관을 통해 기/액 샘플로서 중앙 분석 스테이션으로 전달될 수 있다. 분석 스테이션에 도달한 후, 비용 효과적이며 실제 증명된 분석 기술은 다양한 분석 지점에서 공정 조건 또는 화학 조성에 대한 특정 정보를 이끌어내는데 사용할 수 있고, 여기서 데이터는 본 명세서에 기술된 방법 및 시스템을 이용하여 체계화하고, 평가하여 디스플레이할 수 있다. 이러한 방식으로 획득할 수 있는 데이터는 온도 데이터, 압력 데이터, UV 흡수 데이터, IR 분광분석 데이터, pH 데이터, 특정 성분의 데이터, 예컨대 알데하이드 농도 데이터, 미량 금속 데이터, 불순물 데이터(예, ppm 수준 이하의 공급원료 불순물, 예컨대 황, 불소, 아세틸렌, 비소, HCl 등), 이온 데이터(예, 흡수제 유래의 나트륨 또는 규소 이온 데이터) 및 이의 혼합 데이터를 포함하지만, 이에 국한되는 것은 아니다. 본 명세서에 기술된 바와 같이, 히스토리언에 데이터의 수집은 제조 공정 히스토리의 건설을 허용하고, 동시에 더 구체적으로 공정의 연속적인 실시간에 가까운 온라인 모니터링을 허용한다.Regarding the
이러한 관점에 적합한 이용분야의 예시적 예는 촉매 제조로서, 특히 촉매 제조 공정이 종종 수율, 활성 등의 최적화를 위해 함침 공정 용액의 재순환을 포함하기 때문에, 상기 실시간에 가까운 스트림 분석 및 데이터 수집이 유익할 수 있다. 민감한 매개변수, 예컨대 도판트 농도, pH, 공기 습도, 공기 흐름 및 다양한 공정 온도 등의 정확한 조정은 본 명세서에 기술된 방법을 이용하여 모니터하고 조절할 수 있다. 이러한 선택 매개변수들의 향상된 조절은, 허용되는 사양 범위내인 산물을 수득하기가 더욱 쉬워지기 때문에 더 우수한 촉매의 품질을 직접적으로 야기할 수 있다.Illustrative examples of applications suitable for this aspect are catalyst preparation, particularly near real time stream analysis and data collection, as the catalyst preparation process often involves recycling of impregnation process solutions for optimization of yield, activity, etc. can do. Precise adjustment of sensitive parameters such as dopant concentration, pH, air humidity, air flow and various process temperatures can be monitored and adjusted using the methods described herein. Improved control of these optional parameters can directly lead to better catalyst quality because it is easier to obtain products that are within the acceptable specification range.
도 2는 모델 건축, 도 1에 일반적으로 기술된 바와 같이, 그리고 에틸렌 글리콜/에틸렌 옥사이드 생산 플랜트와 같이 연속해서 또는 거의 연속해서 작업하는 산업 공정에서 작업의 모니터링에 적용된, 모델 제작, 실행 및 실시간에 가까운 시스템의 온라인 모니터링을 위한 방법의 블록 다이아그램이다. 이 방법에서 종합해서 "모델링전" 단계(13)라고 표시한 제1 단계는, 모니터할 것 및 이 모델에 포함시킬 공정 및 공정 변수를 결정하는 것이다. 이 공정 변수(또한, 공정 매개변수 또는 "태그"(12a 및 12b)라고도 알려짐)는 이용할 수 있는 데이터 정보 및 모니터할 전반적으로 연속해서 작업하는 산업 공정의 이해를 기반으로 해서 선택한다. 이러한 태그는 도 2에서 번호 26과 28로 식별되고 이하에 더 상세하게 설명된 모델을 개발하는데 필요하다. 전형적인 공정 변수, 또는 "태그"(12a 및 12b)는 공정 간 또는 2 이상의 열전대 간에 온도 차이, 작업 압력, 산물 흐름 매개변수(속도, 밀도 등), 냉각수 흐름 속도, 산출량 측정, 밸브 센서 데이터, 제어기 데이터, 펌프 흐름 데이터, 특정 공정에 수반된 관(piping)과 관련된 데이터(예컨대, 관 내에서 전달되는 유체의 유속 및 압력), 화학 조성 데이터, 예컨대 반응 진행 또는 촉매 성능, 엔지니어링 및 비용 계산 데이터 등을 포함하지만, 이에 국한되는 것은 아니다. 태그(12a 및 12b)는 분석 데이터(12a) 및 데이터 히스토리안(20)에 의해 포획되거나 다른 방식으로 유입된 노트(12b)와 같은 별도 근원으로부터 데이터를 나타낸다. 본 명세서에 언급된 데이터 히스토리안은 필드(생산 설비)에서 데이터 "태그"를 모아서 소정의 속도(예컨대 2분마다)로 저장할 수 있다. 이러한 데이터 히스토리안(20)은 일반적으로 태그 데이터를 분 기준으로 획득하지만, 이러한 데이터 수집의 빈도는 주로 모니터되는 태그에 따라 달라질 수 있고, 원하는 임의의 빈도(분, 시간, 일, 월 또는 연)로 수집할 수 있다. 종종, 생산 설비의 센서에서 수득된 측정값 또는 "태그 데이터"는 데이터 엑세스 모듈(14)에 의해 온라인으로 실시간 또는 실시간에 가깝게 수집된다. 본 발명의 실시간에 가까운 다변량 모델이 완성되면, 이러한 "태그 데이터"는 히스토리안(20) 또는 데이터 엑세스 시스템(14)으로부터 온라인 공정 모니터링 모듈(30)로 직접 보낼 수 있다. FIG. 2 is a model building, model construction, execution and real-time application as described generally in FIG. 1 and applied to the monitoring of work in industrial processes working continuously or nearly continuously, such as in ethylene glycol / ethylene oxide production plants. A block diagram of the method for online monitoring of a nearby system. The first step, summed up in this method as the "before modeling"
동시에, 모델링전 단계(13) 동안, 관련 데이터를 포획하기 위해 얼마나 오래전으로 거슬러 올라가야 하는지를 결정해야 한다. 이러한 시간 길이는 공정 의존적이고, 종종 이용할 수 있는 데이터의 양과 종류에 의해 제한될 것이다. 전형적인 시간 길이는 약 1년에서 약 5년이지만, 일반적으로 포획된 "태그" 데이터는 약 1년에서 약 2년 범위일 것이다. 이러한 점에서, 히스토리안(20)으로부터의 모든 데이터는 수득되어 데이터 검색 프로그램(22)에 의해 처리되고, 이 때 태그 데이터의 검토(16)는 오프라인 분석 전문가가 수행하여, 모델화되는 공정과 관련이 없는 태그인 "정크" 태그는 버리고 적용할 수 있는 데이터 태그만을 남긴다.At the same time, during the
"정크" 태그의 1차 선발을 수행한 후, 추가로 태그 검토(16)의 반복을 진행할 수 있고, 여기서 데이터 히스토리안(20)에 남아 있는 모든 관련 데이터를 데이터 수집 프로그램(22)을 이용해서 다운로드하고, 각 변수들의 경시적인 추세를 각 데이터 점마다 그래프로 나타낸다. 그 다음, 태그가 작용하는지 아닌지를 결정하기 위해 태그를 개별적으로 평가한다. 태그가 작용하지 않는다면 제거하고, 그렇지 않다면 남겨서 모델 구축에 사용한다. 그 다음, 공정 계기도(P&ID)는 교차 참조 단계에서 검토해서 태그가 생산 공정 내에서 정확한 값, 작업 또는 지점을 나타내는 것을 확실하게 한다. 여기서부터, P&ID 및 공정 태그 데이터는 공정 플랜트의 엔지니어 및/또는 조작자가 다시 검토할 수 있다.After performing the first selection of the "junk" tag, it is possible to further repeat the
태그 및 P&ID 검토(16)의 목적은 3가지이다: 단위 작업 또는 제조 공정 단계와 같은 모니터링 시스템의 개발을 위한 논리적 서브그룹의 이해를 위해; 데이터 태그를 위한 "정상"값 범위를 수득하기 위한 정상 작업 기간의 검토를 위해; 전반적인 생산 공정에 관한 것으로, 당해의 주요 모니터링 목적 및 반응/성능 변수(예, 수율, 에너지 이용, 선택성 등)를 동정하기 위해. 이러한 목적 중 첫번째 목적과 관련하여, 도 3을 참조로 하여 이하에 더 상세하게 논의되는 것처럼, 각 공정 섹션의 서브그룹마다 일반적으로 많은 태그가 있지만, 생산 공정 내의 "섹션"의 "경계"를 따라 매개변수(예, 산물 흐름)에 관한 다수의 상호관련 데이터 태그가 있어서, 다양한 섹션을 함께 연계시키는 작용을 한다. 일부 경우에, 모델화되는 공정 및 이의 복잡성에 따라, 태그와 P&ID 검토 공정(16)은 적당하다면 수회 반복할 필요가 있을 수 있다.The purpose of the tag and P &
연속 화학 제조 공정 시, 일시적 작업을 모니터할 수 있는 동시에 화학 제조 공정의 오류 또는 문제를 최소화할 수 있는 실시간에 가까운 시스템의 기능 블록 다이아그램은 도 2에 도시했고, 하지만 도 2는 온라인 및 오프라인 단계를 모두 포함한다는 것을 유념한다. 공정 일부 외에, 전체 연속 화학 제조 공정 전반에 걸쳐 위치한 센서(12a)는 다수의 여러 종류가 있고, 각 센서는 연속 공정의 현행 작업 조건을 나타내는 여러 측정값을 수득한다. 이러한 측정값들은 전공정을 통한 산물의 중량, 온도, 흐름 속도, 유입 및 배출 냉각수의 온도, 압력 및 흐름 속도, 배출 가스의 조성 등을 포함할 수 있지만, 이에 국한되는 것은 아니다. 물론, 센서 및 수득된 공정 측정값(도 1 참조)은 연속 화학 제조 공정의 다양한 공정 설계마다 상이할 수 있고, 본 발명에 여기에 제한되지 않는다. 이러한 센서로부터 수득된 측정값은 데이터 엑세스 모듈(14) 의해 실시간으로 온라인으로 수집될 수 있고, 그 다음 온라인 공정 모니터링 모듈(30)로 보낸다. 공정 모니터링 모듈이 실시간에 가까운 공정 측정값을 수신한 후, 주어진 다변량 통계 모델(28)을 기초로 하여 일련의 계산을 수행하여 공정 이상을 검출한다. 도 3에 더 상세히 설명되는 모델 개발 단계(26)는 연속 화학 제조 공정의 정상 스테디 작업이 공정 사실적 데이터 저장소, 또는 데이터 히스토리안(20)에서 선택된 공정 데이터 유래의 모델을 특징으로 하는 상기 모델을 오프라인으로 개발하는데 사용된다. 공정 모니터링 모듈(30)은 실시간에 가까운 공정 데이터, 통계 계량값 및 잠재적 제조 문제점에 관한 경고 및 사람-기계 인터페이스(HMI)(32)에 의한 디스플레이용 관련 공정 변수를 공급하는데 책임이 있다. 공정 문제점 경고를 모니터하고 모델이 소정의 모델 성능 기준, 예컨대 거짓 경고율, 누락 경고율, 고장 경고율 등을 기초로 하여 재조정 또는 재구축되어야 하는지를 결정하기 위해 성능 평가 모듈(34)을 시스템에 포함시킨다. 필요하다면, 다변량 통계 모델은 결정점(36)에서 오프라인으로 재구축될 수 있다. 또한, 수득되는 모델은 모델 성능을 향상시키기 위해 온라인으로 재조정되는 일정한 조정가능한 매개변수를 제공한다. 예를 들어, 이러한 조정가능한 매개변수는 모델의 특징을 나타내지 않는 작업 영역의 정상 변화로부터 가능한 표류를 부분적으로 상쇄하거나, 측정 문제로 인한 변수를 배제하도록 결정점(36)에서 온라인으로 조정할 수 있다(예컨대, 열교환기는 세정 또는 유지되기 위해 오프라인이다). 배제된 변수는 이 변수가 적당하게 최적화되거나, 정상 또는 "정상에 가깝게" 돌아간 후에는, 적당하다면 다시 첨가할 수 있다. 경우에 따라, 이러한 시스템에 따라 경고에 의해 제기된 문제점은 제조 플랜트 내의 개인(38)에 의해 조사될 수 있고, 문제를 조정하거나, 필요한 경우 장치를 조정하여 문제를 수정하여 경보를 침묵시킨다. 모델(28) 및 공정 모니터링 방법에 의해 세부사항이 제공된 당해 시스템의 사용을 통해, HMI(32)에 의해 영상화된 정보는 조작자/엔지니어가 경보 발생 문제의 위치를 생산 설비 내에서 구체적으로 찾아내어 정확히 지적할 수 있다.In a continuous chemical manufacturing process, a functional block diagram of a near real-time system that can monitor temporary work while minimizing errors or problems in the chemical manufacturing process is shown in FIG. 2, but FIG. 2 is an online and offline step. Note that it includes both. In addition to some of the processes, there are a number of different types of
도 3은 선택된 사실적 데이터로부터 다변량 부분 최소 면적법(MPLS) 또는 주요 성분 분석(MPCA) 모델을 구축하여 연속 화학 제조 작업의 정상 작업을 특징적으로 나타내기 위한, 본 발명의 모델 개발 모듈(26)(도 2)의 단계들을 설명한 흐름도이다. 각 단계는 바람직한 양태를 참조로 하여 이하에 더 상세히 설명되고, 여기서 이상 작업은 특히 하나 이상의 공정 매개변수들의 변화를 의미한다. 이하에 설명되듯이, 성공적인 실현에 영향을 미치는 본 발명의 관점은 많다.3 illustrates a
모델 개발Model development
많은 이상 데이터 영역 및 "정크" 태그는 태그 검토(16) 동안 모델 구축 데이터세트로부터 제거되지만(도 2), 데이터의 추가적인 세부 "클리닝"이 도 3에서 번호 42로 예시한 바와 같이 필요할 수 있다. 일반적으로, 이것은 공정에 직접 관여하는 개인들, 예컨대 플랜트 작동자, 공정 엔지니어 등 간의 상호작용에 의해 수행한다. 데이터 클리닝 단계 동안, 여러 가지 일이 일어날 수 있는데, 그 예로는 논리적 서브그룹의 개발, 정상 데이터 값의 수립 및 반응 변수들에 대한 정보 수득이 있다. 이 중 첫 번째 예인 모니터링 시스템을 위한(예컨대, 단위 작업을 위한, 또는 특정 공정 단계를 위한, 예컨대 EO 생산 공정 내의 단계를 위한) 논리적 서브그룹의 개발과 관련하여, 서브그룹 당 많은 태그뿐만 아니라 다른 공정 단계로 경계를 가로지르는 태그(예컨대, 공정의 한 단계에서 공정의 다른 단계로의 유체 흐름)(이러한 경우에 태그는 공정 섹션을 함께 연계시키는 태그 링크라 지칭한다)를 수득하기 위해 정보를 평가한다. 데이터 클리닝 단계(42) 동안 정상 데이터 값을 수립하는데 있어서 검토될 수 있는 정보는 "정상"을 수득하기 위한 정상 작업 기간, 배제되어야 하는 임의의 데이터 스파이크를 결정하기 위한 데이터 태그의 기본 값 범위 등을 포함한다. 또한, 공정에 따라, 전체 공정의 특정 부분과 관련된 반응 변수 또는 성능 변수, 예컨대 수율, 에너지 사용, 선택성, 촉매 선택성 등에 대한 조정을 문의하고 실시하는 것이 중요할 수 있다. 이러한 각 태그마다, 비정상 태그 정보(즉, 데이터의 "노이즈")는 데이터 클리닝 단계(42) 동안 배제시켜, 양호한 모델 개발을 위해 적당하게 수득할 수 있는 최상의 "정상화된" 데이터 세트를 수득한다. 클린 태그와 모델 반응을 사용해서, 모델 세트는 PCA(주요성분 분석), PLS(부분 최소 면적 또는 잠복 구조에 대한 투사), 또는 당업계에 공지된 임의의 다른 적당한 다변량 통계 모델링 시도, 예컨대 통계 공정 제어(SPC) 챠트와 같은 다변량 모델 구축법을 이용해서 박스(40)로 나타낸 바와 같이 제작한다. 이 모델 데이터세트는 그 다음, 다변량 모델의 개발(단계 44)에 사용한다.Many anomalous data areas and "junk" tags are removed from the model building dataset during tag review 16 (FIG. 2), but additional detailed "cleaning" of the data may be needed as illustrated by
일반적으로 말하면, 이 모델은 특정 공정들의 다양한 행동을 플로팅하고, 플로팅된 영역 내에서 새로운 공정 데이터가 계속 속하는 모니터링 영역을 한정하여 개발할 수 있다. 단일 공정 행동이 일반적 예시로서 설명될 것이다. 여기에 사용된 것과 같이, 통상의 통계적 공정 제어(SPC) 차트 및 공정에 따라 각 특정 공정에 관한 정보는 공정 변수(X) 뿐만 아니라 산물 품질 변수(Y)의 다수의 통상적인 측정값, 그렇지 않다면 반응 변수로 알려져 있고 전반적인 성능을 평가하는데 유용한 수율, 조성물의 선택성 등과 같은 데이터에 대응하는 통상의 측정값에 포함될 수 있다. 일반적으로, Y 공간에 변화를 설명하는 공정 변수의 대부분의 정보는 t1, t2 등으로 표시된 소수의 잠복 변수들에 포획될 수 있다. 따라서, 초평면 상의 위치 및 수직 거리와 관련하여 잠복 가변 위치를 계산하여 공정의 일반적 행동을 모니터하고, 이로써 공정 플랜트가 계속해서 정상적으로 작동하는 한 새로운 공정 데이터(X)가 계속해서 투사되어야 초평면(또는 평면) 내의 모니터링 영역을 한정한다. 이러한 n-차원(n은 1, 2, 3, 4 등, 적당한 것)의 잠복 가변 플롯은 당업계에 공지되어 있고, 일반적으로 소정의 유효 수준(예, 1% 및 5%)에 대응하는 모니터링 경계를 한정하는 복수의 외곽을 포함한다. 잠복 벡터가 0 수단과 함께 일반적으로 분포된다는 표준 가정 하에, 이러한 영역들은 타원형으로 표현될 수 있고, 이 때, 하나 이상의 참조 분포는 모니터링 영역 경계를 한정하는데 사용될 수 있다. 그 후, 산물 품질 데이터 Y의 유사한 투사 플롯도 역시 Y 공간의 잠복 변수들 u1, u2를 사용하여 표현할 수 있다. 새로운 y 데이터는 수득되면 이 평면 내의 유사한 영역에 속하는 것이 바람직하다. 여기에 사용된 모델링은 X와 관련된 단일 벡터로서 Y가 모델링되어, 단일 모델에 의해 다수의 y를 모니터링할 수 있다는 점에서 독특하다.Generally speaking, this model can be developed by plotting the various behaviors of specific processes and defining the monitoring area where new process data continues to belong within the plotted area. Single process behavior will be described as a general example. As used herein, in accordance with conventional statistical process control (SPC) charts and processes, information about each particular process may include a number of conventional measurements of product quality variables (Y) as well as process variables (X), otherwise Known response parameters and can be included in conventional measurements corresponding to data such as yield, selectivity of the composition, etc., useful for assessing overall performance. In general, most of the information of a process variable describing a change in the Y space can be captured in a small number of latent variables, denoted by t 1 , t 2 , and the like. Therefore, the general behavior of the process is monitored by calculating the latent variable position in relation to the position on the hyperplane and the vertical distance so that new process data (X) must be continuously projected as long as the process plant continues to operate normally. Define the monitoring area within Such latent variable plots of n-dimensions (where n is 1, 2, 3, 4, etc., suitable) are known in the art and are generally monitored corresponding to certain effective levels (eg, 1% and 5%). It includes a plurality of outlines defining a boundary. Under the standard assumption that the latency vector is generally distributed with 0 means, these regions can be represented as elliptical, where one or more reference distributions can be used to define the monitoring region boundary. A similar projection plot of the product quality data Y can then also be represented using the latent variables u 1 , u 2 in the Y space. Once the new y data is obtained it is desirable to belong to a similar area within this plane. The modeling used here is unique in that Y is modeled as a single vector associated with X, allowing multiple y to be monitored by a single model.
공정이 정상적인 방식으로 계속해서 작동한다고 가정하면, 새로운 관찰값이 계속해서 잠복 가변 평면의 모니터링 영역에 투사될 뿐만 아니라, 이러한 평면의 표면에 위치하거나 매우 가깝게 위치할 것이라고 생각한다. 따라서, 이러한 평면으로부터의 새로운 관찰값(xi 또는 yi)의 제곱 수직 거리(제곱 예측 오류 또는 SPE라고도 알려져 있음)를 계산할 수 있다. 이러한 값들 SPEX 및 SPEY(여기서, X는 공정 변수를 나타내고, Y는 반응 변수를 나타내며, 그 예로는 공정 또는 각 공정 단계의 수율, 공정 단계 또는 일련의 단계들의 선택성 등)의 일반적인 계산은 i번째 관찰에 대해 다음과 같이 계산할 수 있다:Assuming that the process continues to operate in the normal manner, it is assumed that new observations will not only be projected onto the monitoring area of the latent variable plane, but also located on or very close to the surface of this plane. Thus, the square vertical distance (also known as square prediction error or SPE) of the new observation (x i or y i ) from this plane can be calculated. The general calculation of these values SPE X and SPE Y (where X represents a process variable, Y represents a reaction variable, for example the yield of a process or each process step, the selectivity of a process step or series of steps, etc.) is i For the first observation we can calculate:
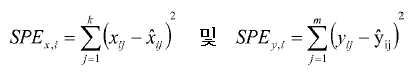
여기서, ![]()
![]()
![]()
![]()
첫 번째 모델의 결과에 따라, 모델은 이제 "정크"인 것으로 나타나는 시간 중의 임의의 새로운 태그 또는 데이터 영역을 제거하기 위해 반복 공정(46)을 진행할 수 있다. 반복이 끝난 후, 데이터는 그 다음 "모델 세트"의 이상을 최소화하기 위해, 다변량 통계 모델을 이용하여 결정 프롬프트(48)에서 리핏(refit) 및 재분석한다. 반복 공정은 이상의 원하는 최소 수준이 달성될 때까지 수회 반복할 수 있다.Depending on the results of the first model, the model may now go through an
모델 확인Model Verification
모델 개발에 이어, 최신 모델 계수를 수득한 후, 공정 단계(52)의 수행 전에 일련의 점검 및 확인을 통해 다변량 통계 모델(44)을 확인한다. 이는 먼저 y hat(![]()
![]()
![]()
![]()
확인 단계(50)에서 x-hat 및 y-hat 점검은 모든 개별적인 X 및 Y가 잘 예측되고 있는지를 확인하기 위해 수행하여 모델의 신뢰성을 향상시킨다. 또한, 이러한 확인 점검들은 이전 점검 동안 놓친 임의의 무가치한 데이터를 추가로 포획하는 작용을 할 수 있다. 그 다음, 양호한 예측인자의 수득 및 모델의 노이즈 감소 또는 최소화를 위해, T를 통해 X와 Y를 관련시킬 수 있다. 또한, 개발된 모델을 기초로 한 특정 공정의 예측 온도, 압력, 흐름속도, 시약 함량 등이 현재 특정 제조 또는 생산공정에서 수행되고 있는 실제 값과 크게 다르지 않도록 하기 위해 확인 단계(50)에서 추가 점검을 수행해도 좋다. x-hat 및 y-hat 점검은 잠재적인 다변량 모델의 평가 시에(또는) 모델 개량 동안 사용한다. 이러한 점검들의 사용은 온라인 수행에 더욱 강고하고 유용한 모델을 구축하는데 도움을 준다. x-hat 점검은 x 변수들의 개별적인 시간 경향을 이들의 예측값(![]()
![]()
![]()
![]()
계속해서 도 3을 살펴보면, 단계 (50)에서 확인한 후, 다변량 통계 모델(44)은 당업계에 공지된 방법 및 공정을 이용해서 모델 온라인 실행(52)을 하도록 배열될 수 있다. 예를 들어, 전형적인 온라인 모델 배열 공정에서, 시중에서 입수할 수 있는 임의의 수의 특정 프로그램 또는 당업자에 의해 쉽게 개발될 수 있는 프로그램을 이용해서 모델로부터 계수를 추출한다. 예를 들어, 모델 개발은 프로그램 Simca-P(Umetrics AB)를 이용해서 수행할 수 있고, 계수 추출에는 다른 기구를 이용할 수 있다. 이와 같이 추출된 계수는 그 다음 온라인 계산 시에 검색될 수 있도록 저장한다. PLS 계산 모듈은 그 다음 예를 들어 ProcessMonitor® 및/또는 ProcessNet®(Matrikon) 프로세싱 시스템을 이용해서 계산을 계획하고, 데이터를 추출하며, 데이터를 파일에 쓰고, 온라인 실행과 관련된 유사 공정을 위해 배열된다. 이러한 배열 후, 모델은 하나 이상의 서버/그래픽 인터페이스(54)에 장착되어 실시간에 가까운 모니터링에 사용된다.Continuing with reference to FIG. 3, after verifying in
연속 온라인 모니터링을 위한 연속 작업 동안, 시스템은 특히 모니터링 공정에 따라 발생되는 경보와 관련하여 연속해서 데이터 확인 문의(56)를 받는다. 이 목적을 위해, 발생된 공정 경보가 정당한 것으로 결정되면, 문제를 정정하기 위해, 예컨대 수송 파이프의 유체 흐름 조정, 시약 첨가 속도 등을 위해 적당한 단계를 취할 수 있다. 하지만, 발생된 경보가 거짓으로 결정되면, 여러 가지 옵션이 취해질 수 있다. 문제는 수동으로 개량될 수 있고(58) 또는 다변량 통계 모델 자체가 면밀한 조사를 받을 수 있고, 이러한 것으로 오류의 본성에 따라서 적당하게 모델 자체가 재모델링되거나(60a), 개정되거나(60b), 재계산되고 재확인될 수 있다(60c).During the continuous operation for continuous on-line monitoring, the system receives data confirmation queries 56 continuously, particularly with regard to alarms generated by the monitoring process. For this purpose, if it is determined that the process alarm generated is legitimate, appropriate steps can be taken to correct the problem, for example for adjusting the fluid flow of the transport pipe, the rate of reagent addition, and the like. However, if the alert generated is determined to be false, several options can be taken. The problem can be remediated manually (58) or the multivariate statistical model itself can be scrutinized, such that the model itself is properly remodeled (60a), revised (60b), or reconstructed according to the nature of the error. It can be calculated and reconfirmed (60c).
도 4는 특정 산물, 예컨대 화학적 산물의 거의 전체 제조 공정을 계속해서 모니터하는데 사용된 PLS 또는 PCA 모델의 한 예에 대한 데이터 흐름을 나타낸 것이다. 본 발명은 전체 플랜트 또는 플랜트의 여러 단위 작업을 모니터하는데 사용될 수 있다. 시스템은 온라인 및 오프라인 성분을 모두 예시한 도 2와 함께 도 1 내지 도 3에서 총괄해서 나타낸 바와 같이 개발된 오프라인 모델(78)에 의해 시작된다. 공정 전반의 각 단계에서 전체 생산 공정을 전술한 바와 같이 개발된 모델을 이용하여 모니터하는 시스템은 도 4에서 일반적으로 번호 (70)으로 표시한 것이다. 온라인 모델 성분(76)은 일반적으로 수동 입력을 통해 또는 도 5에 더 상세히 설명되는 바와 같은 컴퓨터 네트워크 링크 또는 서버 상의 데이터 엑세스 인터페이스(72)를 통해 입력 데이터(71)에 접근하는 컴퓨터 시스템에서 실행될 수 있다. 이러한 데이터 값들은 단계 (73)에서 사전 처리되어, 누락값 또는 믿을 수 없는 값을 검출하여 적당하게 측정된 예측값으로 대체한다.4 shows the data flow for one example of a PLS or PCA model used to continuously monitor almost the entire manufacturing process of a particular product, such as a chemical product. The present invention can be used to monitor the entire plant or the various unit operations of the plant. The system is started by an off-
작업 동안, 도 4에 도시된 바와 같이, 시스템은 공정 전반의 모니터링 점에서부터 데이터를 수집해서 사전처리하여, 평가를 위한 PLS 또는 PCA 모델(76)로 보낸다. 진행 기준 하에, 모델 출력값을 계산하고 이후 검색을 위해 데이터 저장소(77)에 기재한다. 항목 (79)로 예시된 바와 같이, 사용자는 연속해서 원거리에서 입력 급원(71) 유래의 미가공 태그 데이터뿐만 아니라 저장된 모델 출력값(77)(SPEx, SPEy, T2 등)에 접근하여 검토할 수 있다. 데이터는 도 5에 더 상세히 설명된, 디스플레이 인터페이스(74)를 통해 사용자에게 제공된다.During operation, as shown in FIG. 4, the system collects and preprocesses data from monitoring points throughout the process and sends it to the PLS or
일반적으로, 모델은 온라인 모니터링 동안 단지 드물게 업데이트를 필요로 한다. 모델 업데이트 단계 동안 데이터베이스(77)에 저장된 데이터는 오프라인 모델 적응 단계인 프로세싱 단계(75)에 사용될 수 있다. 추가 공정 데이터는 도 2에 연결해서 설명된 공정 평가 단계를 사용해서 점검하고, 새로운 모델은 기존 온라인 및 오프라인 모델(78 및 76)을 대체한다.In general, models only rarely need updates during online monitoring. The data stored in the
온라인 시스템 용도Online system purpose
도 5는 온라인 모델 실행 및 데이터 흐름에 관하여 더 상세하게 제공한다. 도 5를 살펴보면, 본 발명의 관점들에 따른 상세한 데이터 흐름 구조의 모식도가 예시된다. PI(플랜트 정보) 시스템 또는 유사 시스템과 같은 데이터 히스토리안 서버(82)는 적당한 적용 프로그램 인터페이스(API)를 통해 공정 모니터링 서버 시스템(80)에 연결된다. 본 명세서에 사용되고 기술된 상기 API는 2가지 분리된 및/또는 다른 조각의 소프트웨어를 통합시키는데 사용될 수 있는 미리기록된 소프트웨어 조각인 것으로 당업계에 알려져 있다. 이러한 API의 한 예는 주요 서치 엔진(예, 구글)을 이용하기 위해 서치 기능을 제공하는 제3의 웹페이지에 사용된 표준 인터페이스 코드이다. 기능은 구체적으로 소프트웨어의 상호연결된 조각 간에 상세한 상호작용(예, 데이터 전이, 임무 개시 및 조절)을 조절하는 것이다. 도 5에 도시된 바와 같이, 하스토리안 서버(82)에 대한 히스토리안 API(84)는 하나 이상의 작용 경로가 일어나게 하는 시스템(80) 내에서 활성화된다. 예를 들어, 도면에 도시된 것처럼, API는, Matrikon ProcessNet 또는 이의 유사물과 같은 결정 서포트 소프트웨어 패키지이고 도 2의 통계 모델(28) 유래의 정보를 처리하는 웹 가시화 서비스 애플리케이션(86)에 히스토리안 데이터 접근을 제공할 수 있다. 웹 가시화 서비스(86)로부터 발생된 정보는 그 다음 하이퍼텍스트 전송 프로토콜(HTTP)을 통해 원거리 고객/작동자에게 전달될 수 있고, 원거리 고객/작동자는 인터넷 익스플로러® 원격 클라이언트 98과 같은 사람-기계 인터페이스를 이용하여 생산 공정의 연속적인 온라인 모니터링을 위한 시스템에 접근한다.5 provides more details regarding online model execution and data flow. 5, a schematic diagram of a detailed data flow structure in accordance with aspects of the present invention is illustrated.
선택적으로, 동등하게 허용되는 히스토리안 인터페이스(84)는 임의의 적당한 실시간에 가까운 계산 시스템, 예컨대 ProcessMonitor®(Matrikon(캐나다 에드몬튼 소재)에서 입수할 수 있다)일 수 있는 계산 엔진(90)과 상호작용(직접 또는 간접적으로) 할 수 있다. 본 발명의 이러한 계산 시스템은 성능과 유용성을 최대화하기 위해 제조 공정 동안 공정 및/또는 장치 문제를 예측하고 예방하기 위한 더 큰 시스템에 통합된다. 구성된 계산 엔진(90)은 정보를 받아서 API를 통해 수학 분석 시스템(94), 예컨대 MATLAB®(The MathWorks(Natick, MA)에서 입수용이), 또는 다른 공지되고 입수용이한 적당한 수학 분석 프로그램으로 정보를 보낸다. 이러한 수학 분석 시스템, 예컨대 MATLAB®은 종종 고도의 언어 및 상호작용 환경이어서, 개발자는 컴퓨터 집약적 수학 임무를 통상의 프로그래밍 언어, 예컨대 C, C++, Visual Basic 및 Fortran 등, 이에 국한되지 않는 프로그래밍 언어보다 더 빠르게 수행할 수 있게 한다. 이러한 상호작용 환경은 연속적인 온라인 모니터링 공정의 사용에 필수적인 다수의 수학 관련 공정 또는 애플리케이션, 예컨대 알고리듬 개발, 데이터 가시화, 데이터 분석, 시그널 프로세싱 및 숫자 계산(이에 국한되지 않는다) 등을 위해 본 발명에 사용된다.Optionally, an equally
도 5에 일반적으로 예시된 것처럼, 계산 엔진(90)은 전술한 모델 매개변수 기록보관소(92)로부터 텍스트 정보를 동시에 받아서, 예측 공정에 사용한다. 시스템(94)과 기록보관소(92)가 상호작용하면서, 동시에 데이터베이스 운영 서버(88) 및 국소 히스토리안(89)과 통신한다. 국소 히스토리안(89)은 이후 사용 및 디스플레이를 위한 중간 및 최종 계산을 보관해서, 유용한 다수의 소프트웨어 패키지, 예컨대 OPC(공정제어를 위한 OLE(Object Linking and Embedding)) 데스크탑 히스토리안을 이용해서 실행될 수 있다. 계산 엔진은 데이터 운영 서버 및 국소 히스토리안과 적당한 통신 경로, 예컨대 오픈 데이터베이스 계산 커넥션(ODBC) 및 OPC 인터페이스 등을 이용하여 통신한다. 서버(88)는 일반적으로 데이터베이스 운영 시스템, 예컨대 SQL 서버이며, 이는 적당한 언어, 예컨대 SQL(Structured Query Language)로 포맷화된 클라이언트 기계로부터의 문의에 응답할 수 있다. 국소 데이터 히스토리안(89)은 시스템에 의해 수득된 계산을 저장하기 위해 포함되어, 계산 엔진(90) 또는 모니터링 가시화 서비스(86)로 이후에 검색하는데 사용한다. 서버(80) 내에서 예시된 정보의 연속 흐름을 이용해서, 본 발명의 연속 온라인 모니터링 공정은 플랜트 위치에서 또는 원거리에서 인터넷 클라인언트(98)를 통해 수행할 수 있다. 연속 온라인 모니터링 기구 및 인터페이스는 불량하거나 예상치못한 성능 및 계획하지 않은 제조 시스템 정지시간의 근원적인 원인을 검출 및 진단할 수 있게 한다.As generally illustrated in FIG. 5, the
시스템 작동자에 의해 관찰된 모니터 상의 임의의 수의 적당한 가시적 디스플레이는 전자 스프레드시트, 디지털 대시보드, 표 데이터 등으로 본 발명에 따라 사요오딜 수 있지만, 바람직한(이에 국한되는 것은 아니다) 가시적 애플리케이션 및 이의 용도는 도 6 내지 9에 예증되어 있다.Any number of suitable visual displays on the monitor observed by the system operator can be used in accordance with the present invention with electronic spreadsheets, digital dashboards, tabular data, etc., although preferred applications include, but are not limited to: Use is illustrated in FIGS. 6-9.
도 6을 살펴보면, 생산 공정의 실시간에 가까운 연속 모니터링 동안 예시적 산업 생산 설비의 주요 전체보기(overview) 디스플레이 스크린(100)이, 모델 블록이라고도 언급되는, 복수의 1차 디스플레이 인자(102)(예, EO 반응기, EO 흡수 및 스트리핑, CO2 제거, 경질 말단물 제거 및 급냉/글리콜 배출 시스템)을 포함하는 것으로 예시되고 있다. 이 도면에 추가로 예시된 바와 같이, 각각의 1차 디스플레이 인자 또는 모델 블록(102)은 텍스트 라벨 또는 인자 자체의 설명, 또는 기호, 그래픽 아이콘 또는 이미지를 비롯한, 관련된 적당한 다른 식별인자를 보유할 수 있다. 예를 들어, 실시간에 가까운 모니터링 과정에서, 사용자는 선택 장치, 예컨대 마우스 또는 다른 적당한 컴퓨터 하드웨어(예, 스타일러스)를 제시된 모델 블록과 관련된 잠재적 공정 폴트를 조사하고 연구하기 위한 모델 블록(102) 상에서 클릭할 수 있다.Referring to FIG. 6, the main
주요 전체보기 디스플레이 스크린(100)의 또 다른 특징은 계산 상태 인디케이터(101), 모니터되고 있는 공정에 대한 정보를 실시간에 가깝게 제공하는 라이브 태그 데이터 디스플레이(104), 및 선택적으로 사용자가 임의의 적당한 선택 장치를 이용하여 사용자 판단에 따라 모니터되고 있는 공정의 경향 간에 쉽게 이동할 수 있게 하는 트리뷰 페인(106)이다. 계산 상태 인디케이터(101)는 모델 자체의 계산에 대한 정보를 제공하는 작용을 하고 디스플레이 스크린(100)의 적당한 섹션 상에 선택 장치를 이동시켜 촉발시킬 수 있다. 라이브 태그 데이터 디스플레이(104)는 예시된 바와 같이 디스플레이 모니터 자체에 계속해서 나타날 수도 있고, 또는 선택 장치 또는 메뉴에 의해 촉발되었을 때에만 디스플레이되는 팝업으로 나타날 수도 있다. 이러한 라이브 태그 디스플레이(104)는 생산 공정으로부터 실시간에 가깝게("라이브") 종종-모니터되는 태그 데이터, 예컨대 온도, 압력 및 기체 발생 데이터(이에 국한되지 않는다)를 디스플레이하는데 사용될 수 있다. 라이브 태그 데이터 디스플레이(104)는 이하에 더 상세하게 설명되는 것처럼 "드릴-다운(drill-down)" 기술을 이용해서 라이브 태그 데이터 값을 빠르게 평가하는데 사용될 수도 있다.Another feature of the main
1차 디스플레이 인자, 또는 모델 블록(102)은 다수의 색을 있고, 여기서 색은 "디스플레이 인자" 자체에 의해 표시되는, 모니터되는 특정 항목 또는 항목들의 계산, 측정 또는 모니터되는 속성에 의해 결정되는 것이 바람직하다. 계산, 측정 또는 모니터된 속성은 본 발명의 다변량 통계 모델과 직접 상관성이 있고 연계된다. 임의의 수의 색이 사용될 수 있지만, 다양한 이유 또는 선호도로 인해, 본 발명에 전형적으로 사용된 디스플레이 색은 연속적인 모니터된 범위 또는 모니터되고 있는 일련의 공정 값을 반영하도록 한다. 예를 들어, 인자들의 색은 현재 표시되고 있는 데이터 세트 내의 1차 디스플레이 인자 색을 조절하는 하나 이상의 속성의 실제 숫자 범위에 대응할 수 있다. 대안적으로, 디스플레이 인자의 색은 인자 색을 조절하는 속성의 가능한 숫자 범위에 대응할 수 있다. 본 발명의 한 관점에서, 실시간에 가까운 모니터링 과정 동안, 디스플레이 인자(102)는 색 범위가 적색부터 녹색까지일 수 있고, 여기서 녹색은 모니터된 값의 안정한 성능을 나타내고, 오렌지색 또는 노란색은 잠재적으로 문제가 있는 성능을 나타내며, 적색 디스플레이 인자는 하락하거나 문제가 있는 공정 성능을 나타낸다. 공정의 이러한 관점과 관련하여, 연속적인 온라인 모니터링 시스템은 전체 제조 공정 자체 내에서 거의 모든 공정(일반적인 모델 블록 102로 표시됨)을 포함하여, 제조 과정이 사용자가 선택한 시간 간격, 예컨대 분당, 시간당, 일당, 월당, 연당 등에 따라 적당하게 시작부터 끝까지 연속해서 모니터될 수 있게 한다.The primary display factor, or
도 7은 실시간 연속 모니터링 동안 도 6의 모델 블록(102)에 "드릴 다운"함으로써 수득할 수 있는 것과 같은, 산업적 생산 설비 내의 일반 공정의 세부사항과 함께 전형적인 2차 컴퓨터 전체보기 스크린 디스플레이(110)를 예시한 것이다. 여기에 사용된, "드릴 다운"은 사용자가 디스플레이 스크린 상의 이동가능한 커서, 당해의 특수 구성요소 또는 하위구성요소의 사용을 통해 또는 마우스와 같은 적당한 선택 수단을 통해 선택하고, 이러한 구성요소의 선택을 통해 이 구성요소 또는 하위구성요소가 표시하는 제조 또는 공정 이벤트의 현행 실시간 진행에 대한 더욱 세부적인 정보를 수득하는 것을 의미한다. 도면에서 볼 수 있듯이, 디스플레이 스크린(110)은 일반적으로 선택적인 트리뷰 페인(106), 하나 이상의 기여 또는 일관성 플롯(130, 140 및 150), 뿐만 아니라 제시된 사분면 형태로 디스플레이된, 선택적인 기여 표(160)를 포함할 수 있지만, 이러한 종류의 디스플레이는 단지 예시적인 것이지, 제한하려는 것이 아니다.FIG. 7 illustrates a typical secondary computer
도 7의 모델 섹션 전체보기 스크린(110)에 예시된 바와 같이, 디스플레이 플롯(130)은 X-일관성 지수 플롯으로, 참조 세트에 존재하지 않는 임의의 새로운 변화 근원의 발생을 검출하는데 사용하기 위한, XCon vs. 시간으로 플로팅한 특정 공정 변수의 X 일관성(SPEx, 여기에 디스플레이된 플롯에는 XCon으로도 지칭됨)을 예시하고 있다. 평가 중인 공정의 변화 또는 변경, 예컨대 반응기에 유입되는 유체의 온도는 초기 잠재적 변수를 한정하는 "평면"으로부터 이탈한 새로운 데이터 점을 산출하여, XCon(SPEx)의 증가를 유발한다. 도 7에 예증된 것처럼, 디스플레이 플롯(130)에서 정상 공정 작업 유래의 데이터는 조절 범위(132)에 속하거나 그 이하에 속하지만, 압력이 감소함에 따라(본 실시예에서와 같이), SPEx는 동그라미 친 영역(133)에서와 같이 조절 범위(132)를 빠르게 이탈하여, 추가 조사할 사건이 일어났음을 사용자에게 표시해 준다. SPE의 조절 범위는 본 명세서에서 데이터 히스토리안 등으로부터의 참조 데이터를 이용해서 개발하고 설명한 모델을 기초로 한 가설 검사 세트에 대응한다. 이와 유사하게, 디스플레이 플롯(140)은 동일한 모델 블록(102)으로 표현된 공정과 관련된 Y 일관성(YCon 또는 SPEy)를 예시한 것으로, SPEY가 조절 범위(142)를 이탈하게 하는 데이터 작업도 역시 추가 조사할 사건이 일어났음을 표시하며 도 6에서 디스플레이(100) 상에 표시성 색 변화를 유발할 가능성이 있다. 도 7의 디스플레이 플롯(150)은 전체 공정 상태(OpS 또는 T2)를 예시하며, 특정 공정의 "정상 데이터"의 중심으로부터의 거리를 나타낸다. 상기 디스플레이 플롯(130) 및 (140)과 함께 설명되는 것처럼, T 제곱(T2) 값이 사전 설정된 모니터링 범위(152)를 이탈하게 하는 공정의 작업 데이터는 시스템 작업자 또는 사용자가 추가 조사를 해야 하는 사건의 발생을 나타내거나 암시할 수 있다.As illustrated in the model
도 7의 디스플레이 사분면(160)은 사용자에 의해 지정된 디스플레이의 임의의 수일 수 있는, 선택적으로 디스플레이된 기여 페인(contribution pane)을 예시한 것이다. 도면에 도시된 것처럼, 디스플레이 사분면(160)은 현행 X 불일치에 대한 최고 5개의 기여인자(162)를 정리한 표를 포함할 수 있다. 본 발명과 고나련하여 디스플레이 사분면(160)에 디스플레이될 수 있는 다른 진단 기구는 분석 중인 공정의 특정 섹션을 위한 Treemap 또는 특정 플랜트 섹션과 같은 선택된 공정의 섹션을 위한 콘센서스 t1-t2 평면을 포함할 수 있다. 이러한 후자 타입의 잠복 가변 공간에의 데이터 돌출은 진단 목적으로 본 명세서에 기술된 시스템에 따라 유용할 수 있다. 예를 들어, 이러한 타입의 디스플레이는 불순물 오염, 반응기 오염 등, 잠복 가변 공간의 특정 영역으로 이동하는 데이터 돌출을 특징으로 할 수 있는 불확실한 폴트에 유용할 수 있다. 여기에 예시되지는 않았지만, 복수의 변수가 t2 vs. t1 평면에 플로팅되어 디스플레이될 수 있고, 여기서 모니터링 영역은 난형 또는 유사한 경계선으로 예시된다. 모니터링 영역의 "외측"에서 발생한 데이터 점들은 임의의 수의 모델 변수들, 예컨대 가능한 불순물, 잘못된 온도 또는 압력 등 때문일 수 있고, 이에 따라 필요한 경우 추가 조사를 필요로 할 수 있는 점이다.
사용자가 전체 공정의 특별한 특징에 대한 더 자세한 사항을 원하는 경우에 또는 디스플레이의 구성요소 또는 하위구성요소 중 하나에서 특정 또는 잠재적 문제에 관한 더 자세한 세부사항을 수득하고자 하는 경우에, 사용자는 도 7에 예시된 하나 이상의 플롯들의 조절 범위 외측에 놓인 당해의 특정 영역을 선택하면, 공정의 세부사항에 관한 추가 하위수준의 정보로 "드릴 다운"함으로써 추가적인 세부 정보를 수득할 수 있다. 도 8a는 도 7의 디스플레이 플롯(130)의 연장된 뷰를 가진 예시적 디스플레이 스크린(170)을 예시한 것으로, 상대적 및/또는 범위 기여를 계산하기 위한 사용자-선택가능한 옵션(176), 및 사용자가 MSPC 위반에 기여하는 예측 오류를 추가 검토하기 위한 시간의 하나 이상의 지점을 선택하게 하는 MSPC 분석값(174)의 시간 경향을 예시한다. 구체적으로, MSPC 플롯(174)은 X-일관성(SPEx) 및 특정 공정, 이 예에서는 경질 말단물 제거(LERA) 공정을 위한 일정 시간(바닥 축을 따라 제시됨) 동안 정상으로부터의 차이를 예시한 것이다. 이러한 방식에 따르면, 하나 이상의 검출된 공정 작업 데이터 점(174)이 전반적인 제조 또는 생산 공정의 상기 구성요소에 대한 모니터링 범위(132)의 위반에 기여하는지를 더욱 분명하게 알 수 있다. 연속된 당해의 급작스런 완충액 용기 압력 강하 시에, MSPC 플롯 및 추가 드릴다운 정보는 본 발명의 연속적인 온라인 모니터링 시스템의 사용자가 공정 플랜트의 엔지니어로 하여금 생산 공정의 잠재적 문제를 조사할 위치를 지시해줄 수 있게 한다. 이러한 정보는 제조 공정 내의 문제 지점 또는 지점들을 특별히 찾아내는데 유용하여, 공정이 더욱 능률적이도록 하고 산물 생산이 최대화되도록 하며, 안정성 조절이 최대화되도록 하여 불필요하거나 원하지 않는 위험 또는 사건을 최소화한다.If the user wants more details on a particular feature of the overall process or wants to obtain more details on a particular or potential problem in one of the components or subcomponents of the display, the user can see in FIG. Selecting a particular area of interest outside of the control range of one or more plots illustrated may result in additional details by "drilling down" to further lower-level information about the details of the process. FIG. 8A illustrates an
도 8b는 디스플레이 윈도우(180)를 나타낸 것이다. 도 8b에는 도 8a의 플롯(174)의 MSPC 시간 경향(181)의 또 다른 뷰를 예시한 것으로, 여기서는 사용자가 MSPC 오류에 기여하는 당해의 특정 개별 공정 점을 "드릴 다운"함으로써 추가 검토하기 위해 186에서 원하는 시작 및 종료 날짜 범위를 선택했다. 기여 분석을 시작하기 위해, 사용자는 실행 버튼(188)을 선택하여 소정의 시간 범위에서 SPEx 분석법에 기여하는 태그 플롯을 작도했다. 이 디스플레이는 시간 변동성 SPEx 분석값(174), 역치 모니터링 범위 값(132), 당해 외측 데이터 점의 동그라미 친 범위(133)를 예시한다. 도 8c는 도 8b에 도시된 데이터 점들의 상대적 기여 계산값을 요구하고 수득하는 예이다. 여기에 예시된 것처럼, 범위 선택 및 상대적 기여 옵션(187)을 모두 선택했으면, 그 다음 디스플레이 플롯(181) 내의 기본 범위(189)의 시작 및 종료 지점을 선택한다. 상대적 기여에 관한 당해 범위(133)의 시작점과 종료점을 그 다음 선택하고, 계산을 실행하기 위해 버튼(188)을 선택한다.8B illustrates
도 9는 9 is
도 7은 개별 플랜트 섹션의 예시적인 다변량 전체보기 스크린을 예시한 것이다.7 illustrates an exemplary multivariate overview screen of individual plant sections.
도 8a 내지 8C는 도 7에 도시된 X-일관성(XCon 또는 SPEx)에 대한 다변량 통계 공정 제어(MSPC) 플롯, 범위 기여 선택 옵션, 및 상대적 기여 선택 옵션을 예시한 것이다.8A-8C illustrate multivariate statistical process control (MSPC) plots, range contribution selection options, and relative contribution selection options for X-consistency (XCon or SPEx) shown in FIG. 7.
도 9는 디스플레이 플롯(181)로부터 드릴 다운을 예시한 디스플레이 윈도우(190)를 도시한 것으로, 태그의 범위 기여를 눈금이 있는 기여 vs. 태그의 막대 플롯으로 나타내고 있다. 디스플레이 윈도우는 각각 양성 및 음성 기여 태그(192), 뿐만 아니라 기여 타입을 보여주는 인디케이터(198)(이 경우에, XCon 또는 SPEx) 및 디스플레이된 기여의 시간 범위를 예시하고 있다. 또한, 디스플레이 윈도우(190)는 디스플레이 텍스트(196)로 도시된 바와 같은 불일치 값 vs. 범위에 관한 정보를 제공할 수 있다. 또한, 기여로부터 태그를 일시적 배제시키기 위한 선택 장치(194), 예컨대 체크 박스도 경우에 따라 포함될 수 있다. 192와 같이 막대 상에 적당한 선택 장치를 두면, 사용자는 태그 설명 정보를 수득할 수 있고, 원하는 막대를 선택하여 도 10에 도시된 바와 같은 시간 경향 정보를 볼 수 있다. 도 10은 도 9의 태그(192)를 드릴 다운하여 수득되는 경시적인 예시적 태그 플롯(202)를 보여주는 디스플레이 윈도우(200) 중의 시간 경향 그래픽 플롯이다. 이 디스플레이 윈도우는 또한 제시된 플롯에 관한 정보를 디스플레이하기 위한 인디케이터(203)도 포함한다. 도 10에 예시된 바와 같이 이러한 경향 및 태그 플롯은 NetTrend 소프트웨어 툴(Matrikon ProcessNet suite의 일부로 입수용이함, Edmonton Alberta, Canada)과 같은 적당한 소프트웨어 또는 애플리케이션을 사용하여 디스플레이할 수 있다. 당해의 예에 따르면, 완충액 용기 압력의 시간 경향이 제시되고, 동그라미 친 영역(204)은 압력의 잠재적으로 비정상적인 급강에 대응하는 것으로 볼 수 있다. 당해의 예에서, 이러한 압력 강하는 도 7 내지 8C의 동그라미 친 영역(133)에서 관찰되고 도 6 내지 9에서 "드릴 다운"에 의해 조사된 고도의 X 일관성 오류(SPEx)가 궁극적인 원인이다. 따라서, 사용자는 몇 층의 드릴 다운에서, 잠재적 이상이 발생한 거의 전체 제조 공정 내의 적당한 공정 지점을 측정할 수 있다,FIG. 9 shows a
이제 도 11을 살펴보면, 제조 공정의 다양한 단위 작업 간에 통신을 통합시킨 실시간에 가까운 작업에 사용하기 위한 연속 온라인 모니터링 시스템의 산업적 실행을 위한 전체 컴퓨터 시스템(201)을 예시한 것이다. 도 11에 제시된 시스템 구조는 2가지 기본 구성요소로 이루어질 수 있다: 온라인 모니터링 시스템(207) 및 오프라인 모델링 시스템(205). 온라인 모니터링 시스템은 데이터 티어(206), 계산 티어(208) 및 프리젠테이션 티어(210)를 포함하는 표준 3 티어 소프트웨어 개발 프레임워크에 따라 설계한다.Referring now to FIG. 11, illustrated is a
데이터 티어(206) 내에서, 데이터 엑세스 서버(220)는 제조 공정 또는 설비 내의 다수의 단위 작업으로부터 다소의 공정 측정값(태그)(232)에 연속적인 실시간에 가까운 엑세스를 제공한다. 본 발명의 일부 비제한적 양태에 따르면, OPC 데이터 엑세스 사양이 채택될 수 있으나, 적당하거나 원한다면 PI도 사용할 수 있다. 선택된 실시간에 가까운 데이터는 모델 계산을 위해 제2 티어(208)로 공급하고, 동시에 데이터 기록보관 목적을 위해 보통 이더넷 연결을 이용하여 실행되는 데이터 엑세스 네트워크(216)를 통해 공정의 실제 데이터베이스(218)로 공급한다. 기록보관된 데이터는 필요하다면, 예컨대 전체 생산공정의 변화에 비추어 MPLS(잠복 구조에 대한 다변량 돌출) 또는 MPCA(다변량 주요 성분 분석) 모델이 재구축되거나 변경되어야 할 때, 오프라인 모델링 시스템에서 사용될 수 있다.Within
도 11의 계산 티어(208)는 데이터 엑세스 인터페이스(예, 216)를 통해 실시간에 가깝게 데이터를 수신할 수 있는 계산 서버(222)를 포함한다. 서버(222)는 MPLS 또는 MPCA 계산(들)을 수행할 수 있고, HMI(사람-기계 인터페이스) 컴퓨터(224) 또는 원거리 작업자(226, 228)에게 임의의 경보-관련 정보를 보낼 수 있다.The
프리젠테이션 티어(210)는 HMI 컴퓨터(224), 보안 서버 또는 인터넷을 통해 시스템에 연결된 원거리 작업자 디스플레이 시스템(226) 및/또는 무선 연결, 예컨대 전용 장치이거나 그렇지 않을 수 있는 PDA 등을 통해 시스템에 연결된 원거리 작업자 디스플레이(228)를 포함할 수 있다. 사람-기계 인터페이스 컴퓨터 시스템(224)은 제조 설비 제어실에 직접 위치할 수 있고, 일반적으로 현행 작업 조건을 디스플레이할 수 있으며, 비정상 온도 스파이크 또는 흐름 조절 문제(본 명세서에 기술된 다변량 모델로부터의 SPE 또는 T2 통계값에 의해 제공된 정보를 바탕으로)와 같은 급박한 공정 이상에 관한 경보를 제공할 수 있으며, 경보가 발생한 때를 작업자가 정확히 결정할 수 있도록 도와줄 수 있다. 컴퓨터 시스템(224)과 사용하기 위한 서버-사용자 인터페이스는 당업계에 공지된 임의의 적당한 인터페이스일 수 있고, 여기에는 인터넷 익스플로러(마이크로소프트 코포레이션에서 입수가능) 또는 유사 소프트웨어가 포함되지만, 이에 국한되는 것은 아니다.The
오프라인 모델링 시스템(205)은 데이터 엑세스 네트워크(216)를 통해 생산 네트워크에 연결하는 하나 이상의 개발 컴퓨터(212)를 포함한다. 개발 컴퓨터(212)는 연속 MPLS 또는 MPCA 모델 개발에, 모델 성능 평가에 및 다른 특별 분석에 사용하기 위해 본 명세서에 기술된 바와 같은 공정 실제 데이터에 접근할 수 있다. 이러한 분석들은 시스템을 고도의 가동시간 하에 가동되도록 하는데 매우 중요하다. 또한, MPLS 및 MPCA 모델 개발 방법이 모두 본 발명에 적용될 수 있지만, 본 발명의 한 관점에 따르면 통계 모델 개발의 바람직한 방법은 MPLS 또는 PLS이다.The
당업자는 전술한 컴퓨터 시스템이 다양한 상황에서 달라질 수 있고, 예컨대 데이터 엑세스 서버 대신에 주문제작된 데이터 획득 시스템이 사용될 수 있거나, HMI 기계의 디스플레이 기능이 DCS(Distributed Control System)과 같은 다른 조절 시스템에 통합될 수 있다. 따라서, 본 발명은 앞에서 예시한 시스템 및 구조에만 제한되지 않는다.Those skilled in the art will appreciate that the computer system described above may vary in various situations, for example, a customized data acquisition system may be used instead of a data access server, or the display function of the HMI machine may be integrated into another control system such as a Distributed Control System (DCS). Can be. Thus, the present invention is not limited to only the systems and structures illustrated above.
산업상 이용가능성Industrial availability
본 명세서에 기술된 방법 및 시스템은 다양한 제조 시나리오에 적용될 수 있다. 예를 들어, 에틸렌 옥사이드, 에틸렌 글리콜, 스티렌, 저급 올레핀, 프로판 디올(PDO, 생물학적 또는 합성)을 비롯한(이에 국한되지 않음) 화학 제조 플랜트, 또는 이와 유사한 화학 제조 플랜트의 연속적인 온라인 모니터링에 사용하기에 적합한 것 외에, 본 명세서에 기술된 시스템 및 방법은 정제소, 석유화학 생산 설비, 촉매 제조 설비 등에도 적용할 수 있다. 예를 들어, 본 발명의 연속적인 실시간에 가까운 모니터링 시스템 및 방법은 화학 공정 동안 촉매 성능을 모니터링하는데 사용될 수 있을 뿐만 아니라 회전 장치와 같은 기계류의 성능 특징을 모니터링하는 데에도 사용될 수 있다. 또한, 당해의 시스템 및 방법은 원거리에 위치한 설비, 예컨대 컴프레서의 모니터링에도 사용할 수 있다. 다른 적용분야로는 연속적인 실시간에 가까운 공정의 모니터링, 예컨대 수압할렬, 치수, 및 다수의 원거리에 위치한 탄화수소 또는 물 생산 웰의 생산이 포함된다. 일반적으로, 본 명세서에 기술된 시스템은 적어도 하나의 다변량 특징을 가진 거의 모든 화학 또는 제조 공정 또는 구성요소와 함께 사용될 수 있다.The methods and systems described herein can be applied to a variety of manufacturing scenarios. For use in continuous online monitoring of chemical manufacturing plants, including, but not limited to, ethylene oxide, ethylene glycol, styrene, lower olefins, propane diols (PDO, biological or synthetic), or similar chemical manufacturing plants, for example. In addition to being suitable for, the systems and methods described herein may be applied to refineries, petrochemical production equipment, catalyst production equipment, and the like. For example, the continuous near real-time monitoring system and method of the present invention can be used not only to monitor catalyst performance during chemical processes but also to monitor performance characteristics of machinery such as rotary devices. The present systems and methods can also be used for the monitoring of remotely located equipment, such as compressors. Other applications include continuous near real-time monitoring of processes, such as hydrostraining, dimensions, and production of multiple remotely located hydrocarbon or water production wells. In general, the systems described herein can be used with almost any chemical or manufacturing process or component having at least one multivariate feature.
본 발명은 바람직하고 다른 양태들의 상황에서 설명되었지만, 본 발명의 모든 양태가 설명된 것은 아니다. 설명된 양태들에 대한 분명한 변형과 변경이 당업자에게는 자명한 것이다. 개시된 양태는 물론 개시되지 않은 양태들도 본 출원인이 착상한 본 발명의 범위 또는 이용가능성을 제한하거나 한정하려는 것이 아니고, 특허법에 따라 출원인은 다음 청구의 범위 또는 이의 등가물의 범위에 속하는 모든 변형 및 개량을 전부 보호받고자 한다.Although the present invention is preferred and described in the context of other aspects, not all aspects of the invention have been described. Obvious modifications and variations of the described aspects will be apparent to those skilled in the art. The disclosed embodiments as well as the non-disclosed embodiments are not intended to limit or limit the scope or applicability of the present invention conceived by the applicant, and in accordance with patent law, the applicant is entitled to all modifications and improvements that fall within the scope of the following claims or their equivalents. Want to be protected.
도 1에서, 10 : 시스템
12 : 센서 또는 분석 지점
14 : 데이터 엑세스 또는 분석 스테이션
도 2에서, 12 : 모델링전 단계
12a 및 12b : 태그In Figure 1, 10: system
12: sensor or analysis point
14: data access or analysis station
In Figure 2, 12: pre-modeling step
12a and 12b: tags
Claims (14)
산업적 생산 설비 내에 위치한 복수의 분석 데이터 측정 센서;
다변량 통계 모델; 및
현행 작업 조건 및 최근 기록을 디스플레이하기 위한 사람-기계 인터페이스를 포함하고,
산업적 생산 설비의 복수의 단위 작업을 포함하는 실시간에 가까운 시스템.A near real-time system for continuous online monitoring of working conditions in industrial production facilities.
A plurality of analytical data measurement sensors located within an industrial production facility;
Multivariate statistical model; And
A human-machine interface for displaying current working conditions and recent records,
Near-real-time system involving multiple unit operations of industrial production facilities.
산업적 생산 설비의 실시간에 가까운 공정 분석 데이터를 수득하기 위한 복수의 측정 센서;
데이터 엑세스 모듈;
모델 계산 모듈; 및
계산된 공정 상태에 따라 원하는 작업 범위와 현행 작업 상태를 디스플레이하기 위한 사람-기계 인터페이스를 포함하는 실시간에 가까운 시스템.It is a near real-time system for continuous online monitoring of continuous industrial production facilities and predicting impending process anomalies.
A plurality of measurement sensors for obtaining near real-time process analysis data of industrial production facilities;
A data access module;
Model calculation module; And
Near real-time system with human-machine interface for displaying the desired working range and the current working status according to the calculated process conditions.
모니터될 산업적 생산 설비에서 복수의 단위 작업으로부터 공정 데이터를 획득하는 단계;
산업적 생산 설비의 정상 작업에 대응하는 다변량 통계 모델을 개발하는 단계;
상기 다변량 통계 모델을 x-hat 점검 및/또는 y-hat 점검을 이용하여 확인하는 단계;
상기 다변량 통계 모델을 포함시킨 연속적인 실시간에 가까운 온라인 모니터링 시스템을 수득하는 단계;
상기 산업적 생산 설비의 작업 동안 복수의 단위 작업으로부터 공정 매개변수의 온라인 측정값을 획득하는 단계; 및
상기 온라인 측정값이 상기 다변량 통계 모델에 의해 설명된 정상 작업 매개변수와 일치하는지를 측정하는 단계를 포함하는 방법.As a way to closely monitor real-time operations of continuous or batch industrial production facilities,
Obtaining process data from a plurality of unit operations in an industrial production facility to be monitored;
Developing a multivariate statistical model corresponding to normal operation of the industrial production facility;
Confirming the multivariate statistical model using an x-hat check and / or a y-hat check;
Obtaining a continuous near real time online monitoring system including the multivariate statistical model;
Obtaining on-line measurements of process parameters from a plurality of unit operations during the operation of the industrial production facility; And
Measuring whether the on-line measurement is consistent with normal working parameters described by the multivariate statistical model.
Applications Claiming Priority (2)
| Application Number | Priority Date | Filing Date | Title |
|---|---|---|---|
| US95572707P | 2007-08-14 | 2007-08-14 | |
| US60/955,727 | 2007-08-14 |
Publications (1)
| Publication Number | Publication Date |
|---|---|
| KR20100042293A true KR20100042293A (en) | 2010-04-23 |
Family
ID=39791037
Family Applications (1)
| Application Number | Title | Priority Date | Filing Date |
|---|---|---|---|
| KR1020107005743A Withdrawn KR20100042293A (en) | 2007-08-14 | 2008-08-12 | System and methods for continuous, online monitoring of a chemical plant or refinery |
Country Status (10)
| Country | Link |
|---|---|
| US (1) | US20090149981A1 (en) |
| EP (1) | EP2179338A1 (en) |
| JP (1) | JP2010537282A (en) |
| KR (1) | KR20100042293A (en) |
| CN (1) | CN101842756A (en) |
| BR (1) | BRPI0815489A2 (en) |
| CA (1) | CA2695783A1 (en) |
| RU (1) | RU2010109422A (en) |
| TW (1) | TW200916992A (en) |
| WO (1) | WO2009023659A1 (en) |
Cited By (2)
| Publication number | Priority date | Publication date | Assignee | Title |
|---|---|---|---|---|
| KR20190025474A (en) * | 2017-09-01 | 2019-03-11 | 두산중공업 주식회사 | Apparatus and Method for Predicting Plant Data |
| KR102102544B1 (en) * | 2018-10-31 | 2020-04-22 | 한국전력공사 | Method for predicting early warning using data filtering and early warning apparatus using the same |
Families Citing this family (87)
| Publication number | Priority date | Publication date | Assignee | Title |
|---|---|---|---|---|
| US7444197B2 (en) | 2004-05-06 | 2008-10-28 | Smp Logic Systems Llc | Methods, systems, and software program for validation and monitoring of pharmaceutical manufacturing processes |
| US7799273B2 (en) | 2004-05-06 | 2010-09-21 | Smp Logic Systems Llc | Manufacturing execution system for validation, quality and risk assessment and monitoring of pharmaceutical manufacturing processes |
| US7761172B2 (en) * | 2006-03-21 | 2010-07-20 | Exxonmobil Research And Engineering Company | Application of abnormal event detection (AED) technology to polymers |
| US7720641B2 (en) * | 2006-04-21 | 2010-05-18 | Exxonmobil Research And Engineering Company | Application of abnormal event detection technology to delayed coking unit |
| US7606681B2 (en) * | 2006-11-03 | 2009-10-20 | Air Products And Chemicals, Inc. | System and method for process monitoring |
| US7680553B2 (en) * | 2007-03-08 | 2010-03-16 | Smp Logic Systems Llc | Methods of interfacing nanomaterials for the monitoring and execution of pharmaceutical manufacturing processes |
| US20090106290A1 (en) * | 2007-10-17 | 2009-04-23 | Rivard James P | Method of analyzing manufacturing process data |
| US8966384B2 (en) * | 2007-11-12 | 2015-02-24 | Honeywell International Inc. | Apparatus and method for displaying energy-related information |
| US8761909B2 (en) * | 2007-11-30 | 2014-06-24 | Honeywell International Inc. | Batch process monitoring using local multivariate trajectories |
| US7918994B2 (en) * | 2008-03-27 | 2011-04-05 | Brimrock International Inc. | System that removes contaminants from sulfur |
| US20100033486A1 (en) * | 2008-07-01 | 2010-02-11 | Karl Erik Vilhelm Dahlen | Method and system of determining and visualizing dependencies between industrial process parameters |
| US8165700B2 (en) * | 2008-10-02 | 2012-04-24 | Fisher-Rosemount Systems, Inc. | Complete integration of stand-alone batch operator interface capabilities into generic human machine interface using componentized objects |
| US9458388B2 (en) | 2008-11-03 | 2016-10-04 | Nalco Company | Development and implementation of analyzer based on control system and algorithm |
| US9150793B2 (en) | 2008-11-03 | 2015-10-06 | Nalco Company | Method of reducing corrosion and corrosion byproduct deposition in a crude unit |
| EP2374029A2 (en) * | 2009-01-05 | 2011-10-12 | Services Pétroliers Schlumberger | Processing time series data embedded in high noise |
| US8707193B2 (en) * | 2009-05-15 | 2014-04-22 | Incheck Technologies, Inc. | Remote monitoring system and method |
| US8571696B2 (en) * | 2009-06-10 | 2013-10-29 | Fisher-Rosemount Systems, Inc. | Methods and apparatus to predict process quality in a process control system |
| US9323234B2 (en) * | 2009-06-10 | 2016-04-26 | Fisher-Rosemount Systems, Inc. | Predicted fault analysis |
| US8326789B2 (en) | 2009-08-20 | 2012-12-04 | Uop Llc | Expert system integrated with remote performance management |
| US8862250B2 (en) | 2010-05-07 | 2014-10-14 | Exxonmobil Research And Engineering Company | Integrated expert system for identifying abnormal events in an industrial plant |
| US20120089434A1 (en) * | 2010-10-06 | 2012-04-12 | Schlitt John A | Method and apparatus for chemical data repository |
| CN102467089B (en) * | 2010-11-10 | 2013-09-11 | 北京北方微电子基地设备工艺研究中心有限责任公司 | Process control method of semiconductor technology and system thereof |
| US9378111B2 (en) * | 2010-11-11 | 2016-06-28 | Sap Se | Method and system for easy correlation between monitored metrics and alerts |
| US8329072B2 (en) | 2010-11-24 | 2012-12-11 | Brimrock International Inc. | Method and system for generating sulfur seeds and granules |
| CN102540992B (en) * | 2010-12-14 | 2014-09-10 | 中国石油天然气股份有限公司 | A remote intelligent measurement and control system, method and terminal for coalbed methane wells |
| US20120259679A1 (en) * | 2011-04-07 | 2012-10-11 | Infosys Technologies Limited | Method and system for devising and tracking measures for organizational value creation |
| US8769345B2 (en) | 2011-07-29 | 2014-07-01 | General Electric Company | Computing device and methods of presenting data to identify faults within power systems |
| JP5472753B2 (en) * | 2011-09-29 | 2014-04-16 | 横河電機株式会社 | Operating state monitoring device and operating state monitoring method |
| US20130100136A1 (en) * | 2011-10-24 | 2013-04-25 | Kim Ordean Van Camp | Sparkline presentations of process control system alarms |
| GB2496040B (en) * | 2011-10-24 | 2019-04-03 | Fisher Rosemount Systems Inc | Predicted fault analysis |
| JP5868784B2 (en) * | 2012-05-31 | 2016-02-24 | 横河電機株式会社 | Process monitoring system and method |
| US9135135B2 (en) | 2012-06-28 | 2015-09-15 | Sap Se | Method and system for auto-adjusting thresholds for efficient monitoring of system metrics |
| TWI580771B (en) | 2012-07-25 | 2017-05-01 | 奈寇公司 | Design, development and implementation of analyzers based on control systems and algorithms |
| US10401164B2 (en) | 2012-10-16 | 2019-09-03 | Exxonmobil Research And Engineering Company | Sensor network design and inverse modeling for reactor condition monitoring |
| US9983575B2 (en) * | 2013-04-09 | 2018-05-29 | Fisher-Rosemount Systems, Inc. | Systems and methods to graphically display process control system information |
| US10514668B2 (en) | 2013-03-15 | 2019-12-24 | Fisher-Rosemount Systems, Inc. | Graphical process variable trend monitoring in a process control system using a navigation pane |
| US10180681B2 (en) | 2013-03-15 | 2019-01-15 | Fisher-Rosemount Systems, Inc. | Graphical process variable trend monitoring with zoom features for use in a process control system |
| WO2014143725A1 (en) * | 2013-03-15 | 2014-09-18 | Lantheus Medical Imaging, Inc. | Control system for radiopharmaceuticals |
| US10803636B2 (en) | 2013-03-15 | 2020-10-13 | Fisher-Rosemount Systems, Inc. | Graphical process variable trend monitoring, predictive analytics and fault detection in a process control system |
| US10013149B2 (en) | 2013-03-15 | 2018-07-03 | Fisher-Rosemount Systems, Inc. | Graphical process variable trend monitoring for a process control system |
| US20140379626A1 (en) * | 2013-06-20 | 2014-12-25 | Rockwell Automation Technologies, Inc. | Information platform for industrial automation stream-based data processing |
| US10018997B2 (en) * | 2013-06-28 | 2018-07-10 | Fisher-Rosemount Systems, Inc. | Non-intrusive data analytics in a process control system |
| CN103500280A (en) * | 2013-09-30 | 2014-01-08 | 沈阳化工大学 | Cell concentration online soft measurement method in glutamic acid fermentation process |
| US10956014B2 (en) * | 2013-12-27 | 2021-03-23 | Baker Hughes, A Ge Company, Llc | Systems and methods for dynamically grouping data analysis content |
| CA2944635A1 (en) | 2014-04-03 | 2015-10-08 | Schlumberger Canada Limited | State estimation and run life prediction for pumping system |
| KR101674260B1 (en) * | 2014-10-14 | 2016-11-08 | 엘에스산전 주식회사 | System and method for managing water in water pipe network |
| WO2016070216A1 (en) * | 2014-11-03 | 2016-05-12 | Technological Resources Pty Limited | Remote monitoring and optimisation centre |
| CN104503402B (en) * | 2014-12-13 | 2017-04-19 | 中国烟草总公司郑州烟草研究院 | Method for inspecting cigarette rolling quality stability in cigarette processing |
| EP3276436B1 (en) * | 2015-03-24 | 2021-07-28 | Mitsubishi Electric Corporation | Plant monitor/control device |
| US10360249B2 (en) | 2015-04-10 | 2019-07-23 | Trendminder N.V. | System and method for creation and detection of process fingerprints for monitoring in a process plant |
| WO2017035377A1 (en) | 2015-08-26 | 2017-03-02 | Lin And Associates | History compare software |
| US10228685B2 (en) * | 2015-10-22 | 2019-03-12 | Globalfoundries Inc. | Use of multivariate models to control manufacturing operations |
| EP3383972A1 (en) * | 2015-12-04 | 2018-10-10 | General Electric Company | System and method of predictive analytics for control of an overhead crude section of a hydrocarbon refining process |
| US10394973B2 (en) * | 2015-12-18 | 2019-08-27 | Fisher-Rosemount Systems, Inc. | Methods and apparatus for using analytical/statistical modeling for continued process verification (CPV) |
| US11069102B2 (en) | 2016-05-23 | 2021-07-20 | Lin and Associates, Inc. | Dynamic progressive awareness |
| WO2017205238A1 (en) | 2016-05-23 | 2017-11-30 | Lin And Associates, Inc | Dynamic progressive awareness |
| EP3258333A1 (en) * | 2016-06-17 | 2017-12-20 | Siemens Aktiengesellschaft | Method and system for monitoring sensor data of rotating equipment |
| MX2019000300A (en) | 2016-07-07 | 2019-06-20 | Ats Automation Tooling Systems Inc | System and method for diagnosing automation systems. |
| EP3482266A1 (en) * | 2016-07-07 | 2019-05-15 | Aspen Technology Inc. | Computer system and method for monitoring key performance indicators (kpis) online using time series pattern model |
| CN109643085B (en) * | 2016-08-23 | 2022-05-10 | 埃森哲环球解决方案有限公司 | Real-time industrial equipment production forecasting and operational optimization |
| CN107817335A (en) * | 2016-09-13 | 2018-03-20 | 普瑞米尔伊沃维克斯私人有限公司 | The integrated system and method for on-line monitoring and off-line test are carried out in weaving unit |
| JP6747218B2 (en) * | 2016-09-28 | 2020-08-26 | 横河電機株式会社 | Plant simulation device and plant simulation method |
| CN110419011A (en) * | 2017-03-17 | 2019-11-05 | 龙沙有限公司 | Automate batch data analysis |
| DE102017108547A1 (en) * | 2017-04-21 | 2018-10-25 | Sig Technology Ag | Providing a user interface for monitoring and / or controlling a packaging installation |
| JP6991833B2 (en) * | 2017-10-31 | 2022-01-13 | 株式会社日立製作所 | Causal relationship model construction system and method |
| US11687064B2 (en) * | 2017-11-08 | 2023-06-27 | Honeywell International Inc. | IBATCH interactive batch operations system enabling operational excellence and competency transition |
| EP3511784A1 (en) * | 2018-01-15 | 2019-07-17 | Covestro Deutschland AG | Method for improving a chemical production process |
| EP3511782A1 (en) * | 2018-01-15 | 2019-07-17 | Covestro Deutschland AG | Method for improving a chemical production process |
| EP3511783A1 (en) * | 2018-01-15 | 2019-07-17 | Covestro Deutschland AG | Method for improving a chemical production process |
| EP3521273A1 (en) | 2018-02-05 | 2019-08-07 | YARA International ASA | A method and system for controlling an operation of a urea production process |
| US10734098B2 (en) * | 2018-03-30 | 2020-08-04 | Uop Llc | Catalytic dehydrogenation catalyst health index |
| EP3776116A1 (en) * | 2018-05-18 | 2021-02-17 | Siemens Aktiengesellschaft | Online fault localization in industrial processes without utilizing a dynamic system model |
| CN109712052A (en) * | 2018-08-30 | 2019-05-03 | 中节能唯绿(北京)科技股份有限公司 | Urban area energy wisdom manages platform |
| CN109857067B (en) * | 2018-12-23 | 2021-01-05 | 北京首钢自动化信息技术有限公司 | Steelmaking multi-process temperature coordination control system and method under big data environment |
| TWI831864B (en) | 2018-12-27 | 2024-02-11 | 美商Bl科技公司 | System and method for dynamic monitoring and control of a process gas compressor |
| CN109813782B (en) * | 2019-02-01 | 2020-12-29 | 杭州原创软件有限公司 | Self-diagnosis PH on-line monitoring system and method |
| EP3696619A1 (en) * | 2019-02-15 | 2020-08-19 | Basf Se | Determining operating conditions in chemical production plants |
| WO2020210034A1 (en) * | 2019-04-10 | 2020-10-15 | Exxonmobil Research And Engineering Company | Dynamic quality control in petrochemical, chemical, and pharmaceutical manufacturing processes |
| US20200402077A1 (en) * | 2019-06-20 | 2020-12-24 | Saudi Arabian Oil Company | Model predictive control using semidefinite programming |
| JP7273202B2 (en) * | 2019-06-27 | 2023-05-12 | タタ・コンサルタンシー・サーヴィシズ・リミテッド | Method and system for performance optimization of flue gas desulfurization (FGD) units |
| EP3879360A1 (en) * | 2020-03-12 | 2021-09-15 | Basf Se | Method for controlling and/or monitoring an equipment of a chemical plant |
| US20210294307A1 (en) * | 2020-03-19 | 2021-09-23 | Honeywell International Inc. | Assisted engineering design and development management system |
| EP4241144A1 (en) * | 2020-11-06 | 2023-09-13 | Basf Se | System for determining operating points in a chemical plant |
| EP4020107B1 (en) * | 2020-12-23 | 2023-11-29 | Red Bull GmbH | Method for monitoring the production of containers filled with an aqueous system with a production system, use of a monitoring method and production system |
| CN114517889B (en) * | 2022-01-25 | 2024-01-23 | 佛山绿色发展创新研究院 | Control method for realizing hydrogen quality on-line detection and hydrogenation system |
| GB202308527D0 (en) * | 2023-06-08 | 2023-07-26 | Johnson Matthey Plc | A method of monitoring a chemical plant |
| KR20250154043A (en) * | 2024-04-19 | 2025-10-28 | 엘에스일렉트릭(주) | Electronic device providing user interface for process inspection and process inspection method using the same |
Family Cites Families (41)
| Publication number | Priority date | Publication date | Assignee | Title |
|---|---|---|---|---|
| US4461172A (en) * | 1982-05-24 | 1984-07-24 | Inc. In-Situ | Well monitoring, controlling and data reducing system |
| US5636693A (en) * | 1994-12-20 | 1997-06-10 | Conoco Inc. | Gas well tubing flow rate control |
| US5732776A (en) * | 1995-02-09 | 1998-03-31 | Baker Hughes Incorporated | Downhole production well control system and method |
| US5706896A (en) * | 1995-02-09 | 1998-01-13 | Baker Hughes Incorporated | Method and apparatus for the remote control and monitoring of production wells |
| WO1996024745A2 (en) * | 1995-02-09 | 1996-08-15 | Baker Hughes Incorporated | Computer controlled downhole tools for production well control |
| US5597042A (en) * | 1995-02-09 | 1997-01-28 | Baker Hughes Incorporated | Method for controlling production wells having permanent downhole formation evaluation sensors |
| US5730219A (en) * | 1995-02-09 | 1998-03-24 | Baker Hughes Incorporated | Production wells having permanent downhole formation evaluation sensors |
| NO325157B1 (en) * | 1995-02-09 | 2008-02-11 | Baker Hughes Inc | Device for downhole control of well tools in a production well |
| US5565862A (en) * | 1995-03-28 | 1996-10-15 | The Titan Corporation | Collection and management of pipeline-flow data |
| US6434435B1 (en) * | 1997-02-21 | 2002-08-13 | Baker Hughes Incorporated | Application of adaptive object-oriented optimization software to an automatic optimization oilfield hydrocarbon production management system |
| US6281489B1 (en) * | 1997-05-02 | 2001-08-28 | Baker Hughes Incorporated | Monitoring of downhole parameters and tools utilizing fiber optics |
| US6176323B1 (en) * | 1997-06-27 | 2001-01-23 | Baker Hughes Incorporated | Drilling systems with sensors for determining properties of drilling fluid downhole |
| ATE281260T1 (en) * | 1998-07-21 | 2004-11-15 | Dofasco Inc | SYSTEM BASED ON A MULTIVARIABLE STATISTICAL MODEL FOR REPRESENTING THE OPERATION OF A CONTINUOUS CASTING PLANT AND DETECTING IMPENDING BREAKTHROUGH |
| US6282452B1 (en) * | 1998-11-19 | 2001-08-28 | Intelligent Inspection Corporation | Apparatus and method for well management |
| US6182756B1 (en) * | 1999-02-10 | 2001-02-06 | Intevep, S.A. | Method and apparatus for optimizing production from a gas lift well |
| US6774807B1 (en) * | 1999-03-02 | 2004-08-10 | Cadence Design Systems, Inc. | Tamper detection mechanism |
| US6442445B1 (en) * | 1999-03-19 | 2002-08-27 | International Business Machines Corporation, | User configurable multivariate time series reduction tool control method |
| US6266619B1 (en) * | 1999-07-20 | 2001-07-24 | Halliburton Energy Services, Inc. | System and method for real time reservoir management |
| US6853921B2 (en) * | 1999-07-20 | 2005-02-08 | Halliburton Energy Services, Inc. | System and method for real time reservoir management |
| US6980940B1 (en) * | 2000-02-22 | 2005-12-27 | Schlumberger Technology Corp. | Intergrated reservoir optimization |
| US6865509B1 (en) * | 2000-03-10 | 2005-03-08 | Smiths Detection - Pasadena, Inc. | System for providing control to an industrial process using one or more multidimensional variables |
| CA2418732A1 (en) * | 2000-08-11 | 2002-02-21 | Dofasco Inc. | Desulphurization reagent control method and system |
| US7096092B1 (en) * | 2000-11-03 | 2006-08-22 | Schlumberger Technology Corporation | Methods and apparatus for remote real time oil field management |
| WO2002063130A1 (en) * | 2001-02-05 | 2002-08-15 | Schlumberger Holdings Limited | Optimization of reservoir, well and surface network systems |
| FR2821675B1 (en) * | 2001-03-01 | 2003-06-20 | Inst Francais Du Petrole | METHOD FOR DETECTING AND CONTROLLING THE FORMATION OF HYDRATES AT ANY POINT IN A PIPELINE OR CIRCULATING POLYPHASIC OIL FLUIDS |
| US7899657B2 (en) * | 2003-01-24 | 2011-03-01 | Rockwell Automoation Technologies, Inc. | Modeling in-situ reservoirs with derivative constraints |
| US7584165B2 (en) * | 2003-01-30 | 2009-09-01 | Landmark Graphics Corporation | Support apparatus, method and system for real time operations and maintenance |
| FR2851670B1 (en) * | 2003-02-21 | 2005-07-01 | Inst Francais Du Petrole | METHOD FOR RAPIDLY DEVELOPING A STOCHASTIC MODEL REPRESENTATIVE OF A UNDERGROUND HETEROGENEOUS RESERVOIR CONSTRAINTED BY UNCERTAIN STATIC AND DYNAMIC DATA |
| US7349746B2 (en) * | 2004-09-10 | 2008-03-25 | Exxonmobil Research And Engineering Company | System and method for abnormal event detection in the operation of continuous industrial processes |
| US7424395B2 (en) * | 2004-09-10 | 2008-09-09 | Exxonmobil Research And Engineering Company | Application of abnormal event detection technology to olefins recovery trains |
| US20060074598A1 (en) * | 2004-09-10 | 2006-04-06 | Emigholz Kenneth F | Application of abnormal event detection technology to hydrocracking units |
| US7567887B2 (en) * | 2004-09-10 | 2009-07-28 | Exxonmobil Research And Engineering Company | Application of abnormal event detection technology to fluidized catalytic cracking unit |
| US8352226B2 (en) * | 2006-01-31 | 2013-01-08 | Landmark Graphics Corporation | Methods, systems, and computer-readable media for real-time oil and gas field production optimization using a proxy simulator |
| CN101379498B (en) * | 2006-01-31 | 2012-05-30 | 兰德马克绘图公司 | Method and system for rapidly updating oil and gas field production models using physical and proxy simulators |
| US8504341B2 (en) * | 2006-01-31 | 2013-08-06 | Landmark Graphics Corporation | Methods, systems, and computer readable media for fast updating of oil and gas field production models with physical and proxy simulators |
| US7761172B2 (en) * | 2006-03-21 | 2010-07-20 | Exxonmobil Research And Engineering Company | Application of abnormal event detection (AED) technology to polymers |
| US7720641B2 (en) * | 2006-04-21 | 2010-05-18 | Exxonmobil Research And Engineering Company | Application of abnormal event detection technology to delayed coking unit |
| US8014880B2 (en) * | 2006-09-29 | 2011-09-06 | Fisher-Rosemount Systems, Inc. | On-line multivariate analysis in a distributed process control system |
| US7606681B2 (en) * | 2006-11-03 | 2009-10-20 | Air Products And Chemicals, Inc. | System and method for process monitoring |
| US8285513B2 (en) * | 2007-02-27 | 2012-10-09 | Exxonmobil Research And Engineering Company | Method and system of using inferential measurements for abnormal event detection in continuous industrial processes |
| GB0714939D0 (en) * | 2007-08-01 | 2007-09-12 | Seimtec Ltd | Improved solid cleaning |
-
2008
- 2008-08-12 US US12/190,467 patent/US20090149981A1/en not_active Abandoned
- 2008-08-12 TW TW097130701A patent/TW200916992A/en unknown
- 2008-08-12 CA CA2695783A patent/CA2695783A1/en not_active Abandoned
- 2008-08-12 WO PCT/US2008/072868 patent/WO2009023659A1/en not_active Ceased
- 2008-08-12 BR BRPI0815489A patent/BRPI0815489A2/en not_active IP Right Cessation
- 2008-08-12 EP EP08797673A patent/EP2179338A1/en not_active Withdrawn
- 2008-08-12 RU RU2010109422/08A patent/RU2010109422A/en not_active Application Discontinuation
- 2008-08-12 KR KR1020107005743A patent/KR20100042293A/en not_active Withdrawn
- 2008-08-12 CN CN200880109591A patent/CN101842756A/en active Pending
- 2008-08-12 JP JP2010521116A patent/JP2010537282A/en not_active Withdrawn
Cited By (3)
| Publication number | Priority date | Publication date | Assignee | Title |
|---|---|---|---|---|
| KR20190025474A (en) * | 2017-09-01 | 2019-03-11 | 두산중공업 주식회사 | Apparatus and Method for Predicting Plant Data |
| US10976729B2 (en) | 2017-09-01 | 2021-04-13 | DOOSAN Heavy Industries Construction Co., LTD | Method of generating plant normal state prediction data and apparatus using the same |
| KR102102544B1 (en) * | 2018-10-31 | 2020-04-22 | 한국전력공사 | Method for predicting early warning using data filtering and early warning apparatus using the same |
Also Published As
| Publication number | Publication date |
|---|---|
| JP2010537282A (en) | 2010-12-02 |
| US20090149981A1 (en) | 2009-06-11 |
| TW200916992A (en) | 2009-04-16 |
| CN101842756A (en) | 2010-09-22 |
| CA2695783A1 (en) | 2009-02-19 |
| EP2179338A1 (en) | 2010-04-28 |
| WO2009023659A1 (en) | 2009-02-19 |
| BRPI0815489A2 (en) | 2017-03-21 |
| RU2010109422A (en) | 2011-09-20 |
Similar Documents
| Publication | Publication Date | Title |
|---|---|---|
| KR20100042293A (en) | System and methods for continuous, online monitoring of a chemical plant or refinery | |
| JP7461440B2 (en) | COMPUTER SYSTEM AND METHOD FOR PERFORMING ROOT CAUSE ANALYSIS AND BUILDING PREDICTION MODELS FOR THE OCCURRENCE OF RARE EVENTS IN PLANT-WIDE OPERATIONS - Patent application | |
| US7206646B2 (en) | Method and apparatus for performing a function in a plant using process performance monitoring with process equipment monitoring and control | |
| KR102169561B1 (en) | Data cleansing system and method for inferring feed composition | |
| JP5666543B2 (en) | Method and system for detecting an abnormal situation associated with a processing plant | |
| US7853431B2 (en) | On-line monitoring and diagnostics of a process using multivariate statistical analysis | |
| US20210116891A1 (en) | System And Methods For Automated Model Development From Plant Historical Data For Advanced Process Control | |
| US20180046155A1 (en) | Identifying and implementing refinery or petrochemical plant process performance improvements | |
| JP2015011722A (en) | Non-intrusive data analysis in process control systems | |
| CN101536002A (en) | System and method for process monitoring | |
| WO2008042739A2 (en) | On-line monitoring and diagnostics of a process using multivariate statistical analysis | |
| CN116648680A (en) | Auxiliary device and method for automatic identification of fault types of technical systems | |
| CN111837082B (en) | Ultrasonic flow meter prognostics using near real-time conditions | |
| WO2019023210A1 (en) | Cleansing system for a feed composition based on environmental factors | |
| RU2777950C1 (en) | Detection of emergency situations for predictive maintenance and determination of end results and technological processes based on the data quality | |
| WO2019028020A1 (en) | Refinery or petrochemical plant process performance improvements. | |
| WO2008042757A2 (en) | Univariate method for monitoring and analysis of multivariate data | |
| Suzuki et al. | An Online Anomaly Detection System Supporting Batch-Process Operator Decision-Making |
Legal Events
| Date | Code | Title | Description |
|---|---|---|---|
| PA0105 | International application |
Patent event date: 20100315 Patent event code: PA01051R01D Comment text: International Patent Application |
|
| PG1501 | Laying open of application | ||
| PC1203 | Withdrawal of no request for examination | ||
| WITN | Application deemed withdrawn, e.g. because no request for examination was filed or no examination fee was paid |