KR101466798B1 - Method and apparatus for discovering the equipment causing product faults in manufacturing process - Google Patents
Method and apparatus for discovering the equipment causing product faults in manufacturing process Download PDFInfo
- Publication number
- KR101466798B1 KR101466798B1 KR1020140060603A KR20140060603A KR101466798B1 KR 101466798 B1 KR101466798 B1 KR 101466798B1 KR 1020140060603 A KR1020140060603 A KR 1020140060603A KR 20140060603 A KR20140060603 A KR 20140060603A KR 101466798 B1 KR101466798 B1 KR 101466798B1
- Authority
- KR
- South Korea
- Prior art keywords
- product
- facilities
- contribution
- facility
- calculating
- Prior art date
- Legal status (The legal status is an assumption and is not a legal conclusion. Google has not performed a legal analysis and makes no representation as to the accuracy of the status listed.)
- Active
Links
Images


Classifications
-
- G—PHYSICS
- G05—CONTROLLING; REGULATING
- G05B—CONTROL OR REGULATING SYSTEMS IN GENERAL; FUNCTIONAL ELEMENTS OF SUCH SYSTEMS; MONITORING OR TESTING ARRANGEMENTS FOR SUCH SYSTEMS OR ELEMENTS
- G05B19/00—Programme-control systems
- G05B19/02—Programme-control systems electric
- G05B19/418—Total factory control, i.e. centrally controlling a plurality of machines, e.g. direct or distributed numerical control [DNC], flexible manufacturing systems [FMS], integrated manufacturing systems [IMS] or computer integrated manufacturing [CIM]
- G05B19/41875—Total factory control, i.e. centrally controlling a plurality of machines, e.g. direct or distributed numerical control [DNC], flexible manufacturing systems [FMS], integrated manufacturing systems [IMS] or computer integrated manufacturing [CIM] characterised by quality surveillance of production
-
- G—PHYSICS
- G05—CONTROLLING; REGULATING
- G05B—CONTROL OR REGULATING SYSTEMS IN GENERAL; FUNCTIONAL ELEMENTS OF SUCH SYSTEMS; MONITORING OR TESTING ARRANGEMENTS FOR SUCH SYSTEMS OR ELEMENTS
- G05B2219/00—Program-control systems
- G05B2219/30—Nc systems
- G05B2219/32—Operator till task planning
- G05B2219/32187—Correlation between controlling parameters for influence on quality parameters
-
- G—PHYSICS
- G05—CONTROLLING; REGULATING
- G05B—CONTROL OR REGULATING SYSTEMS IN GENERAL; FUNCTIONAL ELEMENTS OF SUCH SYSTEMS; MONITORING OR TESTING ARRANGEMENTS FOR SUCH SYSTEMS OR ELEMENTS
- G05B2219/00—Program-control systems
- G05B2219/30—Nc systems
- G05B2219/32—Operator till task planning
- G05B2219/32204—Performance assurance; assure certain level of non-defective products
-
- G—PHYSICS
- G05—CONTROLLING; REGULATING
- G05B—CONTROL OR REGULATING SYSTEMS IN GENERAL; FUNCTIONAL ELEMENTS OF SUCH SYSTEMS; MONITORING OR TESTING ARRANGEMENTS FOR SUCH SYSTEMS OR ELEMENTS
- G05B2219/00—Program-control systems
- G05B2219/30—Nc systems
- G05B2219/32—Operator till task planning
- G05B2219/32324—Quality data determines optimum machine sequence selection, queuing rules
-
- G—PHYSICS
- G05—CONTROLLING; REGULATING
- G05B—CONTROL OR REGULATING SYSTEMS IN GENERAL; FUNCTIONAL ELEMENTS OF SUCH SYSTEMS; MONITORING OR TESTING ARRANGEMENTS FOR SUCH SYSTEMS OR ELEMENTS
- G05B2219/00—Program-control systems
- G05B2219/30—Nc systems
- G05B2219/45—Nc applications
- G05B2219/45031—Manufacturing semiconductor wafers
-
- H10P74/23—
-
- Y—GENERAL TAGGING OF NEW TECHNOLOGICAL DEVELOPMENTS; GENERAL TAGGING OF CROSS-SECTIONAL TECHNOLOGIES SPANNING OVER SEVERAL SECTIONS OF THE IPC; TECHNICAL SUBJECTS COVERED BY FORMER USPC CROSS-REFERENCE ART COLLECTIONS [XRACs] AND DIGESTS
- Y02—TECHNOLOGIES OR APPLICATIONS FOR MITIGATION OR ADAPTATION AGAINST CLIMATE CHANGE
- Y02P—CLIMATE CHANGE MITIGATION TECHNOLOGIES IN THE PRODUCTION OR PROCESSING OF GOODS
- Y02P90/00—Enabling technologies with a potential contribution to greenhouse gas [GHG] emissions mitigation
- Y02P90/02—Total factory control, e.g. smart factories, flexible manufacturing systems [FMS] or integrated manufacturing systems [IMS]
Landscapes
- Engineering & Computer Science (AREA)
- General Engineering & Computer Science (AREA)
- Manufacturing & Machinery (AREA)
- Quality & Reliability (AREA)
- Physics & Mathematics (AREA)
- General Physics & Mathematics (AREA)
- Automation & Control Theory (AREA)
- General Factory Administration (AREA)
Abstract
본 발명의 실시 예에 따른 제조 공정에서의 불량 설비 탐지 방법은: 제품의 공정 경로 데이터 및 공정 결과 데이터를 획득하는 단계; 상기 획득된 데이터들에 기초하여 상기 제품의 불량에 대한 복수의 설비들 각각의 기여도를 산출하는 단계; 상기 산출된 기여도에 기초하여 선택된 설비들에 대하여, 상기 제품의 불량에 기여하는 설비 및 경로의 누적 효과를 규칙으로 생성하는, 수정된 연관 규칙을 적용하는 단계; 그리고 상기 산출된 기여도 및 상기 수정된 연관 규칙에 기초하여 불량설비 판단 지수를 산출하는 단계를 포함할 수 있다. 본 발명의 실시 예에 따르면, 제조 공정에서의 제품 불량을 야기하는 혐의 설비를 효율적으로 탐지할 수 있다. 또한, 제조 공정의 수율을 증가시키는 최적의 경로를 탐색할 수 있다.A method of detecting a defective facility in a manufacturing process according to an embodiment of the present invention includes: obtaining process path data and process result data of a product; Calculating a contribution of each of the plurality of facilities to the fault of the product based on the obtained data; Applying a modified association rule to the selected facilities based on the calculated contribution to generate a cumulative effect of facilities and paths contributing to the failure of the product as rules; And calculating a bad facility determination index based on the calculated contribution and the modified association rule. According to the embodiment of the present invention, it is possible to efficiently detect an accused facility causing a product defect in the manufacturing process. Further, it is possible to search for an optimal path for increasing the yield of the manufacturing process.
Description
본 발명은 반도체 제조 공정에 관한 것으로, 좀 더 구체적으로는, 반도체 제조 공정에서의 제품 불량을 야기하는 원인 설비를 감지하는 방법에 관한 것이다.BACKGROUND OF THE
제조 공정에서의 수율은 제품의 품질, 원가 등을 결정하는 중요한 요소이다. 특히, 반도체 제조 공정과 같은 미세 제조 공정은 일반적으로 많은 단계의 공정을 거친다. 반도체 제조 공정은 각각의 공정마다 복수의 설비를 갖추고 있고, 복수의 설비들 중, 정해진 스케줄에 따라, 임의의 설비를 통하여 해당 공정에서의 처리가 완료된다. 이 경우, 제조 공정에서의 전체 설비의 수는 기하급수적으로 증가한다. 따라서, 수많은 설비들을 모두 검사하여 제품 불량의 원인 설비를 감지하는 것은 현실적으로 어려운 문제이다. 게다가, 설비들 간의 상관 관계가 존재하므로, 선공정과 후공정이 복합적으로 제품의 불량을 야기하는 누적효과가 존재할 수 있다. 이는 단순히 공정들 간의 상관 관계가 아니라, 공정에 관여하는 설비들 간의 상관 관계이다. 따라서, 제품 불량을 야기하는 설비 각각의 기여도를 분석하는 것뿐만 아니라, 설비 및 공정 경로에 따른 누적 요인을 분석하여 제품 불량을 야기하는 혐의 설비(suspicious equipment)를 감지하고 관리하는 것이 매우 중요하다.The yield in the manufacturing process is an important factor in determining the quality and cost of the product. In particular, microfabrication processes, such as semiconductor manufacturing processes, typically take many steps. The semiconductor manufacturing process has a plurality of facilities for each process, and the process in the process is completed through an arbitrary facility in accordance with a predetermined schedule among a plurality of facilities. In this case, the total number of installations in the manufacturing process increases exponentially. Therefore, it is a real difficult problem to inspect the numerous facilities to detect the cause of the product failure. Furthermore, since there is a correlation between the facilities, there may be a cumulative effect that causes the failure of the product due to the combination of the pre-process and the post-process. This is not simply a correlation between processes, but a correlation between processes involved in the process. Therefore, it is very important to not only analyze the contribution of each facility causing the product failure, but also to detect and manage the suspicious equipment causing the product failure by analyzing the cumulative factors along the facility and the process route.
본 발명의 목적은 제조 공정에서의 제품 불량을 야기하는 설비를 효율적으로 감지하는데 있다.It is an object of the present invention to efficiently detect equipment that causes product defects in the manufacturing process.
또한, 본 발명의 다른 목적은 제조 공정의 수율을 증가시키는 최적의 경로를 탐색하는데 있다.It is also an object of the present invention to seek an optimal path for increasing the yield of the manufacturing process.
본 발명의 실시 예에 따른, 복수의 공정들 각각에서 복수의 설비들 중 선택된 설비에 의해 제품이 생산되는 제조 공정에서의 불량 설비 탐지 방법은: 상기 제품의 공정 경로 데이터 및 공정 결과 데이터를 획득하는 단계; 상기 획득된 데이터들에 기초하여 상기 제품의 불량에 대한 상기 복수의 설비들 각각의 기여도를 산출하는 단계; 상기 산출된 기여도에 기초하여 선택된 설비들에 대하여, 상기 제품의 불량에 기여하는 설비 및 경로의 누적 효과를 규칙으로 생성하는, 수정된 연관 규칙을 적용하는 단계; 그리고 상기 산출된 기여도 및 상기 수정된 연관 규칙에 기초하여 불량설비 판단 지수를 산출하는 단계를 포함할 수 있다.A method for detecting a defective facility in a manufacturing process in which a product is produced by a selected one of a plurality of facilities in each of a plurality of processes according to an embodiment of the present invention includes the steps of: step; Calculating a contribution of each of the plurality of facilities to a fault of the product based on the obtained data; Applying a modified association rule to the selected facilities based on the calculated contribution to generate a cumulative effect of facilities and paths contributing to the failure of the product as rules; And calculating a bad facility determination index based on the calculated contribution and the modified association rule.
실시 예로써, 상기 획득하는 단계는: 상기 복수의 설비들이 상기 제품을 생산하는데 관여한 설비인지 여부에 따라 상기 공정 경로 데이터를 이진화하는 단계; 그리고 상기 제품이 정상인지 여부에 따라 상기 공정 결과 데이터를 이진화하는 단계를 포함할 수 있다.As an embodiment, the obtaining step may include: binarizing the process path data according to whether the plurality of facilities are equipment involved in producing the product; And binarizing the process result data according to whether the product is normal or not.
다른 실시 예로써, 상기 기여도를 산출하는 단계는 다변량 회귀분석 또는 변수 선택법을 사용하여 수행될 수 있다.In another embodiment, the step of calculating the contribution may be performed using a multivariate regression analysis or a variable selection method.
또 다른 실시 예로써, 상기 다변량 회귀분석 또는 상기 변수 선택법은 PLSR-VIP (Partial Least Square Regression-Variable Importance in the Projection), mRMR (Minimum-Redundancy-Maximum-Relevance) 변수 선택법, 또는 SVM-RFE (Support Vector Machine Recursive Feature Elimination) 중 어느 하나일 수 있다.As another embodiment, the multivariate regression analysis or the variable selection method may be applied to a PLSR-VIP (Partial Least Square Regression-Variable Importance in the Projection), a Minimum-Redundancy-Maximum-Relevance (mRMR) Vector Machine Recursive Feature Elimination).
또 다른 실시 예로써, 상기 수정된 연관 규칙을 적용하는 단계는: 상기 공정 경로 데이터에 대응하는 설비들로부터 상기 기여도가 제 1 기준값 이하인 설비들을 제거하여, 상기 규칙들을 생성하는 단계; 상기 규칙들로부터 상기 규칙들에 포함된 설비들 중 후공정 설비에 의한 누적 효과를 산출하는 단계; 그리고 상기 누적 효과가 제 2 기준값을 초과하는 규칙들에 대하여, 상기 수정된 연관 규칙 적용시 발생하는 파라미터들의 대표값을 산출하는 단계를 포함할 수 있다.In yet another embodiment, applying the modified association rule may include: removing facilities having the contribution less than or equal to a first reference value from facilities corresponding to the process path data to generate the rules; Calculating a cumulative effect of the facilities included in the rules from the rules by the post-processing facility; And calculating a representative value of parameters that occur when the modified association rule is applied to the rules whose cumulative effect exceeds a second reference value.
또 다른 실시 예로써, 상기 누적 효과는 선공정의 정확도에 대한, 후공정에 의한 불량율의 증가분의 비율일 수 있다.In another embodiment, the cumulative effect may be a ratio of an increase in a defective rate by a post-process to an accuracy of a pre-process.
또 다른 실시 예로써, 상기 수정된 연관 규칙을 적용하는 단계는 Apriori, Eclat, AprioriDP, 또는 CMPNARM 알고리즘을 사용함으로써 수행될 수 있다.In yet another embodiment, applying the modified association rules may be performed using an Apriori, Eclat, AprioriDP, or CMPNARM algorithm.
또 다른 실시 예로써, 상기 불량설비 판단 지수는 상기 기여도, 상기 파라미터들의 상기 대표값, 및 불량 제품의 개수 중 적어도 하나를 독립 변수로 하는 제 1 함수를 포함할 수 있다.In yet another embodiment, the defective equipment determination index may include a first function having at least one of the contribution, the representative value of the parameters, and the number of defective products as independent variables.
또 다른 실시 예로써, 상기 대표값은 산술평균(arithmetic mean), 강건평균(robust mean), 절사평균(trimed mean), 가중평균(weighted mean), 기하평균(geometric mean), 조화평균(harmonic mean), 또는 중앙값(median) 중 하나일 수 있다.In yet another embodiment, the representative value may be an arithmetic mean, a robust mean, a trimmed mean, a weighted mean, a geometric mean, a harmonic mean, ), Or a median.
또 다른 실시 예로써, 상기 불량설비 판단 지수는 상기 제품을 생산되는데 관여된 설비들 중 상기 누적 효과가 상기 기준값을 초과하는 규칙에 대응하는 설비들의 개수의 평균값을 독립 변수로 하는 제 2 함수를 포함할 수 있다.In another embodiment, the defective equipment determination index includes a second function having, as independent variables, an average value of the number of equipments corresponding to a rule that the cumulative effect exceeds the reference value among equipments involved in producing the product can do.
본 발명의 실시 예에 따른, 제조 공정에서의 불량 설비 탐지 장치는: 제품의 공정 경로 데이터 및 공정 결과 데이터를 획득하는 입력부; 그리고 상기 획득된 데이터들에 기초하여 상기 제품의 불량에 대한 각각의 설비의 기여도를 산출하고, 상기 산출된 기여도에 기초하여 선택된 설비들에 대하여 상기 제품의 불량에 기여하는 설비 및 생산 경로의 누적 효과를 규칙으로 생성하는 수정된 연관 규칙을 적용하고, 그리고 상기 산출된 기여도 및 상기 수정된 연관 규칙에 기초하여 불량설비 판단 지수를 산출하는 제어부를 포함할 수 있다.An apparatus for detecting bad facilities in a manufacturing process according to an embodiment of the present invention includes: an input unit for obtaining process path data and process result data of a product; Calculating a contribution of each facility to the defective product based on the obtained data, calculating cumulative effects of facilities and production paths contributing to the defective product to the selected facilities based on the calculated contribution, And a control unit for calculating a bad equipment determination index based on the calculated contribution and the modified association rule.
실시 예로써, 상기 제어부는 상기 복수의 설비들이 상기 제품을 생산하는데 관여한 설비인지 여부에 따라 상기 공정 경로 데이터를 이진화하고, 그리고 상기 제품이 정상인지 여부에 따라 상기 공정 결과 데이터를 이진화할 수 있다.In an embodiment, the control unit may binarize the process path data according to whether the plurality of facilities are equipment involved in producing the product, and binarize the process result data according to whether the product is normal or not .
다른 실시 예로써, 상기 제어부는 PLSR-VIP (Partial Least Square Regression-Variable Importance in the Projection), mRMR (Minimum-Redundancy-Maximum-Relevance) 변수 선택법, 또는 SVM-RFE (Support Vector Machine Recursive Feature Elimination) 중 어느 하나에 의하여 상기 기여도를 산출할 수 있다.In another embodiment, the control unit is configured to perform a PLSR-VIP (Partial Least Square Regression-Variable Importance in the Projection), an mRMR (Minimum-Redundancy-Maximum-Relevance) parameter selection method, or a SVM-RFE (Support Vector Machine Recursive Feature Elimination) The contribution can be calculated by any one of them.
또 다른 실시 예로써, 상기 누적 효과는 선공정의 정확도에 대한, 후공정에 의한 불량율의 증가분의 비율일 수 있다.In another embodiment, the cumulative effect may be a ratio of an increase in a defective rate by a post-process to an accuracy of a pre-process.
또 다른 실시 예로써, 상기 제어부는 상기 공정 경로 데이터에 대응하는 설비들로부터 상기 기여도가 제 1 기준값 이하인 설비들을 제거하여 상기 규칙들을 생성하고, 상기 규칙들로부터 상기 규칙들에 포함된 설비들 중 후공정 설비에 의한 누적 효과를 산출하고, 그리고 상기 누적 효과가 제 2 기준값을 초과하는 규칙들에 대하여, 상기 수정된 연관 규칙 적용시 발생하는 파라미터들의 대표값을 산출할 수 있다.In yet another embodiment, the control unit may generate the rules by removing facilities having the contribution less than or equal to a first reference value from facilities corresponding to the process path data, and extracting, from the rules, A cumulative effect of the process facility is calculated and a representative value of parameters occurring when applying the modified association rule is calculated for rules whose cumulative effect exceeds a second reference value.
또 다른 실시 예로써, 상기 불량설비 판단 지수는 상기 기여도에 비례하고, 그리고 상기 파라미터들의 대표값 또는 상기 파라미터들의 대표값들의 합에 비례할 수 있다.In another embodiment, the bad facility determination index is proportional to the contribution and may be proportional to a representative value of the parameters or a sum of representative values of the parameters.
본 발명의 실시 예에 따른, 복수의 공정들을 거치되, 상기 공정들 각각에서 복수의 설비들 중 선택된 설비에 의해 제품이 생산되는 제조 공정에서의 불량 설비 감지 방법은: 상기 제품의 공정 경로 데이터 및 공정 결과 데이터를 획득하는 단계; 상기 복수의 설비들이 상기 제품을 생산하는데 관여한 설비인지 여부에 따라 상기 공정 경로 데이터를 이진화하는 단계; 상기 제품이 정상인지 여부에 따라 상기 공정 결과 데이터를 이진화하는 단계; 상기 획득된 데이터들에 기초하여 상기 제품의 불량에 대한 각각의 설비의 기여도를 산출하는 단계; 상기 공정 경로 데이터 및 상기 산출된 기여도에 기초하여 생성된 규칙들에 대하여, 상기 제품의 불량에 기여하는 누적 효과를 반영함으로써, 수정된 연관 규칙을 적용하는 단계; 그리고 상기 산출된 기여도 및 상기 수정된 연관 규칙에 기초하여 불량설비 판단 지수를 산출하는 단계를 포함할 수 있다.A method for detecting a defective facility in a manufacturing process in which a plurality of processes are carried out and a product is produced by a selected one of a plurality of facilities in each of the processes according to an embodiment of the present invention includes: Obtaining process result data; Binarizing the process path data according to whether the plurality of facilities are facilities involved in producing the product; Binarizing the process result data according to whether the product is normal or not; Calculating a contribution of each facility to a fault of the product based on the obtained data; Applying the modified association rule to the rules generated based on the process path data and the calculated contribution, by reflecting the cumulative effect that contributes to the failure of the product; And calculating a bad facility determination index based on the calculated contribution and the modified association rule.
실시 예로써, 상기 수정된 연관 규칙을 적용하는 단계는: 상기 복수의 설비들 각각의 상기 기여도가 제 1 기준값을 초과하는지 여부를 판단하는 단계; 상기 규칙들 중, 상기 기여도가 상기 제 1 기준값을 초과한다고 판단된 설비들이 포함된 규칙들에 대하여, 누적 효과를 산출하는 단계; 그리고 상기 누적 효과가 상기 제 2 기준값을 초과하는 규칙들에 대하여, 상기 수정된 연관 규칙 적용시 발생하는 파라미터들의 대표값을 산출하는 단계를 포함할 수 있다.As an embodiment, the step of applying the modified association rule comprises: determining whether the contribution of each of the plurality of facilities exceeds a first reference value; Calculating a cumulative effect for rules including facilities that the contribution is judged to exceed the first reference value, among the rules; And calculating a representative value of parameters that occur when the modified association rule is applied to rules for which the cumulative effect exceeds the second reference value.
다른 실시 예로써, 상기 기여도를 산출하는 단계는 PLSR-VIP (Partial Least Square Regression-Variable Importance in the Projection), mRMR (Minimum-Redundancy-Maximum-Relevance) 변수 선택법, 또는 SVM-RFE (Support Vector Machine Recursive Feature Elimination) 중 어느 하나를 사용하여 수행될 수 있다.In another embodiment, the step of calculating the contribution may be performed using a PLSR-VIP (Partial Least Square Regression-Variable Importance in the Projection), a Minimum-Redundancy-Maximum-Relevance (mRMR) variable selection method, or SVM- Feature Elimination).
또 다른 실시 예로써, 상기 수정된 연관 규칙을 적용하는 단계는 Apriori, Eclat, AprioriDP, 또는 CMPNARM 알고리즘을 사용함으로써 수행될 수 있다.In yet another embodiment, applying the modified association rules may be performed using an Apriori, Eclat, AprioriDP, or CMPNARM algorithm.
본 발명의 실시 예에 따르면, 제조 공정에서의 제품 불량을 야기하는 혐의 설비, 설비 조건(recipe) 또는 레티클(reticle) 등을 효율적으로 감지할 수 있다.According to an embodiment of the present invention, it is possible to efficiently detect a suspicious facility, a recipe, or a reticle that causes a product defect in the manufacturing process.
또한, 본 발명의 실시 예에 따르면, 제조 공정의 수율을 증가시키는 최적의 경로를 탐색할 수 있다.Further, according to the embodiment of the present invention, an optimal path for increasing the yield of the manufacturing process can be searched.
도 1은 본 발명의 실시 예에 따른 제조 공정에서의 불량 설비 감지 시스템을 보여주는 블록도이다.
도 2는 본 발명의 실시 예에 따른 불량 설비 감지 방법을 설명하기 위해 도시된, 제품의 제조 공정의 일 예를 보여주는 도면이다.
도 3은 본 발명의 실시 예에 따른 불량 설비 감지 방법을 보여주는 흐름도이다.
도 4a 내지 4c는 본 발명의 실시 예에 따라 제품의 불량에 대한 각각의 설비의 기여도를 산출하는 방법을 상세하게 보여주는 도면이다.
도 5는 도 3에 도시된, 누적 효과를 반영하여 수정된 연관 규칙을 적용하는 단계를 상세하게 보여주는 흐름도이다.
도 6은 본 발명의 실시 예에 따라, 선공정의 설비가 후공정의 설비에 의한 제품의 불량에 영향을 미치는 누적 효과를 설명하기 위한 도면이다.
도 7은 본 발명의 다른 실시 예에 따른 불량 설비 감지 방법을 보여주는 흐름도이다.
도 8은 본 발명의 실시 예에 따른 불량 설비 감지 방법이 반도체 제조 공정에 적용되는 예를 보여주는 블록도이다.
도 9는 본 발명의 실시 예에 따른 불량 설비 감지 방법이 LCD 제조 공정에 적용되는 예를 보여주는 블록도이다.1 is a block diagram showing a faulty facility detection system in a manufacturing process according to an embodiment of the present invention.
2 is a view illustrating an example of a manufacturing process of a product, which is illustrated for explaining a defective facility sensing method according to an embodiment of the present invention.
3 is a flowchart illustrating a method for detecting a defective facility according to an embodiment of the present invention.
4A to 4C are views showing details of a method of calculating the contribution of each facility to a product failure according to an embodiment of the present invention.
FIG. 5 is a flow chart showing in detail the step of applying the modified association rule shown in FIG. 3 to reflect the cumulative effect.
FIG. 6 is a diagram for explaining a cumulative effect of equipment in a pre-process affecting a product failure due to equipment in a post-process, according to an embodiment of the present invention.
FIG. 7 is a flowchart illustrating a faulty facility detection method according to another embodiment of the present invention.
FIG. 8 is a block diagram showing an example in which a defective facility sensing method according to an embodiment of the present invention is applied to a semiconductor manufacturing process.
FIG. 9 is a block diagram showing an example in which a defective facility sensing method according to an embodiment of the present invention is applied to an LCD manufacturing process.
앞의 일반적인 설명 및 다음의 상세한 설명 모두 예시적이라는 것이 이해되어야 하며, 청구된 발명의 부가적인 설명이 제공되는 것으로 여겨져야 한다. 참조 부호들이 본 발명의 바람직한 실시 예들에 상세히 표시되어 있으며, 그것의 예들이 참조 도면들에 표시되어 있다. 가능한 어떤 경우에도, 동일한 참조 번호들이 동일한 또는 유사한 부분을 참조하기 위해서 설명 및 도면들에 사용된다.It is to be understood that both the foregoing general description and the following detailed description are exemplary and should provide a further description of the claimed invention. Reference numerals are shown in detail in the preferred embodiments of the present invention, examples of which are shown in the drawings. Wherever possible, the same reference numbers are used in the description and drawings to refer to the same or like parts.
아래에서, 장치 및 방법이 본 발명의 특징 및 기능을 설명하기 위한 한 예로서 사용된다. 하지만, 이 기술 분야에 정통한 사람은 여기에 기재된 내용에 따라 본 발명의 다른 이점들 및 성능을 쉽게 이해할 수 있을 것이다. 본 발명은 다른 실시 예들을 통해 또한, 구현되거나 적용될 수 있을 것이다. 게다가, 상세한 설명은 본 발명의 범위, 기술적 사상 그리고 다른 목적으로부터 상당히 벗어나지 않고 관점 및 용도에 따라 수정되거나 변경될 수 있다.In the following, apparatus and methods are used as an example to describe the features and functions of the present invention. However, those skilled in the art will readily appreciate other advantages and capabilities of the present invention in accordance with the teachings herein. The invention may also be embodied or applied in other embodiments. In addition, the detailed description may be modified or changed in accordance with the viewpoint and use without departing from the scope, technical thought and other objects of the present invention.
한 요소 또는 층이 다른 요소 또는 층에 "연결되는", "결합하는", 또는 "인접하는" 것으로 언급되는 때에는, 다른 요소 또는 층에 직접적으로 연결되거나, 결합 되거나, 또는 인접하는 것일 수 있고, 혹은 그 사이에 끼워지는 요소 또는 층이 존재할 수 있음이 잘 이해될 것이다. 본 명세서에서 사용되는 "및/또는"이라는 용어는 나열된 요소들의 하나 또는 그 이상의 가능한 조합들을 포함할 것이다.When an element or layer is referred to as being "connected," "coupled", or "adjacent" to another element or layer, it may be directly connected, joined, or adjacent to another element or layer, It is to be understood that there may be elements or layers interposed therebetween. As used herein, the term "and / or" will include one or more possible combinations of the listed elements.
비록 "제 1", "제 2" 등의 용어가 여기서 다양한 요소를 설명하기 위해 사용될 수 있다 하더라도, 이들 요소는 이 용어들에 의해 한정되지 않는다. 이 용어들은 단지 다른 것들로부터 하나의 구성요소를 구별하기 위해 사용될 수 있다. 따라서, 본 명세서에서 사용된 제 1 구성요소, 구간, 층과 같은 용어는 본 발명의 사상을 벗어나지 않는 범위 내에서 제 2 구성요소, 구간, 층 등으로 사용될 수 있다.Although the terms "first "," second "and the like can be used herein to describe various elements, these elements are not limited by these terms. These terms may only be used to distinguish one element from the other. Accordingly, terms such as first element, section, and layer used in this specification may be used as a second element, section, layer, etc. without departing from the spirit of the present invention.
"아래의", "하부의", "위의", "상부의", 및 이와 유사한 용어들은 직접적으로(directly) 또는 다른 층을 개재하여(indirectly) 배치되는 경우를 모두 포함한다. 그리고, 공간적으로 상대적인 이러한 용어들은 도면에 도시된 방향에 더하여 다른 방향을 포함하는 것으로 이해되어야 한다. 예를 들어, 만일 디바이스가 뒤집히면, "아래의"로 설명된 구성요소는 "위의"가 될 것이다.The terms "lower "," lower ", "upper "," upper ", and like terms encompass both directly and indirectly. It should be understood that these terms spatially relative include directions in addition to those shown in the figures. For example, if the device is inverted, the component described as "below" will be "above."
본 명세서에서 설명되는 용어는 단지 특정한 실시 예를 설명하기 위한 목적으로 사용되며, 그것에 한정되지 않는다. "하나의"와 같은 용어는 달리 명백하게 지칭하지 않으면 복수의 형태를 포함하는 것으로 이해되어야 한다. "포함하는" 또는 "구성되는"과 같은 용어는 설명된 특징, 단계, 동작, 성분, 및/또는 구성요소의 존재를 명시하며, 추가적인 하나 또는 그 이상의 특징, 단계, 동작, 성분, 구성요소 및/또는 그들의 그룹의 존재를 배제하지 않는다. The terminology described herein is used for the purpose of describing a specific embodiment only, and is not limited thereto. Terms such as "one" should be understood to include plural forms unless explicitly referred to as " one ". The terms "comprising" or "comprising" are used to specify the presence of stated features, steps, operations, components, and / or components and may include additional features, steps, operations, components, And / or does not exclude the presence of their group.
달리 정의되지 않으면, 본 명세서에서 사용되는 모든 용어들은 본 발명이 속하는 기술 분야에서 통상의 지식을 지닌 자에 의해 공통적으로 이해될 수 있도록 동일한 의미를 갖는 것으로 사용된다. 그리고, 사전에서 공통적으로 정의된 용어들은 관련 분야에서 일관된 의미를 갖는 것으로 해석되어야 하며, 달리 정의되지 않으면, 과도한 의미로써 사용되지 않는다. Unless otherwise defined, all terms used herein have the same meaning as commonly understood by one of ordinary skill in the art to which this invention belongs. Terms commonly defined in the dictionary should be interpreted as having a consistent meaning in the relevant field and, unless otherwise defined, are not used in an excessive sense.
이하, 본 발명이 속하는 기술분야에서 통상의 지식을 가진 자가 본 발명의 기술적 사상을 용이하게 실시할 수 있도록 본 발명의 실시 예를 첨부된 도면을 참조하여 설명할 것이다.Hereinafter, embodiments of the present invention will be described with reference to the accompanying drawings so that those skilled in the art can easily carry out the technical idea of the present invention.
도 1은 본 발명의 실시 예에 따른 제조 공정에서의 불량 설비 감지 시스템을 보여주는 블록도이다. 1 is a block diagram showing a faulty facility detection system in a manufacturing process according to an embodiment of the present invention.
도 1을 참조하여, 불량 설비 감지 시스템(100)은 복수의 공정 파트들(110-1 내지 110-m) 및 불량 설비 감지 장치(120)를 포함할 수 있다. 제품을 생산하기 위해, 제 1 공정 파트(110-1)부터 제 m 공정 파트(110-m)를 통한 공정이 순차적으로 수행될 수 있다. 반도체 제조 공정을 예로 들면, 복수의 공정 파트들(110-1 내지 110-m)은 웨이퍼 제작, 회로 설계, 마스크 제작, 웨이퍼 가공 등의 공정을 포함할 수 있다. 이때, 웨이퍼 가공 공정은 산화 공정, 감광액 도포 공정, 노광 공정, 현상 공정, 식각 공정, 이온 주입 공정 등을 포함할 수 있다. 예를 들어, 제 1 공정 파트(110-1)는 웨이퍼의 산화 공정, 제 2 공정 파트(110-2)는 감광액 도포 공정, 제 3 공정 파트(110-3)는 노광 공정에 각각 대응할 수 있다. 나머지 공정 파트들도 다른 반도체 공정들에 각각 대응될 수 있다.Referring to FIG. 1, the faulty
제 1 공정 파트(110-1) 내지 제 m 공정 파트(110-m) 각각에서, 복수의 설비들이 사용될 수 있다. 최초 투입물(즉, 원재료)은 제품이 완성될 때까지 제조 관리 스케줄에 따라 각각의 공정의 특정 설비를 거치게 된다. 즉, 제품이 완성되기까지 원재료가 각 공정마다 거친 특정 설비의 자취(이하, 공정 경로 데이터라 칭함)는 매우 다양하며, 제품들마다 서로 다를 수 있다.In each of the first process part 110-1 to the m-th processing part 110-m, a plurality of facilities can be used. The initial inputs (ie, the raw materials) will go through the specific facilities of each process according to the manufacturing management schedule until the product is completed. That is, the trace of specific equipment (hereinafter, referred to as process path data) in which the raw materials are roughed up to the completion of the product is very diverse and may vary from product to product.
불량 설비 감지 장치(120)는 공정 경로 데이터와 공정 결과 데이터를 이용하여 제품의 불량에 기여하는 혐의 설비를 감지할 수 있다. 여기서, 공정 결과 데이터란 정상적으로 공정 경로를 거친 제품이 정상인지 또는 불량인지 최종적으로 판정받은 데이터를 의미한다. 불량 설비 감지 장치(120)는 입력부(122) 및 제어부(124)를 포함할 수 있다. 입력부(122)는 공정 파트들(110-1 내지 110-m)로부터 공정 경로 데이터를 입력받을 수 있다. 입력부(122)는 공정 결과 데이터를, 예를 들어, 제품의 불량 유무를 판단하는 별도의 테스터기(미도시)로부터 입력받을 수 있다. 입력된 공정 경로 데이터 및 공정 결과 데이터는 제품의 불량을 야기하는 설비를 감지하고 수율을 증가시킬 수 있는 최적의 경로를 탐색하는데 이용될 수 있다.The defective
본 발명의 실시 예에 따른 불량 설비 감지 장치(120)는 제품의 불량에 기여하는 각각의 설비들의 기여도를 산출할 수 있다. 뿐만 아니라, 불량 설비 감지 장치(120)는 선공정의 설비와 후공정의 설비 간의 상관 관계로 인하여 야기되는 누적 효과를 산출할 수 있다. 불량 설비 감지 장치(120)는 산출된 각각의 설비들의 기여도와 누적 효과를 고려하여 제품의 불량을 야기하는 혐의 설비(suspicious equipment)를 효율적으로 감지할 수 있다. 그 결과, 제조 공정의 수율을 증가시키는 최적의 경로를 제공할 수 있다.The defective
도 2는 본 발명의 실시 예에 따른 불량 설비 감지 방법을 설명하기 위해 도시된, 제품의 제조 공정의 일 예를 보여주는 도면이다.2 is a view illustrating an example of a manufacturing process of a product, which is illustrated for explaining a defective facility sensing method according to an embodiment of the present invention.
도 2를 참조하여, 원재료는 공정 P1 내지 P10을 거쳐 최종적으로 제품이 생산된다. 그리고, 공정 P1은 설비 A1, B1, C1을 갖추고 있고, 공정 P2는 설비 A2, B2를 갖추고 있다. P3 내지 P10도 마찬가지로 설명이 가능하다. 원재료가 투입되면, 원재료는 각각의 공정마다 정해진 스케쥴에 따라서 임의의 설비를 거치게 되며, 최종적으로 제품이 생산된다. 예를 들어, 제품이 생산되는 경로는 A1→B2→E3→...→B8→A9→B10과 같이 정해진 스케줄에 따라 임의로 선택될 수 있다. Referring to FIG. 2, the raw material is finally produced through steps P1 to P10. Step P1 includes equipments A1, B1 and C1, and step P2 equips equipments A2 and B2. P3 to P10 can be similarly described. When the raw materials are input, the raw materials are subjected to arbitrary facilities according to a schedule determined for each process, and the final product is produced. For example, the path through which the product is produced can be arbitrarily selected according to a predetermined schedule such as A1? B2? E3? ...? B8? A9? B10.
이하, 이해를 돕기 위해 도 2에 도시된 예에 따라 설명하기로 한다. 그러나, 공정의 개수 및 각각의 공정마다 구비된 설비들의 개수는 이에 한정되지 않음은 잘 이해될 것이다.Hereinafter, for the sake of understanding, description will be made with reference to the example shown in Fig. However, it will be understood that the number of processes and the number of facilities provided for each process are not limited thereto.
도 3은 본 발명의 실시 예에 따른 불량 설비 감지 방법을 보여주는 흐름도이다. 3 is a flowchart illustrating a method for detecting a defective facility according to an embodiment of the present invention.
S110 단계에서, 공정 경로 데이터 및 공정 결과 데이터가 획득될 수 있다.In step S110, the process path data and the process result data can be obtained.
전술한 바와 같이, 공정 경로 데이터는 제품이 완성되기까지 제품이 각 공정마다 거친 특정 설비의 자취를 의미한다. 예를 들어, 공정 경로 데이터는 제품이 특정 설비를 거쳤는지 여부에 따라 "1" 또는 "0"의 이진화 데이터로써 획득될 수 있다. 예를 들어, 제품이 도 2의 세 번째 공정 P3에서 설비 E3를 거쳤다면, P3 공정에서의 공정 경로 데이터는 "00001"일 수 있다.As described above, the process path data refers to a trace of a specific facility in which a product is roughed through each process until the product is completed. For example, the process path data may be obtained as binary data of "1" or "0 ", depending on whether the product has passed a particular facility. For example, if the product has passed through the facility E3 in the third process P3 in Fig. 2, the process path data in the P3 process may be "00001 ".
공정 결과 데이터는 정상적으로 공정 경로를 거친 제품이 정상인지 또는 불량인지 최종적으로 판정받은 데이터를 의미한다. 예를 들어, 공정 결과 데이터는 제품이 정상인지 불량인지 여부에 따라 "1" 또는 "0"의 이진화 데이터로써 획득될 수 있다. 또는, 공정 결과 데이터는 정상의 정도에 따라, 연속형 변수의 형태로 표시될 수 있다. 공정 결과 데이터는 제품이 정상인지 여부를 판단하는 별도의 테스터기(tester)로부터 획득될 수 있다.Process result data means data that is finally determined whether the product passed through the process path is normal or defective. For example, the process result data may be obtained as binary data of "1" or "0" depending on whether the product is normal or defective. Alternatively, the process result data may be displayed in the form of a continuous variable, depending on the degree of normal. The process result data may be obtained from a separate tester for determining whether the product is normal.
S120 단계에서, 획득된 공정 경로 데이터 및 공정 결과 데이터에 기초하여 제품의 불량에 대한 각각의 설비의 기여도가 산출될 수 있다. In step S120, the contribution of each facility to the defective product can be calculated based on the obtained process path data and the process result data.
제품의 불량에 대한 각각의 설비의 기여도를 산출하기 위해 여러 가지 수학적 알고리즘이 이용될 수 있다. 각 설비의 기여도를 산출하기 위해 다변량 회귀분석 및 변수 선택 방법론과 같이 여러 변수 간의 관계를 종합적으로 분석할 수 있는 방법론이 사용될 수 있다. 예를 들어, PLSR-VIP (Partial Least Square Regression-Variable Importance in the Projection) 방법, mRMR (Minimum-redundancy-maximum-relevance) 변수 선택법, SVM-RFE (Support Vector Machine Recursive Feature Elimination) 등이 사용될 수 있다.Various mathematical algorithms can be used to calculate the contribution of each facility to a product failure. In order to calculate the contribution of each facility, a methodology can be used to comprehensively analyze the relationships among various variables such as multivariate regression analysis and variable selection methodology. For example, a PLSR-VIP (Partial Least Square Regression-Variable Importance in the Projection) method, a Minimum-redundancy-maximum-relevance (mRMR) variable selection method, and SVM-RFE (Support Vector Machine Recursive Feature Elimination) .
본 발명의 실시 예에 따른 불량 설비 감지 방법에 있어서, 제품의 불량에 대한 각각의 설비의 기여도는 PLSR-VIP를 사용함으로써 산출하고자 한다. PLSR-VIP를 사용하는 이유는 분석하고자 하는 데이터의 양을 줄이기 위함이다. 예를 들어, 도 2를 참조하면, 제품이 완성되기까지 원재료가 거치는 공정 경로는 3×2×5×4×3×3×5×3×3×2=97200 개가 있을 수 있다. 이렇게 많은 양의 데이터를 실시간으로 분석하고 제품의 불량에 영향을 미치는 설비를 감지한다는 것은 현실적으로 매우 어렵고 큰 부담일 수 있다. 따라서, 제품의 불량에 영향을 미치는 기여도가 낮은 설비를 데이터로부터 제외하는 것이 필요하다.In the defective facility detection method according to the embodiment of the present invention, the contribution of each facility to defective products is calculated by using PLSR-VIP. The reason for using PLSR-VIP is to reduce the amount of data to analyze. For example, referring to FIG. 2, the process route through which the raw material passes until the product is completed may be 97200 pieces of 3 × 2 × 5 × 4 × 3 × 3 × 5 × 3 × 3 × 2. Real-time analysis of such a large amount of data and detecting equipment that affects product failure can be very difficult and costly in practice. Therefore, it is necessary to exclude from the data the facilities that have a low contribution, which affects the defects of the product.
PLSR을 간략히 설명하면 다음과 같다. 복수의 독립 변수(예를 들어, X1 및 X2)와 하나의 종속 변수(예를 들어, Y)가 선형 방정식(예를 들어, Y=a×X1+b×X2+c)을 만족한다고 가정하자. 이때, 새로운 독립 변수(즉, 잠재 변수 t1 및 t2)와 종속 변수(즉, Y) 사이의 새로운 선형 방정식을 만들되, 종속 변수(즉, Y)에 대한 기여도가 낮은 잠재 변수(예를 들어, t2)는 제거한다. The PLSR is briefly described as follows. Suppose that a plurality of independent variables (for example, X1 and X2) and one dependent variable (for example, Y) satisfy a linear equation (for example, Y = a x X1 + b x X2 + c) . At this time, a new linear equation between the new independent variable (i.e., the latent variables t1 and t2) and the dependent variable (i.e., Y) is made and the latent variable with low contribution to the dependent variable (i.e., Y) ).
VIP는 새롭게 산출된 잠재 변수에 관한 선형 방정식(예를 들어, Y=a'×t1+b')으로부터, 원래의 독립 변수들(즉, X1 및 X2)이 종속 변수(즉, Y)에 미치는 영향을 산출하는 방법에 관한 것이다. PLSR-VIP를 사용함으로써, 분석하고자 하는 변수의 수(또는 데이터의 양)를 줄이고, 제품의 생산에 관여한 설비들이 제품의 불량에 미치는 기여도를 보다 효율적으로 계산할 수 있다.VIP determines whether the original independent variables (i. E., X1 and X2) affect the dependent variable (i. E. Y) from the linear equation for the newly generated latent variable (e.g., Y = a 'x t1 + b' And a method for calculating an influence. By using PLSR-VIP, it is possible to reduce the number of variables (or the amount of data) to be analyzed, and more efficiently calculate the contribution of equipment involved in product production to product failure.
PLSR-VIP를 사용하여 제품의 불량에 대한 각각의 설비의 기여도를 산출하는 구체적인 방법에 대해서는 도 4a 내지 4c에서 상세하게 설명될 것이다. 비록 본 발명에서는 PLSR-VIP를 사용하여 제품의 불량에 대한 각각의 설비의 기여도를 산출하고자 하나, 다변량 회귀분석 및 변수 선택 방법론과 같은 다양한 방법이 사용될 수 있음은 잘 이해될 것이다.A specific method of calculating the contribution of each facility to the defective product using PLSR-VIP will be described in detail in Figs. 4A to 4C. Although it is intended to calculate the contribution of each facility to a product failure using the PLSR-VIP in the present invention, it will be appreciated that a variety of methods such as multivariate regression analysis and variable selection methodology may be used.
S130 단계에서, 각각의 설비에 대하여, 제품의 불량에 기여하는 누적 효과를 반영함으로써, 수정된 연관 규칙이 적용될 수 있다. In step S130, the modified association rule can be applied to each facility by reflecting the cumulative effect that contributes to the failure of the product.
원래의 제품 생산 경로가 A1→B2→E3→...→B8→A9→B10 이라고 가정하자(도 2 참조). 이와 같은 제품 생산 경로는, S120 단계에서 제품의 불량에 미치는 기여도가 작은 설비가 제거됨으로써, 예컨대, E3→A9와 같이, 단순화될 수 있다. 즉, 공정 3의 설비 E3과 공정 9의 설비 A9가 제품의 불량에 미치는 기여도가 가장 큰 설비라는 의미이다. Assume that the original product production path is A1? B2? E3? ...? B8? A9? B10 (see FIG. 2). Such a product production path can be simplified, for example, E3? A9 by removing equipment with a small contribution to defective products in step S120. That is, the facility E3 in the
그러나, 반도체 제조 공정과 같은 미세 제조 공정은 설비들 간의 상관 관계가 존재하므로, 선공정과 후공정이 복합적으로 제품의 불량을 야기할 수 있다. 따라서, 제품의 불량에 대한 각각의 설비의 기여도를 산출하는 것뿐만 아니라, 선공정이 후공정에 의해 야기되는 불량에 어느 정도 기여하는가에 관한 개념인 누적 효과(Cumulative Effect)를 파악하는 것도 중요하다. 제품의 불량을 야기하는 혐의 설비(suspicious equipment)를 감지하는데 누적 효과를 반영하면, 불량 설비를 보다 효율적으로 파악하고, 수율을 높이는 최적의 경로를 파악할 수 있다. However, since a microfabrication process such as a semiconductor manufacturing process has a correlation between the facilities, the preliminary process and the postproduction process may result in a defective product. It is therefore important not only to calculate the contribution of each facility to a product failure, but also to determine the cumulative effect, which is the concept of how much the pre-process contributes to the failure caused by the post-process . By reflecting the cumulative effect of detecting suspicious equipment that causes the product to fail, it is possible to grasp the defective equipment more efficiently and grasp the optimal path to increase the yield.
그리고, 각각의 설비에 대한 누적 효과를 반영하여 수정된 연관 규칙(modified association rule)을 적용한다. 연관 규칙을 적용함으로써, 제품의 불량에 기여하는 불량설비 판단 지수를 산출하는데 필요한 파라미터를 도출할 수 있다.The modified association rule is applied to reflect the cumulative effect of each facility. By applying the association rule, it is possible to derive the parameters necessary for calculating the defective equipment judgment index contributing to the defective product.
누적 효과를 적용하여 후공정에서의 불량에 대한 선공정의 기여도를 산출하는 방법 및 연관 규칙을 이용하여 파라미터를 도출하는 방법에 대해서는 도 5 및 도 6에서 상세하게 설명될 것이다.The method of calculating the contribution of the line process to the defect in the post process by applying the cumulative effect and the method of deriving the parameter by using the association rule will be described in detail in FIG. 5 and FIG.
S140 단계에서, 제품의 불량에 대한 각각의 설비의 기여도 및 수정된 연관 규칙에 기초하여 불량설비 판단 지수가 산출될 수 있다. 불량설비 판단 지수는 S120 단계에서 산출된 VIP 값 및 S130 단계에서 산출된 파라미터들을 이용하여 계산된다. 본 발명의 실시 예에 따른 불량설비 판단 지수는 단순히 제품의 불량에 기여하는 각각의 설비의 기여도만을 고려한 것이 아니라, 후공정에 의해 야기되는 불량에 대한 선공정의 기여도를 함께 고려한다. 따라서, 불량 설비 탐지의 효율성 및 신뢰성을 높일 수 있다. 또한, 제조 공정의 수율을 증가시키는 최적의 경로를 탐색할 수 있다. 불량설비 판단 지수를 산출하는 구체적인 방법에 대해서는 상세하게 후술될 것이다.In step S140, a bad facility judgment index can be calculated based on the contribution of each facility to the fault of the product and the modified association rule. The bad facility determination index is calculated using the VIP value calculated in step S120 and the parameters calculated in step S130. The bad facility determination index according to the embodiment of the present invention considers not only the contribution of each facility contributing to the defect of the product but also the contribution of the pre-process to the defect caused by the post-process. Thus, the efficiency and reliability of the detection of bad facilities can be enhanced. Further, it is possible to search for an optimal path for increasing the yield of the manufacturing process. A detailed method of calculating the bad facility determination index will be described later in detail.
도 4a 내지 4c는 본 발명의 실시 예에 따라 제품의 불량에 대한 각각의 설비의 기여도를 산출하는 방법을 상세하게 보여주는 도면이다.4A to 4C are views showing details of a method of calculating the contribution of each facility to a product failure according to an embodiment of the present invention.
도 4a를 참조하면, 원래의 선형 방정식으로부터, 감소된 수의 독립 변수(즉, 잠재 변수)에 관한 새로운 선형 방정식을 도출하는 방법이 개념적으로 도시되어 있다. Referring to FIG. 4A, there is conceptually illustrated a method for deriving a new linear equation for a reduced number of independent variables (i.e., latent variables) from the original linear equations.
PLSR을 적용하기 전, 종속 변수 Y는 독립변수 X1 및 X2에 관한 선형 방정식(예를 들어, Y=a×X1+b×X2+c)으로 표시될 수 있다. 이때, 독립 변수 X1 및 X2는 제조 공정에서의 설비에 대응할 수 있다. 그리고, 종속 변수 Y는 공정 결과 데이터에 대응할 수 있다. 만약, 도 2의 제조 공정에 적용하고자 한다면, 독립변수는 전체 설비들의 개수인 33개(X1 내지 X33)가 될 것이다. 이렇게 많은 독립 변수(즉, 설비)들 각각이 종속 변수(즉, 수율)에 미치는 기여도를 판단하는 것은 매우 긴 시간을 요하는 어려운 작업이다. 따라서, 어떤 방법을 사용하여 독립 변수의 수를 줄이는 것이 필요하다.Before applying the PLSR, the dependent variable Y can be expressed as a linear equation (for example, Y = a x X1 + b x X2 + c) for the independent variables X1 and X2. At this time, the independent variables X1 and X2 can correspond to equipment in the manufacturing process. Then, the dependent variable Y can correspond to the process result data. If it is applied to the manufacturing process of FIG. 2, the independent variable will be 33 (X1 to X33), which is the total number of equipments. Determining the contribution of each of these many independent variables (ie, installations) to dependent variables (ie, yield) is a difficult task that takes a very long time. Therefore, it is necessary to reduce the number of independent variables using some method.
PLSR을 적용한 후, 독립 변수의 개수는 감소할 수 있다. 도면의 오른쪽 그림과 같이, 종전의 X1과 X2에 관한 직교 좌표계 대신에, t1과 t2에 관한 새로운 직교 좌표계를 생성한다고 하자. 이 경우, 종속 변수 Y는 새로운 독립 변수인 t1과 t2(즉, 잠재 변수)에 관한 새로운 선형 방정식으로 표현될 수 있다. 다만, 데이터의 분포를 살펴보면, t2 방향으로의 데이터의 산포는 t1 방향으로의 데이터의 산포에 비해 상당히 작은 것을 알 수 있다. 이는 종속 변수 Y에 미치는 잠재 변수 t2의 기여도가 낮은 것으로 이해될 수 있다. 따라서, 잠재 변수 t2를 무시하고, 종속 변수 Y는 잠재 변수 t1의 선형 방정식(Y=a'×t1+b')으로 표현될 수 있다. After applying the PLSR, the number of independent variables can be reduced. Suppose we create a new Cartesian coordinate system for t1 and t2, instead of the Cartesian coordinate system for the previous X1 and X2, as shown in the right figure. In this case, the dependent variable Y can be expressed as a new linear equation for the new independent variables t1 and t2 (ie latent variables). However, as for the distribution of data, it can be seen that the distribution of the data in the t2 direction is significantly smaller than the distribution of the data in the t1 direction. It can be understood that the contribution of the potential variable t2 to the dependent variable Y is low. Thus, ignoring the latent variable t2, the dependent variable Y can be expressed by the linear equation of the latent variable t1 (Y = a 'x t1 + b').
도 4b를 참조하면, 공정 경로 데이터, 공정 결과 데이터, 및 잠재 변수의 관계가 수학식으로 표시되었다. 도 4c는 PLSR 적용시 변수들을 설명하기 위한 테이블이다. 본 발명이 반도체 제조 공정에 적용되는 경우, 전체 데이터의 수 k는 전체 웨이퍼의 수에 대응할 수 있다. 독립 변수 X는 전체 설비에 대응하고, 독립 변수의 수 n은 전체 설비의 수에 대응할 수 있다. 그리고, 종속 변수 Y는 웨이퍼의 수율에 대응할 수 있다.Referring to FIG. 4B, the relationship between the process path data, the process result data, and the latent variables is expressed by the following equation. FIG. 4C is a table for explaining variables in PLSR application. When the present invention is applied to a semiconductor manufacturing process, the total number k of data can correspond to the total number of wafers. The independent variable X corresponds to the entire plant, and the number n of independent variables can correspond to the total number of plants. Then, the dependent variable Y can correspond to the yield of the wafer.
본 발명의 실시 예에 따라, 제품의 불량에 미치는 기여도가 낮은 설비를 배제하기 위해 수학식 1 내지 3을 만족시키는 잠재 변수 T가 도출될 수 있다. 잠재 변수 T는 공정 경로 데이터와 공정 결과 데이터의 정보를 모두 담고 있는 결과물이다.According to an embodiment of the present invention, a latent variable T that satisfies equations (1) to (3) can be derived in order to exclude facilities with low contribution to product failure. The latent variable T is the product of both the process path data and the process result data.
![]()
![]()
![]()
![]()
![]()
![]()
PLSR에 의해 산출된 변수 행렬들은 수학식 4에서의 계산을 위해 사용될 수 있다. The variable matrices produced by the PLSR can be used for the calculations in equation (4).
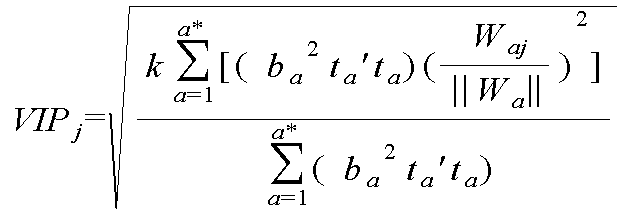
수학식 4는 다시 원래의 독립 변수들(X1, X2 등)이 종속 변수(Y)에 미치는 기여도를 산출하기 위한 식이다. 수학식 1 내지 3으로부터는, 단지 잠재 변수(t1, t2 등)가 종속 변수(Y)에 미치는 기여도를 파악할 수 있을 뿐이기 때문이다. 감소된 수의 잠재 변수들로부터 원래의 독립 변수들에 의한 기여도를 계산할 수 있기 때문에, 계산량이 상당히 감소될 수 있다. Equation (4) is again for calculating the contribution of the original independent variables (X1, X2, etc.) to the dependent variable (Y). Equations (1) to (3) are merely because the contribution of the latent variable (t1, t2, etc.) to the dependent variable (Y) can be grasped. Since the contribution by the original independent variables can be calculated from the reduced number of potential variables, the amount of computation can be significantly reduced.
VIPj는 j번째 독립 변수가 종속 변수에 미치는 기여도를 의미할 수 있다. 이를 제조 공정에 적용하고자 하는 경우, j는 제조 공정에서 제품이 거치는 해당 설비를, 종속 변수는 수율을 의미할 수 있다. 따라서 수학식 4에서 도출된 VIPj는 해당 설비 j가 공정 결과에 영향을 미치는 기여도로 해석될 수 있다.VIPj can be the contribution of the jth independent variable to the dependent variable. In the case of applying this to the manufacturing process, j is the equipment to which the product passes in the manufacturing process, and the dependent variable is the yield. Therefore, VIPj derived from Equation (4) can be interpreted as the contribution of the facility j to the process result.
본 발명의 실시 예에서는 제품의 불량에 미치는 기여도를 산출하기 위해 PLSR-VIP 방법을 사용하였다. 그러나, 이는 예시적인 것이며, 다변량 회귀분석 및 변수 선택 방법론과 같이 여러 변수 간의 관계를 종합적으로 분석할 수 있는 방법론이 사용될 수 있음은 잘 이해될 것이다. 예를 들어, mRMR (Minimum-Redundancy-Maximum-relevance) 변수 선택법, SVM-RFE (Support Vector Machine Recursive Feature Elimination) 등이 사용될 수 있다.In the embodiment of the present invention, the PLSR-VIP method was used to calculate the contribution to product failure. However, it will be appreciated that the methodology is illustrative and that methodologies can be used to comprehensively analyze the relationships between the various variables, such as multivariate regression analysis and variable selection methodology. For example, a Minimum-Redundancy-Maximum-relevance (mRMR) variable selection method and a Support Vector Machine Recursive Feature Elimination (SVM-RFE) may be used.
도 5는 도 3에 도시된, 누적 효과를 반영하여 수정된 연관 규칙을 적용하는 단계(S130)를 상세하게 보여주는 흐름도이다.FIG. 5 is a flow chart showing in detail the step (S130) of applying the modified association rule shown in FIG. 3 to reflect the cumulative effect.
S132 단계에서, 수학식 4에 의한 VIP 값이 제 1 기준값을 초과하는 설비들에 대하여, 규칙(rule)들을 생성할 수 있다. 즉, 특정 공정 경로 데이터에 대응하는 설비들로부터, VIP 값이 제 1 기준값 이하인 설비들을 제거하여 규칙을 생성한다. 제품의 불량에 기여도가 높은 설비만을 선택하여 데이터의 양을 줄이고, 탐색의 효율을 증가시키기 위함이다. 이때, 제 1 기준값은 VIP 값들에 따라 임의로 설정되거나 변경될 수 있다. 연관 규칙이란 방대한 양의 데이터에서 주목할 만한 규칙을 찾는데 유용한 방법론이다. 연관 규칙은 불량 설비 군(단독 설비 또는 복수 설비의 선후 공정 관계)으로부터 규칙(rule)을 생성해 내는 알고리즘이며, 규칙(rule)마다 정확도가 계산된다. 예를 들어 도 6을 참조하면, 불량 규칙 {P3=E3, P9=A9, [12, 88]}는 웨이퍼가 E3와 A9설비에서 가공되면 총 100개의 웨이퍼 중 88가 불량이 난다는 뜻으로 이 규칙의 정확도는 88%이다.In step S132, rules may be generated for facilities where the VIP value according to Equation (4) exceeds the first reference value. That is, from the facilities corresponding to the specific process route data, the facilities having the VIP value equal to or less than the first reference value are removed to generate the rule. It is to select only the equipment that contributes to the defective product to reduce the amount of data and increase the efficiency of the search. At this time, the first reference value may be arbitrarily set or changed according to the VIP values. Association rules are a useful methodology for finding notable rules in vast amounts of data. The association rule is an algorithm for generating a rule from a defective equipment group (a single facility or a post-process relation of plural facilities), and the accuracy is calculated for each rule. For example, referring to FIG. 6, the failure rule {P3 = E3, P9 = A9, [12, 88]} means that 88 of the 100 wafers in total are defective when the wafer is processed at the E3 and A9 facilities The accuracy of the rule is 88%.
연관 규칙을 응용함에 있어서, 서포트(support), 컨피던스(confidence) 등과 같은 파라미터들이 사용될 수 있다. 서포트 값은 일반적으로 전체 데이터 중에서 규칙이 발생하는 비율을 의미한다. 이를 본 발명에 적용하고자 하는 경우, 서포트 값은 총 웨이퍼의 개수에 대한 해당 설비를 거쳐간 웨이퍼들의 개수의 비율을 의미할 수 있다. 컨피던스 값은 해당 설비를 거친 제품의 수에 대한 불량 제품의 비율을 의미할 수 있으며, 규칙의 정확도를 다른 말로 표현한 것이다. 모든 규칙마다 서포트 값과 컨피던스 값을 계산한다.In applying the association rule, parameters such as support, confidence, etc. may be used. The support value generally means the rate at which rules occur in the entire data. In the case of applying this to the present invention, the support value may mean the ratio of the number of wafers passing through the facility to the total number of wafers. The confidence value can mean the ratio of the defective product to the number of products passed through the facility and expresses the accuracy of the rule in other words. Calculate the support value and the confidence value for every rule.
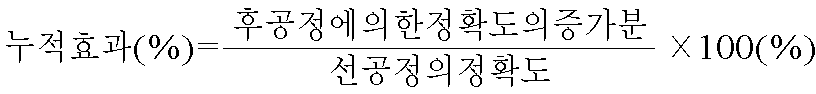
S134 단계에서, 누적 효과가 계산될 수 있다. 누적 효과(Cumulative Effect)는 제조 공정에서 투입물이 선공정 만을 거쳤을 때의 규칙 정확도와 선공정 및 후공정을 모두 거쳤을 때의 규칙 정확도의 차이를 의미한다. 누적 효과는 수학식 5와 같이 표현될 수 있다. 누적 효과를 계산하는 방법에 대해서는 도 6을 함께 참조하여, 좀 더 상세하게 설명하고자 한다.In step S134, the cumulative effect can be calculated. The cumulative effect is the difference in rule accuracy when the inputs are passed through the pre-process in the manufacturing process, and the difference in the rule accuracy when both the pre-process and post-process are performed. The cumulative effect can be expressed as Equation (5). A method of calculating the cumulative effect will be described in more detail with reference to FIG.
도 6은 본 발명의 실시 예에 따라, 선공정의 설비가 후공정의 설비에 의한 제품의 불량에 영향을 미치는 누적 효과를 설명하기 위한 도면이다. FIG. 6 is a diagram for explaining a cumulative effect of equipment in a pre-process affecting a product failure due to equipment in a post-process, according to an embodiment of the present invention.
도 6을 참조하면, {P3=E3, [101, 264]}는 각 투입물이 공정의 세 번째 단계(P3)에서 설비 3(E3)을 거쳤을 때, 발생하는 정상 제품의 수(101)와 불량품의 수(264)를 나타낸다. {P3=E3, P9=A9, [12, 88]}는 각 투입물이 공정의 세 번째 단계(P3)에서는 설비 E3을 거치고, 이후 아홉 번째 단계(P9)에서는 설비 A9를 거친다는 것을 나타낸다. 그리고, 이에 따른 공정 결과로 정상 제품 수가 12개, 불량품 수가 88개 발생했음을 나타낸다. Referring to FIG. 6, {P3 = E3, [101, 264]} represents the number 101 of normal products that occurs when each input passes through the facility 3 (E3) in the third stage P3 of the process And the number of defective products (264). {P3 = E3, P9 = A9, [12, 88]} indicates that each input goes through facility E3 in the third phase (P3) of the process and then through facility A9 in the ninth phase (P9). As a result of the process, the number of normal products is 12 and the number of defective products is 88.
도 6에서, 선공정에 해당하는 규칙이 {P3=E3, [101, 264]}이므로, 후공정에 따른 정확도(즉, 불량율)의 증가분은 컨피던스 값의 차이인 0.157이다. 수학식 5에 따라 선공정에 대한 후공정 설비 A9의 누적효과는 0.157/0.723*100=21.7%이 된다.In FIG. 6, since the rule corresponding to the pre-process is {P3 = E3, [101, 264]}, the increment of the accuracy according to the post-process (that is, the defect rate) is 0.157 which is the difference of the confidence values. According to Equation 5, the cumulative effect of the post-processing facility A9 to the pre-processing is 0.157 / 0.723 * 100 = 21.7%.
다시 도 5를 참조하면, S136 단계에서, 수정된 연관 규칙 적용시 발생하는 파라미터들의 대표값이 산출될 수 있다. 구체적으로, VIP 값이 제 1 기준값을 초과하는 설비들 각각에 대해서 다음과 같은 과정을 진행한다. 해당 설비가 후공정으로 포함되어 있고 누적 효과가 제 2 기준값을 초과하는 규칙(rule)들에 대하여, 수정된 연관 규칙 적용시 발생하는 파라미터들의 대표값이 산출될 수 있다. 즉, S132 단계에서 계산된 복수의 서포트 값들 중에서, 누적 효과가 제 2 기준값을 초과하는 규칙들의 서포트 값들의 대표값(representative value)을 구한다. 예를 들어, 대표값은 산술 평균(arithmetic mean), 강건 평균(robust mean), 절사 평균(trimed mean), 가중 평균(weighted mean), 기하 평균(geometric mean), 조화 평균(harmonic mean), 또는 중앙값(median) 중 어느 하나일 수 있다. 그러나, 대표값은 이들에 한정되는 것은 아니다. 본 발명에서는 산술 평균값을 예로 들어 설명하기로 한다. 본 발명에서는 산술 평균(supportavg)을 구하여 설명하기로 한다. 마찬가지로, S132 단계에서 계산된 복수의 컨피던스 값들 중에서, 누적 효과가 제 2 기준값을 초과하는 규칙들의 컨피던스 값들의 대표값을 구한다. 대표 값은 위와 마찬가지로 여러 가지가 있을 수 있으나, 본 발명에서는 평균값(confidenceavg)을 예로 들어 설명하기로 한다. 이때, 제 2 기준값은 계산된 누적 효과의 값들에 따라 임의로 설정되거나 변경될 수 있다. 누적 효과가 제 2 기준값을 초과하는 규칙들을 고려해서 연관 규칙을 적용한다는 관점에서, '수정된' 연관 규칙이라 명명된 것이다. 수정된 연관 규칙을 적용하는 경우, Apriori, Eclat, AprioriDP, CMPNARM 등과 같은 알고리즘이 활용될 수 있다. 제품의 불량에 기여하는 누적 효과를 반영한 수정된 연관 규칙을 적용함으로써, 불량설비 판단 지수를 산출하는데 필요한 모든 요소들이 구비된다.Referring again to FIG. 5, in step S136, a representative value of the parameters occurring when applying the modified association rule can be calculated. Specifically, the following procedure is performed for each facility whose VIP value exceeds the first reference value. A representative value of parameters occurring when applying the modified association rule can be calculated for rules in which the facility is included in the post process and the cumulative effect exceeds the second reference value. That is, from among the plurality of support values calculated in step S132, the representative value of the support values of the rules whose cumulative effect exceeds the second reference value is obtained. For example, the representative value may be an arithmetic mean, a robust mean, a trimmed mean, a weighted mean, a geometric mean, a harmonic mean, Median < / RTI > However, representative values are not limited to these. In the present invention, an arithmetic average value will be described as an example. In the present invention, an arithmetic average (support avg ) will be described. Similarly, among the plurality of confidence values calculated in step S132, a representative value of the confidence values of the rules whose cumulative effect exceeds the second reference value is obtained. The representative value may be various as described above, but the present invention will be described by taking an average value (confidence avg ) as an example. At this time, the second reference value may be arbitrarily set or changed according to the calculated cumulative effect values. It is named 'modified' association rule in view of applying the association rule in consideration of the rules in which the cumulative effect exceeds the second reference value. When applying modified association rules, algorithms such as Apriori, Eclat, AprioriDP, CMPNARM etc. can be utilized. By applying a modified association rule that reflects the cumulative effect that contributes to the failure of the product, all the elements necessary to calculate the bad facility determination index are included.
불량설비 판단 지수(또는, 혐의 지수(Suspicious Index))는 제품의 불량에 대한 설비들 각각의 기여도 및 누적 효과가 반영된 수정된 연관 규칙에 기초하여 제품의 불량을 야기하는 혐의 설비(suspicious equipment)를 감지하는데 이용될 수 있다. 불량설비 판단 지수는 각 설비별로 계산되며, 수학식 6과 같이 표현될 수 있다.The Suspicious Equipment Index (or Suspicious Index) is a suspicious equipment that causes a product to fail based on a modified association rule that reflects the contribution and cumulative effect of each of the facilities to the failure of the product. Lt; / RTI > The bad facility determination index is calculated for each facility and can be expressed as Equation (6).
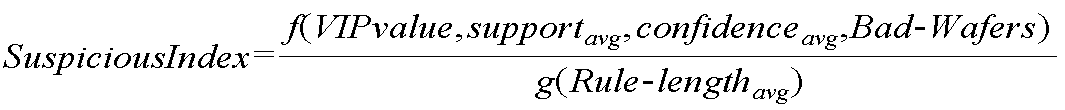
여기서, f는 VIP 값, 서포트 값(supportavg), 컨피던스 값(confidenceavg), 및 배드_웨이퍼(Bad_Wafers) 중 적어도 하나를 독립 변수로 하는 함수이다. 수학식 6에서는 예시적으로, 위의 4 가지를 독립 변수로 하는 함수로써 표현되었다. g는 룰의 길이(Rule_lengthavg)를 독립 변수로 하는 함수이다. 결국, 불량설비 판단 지수는 함수 f와 g로 표현되므로, 서포트 값(supportavg), 컨피던스 값(confidenceavg), 배드_웨이퍼(Bad_Wafers), 및 룰의 길이(Rule_lengthavg)의 다양한 조합에 의해 구해질 수 있다.Where f is a function having at least one of a VIP value, a support value (support avg ), a confidence value (confidence avg ), and a bad_Wafers as independent variables. In Equation (6), as an example, the above four functions are expressed as functions having independent variables. g is a function that takes the length of the rule (Rule_length avg ) as an independent variable. As a result, since the bad equipment judgment index is represented by the functions f and g, it is possible to calculate the poor equipment determination index by using various combinations of the support value (support avg ), the confidence value (confidence avg ), the bad_Wafers and the rule length (Rule_length avg ) .
VIP 값은 수학식 4에서 계산된, 제품의 불량에 대한 각각의 설비의 기여도 값이다. 서포트 값(supportavg) 및 컨피던스 값(confidenceavg)은 도 5의 S136 단계에서 계산된 값들이다. 룰의 길이(Rule_lengthavg)는, S136 단계에서 누적 효과가 제 2 기준값을 초과하는 경우, 제품을 생산하는데 관여한 설비의 개수의 평균값을 의미한다. 예를 들어, {P3=E3, P9=A9, [12, 88]}과 같은 룰(rule)이 있다면, 제품을 생산하는데 관여한 설비는 E3, A9이므로, 룰의 길이는 2가 된다. 설비 A9이 포함된 다른 룰 {P9=A9, [20, 200]}이 더 있다면, 룰의 길이는 1이 된다. 따라서, 설비 A9 관점에서는 평균 룰 길이는 (2+1)/2=1.5가 된다. 그리고, 배드_웨이퍼(Bad_Wafers)는 불량 웨이퍼들의 개수로써, 불량설비 판단 지수를 도출하는데 부여되는 가중치이다.The VIP value is the contribution value of each facility to the fault of the product, calculated in equation (4). The support value (support avg ) and the confidence value (confidence avg ) are the values calculated in the step S136 of FIG. The length of the rule (Rule_length avg ) means the average value of the number of facilities involved in producing the product when the cumulative effect exceeds the second reference value in step S136. For example, if there is a rule such as {P3 = E3, P9 = A9, [12, 88}}, the length of the rule is 2 since the equipment involved in producing the product is E3 and A9. If there is another rule {P9 = A9, [20, 200]} that includes facility A9, the length of the rule is one. Therefore, from the point of view of the facility A9, the average rule length is (2 + 1) /2=1.5. Bad_Wafers is the number of defective wafers, and is a weight given to derive a bad facility judgment index.
수학식 6은 제품의 불량에 대한 각각의 설비의 기여도인 VIP 값과 누적 효과가 반영된 수정된 연관 규칙에서 발생하는 파라미터들을 이용하여 임의로 산출한 것에 불과하다. 제품의 불량에 대한 각각의 설비의 기여도와 누적 효과가 반영된 수정된 연관 규칙에서 발생하는 파라미터들을 이용하여 다양한 불량설비 판단 지수가 도출될 수 있음은 잘 이해될 것이다.Equation (6) is only arbitrarily calculated using parameters generated in the modified association rule reflecting the cumulative effect and the VIP value, which is the contribution of each facility to the fault of the product. It will be appreciated that a variety of bad plant decision indices can be derived using parameters arising from the modified association rules that reflect the contribution and cumulative effects of each facility to product failures.
도 7은 본 발명의 다른 실시 예에 따른 불량 설비 감지 방법을 보여주는 흐름도이다. FIG. 7 is a flowchart illustrating a faulty facility detection method according to another embodiment of the present invention.
S112 단계에서, 각각의 설비들이 제품을 생산하는데 관여한 설비인지 여부에 따라 공정 경로 데이터가 이진화될 수 있다. 공정 경로 데이터는 제품이 특정 설비를 거쳤는지 여부에 따라 "1" 또는 "0"의 이진화 데이터로써 획득될 수 있다. 예를 들어, 공정 경로 데이터는 각각의 공정들로부터 획득될 수 있다. 만일, 제품이 생산되는 경로가 A1→B2→E3→...→B8→A9→B10 라고 한다면(도 2 참조), 공정 경로 데이터는 "1000100001...01010001"로 표시될 수 있다.In step S112, the process path data may be binarized depending on whether each facility is a facility involved in producing the product. The process path data may be obtained as binary data of "1" or "0 " depending on whether the product has passed through a particular facility. For example, process path data may be obtained from each process. If the path through which the product is produced is A1 → B2 → E3 → ... → B8 → A9 → B10 (see FIG. 2), the process path data may be represented by "1000100001 ... 01010001".
S114 단계에서, 제품이 정상인지 여부에 따라 공정 결과 데이터가 이진화될 수 있다. 공정 결과 데이터는 정상적으로 공정 경로를 거친 제품이 정상인지 또는 불량인지 최종적으로 판정받은 데이터를 의미한다. 예를 들어, 공정 결과 데이터는 제품이 정상인지 불량인지 여부에 따라 "1" 또는 "0"의 이진화 데이터로써 획득될 수 있다. 예를 들어, 공정 결과 데이터는 제품이 정상인지 여부를 판단하는 별도의 테스터기(tester)로부터 획득될 수 있다.In step S114, the process result data may be binarized depending on whether the product is normal or not. Process result data means data that is finally determined whether the product passed through the process path is normal or defective. For example, the process result data may be obtained as binary data of "1" or "0" depending on whether the product is normal or defective. For example, the process result data may be obtained from a separate tester that determines whether the product is normal.
S120 내지 S140 단계는 2에서 설명한 바와 동일하므로 상세한 설명은 생략하기로 한다. Since steps S120 to S140 are the same as those described in 2, a detailed description will be omitted.
본 발명의 실시 예에 따른 불량설비 판단 지수는 단순히 제품의 불량에 기여하는 각각의 설비의 기여도만을 고려한 것이 아니라, 후공정에 의해 야기되는 불량에 대한 선공정의 기여도를 함께 고려한다. 따라서, 불량 설비 탐지의 효율성 및 신뢰성을 높일 수 있다. 또한, 제조 공정의 수율을 증가시키는 최적의 경로를 탐색할 수 있다.The bad facility determination index according to the embodiment of the present invention considers not only the contribution of each facility contributing to the defect of the product but also the contribution of the pre-process to the defect caused by the post-process. Thus, the efficiency and reliability of the detection of bad facilities can be enhanced. Further, it is possible to search for an optimal path for increasing the yield of the manufacturing process.
도 8은 본 발명의 실시 예에 따른 불량 설비 감지 방법이 반도체 제조 공정에 적용되는 예를 보여주는 블록도이다.FIG. 8 is a block diagram showing an example in which a defective facility sensing method according to an embodiment of the present invention is applied to a semiconductor manufacturing process.
반도체 제조 공정(1000)은 크게 가공 공정(fabrication)(1100)과 조립 공정(assembly)(1300) 공정을 포함할 수 있다. 가공 공정(1100)이 완료되면 제 1 테스트(1200)가 수행될 수 있고, 조립 공정(1300)이 완료되면 제 2 테스트(1400)가 수행될 수 있다. 가공 공정(1100)은 포토 공정, 에칭 공정, 디퓨전 공정, CVD 공정, 배선 공정 등을 포함할 수 있다. 그리고, 이들 공정 각각은 복수의 설비들을 포함하고 있어서, 하나의 웨이퍼가 생산되기까지 원재료가 각 공정마다 거치는 공정 경로는 다양할 수 있다.The
제 1 테스트(1200)는 가공 공정(1100)을 거쳐 생산된 웨이퍼가 정상인지 또는 불량인지 여부를 테스트할 수 있다. 예를 들어, 제 1 테스트(1200)는 EDS (Electrical Die Sorting) 테스트일 수 있다. EDS 테스트는 제조된 웨이퍼에 대해 전기적 특성 검사를 실시하여 웨이퍼가 기준 품질을 만족하는지 여부를 테스트하는 공정이다. EDS 테스트는 ET Test & WBI (Electrical Test & Wafer Burn In), Pre-Laser (Hot/Cold), Laser Repair & Post Laser, Tape Laminate & Bake Grinding, Inking 공정 등을 포함할 수 있다.The
제 1 테스트(1200)를 거쳐 제품이 정상인지 여부에 관한 데이터인 공정 결과 데이터가 획득될 수 있다. 본 발명의 실시 예에 따르면, 가공 공정(1100)으로부터 공정 경로 데이터를 획득하고, 제 1 테스트(1200)로부터 공정 결과 데이터를 획득할 수 있다. 그리고, 획득된 데이터에 기초하여, 제품의 불량을 야기하는 혐의 설비(suspicious equipment)를 감지하는데 이용될 수 있다.Through the
뿐만 아니라, 본 발명은 조립 공정(assembly)(1300)에도 적용될 수 있다. 예를 들어, 조립 공정(1300)은 패키지 공정일 수 있다. 제 2 테스트(1400)는 패키지 테스트일 수 있으며, Assembly Out, DC test & Loading / Burn-in (& Unloading), MBT (Monitoring Burn-in & Tester), Post Burn Test, Final Test 등을 포함할 수 있다. 조립 공정(1300)에서 생산된 패키지에 대해 제 2 테스트(1400)를 실시함으로써, 제품이 최종적으로 정상인지 불량인지 여부가 판단될 수 있다.In addition, the present invention may also be applied to an
본 발명의 실시 예에 따르면, 조립 공정(1300)으로부터 공정 경로 데이터를 획득하고, 제 2 테스트(1400)로부터 공정 결과 데이터를 획득할 수 있다. 그리고, 획득된 데이터에 기초하여, 제품의 불량을 야기하는 혐의 설비(suspicious equipment)를 감지하는데 이용될 수 있다.According to an embodiment of the present invention, process path data may be obtained from the
도 9는 본 발명의 실시 예에 따른 불량 설비 감지 방법이 LCD 제조 공정에 적용되는 예를 보여주는 블록도이다.FIG. 9 is a block diagram showing an example in which a defective facility sensing method according to an embodiment of the present invention is applied to an LCD manufacturing process.
LCD 제조 공정(2000)은 크게 TFT 공정(2100), 칼라 필터(Color Filter) 공정(2200), 셀(Cell) 공정(2300), 및 모듈(Module) 공정(2400)을 포함할 수 있다. 그리고 각각의 공정들을 많은 서브-공정들을 포함할 수 있다. 예를 들어, TFT 공정은 세정(Cleaning), 증착(Deposition), 세정(Cleaning), PR 도포(PR coating), 노광(Exposure), 현상(Develop), 식각(Etching), PR 박리(PR strip) 공정 등을 포함할 수 있다.The
TFT 공정(2100)이 완료되면, 제품의 불량 여부를 테스트하는 검사가 수행될 수 있다. 본 발명의 실시 예에 따르면, TFT 공정(1300)에 포함된 복수의 서브-공정들로부터 공정 경로 데이터가 획득되고, TFT의 불량 여부를 테스트하는 테스터기(미도시)로부터 공정 결과 데이터가 획득될 수 있다. 그리고, 획득된 데이터에 기초하여, 제품의 불량을 야기하는 혐의 설비(suspicious equipment)를 감지할 수 있다. 마찬가지로, 다른 공정들(2200 내지 2400)에도 본 발명이 적용될 수 있음은 잘 이해될 것이다.When the
본 발명의 범위 또는 기술적 사상을 벗어나지 않고 본 발명의 구조가 다양하게 수정되거나 변경될 수 있음은 이 분야에 숙련된 자들에게 자명하다. 상술한 내용을 고려하여 볼 때, 만약 본 발명의 수정 및 변경이 아래의 청구항들 및 동등물의 범주 내에 속한다면, 본 발명이 이 발명의 변경 및 수정을 포함하는 것으로 여겨진다.It will be apparent to those skilled in the art that the structure of the present invention can be variously modified or changed without departing from the scope or spirit of the present invention. In view of the foregoing, it is intended that the present invention cover the modifications and variations of this invention provided they fall within the scope of the following claims and equivalents.
110-m: 제 m 공정 120: 불량 설비 감지 장치
122: 입력부 124: 제어부110-m: m < th > process 120:
122: input unit 124:
Claims (10)
상기 제품의 공정 경로 데이터 및 공정 결과 데이터를 획득하는 단계;
상기 획득된 데이터들에 기초하여 상기 제품의 불량에 대한 상기 선택된 설비들 각각의 기여도를 산출하는 단계;
상기 산출된 기여도에 기초하여, 선택된 설비들에 대하여 상기 제품의 불량에 기여하는 설비 및 생산 경로의 누적 효과를 반영하는 규칙들을 생성하는, 수정된 연관 규칙을 적용하는 단계; 그리고
상기 산출된 기여도 및 상기 수정된 연관 규칙에 기초하여 불량설비 판단 지수를 산출하는 단계를 포함하되,
상기 획득하는 단계는:
상기 복수의 설비들이 상기 제품을 생산하는데 관여한 설비인지 여부에 따라 상기 공정 경로 데이터를 이진화하는 단계; 그리고
상기 제품이 정상인지 여부에 따라 상기 공정 결과 데이터를 이진화하는 단계를 포함하는 불량 설비 탐지 방법.A method for detecting a defective facility in a manufacturing process in which a product is produced by a selected one of a plurality of facilities in each of a plurality of processes, the method comprising:
Obtaining process path data and process result data of the product;
Calculating a contribution of each of said selected facilities to a fault of said product based on said obtained data;
Applying a modified association rule to the selected facilities based on the calculated contribution to generate rules that reflect the cumulative effect of equipment and production paths contributing to the failure of the product; And
Calculating a bad facility determination index based on the calculated contribution and the modified association rule,
Wherein the obtaining comprises:
Binarizing the process path data according to whether the plurality of facilities are facilities involved in producing the product; And
And binarizing the process result data according to whether the product is normal or not.
상기 기여도를 산출하는 단계는 다변량 회귀분석 또는 변수 선택법을 사용하여 수행되는 불량 설비 탐지 방법.The method according to claim 1,
Wherein the step of calculating the contribution is performed using a multivariate regression analysis or a variable selection method.
상기 다변량 회귀분석 또는 상기 변수 선택법 은 PLSR-VIP (Partial Least Square Regression-Variable Importance in the Projection), mRMR (Minimum-Redundancy-Maximum-Relevance) 변수 선택법, 또는 SVM-RFE (Support Vector Machine Recursive Feature Elimination) 중 어느 하나인 불량 설비 탐지 방법.The method of claim 3,
The multivariate regression analysis or the variable selection method may be performed using a PLSR-VIP (Partial Least Square Regression-Variable Importance in the Projection), a Minimum-Redundancy-Maximum-Relevance (mRMR) variable selection method, or a SVM-Supported Vector Machine Recursive Feature Elimination A method of detecting a defective facility.
상기 수정된 연관 규칙을 적용하는 단계는:
상기 공정 경로 데이터에 대응하는 설비들로부터 상기 기여도가 제 1 기준값 이하인 설비들을 제거하여, 상기 규칙들을 생성하는 단계;
상기 규칙들로부터 상기 규칙들에 포함된 설비들 중 후공정 설비에 의한 누적 효과 값들을 산출하는 단계;
상기 누적 효과가 제 2 기준값을 초과하는 규칙들을 선택하는 단계; 그리고
상기 선택된 규칙들에 대하여, 상기 수정된 연관 규칙 적용시 발생하는 파라미터들의 대표값을 산출하는 단계를 포함하는 불량 설비 탐지 방법.The method of claim 3,
Wherein applying the modified association rule comprises:
Removing facilities having the contribution lower than a first reference value from facilities corresponding to the process path data, and generating the rules;
Calculating cumulative effect values of post-processing facilities among the facilities included in the rules from the rules;
Selecting rules for which the cumulative effect exceeds a second reference value; And
And calculating a representative value of parameters generated when applying the modified association rule, to the selected rules.
상기 누적 효과는 선공정의 정확도에 대한, 후공정에 의한 불량율의 증가분의 비율인 불량 설비 탐지 방법.6. The method of claim 5,
Wherein the cumulative effect is a ratio of an increase in a defective rate by a post-process to an accuracy of a pre-process.
상기 수정된 연관 규칙을 적용하는 단계는 Apriori, Eclat, AprioriDP, 또는 CMPNARM 알고리즘을 사용함으로써 수행되는 불량 설비 탐지 방법.6. The method of claim 5,
Wherein applying the modified association rule is performed by using an Apriori, Eclat, AprioriDP, or CMPNARM algorithm.
상기 불량설비 판단 지수는 상기 기여도, 상기 파라미터들의 상기 대표값, 및 불량 제품의 개수 중 적어도 하나를 독립 변수로 하는 제 1 함수를 포함하는 불량 설비 탐지 방법.6. The method of claim 5,
Wherein the defective equipment determination index includes a first function having at least one of the contribution, the representative value of the parameters, and the number of defective products as independent variables.
상기 획득된 데이터들에 기초하여 상기 제품의 불량에 대한 각각의 설비의 기여도를 산출하고, 상기 산출된 기여도에 기초하여 선택된 설비들에 대하여 상기 제품의 불량에 기여하는 설비 및 생산 경로의 누적 효과를 반영하는 규칙들을 생성하는 수정된 연관 규칙을 적용하고, 그리고 상기 산출된 기여도 및 상기 수정된 연관 규칙에 기초하여 불량설비 판단 지수를 산출하는 제어부를 포함하되,
상기 제어부는 상기 복수의 설비들이 상기 제품을 생산하는데 관여한 설비인지 여부에 따라 상기 공정 경로 데이터를 이진화하고, 그리고 상기 제품이 정상인지 여부에 따라 상기 공정 결과 데이터를 이진화하는 불량 설비 탐지 장치.An input unit for acquiring process path data and process result data of the product; And
Calculating a contribution of each facility to the fault of the product based on the obtained data and calculating a cumulative effect of facilities and a production route contributing to the defect of the product to the facilities selected based on the calculated contribution Applying a modified association rule that generates rules that reflect the usage rule and the modified association rule, and calculating a bad facility determination index based on the calculated contribution and the modified association rule,
Wherein the control unit binarizes the process path data according to whether the plurality of facilities is equipment involved in producing the product, and binarizes the process result data according to whether the product is normal or not.
Priority Applications (2)
| Application Number | Priority Date | Filing Date | Title |
|---|---|---|---|
| KR1020140060603A KR101466798B1 (en) | 2014-05-20 | 2014-05-20 | Method and apparatus for discovering the equipment causing product faults in manufacturing process |
| US14/674,383 US20150338847A1 (en) | 2014-05-20 | 2015-03-31 | Method and apparatus for discovering equipment causing product defect in manufacturing process |
Applications Claiming Priority (1)
| Application Number | Priority Date | Filing Date | Title |
|---|---|---|---|
| KR1020140060603A KR101466798B1 (en) | 2014-05-20 | 2014-05-20 | Method and apparatus for discovering the equipment causing product faults in manufacturing process |
Publications (1)
| Publication Number | Publication Date |
|---|---|
| KR101466798B1 true KR101466798B1 (en) | 2014-12-01 |
Family
ID=52676937
Family Applications (1)
| Application Number | Title | Priority Date | Filing Date |
|---|---|---|---|
| KR1020140060603A Active KR101466798B1 (en) | 2014-05-20 | 2014-05-20 | Method and apparatus for discovering the equipment causing product faults in manufacturing process |
Country Status (2)
| Country | Link |
|---|---|
| US (1) | US20150338847A1 (en) |
| KR (1) | KR101466798B1 (en) |
Cited By (7)
| Publication number | Priority date | Publication date | Assignee | Title |
|---|---|---|---|---|
| KR20180031698A (en) * | 2015-07-22 | 2018-03-28 | 도쿄엘렉트론가부시키가이샤 | Tool error analysis using spatial distortion similarity |
| KR20200052426A (en) * | 2018-10-26 | 2020-05-15 | 안상의 | Method of predicting processing fault considering process factor |
| KR20200125734A (en) * | 2018-04-19 | 2020-11-04 | 미쓰비시덴키 가부시키가이샤 | Apparatus, method, and computer program stored in a recording medium for specifying abnormal equipment |
| CN111932394A (en) * | 2020-08-10 | 2020-11-13 | 成都数之联科技有限公司 | Bad root cause path analysis method and system based on association rule mining |
| CN114090647A (en) * | 2021-10-22 | 2022-02-25 | 国家电网公司西南分部 | Power communication equipment defect relevance analysis method and defect checking method |
| KR20230072164A (en) | 2021-11-17 | 2023-05-24 | 주식회사 유유랑컴퍼니 | Product quality management system for zero defect rate |
| US12517799B2 (en) | 2023-09-08 | 2026-01-06 | Samsung Electronics Co., Ltd. | Method and apparatus with test result reliability verification |
Families Citing this family (10)
| Publication number | Priority date | Publication date | Assignee | Title |
|---|---|---|---|---|
| US9910429B2 (en) * | 2013-09-03 | 2018-03-06 | The Procter & Gamble Company | Systems and methods for adjusting target manufacturing parameters on an absorbent product converting line |
| CN106093612B (en) * | 2016-05-26 | 2019-03-19 | 国网江苏省电力公司电力科学研究院 | A kind of power transformer fault diagnosis method |
| EP3379354A1 (en) * | 2017-03-20 | 2018-09-26 | Klingelnberg AG | Method and device for automatic processing of toothed wheel components |
| CN107783071A (en) * | 2017-10-23 | 2018-03-09 | 盐城工学院 | Sensor fault monitoring method and device |
| WO2019226715A1 (en) * | 2018-05-21 | 2019-11-28 | Promptlink Communications, Inc. | Techniques for assessing a customer premises equipment device |
| CN109444602A (en) * | 2018-12-12 | 2019-03-08 | 云南电网有限责任公司电力科学研究院 | A kind of surge arrester failure monitoring method and device based on projection variation |
| CN109840554B (en) * | 2018-12-26 | 2023-05-02 | 贵州联科卫信科技有限公司 | Alzheimer's disease MRI image classification method based on SVM-RFE-MRMR algorithm |
| DE102020210967A1 (en) * | 2019-11-14 | 2021-05-20 | Sms Group Gmbh | Method and system for optimizing a production process in a production plant in the metal-producing industry, the non-ferrous industry or the steel industry for the production of semi-finished or finished products, in particular for monitoring the product quality of rolled or forged metal products |
| JP7406441B2 (en) * | 2020-04-08 | 2023-12-27 | 株式会社日立製作所 | Manufacturing defect factor search method and manufacturing defect factor search device |
| KR102711997B1 (en) * | 2021-11-12 | 2024-09-30 | (주)미소정보기술 | Method for abnormal detection |
Citations (4)
| Publication number | Priority date | Publication date | Assignee | Title |
|---|---|---|---|---|
| KR20070064259A (en) * | 2005-12-15 | 2007-06-20 | 오므론 가부시키가이샤 | Process Anomaly Analysis Device and Program |
| KR20100129757A (en) * | 2008-03-07 | 2010-12-09 | 엠케이에스 인스트루먼츠, 인코포레이티드 | Process control using process data and yield data |
| KR20120128251A (en) * | 2011-05-17 | 2012-11-27 | 구흥섭 | Fault detection method |
| KR20140039380A (en) * | 2012-09-20 | 2014-04-02 | 국립대학법인 울산과학기술대학교 산학협력단 | Apparatus and method for quality control using datamining in manufacturing process |
Family Cites Families (5)
| Publication number | Priority date | Publication date | Assignee | Title |
|---|---|---|---|---|
| JP3870052B2 (en) * | 2001-09-20 | 2007-01-17 | 株式会社日立製作所 | Semiconductor device manufacturing method and defect inspection data processing method |
| US7539585B2 (en) * | 2007-06-14 | 2009-05-26 | International Business Machines Corporation | System and method for rule-based data mining and problem detection for semiconductor fabrication |
| US8855804B2 (en) * | 2010-11-16 | 2014-10-07 | Mks Instruments, Inc. | Controlling a discrete-type manufacturing process with a multivariate model |
| US8732627B2 (en) * | 2012-06-18 | 2014-05-20 | International Business Machines Corporation | Method and apparatus for hierarchical wafer quality predictive modeling |
| JP6165658B2 (en) * | 2014-03-20 | 2017-07-19 | 株式会社東芝 | Manufacturing apparatus management system and manufacturing apparatus management method |
-
2014
- 2014-05-20 KR KR1020140060603A patent/KR101466798B1/en active Active
-
2015
- 2015-03-31 US US14/674,383 patent/US20150338847A1/en not_active Abandoned
Patent Citations (4)
| Publication number | Priority date | Publication date | Assignee | Title |
|---|---|---|---|---|
| KR20070064259A (en) * | 2005-12-15 | 2007-06-20 | 오므론 가부시키가이샤 | Process Anomaly Analysis Device and Program |
| KR20100129757A (en) * | 2008-03-07 | 2010-12-09 | 엠케이에스 인스트루먼츠, 인코포레이티드 | Process control using process data and yield data |
| KR20120128251A (en) * | 2011-05-17 | 2012-11-27 | 구흥섭 | Fault detection method |
| KR20140039380A (en) * | 2012-09-20 | 2014-04-02 | 국립대학법인 울산과학기술대학교 산학협력단 | Apparatus and method for quality control using datamining in manufacturing process |
Cited By (11)
| Publication number | Priority date | Publication date | Assignee | Title |
|---|---|---|---|---|
| KR20180031698A (en) * | 2015-07-22 | 2018-03-28 | 도쿄엘렉트론가부시키가이샤 | Tool error analysis using spatial distortion similarity |
| KR102564629B1 (en) | 2015-07-22 | 2023-08-07 | 도쿄엘렉트론가부시키가이샤 | Tool Error Analysis Using Spatial Distortion Similarity |
| KR20200125734A (en) * | 2018-04-19 | 2020-11-04 | 미쓰비시덴키 가부시키가이샤 | Apparatus, method, and computer program stored in a recording medium for specifying abnormal equipment |
| KR102244169B1 (en) | 2018-04-19 | 2021-04-23 | 미쓰비시덴키 가부시키가이샤 | Apparatus, method for specifying abnormal equipment, and computer program stored in a recording medium |
| KR20200052426A (en) * | 2018-10-26 | 2020-05-15 | 안상의 | Method of predicting processing fault considering process factor |
| KR102247945B1 (en) * | 2018-10-26 | 2021-05-03 | 안상의 | Method of predicting processing fault considering process factor |
| CN111932394A (en) * | 2020-08-10 | 2020-11-13 | 成都数之联科技有限公司 | Bad root cause path analysis method and system based on association rule mining |
| CN111932394B (en) * | 2020-08-10 | 2023-10-31 | 成都数之联科技股份有限公司 | Bad root cause path analysis method and system based on association rule mining |
| CN114090647A (en) * | 2021-10-22 | 2022-02-25 | 国家电网公司西南分部 | Power communication equipment defect relevance analysis method and defect checking method |
| KR20230072164A (en) | 2021-11-17 | 2023-05-24 | 주식회사 유유랑컴퍼니 | Product quality management system for zero defect rate |
| US12517799B2 (en) | 2023-09-08 | 2026-01-06 | Samsung Electronics Co., Ltd. | Method and apparatus with test result reliability verification |
Also Published As
| Publication number | Publication date |
|---|---|
| US20150338847A1 (en) | 2015-11-26 |
Similar Documents
| Publication | Publication Date | Title |
|---|---|---|
| KR101466798B1 (en) | Method and apparatus for discovering the equipment causing product faults in manufacturing process | |
| TWI649650B (en) | Methods of modelling systems or performing predictive maintenance of systems, such as lithographic systems, and associated lithographic systems | |
| US7681159B2 (en) | System and method for detecting defects in a semiconductor during manufacturing thereof | |
| JP4615222B2 (en) | Correlation between line end data mining and process tool data mining | |
| JP7354421B2 (en) | Error factor estimation device and estimation method | |
| KR20200014938A (en) | Systems and methods for predicting defects and critical dimensions using deep learning in semiconductor manufacturing processes | |
| CN110503288B (en) | System and method for identifying yield loss reason considering machine interaction | |
| US20190064253A1 (en) | Semiconductor yield prediction | |
| KR102352701B1 (en) | Defect detection on transparent or translucent wafers | |
| US9689923B2 (en) | Adaptive electrical testing of wafers | |
| TWI862795B (en) | Methods and models for predicting die susceptible to early lifetime failure | |
| US11624775B2 (en) | Systems and methods for semiconductor defect-guided burn-in and system level tests | |
| TW201445656A (en) | System and method for identifying systematic defects in wafer inspection using hierarchical grouping and filtering | |
| JP2018504772A (en) | Determining critical parameters using a high-dimensional variable selection model | |
| US20170309009A1 (en) | Computer Assisted Weak Pattern Detection and Quantification System | |
| Gangidi | Application of six sigma in semiconductor manufacturing: A case study in yield improvement | |
| WO2019006222A1 (en) | Systems and methods for predicting defects and critical dimension using deep learning in the semiconductor manufacturing process | |
| KR20220115820A (en) | System, method and non-transitory computer readable medium for tuning sensitivies of, and determinng a process window for, a modulated wafer | |
| CN101118422A (en) | Method and system for virtual measurement estimation and estimation model establishment in semiconductor manufacturing | |
| JP6832175B2 (en) | Processing flow management device and processing flow management method | |
| JP4276503B2 (en) | Methods for narrowing down the causes of semiconductor defects | |
| JP2005033090A (en) | Apparatus state discrimination system and manufacturing process stabilization system in manufacturing process | |
| Sakamoto et al. | New method of screening out outlier; expanded part average testing during package level test | |
| Baek et al. | Optimization of blended virtual and actual metrology schemes | |
| US7849366B1 (en) | Method and apparatus for predicting yield parameters based on fault classification |
Legal Events
| Date | Code | Title | Description |
|---|---|---|---|
| PA0109 | Patent application |
St.27 status event code: A-0-1-A10-A12-nap-PA0109 |
|
| PA0201 | Request for examination |
St.27 status event code: A-1-2-D10-D11-exm-PA0201 |
|
| PA0302 | Request for accelerated examination |
St.27 status event code: A-1-2-D10-D17-exm-PA0302 St.27 status event code: A-1-2-D10-D16-exm-PA0302 |
|
| D13-X000 | Search requested |
St.27 status event code: A-1-2-D10-D13-srh-X000 |
|
| D14-X000 | Search report completed |
St.27 status event code: A-1-2-D10-D14-srh-X000 |
|
| PE0902 | Notice of grounds for rejection |
St.27 status event code: A-1-2-D10-D21-exm-PE0902 |
|
| E13-X000 | Pre-grant limitation requested |
St.27 status event code: A-2-3-E10-E13-lim-X000 |
|
| P11-X000 | Amendment of application requested |
St.27 status event code: A-2-2-P10-P11-nap-X000 |
|
| P13-X000 | Application amended |
St.27 status event code: A-2-2-P10-P13-nap-X000 |
|
| R18-X000 | Changes to party contact information recorded |
St.27 status event code: A-3-3-R10-R18-oth-X000 |
|
| E701 | Decision to grant or registration of patent right | ||
| PE0701 | Decision of registration |
St.27 status event code: A-1-2-D10-D22-exm-PE0701 |
|
| GRNT | Written decision to grant | ||
| PR0701 | Registration of establishment |
St.27 status event code: A-2-4-F10-F11-exm-PR0701 |
|
| PR1002 | Payment of registration fee |
St.27 status event code: A-2-2-U10-U11-oth-PR1002 Fee payment year number: 1 |
|
| PG1601 | Publication of registration |
St.27 status event code: A-4-4-Q10-Q13-nap-PG1601 |
|
| PR1001 | Payment of annual fee |
St.27 status event code: A-4-4-U10-U11-oth-PR1001 Fee payment year number: 4 |
|
| FPAY | Annual fee payment |
Payment date: 20181031 Year of fee payment: 5 |
|
| PR1001 | Payment of annual fee |
St.27 status event code: A-4-4-U10-U11-oth-PR1001 Fee payment year number: 5 |
|
| PR1001 | Payment of annual fee |
St.27 status event code: A-4-4-U10-U11-oth-PR1001 Fee payment year number: 6 |
|
| PR1001 | Payment of annual fee |
St.27 status event code: A-4-4-U10-U11-oth-PR1001 Fee payment year number: 7 |
|
| PR1001 | Payment of annual fee |
St.27 status event code: A-4-4-U10-U11-oth-PR1001 Fee payment year number: 8 |
|
| R18-X000 | Changes to party contact information recorded |
St.27 status event code: A-5-5-R10-R18-oth-X000 |
|
| PR1001 | Payment of annual fee |
St.27 status event code: A-4-4-U10-U11-oth-PR1001 Fee payment year number: 9 |
|
| PN2301 | Change of applicant |
St.27 status event code: A-5-5-R10-R13-asn-PN2301 St.27 status event code: A-5-5-R10-R11-asn-PN2301 |
|
| PR1001 | Payment of annual fee |
St.27 status event code: A-4-4-U10-U11-oth-PR1001 Fee payment year number: 10 |
|
| PR1001 | Payment of annual fee |
St.27 status event code: A-4-4-U10-U11-oth-PR1001 Fee payment year number: 11 |
|
| PR1001 | Payment of annual fee |
St.27 status event code: A-4-4-U10-U11-oth-PR1001 Fee payment year number: 12 |
|
| U11 | Full renewal or maintenance fee paid |
Free format text: ST27 STATUS EVENT CODE: A-4-4-U10-U11-OTH-PR1001 (AS PROVIDED BY THE NATIONAL OFFICE) Year of fee payment: 12 |
|
| P22-X000 | Classification modified |
St.27 status event code: A-4-4-P10-P22-nap-X000 |