KR100982034B1 - Monitoring method and system for database performance - Google Patents
Monitoring method and system for database performance Download PDFInfo
- Publication number
- KR100982034B1 KR100982034B1 KR1020100044189A KR20100044189A KR100982034B1 KR 100982034 B1 KR100982034 B1 KR 100982034B1 KR 1020100044189 A KR1020100044189 A KR 1020100044189A KR 20100044189 A KR20100044189 A KR 20100044189A KR 100982034 B1 KR100982034 B1 KR 100982034B1
- Authority
- KR
- South Korea
- Prior art keywords
- data
- monitoring
- database
- normal range
- time
- Prior art date
- Legal status (The legal status is an assumption and is not a legal conclusion. Google has not performed a legal analysis and makes no representation as to the accuracy of the status listed.)
- Active
Links
Images


Classifications
-
- G—PHYSICS
- G06—COMPUTING OR CALCULATING; COUNTING
- G06F—ELECTRIC DIGITAL DATA PROCESSING
- G06F11/00—Error detection; Error correction; Monitoring
- G06F11/30—Monitoring
-
- G—PHYSICS
- G06—COMPUTING OR CALCULATING; COUNTING
- G06F—ELECTRIC DIGITAL DATA PROCESSING
- G06F9/00—Arrangements for program control, e.g. control units
- G06F9/06—Arrangements for program control, e.g. control units using stored programs, i.e. using an internal store of processing equipment to receive or retain programs
- G06F9/22—Microcontrol or microprogram arrangements
Landscapes
- Engineering & Computer Science (AREA)
- Theoretical Computer Science (AREA)
- Software Systems (AREA)
- Physics & Mathematics (AREA)
- General Engineering & Computer Science (AREA)
- General Physics & Mathematics (AREA)
- Quality & Reliability (AREA)
- Debugging And Monitoring (AREA)
Abstract
본 발명은 데이터베이스의 성능을 모니터링하는 방법 및 시스템에 관한 것으로 더욱 상세하게는 평균과 표준편차를 활용하여 동적인 임계치를 산출하여 다이나믹하고 효과적인 시스템 감시를 제공하는 모니터링 방법 및 시스템에 관한 것이다.
본 발명에 따르는 데이터베이스 성능 모니터링 방법은 시계열 데이터를 수집하는 단계; 시계열 데이터를 평균과 표준편차를 이용하여 데이터 패턴을 인식하되, 시구간별 동적 임계치를 산출하고 모니터링 항목별로 표준화된 모니터링 단위를 제공하기 위해, (a)모니터링 항목별 정상범위 구간 데이터와 임계치 데이터를 산출하는 단계 및 (b)상기 산출된 데이터를 이용하여 실시간으로 접근되는 데이터를 모니터링하는 단계를 포함하되, 상기 (a)단계는 (a1)지정된 구간의 성능 로깅 데이터를 추출하는 단계; (a2)평균과 표준편차를 산출하는 단계; (a3)모니터링 항목별 정상범위 구간 및 임계치 산출 단계; 및 (a4)데이터베이스에 저장하는 단계를 수행하는 일련의 절차를 포함하고, 상기 (b)단계는 (b1)실시간 데이터를 모니터링하는 단계; (b2)상기 (a3)단계에서 산출된 정상범위 구간 및 임계치를 데이터베이스로부터 추출하는 단계; (b3)실시간 데이터가 정상범위에 있는지를 판단한 후 정상범위인 경우 상기 (b1)단계에서부터 다시 수행하고, 정상범위를 벗어난 경우 다음 절차를 수행하도록 하는 단계; (b4)실시간 데이터가 미리 설정된 횟수만큼 반복적으로 정상범위를 이탈하는지 여부를 판단한 후 정상범위를 이탈하지 않은 경우 상기(b1)단계부터 절차를 다시 수행하고, 정상범위를 이탈한 경우는 다음 절차를 수행하도록 하는 단계; (b5)정상구간을 벗어났다는 경고에 관한 정보를 로깅한 후 데이터베이스에 저장하는 단계; 및 (b6)경고를 발생하는 단계를 수행하는 일련의 절차를 포함하는 시계열 데이터 분석단계; 및 클라이언트의 주기적 질의에 대한 응답 및 경고를 발생하는 단계를 포함하는 것을 특징으로 한다.The present invention relates to a method and system for monitoring the performance of a database, and more particularly, to a monitoring method and system for providing a dynamic and effective system monitoring by calculating dynamic thresholds using averages and standard deviations.
A database performance monitoring method in accordance with the present invention comprises the steps of: collecting time series data; (A) Calculate normal range data and threshold data for each monitoring item in order to recognize the data pattern using the mean and standard deviation of time series data, and to calculate dynamic threshold values for each time period and provide standardized monitoring units for each monitoring item. And (b) monitoring data accessed in real time using the calculated data, wherein step (a) comprises: (a1) extracting performance logging data of a specified section; (a2) calculating the mean and standard deviation; (a3) calculating a normal range section and a threshold value for each monitoring item; And (a4) a series of procedures for performing a step of storing in a database, wherein step (b) comprises: (b1) monitoring real time data; (b2) extracting the normal range section and the threshold value calculated in step (a3) from a database; (b3) determining whether the real-time data is in the normal range, and then performing the process again from the step (b1) in the case of the normal range, and performing the following procedure if the real-time data is out of the normal range; (b4) If it is determined that the real-time data has repeatedly departed from the normal range by a predetermined number of times, if the normal range is not departed, the procedure is repeated from step (b1) above. To perform; (b5) logging the information regarding the warning that the user has left the normal section and storing the information in a database; And (b6) a time series data analysis step including a series of procedures for performing the step of generating a warning; And generating a response and an alert to the periodic query of the client.
Description
본 발명은 데이터베이스의 성능을 모니터링하는 방법 및 시스템에 관한 것으로 더욱 상세하게는 평균과 표준편차를 활용하여 동적인 임계치를 산출하여 다이나믹하고 효과적인 시스템 감시를 제공하는 모니터링 방법 및 시스템에 관한 것이다.
The present invention relates to a method and system for monitoring the performance of a database, and more particularly, to a monitoring method and system for providing a dynamic and effective system monitoring by calculating dynamic thresholds using averages and standard deviations.
시스템을 운영하는 기업들은 대부분 시스템을 모니터링하거나 Alerting을 받을 수 있는 다양한 형태의 소프트웨어를 사용하고 있다. 이러한 소프트웨어들은 시스템이나 데이터베이스의 특정 항목에 대하여 별도로 저장된 임계치를 통해 임계치 초과 여부를 검사하고, 임계치 초과 시 사용자에게 해당 사실을 Alerting 해주는 기능을 수행하고 있으나 현실적으로 많은 운영상의 문제점들을 가지고 있어 실질적인 효과를 기대하기 어려운 것이 사실이다. 특히, 1차원적인 획일적인 임계치 설정은 시스템이나 데이터베이스가 가지고 있는 다양한 운영상의 특성 (Peak-Time, 결산, 마감작업, 집중 Batch 수행 등이 몰리는 현상)을 반영할 수 없으므로 장애 또는 성능 저하 발생 시 빠른 대응을 통한 장애 시간 최소화를 기대하기 어렵다. 즉, 실질적인 의미에서의 효과적인 모니터링이 제대로 이루어지지 못하고 있다고 해도 과언이 아니다. 또한 다양한 장애나 성능 이슈로 인하여 수많은 모니터링 항목이 존재하고 이를 표준화한 단위가 존재하지 않아 적절한 시스템 감시를 위해서는 상당한 경력을 가진 전문엔지니어에 의해서 수행해야하므로 기업의 입장에서는 인력 수급 및 유지에 있어서 상당한 부담이 아닐 수 없다.
Most companies that run systems use various forms of software that can monitor and alert them. Such software checks whether a threshold is exceeded through a threshold that is stored separately for a specific item in the system or database, and alerts the user when the threshold is exceeded, but there are many operational problems in reality. It is true that it is difficult to do. In particular, the one-dimensional, uniform threshold setting cannot reflect various operational characteristics of the system or database (such as peak-time, closing, closing, intensive batch execution, etc.) It is difficult to expect to minimize downtime through response. In other words, it is not an exaggeration to say that effective monitoring in a practical sense is not performed properly. In addition, there are many monitoring items due to various obstacles and performance issues, and there is no standardized unit. Therefore, it is necessary to perform a professional engineer with considerable experience for proper system monitoring. This can not be.
본 발명은 많은 기업들이 겪고 있는 상기의 다양한 모니터링의 어려운 문제점들을 해결하기 위하여 평균과 표준편차를 활용한 시계열 분석을 통해 자동으로 동적 임계치를 생성하고 패턴을 인식하여 장애를 사전에 감지하거나 즉시 감지할 수 있는 방법을 제시함으로써 다양한 장애나 성능 이슈로 인한 기업들의 손실을 획기적으로 최소화할 수 있다. 특히, 성능 모니터링과 관련된 수많은 항목들을 정규화를 통해 표준화하여 모니터링함으로써 전문 엔지이너들만이 할 수 있는 시스템이나 모니터링 분야를 다양한 인력들이 수행할 수 있도록 해줄 수 있는 방법 및 시스템의 제공을 목적으로 한다.In order to solve the above-mentioned various problems of monitoring that many companies are experiencing, the present invention can automatically generate dynamic thresholds and recognize patterns through time series analysis using mean and standard deviation, and detect faults immediately or immediately. By presenting ways you can dramatically reduce the loss of companies due to various failures or performance issues. In particular, it aims to provide a method and system that can allow various personnel to perform a system or monitoring field that can only be performed by professional engineers by standardizing and monitoring a large number of items related to performance monitoring.
본 발명에 따르는 데이터베이스 성능 모니터링 방법은 시계열 데이터를 수집하는 단계; 시계열 데이터를 평균과 표준편차를 이용하여 데이터 패턴을 인식하되, 시구간별 동적 임계치를 산출하고 모니터링 항목별로 표준화된 모니터링 단위를 제공하기 위해, (a)모니터링 항목별 정상범위 구간 데이터와 임계치 데이터를 산출하는 단계 및 (b)상기 산출된 데이터를 이용하여 실시간으로 접근되는 데이터를 모니터링하는 단계를 포함하되, 상기 (a)단계는 (a1)지정된 구간의 성능 로깅 데이터를 추출하는 단계; (a2)평균과 표준편차를 산출하는 단계; (a3)모니터링 항목별 정상범위 구간 및 임계치 산출 단계; 및 (a4)데이터베이스에 저장하는 단계를 수행하는 일련의 절차를 포함하고, 상기 (b)단계는 (b1)실시간 데이터를 모니터링하는 단계; (b2)상기 (a3)단계에서 산출된 정상범위 구간 및 임계치를 데이터베이스로부터 추출하는 단계; (b3)실시간 데이터가 정상범위에 있는지를 판단한 후 정상범위인 경우 상기 (b1)단계에서부터 다시 수행하고, 정상범위를 벗어난 경우 다음 절차를 수행하도록 하는 단계; (b4)실시간 데이터가 미리 설정된 횟수만큼 반복적으로 정상범위를 이탈하는지 여부를 판단한 후 정상범위를 이탈하지 않은 경우 상기(b1)단계부터 절차를 다시 수행하고, 정상범위를 이탈한 경우는 다음 절차를 수행하도록 하는 단계; (b5)정상구간을 벗어났다는 경고에 관한 정보를 로깅한 후 데이터베이스에 저장하는 단계; 및 (b6)경고를 발생하는 단계를 수행하는 일련의 절차를 포함하는 시계열 데이터 분석단계; 및 클라이언트의 주기적 질의에 대한 응답 및 경고를 발생하는 단계를 포함하는 것을 특징으로 한다.
또한, 상기 데이터 수집단계는 데이터베이스 관리시스템(DBMS)의 메모리 구조를 직접 읽어들이는 직접 메모리 접근방식에 의해 데이터를 추출하는 방식에 의한 것을 특징으로 하고,
상기 데이터 수집단계는 데이터 손실을 방지하기 위하여 운영체제(OS)상의 메시지 큐를 이용하여 데이터를 버퍼링함으로써 데이터를 송수신하는 것을 특징으로 하며,
상기 데이터 수집단계는 데이터 손실을 방지하기 위하여 운영체제(OS)상의 파일(File) 로깅(logging) 방식을 이용하여 데이터를 저장하되, 별도의 데몬 프로세스에 의해 데이터를 수집하여 분석서버에 전송하는 것을 특징으로 한다.
또한, 상기 (a)단계에 있어서 각 단계는 데이터를 추출한 후 시간, 날짜, 요일별로 구분하여 패턴화하여 정상범위 구간과 임계치 산출 저장하는 단계를 수행하는 것을 특징으로 하고, (b)단계에 있어서도 시간, 날짜, 요일별 특성을 반영하여 실시간 데이터를 모니터링하는 일련의 절차를 수행하는 것을 특징으로 하고,
상기 (a)단계에서 데이터를 추출하는 단계는 다수의 원격 소스서버에 구비된 데이터 송신모듈로부터 데이터가 송신되는 단계와 분석서버에 구비된 데이터 수신모듈을 통해 데이터를 수신하는 단계를 더 포함하는 것을 특징으로 하며,
상기 (b)단계는 (b2)단계와 (b3)단계 사이에 모니터링 항목의 단위 표준화를 위하여 평균값과 모니터링한 값의 차를 표준편차로 나누어 정규화된 값을 제공하는 단계를 더 포함하는 것을 특징으로 한다.
본 발명에 따른 데이터베이스 성능 모니터링 시스템은 데이터베이스 성능정보를 수집하기 위한 모듈을 구비한 데이터 베이스 또는 어플리케이션이 구동되는 하나 또는 둘 이상의 소스서버; 상기 소스서버로부터 수집된 시계열 데이터를 평균과 표준편차를 이용하여 데이터베이스 성능정보에 관한 패턴을 인식하고, 시구간별 동적 임계치를 산출하며, 모니터링 항목별 정규화를 통해 표준화된 모니터링 데이터를 산출함으로써 시계열 데이터에 대한 성능분석을 수행하기 위해, (a)모니터링 항목별 정상범위 구간 데이터와 임계치 데이터를 산출하는 단계 및 (b)상기 산출된 데이터를 이용하여 실시간으로 접근되는 데이터를 모니터링하는 단계를 포함하되, 상기 (a)단계는 (a1)지정된 구간의 성능 로깅 데이터를 추출하는 단계; (a2)평균과 표준편차를 산출하는 단계; (a3)모니터링 항목별 정상범위 구간 및 임계치 산출 단계; 및 (a4)데이터베이스에 저장하는 단계를 수행하는 일련의 절차를 포함하고, 상기 (b)단계는 (b1)실시간 데이터를 모니터링하는 단계; (b2)상기 (a3)단계에서 산출된 정상범위 구간 및 임계치를 데이터베이스로부터 추출하는 단계; (b3)실시간 데이터가 정상범위에 있는지를 판단한 후 정상범위인 경우 상기 (b1)단계에서부터 다시 수행하고, 정상범위를 벗어난 경우 다음 절차를 수행하도록 하는 단계; (b4)실시간 데이터가 미리 설정된 횟수만큼 반복적으로 정상범위를 이탈하는지 여부를 판단한 후 정상범위를 이탈하지 않은 경우 상기(b1)단계부터 절차를 다시 수행하고, 정상범위를 이탈한 경우는 다음 절차를 수행하도록 하는 단계; (b5)정상구간을 벗어났다는 경고에 관한 정보를 로깅한 후 데이터베이스에 저장하는 단계; 및 (b6)경고를 발생하는 단계를 수행하는 일련의 절차를 수행하는 분석서버; 및 주기적으로 분석 데이터에 대한 질의를 수행하고, 그에 대한 응답 및 경고를 수신하는 하나 또는 둘 이상의 클라이언트 단말기를 포함하는 것을 특징으로 한다.
또한, 상기 소스서버는 분석서버로부터 원격으로 구성되되, 성능정보 수집을 위한 모듈로서 별도의 응용프로그램 인터페이스(application programming interface)로 구현된 성능정보추출 및 센드 데몬(Send Demon)을 구비하고, 상기 분석서버는 성능정보를 수신하기 위한 리시브 데몬(Receive Demon)을 더 포함하는 것을 특징으로 하고,
상기 소스서버내 구비된 성능정보 수집을 위한 모듈은 데이터베이스 관리시스템(DBMS)의 메모리 구조를 직접 읽어들이는 직접 메모리 접근방식에 의해 데이터를 추출하는 방식에 의한 것을 특징으로 하며,
상기 소스서버내 구비된 성능정보 수집을 위한 모듈은 데이터 손실을 방지하기 위하여 운영체제(OS)상의 메시지 큐를 이용하여 데이터를 버퍼링함으로써 데이터를 송수신하는 것을 특징으로 하고,
상기 소스서버내 구비된 성능정보 수집을 위한 모듈은 데이터 손실을 방지하기 위하여 운영체제(OS)상의 파일(FILE) 로깅(logging) 방식을 이용하여 데이터를 저장하되, 별도의 데몬 프로세스에 의해 데이터를 수집하여 분석서버로 전송하는 것을 특징으로 한다.
또한, 상기 (a)단계에 있어서 각 단계는 데이터를 추출한 후 시간, 날짜, 요일별로 구분하여 패턴화하여 정상범위 구간과 임계치 산출 저장하는 단계를 수행하는 것을 특징으로 하고, (b)단계에 있어서도 시간, 날짜, 요일별 특성을 반영하여 실시간 데이터를 모니터링하는 일련의 절차를 수행하는 것을 특징으로 하고,
상기 (a)단계에서 데이터를 추출하는 단계는 다수의 원격서버에 구비된 데이터 송신모듈로부터 데이터가 송신되는 단계와 분석서버에 구비된 데이터 수신모듈을 통해 데이터를 수신하는 단계를 더 포함하는 것을 특징으로 하며,
상기 (b)단계는 (b2)단계와 (b3)단계 사이에 모니터링 항목의 단위 표준화를 위하여 평균값과 모니터링한 값의 차를 표준편차로 나누어 정규화된 값을 제공하는 단계를 더 포함하는 것을 특징으로 한다.
또한, 상기 분석서버는 성능분석 정보를 저장하는데 있어서 관계형 데이터베이스(relational database)를 사용하는 것을 특징으로 하는 데이터베이스 성능 모니터링 시스템.
A database performance monitoring method in accordance with the present invention comprises the steps of: collecting time series data; (A) Calculate normal range data and threshold data for each monitoring item in order to recognize the data pattern using the mean and standard deviation of time series data, and to calculate dynamic threshold values for each time period and provide standardized monitoring units for each monitoring item. And (b) monitoring data accessed in real time using the calculated data, wherein step (a) comprises: (a1) extracting performance logging data of a specified section; (a2) calculating the mean and standard deviation; (a3) calculating a normal range section and a threshold value for each monitoring item; And (a4) a series of procedures for performing a step of storing in a database, wherein step (b) comprises: (b1) monitoring real time data; (b2) extracting the normal range section and the threshold value calculated in step (a3) from a database; (b3) determining whether the real-time data is in the normal range, and then performing the process again from the step (b1) in the case of the normal range, and performing the following procedure if the real-time data is out of the normal range; (b4) If it is determined that the real-time data has repeatedly departed from the normal range by a predetermined number of times, the procedure is repeated from step (b1) above. To perform; (b5) logging the information regarding the warning that the user has left the normal section and storing the information in a database; And (b6) a time series data analysis step including a series of procedures for performing the step of generating a warning; And generating a response and an alert to the periodic query of the client.
In addition, the data collection step is characterized in that by the method of extracting data by a direct memory approach to directly read the memory structure of the database management system (DBMS),
The data collection step is characterized in that the data is transmitted and received by buffering the data using a message queue on the operating system (OS) to prevent data loss,
The data collection step stores data using a file logging method on an operating system (OS) in order to prevent data loss, but collects data by a separate daemon process and transmits the data to an analysis server. It is done.
Further, in the step (a), after extracting the data, each step is divided into patterns by time, date, and day, and patterned to store the normal range and the threshold value, and also in the step (b) It is characterized by performing a series of procedures for monitoring real-time data by reflecting the characteristics of time, date, and day of the week,
Extracting data in the step (a) further comprises the step of transmitting data from a data transmission module provided in a plurality of remote source server and receiving the data through the data receiving module provided in the analysis server. Features,
The step (b) further comprises the step of providing a normalized value by dividing the difference between the average value and the monitored value by the standard deviation for unit standardization of the monitoring item between the steps (b2) and (b3). do.
Database performance monitoring system according to the present invention comprises one or more source servers running a database or application having a module for collecting database performance information; The time series data collected from the source server is recognized using a mean and standard deviation to recognize a pattern regarding database performance information, a dynamic threshold value is calculated for each time period, and standardized monitoring data is calculated through normalization for each monitoring item. In order to perform the performance analysis for, (a) calculating the normal range data and threshold data for each monitoring item; and (b) monitoring the data accessed in real time using the calculated data, the Step (a) comprises the steps of (a1) extracting performance logging data of a specified section; (a2) calculating the mean and standard deviation; (a3) calculating a normal range section and a threshold value for each monitoring item; And (a4) a series of procedures for performing a step of storing in a database, wherein step (b) comprises: (b1) monitoring real time data; (b2) extracting the normal range section and the threshold value calculated in step (a3) from a database; (b3) determining whether the real-time data is in the normal range, and then performing the process again from the step (b1) in the case of the normal range, and performing the following procedure if the real-time data is out of the normal range; (b4) If it is determined that the real-time data has repeatedly departed from the normal range by a predetermined number of times, if the normal range is not departed, the procedure is repeated from step (b1) above. To perform; (b5) logging the information regarding the warning that the user has left the normal section and storing the information in a database; And (b6) an analysis server performing a series of procedures for performing a step of generating a warning; And one or more client terminals that periodically perform queries on the analysis data and receive responses and warnings therefrom.
In addition, the source server is configured remotely from the analysis server, as a module for collecting the performance information includes a performance information extraction and send daemon implemented in a separate application programming interface (Send Daemon), the analysis The server further comprises a receive daemon (Receive Daemon) for receiving the performance information,
The module for collecting performance information provided in the source server is characterized in that the data is extracted by a direct memory approach to directly read the memory structure of the database management system (DBMS),
The module for collecting performance information provided in the source server is characterized by transmitting and receiving data by buffering the data using a message queue on the operating system (OS) to prevent data loss,
The module for collecting performance information provided in the source server stores data using a file logging method on an operating system (OS) to prevent data loss, but collects data by a separate daemon process. Characterized in that the transmission to the analysis server.
Further, in the step (a), after extracting the data, each step is divided into patterns by time, date, and day, and patterned to store the normal range and the threshold value, and also in the step (b) It is characterized by performing a series of procedures for monitoring real-time data by reflecting the characteristics of time, date, and day of the week,
Extracting the data in the step (a) further comprises the step of transmitting data from the data transmission module provided in the plurality of remote servers and receiving the data through the data receiving module provided in the analysis server. ,
The step (b) further comprises the step of providing a normalized value by dividing the difference between the average value and the monitored value by the standard deviation for unit standardization of the monitoring item between the steps (b2) and (b3). do.
In addition, the analysis server database performance monitoring system, characterized in that for using the relational database (relational database) in storing the performance analysis information.
본 발명에 따른 데이터베이스 성능 모니터링 방법 및 시스템은 성능 데이터의 시계열적 패턴을 인식할 수 있고, 계절적 변동요인인 시간대, 월별, 요일별 데이터 성능 변화의 특성을 반영한 동적인 임계치를 제공하므로 평일, 유일, 결산기간, 정기 PM 등 다양한 요인에 의해 영향을 받는 시스템에 효과적인 감시 체계를 제공할 수 있다. 또한, 정규화를 통해 모니터링 항목의 단위 표준화를 제공함으로써 무수히 많은 모니터링 항목을 하나의 단위로 통일함으로써 복잡하고 다양한 항목을 표준화된 기준하에 감시할 수 있어 고도의 전문 엔지니어가 아니더라도 일정한 교육에 의해 누구나 손쉽고 빠르게 장애 사실을 모니터링할 수 있다는 장점이 있다.
Database performance monitoring method and system according to the present invention can recognize the time series pattern of performance data, and provides a dynamic threshold reflecting the characteristics of the data performance changes by time zone, month, day of the week, which is a seasonal variation, so that the weekday, only, settlement An effective monitoring system can be provided for systems affected by various factors, such as period and periodic PM. In addition, by providing unit standardization of monitoring items through normalization, countless monitoring items can be unified into one unit so that complex and diverse items can be monitored under standardized standards. The advantage is that the fault can be monitored.
도1은 본 발명에 따른 데이터베이스 성능 모니터링 시스템 개요도.
도2은 본 발명에 따른 데이터베이스 성능 모니터링 방법에 관한 블록도.
도3는 본 발명에 따른 시계열 데이터 분석 및 모니터링을 위한 일련의 절차를 도시한 블록도.
도4는 본 발명에 따른 일 실시예를 표시한 그래프.
도5a는 일 실시예에서 CPU 사용량의 시간대별 변화를 도시한 그래프.
도5b는 일 실시예에서 CPU 사용량의 일별 변화를 도시한 그래프.
도6는 본 발명에 따른 일 실시예의 동적 임계치를 통한 시간대별 모니터링을 도시한 그래프.
도7는 본 발명에 따른 일 실시예에서 모니터링 대상 정보의 발생 추이 및 표준화를 적용하여 임계치 초과여부를 조회하는 UI화면.1 is a schematic diagram of a database performance monitoring system according to the present invention;
2 is a block diagram of a database performance monitoring method in accordance with the present invention.
3 is a block diagram illustrating a series of procedures for analyzing and monitoring time series data in accordance with the present invention.
4 is a graph showing an embodiment according to the present invention;
FIG. 5A is a graph illustrating a time-phase change in CPU usage in one embodiment. FIG.
5B is a graph depicting daily changes in CPU usage in one embodiment.
Figure 6 is a graph illustrating time-phase monitoring through dynamic thresholds in one embodiment according to the present invention.
7 is a UI screen for inquiring whether the threshold is exceeded by applying the trend and standardization of the monitoring target information in one embodiment according to the present invention.
본 발명에 따른 데이터베이스 성능 모니터링 방법 및 시스템에 관한 구체적인 내용 및 실시예를 도면을 첨부하여 설명하면 다음과 같다.
Detailed descriptions and embodiments of a database performance monitoring method and system according to the present invention will be described with reference to the accompanying drawings.
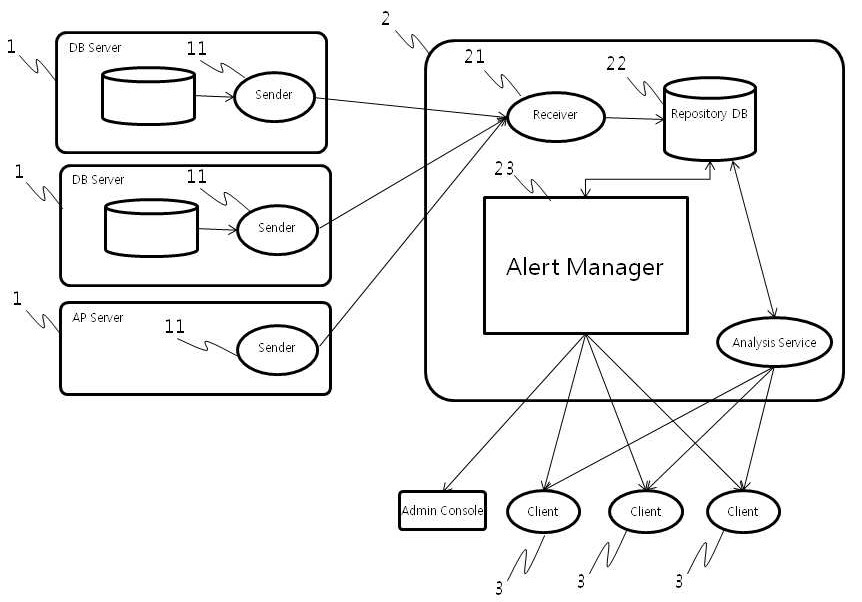
도1은 본 발명에 따른 데이터베이스 성능 모니터링 시스템의 아키텍쳐(Architecture)를 도시한 개요도이다. 도시된 바와 같이 본 시스템의 기본적 구조는 데이터베이스 성능정보를 수집하기 위한 모듈을 구비한 데이터 베이스 또는 어플리케이션이 구동되는 하나 또는 둘 이상의 소스서버(1)와 상기 소스서버로부터 수집된 시계열 데이터를 평균과 표준편차를 이용하여 데이터베이스 성능정보에 관한 패턴을 인식하고, 시구간별 동적 임계치를 산출하며, 모니터링 항목별 정규화를 통해 표준화된 모니터링 데이터를 산출함으로써 시계열 데이터에 대한 성능분석을 수행하는 분석서버(2) 및 주기적으로 분석 데이터에 대한 질의를 수행하고, 그에 대한 응답 및 경고를 수신하는 하나 또는 둘 이상의 클라이언트 단말기(3)를 포함하는 것을 특징으로 한다.
1 is a schematic diagram illustrating an architecture of a database performance monitoring system according to the present invention. As shown, the basic structure of the present system is to average and standardize one or
상기 소스서버(1)는 수집분석서버로부터 원격으로 구성되되, 성능정보 수집을 위한 모듈로서 별도의 응용프로그램 인터페이스(application programming interface)로 구현된 성능정보추출 및 센드 데몬(Send Demon)(11)을 구비하고, 상기 수집분석서버(2)는 성능정보를 수신하기 위한 리시브 데몬(Receive Demon)(21)을 더 포함할 수 있다.
The
또한, 상기 소소서버내 구비된 성능정보 수집을 위한 모듈은 데이터베이스 관리시스템(DBMS)의 메모리 구조를 직접 읽어들이는 직접 메모리 접근방식에 의해 데이터를 추출하는 방식에 의해 구현할 수 있다.
In addition, the module for collecting performance information provided in the source server may be implemented by extracting data by a direct memory approach that directly reads the memory structure of a database management system (DBMS).
상기 소소서버(1)내 구비된 성능정보 수집을 위한 모듈은 데이터 손실을 방지하기 위하여 운영체제(OS)상의 메시지 큐를 이용하여 데이터를 버퍼링함으로써 데이터를 송수신하는 방법과 데이터 손실을 방지하기 위하여 운영체제(OS)상의 파일(FILE) 로깅(logging) 방식을 이용하여 데이터를 저장하되, 별도의 데몬 프로세스에 의해 데이터를 수집하여 분석서버(2)로 전송하는 방법을 이용할 수 있다.
The module for collecting performance information included in the
상기 분석서버(2)는 시계열 데이터 분석을 위하여, (a)모니터링 항목별 정상범위 구간 데이터와 임계치 데이터를 산출하는 단계 및 (b)상기 산출된 데이터를 이용하여 실시간으로 접근되는 데이터를 모니터링하는 단계를 포함하되, 상기 (a)단계는 (a1)지정된 구간의 성능 로깅 데이터를 추출하는 단계; (a2)평균과 표준편차를 산출하는 단계; (a3)모니터링 항목별 정상범위 구간 및 임계치 산출 단계; 및 (a4)데이터베이스에 저장하는 단계를 수행하는 일련의 절차를 포함하고, 상기 (b)단계는 (b1)실시간 데이터를 모니터링하는 단계; (b2)상기 (a3)단계에서 산출된 정상범위 구간 및 임계치를 데이터베이스로부터 추출하는 단계; (b3)실시간 데이터가 정상범위에 있는지를 판단한 후 정상범위인 경우 상기 (b1)단계에서부터 다시 수행하고, 정상범위를 벗어난 경우 다음 절차를 수행하도록 하는 단계; (b4)실시간 데이터가 미리 설정된 횟수만큼 반복적으로 정상범위를 이탈하는지 여부를 판단한 후 정상범위를 이탈하지 않은 경우 상기(b1)단계부터 절차를 다시 수행하고, 정상범위를 이탈한 경우는 다음 절차를 수행하도록 하는 단계; (b5)정상구간을 벗어났다는 경고에 관한 정보를 로깅한 후 데이터베이스에 저장하는 단계; 및 (b6)경고를 발생하는 단계를 수행하는 일련의 절차를 수행하는 것을 특징으로 한다.
The
상기 (a)단계에 있어서 각 단계는 데이터를 추출한 후 시간, 날짜, 요일별로 구분하여 패턴화하여 정상범위 구간과 임계치 산출 저장하는 단계를 수행하는 것을 특징으로 하고, (b)단계에 있어서도 시간, 날짜, 요일별 특성을 반영하여 실시간 데이터를 모니터링 하는 일련의 절차를 수행할 수 있다.
In the step (a), after extracting the data, the step is performed to store the normal range and the threshold value by patterning by dividing the pattern by time, date, and day of the week.In the step (b), A series of procedures can be performed to monitor real-time data, reflecting the characteristics of each day and day.
또한, 상기 (a)단계에서 데이터를 추출하는 단계는 다수의 원격서버에 구비된 데이터 송신모듈로부터 데이터가 송신되는 단계와 분석서버에 구비된 데이터 수신모듈을 통해 데이터를 수신하는 단계를 더 포함할 수 있다.
In addition, the step of extracting data in the step (a) further comprises the step of transmitting data from the data transmission module provided in the plurality of remote servers and the step of receiving data through the data receiving module provided in the analysis server; Can be.
상기 (b)단계는 (b2)단계와 (b3)단계 사이에 모니터링 항목의 단위 표준화를 위하여 평균값과 모니터링한 값의 차를 표준편차로 나누어 정규화된 값을 제공하는 단계를 더 포함할 수 있다.
Step (b) may further include providing a normalized value by dividing the difference between the average value and the monitored value by the standard deviation for unit standardization of the monitoring item between steps (b2) and (b3).
또한, 상기 분석서버(2)는 성능분석 정보를 저장하는데 있어서 관계형 데이터베이스(relational database)를 사용하는 것을 특징으로 할 수 있다.
In addition, the
이하, 본 발명에 따른 시스템 아키텍쳐에 관하여 보다 구체적으로 설명하면 하기와 같다.
Hereinafter, the system architecture according to the present invention will be described in more detail.
OS/DB 성능정보 추출모듈은 OS 상에서 성능 저하 및 장애가 발생하는 경우 나타나는 증상에 대하여 모니터링 할 수 있는 항목을 선정하고 주기적으로 관련 데이터를 추출하여 Send 데몬에게 제공한다. 이때 OS 정보의 경우 CPU, Memory, Disk 사용량 등의 리소스(Resource) 사용량을 주기적으로 추출하여 로깅하고, DB 정보의 경우 DBMS 엔진을 OS상에서 메모리를 직접 액세스하여 성능정보를 추출한다.
The OS / DB performance information extraction module selects items to be monitored for symptoms of performance degradation and failures in the OS, and periodically extracts relevant data and provides it to the Send daemon. At this time, in case of OS information, resource usage such as CPU, Memory, Disk usage is periodically extracted and logged, and in case of DB information, DBMS engine directly accesses memory in OS to extract performance information.
성능정보 추출모듈은 데몬 프로그램으로 구현될 수 있는데, 본 발명에서는 이하 센드데몬(Send Demon)(11)이라 한다. 센드데몬은 OS의 성능 정보를 추출하기 위해서는 직접 명령(Command)을 하는 것이 아니라 별도의 응용프로그램 인터페이스(API)를 통해 관련정보를 추출하며, 이러한 수집 기술은 대형 서버의 성능에 영향을 미치지 않도록 고안되어 개발된 데몬에 의해 실행된다. 특히, 데이터를 수신하는 서버에 문제가 발생하거나 기타 예상하지 못한 이유로 데이터 송수신에 문제가 발생할 가능성이 있으므로 수집된 데이터가 일정 사이즈 이상 증가하면, OS에 별도의 파일(File) 형태로 수집 데이터를 저장하고, 송수신관련 문제가 해결된 다음 자동으로 파일로 저장된 데이터를 다시 송신할 수 있는 장애 극복 알고리즘이 내장할 수 있다.
The performance information extraction module may be implemented as a daemon program. Hereinafter, the present invention is referred to as a
분석서버(2)내에 구비된 리시브 데몬(Recive Demon)(21)은 상기 센드데몬(11)으로부터 송신된 데이터를 수신하고 수신된 데이터를 분석용 DB(22)에 저장한다. 수신된 데이터에 대한 성능 진단을 수행하여 성능 문제가 있는 지를 검사하고 확인한다. 수신된 데이터를 분석하여 성능상의 문제점이 발견되면 수집 서버의 관계형 데이터베이스(RDB) 내의 별도 테이블에 경고 메시지를 저장함으로써 해당 서버의 성능 문제 발생 사실을 확인할 수 있다.
A receive
분석서버(2)는 관계형 데이터베이스(RDB)를 활용하여 시계열 데이터를 분석하게되는데, 소스 서버로부터 수신된 데이터는 RDB 테이블에 저장된다. 예를들어 1분마다 수신되어 저장된 데이터는 지정된 주기마다 일괄프로그램(BATCH Program)에 의해 분석데이터를 생성하는데 활용된다. 관계형 데이터베이스(RDB)를 사용하는 이유는 파일형태의 데이터 활용에 따른 성능 문제를 극복하기 위해서이며, 다양한 데이터 질의 방식(SQL)을 통해 원하는 분석 데이터를 쉽게 생성하고 활용할 수 있기 때문이다. 분석 데이터를 생성하기 위해서는 별도의 일괄프로그램(BATCH program)이 필요하며, 이 때 과거 특정시점 이후의 데이터를 분석하여 평균, 표준편차를 생성하고, 각 모니터링 항목에 대한 표준화 작업이 이루어진다. 분석 항목별 평균과 표준편차 및 정규화 작업을 통해 기준 데이터를 생성하고 모니터링에 활용한다. 상기 일련의 프로세스를 제어하는 도1에서 도시된 경보관리자(Alert Manager)(23)는 별도의 물리적 장치는 물론 어플리케이션 또는 데몬형태의 프로그램 등 다양한 형태로 구현될 수 있다.
The
클라이언트 단말기(3)은 수집서버의 RDB에 저장된 모니터링 데이터 및 분석 데이터를 주기적으로 질의 하여 현재 모니터링 대상 서버에 성능 이슈가 발생했는지를 확인하고 경보(Alert)를 해주는 응용프로그램이 인스톨되어 있다. 지정된 주기마다 모니터링 대상 서버의 성능 정보를 확인하고 해당 서버의 모든 성능 정보를 손쉽게 확인할 수 있도록 별도 UI 화면(통합관제 화면)을 통해 모니터링이 가능하다.
The
본 발명에 있어서 종래의 기술과 차별화되는 특징 중의 하나인 데이터 추출방법에 대해 보다 구체적으로 설명하면 하기와 같다.
In the present invention, the data extraction method, which is one of the characteristics that are differentiated from the prior art, will be described in more detail.
본 발명에 따른 데이터 추출방법의 특징은 신속한 장애 감지를 위한 데이터베이스 관리 시스템(DBMS) 엔진에서 데이터를 직접 읽어들이는 방식에 있다.A feature of the data extraction method according to the present invention lies in a method of directly reading data from a database management system (DBMS) engine for rapid failure detection.
2-Tier (클라이언트 서버시스템) 구조의 데이터 수집 방식을 활용하는 제품의 경우 DB에 성능 문제가 발생하면 성능데이터의 수집이 불가능한 단점을 가지고 있다. 이러한 단점을 극복하기 위하여 OS 메모리상에서의 DBMS 엔진의 메모리 구조를 직접 READ하여 읽어냄으로써 DB에 성능 문제가 발생되더라도 문제점이 무엇인지 모니터링 할 수 있는 3-Tier 방식의 구조로 모니터링한다.In the case of the product using the data collection method of 2-Tier (client server system) structure, if there is a performance problem in the DB, performance data cannot be collected. In order to overcome this drawback, the memory structure of the DBMS engine is directly read and read in the OS memory to monitor the 3-tier structure to monitor what the problem is even if a performance problem occurs in the DB.
이러한 3-Tier 방식의 메모리 직접접근방식(DMA, Drect Memory Access)를 통하지 않고서는 진정한 의미에서의 장애 사전감지가 불가능하다. 즉, 고객사 DB에 문제가 발생하더라도 모니터링 프로그램은 영향을 받지 않아야 한다는 전제하에서 장애 사전감지 기술이 완성되는 것이므로 기존의 모니터링 솔루션들과는 차별화되는 장애 사전감지 기술이라고 할 수 있다.Without this 3-Tier Drect Memory Access (DMA) approach, fault detection in the true sense is impossible. In other words, failure detection technology is completed under the premise that the monitoring program should not be affected even if a problem occurs in the customer DB, so it can be said to be a failure detection technology that is differentiated from existing monitoring solutions.
상기 DMA 방식이란 성능성보를 모니터링 하기 위하여 대상 DBMS에 접속한 후 성능 데이터를 추출하는 방식이 아니고, OS상에서 보이는 DBMS엔진을 직접 READ한 후 메모리 구조를 분석하여 성능 정보를 읽어내는 기술로서, DBMS에 접속하지 않으므로, 해당 DB에 성능 문제가 있더라도 모니터링이 가능한 기술이다.
The DMA method is not a method of extracting performance data after accessing a target DBMS in order to monitor the performance report, but directly reading the DBMS engine seen on the OS and analyzing the memory structure to read performance information. Because it does not connect, it is a technology that can be monitored even if there is a performance problem in the DB.
본 발명은 메시지 큐 방식 및 FILE 로깅 구조 활용을 통하여 수집 데이터의 손실 방지할 수 있는 솔루션을 제공하는 바, 송수신 대상 서버의 성능 문제 또는 기타 시스템의 네트워크 문제로 인하여 데이터 송수신에 문제가 발생할 수 있는데, 이러한 경우 데이터의 유실이 발생할 수 있으므로, 아래와 같은 방식으로 데이터 유실을 방지 한다.
The present invention provides a solution to prevent the loss of collected data through the use of the message queue method and the FILE logging structure, which may cause a problem in data transmission and reception due to performance problems of the transmission and reception target server or network problems of other systems. In this case, data loss may occur, so data loss is prevented in the following manner.
첫째, 데이터 송수신을 위해 OS상의 메시지 큐에 데이터를 저장하여 송수신함으로써 데이터의 정합성(integrity)을 확보할 수 있다. 데이터 송수신에 문제가 발생할 경우 메시지 큐에 FULL이 발생할 수 있으므로 이때 추가적으로 발생하는 메시지 데이터를 메모리에 저장한다(버퍼링, DEFAULT: 30분).
First, data integrity may be secured by storing and transmitting data in a message queue on the OS for data transmission and reception. If there is a problem in sending or receiving data, FULL may occur in the message queue. Therefore, the additional message data is stored in memory (buffering, DEFAULT: 30 minutes).
둘째, 파일 로깅 구조를 통한 수집 데이터의 손실 방지할 수 있는데, 일정 시간 이상 문제가 해결되지 않을 경우는 추가적으로 발생하는 데이터는 OS상에 파일로 저장을 한다. OS 상에 파일로 저장된 메시지는 문제가 해결될 때까지 지속적으로 관리되며, 향후 송수신 문제가 해결된 후에 별도 데몬 프로세스에 의해 수집 서버에 전송됨으로써 데이터의 정합성이 확보되고 손실을 방지할 수 있다.
Second, it is possible to prevent the loss of collected data through the file logging structure. If the problem is not solved for a certain time, additional data is stored as a file on the OS. Messages stored as files on the OS are continuously managed until the problem is resolved. Data is transmitted to a collection server by a separate daemon process after the transmission / reception problem is solved in the future, thereby ensuring data consistency and preventing loss.
도2는 본 발명의 핵심기술이라 할 수 있는 시계열 데이터를 분석하기 위한 모니터링 방법을 블록도로 도시한 것이다.
2 is a block diagram illustrating a monitoring method for analyzing time series data, which may be a core technology of the present invention.
본 발명에 따른 데이터베이스 성능 모니터링 방법은 크게 시계열 데이터를 수집하는 단계(S1)와 시계열 데이터를 평균과 표준편차를 이용하여 데이터 패턴을 인식하되, 시구간별 동적 임계치를 산출하고 모니터링 항목별로 표준화된 모니터링 단위를 제공하는 시계열 데이터 분석단계(S2) 및 클라이언트의 주기적 질의에 대한 응답 및 경고를 발생하는 단계(S3)를 포함하는 것을 특징으로 한다.
In the database performance monitoring method according to the present invention, a step (S1) of collecting time series data and recognizing data patterns using the mean and standard deviation of time series data are calculated, a dynamic threshold for each time period is calculated, and a standardized monitoring unit for each monitoring item. It characterized in that it comprises a time series data analysis step (S2) for providing a and the step (S3) for generating a response and alert to the periodic query of the client.
상술한 바와 같이 상기 데이터 수집단계(S1)는 데이터베이스 관리시스템(DBMS)의 메모리 구조를 직접 읽어들이는 직접 메모리 접근방식에 의해 데이터를 추출하는 방식(S11)에 의할 수 있고, 데이터 손실을 방지하기 위하여 운영체제(OS)상의 메시지 큐를 이용하여 데이터를 버퍼링함(S12)으로써 데이터를 송수신하거나, 운영체제(OS)상의 파일(File) 로깅(logging) 방식(S13)을 이용하여 데이터를 저장하되, 별도의 데몬 프로세스에 의해 데이터를 수집하여 분석서버에 전송할 수 있다.As described above, the data collection step S1 may be based on a method S11 of extracting data by a direct memory approach that directly reads a memory structure of a database management system DBMS, and prevents data loss. In order to buffer the data using a message queue on the operating system (OS) in order to send and receive data, or to store data using a file logging method (S13) on the operating system (OS), Data can be collected by a separate daemon process and sent to the analysis server.
상기 시계열 데이터 분석을 위한 일련단계는 도3에서 도시된 바와 같이 (a)모니터링 항목별 정상범위 구간 데이터와 임계치 데이터를 산출하는 단계(S100) 및 (b)상기 산출된 데이터를 이용하여 실시간으로 접근되는 데이터를 모니터링하는 단계(S200)를 포함하되, 상기 (a)단계는 (a1)지정된 구간의 성능 로깅 데이터를 추출하는 단계(S110)와 (a2)평균과 표준편차를 산출하는 단계(S120)와 (a3)모니터링 항목별 정상범위 구간 및 임계치 산출 단계(S130) 및 (a4)데이터베이스에 저장하는 단계(S140)를 수행하는 일련의 절차를 포함하고, 상기 (b)단계는 (b1)실시간 데이터를 모니터링하는 단계(S210)와 (b2)상기 (a3)단계에서 산출된 정상범위 구간 및 임계치를 데이터베이스로부터 추출하는 단계(S220)와 (b3)실시간 데이터가 정상범위에 있는지를 판단한 후 정상범위인 경우 상기 (b1)단계에서부터 다시 수행하고, 정상범위를 벗어난 경우 다음 절차를 수행하도록 하는 단계(S230)와 (b4)실시간 데이터가 미리 설정된 횟수만큼 반복적으로 정상범위를 이탈하는지 여부를 판단한 후 정상범위를 이탈하지 않은 경우 상기(b1)단계부터 절차를 다시 수행하고, 정상범위를 이탈한 경우는 다음 절차를 수행하도록 하는 단계(S240)와 (b5)정상구간을 벗어났다는 경고에 관한 정보를 로깅(S250)한 후 데이터베이스에 저장(S251)하는 단계 및 (b6)경고를 발생하는 단계(S260)를 수행하는 일련의 절차를 포함하는 것을 특징한다. 필요에 따라 (a)단계에서는 극한치의 데이터를 보정하는 절차(S111) 부가할 수 있다.
As shown in FIG. 3, the serial steps for analyzing the time series data include (a) calculating normal range data and threshold data for each monitoring item (S100) and (b) accessing in real time using the calculated data. Monitoring (S200) is a data, wherein the step (a) is (a1) extracting the performance logging data of the specified section (S110) and (a2) calculating the average and standard deviation (S120) And (a3) a normal range section and threshold calculation step (S130) for each monitoring item and a series of procedures for performing (S4) storing in a database (S140), wherein step (b) includes (b1) real-time data. (S210) and (b2) extracting the normal range section and the threshold value calculated in the step (a3) from the database (S220) and (b3) determining whether the real-time data is in the normal range and then the normal range. If award After performing step (b1) again, and if it is out of the normal range step (S230) and (b4) to determine whether or not the real-time data is repeatedly out of the normal range by a predetermined number of times after the normal range is determined If it did not deviate from the step (b1) above, and if the deviation from the normal range to perform the next step (S240) and (b5) logging information about the warning that the deviation is out of the normal section ( S250), and then storing the data in a database (S251) and (b6) generating a warning (S260). If necessary, in step (a), a procedure (S111) of correcting extreme data may be added.
또한, 상기 (a)단계에 있어서 각 단계는 데이터를 추출한 후 시간, 날짜, 요일별로 구분하여 패턴화하여 정상범위 구간과 임계치 산출 저장하는 단계를 수행하는 것을 특징으로 하고, (b)단계에 있어서도 시간, 날짜, 요일별 특성을 반영하여 실시간 데이터를 모니터링 하는 일련의 절차를 수행할 수 있다.
Further, in the step (a), after extracting the data, each step is divided into patterns by time, date, and day, and patterned to store the normal range and the threshold value, and also in the step (b) A set of procedures can be performed to monitor real-time data that reflects time, date, and day of the week characteristics.
소스서버와 분석서버가 원격으로 분리된 시스템에서의 절치를 위하여 상기 (a)단계에서 데이터를 추출하는 단계는 다수의 원격 소스서버에 구비된 데이터 송신모듈로부터 데이터가 송신되는 단계와 분석서버에 구비된 데이터 수신모듈을 통해 데이터를 수신하는 단계를 더 포함할 수 있다.
Extracting data in step (a) is performed in a step of transmitting data from a data transmission module provided in a plurality of remote source servers and an analysis server in order to perform a procedure in a system in which the source server and the analysis server are remotely separated. The method may further include receiving data through the data receiving module.
상기 (b)단계는 (b2)단계와 (b3)단계 사이에 모니터링 항목의 단위 표준화를 위하여 평균값과 모니터링한 값의 차를 표준편차로 나누어 정규화된 값을 제공하는 단계를 더 포함할 수 있다.
Step (b) may further include providing a normalized value by dividing the difference between the average value and the monitored value by the standard deviation for unit standardization of the monitoring item between steps (b2) and (b3).
이하 시계열 분석을 통한 장애감지 방법에 대한 상세한 내용을 설명한다.
Hereinafter, the details of the failure detection method through time series analysis will be described.
고객사 시스템의 장애 또는 성능 이슈가 발생하는 패턴을 보면 모니터링 데이터가 기존과는 다른 패턴의 양상을 보이며, 이러한 패턴이 일정 시간 지속된 후에 어플리케이션(Application) 사용자에 의해 성능저하가 감지되거나 모니터링 솔루션에 의해 감지가 된다.In the pattern of failure or performance issue of the customer's system, the monitoring data shows a different pattern from the existing ones, and after such pattern persists for a certain time, the performance degradation is detected by the application user or the monitoring solution It is detected.
이때, 사용자 또는 모니터링 솔루션에 의해 감지가 된다는 것은 이미 장애 상황이 일정기간 지속이 된 이후라는 점에 주목해야 한다. 따라서, 장애 상황이 이미 진행된 이후가 아닌 장애 발생 즉시 감지하기 위해서는 아래와 같은 3가지 조건이 충족되어야 한다.
It should be noted that the detection by the user or the monitoring solution is already after a period of failure. Therefore, the following three conditions must be met in order to detect a failure immediately after the failure situation has not already occurred.
가. 성능 데이터의 패턴 인식기술.end. Pattern recognition technology for performance data.
나. 시간대별, 월별, 요일별 동적 임계치 생성 및 활용.I. Dynamic threshold generation and utilization over time, month and day of the week.
다. 모니터링 항목의 단위 표준화.
All. Unit standardization of monitoring items.
우선 패턴인식과 관련하여, 성능 데이터의 패턴 인식 기술은 모니터링 대상 항목들이 이상 현상을 보인다는 사실을 시스템적으로 계산하여 인식하기 위해서는 아래와 같이 평균과 표준편차(시그마)를 활용한다. (평균 : 모니터링 대상 항목들의 일정구간에서의 평균을 의미, 표준편차(시그마) : 모니터링 대상 데이터가 평균으로부터 얼마나 떨어져 있는지를 나타내는 산포도를 도수로 표현한 값)
First, in relation to pattern recognition, the pattern recognition technology of performance data utilizes the mean and standard deviation (sigma) as follows to systematically calculate and recognize the fact that the monitored items are abnormal. (Average: Mean average over a certain period of items to be monitored, Standard deviation (Sigma): Scatter plot that shows how far the monitored data is from average)
시그마 활용법의 예로서 이하 3시그마를 기준으로 설명한다.As an example of the sigma utilization method will be described based on the three sigma.
◆ 1시그마 : 평균 ± 1 * 표준편차 → 68.3%◆ 1 sigma: mean ± 1 * standard deviation → 68.3%
즉, 전체 데이터의 68.3%가 평균 ± 1 * 표준편차의 범위내에 포함된다는 의미,In other words, 68.3% of the total data falls within the mean ± 1 * standard deviation,
◆ 2시그마 : 평균 ± 2 * 표준편차 → 95.3% ◆ 2 sigma: mean ± 2 * standard deviation → 95.3%
전체 데이터의 95.3%가 평균 ± 2 * 표준편차의 범위내에 포함된다는 의미,95.3% of the total data falls within the mean ± 2 * standard deviation,
◆ 3시그마 : 평균 ± 3 * 표준편차 → 97.3%◆ 3 sigma: mean ± 3 * standard deviation → 97.3%
전체 데이터의 97.3%가 평균 ± 3* 표준편차의 범위내에 포함된다는 의미,
97.3% of the total data falls within the mean ± 3 * standard deviation,
즉, 모니터링 된 값이 상기 3시그마의 범위를 벗어나는 경우 비정상적인 값으로 볼 수 있다. 사용자에 따라 시그마의 수준(1시그마 내지 6시그마) 사이에서 적절한 모니터링 수준을 조절할 수 있다.
That is, when the monitored value is out of the range of the three sigma, it may be regarded as an abnormal value. Depending on the user, an appropriate monitoring level can be adjusted between levels of sigma (1 sigma to 6 sigma).
비정상 여부의 감지방법은 모니터링 데이터가 지정된 시그마 범위를 벗어난 경우 일시적인 현상일 수 있으므로, 지정된 횟수 이상 연속을 벗어난 경우를 장애로 감지한다. 특정시간대에 반복적으로 실행되는 일괄(BATCH)작업의 경우 부하를 유발할 수 있으나, 이러한 경우 장애로 간주하지 않는 경우가 있으므로 반복적으로 발생하는 패턴을 인식할 수 있어야 한다. 이러한 경우를 감지하기 위하여 모니터링 데이터의 저장시 1분간 발행한 성능 데이터의 평균 값 외에 1분간 발생한 성능 데이터의 최대값도 저장하여 활용한다.
The abnormal detection method may be a temporary phenomenon when the monitoring data is out of a specified sigma range, and thus detects a failure when the monitoring data is out of a specified number of consecutive times. In the case of a batch job that is repeatedly executed at a specific time, it may cause a load, but in such a case, it may not be regarded as a failure, so it is necessary to recognize a pattern that occurs repeatedly. In order to detect such a case, the maximum value of performance data generated for 1 minute is stored and used in addition to the average value of performance data issued for 1 minute during storage of monitoring data.
장애감지를 위한 모니터링 데이터의 저장방법의 예는 다음과 같다. 서버 및 DB의 성능 데이터를 1초에 1회에서 100회까지 폴링(수집)이 가능하며, 지정된 횟수만큼 폴링한다. 수집된 데이터는 1분에 한 번 수집분석서버의 관계형 데이터베이스(RDB)에 저장되며 1분간 수집된 데이터의 평균값과 최대값을 저장한다. 평균값과 표준편차는 비정상적 패턴을 인식하기 위해 사용되며, 최대값은 비정상적인 패턴이 반복적으로 발생하는지 여부를 인식하기 위해 사용된다.
An example of how to store monitoring data for fault detection is as follows. It is possible to poll (gather) the performance data of server and DB from 1 to 100 times per second, and poll the designated number of times. Collected data is stored in the relational database (RDB) of the collection analysis server once a minute and stores the average value and the maximum value of the collected data for 1 minute. The mean and standard deviation are used to recognize an abnormal pattern, and the maximum value is used to recognize whether an abnormal pattern occurs repeatedly.
도4는 평균과 표준편차를 활용한 임계치를 생성하는데 있어서 "평균+2*표준편차"를 이용한 이상발생 감지의 실시예를 도시한 도면이다. 일부 데이터를 제외한 대부분의 성능관련 데이터들은 평균값을 중심으로 정규분포를 이루고 있으므로, 평균과 어느 정도 떨어져 있는지를 알 수 있는 표준편차를 이용하여 다이나믹(Dynamic)한 임계치를 도출할 수 있다.
4 is a diagram illustrating an example of anomaly detection using “mean + 2 * standard deviation” in generating a threshold utilizing average and standard deviation. Most of the performance-related data, except for some data, are normally distributed around the mean, so that the dynamic threshold can be derived using the standard deviation, which shows how far it is from the mean.
동적 임계치 생성 및 활용과 관련하여, 기존 모니터링 솔루션들은 사용자가 정의한 임계치를 초과했는지 여부를 체크하여 장애 사실을 감지하고 경보(Alerting)를 제공한다. 이러한 경우 시스템이나 DB의 다양한 시간대별, 요일별, 월별 특성을 반영하지 못해 실질적인 모니터링이 이루어지지 못하고 있다. 따라서, 본 발명은 요일별,월별 특성을 반영한 시간대별 임계치를 생성하여 저장함으로써 모니터링된 데이터가 정상인지 여부를 판단하는데 활용함으로서 실질적인 모니터링 효과를 기대할 수 있다.
With regard to dynamic threshold generation and utilization, existing monitoring solutions detect whether a threshold has been exceeded by a user-defined threshold to detect failures and provide alerting. In this case, actual monitoring cannot be achieved because it does not reflect various time zones, days, and monthly characteristics of the system or DB. Accordingly, the present invention can expect a substantial monitoring effect by generating and storing threshold values for each time zone reflecting the characteristics of the day of the week and the month, to determine whether the monitored data is normal.
시간대별 동적 임계치를 생성하는 예는 다음과 같다. 지정된 기간 (Default:30일) 동안의 시간대별 평균과 표준편차, 최대값과 최대값의 표준편차를 구하여 저장하고, 지정된 기간 동안에 발생한 이상 값(극단치)은 장애상황으로 간주하여 통계 데이터 생성 시 제외하며, 전일자 기준으로 시간대별 임계치 데이터를 미리 생성함으로써 실시간으로 성능 저하 및 장애를 판단한다.
An example of generating a time-phase dynamic threshold is as follows. Obtains and saves the mean, standard deviation, and standard deviation of the maximum and maximum values for each time period during the specified period (Default: 30 days). Except, the performance degradation and failures are determined in real time by generating the threshold data for each time zone based on the previous day.
현재 대다수의 성능관리 솔루션 및 통합 모니터링 솔루션은 사전에 정의된 임계치를 통해 문제 발생 사실을 감지하고 경보(Alerting) 하는 구조로 되어 있다. 그러나 고객사의 시스템 성능은 평일과 휴일, 결산 기간, 정기 PM등 다양한 요인에 의해 영향을 받고 있으며, 시간대별로도 다른 형태의 성능 패턴을 보이고 있다. 따라서 획일적인 임계치로는 정확한 성능 저하 또는 장애를 감지하는데 한계가 있다.
Most performance management solutions and integrated monitoring solutions now have a structure that detects and alerts to problems through predefined thresholds. However, the performance of the customer's system is affected by various factors such as weekdays, holidays, settlement periods, and regular PMs, and shows different performance patterns for each time zone. Therefore, the uniform threshold is limited in detecting the exact degradation or failure.
도5a는 시간대별 CPU 사용량 추이를 도시한 예이고, 도5b는 일별사용량 추이를 도시한 예이다. 도시된 바와 같이 시간대별로 다른 추이를 보이고 있으므로 시간대별로 차별화된 임계치가 필요하며 월말로 갈수록 CPU 사용량이 증가하고 있으므로 고객사의 특성에 맞는 일자별 또는 요일별 다른 임계치가 필요하다.
5A illustrates an example of a CPU usage trend by time zone, and FIG. 5B illustrates an example of daily usage trend. As shown in the figure, different time zones show different trends, so different thresholds are needed for each time zone. As CPU usage increases toward the end of the month, different thresholds for each day or day are needed.
성능관련 시계열 데이터의 4가지 요소로는 ① CPU, 리소스 사용량의 지속적인 증가/하락을 반영하는 장기적 추세, ② 결산작업 등 요일별, 월별, 분기별 일정한 주기로 반복되는 변동에 의한 계절적 변동, ③ 리오그/통계정보 생성 등 어느정도 주기를 가지고 상승/하락을 반복하는 순환변동, 그리고 ④ 비정상적인 리소스 사용량 증가 등 예측이 어려운 이슈/장애 발생 등 즉각적인 장애 감지 대상이 되는 불규칙 변동을 들 수 있다. 이 중 평균과 표준편차를 이용한 임계치를 활용할 경우 시계열 데이터의 4가지 요소 중 특히 ③ 계절적 변동(시간대별, 날짜별, 요일별 변동)에 의한 영향을 반영하지 않을 경우 정확성을 확보하기 어려우므로 계절적 변동 요인을 임계치 생성시 반영하여야 한다.
The four elements of performance-related time series data are: ① long-term trends that reflect a continuous increase / decrease in CPU and resource usage, ② seasonal changes due to recurring fluctuations of the day, month, quarter, etc. Cyclical fluctuations, such as generating statistical information, with repeated cycles of rising and falling, and irregular fluctuations that are the target of immediate failure detection, such as unforeseen issues / failures such as abnormal resource usage. Of these, when the threshold using the mean and standard deviation is used, it is difficult to secure accuracy unless it reflects the effects of seasonal variation (variation by time zone, date, and day of the week) among the four elements of time series data. Should be reflected in the threshold generation.
시간대별 변동의 특성은 오전, 오후 업무 시간대는 다른 시간대에 비해 리소스 사용률이 높으며 새벽 시간대에는 사용률이 낮은 편을 보인다. 날짜별 변동의 특성은 월말로 갈 수 록 결산 등의 이유로 사용량이 증가함에 따라 리소스 사용률도 증가하는 패턴을 보인다. 요일별 변동의 특성은 매주 월요일은 다른 평일보다 출근 직후인 08시~10시 사이에 높은 리소스 사용률을 보이는 경우가 있으며, 공휴일은 평일보다 급격히 낮은 사용률을 보인다. 이러한 점을 고려하여 시간대별 동적임계치를 산출하는데 있어서, 최근 N일간의 시간대별 평균과 표준편차를 산출한 후 휴일 가중치(휴일인 경우 '-' 가중치), 요일별 가중치(월요일인 경우 '+' 가중치), 일자별 가중치(결산기간인 경우 '+' 가중치)를 가감할 수 있을 것이다. 상기 가중치 데이터의 산출은 각 고객사의 실 데이터를 기준으로 산출하는 것이 바람직하다. 도6은 동적 임계치를 통한 시간대별 모니터링의 실시예를 그래프로 도시한 것이다.
The characteristics of time-phased fluctuations are high in resource usage in the morning and afternoon business hours, and low in the morning hours. The characteristics of the change by date show a pattern of increasing resource usage as the usage increases due to settlement at the end of the month. Due to the change in the days of the week, there is a case where the resource usage rate is high from 08:00 to 10 o'clock every Monday on the day of work, and on holiday, the usage rate is lower than the weekday. In consideration of this, in calculating the time-based dynamic threshold, the average weight and standard deviation of the last N days are calculated, followed by the holiday weight ('-' weight for the holiday) and the weight for each day ('+' weight for the Monday). ), The weight by date (or '+' weight in case of settlement period) can be added or subtracted. The weight data may be calculated based on actual data of each client company. 6 graphically illustrates an embodiment of time-phase monitoring via a dynamic threshold.
모니터링 항목의 단위 표준화와 관련하여, 서버 및 DB의 모니터링 항목을 수백가지에 이른다. 이러한 모니터링 항목들은 모두 단위가 각각 다르며, 데이터의 수치도 각기 다른 범위를 가지고 있다. 이러한 수많은 항목들에 대하여 단위 및 데이터의 발생 범위나 분포를 기억하고 모니터링 하는 것 현실적으로 불가능하며, 이러한 사유로 인하여 효과적인 모니터링이 이루어지지 못하고 있다. Regarding unit standardization of monitoring items, there are hundreds of monitoring items of server and DB. All of these monitoring items are in different units, and the data values have different ranges. It is practically impossible to memorize and monitor the generation range or distribution of units and data for such a large number of items, and for this reason, effective monitoring is not achieved.
따라서, 이러한 모니터링 데이터의 다양성을 하나의 단위로 통일함으로써 어떠한 항목에 대해서도 똑 같은 기준으로 모니터링이 가능하며, 누구나 성능 저하 및 장애 발생 사실을 손쉽게 모니터링 할 수 있다.
Thus, by unifying the diversity of such monitoring data into one unit, any item can be monitored by the same criteria, and anyone can easily monitor the performance degradation and the occurrence of a failure.
모니터링 항목의 정규화는 평균값과 모니터링 값의 차를 표준편차로 나누어 산출할 수 있다.Normalization of the monitoring items can be calculated by dividing the difference between the mean value and the monitoring value by the standard deviation.
◆ 정규화(Z) = (평균값 - 모니터링 값) / 표준편차
Normalization (Z) = (mean value-monitoring value) / standard deviation
모니터링된 데이터를 미리 생성된 평균과 표준편차를 활용하여 모니터링함으로써 모든 항목으로 같은 단위로 모니터링할 수 있으며, 장애 발생 사실을 직관적으로 확인할 수 있는데 그 예는 하기와 같다.
By monitoring the monitored data using the pre-generated average and standard deviation, all items can be monitored in the same unit, and the fault can be intuitively checked. Examples are as follows.
(활용의 예)(Example of the use)
- Z 값이 0 ~ 2 사이 : 정상-Z value is between 0 and 2:
- Z 값이 2 ~ 3 사이 : Warning (경고)-Z value is between 2 and 3: Warning
- Z 값이 3 이상 : Critical (장애)
-Z value is 3 or more: Critical
모든 모니터링 데이터는 정규화를 통해서 위와 같이 항목과 상관없이 같은 단위로 모니터링할 수 있으므로, 누구나 쉽고 빠르게 장애 및 성능 저하 사실을 인지할 수 있다. 도7은 모니터링 대상 정보의 발생추이 및 표준화를 적용하여 임계치를 초과하는지 여부를 조회하는 실시예을 도시한 것이다.
All monitoring data can be monitored in the same unit regardless of the items through normalization, so anyone can easily and quickly recognize the failure and performance degradation. FIG. 7 illustrates an embodiment of inquiring whether a threshold is exceeded by applying a trend and standardization of monitoring target information.
상기 본 발명의 구체적인 내용은 바람직한 실시예로서 설명된 것이므로 상술한 내용에 의해 본 발명의 청구범위가 제한적으로 해석되어서는 아니되고 예시적인 사항으로 고려되어야 할 것이다. 또한 본 발명의 권리범위는 청구범위와 균등하게 볼 수 있는 범위까지 미침은 물론이다.
Since the detailed description of the present invention has been described as a preferred embodiment, the claims of the present invention should not be construed as limited by the above description but should be considered as illustrative. In addition, the scope of the present invention, of course, extends to the scope equivalent to the claims.
1: 소스서버, 11: 센드데모,
2: 분석서버, 21: 리시브데모,
22: 데이터베이스, 23: 경고 관리자 모듈,
3: 클라이언트 단말기.1: source server, 11: senddemo,
2: analytics server, 21: receive demo,
22: database, 23: alert manager module,
3: client terminal.
Claims (18)
시계열 데이터를 평균과 표준편차를 이용하여 데이터 패턴을 인식하되, 시구간별 동적 임계치를 산출하고 모니터링 항목별로 표준화된 모니터링 단위를 제공하기 위해, (a)모니터링 항목별 정상범위 구간 데이터와 임계치 데이터를 산출하는 단계 및 (b)상기 산출된 데이터를 이용하여 실시간으로 접근되는 데이터를 모니터링하는 단계를 포함하되,
상기 (a)단계는
(a1)지정된 구간의 성능 로깅 데이터를 추출하는 단계;
(a2)평균과 표준편차를 산출하는 단계;
(a3)모니터링 항목별 정상범위 구간 및 임계치 산출 단계; 및
(a4)데이터베이스에 저장하는 단계를 수행하는 일련의 절차를 포함하고,
상기 (b)단계는
(b1)실시간 데이터를 모니터링하는 단계;
(b2)상기 (a3)단계에서 산출된 정상범위 구간 및 임계치를 데이터베이스로부터 추출하는 단계;
(b3)실시간 데이터가 정상범위에 있는지를 판단한 후 정상범위인 경우 상기 (b1)단계에서부터 다시 수행하고, 정상범위를 벗어난 경우 다음 절차를 수행하도록 하는 단계;
(b4)실시간 데이터가 미리 설정된 횟수만큼 반복적으로 정상범위를 이탈하는지 여부를 판단한 후 정상범위를 이탈하지 않은 경우 상기(b1)단계부터 절차를 다시 수행하고, 정상범위를 이탈한 경우는 다음 절차를 수행하도록 하는 단계;
(b5)정상구간을 벗어났다는 경고에 관한 정보를 로깅한 후 데이터베이스에 저장하는 단계; 및
(b6)경고를 발생하는 단계를 수행하는 일련의 절차를 포함하는 시계열 데이터 분석단계; 및
클라이언트의 주기적 질의에 대한 응답 및 경고를 발생하는 단계를 포함하는 것을 특징으로 하는 데이터베이스 성능 모니터링 방법.
Collecting time series data;
(A) Calculate normal range data and threshold data for each monitoring item in order to recognize the data pattern using the mean and standard deviation of time series data, and to calculate dynamic threshold values for each time period and provide standardized monitoring units for each monitoring item. And (b) monitoring data accessed in real time using the calculated data,
Step (a) is
(a1) extracting performance logging data of a designated section;
(a2) calculating the mean and standard deviation;
(a3) calculating a normal range section and a threshold value for each monitoring item; And
(a4) includes a set of procedures for performing the steps of storing in a database;
Step (b) is
(b1) monitoring real time data;
(b2) extracting the normal range section and the threshold value calculated in step (a3) from a database;
(b3) determining whether the real-time data is in the normal range, and then performing the process again from the step (b1) in the case of the normal range, and performing the following procedure if the real-time data is out of the normal range;
(b4) If it is determined that the real-time data has repeatedly departed from the normal range by a predetermined number of times, if the normal range is not departed, the procedure is repeated from step (b1) above. To perform;
(b5) logging the information regarding the warning that the user has left the normal section and storing the information in a database; And
(b6) analyzing the time series data including a series of procedures for performing a step of generating a warning; And
Generating a response and alert to a periodic query of the client.
The method of claim 1, wherein the data collection step is performed by extracting data by a direct memory approach that directly reads a memory structure of a database management system (DBMS).
The method of claim 1, wherein the data collecting step transmits and receives data by buffering the data using a message queue on an operating system (OS) to prevent data loss.
The method of claim 1, wherein the data collecting step stores data using a file logging method on an operating system (OS) to prevent data loss, but collects and analyzes data by a separate daemon process. Database performance monitoring method, characterized in that the transmission to the server.
The method of claim 1, wherein in step (a), after extracting data, each step is performed by patterning and storing the normal range section and the threshold value by dividing the data by time, date, and day of the week, and (b) The database performance monitoring method, characterized in that the step of monitoring the real-time data by reflecting the characteristics of time, date, day of the week.
The method of claim 1, wherein the extracting data in the step (a) comprises transmitting data from a data transmission module provided in a plurality of remote source servers and receiving data through a data receiving module provided in the analysis server. Database performance monitoring method further comprising the step.
The method of claim 1, wherein step (b) comprises providing a normalized value by dividing the difference between the average value and the monitored value by the standard deviation for unit standardization of the monitoring item between the steps (b2) and (b3). Database performance monitoring method, characterized in that it further comprises.
상기 소스서버로부터 수집된 시계열 데이터를 평균과 표준편차를 이용하여 데이터베이스 성능정보에 관한 패턴을 인식하고, 시구간별 동적 임계치를 산출하며, 모니터링 항목별 정규화를 통해 표준화된 모니터링 데이터를 산출함으로써 시계열 데이터에 대한 성능분석을 수행하기 위해, (a)모니터링 항목별 정상범위 구간 데이터와 임계치 데이터를 산출하는 단계 및 (b)상기 산출된 데이터를 이용하여 실시간으로 접근되는 데이터를 모니터링하는 단계를 포함하되,
상기 (a)단계는
(a1)지정된 구간의 성능 로깅 데이터를 추출하는 단계;
(a2)평균과 표준편차를 산출하는 단계;
(a3)모니터링 항목별 정상범위 구간 및 임계치 산출 단계; 및
(a4)데이터베이스에 저장하는 단계를 수행하는 일련의 절차를 포함하고,
상기 (b)단계는
(b1)실시간 데이터를 모니터링하는 단계;
(b2)상기 (a3)단계에서 산출된 정상범위 구간 및 임계치를 데이터베이스로부터 추출하는 단계;
(b3)실시간 데이터가 정상범위에 있는지를 판단한 후 정상범위인 경우 상기 (b1)단계에서부터 다시 수행하고, 정상범위를 벗어난 경우 다음 절차를 수행하도록 하는 단계;
(b4)실시간 데이터가 미리 설정된 횟수만큼 반복적으로 정상범위를 이탈하는지 여부를 판단한 후 정상범위를 이탈하지 않은 경우 상기(b1)단계부터 절차를 다시 수행하고, 정상범위를 이탈한 경우는 다음 절차를 수행하도록 하는 단계;
(b5)정상구간을 벗어났다는 경고에 관한 정보를 로깅한 후 데이터베이스에 저장하는 단계; 및
(b6)경고를 발생하는 단계를 수행하는 일련의 절차를 수행하는 분석서버; 및
주기적으로 분석 데이터에 대한 질의를 수행하고, 그에 대한 응답 및 경고를 수신하는 하나 또는 둘 이상의 클라이언트 단말기를 포함하는 것을 특징으로 하는 데이터베이스 성능 모니터링 시스템.
One or more source servers on which a database or application including a module for collecting database performance information is driven;
The time series data collected from the source server is recognized using a mean and standard deviation to recognize a pattern regarding database performance information, a dynamic threshold value is calculated for each time period, and standardized monitoring data is calculated through normalization for each monitoring item. In order to perform the performance analysis for the step of (a) calculating the normal range data and threshold data for each monitoring item and (b) monitoring the data accessed in real time using the calculated data,
Step (a) is
(a1) extracting performance logging data of a designated section;
(a2) calculating the mean and standard deviation;
(a3) calculating a normal range section and a threshold value for each monitoring item; And
(a4) includes a set of procedures for performing the steps of storing in a database;
Step (b) is
(b1) monitoring real time data;
(b2) extracting the normal range section and the threshold value calculated in step (a3) from a database;
(b3) determining whether the real-time data is in the normal range, and then performing the process again from the step (b1) in the case of the normal range, and performing the following procedure if the real-time data is out of the normal range;
(b4) If it is determined that the real-time data has repeatedly departed from the normal range by a predetermined number of times, the procedure is repeated from step (b1) above. To perform;
(b5) logging the information regarding the warning that the user has left the normal section and storing the information in a database; And
(b6) an analysis server performing a series of procedures for performing a step of generating a warning; And
And one or more client terminals that periodically query the analysis data and receive responses and alerts thereto.
10. The method of claim 9, wherein the source server is configured remotely from the analysis server, as a module for collecting performance information has a performance information extraction and send daemon implemented as a separate application programming interface (application programming interface) The analysis server further comprises a receive daemon for receiving performance information (Receive Daemon) characterized in that the database performance monitoring system.
10. The method of claim 9, wherein the module for collecting performance information provided in the source server is characterized in that the data is extracted by a direct memory approach that directly reads the memory structure of a database management system (DBMS). Database performance monitoring system
The method of claim 9, wherein the module for collecting performance information provided in the source server transmits and receives data by buffering data using a message queue on an operating system (OS) to prevent data loss. system.
10. The method of claim 9, wherein the module for collecting performance information provided in the source server stores data using a file logging method on an operating system (OS) in order to prevent data loss. Database performance monitoring system, characterized in that to collect the data by the process and transmit to the analysis server.
The method of claim 9, wherein in the step (a), after extracting the data, the data is divided into patterns by time, date, and day of the week to be patterned to store the normal range and the threshold value, and (b) The database performance monitoring system, characterized in that a series of procedures for monitoring real-time data by reflecting the characteristics of time, date, and day of the week.
10. The method of claim 9, wherein the extracting data in the step (a) comprises: transmitting data from a data transmission module provided in a plurality of remote servers and receiving data through a data receiving module provided in the analysis server. Database performance monitoring system further comprises.
10. The method of claim 9, wherein step (b) comprises providing a normalized value by dividing the difference between the average value and the monitored value by the standard deviation for unit standardization of the monitoring item between steps (b2) and (b3). Database performance monitoring system, characterized in that it further comprises.
10. The system of claim 9, wherein the analysis server uses a relational database for storing performance analysis information.
Priority Applications (1)
| Application Number | Priority Date | Filing Date | Title |
|---|---|---|---|
| KR1020100044189A KR100982034B1 (en) | 2010-05-11 | 2010-05-11 | Monitoring method and system for database performance |
Applications Claiming Priority (1)
| Application Number | Priority Date | Filing Date | Title |
|---|---|---|---|
| KR1020100044189A KR100982034B1 (en) | 2010-05-11 | 2010-05-11 | Monitoring method and system for database performance |
Publications (1)
| Publication Number | Publication Date |
|---|---|
| KR100982034B1 true KR100982034B1 (en) | 2010-09-13 |
Family
ID=43010096
Family Applications (1)
| Application Number | Title | Priority Date | Filing Date |
|---|---|---|---|
| KR1020100044189A Active KR100982034B1 (en) | 2010-05-11 | 2010-05-11 | Monitoring method and system for database performance |
Country Status (1)
| Country | Link |
|---|---|
| KR (1) | KR100982034B1 (en) |
Cited By (15)
| Publication number | Priority date | Publication date | Assignee | Title |
|---|---|---|---|---|
| KR101599718B1 (en) * | 2015-02-27 | 2016-03-04 | 삼성에스디에스 주식회사 | Method and Apparatus for Managing Performance of Database |
| KR101656725B1 (en) * | 2015-03-04 | 2016-09-13 | 삼성에스디에스 주식회사 | Method and Apparatus for Analyzing Database Performance Degradation |
| CN107247649A (en) * | 2016-10-12 | 2017-10-13 | 北京奇虎科技有限公司 | Method, device and the gateway of detecting system health status |
| KR20180076172A (en) * | 2016-12-27 | 2018-07-05 | 주식회사 씨에스리 | Apparatus and method for detecting anomaly of database system |
| KR20200011416A (en) * | 2018-05-07 | 2020-02-03 | 산동 유니버시티 오브 사이언스 앤드 테크놀로지 | Dynamic Alarm Threshold Design and Method and System of Alarm Cancellation |
| CN112464260A (en) * | 2020-11-25 | 2021-03-09 | 四川易诚智讯科技有限公司 | Transmission method for sensitive data around nuclear power station |
| CN113377560A (en) * | 2021-04-27 | 2021-09-10 | 国网吉林省电力有限公司 | Intelligent mode detection method, system and storage medium for database |
| KR102368147B1 (en) * | 2021-10-19 | 2022-02-25 | 강동원 | Server monitoring system and the driving method |
| KR20220071451A (en) * | 2020-11-24 | 2022-05-31 | 스트라토 주식회사 | Data monitering system and control method thereof |
| CN115761142A (en) * | 2022-12-06 | 2023-03-07 | 上海瞰融信息技术发展有限公司 | High-performance live-action modeling method based on multi-GPU (graphics processing Unit) cooperation |
| CN115982476A (en) * | 2022-12-05 | 2023-04-18 | 平安银行股份有限公司 | Data aging monitoring method and device |
| CN117423052A (en) * | 2023-10-20 | 2024-01-19 | 山东运泰通信工程有限公司 | A monitoring equipment debugging system and method based on data analysis |
| KR20240080314A (en) | 2022-11-29 | 2024-06-07 | 주식회사 카카오 | Method, monitoring server and monitoring system for monitoring using time series database |
| WO2024169470A1 (en) * | 2023-02-16 | 2024-08-22 | 中兴通讯股份有限公司 | Database management method, electronic device and storage medium |
| CN119135884A (en) * | 2024-08-19 | 2024-12-13 | 深圳柏成科技有限公司 | A data visualization monitoring platform |
Citations (1)
| Publication number | Priority date | Publication date | Assignee | Title |
|---|---|---|---|---|
| KR20090080065A (en) * | 2006-10-05 | 2009-07-23 | 스플렁크 인코퍼레이티드 | Time series search engine |
-
2010
- 2010-05-11 KR KR1020100044189A patent/KR100982034B1/en active Active
Patent Citations (1)
| Publication number | Priority date | Publication date | Assignee | Title |
|---|---|---|---|---|
| KR20090080065A (en) * | 2006-10-05 | 2009-07-23 | 스플렁크 인코퍼레이티드 | Time series search engine |
Cited By (20)
| Publication number | Priority date | Publication date | Assignee | Title |
|---|---|---|---|---|
| KR101599718B1 (en) * | 2015-02-27 | 2016-03-04 | 삼성에스디에스 주식회사 | Method and Apparatus for Managing Performance of Database |
| KR101656725B1 (en) * | 2015-03-04 | 2016-09-13 | 삼성에스디에스 주식회사 | Method and Apparatus for Analyzing Database Performance Degradation |
| CN107247649A (en) * | 2016-10-12 | 2017-10-13 | 北京奇虎科技有限公司 | Method, device and the gateway of detecting system health status |
| KR20180076172A (en) * | 2016-12-27 | 2018-07-05 | 주식회사 씨에스리 | Apparatus and method for detecting anomaly of database system |
| KR101981310B1 (en) | 2016-12-27 | 2019-05-22 | 주식회사 씨에스리 | Apparatus and method for detecting anomaly of database system |
| KR20200011416A (en) * | 2018-05-07 | 2020-02-03 | 산동 유니버시티 오브 사이언스 앤드 테크놀로지 | Dynamic Alarm Threshold Design and Method and System of Alarm Cancellation |
| KR102160202B1 (en) | 2018-05-07 | 2020-09-25 | 산동 유니버시티 오브 사이언스 앤드 테크놀로지 | Dynamic alarm threshold design and method of alarm elimination |
| KR20220071451A (en) * | 2020-11-24 | 2022-05-31 | 스트라토 주식회사 | Data monitering system and control method thereof |
| KR102457031B1 (en) * | 2020-11-24 | 2022-10-21 | 스트라토 주식회사 | Data monitering system and control method thereof |
| CN112464260A (en) * | 2020-11-25 | 2021-03-09 | 四川易诚智讯科技有限公司 | Transmission method for sensitive data around nuclear power station |
| CN113377560A (en) * | 2021-04-27 | 2021-09-10 | 国网吉林省电力有限公司 | Intelligent mode detection method, system and storage medium for database |
| CN113377560B (en) * | 2021-04-27 | 2024-02-27 | 国网吉林省电力有限公司 | An intelligent pattern detection method, system and storage medium for database |
| KR102368147B1 (en) * | 2021-10-19 | 2022-02-25 | 강동원 | Server monitoring system and the driving method |
| KR20240080314A (en) | 2022-11-29 | 2024-06-07 | 주식회사 카카오 | Method, monitoring server and monitoring system for monitoring using time series database |
| CN115982476A (en) * | 2022-12-05 | 2023-04-18 | 平安银行股份有限公司 | Data aging monitoring method and device |
| CN115761142A (en) * | 2022-12-06 | 2023-03-07 | 上海瞰融信息技术发展有限公司 | High-performance live-action modeling method based on multi-GPU (graphics processing Unit) cooperation |
| CN115761142B (en) * | 2022-12-06 | 2023-11-28 | 上海瞰融信息技术发展有限公司 | High-performance live-action modeling method based on multi-GPU cooperation |
| WO2024169470A1 (en) * | 2023-02-16 | 2024-08-22 | 中兴通讯股份有限公司 | Database management method, electronic device and storage medium |
| CN117423052A (en) * | 2023-10-20 | 2024-01-19 | 山东运泰通信工程有限公司 | A monitoring equipment debugging system and method based on data analysis |
| CN119135884A (en) * | 2024-08-19 | 2024-12-13 | 深圳柏成科技有限公司 | A data visualization monitoring platform |
Similar Documents
| Publication | Publication Date | Title |
|---|---|---|
| KR100982034B1 (en) | Monitoring method and system for database performance | |
| US10558545B2 (en) | Multiple modeling paradigm for predictive analytics | |
| EP2324406B1 (en) | Method and apparatus for monitoring the performance of a power delivery control system | |
| CN117391261B (en) | AI intelligent water service system of internet of things based on low-power consumption ultrasonic measurement | |
| CN113472881B (en) | Statistical method and device for online terminal equipment | |
| CN114531338A (en) | Monitoring alarm and tracing method and system based on call chain data | |
| CN108255671A (en) | The monitoring of the application of computer system and aposematic mechanism | |
| CN108390793A (en) | A kind of method and device of analysis system stability | |
| CN119003249A (en) | Automatic disaster recovery process management method and system for intelligent computing center | |
| CN119336580A (en) | Business indicator monitoring and alarm method, device, equipment and medium | |
| CN113656207A (en) | Troubleshooting method, apparatus, electronic device and medium | |
| CN115499302B (en) | Monitoring method and device of business system, readable storage medium and electronic equipment | |
| CN120066747B (en) | Method for switching data sources when calling springboot service interface based on xxl-job scheduled task | |
| CN120179506B (en) | Intelligent operation and maintenance method for streaming computing task based on real-time monitoring | |
| CN112284486B (en) | Liquid level meter abnormal data monitoring method, device, computer equipment and storage medium | |
| CN110633165B (en) | Fault processing method, device, system server and computer readable storage medium | |
| CN117857285A (en) | A distributed data processing system for oil and gas pipeline network | |
| CN117874674A (en) | Network about vehicle order monitoring and alarming method and device, computer equipment and storage medium | |
| CN118312526A (en) | Abnormal SQL positioning method and device, electronic equipment and storage medium | |
| CN117271183A (en) | Method and device for acquiring database abnormal job scheduling retry strategy | |
| CN120743631B (en) | Financial big data management system and method | |
| CN120823984B (en) | Medical equipment monitoring method, device and equipment based on equipment log | |
| CN121116683A (en) | Abnormality processing method and device for business system | |
| CN119087467A (en) | Safety monitoring method for reservoir drainage and flood control projects | |
| CN120872732A (en) | Data processing method, device, equipment and storage medium |
Legal Events
| Date | Code | Title | Description |
|---|---|---|---|
| A201 | Request for examination | ||
| PA0109 | Patent application |
Patent event code: PA01091R01D Comment text: Patent Application Patent event date: 20100511 |
|
| PA0201 | Request for examination | ||
| A302 | Request for accelerated examination | ||
| PA0302 | Request for accelerated examination |
Patent event date: 20100608 Patent event code: PA03022R01D Comment text: Request for Accelerated Examination Patent event date: 20100511 Patent event code: PA03021R01I Comment text: Patent Application |
|
| E902 | Notification of reason for refusal | ||
| PE0902 | Notice of grounds for rejection |
Comment text: Notification of reason for refusal Patent event date: 20100714 Patent event code: PE09021S01D |
|
| E701 | Decision to grant or registration of patent right | ||
| PE0701 | Decision of registration |
Patent event code: PE07011S01D Comment text: Decision to Grant Registration Patent event date: 20100831 |
|
| GRNT | Written decision to grant | ||
| PR0701 | Registration of establishment |
Comment text: Registration of Establishment Patent event date: 20100907 Patent event code: PR07011E01D |
|
| PR1002 | Payment of registration fee |
Payment date: 20100907 End annual number: 3 Start annual number: 1 |
|
| PG1601 | Publication of registration | ||
| FPAY | Annual fee payment |
Payment date: 20130910 Year of fee payment: 4 |
|
| PR1001 | Payment of annual fee |
Payment date: 20130910 Start annual number: 4 End annual number: 4 |
|
| FPAY | Annual fee payment |
Payment date: 20140620 Year of fee payment: 5 |
|
| PR1001 | Payment of annual fee |
Payment date: 20140620 Start annual number: 5 End annual number: 5 |
|
| FPAY | Annual fee payment |
Payment date: 20150720 Year of fee payment: 6 |
|
| PR1001 | Payment of annual fee |
Payment date: 20150720 Start annual number: 6 End annual number: 6 |
|
| FPAY | Annual fee payment |
Payment date: 20160926 Year of fee payment: 7 |
|
| PR1001 | Payment of annual fee |
Payment date: 20160926 Start annual number: 7 End annual number: 7 |
|
| FPAY | Annual fee payment |
Payment date: 20171010 Year of fee payment: 8 |
|
| PR1001 | Payment of annual fee |
Payment date: 20171010 Start annual number: 8 End annual number: 8 |
|
| FPAY | Annual fee payment |
Payment date: 20180917 Year of fee payment: 9 |
|
| PR1001 | Payment of annual fee |
Payment date: 20180917 Start annual number: 9 End annual number: 9 |
|
| PR1001 | Payment of annual fee |
Payment date: 20201007 Start annual number: 11 End annual number: 11 |
|
| PR1001 | Payment of annual fee |
Payment date: 20210804 Start annual number: 12 End annual number: 12 |
|
| PR1001 | Payment of annual fee |
Payment date: 20220705 Start annual number: 13 End annual number: 13 |
|
| PR1001 | Payment of annual fee |
Payment date: 20230720 Start annual number: 14 End annual number: 14 |
|
| PR1001 | Payment of annual fee |
Payment date: 20240820 Start annual number: 15 End annual number: 15 |
|
| PR1001 | Payment of annual fee |
Payment date: 20250630 Start annual number: 16 End annual number: 16 |