JP7635994B2 - Method and system for detecting target substance - Google Patents
Method and system for detecting target substance Download PDFInfo
- Publication number
- JP7635994B2 JP7635994B2 JP2021543081A JP2021543081A JP7635994B2 JP 7635994 B2 JP7635994 B2 JP 7635994B2 JP 2021543081 A JP2021543081 A JP 2021543081A JP 2021543081 A JP2021543081 A JP 2021543081A JP 7635994 B2 JP7635994 B2 JP 7635994B2
- Authority
- JP
- Japan
- Prior art keywords
- light
- liquid sample
- microchannel
- target substance
- substance
- Prior art date
- Legal status (The legal status is an assumption and is not a legal conclusion. Google has not performed a legal analysis and makes no representation as to the accuracy of the status listed.)
- Active
Links
Images


Classifications
-
- G—PHYSICS
- G01—MEASURING; TESTING
- G01N—INVESTIGATING OR ANALYSING MATERIALS BY DETERMINING THEIR CHEMICAL OR PHYSICAL PROPERTIES
- G01N21/00—Investigating or analysing materials by the use of optical means, i.e. using sub-millimetre waves, infrared, visible or ultraviolet light
- G01N21/62—Systems in which the material investigated is excited whereby it emits light or causes a change in wavelength of the incident light
- G01N21/63—Systems in which the material investigated is excited whereby it emits light or causes a change in wavelength of the incident light optically excited
- G01N21/64—Fluorescence; Phosphorescence
- G01N21/645—Specially adapted constructive features of fluorimeters
- G01N21/6456—Spatial resolved fluorescence measurements; Imaging
- G01N21/6458—Fluorescence microscopy
-
- G—PHYSICS
- G01—MEASURING; TESTING
- G01N—INVESTIGATING OR ANALYSING MATERIALS BY DETERMINING THEIR CHEMICAL OR PHYSICAL PROPERTIES
- G01N33/00—Investigating or analysing materials by specific methods not covered by groups G01N1/00 - G01N31/00
- G01N33/48—Biological material, e.g. blood, urine; Haemocytometers
- G01N33/50—Chemical analysis of biological material, e.g. blood, urine; Testing involving biospecific ligand binding methods; Immunological testing
- G01N33/68—Chemical analysis of biological material, e.g. blood, urine; Testing involving biospecific ligand binding methods; Immunological testing involving proteins, peptides or amino acids
- G01N33/6803—General methods of protein analysis not limited to specific proteins or families of proteins
-
- B—PERFORMING OPERATIONS; TRANSPORTING
- B01—PHYSICAL OR CHEMICAL PROCESSES OR APPARATUS IN GENERAL
- B01L—CHEMICAL OR PHYSICAL LABORATORY APPARATUS FOR GENERAL USE
- B01L3/00—Containers or dishes for laboratory use, e.g. laboratory glassware; Droppers
- B01L3/50—Containers for the purpose of retaining a material to be analysed, e.g. test tubes
- B01L3/502—Containers for the purpose of retaining a material to be analysed, e.g. test tubes with fluid transport, e.g. in multi-compartment structures
- B01L3/5027—Containers for the purpose of retaining a material to be analysed, e.g. test tubes with fluid transport, e.g. in multi-compartment structures by integrated microfluidic structures, i.e. dimensions of channels and chambers are such that surface tension forces are important, e.g. lab-on-a-chip
- B01L3/502715—Containers for the purpose of retaining a material to be analysed, e.g. test tubes with fluid transport, e.g. in multi-compartment structures by integrated microfluidic structures, i.e. dimensions of channels and chambers are such that surface tension forces are important, e.g. lab-on-a-chip characterised by interfacing components, e.g. fluidic, electrical, optical or mechanical interfaces
-
- G—PHYSICS
- G01—MEASURING; TESTING
- G01N—INVESTIGATING OR ANALYSING MATERIALS BY DETERMINING THEIR CHEMICAL OR PHYSICAL PROPERTIES
- G01N21/00—Investigating or analysing materials by the use of optical means, i.e. using sub-millimetre waves, infrared, visible or ultraviolet light
- G01N21/62—Systems in which the material investigated is excited whereby it emits light or causes a change in wavelength of the incident light
- G01N21/63—Systems in which the material investigated is excited whereby it emits light or causes a change in wavelength of the incident light optically excited
- G01N21/64—Fluorescence; Phosphorescence
- G01N21/6428—Measuring fluorescence of fluorescent products of reactions or of fluorochrome labelled reactive substances, e.g. measuring quenching effects, using measuring "optrodes"
-
- G—PHYSICS
- G01—MEASURING; TESTING
- G01N—INVESTIGATING OR ANALYSING MATERIALS BY DETERMINING THEIR CHEMICAL OR PHYSICAL PROPERTIES
- G01N33/00—Investigating or analysing materials by specific methods not covered by groups G01N1/00 - G01N31/00
- G01N33/48—Biological material, e.g. blood, urine; Haemocytometers
- G01N33/50—Chemical analysis of biological material, e.g. blood, urine; Testing involving biospecific ligand binding methods; Immunological testing
- G01N33/58—Chemical analysis of biological material, e.g. blood, urine; Testing involving biospecific ligand binding methods; Immunological testing involving labelled substances
- G01N33/582—Chemical analysis of biological material, e.g. blood, urine; Testing involving biospecific ligand binding methods; Immunological testing involving labelled substances with fluorescent label
-
- B—PERFORMING OPERATIONS; TRANSPORTING
- B01—PHYSICAL OR CHEMICAL PROCESSES OR APPARATUS IN GENERAL
- B01L—CHEMICAL OR PHYSICAL LABORATORY APPARATUS FOR GENERAL USE
- B01L2300/00—Additional constructional details
- B01L2300/06—Auxiliary integrated devices, integrated components
- B01L2300/0627—Sensor or part of a sensor is integrated
- B01L2300/0654—Lenses; Optical fibres
-
- B—PERFORMING OPERATIONS; TRANSPORTING
- B01—PHYSICAL OR CHEMICAL PROCESSES OR APPARATUS IN GENERAL
- B01L—CHEMICAL OR PHYSICAL LABORATORY APPARATUS FOR GENERAL USE
- B01L2400/00—Moving or stopping fluids
- B01L2400/04—Moving fluids with specific forces or mechanical means
- B01L2400/0475—Moving fluids with specific forces or mechanical means specific mechanical means and fluid pressure
- B01L2400/0478—Moving fluids with specific forces or mechanical means specific mechanical means and fluid pressure pistons
-
- G—PHYSICS
- G01—MEASURING; TESTING
- G01N—INVESTIGATING OR ANALYSING MATERIALS BY DETERMINING THEIR CHEMICAL OR PHYSICAL PROPERTIES
- G01N21/00—Investigating or analysing materials by the use of optical means, i.e. using sub-millimetre waves, infrared, visible or ultraviolet light
- G01N21/62—Systems in which the material investigated is excited whereby it emits light or causes a change in wavelength of the incident light
- G01N21/63—Systems in which the material investigated is excited whereby it emits light or causes a change in wavelength of the incident light optically excited
- G01N21/64—Fluorescence; Phosphorescence
- G01N21/6428—Measuring fluorescence of fluorescent products of reactions or of fluorochrome labelled reactive substances, e.g. measuring quenching effects, using measuring "optrodes"
- G01N2021/6439—Measuring fluorescence of fluorescent products of reactions or of fluorochrome labelled reactive substances, e.g. measuring quenching effects, using measuring "optrodes" with indicators, stains, dyes, tags, labels, marks
-
- G—PHYSICS
- G01—MEASURING; TESTING
- G01N—INVESTIGATING OR ANALYSING MATERIALS BY DETERMINING THEIR CHEMICAL OR PHYSICAL PROPERTIES
- G01N21/00—Investigating or analysing materials by the use of optical means, i.e. using sub-millimetre waves, infrared, visible or ultraviolet light
- G01N21/62—Systems in which the material investigated is excited whereby it emits light or causes a change in wavelength of the incident light
- G01N21/63—Systems in which the material investigated is excited whereby it emits light or causes a change in wavelength of the incident light optically excited
- G01N21/64—Fluorescence; Phosphorescence
- G01N21/645—Specially adapted constructive features of fluorimeters
- G01N2021/6482—Sample cells, cuvettes
Landscapes
- Health & Medical Sciences (AREA)
- Life Sciences & Earth Sciences (AREA)
- Chemical & Material Sciences (AREA)
- Engineering & Computer Science (AREA)
- Immunology (AREA)
- Physics & Mathematics (AREA)
- Molecular Biology (AREA)
- Hematology (AREA)
- Analytical Chemistry (AREA)
- General Health & Medical Sciences (AREA)
- Urology & Nephrology (AREA)
- Biomedical Technology (AREA)
- Biochemistry (AREA)
- General Physics & Mathematics (AREA)
- Pathology (AREA)
- Microbiology (AREA)
- Food Science & Technology (AREA)
- Chemical Kinetics & Catalysis (AREA)
- Biotechnology (AREA)
- Cell Biology (AREA)
- Medicinal Chemistry (AREA)
- Nuclear Medicine, Radiotherapy & Molecular Imaging (AREA)
- Proteomics, Peptides & Aminoacids (AREA)
- Bioinformatics & Cheminformatics (AREA)
- Bioinformatics & Computational Biology (AREA)
- Dispersion Chemistry (AREA)
- Clinical Laboratory Science (AREA)
- Biophysics (AREA)
- Optics & Photonics (AREA)
- Investigating Or Analysing Materials By Optical Means (AREA)
- Investigating, Analyzing Materials By Fluorescence Or Luminescence (AREA)
Description
本開示は、被検出物質の検出方法および被検出物質の検出システムに関する。 The present disclosure relates to a method for detecting a substance to be detected and a system for detecting a substance to be detected.
試料に含まれる可能性がある被検出物質を検出する様々な技術が実用化されている。被検出物質の例としては、アレルギー物質、がん細胞由来のタンパク質、核酸または小胞などが挙げられる。たとえばタンパク質の検出技術として、ELISA(Enzyme-Linked Immuno Sorbent Assay)法またはSPR(Surface Plasmon Resonance)法などが知られている。ELISA法により検出可能な被検出物質の最低濃度(検出限界)は0.3[ng/mL]程度とされ、SPR法の検出限界は1[μg/mL]程度とされている。また、いずれの手法によっても被検出物質の検出には数時間を要する。Various techniques for detecting target substances that may be contained in a sample have been put to practical use. Examples of target substances include allergens, proteins derived from cancer cells, nucleic acids, and vesicles. For example, ELISA (Enzyme-Linked Immuno Sorbent Assay) and SPR (Surface Plasmon Resonance) are known as protein detection techniques. The minimum concentration (detection limit) of a target substance that can be detected by the ELISA method is about 0.3 [ng/mL], and the detection limit of the SPR method is about 1 [μg/mL]. In addition, it takes several hours to detect a target substance by either method.
光を用いて被検出物質を検出する技術が提案されている。たとえば国際公開第2014/192937号(特許文献1)に開示された被検出物質の検出装置は、複数の金属ナノ粒子と、光源と、対物レンズと、受光器と、検出器とを備える。複数の金属ナノ粒子の各々は、被検出物質を特異的に付着可能なホスト分子で修飾されている。光源は、複数の金属ナノ粒子を集合させるための偏光を発する。対物レンズは、偏光を集光して、集光された偏光を、試料と複数の金属ナノ粒子とを含む液体に導入する。受光器は、液体からの光を受ける。検出器は、受光器からの信号に基づいて、被検出物質を検出する。A technology has been proposed for detecting a substance to be detected using light. For example, a detection device for a substance to be detected disclosed in International Publication No. 2014/192937 (Patent Document 1) includes a plurality of metal nanoparticles, a light source, an objective lens, a light receiver, and a detector. Each of the plurality of metal nanoparticles is modified with a host molecule to which the substance to be detected can be specifically attached. The light source emits polarized light for aggregating the plurality of metal nanoparticles. The objective lens focuses the polarized light and introduces the focused polarized light into a liquid containing a sample and the plurality of metal nanoparticles. The light receiver receives light from the liquid. The detector detects the substance to be detected based on a signal from the light receiver.
被検出物質の検出感度を高めたり被検出物質の検出時間を短縮したりする技術、言い換えれば、微量の被検出物質を迅速に検出可能な技術に対する要望が常に存在する。 There is always a demand for technology that can increase the detection sensitivity of a target substance or shorten the detection time of the target substance, in other words, technology that can quickly detect trace amounts of the target substance.
本開示は、かかる課題を解決するためになされたものであり、本開示の目的は、被検出物質を迅速かつ高感度に検出することである。 The present disclosure has been made to solve such problems, and the purpose of the present disclosure is to detect the target substance quickly and with high sensitivity.
本開示のある局面に従う被検出物質の検出方法は、第1~第3のステップを含む。第1のステップは、被検出物質に特異的に結合するホスト分子で各々が修飾された複数の微粒子を含む液体試料をポンプを用いてマイクロ流路に流通させるステップである。第2のステップは、複数の微粒子の電子的共鳴の波長域外の光である非共鳴光を液体試料に照射するステップである。第3のステップは、液体試料からの光(透過光、反射光または散乱光)を受けた受光器からの信号に基づいて被検出物質を検出するステップである。A method for detecting a substance to be detected according to an aspect of the present disclosure includes first to third steps. The first step is a step of circulating a liquid sample containing a plurality of microparticles, each of which is modified with a host molecule that specifically binds to the substance to be detected, through a microchannel using a pump. The second step is a step of irradiating the liquid sample with non-resonant light, which is light outside the wavelength range of electronic resonance of the plurality of microparticles. The third step is a step of detecting the substance to be detected based on a signal from a light receiver that receives light (transmitted light, reflected light, or scattered light) from the liquid sample.
受光器は、液体試料を撮影するカメラを含む。検出するステップ(第3のステップ)は、液体試料をカメラにより撮影した画像に基づき、被検出物質と複数の微粒子とが凝集することで形成された凝集体のサイズを表す指標を算出するステップと、被検出物質の濃度と指標との間に予め求められた対応関係を参照することによって、算出された指標から液体試料に含まれる被検出物質の濃度を算出するステップとを含む。The light receiver includes a camera that captures an image of the liquid sample. The detection step (third step) includes a step of calculating an index representing the size of an aggregate formed by aggregation of the detectable substance and a plurality of microparticles based on an image of the liquid sample captured by the camera, and a step of calculating the concentration of the detectable substance contained in the liquid sample from the calculated index by referring to a correspondence relationship previously determined between the concentration of the detectable substance and the index.
被検出物質の検出方法は、照射するステップ(第1のステップ)の後に非共鳴光の照射を停止するステップをさらに含む。検出するステップ(第3のステップ)は、非共鳴光の照射が停止してから所定期間だけ待機した後に受光器から取得された信号に基づいて、被検出物質を検出するステップを含む。The method for detecting a substance to be detected further includes a step of stopping the irradiation of the non-resonant light after the irradiation step (first step). The detection step (third step) includes a step of detecting the substance to be detected based on a signal obtained from the light receiver after waiting for a predetermined period of time after the irradiation of the non-resonant light has stopped.
検出するステップ(第3のステップ)は、非共鳴光の照射継続中に受光器から取得した信号の強度変化に基づいて、液体試料に被検出物質が含まれているか否かを判定するステップを含む。The detection step (third step) includes a step of determining whether or not the liquid sample contains the substance to be detected based on a change in the intensity of the signal obtained from the photodetector while the non-resonant light irradiation continues.
複数の微粒子の各々の比重は、複数の微粒子の分散媒の比重よりも大きい。照射するステップ(第2のステップ)は、非共鳴光を液体試料の上方から下方に向けて照射するステップを含む。The specific gravity of each of the plurality of microparticles is greater than the specific gravity of the dispersion medium of the plurality of microparticles. The irradiating step (second step) includes a step of irradiating the liquid sample with non-resonant light from above to below.
照射するステップ(第2のステップ)は、非共鳴光の焦点がマイクロ流路よりも非共鳴光の照射方向後方に位置する条件下で非共鳴光を液体試料に照射するステップを含む。The irradiating step (second step) includes irradiating the liquid sample with non-resonant light under conditions in which the focus of the non-resonant light is located behind the microchannel in the irradiation direction of the non-resonant light.
照射するステップ(第2のステップ)は、非共鳴光が照射されない領域が局所的に残った状態で、非共鳴光を液体試料に照射するステップを含む。The irradiating step (second step) includes irradiating the liquid sample with non-resonant light while leaving localized areas where the non-resonant light is not irradiated.
被検出物質の検出方法は、流通させるステップ(第1のステップ)に先立ち、液体試料の流速を、被検出物質と複数の微粒子とが凝集後に分裂することを抑制可能な流速に調整するステップをさらに含む。The method for detecting a detectable substance further includes, prior to the step of distributing (first step), a step of adjusting the flow rate of the liquid sample to a flow rate capable of suppressing the splitting of the detectable substance and the multiple microparticles after agglutination.
被検出物質および複数の微粒子のうちの少なくとも一方は、その表面が蛍光分子により修飾されているか、その内部に蛍光分子をドープ(または発現)している。At least one of the substance to be detected and the multiple microparticles has a surface modified with fluorescent molecules or has fluorescent molecules doped (or expressed) within it.
前記複数の微粒子の直径と前記非共鳴光の波長域との組み合わせは、前記非共鳴光を前記複数の微粒子に照射した場合に前記非共鳴光がミー散乱を起こすように定められる。The combination of the diameters of the multiple particles and the wavelength range of the non-resonant light is determined so that the non-resonant light undergoes Mie scattering when the non-resonant light is irradiated onto the multiple particles.
本開示の他の局面に従う被検出物質の検出システムは、ホルダと、ポンプと、光源と、受光器と、演算装置とを備える。ホルダは、マイクロ流路が設けられた検出キットを保持するように構成されている。ポンプは、被検出物質に特異的に結合するホスト分子で各々が修飾された複数の微粒子を含む液体試料をマイクロ流路に流通させる。光源は、複数の微粒子の電子的共鳴の波長域外の光である非共鳴光を液体試料に照射する。受光器は、液体試料からの光(透過光、反射光または散乱光)を受ける。演算装置は、受光器からの信号に基づいて被検出物質の検出処理を実行する。A detection system for a substance to be detected according to another aspect of the present disclosure includes a holder, a pump, a light source, a photoreceiver, and a computing device. The holder is configured to hold a detection kit provided with a microchannel. The pump circulates a liquid sample containing a plurality of microparticles, each of which is modified with a host molecule that specifically binds to the substance to be detected, through the microchannel. The light source irradiates the liquid sample with non-resonant light, which is light outside the wavelength range of electronic resonance of the plurality of microparticles. The photoreceiver receives light (transmitted light, reflected light, or scattered light) from the liquid sample. The computing device executes a detection process for the substance to be detected based on a signal from the photoreceiver.
光源は、複数の微粒子によりミー散乱を起こす波長域の光を非共鳴光として液体試料に照射する。 The light source irradiates the liquid sample with non-resonant light in a wavelength range that causes Mie scattering by multiple microparticles.
受光器は、液体試料を撮影するカメラを含む。演算装置は、検出処理において、カメラにより撮影された画像から、被検出物質と複数の微粒子とが凝集することによって形成された凝集体のサイズを表す指標を算出する。演算装置は、被検出物質の濃度と指標との間に予め求められた対応関係を参照することによって、算出された指標から液体試料に含まれる被検出物質の濃度を算出する。The light receiver includes a camera that captures an image of the liquid sample. In the detection process, the calculation device calculates, from the image captured by the camera, an index that represents the size of an aggregate formed by aggregation of the detectable substance and multiple microparticles. The calculation device calculates the concentration of the detectable substance contained in the liquid sample from the calculated index by referring to a correspondence relationship previously determined between the concentration of the detectable substance and the index.
被検出物質の検出システムは、共焦点光学系をさらに備える。共焦点光学系は、光源からの非共鳴光を液体試料に照射し、かつ、液体試料からの透過光または反射光を受光器へと導く。演算装置は、カメラにより撮影された3次元画像から凝集体の体積を指標として算出する。The detection system for the substance to be detected further includes a confocal optical system. The confocal optical system irradiates the liquid sample with non-resonant light from the light source and guides transmitted or reflected light from the liquid sample to a light receiver. The computing device calculates the volume of the aggregate as an index from the three-dimensional image captured by the camera.
本開示によれば、被検出物質を迅速かつ高感度に検出できる。 According to the present disclosure, the target substance can be detected quickly and with high sensitivity.
以下、本実施の形態について、図面を参照しながら詳細に説明する。なお、図中同一または相当部分には同一符号を付して、その説明は繰り返さない。Hereinafter, the present embodiment will be described in detail with reference to the drawings. Note that the same or corresponding parts in the drawings are given the same reference numerals and their description will not be repeated.
<用語の説明>
本開示およびその実施の形態において、「試料」とは、被検出物質を含む物質または被検出物質を含む可能性がある物質を意味する。試料は、たとえば動物(たとえばヒト、ウシ、ウマ、ブタ、ヤギ、ニワトリ、ラット、マウスなど)からの生体試料であり得る。生体試料は、たとえば、血液、組織、細胞、分泌液、体液等を含み得る。なお、「試料」はそれらの希釈物または分離物(血清、血漿等)を含んでもよい。「液体試料」とは、試料を含有する液体である。
<Terminology>
In the present disclosure and its embodiments, a "sample" refers to a substance that contains a target substance or a substance that may contain a target substance. A sample may be, for example, a biological sample from an animal (e.g., human, cow, horse, pig, goat, chicken, rat, mouse, etc.). A biological sample may include, for example, blood, tissue, cell, secretion, body fluid, etc. In addition, a "sample" may include a dilution or separation thereof (serum, plasma, etc.). A "liquid sample" is a liquid that contains a sample.
本開示およびその実施の形態において、「被検出物質」とは、ナノメートルオーダーからマイクロメートルオーダーまでのサイズを有し、検出キットを用いて検出される物質を意味する。被検出物質の形状は特に限定されず、たとえば球形状、楕円球形状、ロッド形状(棹形状)である。被検出物質が楕円球形状である場合、楕円球の短軸方向および長軸方向の長さの少なくとも一方がナノメートルオーダーからマイクロメートルオーダーまでの範囲内であればよい。被検出物質がロッド状である場合、ロッドの幅および長さの少なくとも一方がナノメートルオーダーからマイクロメートルオーダーまでの範囲内であればよい。In this disclosure and its embodiments, the term "detectable substance" refers to a substance that has a size ranging from nanometer order to micrometer order and is detected using a detection kit. The shape of the detectable substance is not particularly limited, and may be, for example, a sphere, an oval sphere, or a rod shape. When the detectable substance is oval sphere shaped, at least one of the lengths of the short axis and the long axis of the oval sphere may be within the range from nanometer order to micrometer order. When the detectable substance is rod shaped, at least one of the width and length of the rod may be within the range from nanometer order to micrometer order.
被検出物質の例としては、細胞、微生物(細菌、真菌等)、小胞(エクソソーム、マイクロベクシル、アポトーシス小体等)、生体高分子(タンパク質、核酸、脂質、多糖類等)、抗原(アレルゲン等)およびウイルスなどが挙げられる。タンパク質の具体例としては、CD9,CD63,CD80,CD81等のCD(Cluster of Differentiation)分類された抗体、IL-6等のサイトカイン、または、アルブミンなどが挙げられる。核酸としてはDNAまたはRNAが挙げられる。具体的には、核酸は、遊離DNA(cell free DNA, cfDNA)、がん細胞由来の血中腫瘍DNA(circulating tumor DNA, ctDNA)、メッセンジャーRNA(mRNA)およびマイクロRNA(miRNA)などを含む。ただし、被検出物質は、生体由来の物質(生体物質)に限定されず、樹脂ビーズ金属ナノ粒子、金属ナノ粒子集合体、金属ナノ粒子集積構造体、半導体ナノ粒子、有機ナノ粒子などであってもよい。Examples of substances to be detected include cells, microorganisms (bacteria, fungi, etc.), vesicles (exosomes, microvesicles, apoptotic bodies, etc.), biopolymers (proteins, nucleic acids, lipids, polysaccharides, etc.), antigens (allergens, etc.), and viruses. Specific examples of proteins include antibodies classified as CD (Cluster of Differentiation), such as CD9, CD63, CD80, and CD81, cytokines such as IL-6, and albumin. Examples of nucleic acids include DNA and RNA. Specifically, nucleic acids include free DNA (cell free DNA, cfDNA), circulating tumor DNA (ctDNA) derived from cancer cells, messenger RNA (mRNA), and microRNA (miRNA). However, the substances to be detected are not limited to substances derived from living organisms (biological substances), and may be resin beads, metal nanoparticles, metal nanoparticle aggregates, metal nanoparticle assembly structures, semiconductor nanoparticles, organic nanoparticles, etc.
本開示およびその実施の形態において、「微粒子」とは、ナノメートルオーダーからマイクロメートルオーダーまでのサイズを有する物質を意味する。微粒子の形状は、球形状に限定されるものではなく、楕円球形状またはロッド形状などであってもよい。微粒子が楕円球形状である場合、楕円球の長軸方向の長さおよび短軸方向の長さの少なくとも一方がナノメートルオーダーからマイクロメートルオーダーまでの範囲内であればよい。微粒子がロッド形状である場合、ロッドの幅および長さの少なくとも一方がナノメートルオーダーからマイクロメートルオーダーまでの範囲内であればよい。In this disclosure and its embodiments, "microparticle" refers to a substance having a size ranging from nanometer order to micrometer order. The shape of the microparticle is not limited to a spherical shape, and may be an ellipsoidal shape or a rod shape. When the microparticle is an ellipsoidal shape, at least one of the length in the major axis direction and the length in the minor axis direction of the ellipsoid may be within the range from nanometer order to micrometer order. When the microparticle is a rod shape, at least one of the width and length of the rod may be within the range from nanometer order to micrometer order.
微粒子の例としては、金属ナノ粒子、金属ナノ粒子集合体、金属ナノ粒子集積構造体、半導体ナノ粒子、有機ナノ粒子、樹脂ビーズ、磁性ビーズ、微小粒子状物質(PM:Particulate Matter)などが挙げられる。「金属ナノ粒子」とは、ナノメートルのオーダーのサイズを有する金属粒子である。「金属ナノ粒子集合体」とは、複数の金属ナノ粒子が凝集することによって形成された集合体である。「金属ナノ粒子集積構造体」とは、たとえば、複数の金属ナノ粒子が相互作用部位を介してビーズの表面に固定され、互いに隙間を設けて、金属ナノ粒子の直径以下の間隔で配置された構造体である。「半導体ナノ粒子」とは、ナノメートルのオーダーのサイズを有する半導体粒子である。「有機ナノ粒子」とは、ナノメートルオーダーのサイズを有する有機化合物からなる粒子である。「樹脂ビーズ」とは、ナノメートルオーダーからマイクロメートルオーダーまでのサイズを有する樹脂からなる粒子である。「磁性ビーズ」とは、ナノメートルオーダーからマイクロメートルオーダーまでのサイズを有する磁性を帯びた粒子(磁性体を内部に分散または包埋したポリマー微粒子)である。「PM」とは、マイクロメートルオーダーのサイズを有する粒子状物質である。Examples of fine particles include metal nanoparticles, metal nanoparticle aggregates, metal nanoparticle assembly structures, semiconductor nanoparticles, organic nanoparticles, resin beads, magnetic beads, and particulate matter (PM). A "metal nanoparticle" is a metal particle having a size on the order of nanometers. A "metal nanoparticle aggregate" is an aggregate formed by the aggregation of multiple metal nanoparticles. A "metal nanoparticle assembly structure" is, for example, a structure in which multiple metal nanoparticles are fixed to the surface of a bead via interaction sites, and are arranged at intervals less than the diameter of the metal nanoparticles with gaps between them. A "semiconductor nanoparticle" is a semiconductor particle having a size on the order of nanometers. An "organic nanoparticle" is a particle made of an organic compound having a size on the order of nanometers. A "resin bead" is a particle made of resin having a size on the order of nanometers to micrometers. A "magnetic bead" is a magnetic particle (a polymer fine particle with a magnetic material dispersed or embedded inside) having a size on the order of nanometers to micrometers. A "PM" is a particulate matter having a size on the order of micrometers.
本開示およびその実施の形態において、「ナノメートルオーダー」には、1nmから1000nm(=1μm)までの範囲が含まれる。「マイクロメートルオーダー」には、1μmから1000μm(=1mm)までの範囲が含まれる。したがって、「ナノメートルオーダーからマイクロメートルオーダーまで」には、1nmから1000μmまでの範囲が含まれる。「ナノメートルオーダーからマイクロメートルオーダーまで」との用語は、典型的には数nm~数百μmの範囲を意味し、好ましくは100nm~100μmの範囲を意味し、より好ましくは1μm~数十μmの範囲を意味し得る。In this disclosure and its embodiments, "nanometer order" includes the range of 1 nm to 1000 nm (= 1 μm). "Micrometer order" includes the range of 1 μm to 1000 μm (= 1 mm). Therefore, "nanometer order to micrometer order" includes the range of 1 nm to 1000 μm. The term "nanometer order to micrometer order" typically means a range of several nm to several hundred μm, preferably a range of 100 nm to 100 μm, and more preferably a range of 1 μm to several tens of μm.
本開示およびその実施の形態において、「ホスト分子」とは、被検出物質に特異的に結合(特異的な付着であってもよい)することが可能な物質を意味する。ホスト分子と被検出物質との組み合わせとしては、たとえば、抗原と抗体、糖鎖とタンパク質、脂質とタンパク質、低分子化合物(リガンド)とタンパク質、タンパク質とタンパク質、一本鎖DNAと一本鎖DNAなどが挙げられる。これらの特異的親和性を有する両者のうちのいずれか一方が被検出物質である場合に、他方をホスト分子として用いることができる。すなわち、たとえば抗原が被検出物質である場合には、抗体をホスト分子として用いることができる。逆に抗体が被検出物質である場合には、抗原をホスト分子として用いることができる。また、DNAのハイブリダイゼーションにおいては、被検出物質がターゲットDNAであり、ホスト分子がプローブDNAである。また、DNAと特異的に結合する抗DNA抗体(たとえば、二重鎖DNAと特異的に結合する抗dsDNA、または、一本鎖DNAと特異的に結合する抗ssDNAなど)もホスト分子として用いることができる。なお、抗原は、アレルゲン、微生物(細菌、真菌など)、ウイルス、小胞などを含み得る。また、抗体の種類を変えることによって、検出可能なアレルゲン、微生物またはウイルスの種類を変えることもできる。したがって、本開示により検出可能なアレルゲン、微生物またはウイルスの種類は特に限定されるものではない。また、被検出物質が重金属である場合には、重金属イオンを捕集可能な物質をホスト分子として利用できる。In the present disclosure and its embodiments, a "host molecule" refers to a substance capable of specifically binding (or specifically attaching) to a substance to be detected. Examples of combinations of a host molecule and a substance to be detected include an antigen and an antibody, a sugar chain and a protein, a lipid and a protein, a low molecular weight compound (ligand) and a protein, a protein and a protein, and a single-stranded DNA and a single-stranded DNA. When one of these two molecules having specific affinity is a substance to be detected, the other can be used as a host molecule. That is, when an antigen is a substance to be detected, an antibody can be used as a host molecule. Conversely, when an antibody is a substance to be detected, an antigen can be used as a host molecule. In addition, in DNA hybridization, the substance to be detected is a target DNA, and the host molecule is a probe DNA. In addition, an anti-DNA antibody that specifically binds to DNA (for example, an anti-dsDNA that specifically binds to double-stranded DNA, or an anti-ssDNA that specifically binds to single-stranded DNA, etc.) can also be used as a host molecule. The antigen may include an allergen, a microorganism (bacteria, fungi, etc.), a virus, a vesicle, etc. In addition, by changing the type of antibody, the type of detectable allergen, microorganism, or virus can be changed. Therefore, the types of allergens, microorganisms, or viruses that can be detected by the present disclosure are not particularly limited. In addition, when the substance to be detected is a heavy metal, a substance capable of capturing heavy metal ions can be used as a host molecule.
ホスト分子は、ホスト分子と微粒子との間の相互作用により微粒子の表面に固定される。ホスト分子を微粒子表面に固定するのに用いられる相互作用の種類は微粒子の種類に応じて定まる。相互作用は、共有結合、イオン結合、金属結合、ファンデルワールス力、静電的相互作用、疎水性相互作用、分子間力(たとえば水素結合)および吸着力などを含む。The host molecule is immobilized on the surface of the microparticle by interactions between the host molecule and the microparticle. The type of interaction used to immobilize the host molecule on the microparticle surface depends on the type of microparticle. Interactions include covalent bonds, ionic bonds, metallic bonds, van der Waals forces, electrostatic interactions, hydrophobic interactions, intermolecular forces (e.g., hydrogen bonds), and adsorptive forces.
本開示およびその実施の形態において、「マイクロ流路」とは、液体を流通させる流路の断面がマイクロメートルオーダーである流路を意味する。たとえば流路断面が長方形である場合には、長方形の短辺および長辺のうちの少なくとも一方の長さがマイクロメートルオーダーであればよい。流路断面が円形である場合には、直径の長さがマイクロメートルオーダーであればよい。In this disclosure and its embodiments, a "microchannel" refers to a channel through which a liquid flows, the cross section of which is on the order of micrometers. For example, if the cross section of the channel is rectangular, the length of at least one of the short sides and long sides of the rectangle may be on the order of micrometers. If the cross section of the channel is circular, the diameter may be on the order of micrometers.
本開示およびその実施の形態において、「光誘起力」とは、散逸力、勾配力および物質間光誘起力の総称として用いられる。散逸力とは、光散乱あるいは光吸収といった散逸的過程において、光の運動量が物質に与えられることによって発生する力である。勾配力は、光誘起分極が生じた物質が不均一な電磁場の中に置かれた場合に、電磁気学的なポテンシャルの安定点に物質を移動させる力である。物質間光誘起力とは、光励起された複数の物質中の誘起分極から生じる縦電場による力と横電場(輻射場)による力との和である。In this disclosure and its embodiments, the term "photoinduced force" is used as a general term for dissipative force, gradient force, and inter-substance photoinduced force. Dissipative force is a force that occurs when the momentum of light is imparted to a substance in a dissipative process such as light scattering or light absorption. Gradient force is a force that moves a substance with photoinduced polarization to a stable point of electromagnetic potential when the substance is placed in a non-uniform electromagnetic field. Inter-substance photoinduced force is the sum of the force due to the longitudinal electric field and the force due to the transverse electric field (radiation field) that arise from induced polarization in multiple optically excited substances.
本開示およびその実施の形態において、「共鳴光」とは、微粒子への入射によって微粒子に電子励起由来の大きな光誘起分極を生じさせる光を意味する。光誘起分極とは、物質内部の電子が光によって励起されることにより生じる電気分極である。「微粒子の電子的共鳴の波長域」とは、たとえば微粒子が金属ナノ粒子である場合には、局在表面プラズモン共鳴のピークの半値全幅に対応する波長域である。この波長域は、微粒子のサイズに応じて定まり、微粒子が金属ナノ粒子である場合、典型的には400nm~700nmの可視光の波長域に含まれる。微粒子が半導体微粒子または有機微粒子(ポリスチレンなどの有機材料からなる微粒子)である場合には、バンド間遷移または励起子共鳴(電子-正孔対の共鳴)などの電子的共鳴の波長域が共鳴光の波長域となる。微粒子が有機微粒子である場合、「微粒子の電子的共鳴の波長域」は、典型的には400nmよりも短波長側の波長域に含まれる。In this disclosure and its embodiments, "resonant light" means light that, when incident on a fine particle, generates a large photoinduced polarization in the fine particle due to electronic excitation. Photoinduced polarization is electric polarization that occurs when electrons inside a substance are excited by light. The "wavelength range of electronic resonance of the fine particle" is a wavelength range corresponding to the full width at half maximum of the peak of localized surface plasmon resonance, for example, when the fine particle is a metal nanoparticle. This wavelength range is determined according to the size of the fine particle, and when the fine particle is a metal nanoparticle, it is typically included in the wavelength range of visible light of 400 nm to 700 nm. When the fine particle is a semiconductor fine particle or an organic fine particle (a fine particle made of an organic material such as polystyrene), the wavelength range of electronic resonance such as interband transition or exciton resonance (resonance of electron-hole pairs) is the wavelength range of the resonant light. When the fine particle is an organic fine particle, the "wavelength range of electronic resonance of the fine particle" is typically included in the wavelength range on the shorter wavelength side than 400 nm.
一方、「非共鳴光」とは、微粒子への入射によって微粒子に生じる光誘起分極が小さな光を意味する。たとえば微粒子が金属微粒子である場合には、「微粒子の電子的共鳴の波長域外」とは、局在表面プラズモン共鳴のピークの半値全幅の外の波長域である。この波長域は、微粒子のサイズに応じて定まり、微粒子が金属ナノ粒子である場合、典型的には赤外の波長域に含まれる。「赤外の波長域」とは、700nm~10,000μm(=1mm)の波長域を指し、好ましくは700nm~2,500nmの波長域を指し、より好ましくは700nm~1,400nmの波長域を指す。なお、「微粒子の局在表面プラズモン共鳴の波長域外」が紫外の波長域(10nm~400nmの波長域)に含まれる場合もある。微粒子が有機微粒子である場合、「微粒子の電子的共鳴の波長域外」は、バンド間遷移または励起子共鳴(電子-正孔対の共鳴)などの電子的共鳴の波長域外の波長域である。この波長域は、400nmよりも長波長側の波長域に含まれる。On the other hand, "non-resonant light" means light that generates a small photoinduced polarization in the particles when it is incident on the particles. For example, when the particles are metal particles, "outside the wavelength range of electronic resonance of the particles" is a wavelength range outside the full width at half maximum of the peak of localized surface plasmon resonance. This wavelength range is determined according to the size of the particles, and when the particles are metal nanoparticles, it is typically included in the infrared wavelength range. "Infrared wavelength range" refers to a wavelength range of 700 nm to 10,000 μm (= 1 mm), preferably a wavelength range of 700 nm to 2,500 nm, and more preferably a wavelength range of 700 nm to 1,400 nm. Note that "outside the wavelength range of localized surface plasmon resonance of the particles" may also be included in the ultraviolet wavelength range (10 nm to 400 nm). When the particles are organic particles, "outside the wavelength range of electronic resonance of the particles" is a wavelength range outside the wavelength range of electronic resonance such as interband transition or exciton resonance (resonance of electron-hole pairs). This wavelength range is included in the wavelength range longer than 400 nm.
本開示およびその実施の形態において、「白色光」とは、紫外域~近赤外域の波長範囲(たとえば200nm~1100nmの波長範囲)を有する光を意味する。白色光は、連続光であってもよいしパルス光であってもよい。In this disclosure and its embodiments, "white light" means light having a wavelength range from the ultraviolet region to the near infrared region (e.g., a wavelength range of 200 nm to 1100 nm). The white light may be continuous light or pulsed light.
[実施の形態1]
<被検出物質の検出原理>
図1は、ある被検出物質の検出原理を説明するための概念図である。実施の形態1では、いわゆるラテックス(Latex)凝集法を用いて被検出物質が検出される。より詳細には、図1に示す例では、2種類のビーズB1,B2が準備される。
[First embodiment]
<Detection principle of target substance>
Fig. 1 is a conceptual diagram for explaining the detection principle of a certain target substance. In the first embodiment, the target substance is detected using a so-called latex agglutination method. More specifically, in the example shown in Fig. 1, two types of beads B1 and B2 are prepared.
ビーズB1,B2の各々は、共通のビーズ本体B0を含む。ビーズ本体B0は、ポリスチレンからなる樹脂ビーズ(ラテックスビーズ)である。ビーズ本体B0は、一般的なラテックスビーズと同様に、マイクロメートルオーダーのサイズ(典型的には直径1μm~5μm程度のサイズ)を有する。ビーズ本体B0の材料は、アクリル、ポリオレフィン、ポリエチレン、ポリプロピレン等の他の樹脂であってもよい。Each of the beads B1 and B2 includes a common bead body B0. The bead body B0 is a resin bead (latex bead) made of polystyrene. The bead body B0 has a size on the order of micrometers (typically a diameter of about 1 μm to 5 μm), similar to general latex beads. The material of the bead body B0 may be other resins such as acrylic, polyolefin, polyethylene, and polypropylene.
ビーズB1において、ビーズ本体B0は、第1抗体B11により修飾されている。第1抗体B11の修飾には、アビジンB12とビオチンB13とが用いられている。アビジンB12は、アビジンB12とビーズ本体B0との間の相互作用により、ビーズ本体B0の表面に固定されている。ビオチンB13は、第1抗体B11と結合することで第1抗体B11を標識する。第1抗体B11は、アビジンB12とビオチンB13との間の強い親和性により、ビーズ本体B0の表面に修飾されている。In the bead B1, the bead body B0 is modified with a first antibody B11. Avidin B12 and biotin B13 are used to modify the first antibody B11. Avidin B12 is fixed to the surface of the bead body B0 due to the interaction between avidin B12 and the bead body B0. Biotin B13 labels the first antibody B11 by binding to the first antibody B11. The first antibody B11 is modified on the surface of the bead body B0 due to the strong affinity between avidin B12 and biotin B13.
ビーズB2において、ビーズ本体B0は、第2抗体B21により修飾されている。第2抗体B21も第1抗体B11と同様に、アビジンB22とビオチンB23とによってビーズ本体B0の表面に修飾されている。In the bead B2, the bead body B0 is modified with a second antibody B21. Like the first antibody B11, the second antibody B21 is also modified on the surface of the bead body B0 with avidin B22 and biotin B23.
図1に示す例における被検出物質Xは抗原である。具体的には、CD80などを被検出物質Xとすることができる。CD80はB7-1と呼ばれることもある。被検出物質Xは、抗体が抗原に結合する部位を意味する「エピトープ」が設けられた、抗原以外の物質であってもよい。また、被検出物質Xは、複数のエピトープを含む物質であってもよい。そのような物質としては、CD9/CD63複合エピトープが挙げられる。In the example shown in FIG. 1, the substance to be detected X is an antigen. Specifically, the substance to be detected X may be CD80 or the like. CD80 is also called B7-1. The substance to be detected X may be a substance other than an antigen that has an "epitope," which means the site at which an antibody binds to the antigen. The substance to be detected X may also be a substance that contains multiple epitopes. An example of such a substance is the CD9/CD63 composite epitope.
被検出物質Xは、第1抗体B11との間で抗原抗体反応を起こすとともに、第2抗体B21との間で抗原抗体反応を起こす。そのため、被検出物質Xの存在下において、ビーズB1とビーズB2とは、被検出物質Xを介して結合する。図1では、ビーズB1が1つの第1抗体B11のみで修飾されている例を示す。しかし、実際のビーズB1は、より多くの第1抗体B11により修飾されている。ビーズB2についても同様である。そのため、被検出物質Xを含む試料に複数のビーズB1,B2が導入されると、複数のビーズB1,B2が抗原抗体反応により凝集することでビーズB1,B2の凝集体が形成される。The substance to be detected X undergoes an antigen-antibody reaction with the first antibody B11, and also undergoes an antigen-antibody reaction with the second antibody B21. Therefore, in the presence of the substance to be detected X, beads B1 and B2 bind via the substance to be detected X. FIG. 1 shows an example in which bead B1 is modified with only one first antibody B11. However, in actuality, bead B1 is modified with more first antibodies B11. The same is true for bead B2. Therefore, when multiple beads B1 and B2 are introduced into a sample containing the substance to be detected X, the multiple beads B1 and B2 aggregate due to the antigen-antibody reaction, forming an aggregate of beads B1 and B2.
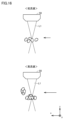
図2は、被検出物質Xの他の一例を示す図である。被検出物質Xは、表面に様々な膜タンパク質を有する細胞外ナノ粒子であってもよい。具体的には、細胞から分泌されるエクソソーム(細胞外小胞)を被検出物質Xとすることができる。大腸がん細胞、肺がん細胞、子宮頸がん細胞などのがん細胞由来のエクソソームが知られている。エクソソームは、バイオマーカーとして診断に利用するなど各種応用に向けた研究が進められている。図3には、4回膜貫通型の膜タンパク質(具体的にはテトラスパニン)を表面に有するエクソソームが模式的に例示されている。エクソソームの典型的なサイズは、直径30nm~150nm程度である。 Figure 2 is a diagram showing another example of the substance X to be detected. The substance X to be detected may be an extracellular nanoparticle having various membrane proteins on its surface. Specifically, the substance X to be detected may be an exosome (extracellular vesicle) secreted from a cell. Exosomes derived from cancer cells such as colon cancer cells, lung cancer cells, and cervical cancer cells are known. Research on exosomes is being conducted for various applications, such as using them as biomarkers for diagnosis. Figure 3 shows a schematic example of an exosome having a four-transmembrane membrane protein (specifically, tetraspanin) on its surface. The typical size of an exosome is about 30 nm to 150 nm in diameter.
図3は、他の被検出物質の検出原理を説明するための概念図である。被検出物質の種類によっては2種類のビーズは必ずしも必要ではない。図3に示す例では、1種類のビーズB3のみが準備される。ビーズB3は、ビーズ本体B0と、ビーズ本体B0を修飾する抗体B31とを含む。 Figure 3 is a conceptual diagram for explaining the detection principle of other detectable substances. Depending on the type of detectable substance, two types of beads are not necessarily required. In the example shown in Figure 3, only one type of bead B3 is prepared. Bead B3 includes bead body B0 and antibody B31 that modifies bead body B0.
この例における被検出物質Yも抗原であり、具体的には、たとえばフィブリノゲン・フィブリン分解産物(FDP:Fibrin/fibrinogen Degradation Products)である。複数のビーズB3と被検出物質Yとを組み合わせた場合にも、複数のビーズB3が被検出物質Yとの抗原抗体反応により凝集し、ビーズB3の凝集体が形成される。In this example, the substance Y to be detected is also an antigen, specifically, for example, fibrinogen/fibrin degradation products (FDP). When multiple beads B3 are combined with the substance Y to be detected, the multiple beads B3 aggregate due to an antigen-antibody reaction with the substance Y to be detected, and an aggregate of beads B3 is formed.
<検出システムの全体構成>
図4は、実施の形態1に係る抗原検出システムの全体構成を概略的に示す図である。以下では、CD80(図1参照)、エクソソーム(図2参照)等の被検出物質Xを検出するための構成について代表的に説明する。x方向およびy方向は水平方向を表す。x方向とy方向とは互いに直交する。z方向は鉛直方向を表す。重力の向きはz方向下方である。
<Overall configuration of detection system>
4 is a diagram showing a schematic overall configuration of the antigen detection system according to the first embodiment. In the following, a configuration for detecting a detection target substance X such as CD80 (see FIG. 1) and exosomes (see FIG. 2) will be representatively described. The x and y directions represent horizontal directions. The x and y directions are mutually orthogonal. The z direction represents a vertical direction. The direction of gravity is downward in the z direction.
図4を参照して、実施の形態1に係る抗原検出システム100は、XYZ軸ステージ10と、調整機構20と、シリンジポンプ30と、レーザ光源41と、照明光源42と、ダイクロイックミラー43と、対物レンズ50と、カメラ60と、コントローラ70とを備える。
Referring to Figure 4, the
XYZ軸ステージ10は、検出キット90を保持するように構成されている。検出キット90は、サンプルSPが流通するマイクロ流路92が基材91上に設けられたマイクロ流路チップである。サンプルSPとは、被検出物質Xを含む可能性がある液体試料である。検出キット90の詳細な構成については図5および図6にて説明する。検出キット90には、マイクロ流路92にサンプルSPを導入するための毛細管31と、マイクロ流路92からサンプルSPを排出するための毛細管32とが接続されている。なお、XYZ軸ステージ10は、本開示に係る「ホルダ」に相当する。The XYZ-
調整機構20は、コントローラ70からの指令に応じて、検出キット90が設置されたXYZ軸ステージ10のx方向、y方向およびz方向の位置を調整する。本実施の形態では対物レンズ50の位置が固定されている。そのため、XYZ軸ステージ10の位置を調整することにより、検出キット90と対物レンズ50との相対的な位置関係が調整される。調整機構20としては、たとえば、顕微鏡に付属のサーボモータおよび焦準ハンドルなどの駆動機構を用いることができるが、調整機構20の具体的な構成は特に限定されるものではない。調整機構20は、固定された検出キット90に対して対物レンズ50の位置を調整してもよい。The
図示しないが、抗原検出システム100にレーザ変位計を設けてもよい。レーザ変位計は、レーザ変位計のレーザ出射口と検出キット90との間の鉛直方向の距離を測定するとともに、検出キット90の水平方向の変位を測定する。調整機構20は、レーザ変位計の測定結果に基づいてXYZ軸ステージ10の位置を調整し、それによりレーザ光源41から出射されるレーザ光L1のビームウエストの位置(後述)を調整できる。Although not shown, a laser displacement meter may be provided in the
シリンジポンプ30は、マイクロ流路92の上流側に設けられた毛細管31に接続されている。シリンジポンプ30は、コントローラ70からの指令に応じて圧力駆動流を調節して毛細管31にサンプルSPを吐出することで、検出キット90にサンプルSPを流通させる。さらに、シリンジポンプ30は、圧力駆動流によるサンプルSPの流れの速さ(以下、「流速V」と記載する)を調整可能に構成されている。The
シリンジポンプ30は、本開示に係る「ポンプ」に相当する。「ポンプ」は、圧力、遠心力または回転力などの作用によりサンプルSPを送り出すことが可能に構成されていればよい。「ポンプ」が電動式であることは必須ではなく、手動式であってもよい。そのため、シリンジポンプ30に代えて、たとえばディスペンサまたはマイクロピペットを採用してもよい。The
レーザ光源41は、コントローラ70からの指令に応じてレーザ光L1を発する。レーザ光L1は、光誘起力を発生させることでサンプルSP中の微粒子を捕捉するために用いられる。レーザ光L1は、ビーズB1,B2の電子的共鳴の波長域から外れた波長を有する「非共鳴光」である。電子的共鳴の波長域は、ビーズB1,B2のサイズ(直径)によって異なる。実施の形態1におけるビーズB1,B2の直径は2μmである。この場合、ビーズB1,B2の電子的共鳴の波長域は、400nm未満の波長域である。一方、レーザ光L1の波長は、電子的共鳴の波長域外の波長であり、たとえば近赤外域に含まれる波長(実施の形態1では1064nm)である。このように、ビーズB1,B2の直径とレーザ光L1の波長との適切な組み合わせを採用することにより、レーザ光L1をビーズB1,B2に照射した場合にレーザ光L1がミー(Mie)散乱を起こす条件を満たすことができる。ミー散乱については図11にて詳細に説明する。なお、レーザ光源41は、本開示に係る「光源」に相当する。The
照明光源42は、コントローラ70からの指令に応じて、検出キット90内のサンプルSPを照らすための白色光L2を発する。一例として、ハロゲンランプを照明光源42として用いることができる。The
ダイクロイックミラー43は、レーザ光源41からのレーザ光L1を反射する一方で、照明光源42からの白色光L2を透過する。なお、ダイクロイックミラー43および対物レンズ50は、たとえば倒立型顕微鏡本体または正立型顕微鏡本体に組み込むことができる。The
対物レンズ50は、レーザ光源41から発せられ、ダイクロイックミラー43で反射したレーザ光L1を集光する。対物レンズ50により集光された光は、検出キット90(より詳細にはマイクロ流路92(図5参照))に照射される。対物レンズ50は、照明光源42から検出キット90に照射された白色光L2を取り込むためにも用いられる。対物レンズ50により取り込まれた白色光L2は、ダイクロイックミラー43によりカメラ60へと導かれる。The
カメラ60は、コントローラ70からの指令に応じて、白色光L2が照射された検出キット90内のサンプルSPを撮影し、撮影された画像をコントローラ70に出力する。カメラ60は、静止画を撮影するスチールカメラであってもよいし、動画を撮影するビデオカメラであってもよい。なお、カメラ60は、本開示に係る「受光器」に相当する。本開示に係る「受光器」は、画像データを出力する機器に限られず、フォトダイオード、光電子増倍管(PMT:Photomultiplier)などを含み得る。In response to a command from the
コントローラ70は、CPU(Central Processing Unit)などのプロセッサ71と、ROM(Read Only Memory)およびRAM(Random Access Memory)などのメモリ72と、入出力ポート73とを含むマイクロコンピュータである。コントローラ70は、抗原検出システム100内の各機器(調整機構20、シリンジポンプ30、レーザ光源41、照明光源42およびカメラ60)を制御する。また、コントローラ70は、カメラ60により撮影された画像に所定の画像処理を施すことで抗原を検出する「抗原検出処理」を実行する。コントローラ70による抗原検出処理については後に詳細に説明する。コントローラ70は、本開示に係る「演算装置」に相当する。The
なお、抗原検出システム100の光学系は、レーザ光源41からのレーザ光L1を検出キット90に照射することが可能であるととともに、検出キット90からの白色光L2をカメラ60に取り込むことが可能であれば、図4に示した構成に限定されるものではない。たとえば、後に図7にて説明するように、検出キット90に対するレーザ光L1の照射方向を適宜変更できる。抗原検出システム100の光学系は、ダイクロイックミラー43に代えてまたは加えて他の光学部品(ミラー、ビームスプリッタ、プリズム、光ファイバ等)を含んでもよい。抗原検出システム100において、調整機構20および照明光源42は必須の構成要素ではない。
The optical system of the
<検出キットの構成>
図5は、レーザ光L1の照射時における検出キット90の様子を示す模式図である。前述のように、検出キット90の基材91にはマイクロ流路92が形成されている。図5に示す例では、マイクロ流路92は、1つのインレット921に対して1つのアウトレット922が形成された非分岐型の流路である。以下では、マイクロ流路92におけるサンプルSPの流通方向をx方向とする。
<Configuration of detection kit>
Fig. 5 is a schematic diagram showing the state of the
検出キット90は、レーザ光L1および白色光L2に対して透明な材料で作成できる。好ましくは、検出キット90に用いられる材料は、たとえばガラスまたは石英のように、偏光であるレーザ光L1に対して異方性を示さない材料である。The
図6は、図5のVI-VI線に沿う検出キット90の断面図である。図6に示すように、マイクロ流路92の断面は、たとえば長方形形状を有する。一例として、長方形の横幅(流路幅、y方向の長さ)は350μmであり、長方形の高さ(z方向の長さ)は100μmである。サンプルSPは、マイクロ流路92を充填した状態(すなわち空気を含まない状態)でマイクロ流路92内を流通する。
Figure 6 is a cross-sectional view of the
図7は、レーザ光L1の照射時における検出キット90を撮影した画像である。マイクロ流路92中の微小な黒点の各々がビーズB1またはビーズB2である。サンプルSPの流通方向は、画像右側から左側に向かう方向(x方向)である。ビーズB1,B2の凝集体が画像中央付近に形成されていることを確認できる。
Figure 7 is an image of the
<上方照射および下方照射>
図8は、検出キット90へのレーザ光L1の照射態様を説明するための図である。本実施の形態においては、レーザ光L1が2通りの照射態様のうちのいずれかの態様により検出キット90に照射されるように、抗原検出システム100の光学系が構成されている。以下では、対物レンズ50を検出キット90の上方に配置し、検出キット90の上方から下方に向けてレーザ光L1を照射するレーザ光L1の照射態様を「下方照射」とも称する。反対に、対物レンズ50を検出キット90の下方に配置し、検出キット90の下方から上方に向けてレーザ光L1を照射するレーザ光L1の照射態様を「上方照射」とも称する。
<Upward and downward irradiation>
8 is a diagram for explaining the irradiation mode of the laser light L1 to the
対物レンズ50の焦点にレーザ光L1のビームウエストが形成される。ビームウエストにおけるビーム直径(最小スポット径φ0)は、たとえば数μm~数十μm程度である。最小スポット径φ0が大きいほど、マイクロ流路92を流れるサンプルSPに対するレーザ光L1の照射面積が大きくなる。よって、レーザ光L1の強度が十分高ければ、より多くのビーズB1,B2を集積できる可能性がある。また、最小スポット径φ0が大きいほど、レーザ光L1の照射を受けずにマイクロ流路92を通過してしまうビーズB1,B2の量を減らすことができる。
A beam waist of the laser light L1 is formed at the focal point of the
後述する一部の測定例(図15、図17、図18など)では、下方照射および上方照射のいずれにおいても、ビームウエストがマイクロ流路92の内部に位置するように、検出キット90と対物レンズ50との間の相対的な位置関係が調整される(フォーカス条件)。ビームウエストの高さは、レーザ光L1の波長および対物レンズ50の仕様(倍率等)から既知である。よって、調整機構20を用いてXYZ軸ステージ10の鉛直方向の位置を調整することで、狙った高さにビームウエストを調整できる。In some measurement examples (e.g., Figures 15, 17, and 18) described later, the relative positional relationship between the
下方照射において、マイクロ流路92の底面を基準(z=0)とした、レーザ光L1のビームウエストの鉛直方向の位置(z座標)をzbtmと記載する。たとえば、zbtm=0である場合、レーザ光L1のビームウエストがマイクロ流路92の底面に位置する。zbtm=50μmである場合、レーザ光L1のビームウエストがマイクロ流路92の底面よりも50μmだけ上方に位置する。一方、上方照射において、マイクロ流路92の上面を基準(z=0)とした、レーザ光L1のビームウエストの鉛直方向の位置(z座標)をztopと記載する。
In downward irradiation, the vertical position (z coordinate) of the beam waist of laser light L1 with the bottom surface of
なお、レーザ光L1の最小スポット径φ0は、対物レンズ50の倍率に加えて、ビームウエストの位置zbtm(またはztop)によっても異なり得る。ある測定例では、対物レンズ50の倍率が10倍であり、かつ、zbtm=0である場合に、最小スポット径φ0=4.66μmであった。対物レンズ50の倍率が10倍であり、かつ、zbtm=50μmである場合、最小スポット径φ0=19.7μmであった。
The minimum spot diameter φ 0 of the laser light L1 may vary depending on the position z btm (or z top ) of the beam waist in addition to the magnification of the
<凝集メカニズム>
図9は、検出キット90へのレーザ光L1の照射時におけるビーズB1,B2の凝集メカニズムを説明するための図である。レーザ光L1のビームウエストがサンプルSP中に位置するように調整した上でレーザ光L1を検出キット90に照射することで、光誘起力(より詳細には物質間光誘起力および勾配力)によりビーズB1,B2がビームウエストの近傍に集まる。これにより、ビームウエスト近傍におけるビーズB1,B2の密度が他の位置(ビームウエストから十分に離れた位置)におけるビーズB1,B2の密度と比べて局所的に高くなる。
<Agglomeration mechanism>
9 is a diagram for explaining the aggregation mechanism of beads B1 and B2 when the
被検出物質Xがビームウエストの周囲に存在する場合、図1にて説明したように、ビーズB1の表面に修飾された第1抗体B11と被検出物質Xとの間、および、ビーズB2の表面に修飾された第2抗体B21と被検出物質Xとの間で抗原抗体反応が起こり、ビーズB1とビーズB2とが被検出物質Xを介して結合する。抗原検出システム100では、シリンジポンプ30を用いてサンプルSPを流通させることで新たな被検出物質Xがビームウエストの周囲に次々に供給されるので、静止した液体中と比べて、抗原抗体反応が起こり易い。抗原抗体反応が繰り返されることでビーズB1,B2の凝集体が形成される。
When the detectable substance X is present around the beam waist, as explained in FIG. 1, an antigen-antibody reaction occurs between the first antibody B11 modified on the surface of bead B1 and the detectable substance X, and between the second antibody B21 modified on the surface of bead B2 and the detectable substance X, and beads B1 and B2 are bound to each other via the detectable substance X. In the
ビーズB1,B2の凝集体のサイズが増大するに従って、凝集体の周囲に存在する被検出物質Xが凝集体に遭遇する確率が高まるので、抗原抗体反応が起こる頻度が増加する。言い換えると、実施の形態1に係る抗原検出システム100によれば、レーザ光L1の照射によってビーズB1,B2の凝集を加速させる「光誘導加速」を実現できる。その結果、ビーズB1,B2が高密度に凝集した凝集体が短時間で形成される。そして、形成した凝集体を光学的に検出することで、サンプルSPが被検出物質Xを含むと迅速に判定できる。As the size of the aggregate of beads B1 and B2 increases, the probability that the target substance X present around the aggregate will encounter the aggregate increases, and therefore the frequency of antigen-antibody reactions increases. In other words, the
ビーズB1,B2には、物質間光誘起力および勾配力に加えて、散逸力がレーザ光L1の照射方向と同方向に作用する。上方照射の場合、ビーズB1,B2は、下方から上方への散逸力が作用することでマイクロ流路92の上面に押し付けられる。一方、下方照射の場合、ビーズB1,B2は、上方から下方への散逸力が作用することでマイクロ流路92の底面に押し付けられる。In addition to the inter-substance light-induced force and gradient force, a dissipation force acts on beads B1 and B2 in the same direction as the irradiation direction of laser light L1. In the case of upward irradiation, beads B1 and B2 are pressed against the upper surface of
ラテックスビーズの比重が1.04[g/cm3]程度と水の比重と同程度であるのに対し、磁性ビーズの比重は約1.6[g/cm3]である。磁性ビーズのように微粒子の比重(質量密度)が周囲の分散媒の比重(この例では純水)よりも十分に大きい場合、微粒子は、攪拌・静置後のサンプルSP中で沈降してマイクロ流路92の底面に近い位置に分散する傾向がある。そのため、マイクロ流路92の底面で凝集体を形成する下方照射の方が、マイクロ流路92の上面で凝集体を形成する上方照射よりも効果的であり、より効率良く微粒子の凝集体を形成できる。
While the specific gravity of latex beads is about 1.04 [g/cm 3 ], which is approximately the same as the specific gravity of water, the specific gravity of magnetic beads is about 1.6 [g/cm 3 ]. When the specific gravity (mass density) of the fine particles, such as magnetic beads, is sufficiently greater than the specific gravity of the surrounding dispersion medium (pure water in this example), the fine particles tend to settle in the sample SP after stirring and standing, and disperse to a position close to the bottom surface of the
図10は、ビーズB1,B2のサイズとレーザ光L1の波長との間の関係を説明するための概念図である。前述のように、ビーズB1,B2の典型的な直径は1μm~5μm程度(後述の実施例では約2μm)である。ビーズB1,B2の電子的共鳴の波長域は、ビーズB1,B2の直径に応じて定まり、上記の直径に対しては400nmよりも短波長側の波長域である。 Figure 10 is a conceptual diagram for explaining the relationship between the size of beads B1, B2 and the wavelength of laser light L1. As mentioned above, the typical diameter of beads B1, B2 is about 1 μm to 5 μm (about 2 μm in the example described below). The wavelength range of electronic resonance of beads B1, B2 is determined according to the diameter of beads B1, B2, and is a wavelength range on the shorter wavelength side than 400 nm for the above diameter.
レーザ光L1がビーズB1,B2の直径と比べて十分に長い波長(たとえば10倍以上の波長)を有する場合、レーザ光L1のほとんどはビーズB1,B2を素通りしてしまう。より詳細には、ビーズB1,B2に照射されたレーザ光L1は、レイリー(Rayleigh)散乱を起こす。レイリー散乱により生じる散逸力は、ビーズB1,B2の直径の6乗に比例する。そのため、レイリー散乱では弱い光誘起力しか発生しない。 When the laser light L1 has a wavelength that is sufficiently longer than the diameter of the beads B1 and B2 (for example, 10 times longer), most of the laser light L1 passes through the beads B1 and B2. More specifically, the laser light L1 irradiated to the beads B1 and B2 causes Rayleigh scattering. The dissipation force caused by Rayleigh scattering is proportional to the sixth power of the diameter of the beads B1 and B2. Therefore, only a weak light-induced force is generated by Rayleigh scattering.
これに対し、実施の形態1において、レーザ光L1は、電子的共鳴の波長域から外れた波長を有する非共鳴光である。具体的には、レーザ光L1は、1064nmの波長、すなわち、ビーズB1,B2の直径と同程度の波長を有する。In contrast, in the first embodiment, the laser light L1 is non-resonant light having a wavelength outside the wavelength range of electronic resonance. Specifically, the laser light L1 has a wavelength of 1064 nm, i.e., a wavelength approximately equal to the diameter of the beads B1 and B2.
図11は、ビーズB1,B2の消衰スペクトルの測定結果の一例を示す図である。図11には、上から順に、ビーズB1,B2の直径が5μmである場合、ビーズB1,B2の直径が2μmである場合、ビーズB1,B2の直径が1μmである場合の消衰スペクトルが示されている。なお、消衰スペクトルとは、散乱スペクトルと吸収スペクトルとを足し合わせたものである。 Figure 11 shows an example of the measurement results of the extinction spectrum of beads B1 and B2. From the top, Figure 11 shows the extinction spectrum when beads B1 and B2 have a diameter of 5 μm, when beads B1 and B2 have a diameter of 2 μm, and when beads B1 and B2 have a diameter of 1 μm. Note that the extinction spectrum is the sum of the scattering spectrum and the absorption spectrum.
図11より、ビーズB1,B2の直径が5μmまたは2μmである場合に、波長1064nm付近で特に大きな消衰が起こることが分かる。これは、レーザ光L1がビーズB1,B2の直径と同程度の波長を有する場合、レーザ光L1がビーズB1,B2に閉じ込められた後にミー散乱を起こすためである(図10参照)。 Figure 11 shows that when the diameter of beads B1 and B2 is 5 μm or 2 μm, particularly large extinction occurs at a wavelength of around 1064 nm. This is because when the laser light L1 has a wavelength similar to the diameter of beads B1 and B2, Mie scattering occurs after the laser light L1 is trapped in beads B1 and B2 (see Figure 10).
ミー散乱により生じる散逸力は、ビーズB1,B2の直径の2乗に比例するため、強い光誘起力が発生する。この強い光誘起力によって、より強力にマイクロ流路92の上面(上方照射の場合)または底面(下方照射の場合)にビーズB1,B2を押し付けることができる。その結果、より効率良くビーズB1,B2の凝集体を形成できる。
The dissipation force caused by Mie scattering is proportional to the square of the diameter of the beads B1 and B2, so a strong light-induced force is generated. This strong light-induced force can press the beads B1 and B2 more strongly against the top surface (in the case of upward irradiation) or bottom surface (in the case of downward irradiation) of the
このように、ビーズB1,B2の直径とレーザ光L1の波長との組み合わせは、ビーズB1,B2への照射時にレーザ光L1がミー散乱を起こすように選定することが望ましい。なお、ここでは、始めにビーズB1,B2の直径が決定され、その後、ビーズB1,B2の直径に応じてレーザ光L1の波長が選定されるように説明した。しかし、レーザ光L1の波長に応じて、使用するビーズB1,B2の直径を選定してもよい。In this way, it is desirable to select a combination of the diameter of the beads B1, B2 and the wavelength of the laser light L1 so that the laser light L1 causes Mie scattering when irradiating the beads B1, B2. Note that, here, it has been explained that the diameter of the beads B1, B2 is determined first, and then the wavelength of the laser light L1 is selected according to the diameter of the beads B1, B2. However, the diameter of the beads B1, B2 to be used may be selected according to the wavelength of the laser light L1.
<抗原検出フロー>
続いて、実施の形態1における2通りの抗原検出処理について説明する。第1の抗原検出処理は、サンプルSP中に被検出物質Xが含有されているかどうかを検出する処理である。第2の抗原検出処理は、サンプルSP中における被検出物質Xの含有濃度を定量する処理である。
<Antigen detection flow>
Next, two types of antigen detection processes in the first embodiment will be described. The first antigen detection process is a process for detecting whether or not the target substance X is contained in the sample SP. The second antigen detection process is a process for quantifying the concentration of the target substance X contained in the sample SP.
図12は、実施の形態1における第1の抗原検出処理を示すフローチャートである。図12および後述する図13に示すフローチャートは、所定条件の成立時(たとえばユーザが図示しない開始ボタンを操作したとき)に実行される。これらのフローチャートに含まれる各ステップは、基本的にはコントローラ70によるソフトウェア処理によって実現されるが、その一部または全部がコントローラ70内に作製されたハードウェア(電気回路)によって実現されてもよい。以下、ステップを「S」と略す。
Figure 12 is a flowchart showing the first antigen detection process in
なお、レーザ光L1のビームウエストの位置(マイクロ流路92の底面を基準(z=0)とした場合のz座標であるzbtm、または、マイクロ流路92の上面を基準(z=0)とした場合のz座標であるztop)は、所望の値に予め設定されているものとする。
It is to be noted that the position of the beam waist of the laser light L1 (z btm , which is the z coordinate when the bottom surface of the
図12を参照して、S101において、コントローラ70は、検出キット90をXYZ軸ステージ10上に設置する。この処理は、たとえば、検出キット90の送り機構(図示せず)により実現できる。ただし、ユーザが手作業で検出キット90を設置してもよい。
Referring to FIG. 12, in S101, the
S102において、コントローラ70は、検出キット90へのサンプルSPの流通を開始するようにシリンジポンプ30を制御する。この際、コントローラ70は、サンプルSPの流速Vが事前に実験的に求められた適切な流速となるようにシリンジポンプ30を制御することが好ましい。ここでの流速Vとは、サンプルSPの流速開始時から流通終了時までの流速の時間平均である。In S102, the
S103において、コントローラ70は、検出キット90へのレーザ光L1の照射を開始(または継続)するようにレーザ光源41を制御する。これにより、被検出物質XがサンプルSPに含まれていた場合、光誘起力により捕捉されたビーズB1,B2に被検出物質Xが遭遇して両者が結合することでビーズB1,B2の凝集体が形成される。ビーズB1,B2の凝集体は、レーザ光L1の照射時間が長くなるにつれて成長する。In S103, the
S104において、コントローラ70は、レーザ光L1の照射開始時からの経過時間が規定時間(後述する例では3分間または4分間)に達したか否かを判定する。コントローラ70は、光照射時間が規定時間に達していない場合(S4においてNO)には処理をS103に戻す。これにより、レーザ光L1の照射が継続される。光照射時間が規定時間に達すると(S104においてYES)、コントローラ70は、処理をS105に進める。In S104, the
S105において、コントローラ70は、検出キット90への白色光L2の照射を開始するように照明光源42を制御する。そして、コントローラ70は、レーザ光L1の照射位置における検出キット90の画像を撮影するようにカメラ60を制御する(S106)。In S105, the
S107において、コントローラ70は、S106にて撮影された画像に所定の画像処理を施すことで、ビーズB1,B2の凝集体が画像中に確認されたかどうかを判定する。この画像処理には、種々の公知の画像処理技術を用いることができる。たとえば、ビーズB1,B2の凝集体が形成された領域では、白色光L2の透過光が減少して画像の色が濃くなる(後述する図17等を参照)。そのため、画像の色が濃くなった領域の有無(または領域の面積の大小)に基づいて、ビーズB1,B2の凝集体が形成されたかどうかを判定できる。あるいは、パターン認識の技術を用いてビーズB1,B2の凝集体の形状の特徴を抽出することで、凝集体が形成されたかどうかを判定することも可能である。In S107, the
また、カメラに代えて他の受光器(フォトダイオードなど)を用いる場合には、受光器からの信号強度に基づいてビーズB1,B2の凝集体の有無を判定できる。より具体的には、ビーズB1,B2の凝集体が形成されると、白色光L2がビーズB1,B2の凝集体により遮られる。そのため、ビーズB1,B2の凝集体が形成された場合には、ビーズB1,B2の凝集体が形成されていない場合と比べて、受光器からの信号強度が低下する。したがって、レーザ光L1の照射継続中に受光器からの信号強度が低下したか否かによって、ビーズB1,B2の凝集体の有無を判定できる。Furthermore, when another light receiver (such as a photodiode) is used instead of a camera, the presence or absence of an aggregate of beads B1 and B2 can be determined based on the signal strength from the light receiver. More specifically, when an aggregate of beads B1 and B2 is formed, the white light L2 is blocked by the aggregate of beads B1 and B2. Therefore, when an aggregate of beads B1 and B2 is formed, the signal strength from the light receiver decreases compared to when an aggregate of beads B1 and B2 is not formed. Therefore, the presence or absence of an aggregate of beads B1 and B2 can be determined based on whether the signal strength from the light receiver decreases while the laser light L1 is being irradiated.
ビーズB1,B2の凝集体が確認された場合(S107においてYES)、コントローラ70は、被検出物質XがサンプルSPに含まれていると判定する(S108)。一方、ビーズB1,B2の凝集体が確認されなかった場合(S107においてNO)、コントローラ70は、被検出物質Xは非検出である(サンプルSPに含まれていない)と判定する(S109)。If an aggregate of beads B1 and B2 is confirmed (YES in S107), the
その後、コントローラ70は、サンプルSPの流通を停止するようにシリンジポンプ30を制御する(S110)。また、コントローラ70は、レーザ光L1の照射を停止するようにレーザ光源41を制御するとともに、白色光L2の照射を停止するように照明光源42を制御する(S111)。これにより、一連の処理が終了する。After that, the
なお、サンプルSPの流通を開始する処理(S102の処理)と、レーザ光L1の照射を開始する処理(S103の処理)と、白色光L2の照射を開始する処理(S105の処理)との順序は、適宜入れ替えることができる。たとえば、白色光L2の照射下で検出キット90の画像(ここでは動画)を撮影しながらサンプルSPの流通を開始し、その後にレーザ光L1の照射を開始してもよい。逆に、動画撮影中にレーザ光L1の照射を開始し、その後にサンプルSPの流通を開始してもよい。
The order of the process of starting distribution of the sample SP (process S102), the process of starting irradiation of the laser light L1 (process S103), and the process of starting irradiation of the white light L2 (process S105) can be switched as appropriate. For example, distribution of the sample SP may be started while an image (here, a video) of the
図13は、実施の形態1における第2の抗原検出処理を示すフローチャートである。図13を参照して、S201~S204の処理は、第1の抗原検出処理におけるS101~S104の処理(図12参照)とそれぞれ同様であるため、説明は繰り返さない。
Figure 13 is a flowchart showing the second antigen detection process in
S205において、コントローラ70は、レーザ光L1の照射を停止するようにレーザ光源41を制御する。さらに、コントローラ70は、レーザ光L1の照射停止後、所定時間(後述する例では10秒間)だけ待機する。In S205, the
S206において、コントローラ70は、検出キット90への白色光L2の照射を開始するように照明光源42を制御する。そして、コントローラ70は、レーザ光L1の照射位置における検出キット90の画像を撮影するようにカメラ60を制御する(S207)。In S206, the
S208において、コントローラ70は、S207にて撮影された画像に画像処理を施し、ビーズB1,B2が凝集することで画像の色が濃くなった領域の面積を算出する。以下、当該領域の面積を「凝集面積A」と記載する。凝集面積Aは、本開示に係る「凝集体のサイズを表す指標」の一例である。In S208, the
S209において、予め準備された検量線を用いることによって、S207にて算出された凝集面積Aから被検出物質Xの濃度を決定する。以下、被検出物質Xの濃度を「ターゲット濃度」と略す場合がある。In S209, the concentration of the target substance X is determined from the agglutination area A calculated in S207 by using a calibration curve prepared in advance. Hereinafter, the concentration of the target substance X may be abbreviated as "target concentration."
図14は、被検出物質Xの濃度を算出するための検量線の一例を示す概念図である。図14および後述する図15等において、横軸は被検出物質Xの濃度(ターゲット濃度)を表す。縦軸は、ビーズB1,B2の凝集面積Aを表す。 Figure 14 is a conceptual diagram showing an example of a calibration curve for calculating the concentration of the target substance X. In Figure 14 and Figure 15 described later, the horizontal axis represents the concentration of the target substance X (target concentration). The vertical axis represents the agglutination area A of beads B1 and B2.
ターゲット濃度とビーズB1,B2の凝集面積Aとの間には対応関係が存在する。図14に示すように、ターゲット濃度が高いほど、ビーズB1,B2の凝集面積Aも大きくなる。このような対応関係が測定条件(レーザ光L1の強度および照射時間、対物レンズ50の倍率、レーザ光L1のビームウエストの位置ztopまたはzbtmなどに関する条件)毎に事前実験により求められ、検量線としてコントローラ70のメモリ72に格納されている。したがって、コントローラ70は、測定条件に応じた検量線をメモリ72から読み出すことによって、ビーズB1,B2の凝集面積Aからターゲット濃度を決定できる。
There is a correspondence relationship between the target concentration and the agglutination area A of the beads B1 and B2. As shown in Fig. 14, the higher the target concentration, the larger the agglutination area A of the beads B1 and B2. Such a correspondence relationship is obtained by a preliminary experiment for each measurement condition (conditions related to the intensity and irradiation time of the laser light L1, the magnification of the
図13に戻り、その後のS210,S211の処理は、図12に示したフローチャートにおけるS110,S111の処理とそれぞれ同様である。S211の処理の終了に伴い、一連の処理が終了する。なお、検出キット90の画像撮影に先立ってレーザ光L1の照射を停止して待機する処理(S206の処理)は必須ではない。この待機処理の効果については後述する。Returning to FIG. 13, the subsequent processes of S210 and S211 are similar to the processes of S110 and S111 in the flowchart shown in FIG. 12. The series of processes ends with the end of the process of S211. Note that the process of stopping the irradiation of the laser light L1 and waiting prior to taking an image of the detection kit 90 (the process of S206) is not essential. The effect of this waiting process will be described later.
以下の実施例1~4においては、抗原検出システム100を用いた被検出物質の検出結果(被検出物質の濃度測定結果)について説明する。実施例1~4では、2種類のビーズB1,B2を用いて被検出物質Xの濃度を測定した。被検出物質XはCD80であり、ビーズB1,B2の表面を抗CD80抗体により修飾した。In the following Examples 1 to 4, the detection results of the target substance (measurement results of the concentration of the target substance) using the
[実施例1]
<ターゲット抗原の濃度依存性>
図15は、被検出物質XがCD80である場合のターゲット濃度とビーズB1,B2の凝集面積Aとの間の関係の測定結果を示す図である。図15には、下方照射におけるマイクロ流路92の底面からのレーザ光L1のビームウエストの位置zbtmを2通り(zbtm=0μm,50μm)に設定し、かつ、サンプルSPの流速Vを2通り(V=47.6[μm/s],476[μm/s])に設定した場合(つまり、位置zbtmと流速Vとの組合せにより4通りの測定条件が存在する場合)の測定結果が示されている。
[Example 1]
<Target antigen concentration dependence>
Fig. 15 is a diagram showing the measurement results of the relationship between the target concentration and the agglutination area A of beads B1, B2 when the detected substance X is CD80. Fig. 15 shows the measurement results when the position z btm of the beam waist of laser light L1 from the bottom surface of
図15および後述する図18等において、エラーバーは、各ターゲット濃度において複数回の測定を行った結果の測定誤差、具体的にはビーズB1,B2の凝集面積Aの標準偏差を表している。図15では、流速V=47.6[μm/s]である場合については4回の測定結果のエラーバーが示されており、流速V=476[μm/s]である場合については3回の測定結果のエラーバーが示されている。 In Figure 15 and Figure 18 described later, the error bars represent the measurement error of the results of multiple measurements at each target concentration, specifically the standard deviation of the agglomeration area A of beads B1 and B2. In Figure 15, the error bars of four measurement results are shown for the flow velocity V = 47.6 [μm/s], and the error bars of three measurement results are shown for the flow velocity V = 476 [μm/s].
0[pg/mL]~250[pg/mL]の濃度範囲で5通りのターゲット濃度(被検出物質Xの質量濃度)を準備した。いずれの濃度も極めて低濃度であり、サンプルSPに含まれる被検出物質Xの量は極微量である。対物レンズ50の倍率は10倍であった。Five target concentrations (mass concentration of the substance X to be detected) were prepared in the range of 0 [pg/mL] to 250 [pg/mL]. All concentrations were extremely low, and the amount of the substance X to be detected contained in the sample SP was extremely small. The magnification of the
図15を参照して、4通りの測定条件のいずれにおいても、基本的に、ターゲット濃度の増大とともにビーズB1,B2の凝集面積Aが増加するという、図14に示したような比例傾向を確認できた。これにより、凝集面積Aからターゲット濃度を検出可能であることが裏付けられたと言える。その一方で、多くのターゲット濃度においてエラーバーが長いことから、測定条件の最適化に改善の余地があることが分かる。 Referring to Figure 15, it was confirmed that, under all four measurement conditions, the agglutination area A of beads B1 and B2 basically increases with increasing target concentration, a proportional trend as shown in Figure 14. This confirms that the target concentration can be detected from the agglutination area A. On the other hand, the long error bars at many target concentrations indicate that there is room for improvement in optimizing the measurement conditions.
[実施例2]
<サンプルの流速の影響>
図16は、サンプルSPの流速VがビーズB1,B2の凝集に及ぼす影響を説明するための概念図である。ビーズB1,B2と被検出物質Xとが遭遇して結合するかどうかは確率的な事象である。しかし、流速Vが遅い場合(たとえばV=47.6[μm/s]である場合)、レーザ光L1のビームウエストに対するビーズB1,B2および被検出物質Xの単位時間当たりの供給量が相対的に少ないため、ビーズB1,B2と被検出物質Xとの遭遇確率が低い。よって、数分間の光照射時間が経過するまでの間にビーズB1,B2が被検出物質Xを介して結合して凝集体の成長がある程度進む場合もあれば、ビーズB1,B2と被検出物質Xとが遭遇せずにビーズB1,B2があまり結合できず、凝集体の成長が進みにくい場合もある(上図参照)。したがって、流速Vが過度に低流速(V=47.6[μm/s])である場合にはエラーバーが大きくなると考えられる。
[Example 2]
<Effect of sample flow rate>
16 is a conceptual diagram for explaining the effect of the flow velocity V of the sample SP on the aggregation of beads B1 and B2. Whether or not the beads B1 and B2 encounter and bind to the target substance X is a probabilistic event. However, when the flow velocity V is slow (for example, when V=47.6 [μm/s]), the supply amount per unit time of the beads B1 and B2 and the target substance X to the beam waist of the laser light L1 is relatively small, so the probability of the beads B1 and B2 encountering the target substance X is low. Therefore, during the light irradiation time of several minutes, the beads B1 and B2 may bind to the target substance X and the growth of the aggregate may progress to a certain extent, or the beads B1 and B2 may not encounter the target substance X and the beads B1 and B2 may not be able to bind to each other, and the growth of the aggregate may not progress (see the upper figure). Therefore, when the flow velocity V is excessively low (V=47.6 [μm/s]), the error bar is considered to be large.
一方、流速Vが速い場合(たとえばV=476[μm/s]である場合)には、ビーズB1,B2および被検出物質Xの単位時間当たりの供給量が相対的に多い。そのため、3分間の光照射時間の間にビーズB1,B2の凝集体の成長が進みやすい。しかしながら、ビーズB1,B2の凝集体が高流速の流体から受ける抵抗も大きいので、一旦、形成されつつあった凝集体が分裂する(凝集体の一部が千切れる)可能性がある(下図参照)。分裂して流される凝集体のサイズがばらつくため、残る側の凝集体のサイズもばらつく。したがって、流速Vが過度に高流速(V=476[μm/s])である場合にもエラーバーが大きくなると考えられる。On the other hand, when the flow velocity V is fast (for example, when V = 476 [μm/s]), the supply amount of beads B1, B2 and the substance to be detected X per unit time is relatively large. Therefore, the growth of aggregates of beads B1 and B2 is likely to proceed during the three-minute light irradiation time. However, since the resistance that the aggregates of beads B1 and B2 receive from the high-velocity fluid is also large, there is a possibility that the aggregates that were once formed will break up (part of the aggregate will break off) (see the figure below). Since the size of the aggregates that break up and flow away varies, the size of the remaining aggregates also varies. Therefore, it is thought that the error bar will also be large when the flow velocity V is excessively high (V = 476 [μm/s]).
このような理由により、流速Vには、たとえば、マイクロ流路92の特性(流路内壁の形状、親水性/疎水性など)、ビーズB1,B2の特性(形状、サイズ、濃度、親水性/疎水性、帯電など)、サンプルSPの特性(溶媒の粘度など)に応じて、適切な範囲が存在する。よって、抗原検出処理の実行開始に先立ち、流速Vを最適化しておくことが望ましい。シリンジポンプ30からの流速Vは、サンプルSPの流通開始に先立ち、ビーズB1,B2と被検出物質Xとが特異的に結合して凝集体の成長が進む最適な流速に調整される。また、後に実施例10(図44参照)にて説明するように、流速Vを所望の値の付近で高精度に調整可能なシリンジポンプ30を採用することが望ましい。For this reason, there is an appropriate range for the flow rate V, depending on, for example, the characteristics of the microchannel 92 (shape of the inner wall of the channel, hydrophilicity/hydrophobicity, etc.), the characteristics of the beads B1 and B2 (shape, size, concentration, hydrophilicity/hydrophobicity, charge, etc.), and the characteristics of the sample SP (viscosity of the solvent, etc.). Therefore, it is desirable to optimize the flow rate V before starting the antigen detection process. The flow rate V from the
[実施例3]
<レーザ光の照射方向の影響>
次に、レーザ光L1を上方照射した場合の測定結果を、レーザ光L1を下方照射の場合の測定結果(図15参照)と比較する。
[Example 3]
<Influence of the laser light irradiation direction>
Next, the measurement results when the laser light L1 is irradiated upward are compared with the measurement results when the laser light L1 is irradiated downward (see FIG. 15).
図17は、被検出物質がCD80であり、レーザ光L1を検出キット90の下方から上方に向けて照射した場合(上方照射時)におけるレーザスポット近傍の画像を示す図である。この例においても倍率10倍の対物レンズ50を用いた。また、マイクロ流路92の上面を基準としたビームウエストの位置ztop=0μmに設定した。さらに、サンプルSPの流速Vを119[μm/s]に設定した。サンプルSPの流通方向は、図中右側から左側に向かう方向であった。
17 is a diagram showing an image in the vicinity of the laser spot when the substance to be detected is CD80 and the laser light L1 is irradiated from below to above the detection kit 90 (upward irradiation). In this example, an
上方照射においても、ターゲット濃度が高いほど、ビーズB1,B2の凝集面積Aが大きくなる傾向が確認された。また、ビーズB1,B2の凝集体の形状がサンプルSPの流通方向に伸びた形状となることも分かった。 In the case of upward irradiation, it was confirmed that the higher the target concentration, the larger the agglomeration area A of beads B1 and B2 tends to be. It was also found that the shape of the agglomerates of beads B1 and B2 becomes elongated in the flow direction of sample SP.
図18は、図17に示す画像から求められた、被検出物質XがCD80である場合のターゲット濃度と凝集面積Aとの間の関係を示す図である。図18には4回の測定結果の平均およびエラーバーが示されている。図18より、上方照射においても下方照射と同様に、ターゲット濃度と凝集面積Aとの間の対応関係(検量線)を取得可能であることが理解される。 Figure 18 is a diagram showing the relationship between the target concentration and the agglutination area A when the substance to be detected X is CD80, obtained from the image shown in Figure 17. The average and error bars of the results of four measurements are shown in Figure 18. It can be seen from Figure 18 that the correspondence relationship (calibration curve) between the target concentration and the agglutination area A can be obtained with upward irradiation, as with downward irradiation.
下方照射時には、レーザ光L1の散逸力がビーズB1,B2に対して上方から下方に向けて作用する。ビーズB1、2の比重は水の比重と同程度(0.98~1.04[g/cm3])であるものの、凝集体を形成したビーズB1,B2はマイクロ流路92の底面に堆積または沈降しやすい。このことが凝集面積Aの算出結果に誤差を生じさせる要因となり得る。そこで、ビーズB1,B2の堆積または沈降を防ぎ、この誤差要因を取り除くことを目的に、下方照射に代えて上方照射を採用することも考えられる。しかし、上方照射により得られた凝集面積Aのエラーバーは、下方照射により得られた凝集面積Aのエラーバー(図15参照)と同程度の長さであった。
During downward irradiation, the dissipation force of the laser light L1 acts on the beads B1 and B2 from above to below. Although the specific gravity of the beads B1 and B2 is approximately the same as that of water (0.98 to 1.04 [g/cm 3 ]), the beads B1 and B2 that have formed an aggregate tend to accumulate or settle on the bottom surface of the
図19は、上方照射時においても凝集面積Aに誤差が生じる理由を説明するための概念図である。レーザ光L1のビームウエストの位置に形成されたビーズB1,B2の凝集体に、サンプルSPの流通とともに新たなビーズB1,B2が供給されて結合することで、凝集体が成長する。この際、重力の影響により、凝集体は、ビームウエストの上方には伸びにくく、ビームウエストの下方には伸びやすい。凝集体がビームウエストの下方に伸びると、凝集体を鉛直方向に観察したときに、凝集体を構成するビーズB1,B2が互いに重複することになる。この重複部分は、凝集面積Aに反映されないので、実際の凝集体のサイズと凝集面積Aとの間に誤差を生じさせ、凝集面積Aの算出精度を低下させ得る(詳細については後述する図25の説明も参照)。 Figure 19 is a conceptual diagram for explaining why an error occurs in the agglomeration area A even when irradiating from above. The aggregate of beads B1 and B2 formed at the position of the beam waist of the laser light L1 grows as new beads B1 and B2 are supplied and bonded to the aggregate along with the circulation of the sample SP. At this time, due to the influence of gravity, the aggregate is less likely to extend above the beam waist and is more likely to extend below the beam waist. If the aggregate extends below the beam waist, the beads B1 and B2 constituting the aggregate will overlap each other when the aggregate is observed in the vertical direction. This overlapping portion is not reflected in the agglomeration area A, so it may cause an error between the actual size of the aggregate and the agglomeration area A, reducing the calculation accuracy of the agglomeration area A (see also the explanation of Figure 25 below for details).
[実施例4]
<対物レンズの倍率の影響>
続いて、対物レンズ50の倍率がビーズB1,B2の凝集体に与える影響について説明する。以下では、倍率が10倍の対物レンズ50を「10倍レンズ」とも記載し、倍率が40倍の対物レンズ50を「40倍レンズ」とも記載する。
[Example 4]
<Effect of objective lens magnification>
Next, we will explain the effect that the magnification of the
図20は、被検出物質XがCD80であり、10倍レンズを用いた場合におけるレーザスポット近傍の画像を示す図である。図21は、被検出物質XがCD80であり、40倍レンズを用いた場合におけるレーザスポット近傍の画像を示す図である。図20および図21には、ターゲット濃度を0[pg/mL]から2.5[ng/mL](=2500[pg/mL])までの濃度範囲で6通りに設定し、下方照射により取得された画像が示されている。また、図20および図21において、左側の画像は、レーザ光L1を3分間照射した後に取得された画像である。右側の画像は、3分間のレーザ光L1の照射後にレーザ光L1の照射を停止し、その後、10秒間が経過したときに取得された画像である。 Figure 20 shows an image near the laser spot when the substance X to be detected is CD80 and a 10x lens is used. Figure 21 shows an image near the laser spot when the substance X to be detected is CD80 and a 40x lens is used. Figures 20 and 21 show images obtained by downward irradiation with six target concentrations set in the concentration range from 0 [pg/mL] to 2.5 [ng/mL] (= 2500 [pg/mL]). In addition, in Figures 20 and 21, the image on the left is an image obtained after irradiating the laser light L1 for three minutes. The image on the right is an image obtained when the irradiation of the laser light L1 is stopped after 3 minutes of irradiation of the laser light L1 and 10 seconds have passed.
図20および図21に示すように、実施の形態1においては、光誘導加速によって3分間程度でビーズB1,B2の凝集体が観察された。つまり、被検出物質X(CD80)の検出に要する時間は、わずか3分程度であった。光誘導加速を行わない手法(たとえばELISA法)では検出時間が約2時間であることを考えると、実施の形態1によれば被検出物質Xの検出時間が大幅に短縮されていることが分かる。20 and 21, in
また、ターゲット濃度が等しい条件下で比較すると、40倍レンズを用いた場合には、10倍レンズを用いた場合と比べて、ビーズB1,B2の凝集体のサイズが大きくなる様子が観察された。その理由は以下のように考えられる。40倍レンズを用いた場合には、10倍レンズを用いた場合と比べて、ビームウエストのサイズが小さい分だけビームウエストにおける電場強度および電場強度勾配が強くなる。そうすると、ビーズB1,B2に作用する光誘起力(物質間光誘起力および勾配力)が強くなるので、ビーズB1,B2が凝集しやすい。 Furthermore, when comparing under conditions of equal target concentrations, it was observed that the size of the aggregates of beads B1 and B2 was larger when a 40x lens was used than when a 10x lens was used. The reason for this is thought to be as follows. When a 40x lens is used, the electric field intensity and electric field intensity gradient at the beam waist are stronger because the size of the beam waist is smaller than when a 10x lens is used. This makes it easier for beads B1 and B2 to aggregate, as the light-induced force (inter-substance light-induced force and gradient force) acting on beads B1 and B2 is stronger.
図22は、図20および図21に示す画像から求められた、被検出物質XがCD80である場合のターゲット濃度とビーズB1,B2の凝集面積Aとの間の関係を示す図である。図22には4回の測定結果の平均およびエラーバーが示されている。マイクロ流路92の底面を基準としたビームウエストの位置zbtm=0μmに設定した。サンプルSPの流速Vは119[μm/s]に設定した。
Fig. 22 is a diagram showing the relationship between the target concentration and the agglutination area A of beads B1, B2 when the substance to be detected X is CD80, obtained from the images shown in Fig. 20 and Fig. 21. The average and error bars of the results of four measurements are shown in Fig. 22. The position of the beam waist based on the bottom surface of the
図22を参照して、10倍レンズを用いた場合には、ターゲット濃度が高いほど、ビーズB1,B2の凝集面積Aが大きくなる傾向が確認された。ただし、ターゲット濃度が250[pg/mL]から2500[pg/mL]に増大しても、それに伴う凝集面積Aの増加は比較的小さかった。そのため、ターゲット濃度をより高濃度にしても凝集面積Aが単調には増加しなくなる可能性がある。 With reference to Figure 22, when a 10x lens was used, it was confirmed that the higher the target concentration, the larger the agglutination area A of beads B1 and B2 tended to be. However, even when the target concentration was increased from 250 [pg/mL] to 2500 [pg/mL], the corresponding increase in agglutination area A was relatively small. Therefore, even if the target concentration was increased to a higher concentration, it is possible that the agglutination area A will no longer increase monotonically.
また、有意差検定を行うと、ターゲット濃度25[pg/mL]の群の両側確率は0.011となった。両側確率が0.05(=5%)以内であることから、25[pg/mL]の群と2.5[pg/mL]の群との間に有意な差があることが確認された。したがって、この実施例における被検出物質X(CD80)の検出限界は2.5[pg/mL]と見積もられた。光誘導加速を行わないELISA法の検出限界が約20[pg/mL]であるので、本実施例における被検出物質Xの検出限界が1桁程度低濃度である(すなわち、検出感度が1桁高い)ことが分かる。 Furthermore, when a significance test was performed, the two-sided probability of the group with a target concentration of 25 [pg/mL] was 0.011. Since the two-sided probability was within 0.05 (= 5%), it was confirmed that there was a significant difference between the 25 [pg/mL] group and the 2.5 [pg/mL] group. Therefore, the detection limit of the target substance X (CD80) in this example was estimated to be 2.5 [pg/mL]. Since the detection limit of the ELISA method without light-induced acceleration is approximately 20 [pg/mL], it can be seen that the detection limit of the target substance X in this example is about one order of magnitude lower (i.e., the detection sensitivity is one order of magnitude higher).
一方、40倍レンズを用いた場合、ターゲット濃度が2500[pg/mL]のときの凝集面積Aが、ターゲット濃度が250[pg/mL]のときの凝集面積Aよりも小さくなった。また、ターゲット濃度が250[pg/mL]または2500[pg/mL]である場合のエラーバーが非常に大きくなった。これは、40倍レンズの使用によりビーズB1,B2の凝集体が過度に大きく成長する結果、ビーズB1,B2の凝集体の一部が分裂してサンプルSPの流通方向に流されてしまったためと考えられる。On the other hand, when the 40x lens was used, the agglutination area A when the target concentration was 2500 [pg/mL] was smaller than the agglutination area A when the target concentration was 250 [pg/mL]. Also, the error bars when the target concentration was 250 [pg/mL] or 2500 [pg/mL] were very large. This is thought to be because the use of the 40x lens caused the aggregates of beads B1 and B2 to grow excessively large, causing some of the aggregates of beads B1 and B2 to break up and flow in the direction of the flow of sample SP.
[実施例5]
<FDPの濃度依存性>
実施例5~実施例7では、被検出物質Yがフィブリノゲン・フィブリン分解産物(FDP)である場合の濃度測定結果について説明する。図3にて説明したように、被検出物質Y(FDP)の検出には、1種類の抗FDP抗体により修飾されたビーズB3が用いられる。
[Example 5]
<FDP concentration dependence>
In Examples 5 to 7, the concentration measurement results when the target substance Y is fibrinogen-fibrin degradation products (FDP) will be described. As described in FIG. 3, beads B3 modified with one type of anti-FDP antibody are used to detect the target substance Y (FDP).
図23は、被検出物質YがFDPである実施例2におけるレーザスポット近傍の画像を示す図である。図23および後述する図26には、被検出物質Yの濃度(ターゲット濃度)を0[ng/mL]~120[μg/mL]の濃度範囲で6通りに設定した場合に、各ターゲット濃度において取得された画像が示されている。また、図23の左側は、レーザ光L1を3分間下方照射した後に取得された画像を示す。右側は、3分間のレーザ光L1の下方照射後にレーザ光L1の照射を停止し、さらに10秒間が経過したときに取得された画像を示す。 Figure 23 shows an image near the laser spot in Example 2, in which the substance Y to be detected is FDP. Figure 23 and Figure 26, which will be described later, show images acquired at each target concentration when the concentration (target concentration) of the substance Y to be detected was set in six different ways in the range of 0 [ng/mL] to 120 [μg/mL]. The left side of Figure 23 shows an image acquired after irradiating the laser light L1 downward for three minutes. The right side shows an image acquired when the irradiation of the laser light L1 was stopped after three minutes of downward irradiation of the laser light L1 and a further 10 seconds had passed.
図23に示すように、被検出物質YがFDPである場合にも、ビーズB3の凝集体が確認された。As shown in Figure 23, aggregates of beads B3 were also observed when the detected substance Y was FDP.
図24は、被検出物質YがFDPである場合のターゲット濃度とビーズB3の凝集面積Aとの間の関係を示す図である。この例では、下方照射において、サンプルSPの流速Vを2通り(V=47.6[μm/s],119[μm/s])に設定した。また、3分間のレーザ光L1の照射後に10秒待機した場合としなかった場合とを比較した。エラーバーは、各測定条件下で4回測定した場合の測定誤差を表す。 Figure 24 shows the relationship between the target concentration and the agglutination area A of bead B3 when the substance Y to be detected is FDP. In this example, the flow velocity V of the sample SP was set to two values (V = 47.6 [μm/s], 119 [μm/s]) for downward irradiation. In addition, a comparison was made between a case where a 10-second wait was performed after irradiation with laser light L1 for three minutes and a case where no wait was performed. The error bars represent the measurement error when measurements were performed four times under each measurement condition.
図24を参照して、いずれの測定条件においても、ターゲット濃度が12[μg/mL]である場合の凝集面積Aは、ターゲット濃度が0.12[μg/mL](=120[ng/mL])以下である場合の凝集面積Aと異なる。よって、ターゲット濃度が12[μg/mL]である場合には測定条件にかかわらず被検出物質Yを検出可能であることが分かる。24, under any measurement condition, the agglutination area A when the target concentration is 12 [μg/mL] is different from the agglutination area A when the target concentration is 0.12 [μg/mL] (= 120 [ng/mL]) or less. Therefore, it can be seen that when the target concentration is 12 [μg/mL], the target substance Y can be detected regardless of the measurement condition.
その中でも右下図に示すように、流速Vを119[μm/s]に設定し、かつ、3分間のレーザ光L1の照射後に10秒間待機した場合には、ターゲット濃度が1.2[μg/mL]である場合にも被検出物質Yを検出できている可能性がある。このように、レーザ光L1の照射停止後に10秒間の待機時間を設けることで、待機時間を設けない場合(左下図参照)と比べて、被検出物質Yの検出精度が向上し、検出可能な被検出物質Yの濃度の範囲が広くなっている(検出限界がより低濃度になっている)可能性がある。Among these, as shown in the lower right diagram, when the flow velocity V is set to 119 [μm/s] and a 10-second wait is performed after irradiation with the laser light L1 for 3 minutes, it is possible that the target substance Y can be detected even when the target concentration is 1.2 [μg/mL]. In this way, by providing a 10-second wait time after stopping irradiation of the laser light L1, it is possible that the detection accuracy of the target substance Y is improved and the range of detectable concentrations of the target substance Y is wider (the detection limit is lower) than when no wait time is provided (see the lower left diagram).
[実施例6]
<待機時間の設定>
図25は、レーザ光L1の照射停止後に待機時間を設ける意味を説明するための概念図である。待機時間を設けることで被検出物質Yの検出精度が向上する理由としては以下の2点が考えられる。
[Example 6]
<Waiting time setting>
25 is a conceptual diagram for explaining the meaning of providing a waiting time after the irradiation of the laser light L1 is stopped. There are two possible reasons why the detection accuracy of the target substance Y is improved by providing a waiting time.
第1に、レーザ光L1の照射開始後、時間の経過に伴い、ビーズB3の凝集体の成長が進む。レーザ光L1の照射開始後に3分間が経過した時点では、レーザ光L1の光誘起力によりビームウエスト近傍に捕捉されているもののビーズB3の凝集体には結合していないビーズB3が存在する。このような未結合のビーズB3の量には測定毎のばらつきが大きい。よって、未結合のビーズB3は、凝集面積Aを算出する上で誤差要因となり得る。レーザ光L1の照射停止後に待機時間を設けることで、未結合のビーズB3がサンプルSPの流通方向に流されるので、誤差要因が低減される。First, after the start of irradiation of the laser light L1, the growth of the aggregate of beads B3 progresses with the passage of time. At the point where three minutes have passed since the start of irradiation of the laser light L1, there are beads B3 that are captured near the beam waist by the light-induced force of the laser light L1 but are not bound to the aggregate of beads B3. The amount of such unbound beads B3 varies greatly from measurement to measurement. Therefore, the unbound beads B3 can be a source of error in calculating the aggregation area A. By providing a waiting time after the end of irradiation of the laser light L1, the unbound beads B3 are caused to flow in the flow direction of the sample SP, thereby reducing the source of error.
第2に、ターゲット濃度と直接的に相関するパラメータは、ビーズB3の凝集体の3次元的なサイズ(体積)である。しかし、1台のカメラ60で凝集体の3次元形状を撮影するのは困難である。そのため、ターゲット濃度の定量に、ビーズB3の凝集体のサイズに代えて、その凝集体を水平面上に射影した面積である凝集面積Aを用いている。ここで、ビーズB3の凝集体には、鉛直方向(z方向)に互いに重複する部分が存在するが、このような重複部分はカメラ60では撮影されない。したがって、重複部分の大小は凝集面積Aに反映されず、凝集体のサイズと凝集面積Aとの対応が悪化する可能性がある。待機期間中には、レーザ光L1の照射停止直後と比べて、重複部分がサンプルSPの流通方向(x方向)に伸びることで、重複部分が小さくなる。その結果、ビーズB3の凝集体のサイズと凝集面積Aとの対応を改善できる。Secondly, the parameter directly correlated with the target concentration is the three-dimensional size (volume) of the aggregate of beads B3. However, it is difficult to capture the three-dimensional shape of the aggregate with one
以上の2つの理由により、待機時間を設けることで、ビーズB3の凝集面積Aからターゲット濃度をより正確に定量することが可能になる。 For the above two reasons, by providing a waiting time, it becomes possible to more accurately quantify the target concentration from the agglomeration area A of bead B3.
[実施例7]
<照射方向依存性および光照射時間の影響>
図26は、被検出物質YがFDPである場合の上方照射時におけるターゲット濃度とビーズB3の凝集面積Aとの間の関係を示す図である。図26の左側は、レーザ光L1を4分間照射した後に取得された画像を示す。右側は、4分間のレーザ光L1の照射後にレーザ光L1の照射を停止し、その後、10秒間が経過したときに取得された画像を示す。
[Example 7]
<Irradiation direction dependency and effect of light irradiation time>
Fig. 26 is a diagram showing the relationship between the target concentration and the agglutination area A of beads B3 during upward irradiation when the substance Y to be detected is FDP. The left side of Fig. 26 shows an image acquired after 4 minutes of irradiation with laser light L1. The right side shows an image acquired 10 seconds after the irradiation with laser light L1 was stopped after 4 minutes of irradiation with laser light L1.
図27は、図26に示す画像から求められた、被検出物質YがFDPである場合のターゲット濃度とビーズB3の凝集面積Aとの間の関係を示す図である。図27を参照して、上方照射においては、レーザ光L1の照射後に待機時間を設けた場合(下図参照)のエラーバーの長さは、待機時間を設けなかった場合(上図参照)のエラーバーの長さと同程度であった。これより、上方照射時には下方照射時(図24参照)とは異なり、待機時間を設ける効果が小さいことが分かる。 Figure 27 is a diagram showing the relationship between the target concentration and the agglutination area A of bead B3 when the substance to be detected Y is FDP, as determined from the image shown in Figure 26. Referring to Figure 27, in the case of upward irradiation, the length of the error bar when a waiting time was provided after irradiation with laser light L1 (see the lower figure) was approximately the same as the length of the error bar when no waiting time was provided (see the upper figure). This shows that, unlike in the case of downward irradiation (see Figure 24), the effect of providing a waiting time is small when irradiating from above.
また、図24と図27とを比較すると、レーザ光L1の照射時間を3分間から4分間に長くしたことで、各ターゲット濃度におけるエラーバーが短くなった。これにより、測定条件最適化の一環としてレーザ光L1の照射時間の最適化が重要であることが分かる。 In addition, comparing Figure 24 with Figure 27, the error bars for each target concentration became shorter by lengthening the irradiation time of the laser light L1 from 3 minutes to 4 minutes. This shows that optimizing the irradiation time of the laser light L1 is important as part of optimizing the measurement conditions.
[実施例8]
<デフォーカス条件>
実施例8,9では、被検出物質XがCD80またはCD9/CD63複合エピトープである場合において、レーザ光L1のビームウエストがマイクロ流路92を外れた条件下で光誘導加速を実施した結果について説明する。以下、この条件を「デフォーカス条件」とも呼ぶ。
[Example 8]
<Defocus conditions>
In Examples 8 and 9, when the substance to be detected X is CD80 or a CD9/CD63 composite epitope, the results of performing light-induced acceleration under the condition that the beam waist of the laser light L1 is outside the
図28は、デフォーカス条件を説明するための図である。図28を参照して、デフォーカス条件とは、より詳細には、レーザ光L1のビームウエストがマイクロ流路92よりもレーザ光L1の照射方向後方に位置するとの条件である。図28には、下方照射において、ビームウエストがマイクロ流路92の底面よりも下方に位置する条件が図示されている。この条件は、マイクロ流路92の底面を基準(z=0)に設定した場合のビームウエストの位置zbtmが負になる条件とも言い換えられる。
Fig. 28 is a diagram for explaining the defocus condition. More specifically, the defocus condition is a condition in which the beam waist of the laser light L1 is located behind the
図29は、被検出物質XがCD80である場合にデフォーカス条件下でマイクロ流路92の底面に生じた凝集体の画像を示す図である。ビームウエストをマイクロ流路92の底面よりも65μmだけ下方に調整した(zbtm=-65μm)。40倍レンズ透過後のレーザ出力は0.53Wであった。サンプルSPの流速V=119[μm/s]に設定した。
29 is a diagram showing an image of aggregates formed on the bottom surface of the
図29に示すように、ターゲット濃度が比較的高い場合(特にターゲット濃度が25[pg/mL]以上である場合)、画像の色が相対的に薄い領域(以下、「薄色領域」とも呼ぶ)を輪郭とし、その中に画像の色が相対的に濃い領域(以下、「濃色領域」とも呼ぶ)の存在を確認できた。一方で、ターゲット濃度が極めて低濃度である場合(ターゲット濃度が2.5[pg/mL]以下である場合)にも薄色領域を確認できた。これは、ターゲット濃度が低濃度であってもビーズB1,B2の凝集が生じていることを意味している。 As shown in Figure 29, when the target concentration is relatively high (especially when the target concentration is 25 pg/mL or higher), the image has a relatively light-colored area (hereinafter also referred to as a "light-colored area") as its outline, and within that, a relatively dark-colored area (hereinafter also referred to as a "dark-colored area") can be confirmed. On the other hand, when the target concentration is extremely low (when the target concentration is 2.5 pg/mL or lower), a light-colored area can also be confirmed. This means that beads B1 and B2 aggregate even when the target concentration is low.
図30は、デフォーカス条件下におけるターゲット濃度と凝集面積Aとの間の関係を示す図である。デフォーカス条件下では、前述のフォーカス条件下(レーザ光L1のビームウエストがマイクロ流路92内に位置する条件)での各測定結果とは異なり、ターゲット濃度の増大とともにビーズB1,B2の凝集面積Aが増加するとの比例傾向は確認されなかった。これはデフォーカス条件に特有のビーズB1,B2の凝集メカニズムに起因すると考えられる。 Figure 30 is a diagram showing the relationship between target concentration and agglutination area A under defocused conditions. Unlike the measurement results under the aforementioned focused conditions (conditions in which the beam waist of laser light L1 is located within the microchannel 92), under defocused conditions, no proportional tendency was observed in which the agglutination area A of beads B1 and B2 increases with increasing target concentration. This is thought to be due to the aggregation mechanism of beads B1 and B2 that is specific to defocused conditions.
図31は、デフォーカス条件下におけるビーズB1,B2の凝集メカニズムを説明するための図である。図31では、マイクロ流路92の底面におけるレーザ光L1(レーザスポット)を黒い円で示している。
Figure 31 is a diagram for explaining the aggregation mechanism of beads B1 and B2 under defocused conditions. In Figure 31, the laser light L1 (laser spot) at the bottom surface of the
レーザ光L1の照射を受けたビーズB1,B2は、レーザ光L1の光誘起力(特に散逸力)によってマイクロ流路92の底面に押し付けられる。これにより、マイクロ流路92の底面上にビーズB1,B2が単層状に並ぶ(上図参照)。その単層の上に他のビーズB1,B2がさらに押し付けられることで、ビーズB1,B2の多層構造が形成される(中段の図参照)。ただし、被検出物質Xを介して結合されていないビーズB1,B2は、サンプルSPの流通方向に押し流される(下図参照)。このような、いわば「洗浄効果」の結果、被検出物質Xを介して結合したビーズB1,B2の多層構造が形成された領域が残る。図29に示した濃色領域は、抗原抗体反応の結果、ビーズB1,B2の多層構造が維持された領域であると考えられる。The beads B1 and B2 irradiated with the laser light L1 are pressed against the bottom surface of the
このように、濃色領域は、被検出物質Xを介して結合したビーズB1,B2の量に依存する領域である。これに対し、薄色領域は、ビーズB1,B2が被検出物質Xを介して結合しているか否かにかかわらず、基本的にはレーザスポットの大きさに応じて定まる領域である。したがって、デフォーカス条件下では、画像の濃淡を区別しない凝集面積Aに代えて濃色領域の面積を用いることで、ターゲット濃度を高精度に定量することが可能になる。 Thus, the dark color region is a region that depends on the amount of beads B1, B2 bound via the substance to be detected X. In contrast, the light color region is a region that is basically determined according to the size of the laser spot, regardless of whether beads B1, B2 are bound via the substance to be detected X. Therefore, under defocus conditions, it is possible to quantify the target concentration with high accuracy by using the area of the dark color region instead of the agglutination area A, which does not distinguish between light and dark in the image.
本実施例では便宜のため、濃色領域の面積を規格化する。具体的には、薄色領域の面積(画像の色が薄い輪郭内の全面積)に対する濃色領域の面積の割合を「多層割合」と定義する。For convenience, in this embodiment, the area of the dark color region is normalized. Specifically, the ratio of the area of the dark color region to the area of the light color region (the total area within the light-colored outline of the image) is defined as the "multilayer ratio."
多層割合=濃色領域の面積/全面積
図32は、デフォーカス条件下におけるターゲット濃度と多層割合との間の関係を示す図である。図32において、横軸はターゲット濃度を表し、縦軸は多層割合を表す。後述する図33等においても同様である。
Multi-layer ratio=area of dark color region/total area Fig. 32 is a diagram showing the relationship between the target density and the multi-layer ratio under defocus conditions. In Fig. 32, the horizontal axis represents the target density, and the vertical axis represents the multi-layer ratio. The same applies to Fig. 33 and other figures described later.
図32の上部に示すように、ターゲット濃度2.5[pg/mL]と25[pg/mL]との間に明確な差異が確認された。そこで、ターゲット濃度2.5[pg/mL]と25[pg/mL]との間をより詳細に5[pg/mL]間隔で測定した結果を図32の下部に示す。図32の下部に示されるように、デフォーカス条件下では、ターゲット濃度の増大とともに多層割合が増大するとの比例傾向が1[pg/mL]~10[pg/mL]の濃度範囲で確認された。この結果は、ELISA法等の従来の検出法と比べてターゲット濃度が1桁低い数[pg/mL]オーダーであっても検出できる可能性を示唆するものである。As shown in the upper part of Figure 32, a clear difference was confirmed between target concentrations of 2.5 [pg/mL] and 25 [pg/mL]. The results of more detailed measurements at 5 [pg/mL] intervals between target concentrations of 2.5 [pg/mL] and 25 [pg/mL] are shown in the lower part of Figure 32. As shown in the lower part of Figure 32, under defocused conditions, a proportional tendency was confirmed in the concentration range of 1 [pg/mL] to 10 [pg/mL] that the multilayer ratio increases with increasing target concentration. This result suggests the possibility of detection even when the target concentration is on the order of several [pg/mL], which is one order of magnitude lower than conventional detection methods such as ELISA.
図33は、被検出物質XがCD9/CD63複合エピトープである場合のデフォーカス条件下におけるターゲット濃度と多層割合との間の関係を示す図である。測定条件は、図29にて説明した被検出物質XがCD80である場合と共通の条件とした。 Figure 33 shows the relationship between the target concentration and the multilayer ratio under defocus conditions when the substance to be detected X is a CD9/CD63 composite epitope. The measurement conditions were the same as those when the substance to be detected X is CD80 as described in Figure 29.
図33を参照して、広範囲のターゲット濃度において、ターゲット濃度と多層割合との間の比例関係を確認できた。しかしながら、ターゲット濃度が極めて低濃度である場合には、大きなエラーバーに表されているように測定誤差が大きかった。これは、CD9/CD63複合エピトープとビーズB1,B2との間の結合力(親和性)が、CD80とビーズB1,B2との間の結合力と比べて弱いためと考察される。 With reference to Figure 33, a proportional relationship between the target concentration and the multilayer ratio was confirmed over a wide range of target concentrations. However, when the target concentration was extremely low, the measurement error was large, as shown by the large error bars. This is considered to be because the binding strength (affinity) between the CD9/CD63 composite epitope and beads B1 and B2 is weaker than the binding strength between CD80 and beads B1 and B2.
[実施例9]
<流路幅と照射スポット径との関係>
ターゲット濃度が極めて低濃度である場合の測定誤差を低減すべく、マイクロ流路92の幅とマイクロ流路92におけるレーザスポットの直径との間の関係を最適化した。なお、以下ではマイクロ流路92の幅を「流路幅W」と略す場合がある。また、マイクロ流路92の底面におけるレーザスポットの直径を「照射スポット径φ」と記載することで、ビームウエストにおけるレーザスポットの直径である「最小スポット径φ0」と区別する。本実施例では、流路幅Wが互いに異なる3種類の検出キット90を準備し、光誘導加速の測定を下方照射条件下で実施した。3種類のマイクロ流路92を第1~第3のマイクロ流路と記載する。
[Example 9]
<Relationship between flow path width and irradiation spot diameter>
In order to reduce measurement errors when the target concentration is extremely low, the relationship between the width of the
図34は、3種類の検出キット90を撮影した画像である。図34には上から順に第1~第3のマイクロ流路が示されている。各マイクロ流路は、長方形(正方形を含む)形状を有する。第1のマイクロ流路の流路幅W=350μmであった。第2のマイクロ流路の流路幅W=50μmであった。第3のマイクロ流路の流路幅W=100μmであった。各画像の中央に記載された円は、マイクロ流路92の底面におけるレーザスポットの大きさ(照射スポット径φ)を表している。
Figure 34 shows images of three types of
図35は、3種類の検出キット90の断面図である。図36は、第1~第3のマイクロ流路の各々について、流路幅Wと照射スポット径φとの間の関係を説明するための断面拡大図である。図35および図36を参照して、第1のマイクロ流路においては、流路幅W=350μmに対して、照射スポット径φ=68.3μmであった。この場合、流路幅Wが照射スポット径φよりも著しく大きいため、第1のマイクロ流路の断面の一部のみ(詳細には断面積の約34%)にレーザ光L1が照射される。
Figure 35 is a cross-sectional view of three types of
第2のマイクロ流路においては、流路幅W=50μmに対して、照射スポット径φ=50μmであった。したがって、第2のマイクロ流路では、その断面全体にレーザ光L1が照射される。In the second microchannel, the channel width W was 50 μm and the irradiation spot diameter φ was 50 μm. Therefore, in the second microchannel, the laser light L1 was irradiated to the entire cross section.
第3のマイクロ流路においては、流路幅W=100μmに対して、照射スポット径φ=68.3μmであった。この測定は、レーザスポットが下方ほど小さくなる下方照射条件で実施され、マイクロ流路92の上面では全体にレーザ光L1が照射される。その点を考慮すると、流路幅Wとレーザスポットの大きさとは同程度であると言える。第3のマイクロ流路の断面のほとんど全部(詳細には断面積の約95%)にレーザ光L1が照射されるものの、レーザ光L1が照射されない領域もわずかに存在する(残りの約5%)。In the third microchannel, the channel width W was 100 μm and the irradiation spot diameter φ was 68.3 μm. This measurement was performed under downward irradiation conditions where the laser spot becomes smaller the further downward, and the entire upper surface of the
本発明者らによる検討の結果、高効率な凝集かつ高精度な定量を実現できるのは、第3のマイクロ流路のようにレーザ光L1が照射されない領域が局所的に残った場合であることが明らかになった。その理由は以下のように説明できる。まず、第1のマイクロ流路では、流路幅Wがレーザスポットの大きさよりも著しく大きい。そのため、レーザ光L1の照射を受けることなくレーザスポットを素通りするビーズB1,B2の割合が高い。よって、ビーズB1,B2の凝集効率を向上させる余地がある。一方、第2または第3のマイクロ流路においては、断面の全体またはほぼ全体にレーザ光L1が照射されるため、ビーズB1,B2が凝集しやすい。第2および第3のマイクロ流路のなかでも特に第3のマイクロ流路を用いることで高い定量精度を実現できることを本発明者らは見出した。As a result of the study by the present inventors, it became clear that highly efficient aggregation and highly accurate quantification can be achieved when the area where the laser light L1 is not irradiated remains locally as in the third microchannel. The reason for this can be explained as follows. First, in the first microchannel, the channel width W is significantly larger than the size of the laser spot. Therefore, the proportion of beads B1 and B2 that pass through the laser spot without being irradiated with the laser light L1 is high. Therefore, there is room to improve the aggregation efficiency of beads B1 and B2. On the other hand, in the second or third microchannel, the entire or almost entire cross section is irradiated with the laser light L1, so that beads B1 and B2 are likely to aggregate. The present inventors found that high quantitative accuracy can be achieved by using the third microchannel in particular among the second and third microchannels.
図37は、第2のマイクロ流路と第3のマイクロ流路との間のメカニズムの違いを説明するための図である。第2のマイクロ流路では断面全体にレーザ光L1が照射される。そうすると、ビーズB1,B2が凝集し、ビーズB1,B2の多層構造が形成される。本来であれば図31にて説明したように、サンプルSPの流通方向に洗浄効果が生じ、被検出物質Xを介して結合されていないビーズB1,B2は、サンプルSPの流通方向に押し流される。しかし、第2のマイクロ流路では、サンプルSPの流れがビーズB1,B2により閉塞しやすく、洗浄効果が得られにくい。つまり、被検出物質Xを介して結合されていないビーズB1,B2もサンプルSPの流通方向に押し流されずに残りやすい。そうすると、多層構造が形成された領域と、被検出物質Xを介して結合したビーズB1,B2が存在する領域とが必ずしも一致しないので、多層割合からターゲット濃度を高精度には定量しにくい。なお、図38は、第2のマイクロ流路よりもさらに流路幅Wが狭い(W=20μm)場合においてビーズB1,B2が閉塞している様子を撮影した画像を示す。 Figure 37 is a diagram for explaining the difference in mechanism between the second microchannel and the third microchannel. In the second microchannel, the laser light L1 is irradiated to the entire cross section. Then, the beads B1 and B2 aggregate, and a multilayer structure of the beads B1 and B2 is formed. Normally, as explained in Figure 31, a cleaning effect occurs in the flow direction of the sample SP, and the beads B1 and B2 that are not bound via the substance to be detected X are swept away in the flow direction of the sample SP. However, in the second microchannel, the flow of the sample SP is easily blocked by the beads B1 and B2, and the cleaning effect is difficult to obtain. In other words, the beads B1 and B2 that are not bound via the substance to be detected X are also likely to remain without being swept away in the flow direction of the sample SP. Then, since the area where the multilayer structure is formed and the area where the beads B1 and B2 bound via the substance to be detected X exist do not necessarily coincide, it is difficult to accurately quantify the target concentration from the multilayer ratio. FIG. 38 shows an image of beads B1 and B2 blocking the microchannel when the channel width W is narrower (W=20 μm) than the second microchannel.
これに対し、第3のマイクロ流路においては、レーザ光L1が照射されない領域が流路側面付近に局所的に存在する。この領域は、サンプルSPの流れのいわば「逃げ道」または「抜け穴」として機能する。したがって、第3のマイクロ流路においてはビーズB1,B2による閉塞が生じにくく、洗浄効果が得られやすい。その結果、多層構造が形成された領域と、被検出物質Xを介して結合したビーズB1,B2が存在する領域とがよく一致する。よって、多層割合からターゲット濃度を高精度に定量することが可能になる。In contrast, in the third microchannel, there is a localized area near the side of the channel where the laser light L1 is not irradiated. This area functions as an "escape route" or "loophole" for the flow of the sample SP. Therefore, in the third microchannel, clogging by beads B1 and B2 is unlikely to occur, and cleaning effects can be easily obtained. As a result, the area where the multilayer structure is formed and the area where beads B1 and B2 bound via the substance to be detected X exist are well aligned. Therefore, it becomes possible to quantify the target concentration with high accuracy from the multilayer ratio.
図39は、第3のマイクロ流路の底面に生じた凝集体の画像を示す図である。この測定では、ビームウエストをマイクロ流路92の底面よりも65μmだけ下方に調整した(Dbtm=-65μm)。40倍レンズ透過後のレーザ出力は0.27Wであった。この場合、第3のマイクロ流路の流路壁面における散逸力は、3.37pNと算出される。被検出物質XにはCD9/CD63複合エピトープを用いた。サンプルSPの流速V=119[μm/s]に設定した。 39 is a diagram showing an image of aggregates formed on the bottom surface of the third micro-channel. In this measurement, the beam waist was adjusted to be 65 μm below the bottom surface of the micro-channel 92 (D btm =-65 μm). The laser output after passing through the 40x lens was 0.27 W. In this case, the dissipation force on the channel wall surface of the third micro-channel is calculated to be 3.37 pN. A CD9/CD63 composite epitope was used as the substance X to be detected. The flow velocity V of the sample SP was set to 119 [μm/s].
図39をよく観察すると、ターゲット濃度が高くなるに従って、ビーズB1,B2の凝集体の輪郭内で濃色領域が増大していく様子を確認できる。 If you look closely at Figure 39, you can see that as the target concentration increases, the dark area within the outline of the aggregate of beads B1 and B2 increases.
図40は、ELISA法により得られた検量線を比較例として示す図である。図39と同様に、被検出物質XにはCD9/CD63複合エピトープを用いた。図40(および後述する図42)の縦軸は、波長450nmにおける光学濃度(OD値)を表す。図41は、第3のマイクロ流路を用いて得られた検量線を示す図である。 Figure 40 shows a calibration curve obtained by ELISA as a comparative example. As in Figure 39, a CD9/CD63 composite epitope was used as the substance X to be detected. The vertical axis in Figure 40 (and Figure 42 described below) represents the optical density (OD value) at a wavelength of 450 nm. Figure 41 shows a calibration curve obtained using the third microchannel.
図40に示すように、ELISA法によっても高い直線線を示す検量線を得ることができた(決定係数R2=0.9993)。ただし、ELISA法によって測定可能なターゲット濃度の範囲は、3.1[pg/mL]~200[pg/mL]であった。ターゲット濃度が当該濃度範囲の下限値よりも低い場合にはエラーバーが大きく、十分に高い定量精度を得ることはできなかった。サンプル量は100μLであった。また、測定にはサンプル調製等の前処理を含めて約5時間を要した。 As shown in Figure 40, a highly linear calibration curve could be obtained by the ELISA method (coefficient of determination R2 = 0.9993). However, the target concentration range measurable by the ELISA method was 3.1 [pg/mL] to 200 [pg/mL]. When the target concentration was lower than the lower limit of the concentration range, the error bar was large and it was not possible to obtain a sufficiently high quantitative accuracy. The sample volume was 100 μL. In addition, the measurement took about 5 hours, including pretreatment such as sample preparation.
一方、本実施例においては図41に示すように、CD9/CD63複合エピトープを被検出物質Xとした場合に、0.31[pg/mL]~5.0[pg/mL]の濃度範囲において、すなわち、ELISA法を適用可能な濃度範囲の下限と同等か1桁低い濃度において、高い直線線を示す検量線を得ることができた(R2=0.9371)。サンプル量は1μL以下でよく、測定の所要時間も5分以内であった。
On the other hand, in this example, when the CD9/CD63 composite epitope was used as the detection substance X, a calibration curve showing a high straight line was obtained (
続いて、肺がん細胞(具体的には市販の肺がん細胞株A549)由来のエクソソームを被検出物質Xとして用いた測定結果について説明する。光学系の測定条件は、図39にて説明した条件と共通である。濃度1000[μg/mL]のエクソソーム原液をリン酸バッファ(リン酸二水素ナトリウムとリン酸水素二ナトリウムとの混合水溶液)で希釈してサンプルSPとした。リン酸バッファの濃度は10[mM]であり、リン酸バッファのpHは7.0であった。まず、ELISA法での測定結果について説明する。 Next, the measurement results using exosomes derived from lung cancer cells (specifically, commercially available lung cancer cell line A549) as the detected substance X will be described. The measurement conditions of the optical system are the same as those described in Figure 39. A stock solution of exosomes with a concentration of 1000 [μg/mL] was diluted with phosphate buffer (a mixed aqueous solution of sodium dihydrogen phosphate and disodium hydrogen phosphate) to obtain sample SP. The concentration of the phosphate buffer was 10 [mM], and the pH of the phosphate buffer was 7.0. First, the measurement results using the ELISA method will be described.
図42は、被検出物質Xがエクソソームである場合にELISA法により得られた検量線を比較例として示す図である。ELISA法によれば、ターゲット濃度が1.0[μg/mL]~50[μg/mL]の濃度範囲内である場合には、高い直線線を示す検量線が得られた(R2=0.9986)(上図参照)。しかしながら、ターゲット濃度が1.0[μg/mL]以下である場合には定量精度が大きく低下した(R2=0.7208)(下図参照)。測定には約5時間を要した。 FIG. 42 shows a comparative example of a calibration curve obtained by ELISA when the detected substance X is an exosome. According to the ELISA method, when the target concentration is within the concentration range of 1.0 [μg/mL] to 50 [μg/mL], a calibration curve showing a high straight line was obtained (R 2 =0.9986) (see upper figure). However, when the target concentration is 1.0 [μg/mL] or less, the quantitative accuracy was greatly reduced (R 2 =0.7208) (see lower figure). The measurement took about 5 hours.
図43は、本実施例において被検出物質Xがエクソソームである場合に得られた検量線を示す図である。本実施例においては、0.01[μg/mL]~0.5[μg/mL]の濃度範囲において、すなわち、ELISA法を適用可能な濃度範囲の下限よりも2桁以上低い濃度においても、高い直線線を示す検量線を得ることができた(R2=0.9595)。測定の所要時間も5分程度であり、2桁の時間短縮を達成できた。
43 shows a calibration curve obtained in this example when the target substance X is exosome. In this example, a calibration curve showing a high straight line was obtained (
なお、図2にて説明したように、エクソソームは、その表面に膜タンパク質を有する、直径30nm~150nm程度の球形物質である。一方、新型コロナウイルス(SARS-CoV-2)も、その表面にS(スパイク)タンパク質を有する直径約100nmの球形物質である。したがって、エクソームを高感度かつ迅速に検出可能であることを示す上記図43の測定結果は、SARS-CoV-2も検出可能であることを示唆している。すなわち、本実施例の新型コロナウイルス感染症(COVID-19)の検査への応用可能性が示唆されている。As explained in Figure 2, exosomes are spherical substances with a diameter of approximately 30 nm to 150 nm that have membrane proteins on their surface. Meanwhile, the new coronavirus (SARS-CoV-2) is also a spherical substance with a diameter of approximately 100 nm that has S (spike) protein on its surface. Therefore, the measurement results in Figure 43 above, which show that exomes can be detected sensitively and quickly, suggest that SARS-CoV-2 can also be detected. In other words, the possibility of applying this example to testing for novel coronavirus disease (COVID-19) is suggested.
[実施例10]
<シリンジポンプの影響>
実施例10では、異なる2機種のシリンジポンプ30を用いた測定結果を比較する。第1および第2のシリンジポンプの流速Vは、各シリンジポンプの仕様値に基づく計算上、互いに等しい値になるように調整した。具体的は、マイクロ流路の断面の幅×高さが100μm×100μmである場合に流速V=167[μm/s]に調整した。
[Example 10]
<Effect of Syringe Pump>
In Example 10, the measurement results using two different models of syringe pumps 30 are compared. The flow rates V of the first and second syringe pumps were adjusted to be equal to each other in calculations based on the specifications of each syringe pump. Specifically, when the width x height of the cross section of the microchannel is 100 μm x 100 μm, the flow rate V was adjusted to 167 [μm/s].
なお、シリンジポンプ30以外の測定条件は、図39、図41および図43にて説明した条件と共通である。被検出物質Xとしては大腸がん細胞(具体的には市販の大腸がん細胞株HCT116)由来のエクソソームを用いた。濃度1000μg/mLのエクソソーム原液をリン酸バッファで希釈してサンプルSPとした。リン酸バッファの濃度は10[mM]であり、リン酸バッファのpHは7.0であった。
The measurement conditions other than the
図44は、2種類のシリンジポンプを用いて得られた検量線を示す図である。図44の上部に第1のシリンジポンプを用いて得られた検量線を示し、下部に第2のシリンジポンプを用いて得られた検量線を示す。第1のシリンジポンプと比べて、第2のシリンジポンプの方が流速が安定していることを確認している。 Figure 44 shows the calibration curves obtained using two types of syringe pumps. The upper part of Figure 44 shows the calibration curve obtained using the first syringe pump, and the lower part shows the calibration curve obtained using the second syringe pump. It has been confirmed that the flow rate is more stable with the second syringe pump than with the first syringe pump.
第1および第2のシリンジポンプのどちらを用いた場合であっても、大腸がん細胞由来のエクソソームに関して高い直線性を示す検量線を得られることを確認できた。ただし、特に1[μg/mL]未満の低濃度範囲で比較すると、より安定した流速の流れを発生可能な第2のシリンジポンプを用いた場合の方が第1のシリンジポンプを用いた場合と比べて、検量線の直線性が一層向上するとともに測定誤差が低減されることが読み取れる。実施例2(図16参照)にて説明したように、サンプルSPの流速Vは、ビーズB1,B2と被検出物質Xとの凝集体の成長が進みやすい最適な流速に調整することが望ましい。その最適な流速の実現に適した安定した圧力駆動流を発生できるシリンジポンプ30を選定することで、より理想的な検量線を作成できる。It was confirmed that a calibration curve showing high linearity for exosomes derived from colon cancer cells could be obtained regardless of whether the first or second syringe pump was used. However, when comparing particularly in the low concentration range of less than 1 [μg/mL], it can be seen that the linearity of the calibration curve is further improved and the measurement error is reduced when the second syringe pump capable of generating a flow with a more stable flow rate is used compared to when the first syringe pump is used. As explained in Example 2 (see FIG. 16), it is desirable to adjust the flow rate V of the sample SP to an optimal flow rate at which the growth of aggregates of beads B1, B2 and the substance to be detected X is likely to proceed. By selecting a
以上のように、実施の形態1においては、被検出物質X(CD80、エクソソーム等)とビーズB1,B2とを含有し、マイクロ流路92を流れるサンプルSPに対して、ビーズB1,B2に非共鳴光であるレーザ光L1を照射する。レーザ光L1の光誘起力を利用した「光誘導加速」を実現することで、被検出物質Xの存在下では、被検出物質Xがたとえ極微量(たとえばサブ~数[pg/mL])であってもビーズB1,B2が短時間(たとえば数分間)で凝集する。カメラ60により撮影された画像に基づき、ビーズB1,B2の凝集体の存在の有無を判定することで、被検出物質Xの有無を検出できる(第1の抗原検出処理)。特に、ビーズB1,B2の凝集体の面積(凝集面積A)と被検出物質Xの濃度(ターゲット濃度)との間の対応関係を検量線として予め準備しておくことで、凝集面積Aからターゲット濃度を算出できる(第2の抗原検出処理)。よって、実施の形態1によれば、被検出物質Xを迅速かつ高感度に検出できる。被検出物質Y(FDP等)とビーズB3との組合せについても同様である。As described above, in the first embodiment, the sample SP contains the target substance X (CD80, exosomes, etc.) and beads B1 and B2, and is flowing through the
[実施の形態2]
実施の形態2においては、光誘導加速を3次元蛍光観察に適用する構成について説明する。
[Embodiment 2]
In the second embodiment, a configuration in which light-induced acceleration is applied to three-dimensional fluorescent observation will be described.
図45は、実施の形態2に係る抗原検出システムの全体構成を概略的に示す図である。実施の形態2に係る抗原検出システム200は、共焦点レーザ顕微鏡の光学系である共焦点光学系80を備える点において、実施の形態1に係る抗原検出システム100(図4参照)と異なる。共焦点光学系80は、励起光源81と、ビームスプリッタ82と、走査装置83と、焦準機構84と、対物レンズ85と、結像レンズ86と、ピンホール(共焦点絞り)87と、受光器88とを含む。
Figure 45 is a diagram showing a schematic diagram of the overall configuration of an antigen detection system according to
励起光源81は、サンプルSPを観察するためのレーザ光L3を発する。レーザ光L3は、サンプルSPに含まれる蛍光色素を励起可能な波長を有する。以下、サンプルSPから発せられ、観察しようとする蛍光を「蛍光L4」とも記載する。The
ビームスプリッタ82は、励起光源81からのレーザ光L3を透過する一方で、サンプルSPからの蛍光L4を反射するように構成されている。
The
走査装置83は、コントローラ70からの指令に応じて、励起光源81からのレーザ光L3を光軸と直交する方向(xy方向)に走査する。走査装置83としては、たとえば、ガルバノミラー、ポリゴンミラー、音響光学偏向素子(AOD:Acousto-optic Deflector)を用いることできる。The
焦準機構84は、コントローラ70からの指令に応じて、検出キット90と対物レンズ85の焦点位置との間の光軸方向(z方向)の距離を変化させる。なお、図45には、焦準機構84が対物レンズ85を移動させる例が図示されているが、焦準機構84は、検出キット90が配置されたXYZ軸ステージ10を光軸方向に移動させてもよい。すなわち、焦準機構84は、検出キット90と対物レンズ85との光軸方向の相対的な位置関係を変化させることができればよい。また、焦準機構84に代えて、空間光変調器(SLM:Spatial Light Modulator)、デフォーマブルミラーなどを採用してもよい。The focusing
対物レンズ85は、励起光源81からのレーザ光L3をサンプルSPに照射するとともに、サンプルSPから発せられた蛍光L4を走査装置83に向けて透過する。
The
結像レンズ86は、ビームスプリッタ82にて反射した蛍光L4をピンホール87上に集光させる。
The
ピンホール87は、結像レンズ86と受光器88との間において、対物レンズ85の焦点位置と共役な位置に配置されている。
The
受光器88は、ピンホール87を通過した蛍光L4を検出し、その検出結果をコントローラ70に出力する。受光器88は、フォトダイオード、アバランシェ・フォトダイオード(APD:Avalanche Photodiode)、光電子増倍管などの受光素子を含む。The
なお、抗原検出システム200の上記以外の構成は、抗原検出システム100の対応する構成と共通である。よって、詳細な説明は繰り返さない。また、図面の煩雑さを避けるため図示しないが、以下に測定結果を示すように、抗原検出システム200は、光学顕顕微鏡像を撮影することも可能に構成されている。
Note that the configuration of the
図46は、実施の形態2における第1の抗原検出処理を示すフローチャートである。図47は、実施の形態2における第2の抗原検出処理を示すフローチャートである。図46および図47を参照して、実施の形態2における第1または第2の抗原検出処理は、白色光L2を照射する処理(S105,S206)に代えてレーザ光L3を照射する処理(S305,S406)を含む点、および、画像(光学顕微鏡像)を撮影する処理(S106,S207)に代えて蛍光像を撮影する処理(S306,S407)を含む点において、実施の形態1における処理(図12または図13参照)と異なる。これら以外の処理は同等であるため、説明は繰り返さない。 Figure 46 is a flowchart showing the first antigen detection process in the second embodiment. Figure 47 is a flowchart showing the second antigen detection process in the second embodiment. With reference to Figures 46 and 47, the first or second antigen detection process in the second embodiment differs from the process in the first embodiment (see Figure 12 or Figure 13) in that it includes a process of irradiating laser light L3 (S305, S406) instead of a process of irradiating white light L2 (S105, S206), and a process of capturing a fluorescent image (S306, S407) instead of a process of capturing an image (optical microscope image) (S106, S207). The other processes are equivalent, so the description will not be repeated.
[実施例11]
実施例11では、被検出物質XとしてCD9/CD63複合エピトープを用いた。CD9/CD63複合エピトープは蛍光色素を含まないため、ビーズB1,B2(ビーズ本体B0)に蛍光ビーズを採用した。
[Example 11]
In Example 11, a CD9/CD63 composite epitope was used as the detection target substance X. Since the CD9/CD63 composite epitope does not contain a fluorescent dye, fluorescent beads were used for beads B1 and B2 (bead body B0).
図48は、蛍光ビーズを用いた場合にマイクロ流路92に形成された凝集体の光学顕微鏡像を示す図である。図49は、蛍光ビーズを用いた場合にマイクロ流路92に形成された凝集体の3次元蛍光像を示す図である。
Figure 48 shows an optical microscope image of an aggregate formed in the
図48に示す光学顕微鏡像より、ターゲット濃度が高くなるに従ってビーズB1,B2の凝集面積Aが大きくなることが確認できた。また、図49に示す3次元蛍光像においても、ターゲット濃度が高くなるに従って高い蛍光強度を示す領域(体積)が広がる様子を確認できた。 From the optical microscope image shown in Figure 48, it was confirmed that the aggregation area A of beads B1 and B2 increases as the target concentration increases. Also, in the three-dimensional fluorescent image shown in Figure 49, it was confirmed that the area (volume) showing high fluorescent intensity expands as the target concentration increases.
ビーズB1,B2の凝集面積Aに代えて、高い蛍光強度を示す領域の体積、いわばビーズB1,B2の凝集体積を用いてもよい。凝集体積とターゲット濃度との間の検量線を準備することにより、凝集体積からターゲット濃度を算出できる。凝集体積は、本開示に係る「凝集体のサイズを表す指標」の他の一例である。なお、凝集体積の算出に共焦点光学系80は必須ではない。凝集体積は、一般的な光学顕微鏡の光学系を用いて凝集体を少なくとも2方向(たとえば鉛直方向および水平方向)から観察することでも算出できる。Instead of the agglutination area A of beads B1 and B2, the volume of the area showing high fluorescence intensity, that is, the agglutination volume of beads B1 and B2, may be used. By preparing a calibration curve between the agglutination volume and the target concentration, the target concentration can be calculated from the agglutination volume. The agglutination volume is another example of the "index representing the size of the agglutinate" according to the present disclosure. Note that the confocal
さらに、対物レンズ50として、凸レンズに代えてシリンドリカルレンズを用いることで、サンプルSPの流通方向に伸びる細長い形状の凝集体を形成することも可能である。この場合、ビーズB1,B2が凝集した領域の長さ(サンプルSPの流通方向の長さ)を「凝集体のサイズを表す指標」として用いることもできる。このように、「凝集体のサイズを表す指標」は、長さ(1次元パラメータ)、面積(2次元パラメータ)、体積(3次元パラメータ)のいずれであってもよい。Furthermore, by using a cylindrical lens instead of a convex lens as the
[実施例12]
実施例12では、被検出物質Xとして、肺がん細胞株A549由来の非蛍光性エクソソームを用いた。非蛍光性エクソソームのタンパク濃度(ターゲット濃度)は0.1[μg/mL]、1[μg/mL]の2通りに設定した。リン酸バッファの濃度は10[mM]であり、リン酸バッファのpHは7.0であった。ビーズB1,B2には蛍光ビーズを用いた。
[Example 12]
In Example 12, non-fluorescent exosomes derived from lung cancer cell line A549 were used as the detection target substance X. The protein concentration (target concentration) of the non-fluorescent exosomes was set to two values, 0.1 [μg/mL] and 1 [μg/mL]. The concentration of the phosphate buffer was 10 [mM], and the pH of the phosphate buffer was 7.0. Fluorescent beads were used for beads B1 and B2.
図50は、被検出物質Xが非蛍光性エクソソームであり、ビーズB1,B2が蛍光ビーズである場合に、マイクロ流路92に形成された凝集体の光学顕微鏡像を示す図である。図51は、被検出物質Xが非蛍光性エクソソームであり、ビーズB1,B2が蛍光ビーズである場合に、マイクロ流路92に形成された凝集体の3次元蛍光像を示す図である。
Figure 50 shows an optical microscope image of an aggregate formed in the
実施例11と同様に、光学顕微鏡像(図50)においてはターゲット濃度が高いほどビーズB1,B2の凝集面積Aが大きくなった。また、3次元蛍光像(図51)においても、ターゲット濃度の上昇に伴って蛍光強度が高い領域の体積が増加した。As in Example 11, in the optical microscope image (Figure 50), the higher the target concentration, the larger the aggregation area A of beads B1 and B2. Also in the three-dimensional fluorescent image (Figure 51), the volume of the area with high fluorescent intensity increased with increasing target concentration.
[実施例13]
実施例13では、被検出物質Xとして蛍光性エクソソーム(CD63-GFP-HeLa-exosome)を用いた。蛍光性エクソソームのタンパク濃度(ターゲット濃度)は20[μg/mL]であった。リン酸バッファの濃度は10[mM]であり、リン酸バッファのpHは7.0であった。ビーズB1,B2には非蛍光ビーズを用いた。
[Example 13]
In Example 13, fluorescent exosomes (CD63-GFP-HeLa-exosomes) were used as the detection target substance X. The protein concentration (target concentration) of the fluorescent exosomes was 20 [μg/mL]. The concentration of the phosphate buffer was 10 [mM], and the pH of the phosphate buffer was 7.0. Non-fluorescent beads were used as beads B1 and B2.
図52は、被検出物質Xが蛍光性エクソソームである場合に、マイクロ流路92に形成された凝集体の2次元蛍光像を示す図である。図52を参照して、ビーズB1,B2が非蛍光性ビーズであっても、ビーズB1,B2に特異的に結合した蛍光性エクソソームからの蛍光を確認できた。
Figure 52 shows a two-dimensional fluorescent image of aggregates formed in the
なお、実施例11~13では、被検出物質XおよびビーズB1,B2のうちの一方のみが蛍光色素を含む例について説明した。しかし、被検出物質XおよびビーズB1,B2の両方が蛍光色素を含む場合にも、高い蛍光強度を示す領域の広さ(≒凝集面積A)がターゲット濃度に応じて定まることは上記測定結果から明らかである。In Examples 11 to 13, examples were described in which only one of the target substance X and beads B1, B2 contained a fluorescent dye. However, it is clear from the above measurement results that even when both the target substance X and beads B1, B2 contained a fluorescent dye, the size of the area showing high fluorescence intensity (≒ agglutination area A) was determined according to the target concentration.
以上のように、実施の形態2においては、被検出物質XおよびビーズB1,B2のうちの少なくとも一方が蛍光色素を含み、かつ、抗原検出システム200が蛍光観察可能な共焦点光学系80を備える。2次元/3次元撮影された蛍光画像に蛍光を示す領域が観察されるかどうかに基づいて、ビーズB1,B2の凝集体の存在の有無を判定することで、被検出物質Xの有無を検出できる(第1の抗原検出処理)。また、蛍光が観察される領域の広さ(すなわち凝集面積A)とターゲット濃度との間の対応関係を検量線として予め準備しておくことで、凝集面積Aからターゲット濃度を算出できる(第2の抗原検出処理)。よって、実施の形態2によっても実施の形態1と同様に、被検出物質Xを迅速かつ高感度に検出できる。被検出物質YとビーズB3との組合せについても同様である。As described above, in the second embodiment, at least one of the substance to be detected X and the beads B1, B2 contains a fluorescent dye, and the
なお、実施の形態1と実施の形態2とは適宜組み合わせることができる。実施の形態1にて説明した上方照射/下方照射、デフォーカス条件、流路幅Wと照射スポット径φとの関係、流速調整などを考慮して蛍光観察を行うことができる。 Note that the first and second embodiments can be combined as appropriate. Fluorescence observation can be performed taking into consideration the upward/downward illumination, defocus conditions, the relationship between the flow path width W and the illumination spot diameter φ, flow rate adjustment, and the like, as described in the first embodiment.
今回開示された実施の形態は、すべての点で例示であって制限的なものではないと考えられるべきである。本開示の範囲は、上記した実施の形態の説明ではなくて請求の範囲によって示され、請求の範囲と均等の意味および範囲内でのすべての変更が含まれることが意図される。The embodiments disclosed herein should be considered to be illustrative and not restrictive in all respects. The scope of the present disclosure is indicated by the claims, not by the description of the embodiments above, and is intended to include all modifications within the meaning and scope of the claims.
B1~B3 ビーズ、X,Y 被検出物質、B0 ビーズ本体、B11 第1抗体、B21 第2抗体、B12,B22 アビジン、B13,B23 ビオチン、B31 抗体、10 XYZ軸ステージ、20 調整機構、30 シリンジポンプ、31,32 毛細管、41 レーザ光源、42 照明光源、43 ダイクロイックミラー、50 対物レンズ、60 カメラ、70 コントローラ、71 プロセッサ、72 メモリ、73 入出力ポート、80 共焦点光学系、81 励起光源、82 ビームスプリッタ、83 走査装置、84 焦準機構、85 対物レンズ、86 結像レンズ、87 ピンホール、88 受光器、90 検出キット、91 基材、92 マイクロ流路、921 インレット、922 アウトレット、100,200 抗原検出システム。B1 to B3 beads, X, Y detectable substance, B0 bead body, B11 first antibody, B21 second antibody, B12, B22 avidin, B13, B23 biotin, B31 antibody, 10 XYZ axis stage, 20 adjustment mechanism, 30 syringe pump, 31, 32 capillary tube, 41 laser light source, 42 illumination light source, 43 dichroic mirror, 50 objective lens, 60 camera, 70 controller, 71 processor, 72 memory, 73 input/output port, 80 confocal optical system, 81 excitation light source, 82 beam splitter, 83 scanning device, 84 focusing mechanism, 85 objective lens, 86 imaging lens, 87 pinhole, 88 photodetector, 90 detection kit, 91 substrate, 92 microchannel, 921 inlet, 922 Outlet, 100,200 Antigen detection system.
Claims (13)
前記被検出物質と前記複数の微粒子との凝集体が形成されるように、前記複数の微粒子の電子的共鳴の波長域外の光である非共鳴光を前記マイクロ流路を流通している前記液体試料に照射するステップと、
前記液体試料からの光を受けた受光器からの信号に基づいて前記被検出物質を検出するステップとを含み、
前記照射するステップは、前記非共鳴光の照射方向と同方向の散逸力を前記複数の微粒子に作用させることで、前記上面および前記下面のうち前記非共鳴光の照射方向下方の面に前記複数の微粒子を押し付けるステップを含む、被検出物質の検出方法。 a step of circulating a liquid sample containing a plurality of microparticles, each of which is modified with a host molecule that specifically binds to a substance to be detected, through a microchannel having an upper surface and a lower surface in a state where the microchannel is filled with the liquid sample;
irradiating the liquid sample flowing through the microchannel with non-resonant light that is light outside the wavelength range of electronic resonance of the plurality of particles so that aggregates of the detection target substance and the plurality of particles are formed;
detecting the target substance based on a signal from a light receiver that receives light from the liquid sample ;
The irradiating step includes a step of pressing the plurality of particles against one of the upper and lower surfaces which is below the irradiation direction of the non-resonant light by applying a dissipation force to the plurality of particles in the same direction as the irradiation direction of the non-resonant light.
前記被検出物質と前記複数の微粒子との凝集体が形成されるように、前記複数の微粒子の電子的共鳴の波長域外の光である非共鳴光を前記マイクロ流路を流通している前記液体試料に照射するステップと、
前記液体試料からの光を受けたカメラからの信号に基づいて前記被検出物質を検出するステップとを含み、
前記検出するステップは、
前記液体試料を前記カメラにより撮影した画像に基づき、前記被検出物質と前記複数の微粒子とが凝集することで形成された凝集体のサイズを表す指標を算出するステップと、
前記液体試料が前記マイクロ流路を流通している条件下において前記被検出物質の濃度と前記指標との間に予め求められた定量的な対応関係を参照することによって、算出された前記指標から前記液体試料に含まれる前記被検出物質の濃度を算出するステップとを含む、被検出物質の検出方法。 a step of circulating a liquid sample containing a plurality of microparticles, each of which is modified with a host molecule that specifically binds to a substance to be detected, through the microchannel in a state where the microchannel is filled with the liquid sample using a pump;
irradiating the liquid sample flowing through the microchannel with non-resonant light that is light outside the wavelength range of electronic resonance of the plurality of particles so that aggregates of the detection target substance and the plurality of particles are formed;
detecting the target substance based on a signal from a camera receiving light from the liquid sample;
The detecting step includes:
calculating an index representing a size of an aggregate formed by aggregation of the target substance and the plurality of particles based on an image of the liquid sample captured by the camera;
and calculating the concentration of the target substance contained in the liquid sample from the calculated index by referring to a quantitative correspondence relationship previously determined between the concentration of the target substance and the index under conditions in which the liquid sample is flowing through the microchannel.
前記被検出物質と前記複数の微粒子との凝集体が形成されるように、前記複数の微粒子の電子的共鳴の波長域外の光である非共鳴光を前記マイクロ流路を流通している前記液体試料に照射するステップと、
前記液体試料からの光を受けた受光器からの信号に基づいて前記被検出物質を検出するステップとを含み、
前記照射するステップの後に前記非共鳴光の照射を停止するステップをさらに含み、
前記検出するステップは、前記非共鳴光の照射が停止してから前記液体試料の流通により前記凝集体を洗浄するのに要する時間だけ待機した後に前記受光器から取得された信号に基づいて、前記被検出物質を検出するステップを含み、
前記凝集体の洗浄は、前記複数の微粒子のうち前記凝集体に結合していない微粒子を前記液体試料の流通方向に押し流して前記凝集体から遠ざける作用である、被検出物質の検出方法。 a step of circulating a liquid sample containing a plurality of microparticles, each of which is modified with a host molecule that specifically binds to a substance to be detected, through the microchannel in a state where the microchannel is filled with the liquid sample using a pump;
irradiating the liquid sample flowing through the microchannel with non-resonant light that is light outside the wavelength range of electronic resonance of the plurality of particles so that aggregates of the detection target substance and the plurality of particles are formed;
detecting the target substance based on a signal from a light receiver that receives light from the liquid sample;
Further comprising the step of ceasing the irradiation of the non-resonant light after the irradiating step;
the detecting step includes a step of detecting the target substance based on a signal acquired from the light receiver after waiting for a time required for washing the aggregate by flowing the liquid sample after the irradiation of the non-resonant light is stopped,
A method for detecting a target substance, in which washing of the aggregate is an action of pushing away from the aggregate those of the plurality of microparticles that are not bound to the aggregate in the flow direction of the liquid sample.
前記照射するステップは、前記非共鳴光を前記液体試料の上方から下方に向けて照射するステップを含む、請求項1~4のいずれか1項に記載の被検出物質の検出方法。 a specific gravity of each of the plurality of fine particles is greater than a specific gravity of a dispersion medium of the plurality of fine particles;
The method for detecting a target substance according to claim 1 , wherein the irradiating step includes a step of irradiating the liquid sample with the non-resonant light from above downward.
被検出物質に特異的に結合するホスト分子で各々が修飾された複数の微粒子を含む液体試料を前記マイクロ流路内が充填された状態で前記マイクロ流路に流通させるポンプと、
前記複数の微粒子の電子的共鳴の波長域外の光である非共鳴光を前記マイクロ流路を流通している前記液体試料に照射する光源と、
前記液体試料からの光を受ける受光器と、
前記受光器からの信号に基づいて前記被検出物質の検出処理を実行する演算装置とを備え、
前記光源は、前記上面および前記下面のうち前記非共鳴光の照射方向下方の面に前記複数の微粒子が押し付けられるように、前記非共鳴光の照射方向と同方向の散逸力を前記複数の微粒子に作用させるように構成されている、被検出物質の検出システム。 a holder configured to hold a detection kit provided with a microchannel having an upper surface and a lower surface ;
a pump for circulating a liquid sample, which contains a plurality of microparticles each modified with a host molecule capable of specifically binding to a substance to be detected, through the microchannel in a state in which the microchannel is filled with the liquid sample;
a light source that irradiates the liquid sample flowing through the microchannel with non-resonant light that is light outside the wavelength range of electronic resonance of the plurality of particles;
a light receiver for receiving light from the liquid sample;
a calculation device that executes a detection process for the target substance based on a signal from the light receiver ,
A detection system for a substance to be detected, wherein the light source is configured to apply a dissipation force to the plurality of microparticles in the same direction as the irradiation direction of the non-resonant light, so that the plurality of microparticles are pressed against the surface of the upper surface or the lower surface that is below the irradiation direction of the non-resonant light.
被検出物質に特異的に結合するホスト分子で各々が修飾された複数の微粒子を含む液体試料を前記マイクロ流路内が充填された状態で前記マイクロ流路に流通させるポンプと、
前記複数の微粒子の電子的共鳴の波長域外の光である非共鳴光を前記マイクロ流路を流通している前記液体試料に照射する光源と、
前記液体試料を撮影するカメラと、
前記カメラからの信号に基づいて前記被検出物質の検出処理を実行する演算装置とを備え、
前記演算装置は、前記検出処理において、
前記カメラにより撮影された画像から、前記被検出物質と前記複数の微粒子とが凝集することによって形成された凝集体のサイズを表す指標を算出し、
前記液体試料が前記マイクロ流路を流通している条件下において前記被検出物質の濃度と前記指標との間に予め求められた定量的な対応関係を参照することによって、算出された前記指標から前記液体試料に含まれる前記被検出物質の濃度を算出する、被検出物質の検出システム。 a holder configured to hold a detection kit provided with a microchannel;
a pump for circulating a liquid sample, which contains a plurality of microparticles each modified with a host molecule capable of specifically binding to a substance to be detected, through the microchannel in a state in which the microchannel is filled with the liquid sample;
a light source that irradiates the liquid sample flowing through the microchannel with non-resonant light that is light outside the wavelength range of electronic resonance of the plurality of particles;
A camera for photographing the liquid sample;
a computing device that executes a detection process for the target substance based on a signal from the camera,
The arithmetic device, in the detection process,
calculating an index representing a size of an aggregate formed by aggregation of the target substance and the plurality of microparticles from the image captured by the camera;
A detection system for a target substance, which calculates the concentration of the target substance contained in the liquid sample from the calculated index by referring to a quantitative correspondence relationship previously determined between the concentration of the target substance and the index under conditions in which the liquid sample is flowing through the microchannel.
前記演算装置は、前記カメラにより撮影された3次元画像から前記凝集体の体積を前記指標として算出する、請求項12に記載の被検出物質の検出システム。 a confocal optical system that irradiates the liquid sample with the non-resonant light from the light source and guides the light from the liquid sample to the camera ;
The system for detecting a target substance according to claim 12 , wherein the calculation device calculates a volume of the aggregate as the index from a three-dimensional image captured by the camera.
Applications Claiming Priority (3)
| Application Number | Priority Date | Filing Date | Title |
|---|---|---|---|
| JP2019158131 | 2019-08-30 | ||
| JP2019158131 | 2019-08-30 | ||
| PCT/JP2020/032758 WO2021040021A1 (en) | 2019-08-30 | 2020-08-28 | Detection method for substance to be detected and detection system for substance to be detected |
Publications (3)
| Publication Number | Publication Date |
|---|---|
| JPWO2021040021A1 JPWO2021040021A1 (en) | 2021-03-04 |
| JPWO2021040021A5 JPWO2021040021A5 (en) | 2022-06-23 |
| JP7635994B2 true JP7635994B2 (en) | 2025-02-26 |
Family
ID=74685197
Family Applications (1)
| Application Number | Title | Priority Date | Filing Date |
|---|---|---|---|
| JP2021543081A Active JP7635994B2 (en) | 2019-08-30 | 2020-08-28 | Method and system for detecting target substance |
Country Status (4)
| Country | Link |
|---|---|
| US (1) | US20220326249A1 (en) |
| EP (1) | EP4024030A4 (en) |
| JP (1) | JP7635994B2 (en) |
| WO (1) | WO2021040021A1 (en) |
Families Citing this family (4)
| Publication number | Priority date | Publication date | Assignee | Title |
|---|---|---|---|---|
| JPWO2023163099A1 (en) * | 2022-02-24 | 2023-08-31 | ||
| EP4517290A1 (en) * | 2022-04-28 | 2025-03-05 | University Public Corporation Osaka | Microbe accumulation method and accumulation system |
| EP4517323A1 (en) | 2022-05-18 | 2025-03-05 | University Public Corporation Osaka | Kit for detecting glycoprotein |
| JP2024030302A (en) * | 2022-08-24 | 2024-03-07 | 株式会社Jvcケンウッド | Target substance measurement method and target substance measurement system |
Citations (2)
| Publication number | Priority date | Publication date | Assignee | Title |
|---|---|---|---|---|
| WO2014192937A1 (en) | 2013-05-30 | 2014-12-04 | 公立大学法人大阪府立大学 | Target-substance detection apparatus and method |
| WO2018207937A1 (en) | 2017-05-12 | 2018-11-15 | 公立大学法人大阪府立大学 | Impedance measuring system, impedance measuring method, and system for detecting substance being detected |
Family Cites Families (18)
| Publication number | Priority date | Publication date | Assignee | Title |
|---|---|---|---|---|
| US4893886A (en) * | 1987-09-17 | 1990-01-16 | American Telephone And Telegraph Company | Non-destructive optical trap for biological particles and method of doing same |
| JP2675895B2 (en) * | 1990-04-25 | 1997-11-12 | キヤノン株式会社 | Sample processing method, sample measuring method, and sample measuring device |
| US5198369A (en) * | 1990-04-25 | 1993-03-30 | Canon Kabushiki Kaisha | Sample measuring method using agglomeration reaction of microcarriers |
| JPH0466873A (en) * | 1990-07-06 | 1992-03-03 | Canon Inc | Sample processing method, sample measurement method, and sample measurement device |
| ATE172791T1 (en) * | 1992-02-20 | 1998-11-15 | Canon Kk | METHOD AND MEASURING APPARATUS FOR HANDLING PARTICLES |
| JP2756397B2 (en) * | 1992-02-20 | 1998-05-25 | キヤノン株式会社 | Particle operation method and apparatus, and measurement apparatus using the same |
| JP3825501B2 (en) * | 1996-06-10 | 2006-09-27 | 吉郎 岡見 | Fine substance holding carrier, suspension system thereof, fine substance operation device, and fine substance position control method |
| WO2000036450A1 (en) * | 1998-12-17 | 2000-06-22 | Leica Microsystems Heidelberg Gmbh | Method for differentiated investigation of diverse structures in preferably biological preparations |
| WO2002031179A2 (en) * | 2000-10-11 | 2002-04-18 | Evotec Oai Ag | Multiplex assays using nanoparticles |
| WO2002068932A2 (en) * | 2001-02-23 | 2002-09-06 | Genicon Sciences Corporation | Methods for providing extended dynamic range in analyte assays |
| US7515269B1 (en) * | 2004-02-03 | 2009-04-07 | The United States Of America As Represented By The Secretary Of The Army | Surface-enhanced-spectroscopic detection of optically trapped particulate |
| US8101431B2 (en) * | 2004-02-27 | 2012-01-24 | Board Of Regents, The University Of Texas System | Integration of fluids and reagents into self-contained cartridges containing sensor elements and reagent delivery systems |
| JP4878550B2 (en) * | 2004-03-12 | 2012-02-15 | 独立行政法人科学技術振興機構 | Quantum dot operation method and quantum dot generation operation device |
| JP4525725B2 (en) * | 2007-10-18 | 2010-08-18 | ソニー株式会社 | OPTICAL MEASUREMENT UNIT, OPTICAL MEASUREMENT MEMBER, FINE PARTICLE MEASUREMENT DEVICE PROVIDED WITH THE SAME, AND MICROPARTICLE OPTICAL MEASUREMENT METHOD |
| WO2015139028A1 (en) * | 2014-03-14 | 2015-09-17 | Optofluidics, Inc. | Using optical forces to measure the property of a substance |
| EP3098606A1 (en) * | 2015-05-29 | 2016-11-30 | Roche Diagniostics GmbH | Cartridge for dispensing particles and a reagent fluid |
| US10180383B2 (en) * | 2016-03-31 | 2019-01-15 | Purdue Research Foundation | System and method for sensing and trapping nanoparticles with plasmonic nanopores |
| JPWO2018003856A1 (en) * | 2016-06-28 | 2019-05-23 | 学校法人慶應義塾 | Micro-well plate for forming droplet array and method of manufacturing droplet array |
-
2020
- 2020-08-28 WO PCT/JP2020/032758 patent/WO2021040021A1/en not_active Ceased
- 2020-08-28 JP JP2021543081A patent/JP7635994B2/en active Active
- 2020-08-28 US US17/639,087 patent/US20220326249A1/en active Pending
- 2020-08-28 EP EP20859031.5A patent/EP4024030A4/en active Pending
Patent Citations (2)
| Publication number | Priority date | Publication date | Assignee | Title |
|---|---|---|---|---|
| WO2014192937A1 (en) | 2013-05-30 | 2014-12-04 | 公立大学法人大阪府立大学 | Target-substance detection apparatus and method |
| WO2018207937A1 (en) | 2017-05-12 | 2018-11-15 | 公立大学法人大阪府立大学 | Impedance measuring system, impedance measuring method, and system for detecting substance being detected |
Non-Patent Citations (1)
| Title |
|---|
| Mayu Ueda,Microflow-mediated optical assembly of nanoparticles with femtogram protein via shrinkage of light-induced bubbles Scilightfeatured,APL Photonics,2019年01月,Vol.4 No.1,pp.010802-1~010802-6,https://doi.org/10.1063/1.5079306 |
Also Published As
| Publication number | Publication date |
|---|---|
| JPWO2021040021A1 (en) | 2021-03-04 |
| EP4024030A1 (en) | 2022-07-06 |
| WO2021040021A1 (en) | 2021-03-04 |
| EP4024030A4 (en) | 2023-09-13 |
| US20220326249A1 (en) | 2022-10-13 |
Similar Documents
| Publication | Publication Date | Title |
|---|---|---|
| JP7635994B2 (en) | Method and system for detecting target substance | |
| US8710413B2 (en) | Optical analysis device, optical analysis method and computer program for optical analysis | |
| US9903861B2 (en) | Device and method for detecting an analyte | |
| JP5652393B2 (en) | Plasmon excitation sensor and assay method used for measurement method by SPFS-LPFS system | |
| CN103210302B (en) | Optical analysis device and optical analysis method for observing polarization characteristics of individual luminescent particles | |
| JP5428322B2 (en) | Assay method using plasmon excitation sensor | |
| CN116438438A (en) | Methods and devices for flow-based single particle and/or single molecule analysis | |
| JP6010029B2 (en) | Method for detecting fluorescent particles | |
| JPWO2013031377A1 (en) | Optical analysis apparatus using single luminescent particle detection, optical analysis method, and computer program for optical analysis | |
| JP6013332B2 (en) | Target particle counting method | |
| JPWO2014017433A1 (en) | Optical specimen detector | |
| JP6482774B2 (en) | Biological analysis device, analysis apparatus, and analysis method |
Legal Events
| Date | Code | Title | Description |
|---|---|---|---|
| A529 | Written submission of copy of amendment under article 34 pct |
Free format text: JAPANESE INTERMEDIATE CODE: A5211 Effective date: 20220228 |
|
| A621 | Written request for application examination |
Free format text: JAPANESE INTERMEDIATE CODE: A621 Effective date: 20230731 |
|
| A131 | Notification of reasons for refusal |
Free format text: JAPANESE INTERMEDIATE CODE: A131 Effective date: 20240806 |
|
| A521 | Request for written amendment filed |
Free format text: JAPANESE INTERMEDIATE CODE: A523 Effective date: 20241001 |
|
| TRDD | Decision of grant or rejection written | ||
| A01 | Written decision to grant a patent or to grant a registration (utility model) |
Free format text: JAPANESE INTERMEDIATE CODE: A01 Effective date: 20250128 |
|
| A61 | First payment of annual fees (during grant procedure) |
Free format text: JAPANESE INTERMEDIATE CODE: A61 Effective date: 20250205 |
|
| R150 | Certificate of patent or registration of utility model |
Ref document number: 7635994 Country of ref document: JP Free format text: JAPANESE INTERMEDIATE CODE: R150 |
|
| S531 | Written request for registration of change of domicile |
Free format text: JAPANESE INTERMEDIATE CODE: R313531 |
|
| R370 | Written measure of declining of transfer procedure |
Free format text: JAPANESE INTERMEDIATE CODE: R370 |