JP7548773B2 - Safety assessment system and safety assessment method - Google Patents
Safety assessment system and safety assessment method Download PDFInfo
- Publication number
- JP7548773B2 JP7548773B2 JP2020179855A JP2020179855A JP7548773B2 JP 7548773 B2 JP7548773 B2 JP 7548773B2 JP 2020179855 A JP2020179855 A JP 2020179855A JP 2020179855 A JP2020179855 A JP 2020179855A JP 7548773 B2 JP7548773 B2 JP 7548773B2
- Authority
- JP
- Japan
- Prior art keywords
- risk
- time
- safety evaluation
- work machine
- area
- Prior art date
- Legal status (The legal status is an assumption and is not a legal conclusion. Google has not performed a legal analysis and makes no representation as to the accuracy of the status listed.)
- Active
Links
Images


Classifications
-
- E—FIXED CONSTRUCTIONS
- E02—HYDRAULIC ENGINEERING; FOUNDATIONS; SOIL SHIFTING
- E02F—DREDGING; SOIL-SHIFTING
- E02F9/00—Component parts of dredgers or soil-shifting machines, not restricted to one of the kinds covered by groups E02F3/00 - E02F7/00
- E02F9/26—Indicating devices
- E02F9/261—Surveying the work-site to be treated
-
- E—FIXED CONSTRUCTIONS
- E02—HYDRAULIC ENGINEERING; FOUNDATIONS; SOIL SHIFTING
- E02F—DREDGING; SOIL-SHIFTING
- E02F9/00—Component parts of dredgers or soil-shifting machines, not restricted to one of the kinds covered by groups E02F3/00 - E02F7/00
- E02F9/20—Drives; Control devices
- E02F9/2025—Particular purposes of control systems not otherwise provided for
- E02F9/2054—Fleet management
-
- E—FIXED CONSTRUCTIONS
- E02—HYDRAULIC ENGINEERING; FOUNDATIONS; SOIL SHIFTING
- E02F—DREDGING; SOIL-SHIFTING
- E02F9/00—Component parts of dredgers or soil-shifting machines, not restricted to one of the kinds covered by groups E02F3/00 - E02F7/00
- E02F9/24—Safety devices, e.g. for preventing overload
-
- E—FIXED CONSTRUCTIONS
- E02—HYDRAULIC ENGINEERING; FOUNDATIONS; SOIL SHIFTING
- E02F—DREDGING; SOIL-SHIFTING
- E02F9/00—Component parts of dredgers or soil-shifting machines, not restricted to one of the kinds covered by groups E02F3/00 - E02F7/00
- E02F9/26—Indicating devices
-
- B—PERFORMING OPERATIONS; TRANSPORTING
- B60—VEHICLES IN GENERAL
- B60Y—INDEXING SCHEME RELATING TO ASPECTS CROSS-CUTTING VEHICLE TECHNOLOGY
- B60Y2200/00—Type of vehicle
- B60Y2200/40—Special vehicles
- B60Y2200/41—Construction vehicles, e.g. graders, excavators
- B60Y2200/412—Excavators
-
- E—FIXED CONSTRUCTIONS
- E02—HYDRAULIC ENGINEERING; FOUNDATIONS; SOIL SHIFTING
- E02F—DREDGING; SOIL-SHIFTING
- E02F3/00—Dredgers; Soil-shifting machines
- E02F3/04—Dredgers; Soil-shifting machines mechanically-driven
- E02F3/28—Dredgers; Soil-shifting machines mechanically-driven with digging tools mounted on a dipper- or bucket-arm, i.e. there is either one arm or a pair of arms, e.g. dippers, buckets
- E02F3/36—Component parts
- E02F3/42—Drives for dippers, buckets, dipper-arms or bucket-arms
- E02F3/43—Control of dipper or bucket position; Control of sequence of drive operations
- E02F3/435—Control of dipper or bucket position; Control of sequence of drive operations for dipper-arms, backhoes or the like
Landscapes
- Engineering & Computer Science (AREA)
- Mining & Mineral Resources (AREA)
- Civil Engineering (AREA)
- General Engineering & Computer Science (AREA)
- Structural Engineering (AREA)
- Component Parts Of Construction Machinery (AREA)
- Operation Control Of Excavators (AREA)
Description
本開示は、作業機械の安全評価システムおよび安全評価方法に関する。 This disclosure relates to a safety assessment system and a safety assessment method for a work machine.
特許文献1には、作業機械の周囲で障害物が検知されたことを示す接近情報を出力する技術が開示されている。特許文献1に係る接近情報は、障害物検知の検知回数を表す。
ところで、障害物の検知などの作業機械に係るインシデントが生じるリスクの検知回数は、確かにリスクの大きさを表し得る。一方で、リスクの発生後直ちに当該リスクが解消される場合と、リスクがある状態が継続される場合とでは、検知回数が同じであっても実際のリスクの大きさは異なると考えられる。つまり、リスクの検知回数のみによっては安全性を適切に評価することができない可能性がある。
本開示の目的は、作業機械の安全性を適切に評価することができる安全評価システムおよび安全評価方法を提供することにある。
Incidentally, the number of times that a risk of an incident occurring related to a work machine, such as the detection of an obstacle, is detected can certainly indicate the magnitude of the risk. However, even if the number of detections is the same, the actual magnitude of the risk is thought to differ between a case where the risk is eliminated immediately after its occurrence and a case where the risk continues to exist. In other words, there is a possibility that safety cannot be appropriately evaluated based only on the number of times that a risk is detected.
An object of the present disclosure is to provide a safety assessment system and a safety assessment method that can appropriately assess the safety of a work machine.
本発明の一態様によれば、安全評価システムは、作業機械に係るインシデントが生じるリスクを検知するリスク検知部と、前記リスクの発生時刻から前記リスクの解消時刻までのリスク時間を計測する時間算出部と、前記リスク時間に基づいて安全評価指標を算出する評価部と、前記安全評価指標を出力する出力部とを備える。 According to one aspect of the present invention, the safety evaluation system includes a risk detection unit that detects the risk of an incident occurring related to a work machine, a time calculation unit that measures a risk time from the time the risk occurs to the time the risk is resolved, an evaluation unit that calculates a safety evaluation index based on the risk time, and an output unit that outputs the safety evaluation index.
上記態様によれば、安全評価システムは、作業機械の安全性を適切に評価することができる。 According to the above aspect, the safety assessment system can appropriately assess the safety of the work machine.
〈第1の実施形態〉
《リスク管理システム1の構成》
以下、図面を参照しながら実施形態について詳しく説明する。
図1は、第1の実施形態に係るリスク管理システム1の構成を示す概略図である。リスク管理システム1は、利用者に作業機械100に係るインシデントが生じるリスクに係るインシデントレポートを提示する。利用者の例としては、稼働現場の管理者または作業機械100のオペレータが挙げられる。利用者は、インシデントレポートを視認することで、稼働現場の整備の検討、およびオペレータによる運転の指導を行うことができる。
First Embodiment
<Configuration of
Hereinafter, the embodiments will be described in detail with reference to the drawings.
1 is a schematic diagram showing the configuration of a
リスク管理システム1は、作業機械100、レポート生成装置300、および利用者端末500を備える。作業機械100、レポート生成装置300、および利用者端末500は、ネットワークを介して通信可能に接続される。
The
作業機械100は、例えばそれが油圧ショベルである場合、施工現場にて稼働し、土砂の掘削作業などを行う。また、作業機械100は、作業状態に基づいて所定のインシデントリスクがあると判定した場合にインシデントリスクをオペレータに報知するための警告を発する。インシデントリスクの判定の詳細については後述する。インシデントリスクの例としては、衝突リスク、転倒リスク、および遵守違反リスクが挙げられる。図1に示す作業機械100は、油圧ショベルであるが、他の実施形態においては、他の作業機械であってもよい。作業機械100の例としては、ブルドーザ、ダンプトラック、フォークリフト、ホイールローダ、モータグレーダなどが挙げられる。
When the
レポート生成装置300は、作業機械100に係るインシデントが生じるリスクをまとめたインシデントレポートデータを生成する。
利用者端末500は、レポート生成装置300が生成したインシデントレポートデータを表示し、または印刷する。
The
The
《作業機械100の構成》
図2は、第1の実施形態に係る作業機械100の構成を示す図である。
作業機械100は、走行体110、旋回体130、作業機150、運転室170、制御装置190を備える。
走行体110は、作業機械100を走行可能に支持する。走行体110は、例えば左右1対の無限軌道である。
旋回体130は、走行体110に旋回中心回りに旋回可能に支持される。
作業機150は、旋回体130の前部に上下方向に駆動可能に支持される。作業機150は、油圧により駆動する。作業機150は、ブーム151、アーム152、およびバケット153を備える。ブーム151の基端部は、旋回体130にピンを介して取り付けられる。アーム152の基端部は、ブーム151の先端部にピンを介して取り付けられる。バケット153の基端部は、アーム152の先端部にピンを介して取り付けられる。ここで、旋回体130のうち作業機150が取り付けられる部分を前部という。また、旋回体130について、前部を基準に、反対側の部分を後部、左側の部分を左部、右側の部分を右部という。
運転室170は、旋回体130の前部に設けられる。運転室170内には、作業機械100を操作するための操作装置およびインシデントリスクの警報を発するための警報装置が設けられる。
制御装置190は、オペレータの操作に基づいて、走行体110、旋回体130、および作業機150を制御する。制御装置190は、例えば運転室の内部に設けられる。制御装置190は、稼働エリア提示装置の一例である。
Configuration of the
FIG. 2 is a diagram showing the configuration of the
The
The running
The rotating
The
The operator's
The
作業機械100は、作業機械100の作業状態を検出するための複数のセンサを備える。具体的には、作業機械100は、位置方位検出器101、傾斜検出器102、走行加速度センサ103、旋回角センサ104、ブーム角センサ105、アーム角センサ106、バケット角センサ107、複数の撮像装置108、複数のレーダ装置109を備える。
The
作業機械100
位置方位検出器101は、旋回体130の現場座標系における位置および旋回体130が向く方位を演算する。位置方位検出器101は、GNSSを構成する人工衛星から測位信号を受信する2つのアンテナを備える。2つのアンテナは、それぞれ旋回体130の異なる位置に設置される。例えば2つのアンテナは、旋回体130のカウンターウェイト部に設けられる。位置方位検出器101は、2つのアンテナの少なくとも一方が受信した測位信号に基づいて、現場座標系における旋回体130の代表点の位置を検出する。位置方位検出器101は、2つのアンテナのそれぞれが受信した測位信号を用いて、現場座標系において旋回体130が向く方位を検出する。
The position and
傾斜検出器102は、旋回体130の加速度および角速度を計測し、計測結果に基づいて旋回体130の水平面に対する傾き(例えば、ロール角およびピッチ角)を検出する。傾斜検出器102は、例えば運転室170の下方に設置される。傾斜検出器102の例としては、IMU(Inertial Measurement Unit:慣性計測装置)が挙げられる。
The
走行加速度センサ103は、走行体110に設けられ、作業機械100の走行に係る加速度を検出する。
旋回角センサ104は、旋回体130の旋回中心に設けられ、走行体110と旋回体130の旋回角度を検出する。
ブーム角センサ105は、旋回体130とブーム151とを接続するピンに設けられ、旋回体130に対するブーム151の回転角であるブーム角を検出する。
アーム角センサ106は、ブーム151とアーム152とを接続するピンに設けられ、ブーム151に対するアーム152の回転角であるアーム角を検出する。
バケット角センサ107は、アーム152とバケット153とを接続するピンに設けられ、アーム152に対するバケット153の回転角であるバケット角を検出する。
The traveling
The
The
The
The
複数の撮像装置108は、それぞれ旋回体130に設けられる。複数の撮像装置108の撮像範囲は、作業機械100の全周のうち、運転室170から視認できない範囲を少なくともカバーする。
複数のレーダ装置109は、それぞれ旋回体130に設けられる。複数のレーダ装置109の撮像範囲は、作業機械100の全周のうち、運転室170から視認できない範囲を少なくともカバーする。
The
The multiple radar devices 109 are each provided on the
図3は、第1の実施形態に係る制御装置190の構成を示す概略ブロック図である。
制御装置190は、プロセッサ210、メインメモリ230、ストレージ250、インタフェース270を備えるコンピュータである。
FIG. 3 is a schematic block diagram showing the configuration of the
The
ストレージ250は、一時的でない有形の記憶媒体である。ストレージ250の例としては、磁気ディスク、光ディスク、光磁気ディスク、半導体メモリ等が挙げられる。ストレージ250は、制御装置190のバスに直接接続された内部メディアであってもよいし、インタフェース270または通信回線を介して制御装置190に接続される外部メディアであってもよい。ストレージ250は、作業機械100を制御するためのプログラムを記憶する。
プログラムは、制御装置190に発揮させる機能の一部を実現するためのものであってもよい。例えば、プログラムは、ストレージ250に既に記憶されている他のプログラムとの組み合わせ、または他の装置に実装された他のプログラムとの組み合わせによって機能を発揮させるものであってもよい。なお、他の実施形態においては、制御装置190は、上記構成に加えて、または上記構成に代えてPLD(Programmable Logic Device)などのカスタムLSI(Large Scale Integrated Circuit)を備えてもよい。PLDの例としては、PAL(Programmable Array Logic)、GAL(Generic Array Logic)、CPLD(Complex Programmable Logic Device)、FPGA(Field Programmable Gate Array)が挙げられる。この場合、プロセッサによって実現される機能の一部または全部が当該集積回路によって実現されてよい。
The program may be for implementing part of the functions to be performed by the
プロセッサ210は、プログラムを実行することで、取得部211、判定部212、送信部213として機能する。
The
取得部211は、位置方位検出器101、傾斜検出器102、走行加速度センサ103、旋回角センサ104、ブーム角センサ105、アーム角センサ106、バケット角センサ107、撮像装置108、レーダ装置109から、それぞれ計測値を取得する。なお、撮像装置108の計測値は、撮像画像である。
なお、取得部211が取得する情報のうち、少なくとも位置方位検出器101によって取得される位置情報は、作業機械100の稼働中は常に所定の時間間隔ごとに記憶されることで、稼働中の位置履歴データとして蓄積される。
The
Of the information acquired by the
判定部212は、取得部211が取得した計測値に基づいてインシデントリスクの有無を判定し、インシデントリスクがあると判定した場合には警報装置に警報の出力指示を出力する。警報装置は、警報の出力指示が入力されると警報を発してインシデントリスクの存在をオペレータに報知する。
The
インシデントリスクの例としては、転倒リスク、衝突リスク、および遵守違反リスクが挙げられる。転倒リスクの例としては、傾斜地における不安定姿勢や吊荷作業時の不安定姿勢が挙げられる。衝突リスクの例としては、危険領域への障害物や人の侵入や、走行時における、走行体110の向きと旋回体130の向き(すなわち運転室170の向き)との不一致(以下、「走行体110の向きの逆転」と記す。)が挙げられる。遵守違反リスクの例としては、警報の無視や離席時における走行体110の向きの逆転が挙げられる。なお、シートベルト非装着や酒気帯び運転なども遵守違反リスクに含めることができる。
Examples of incident risks include the risk of falling, the risk of collision, and the risk of non-compliance. Examples of risk of falling include an unstable posture on a slope or during lifting work. Examples of collision risk include the intrusion of an obstacle or person into a dangerous area, and a mismatch between the direction of the running
判定部212は、傾斜検出器102が検出した作業機械100の水平面に対する傾きに基いて作業機械100の姿勢を算出することによって転倒リスクの有無を判定することができる。また、判定部212は、作業機械100の重心を算出することによって転倒リスクの有無を判定してもよい。また、作業機械100の姿勢は、作業機械100の水平面に対する傾きに加え、旋回体130の旋回角、および作業機150の角度などをさらに用いて算出されてもよい。
The
判定部212は、撮像装置108が撮像した画像のうち危険領域に対応する部分についてのパターンマッチングにより、衝突リスクの有無を判定することができる。また判定部212は、レーダ装置109が取得した距離データにより危険領域内の障害物の有無を判定することで、衝突リスクの有無を判定することができる。
The
送信部213は、警報が発報されたときの作業機械100の状態の履歴を示すデータ(以下、「警報履歴データ」と記す)と上述した稼働中の位置履歴データとを、レポート生成装置300に送信する。警報履歴データは、警報の出力指示が出力された時刻とそのときの計測値、およびそのときの作業機械100の位置の情報を含む。送信部213は、判定部212によってインシデントリスクがあると判定されたときから、インシデントリスクがないと判定されるまでの間、そのときの時刻と計測値と位置情報とを関連付けることで、警報履歴データを生成する。送信部213は、所定の送信タイミングで、警報履歴データや稼働中の位置履歴データなどの履歴データをバッチ処理によりレポート生成装置300に送信してもよいし、リアルタイムにレポート生成装置300に送信してもよい。履歴データをバッチ処理にて送信する場合、取得部211はストレージ250に履歴データを記録し、送信部213はこれをレポート生成装置300に送信する。なお、通信量の削減のために、送信部213は、必要に応じてこれら履歴データは圧縮して送信してもよい。送信部213が送信する履歴データには、作業機械100を操作するオペレータの識別情報が含まれる。オペレータの識別情報は、例えば、作業機械100の起動時に、IDキーから読み出される。
The
《レポート生成装置300の構成》
図4は、第1の実施形態に係るレポート生成装置300の構成を示す概略ブロック図である。
レポート生成装置300は、プロセッサ310、メインメモリ330、ストレージ350、インタフェース370を備えるコンピュータである。
Configuration of
FIG. 4 is a schematic block diagram showing the configuration of the
The
ストレージ350は、一時的でない有形の記憶媒体である。ストレージ350の例としては、磁気ディスク、光ディスク、光磁気ディスク、半導体メモリ等が挙げられる。ストレージ350は、レポート生成装置300のバスに直接接続された内部メディアであってもよいし、インタフェース370または通信回線を介してレポート生成装置300に接続される外部メディアであってもよい。ストレージ350は、インシデントレポートを生成するためのプログラムを記憶する。
プログラムは、レポート生成装置300に発揮させる機能の一部を実現するためのものであってもよい。例えば、プログラムは、ストレージ350に既に記憶されている他のプログラムとの組み合わせ、または他の装置に実装された他のプログラムとの組み合わせによって機能を発揮させるものであってもよい。なお、他の実施形態においては、レポート生成装置300は、上記構成に加えて、または上記構成に代えてカスタムLSIを備えてもよい。この場合、プロセッサによって実現される機能の一部または全部が当該集積回路によって実現されてよい。
The program may be for realizing some of the functions to be performed by the
ストレージ350には、予め稼働現場の地図データが記録される。
プロセッサ310は、プログラムを実行することで、受信部311、入力部312、算出部313、生成部314、出力部315として機能する。
Map data of the operation site is recorded in advance in the
The
受信部311は、作業機械100から警報履歴データおよび稼働中の位置履歴データを含む履歴データを受信する。受信部311は、受信した履歴データをストレージ350に記録する。
The receiving
入力部312は、利用者端末500から、インシデントレポートの評価対象の入力を受け付ける。評価対象は、評価に係る期間、およびオペレータの識別情報または稼働現場の識別情報によって指定される。
The
算出部313は、受信部311が受信した警報履歴データに基づいて、入力された評価期間および評価対象に係る複数のインシデントリスクそれぞれの大きさを示すスコアを算出する。また算出部313は、受信部311が受信した警報履歴データおよび算出したスコアに基づいて、インシデントレポートの生成に用いられる値を算出する。
また、算出部313は、受信部311が稼働中の位置履歴データに基づいて、後述する稼働現場の各エリアにおける作業機械100の滞在時間を算出する。
The
Furthermore, the
生成部314は、算出部313が算出した結果に基づいて、インシデントレポートを示すインシデントレポートデータを生成する。
The
出力部315は、生成部314が生成したインシデントレポートデータを利用者端末500に出力する。
The
《スコアの算出方法》
ここで、算出部313によるインシデントリスクに係るスコアの算出方法の例について説明する。
《How the score is calculated》
Here, an example of a method for calculating the score related to the incident risk by the
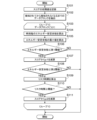
(転倒リスクに係るスコア)
まず、転倒リスクに係るスコアの算出方法を説明する。図5は、第1の実施形態に係る転倒リスクに係るスコアの算出方法を示すフローチャートである。算出部313は、満点を表す転倒リスクに係るスコアの初期値をメインメモリ330に記録する(ステップS101)。算出部313は、警報履歴データから、インシデントリスクが検知されてからインシデントリスクが検知されなくなるまでを表す複数のデータブロックを抽出する(ステップS102)。例えば、算出部313は、時刻が不連続となる位置で警報履歴データを分割することで、複数のデータブロックを抽出することができる。算出部313は、複数のデータブロックを1つずつ選択し(ステップS103)、選択されたデータブロックについて以下のステップS104からステップS111の処理を行う。
(Fall risk score)
First, a calculation method for a score related to a fall risk will be described. FIG. 5 is a flowchart showing a calculation method for a score related to a fall risk according to the first embodiment. The
算出部313は、選択されたデータブロックに含まれる傾斜検出器102、ブーム角センサ105、アーム角センサ106、およびバケット角センサ107の計測値、ならびに既知の作業機械100の各部の形状、重量および重心位置に基づいて、各時刻における作業機械100のエネルギー安定余裕を算出する(ステップS104)。エネルギー安定余裕は、作業機械100が転倒するまでに供給しなければならないエネルギーの大きさを表す量であり、以下の式(1)によって求められる。
The

図6は、エネルギー安定余裕の算出に係る変数を示す図である。式(1)において、Eは、エネルギー安定余裕を示す。Mは、作業機械100の総重量を示す。gは重力加速度を示す。Hは、作業機械100の接地点から、転倒姿勢時の作業機械100の静的重心位置までの高さを示す。x及びzは、現在の作業機械100の静的重心位置の車体座標系におけるX座標及びZ座標の値を示す。θは、水平面に対する作業機械100の傾きを示す。
Figure 6 is a diagram showing variables related to the calculation of the energy stability margin. In formula (1), E indicates the energy stability margin. M indicates the total weight of the
算出部313は、選択されたデータブロックにおけるエネルギー安定余裕の最小値を特定する(ステップS105)。算出部313は、エネルギー安定余裕の最小値が第1閾値以下であるか否かを判定する(ステップS106)。第1閾値は、転倒が発生する可能性があることを示す閾値である。エネルギー安定余裕の最小値が第1閾値以下である場合(ステップS106:YES)、算出部313は、メインメモリ330に記憶される転倒リスクに係るスコアから第1減点数p1を減算する(ステップS107)。なお、エネルギー安定余裕が第1閾値より大きい場合(ステップS106:NO)、スコアは減算されない。つまり、算出部313は、エネルギー安定余裕の最小値が第1閾値以下であるデータブロックの数、すなわちエネルギー安定余裕が第1閾値以下となった回数だけ、スコアから第1減点数p1を減算する。これにより、スコアは、エネルギー安定余裕が第1閾値以下となった回数と第1減点数p1との積だけ減算される。エネルギー安定余裕が第1閾値以下となった回数は、インシデントリスクの発生回数といえる。
The
次に、算出部313は、エネルギー安定余裕の最小値が第2閾値以下であるか否かを判定する(ステップS108)。第2閾値は、転倒している可能性が高いことを示す閾値である。第2閾値は第1閾値より小さい。エネルギー安定余裕の最小値が第2閾値以下である場合(ステップS108:YES)、算出部313は、選択されたデータブロックにおけるインシデントリスクの発生時刻から解消時刻までのリスク時間を算出する(ステップS109)。リスク時間は、データブロックの最初の時刻と最後の時刻の差を求めることで得られる。作業機械100が転倒した後に復帰した場合、転倒リスクに係るリスク時間は、転倒から復帰までの時間であるといえる。また、作業機械100が転倒したまま復帰せずに停止した場合、転倒リスクに係るリスク時間は、転倒から制御装置190が停止するまでの時間であるといえる。算出部313は、リスク時間が所定の閾値以上であるか否かを判定する(ステップS110)。
Next, the
リスク時間が所定の閾値以上である場合(ステップS110:YES)、作業機械100が転倒している可能性が高い。したがって、算出部313は、メインメモリ330に記憶される転倒リスクに係るスコアから第2減点数p2を減算する(ステップS111)。第2減点数p2は、第1減点数p1より十分に大きい値である。なお、エネルギー安定余裕が第2閾値より大きい場合(ステップS108:NO)、またはリスク時間が閾値未満である場合(ステップS110:NO)、スコアから第2減点数p2を減算されない。つまり、算出部313は、リスク時間が閾値以上であるデータブロックの数、すなわちリスク時間が閾値以上となった回数だけ、スコアから第2減点数p2を減算する。これにより、スコアは、リスク時間が閾値以上となった回数と第2減点数p2との積だけ減算される。
If the risk time is equal to or greater than a predetermined threshold (step S110: YES), there is a high possibility that the
算出部313は、各データブロックについて上記計算を行うことで、転倒リスクに係るスコアを算出する。つまり、算出部313は、リスク時間が所定の閾値を超えた回数に第2減点数を乗算した値と、インシデントリスクの発生回数に第1減点数を乗算した値との和を、満点から減算することで、転倒リスクに係るスコアを算出する。なお、他の実施形態においては、エネルギー安定余裕に代えて作業機械100のゼロモーメントポイントを用いてスコアを算出してもよい。
The
(衝突リスクに係るスコア)
衝突リスクに係るスコアの算出方法を説明する。図7は、第1の実施形態に係る衝突リスクに係るスコアの算出方法を示すフローチャートである。算出部313は、警報履歴データから、インシデントリスクが検知されてからインシデントリスクが検知されなくなるまでを表す複数のデータブロックを抽出する(ステップS201)。つまり、算出部313は、警告領域内に少なくとも1つの障害物の侵入が検知されてから、警告領域内にすべての障害物が検知されなくなるまでの作業機械100の状態を示すデータブロックを抽出する。図8は、第1の実施形態に係る作業機械100による衝突に係るインシデントリスクの判断基準を示す図である。図8に示すように、作業機械100の制御装置190は、作業機械100の旋回中心を中心とする警告領域A1及び制御領域A2の内部に障害物が存在するか否かを判定することで、衝突に係るインシデントリスクを検知する。警告領域A1は、障害物の存在を通知する警告を発生させる領域である。図8に示す警告領域A1は、旋回中心を中心とし、ブーム151の長さに近い半径を有する円形の領域である。制御領域A2は、作業機械100が障害物に接触しないように作業機械100を強制的に停止させる介入制御を発生させる領域である。図8に示す制御領域A2は、旋回中心を中心とし、警告領域A1より短い半径を有する円形の領域である。
算出部313は、複数のデータブロックを1つずつ選択し(ステップS202)、選択されたデータブロックについて以下のステップS203からステップS209の処理を行う。
(Collision risk score)
A method for calculating a score related to a collision risk will be described. FIG. 7 is a flowchart showing a method for calculating a score related to a collision risk according to the first embodiment. The
The
算出部313は、撮像装置108の撮像画像及びレーダ装置109の計測値に基づいて、時刻毎の作業機械100から障害物までの距離を算出する(ステップS203)。この時、撮像画像及びレーダ装置109の計測値から複数の障害物が検出される場合、算出部313は、作業機械100に最も近い障害物の距離を算出する。次に、算出部313は、選択されたデータブロックにおける距離の最小値を特定する(ステップS204)。算出部313は、選択されたデータブロックに係るリスク時間を算出する(ステップS205)。衝突リスクに係るリスク時間は、障害物が警告領域内に存在することを検知してから、障害物が警告領域内に存在することを検知しなくなるまでの時間である。
The
算出部313は、距離の最小値に基づいて、選択したデータブロックに係る期間において障害物が作業機械100を中心とする制御領域内に存在したか否かを判定する(ステップS206)。算出部313は、障害物が制御領域内に存在したと判定した場合(ステップS206:YES)、メインメモリ330に記憶する制御継続時間に、ステップS205で算出したリスク時間を加算することで、制御継続時間を更新する(ステップS207)。
Based on the minimum distance, the
算出部313は、障害物が制御領域内に存在しないと判定した場合(ステップS206:NO)、障害物が作業機械100を中心とする警告領域内に存在したか否かを判定する(ステップS208)。算出部313は、障害物が制御領域内に存在したと判定した場合(ステップS208:YES)、メインメモリ330に記憶する警告継続時間に、ステップS205で算出したリスク時間を加算することで、警告継続時間を更新する(ステップS209)。算出部313は、障害物が制御領域にも警告領域にも存在しないと判定した場合(ステップS208:NO)、リスク時間の加算を行わない。
When the
算出部313は、選択された各データブロックについてステップS203からステップS209の処理を行うと、算出された制御継続時間及び警告継続時間に基づいて衝突リスクに係るスコアを算出する(ステップS210)。具体的には、算出部313は、以下の式(2)に基づいて衝突リスクに係るスコアを算出する。
After performing the processes from step S203 to step S209 for each selected data block, the

式(2)において、scoreは、衝突リスクに係るスコアを示す。t1は、警告継続時間を示す。t2は、制御継続時間を示す。Aは、リスク時間に対する減点度合いの強さを示す係数を示す。Bは、制御領域に障害物が存在することに対する重みを示す。Tは、作業機械100の稼働時間を示す。稼働時間は、作業機械100のサービスメータの時間によって特定されてよい。
In formula (2), score indicates the score related to the collision risk. t1 indicates the warning duration. t2 indicates the control duration. A indicates a coefficient indicating the strength of the degree of deduction for the risk time. B indicates the weighting for the presence of an obstacle in the control area. T indicates the operating time of the
(他のスコア)
例えば、算出部313は、旋回角センサ104の計測値が±0度に近いほど値が大きく、180度に近いほど値が小さくなるように走行体110の向きの逆転に係るスコアを算出する。
例えば、算出部313は、警報装置が警報を発した時刻から警報が解除される時刻までの経過時間が大きいほど値が小さくなるように、警報の無視に係るスコアを算出する。
(Other scores)
For example, the
For example, the
《インシデントレポートの例》
図9は、第1の実施形態に係るインシデントレポートRの一例を示す図である。
インシデントレポートRには、評価対象情報R1、レーダーチャートR2、タイムチャートR3、稼働エリアマップR4、傾斜頻度画像R5、傾斜姿勢画像R6、方向別障害物頻度画像R7、および距離別障害物頻度画像R8が含まれる。
<<Example of an Incident Report>>
FIG. 9 is a diagram showing an example of an incident report R according to the first embodiment.
The incident report R includes evaluation target information R1, a radar chart R2, a time chart R3, an operating area map R4, a tilt frequency image R5, a tilt posture image R6, a direction-specific obstacle frequency image R7, and a distance-specific obstacle frequency image R8.
評価対象情報R1は、インシデントレポートRに係る評価対象を表す情報である。評価対象情報R1は、作業機械100の機番、オペレータの氏名、および評価期間を含む。
The evaluation target information R1 is information that represents the evaluation target related to the incident report R. The evaluation target information R1 includes the machine number of the
レーダーチャートR2は、複数のインシデントリスクのそれぞれに係るスコアを表す。レーダーチャートR2は、評価対象に係るオペレータの平均スコア、最大スコアおよび最小スコア、ならびに複数のオペレータの平均スコアを表す。 Radar chart R2 shows the scores for each of the multiple incident risks. Radar chart R2 shows the average score, maximum score, and minimum score of the operators for the evaluation targets, as well as the average score of multiple operators.
タイムチャートR3は、評価期間における複数のインシデントリスクのスコアの経時変化を表す。 Time chart R3 shows the changes in scores for multiple incident risks over time during the evaluation period.
稼働エリアマップR4は、稼働現場の各エリアにおける作業機械100の滞在時間と、各エリアにおけるリスクの大きさと、各インシデントリスクに係るスコアが最小となった位置、すなわちリスクが最大となった位置を表す。図9に示す例においては、稼働エリアマップR4は、稼働現場を表す地図と、稼働現場を複数のエリアに分割するグリッドと、各エリアの滞在時間及びリスクの大きさを示すオブジェクトと、インシデントリスクが最大となった位置を示すピンとを含む。つまり、レポート生成装置300は、稼働エリア提示装置の一例である。
The operating area map R4 shows the stay time of the
傾斜頻度画像R5は、作業機械100の傾斜方向別の転倒リスクに係る警報を発した回数を表す。具体的には、傾斜頻度画像R5は、機械画像、前方検知画像、後方検知画像、左方検知画像および右方検知画像を含む。機械画像は、作業機械100を表す。前方検知画像は、機械画像の前方(図示上側)に配置され、前方傾斜時の転倒リスクの発報回数を表す。後方検知画像は、機械画像の後方(図示下側)に配置され、後方傾斜時の転倒リスクの発報回数を表す。左方検知画像は、機械画像の左方(図示左側)に配置され、左方傾斜時の転倒リスクの発報回数を表す。右方検知画像は、機械画像の右方(図示右側)に配置され、右方傾斜時の転倒リスクの発報回数を表す。
The tilt frequency image R5 represents the number of times an alarm was issued relating to the risk of tipping over for each tilt direction of the
傾斜姿勢画像R6は、転倒リスクに係るスコアが最大となったときの作業機械100の姿勢を表す。すなわち、傾斜姿勢画像R6は、R1で示される期間の中で水平面に対する作業機械100の傾斜角が最も大きいときの作業機械100の姿勢を表す。
The tilted attitude image R6 represents the attitude of the
方向別障害物頻度画像R7は、作業機械100の近傍の障害物の侵入リスクに係る警報の方向別の頻度を表す。具体的には、方向別障害物頻度画像R7は、機械画像、前方検知画像、右前方検知画像、右後方検知画像、左後方検知画像、左前方検知画像を含む。機械画像は、作業機械100を表す。前方検知画像は、機械画像の前方(図示上側)に配置され、警報領域のうち作業機械100の前方に障害物が検知された頻度を表す。右前方検知画像は、機械画像の右前方(図示右上側)に配置され、警報領域のうち作業機械100の右前方に障害物が検知された頻度を表す。右後方検知画像は、機械画像の右後方(図示右下側)に配置され、警報領域のうち作業機械100の右後方に障害物が検知された頻度を表す。左後方検知画像は、機械画像の左後方(図示左下側)に配置され、警報領域のうち作業機械100の左後方に障害物が検知された頻度を表す。左前方検知画像は、機械画像の左前方(図示左上側)に配置され、警報領域のうち作業機械100の左前方に障害物が検知された頻度を表す。各検知画像は、色相によって障害物が検知された頻度を表す。例えば、検知頻度が低いほど青色に近く、検知頻度が高いほど赤色に近づく。検知頻度は、例えば検知回数を正規化することで求められる。
The direction-specific obstacle frequency image R7 represents the frequency of warnings by direction related to the risk of intrusion of an obstacle near the
距離別障害物頻度画像R8は、作業機械100の近傍の障害物の侵入リスクに係る警報の領域別の頻度を表す。具体的には、距離別障害物頻度画像R8は、機械画像、警報領域検知画像、制御領域検知画像を含む。機械画像は、作業機械100を表す。警報領域検知画像は、機械画像を囲む警報領域に相当する位置に配置された黄色のドーナツ型の画像であって、警報領域において障害物が検知された頻度を表す。制御領域検知画像は、機械画像を囲む制御領域に相当する位置に配置された赤色の円形の画像であって、制御領域において障害物が検知された頻度を表す。各検知画像は、数値によって障害物が検知された回数を表す。
The distance-based obstacle frequency image R8 represents the frequency of warnings by area related to the risk of an obstacle intrusion near the
《制御装置190の動作》
作業機械100の制御装置190の取得部211は、作業機械100の稼働中、所定のサンプリング周期に従って各種センサから計測値を取得する。判定部212は、計測値に基づいてインシデントリスクの有無を判定し、インシデントリスクがあると判定した場合には警報装置に警報の出力指示を出力する。送信部213は、警報履歴データや稼働中の位置履歴データなどの履歴データをレポート生成装置300に送信する。警報履歴データは、判定部212によって警報の出力指示を出力したときに生成される。また稼働中の位置履歴データは、作業機械100の稼働中の所定の時間間隔ごとに生成される。レポート生成装置300の受信部311は、作業機械100から履歴データを受信し、ストレージ350に記録する。これにより、レポート生成装置300のストレージ350には、複数の作業機械100の履歴データが収集される。
Operation of the
The
《レポート生成装置300の動作》
図10は、第1の実施形態に係るレポート生成装置300の動作を示すフローチャートである。
利用者は、利用者端末500を操作してレポート生成装置300にアクセスすることで、レポート生成装置300にインシデントレポートの生成指示を送信する。レポート生成装置300の利用者の例としては、作業機械100のオペレータや稼働現場の管理者などが挙げられる。
レポート生成装置300の入力部は、アクセスに応答し、インシデントレポートに係る評価対象の情報の入力を受け付ける(ステップS1)。評価対象の情報の例としては、評価対象に係るオペレータの識別情報または稼働現場の識別情報、および評価期間が挙げられる。なお、評価対象としてオペレータの識別情報が入力された場合、オペレータの個人に係るインシデントレポートが生成され、稼働現場の識別情報が入力された場合、当該稼働現場で作業する複数の作業機械100やオペレータに係るインシデントレポートが生成される。
<<Operation of the
FIG. 10 is a flowchart showing the operation of the
A user operates the
In response to the access, the input unit of the
利用者が利用者端末500を操作して評価対象の情報をレポート生成装置300に入力すると、算出部313は、ストレージ350から、入力された評価対象に係る履歴データを読み出す(ステップS2)。例えば、算出部313は、ストレージ350が記憶する履歴データのうち、評価対象に係るオペレータの識別情報または稼働現場の識別情報、および評価期間に関連付けられたものを読み出す。算出部313は、読み出した履歴データのうちの警報履歴データに基づいて、評価期間に係る時刻ごとに、当該時刻における各インシデントリスクのスコアを算出する(ステップS3)。つまり、算出部313は、図5に示すフローチャートに基づいて転倒リスクに係るスコアを算出し、図7に示すフローチャートに基づいて衝突リスクに係るスコアを算出する。
なお、ある時刻においてインシデントリスクが生じずに警報が出力されない場合、その時刻に係る警報履歴データが存在しない。この場合、算出部313は、当該時刻に係るスコアを最小値に設定する。
When the user operates the
If no incident risk occurs at a certain time and no warning is issued, there is no warning history data for that time. In this case, the
また、算出部313は、警報履歴データの各データブロックにおいて、ステップS204で算出される最も作業機械100と障害物との距離が近いときの障害物の位置に基づいて、作業機械100を中心とした方向別の障害物検知回数、及び距離別の障害物検知回数を特定する(ステップS4)。方向別の障害物検知回数とは、前方に障害物が検知された回数、右前方に障害物が検知された回数、右後方に障害物が検知された回数、左後方に障害物が検知された回数、および左前方に障害物が検知された回数である。距離別の障害物検知回数とは、警報領域において障害物が検知された回数および制御領域において障害物が検知された回数である。
The
次に、算出部313は、各インシデントリスクについて、平均スコア、最大スコアおよび最小スコアを算出する(ステップS5)。生成部314は、ステップS5で算出した平均スコア、最大スコアおよび最小スコアに基づいてレーダーチャートR2を生成する(ステップS6)。
次に、生成部314は、ステップS3で算出したスコアに基づいて、各インシデントリスクのスコアの経時変化を表すタイムチャートR3を生成する(ステップS7)。
Next, the
Next, the
次に、算出部313は、ステップS2で読み出した稼働中の位置履歴データに基づいて、時刻ごとに作業機械100が滞在していたエリアを算出する(ステップS8)。次に、算出部313は、各エリアにおける滞在時刻を積算することで、各エリアの滞在時間を算出する(ステップS9)。算出部313は、各エリアにおける滞在時刻に基づいて、ステップS3で算出したスコアとエリアとを関連付け、各エリアの平均スコアを算出する(ステップS10)。算出部313は、ステップS3で算出したスコアのうち、各インシデントリスクの最大のスコアを特定し、当該スコアに係る位置を特定する(ステップS11)。例えば、算出部313は、最大のスコアに係る時刻を特定し、ステップS8で特定した滞在時刻に関連付けられた位置を、最大のスコアに係る位置として特定する。
Next, the
生成部314は、ストレージ350に記憶された稼働現場を表す地図をグリッドによって複数のエリアに分割し、各エリアに係るグリッドに、ステップS9で算出した滞在時間に応じた大きさ、かつステップS10で算出した平均スコアに応じた色のオブジェクトを配置し、さらにステップS11で特定した位置にピンを配置することで、稼働エリアマップR4を生成する(ステップS12)。
The
算出部313は、ステップS3で算出したスコアに基づいて、転倒リスクに係る警報が発報された時刻を特定する(ステップS13)。算出部313は、ステップS2で読み出した警報履歴データのうち特定した時刻に係るものを用いて、警報が発報された時刻における作業機械100の姿勢を特定する(ステップS14)。すなわち、算出部313は、警報が発報された時刻における作業機械100の傾斜角、旋回角、および作業機150の角度を特定する。生成部314は、ステップS13で特定した各時刻について、特定した姿勢に基づいて、作業機械100の前方、後方、左方、および右方のうち作業機械100が最も傾いた方向を特定する(ステップS15)。具体的には、算出部313は、姿勢の警報履歴データに基づいて前後方向および左右方向の傾斜角を求め、前後方向の傾斜角と左右方向の傾斜角のうち絶対値の大きい方に基づいて、傾斜方向を特定する。
The
生成部314は、ステップS15で特定した方向に基づいて、前方検知画像、後方検知画像、左方検知画像および右方検知画像を生成し、各検知画像を機械画像の周囲に配置することで、傾斜頻度画像R5を生成する(ステップS16)。また、生成部314は、ステップS14で特定した姿勢のうち、最も高いスコアに係る姿勢を特定し、作業機械100の三次元モデルで当該姿勢を再現する(ステップS17)。すなわち、生成部314は、最も高いスコアに係る姿勢に基づいて作業機械100の三次元モデルの各部品の角度を決定する。生成部314は、ステップS15で特定した方向に視線を配置して当該三次元モデルをレンダリングすることで、傾斜姿勢画像R6を生成する(ステップS18)。
The
生成部314は、ステップS4で算出した方向別の障害物検知回数を0以上1以下の範囲の値に正規化する(ステップS19)。次に、生成部314は、正規化した検知回数を色相に変換する(ステップS20)。生成部314は、特定した色相に基づいて、前方検知画像、右前方検知画像、右後方検知画像、左後方検知画像および左前方検知画像を生成し、各検知画像を機械画像の周囲に配置することで、方向別障害物検知頻度画像R7を生成する(ステップS21)。なお、障害物検知回数が正規化されることにより、障害物の検知回数が全体的に少ない場合や全体的に多い場合にも、色相の違いすなわち検知回数の違いを認識しやすくすることができる。
The
生成部314は、ステップS4で算出した距離別の障害物検知回数に基づいて、警告領域検知画像および制御領域検知画像を生成し、各検知画像を機械画像の周囲に配置することで、距離別障害物検知頻度画像R8を生成する(ステップS22)。
The
生成部314は、ステップS1で受信した評価対象情報R1、ステップS5で生成したレーダーチャートR2、ステップS6で生成したタイムチャートR3、ステップS11で生成した稼働エリアマップR4、ステップS15で生成した傾斜頻度画像R5、ステップS17で生成した傾斜姿勢画像R6、ステップS23で生成した方向別障害物検知画像R7、およびステップS24で生成した距離別障害物検知画像R8を用いて、インシデントレポートRを生成する(ステップS23)。出力部315は、生成したインシデントレポートRに係るインシデントレポートデータを、ステップS1でアクセスを受け付けた利用者端末500に出力する(ステップS24)。
The
利用者端末500の利用者は、利用者端末500が受信したインシデントレポートデータを表示し、または印刷することで、インシデントレポートRを視認し、インシデントリスクを認識することができる。また利用者は、表示されまたは印刷されたインシデントレポートRをオペレータに配布し、オペレータにインシデントリスクを認識させることができる。
The user of the
《作用・効果》
このように、第1の実施形態によれば、レポート生成装置300は、インシデントリスクの発生時刻からインシデントリスクの解消時刻までのリスク時間に基づいてスコアを算出し、当該スコアを表すレーダーチャートR2を出力する。これにより、レポート生成装置300は、リスクが存在する状態が継続する時間の長さに応じてスコアを算出するため、作業機械100の安全性を適切に評価することができる。
<Action and Effects>
Thus, according to the first embodiment, the
特に、第1の実施形態によれば、レポート生成装置300は、領域内に障害物の侵入が検知された時刻から領域内に障害物が検知されなくなった時刻までのリスク時間の総和に基づいて衝突リスクに係るスコアを算出する。これにより、レポート生成装置300は、警告領域内に障害物が長時間検出される場合に、警告領域の近傍において障害物が短時間に複数回検出された場合と比較してスコアを低くすることができる。
In particular, according to the first embodiment, the
また、第1の実施形態によれば、レポート生成装置300は、転倒リスクが検知された時刻から転倒リスクが検知されなくなった時刻までのリスク時間の総和に基づいて転倒リスクに係るスコアを算出する。これにより、レポート生成装置300は、単に転倒する可能性のある姿勢が複数回検出された場合に、作業機械100が実際に転倒した場合と比較してスコアを高くすることができる。
Furthermore, according to the first embodiment, the
《他の実施形態》
以上、図面を参照して一実施形態について詳しく説明してきたが、具体的な構成は上述のものに限られることはなく、様々な設計変更等をすることが可能である。すなわち、他の実施形態においては、上述の処理の順序が適宜変更されてもよい。また、一部の処理が並列に実行されてもよい。
Other Embodiments
Although one embodiment has been described in detail above with reference to the drawings, the specific configuration is not limited to the above, and various design changes are possible. That is, in other embodiments, the order of the above-mentioned processes may be changed as appropriate. Also, some of the processes may be executed in parallel.
上述した実施形態に係るレポート生成装置300は、単独のコンピュータによって構成されるものであってもよいし、レポート生成装置300の構成を複数のコンピュータに分けて配置し、複数のコンピュータが互いに協働することでレポート生成装置300として機能するものであってもよい。このとき、レポート生成装置300を構成する一部のコンピュータが作業機械100の内部に搭載され、他のコンピュータが作業機械100の外部に設けられてもよい。
The
例えば、第1の実施形態においては、作業機械100から送信された警報履歴データに基づいて、レポート生成装置300がインシデントリスクの大きさを特定するが、他の実施形態においては、これに限られない。例えば、他の実施形態においては、作業機械100の制御装置190が警報履歴データからスコアを算出してスコアの履歴データを生成し、レポート生成装置300に送信してもよい。つまり、図5および図7に示す処理の一部または全部は、作業機械100の制御装置190によってなされてもよい。この場合、制御装置190は、タイマによってリアルタイムにリスク時間を計測してよい。なお、リアルタイムにリスク時間を計測する場合、制御装置190は、転倒に係るリスク時間が閾値を超えたと判定した場合、それ以降のリスク時間の計算をしなくてもよい。上述の実施形態では、転倒に係るリスク時間は、閾値を超えるか否かを判定するために用いられるため、必ずしも復帰するまでの時間を計算する必要はない。
For example, in the first embodiment, the
第1の実施形態においては、方向別障害物検知画像R7および距離別障害物検知画像R8は、障害物の検知回数を表すが、これに限られない。例えば、他の実施形態に係る方向別障害物検知画像R7および距離別障害物検知画像R8は、リスク時間の総和を表すものであってもよい。つまり、他の実施形態においては、インシデントリスクの大きさが、レーダーチャートR2でなく方向別障害物検知画像R7および距離別障害物検知画像R8によって表されてもよい。 In the first embodiment, the direction-specific obstacle detection image R7 and the distance-specific obstacle detection image R8 represent the number of times an obstacle is detected, but are not limited to this. For example, the direction-specific obstacle detection image R7 and the distance-specific obstacle detection image R8 in other embodiments may represent the total risk time. In other words, in other embodiments, the magnitude of incident risk may be represented by the direction-specific obstacle detection image R7 and the distance-specific obstacle detection image R8 instead of the radar chart R2.
第1の実施形態においては、方向別障害物検知画像R7は、色相によって障害物の検知回数を表すが、これに限られない。例えば、他の実施形態に係る方向別障害物検知画像R7は、明度によって障害物の検知回数を表してもよい。また方向別障害物検知画像の方向を表す画像の数も、5つに限られない。
第1の実施形態においては、距離別障害物検知画像R8は、数値によって障害物の検知回数を表すが、これに限られない。例えば、他の実施形態に係る距離別障害物検知画像R8は、明度や色相によって障害物の検知回数を表してもよい。
In the first embodiment, the direction-specific obstacle detection image R7 indicates the number of times an obstacle is detected by using a hue, but is not limited to this. For example, the direction-specific obstacle detection image R7 according to another embodiment may indicate the number of times an obstacle is detected by using a brightness. Furthermore, the number of images representing the directions in the direction-specific obstacle detection image is not limited to five.
In the first embodiment, the distance-based obstacle detection image R8 indicates the number of times an obstacle is detected by a numerical value, but is not limited thereto. For example, the distance-based obstacle detection image R8 according to another embodiment may indicate the number of times an obstacle is detected by a brightness or hue.
また、第1の実施形態においては、レポート生成装置300は、衝突リスクに係るスコアを算出する際に、領域内に少なくとも1つの障害物の侵入が検知された時刻から、領域内にすべての障害物が検知されなくなった時刻までのリスク時間を計測するが、これに限られない。例えば、他の実施形態においては、レポート生成装置300は、撮像画像及びレーダ装置109の計測値から1つ以上の障害物を分離して特定し、各障害物について、領域に進入した時刻から退出する時刻までのリスク時間を計測してもよい。例えば、レポート生成装置300は、各障害物のリスク時間を用いて算出される制御継続時間及び警告継続時間の総和を式(2)に代入することにより、衝突リスクに係るスコアを算出してもよい。
In addition, in the first embodiment, when calculating the score related to the collision risk, the
また、他の実施形態においては、レポート生成装置300は、転倒リスクに係るスコアおよび衝突リスクに係るスコアのそれぞれをリスク時間に基づいて計算するが、これに限られない。例えば、他の実施形態においては、転倒リスクに係るスコアおよび衝突リスクに係るスコアの何れかをリスク時間に基づかずに計算してもよい。
In another embodiment, the
1…リスク管理システム 100…作業機械 101…位置方位検出器 102…傾斜検出器 103…走行加速度センサ 104…旋回角センサ 105…ブーム角センサ 106…アーム角センサ 107…バケット角センサ 108…撮像装置 109…レーダ装置 110…走行体 130…旋回体 150…作業機 151…ブーム 152…アーム 153…バケット 170…運転室 190…制御装置 210…プロセッサ 211…取得部 212…判定部 213…送信部 230…メインメモリ 250…ストレージ 270…インタフェース 300…レポート生成装置 310…プロセッサ 311…受信部 312…入力部 313…算出部 314…生成部 315…出力部 330…メインメモリ 350…ストレージ 370…インタフェース 500…利用者端末
1...
Claims (13)
前記リスクの発生時刻から前記リスクの解消時刻までのリスク時間を計測する時間算出部と、
前記リスク時間に基づいて安全評価指標を算出する評価部と、
前記安全評価指標を出力する出力部と
を備え、
前記リスク検知部は、前記作業機械を中心とする所定の領域内に障害物が存在するリスクを検知し、
前記時間算出部は、前記領域内に障害物の侵入が検知された時刻から前記領域内に前記障害物が検知されなくなった時刻までの前記リスク時間を計測し、
前記評価部は、前記リスク時間の総和に基づいて前記安全評価指標を算出する
安全評価システム。 A risk detection unit that detects a risk of an incident occurring related to the work machine;
a time calculation unit that measures a risk time from a time when the risk occurs to a time when the risk is resolved;
An evaluation unit that calculates a safety evaluation index based on the risk time;
and an output unit that outputs the safety evaluation index,
The risk detection unit detects a risk of an obstacle being present within a predetermined area centered on the work machine,
the time calculation unit measures the risk time from a time when an obstacle is detected in the area to a time when the obstacle is no longer detected in the area,
The evaluation unit calculates the safety evaluation index based on the sum of the risk times.
前記時間算出部は、前記第1領域に係るリスク時間と前記第2領域に係るリスク時間をそれぞれ計測する
請求項1に記載の安全評価システム。 The area includes a first area centered on the work machine and a second area outside the first area,
The safety evaluation system according to claim 1 , wherein the time calculation unit measures a risk time relating to the first area and a risk time relating to the second area, respectively.
請求項2に記載の安全評価システム。 The safety evaluation system according to claim 2 , wherein the evaluation unit calculates the safety evaluation index based on a risk time related to the first area and a risk time related to the second area.
請求項3に記載の安全評価システム。 The safety evaluation system according to claim 3 , wherein the evaluation unit calculates the safety evaluation index based on a sum of a value obtained by multiplying a risk time relating to the first domain by a first coefficient and a value obtained by multiplying a risk time relating to the second domain by a second coefficient smaller than the first coefficient.
請求項1から請求項4の何れか1項に記載の安全評価システム。 The safety evaluation system according to any one of claims 1 to 4, wherein the time calculation unit measures the risk time from a time when intrusion of at least one obstacle into the area is detected to a time when all obstacles are no longer detected in the area.
前記リスクの発生時刻から前記リスクの解消時刻までのリスク時間を計測する時間算出部と、
前記リスク時間に基づいて安全評価指標を算出する評価部と、
前記安全評価指標を出力する出力部と
を備え、
前記リスク検知部は、前記作業機械の姿勢に基づくリスクを検知し、
前記評価部は、前記リスク時間が所定の閾値を超える場合に、前記安全評価指標を減点する
安全評価システム。 A risk detection unit that detects a risk of an incident occurring related to the work machine;
a time calculation unit that measures a risk time from a time when the risk occurs to a time when the risk is resolved;
An evaluation unit that calculates a safety evaluation index based on the risk time;
and an output unit that outputs the safety evaluation index,
The risk detection unit detects a risk based on a posture of the work machine,
A safety evaluation system, wherein the evaluation unit reduces the safety evaluation index when the risk time exceeds a predetermined threshold.
請求項6に記載の安全評価システム。 The safety evaluation system according to claim 6, wherein the evaluation unit calculates the safety evaluation index based on a sum of a value obtained by multiplying the number of times the risk time exceeds a predetermined threshold by a third coefficient and a value obtained by multiplying the number of times the risk occurs by a fourth coefficient smaller than the third coefficient.
前記時間算出部は、前記第2のリスクに係るリスク時間を計測する
請求項7に記載の安全評価システム。 The risk detection unit detects a first risk and a second risk having a higher possibility of tipping over than the first risk based on a posture of the work machine,
The safety evaluation system according to claim 7 , wherein the time calculation unit measures a risk time related to the second risk.
請求項8に記載の安全評価システム。 The safety evaluation system according to claim 8 , wherein the evaluation unit calculates the safety evaluation index based on the number of times that a risk time of the second risk exceeds a predetermined threshold and the number of times that the first risk occurs.
請求項9に記載の安全評価システム。 The safety evaluation system according to claim 9, wherein the evaluation unit calculates the safety evaluation index based on a sum of a value obtained by multiplying the number of times that the risk time of the second risk exceeded a predetermined threshold by the third coefficient and a value obtained by multiplying the number of times that the first risk occurred by the fourth coefficient.
前記リスクの発生時刻から前記リスクの解消時刻までのリスク時間を計測する時間算出部と、
前記リスク時間に基づいて安全評価指標を算出する評価部と、
前記安全評価指標を出力する出力部と
を備え、
前記リスク検知部は、警報の無視、離席時における前記作業機械の旋回体に対する走行体の向きの逆転、またはシートベルト非装着のリスクを検知する
安全評価システム。 A risk detection unit that detects a risk of an incident occurring related to the work machine;
a time calculation unit that measures a risk time from a time when the risk occurs to a time when the risk is resolved;
An evaluation unit that calculates a safety evaluation index based on the risk time;
and an output unit that outputs the safety evaluation index,
The risk detection unit detects the risk of ignoring an alarm, reversing the direction of a travelling body relative to a rotating body of the work machine when leaving the seat, or not wearing a seat belt.
前記安全評価システムが、前記リスクの発生時刻から前記リスクの解消時刻までのリスク時間を計測するステップと、
前記安全評価システムが、前記リスク時間に基づいて安全評価指標を算出するステップと、
前記安全評価システムが、前記安全評価指標を出力するステップと
を備え、
前記リスクを検知するステップでは、前記作業機械を中心とする所定の領域内に障害物が存在するリスクを検知し、
前記リスク時間を計測するステップでは、前記領域内に障害物の侵入が検知された時刻から前記領域内に前記障害物が検知されなくなった時刻までの前記リスク時間を計測し、 前記安全評価指標を出力するステップでは、前記リスク時間の総和に基づいて前記安全評価指標を算出する
安全評価方法。 A step in which a safety assessment system detects a risk of an incident occurring related to a work machine;
The safety evaluation system measures a risk time from a time when the risk occurs to a time when the risk is eliminated;
The safety evaluation system calculates a safety evaluation index based on the risk time;
The safety evaluation system outputs the safety evaluation index;
In the step of detecting the risk, a risk of an obstacle being present within a predetermined area centered on the work machine is detected,
A safety evaluation method, wherein in the step of measuring the risk time, the risk time is measured from a time when an obstacle is detected in the area to a time when the obstacle is no longer detected in the area, and in the step of outputting the safety evaluation index, the safety evaluation index is calculated based on a sum of the risk times.
前記安全評価システムが、前記リスクの発生時刻から前記リスクの解消時刻までのリスク時間を計測するステップと、
前記安全評価システムが、前記リスク時間に基づいて安全評価指標を算出するステップと、
前記安全評価システムが、前記安全評価指標を出力するステップと
を備え、
前記リスクを検知するステップでは、前記作業機械の姿勢に基づくリスクを検知し、
前記安全評価指標を出力するステップでは、前記リスク時間が所定の閾値を超える場合に、前記安全評価指標を減点する
安全評価方法。 A step in which a safety assessment system detects a risk of an incident occurring related to a work machine;
The safety evaluation system measures a risk time from a time when the risk occurs to a time when the risk is eliminated;
The safety evaluation system calculates a safety evaluation index based on the risk time;
The safety evaluation system outputs the safety evaluation index;
In the step of detecting a risk, a risk based on a posture of the work machine is detected,
The safety evaluation method, wherein in the step of outputting the safety evaluation index, when the risk time exceeds a predetermined threshold, the safety evaluation index is deducted.
Priority Applications (6)
| Application Number | Priority Date | Filing Date | Title |
|---|---|---|---|
| JP2020179855A JP7548773B2 (en) | 2020-10-27 | 2020-10-27 | Safety assessment system and safety assessment method |
| CN202180072672.1A CN116457534A (en) | 2020-10-27 | 2021-10-18 | Security evaluation system and security evaluation method |
| PCT/JP2021/038419 WO2022091838A1 (en) | 2020-10-27 | 2021-10-18 | Safety evaluation system and safety evaluation method |
| US18/032,835 US20230392351A1 (en) | 2020-10-27 | 2021-10-18 | Safety evaluation system and safety evaluation method |
| KR1020237014083A KR20230070310A (en) | 2020-10-27 | 2021-10-18 | Safety evaluation system and safety evaluation method |
| DE112021004571.7T DE112021004571T5 (en) | 2020-10-27 | 2021-10-18 | Safety Rating System and Safety Rating Procedure |
Applications Claiming Priority (1)
| Application Number | Priority Date | Filing Date | Title |
|---|---|---|---|
| JP2020179855A JP7548773B2 (en) | 2020-10-27 | 2020-10-27 | Safety assessment system and safety assessment method |
Publications (2)
| Publication Number | Publication Date |
|---|---|
| JP2022070670A JP2022070670A (en) | 2022-05-13 |
| JP7548773B2 true JP7548773B2 (en) | 2024-09-10 |
Family
ID=81382538
Family Applications (1)
| Application Number | Title | Priority Date | Filing Date |
|---|---|---|---|
| JP2020179855A Active JP7548773B2 (en) | 2020-10-27 | 2020-10-27 | Safety assessment system and safety assessment method |
Country Status (6)
| Country | Link |
|---|---|
| US (1) | US20230392351A1 (en) |
| JP (1) | JP7548773B2 (en) |
| KR (1) | KR20230070310A (en) |
| CN (1) | CN116457534A (en) |
| DE (1) | DE112021004571T5 (en) |
| WO (1) | WO2022091838A1 (en) |
Families Citing this family (1)
| Publication number | Priority date | Publication date | Assignee | Title |
|---|---|---|---|---|
| JP7089569B2 (en) * | 2020-11-06 | 2022-06-22 | 日立建機株式会社 | Construction support system |
Citations (5)
| Publication number | Priority date | Publication date | Assignee | Title |
|---|---|---|---|---|
| JP2016035707A (en) | 2014-08-04 | 2016-03-17 | 日立建機株式会社 | Conveyance vehicle for mine |
| JP2019167745A (en) | 2018-03-23 | 2019-10-03 | 日立建機株式会社 | Work machine |
| JP2019178479A (en) | 2018-03-30 | 2019-10-17 | 株式会社中電工 | Stepladder work condition determination system, stepladder work condition determination method and stepladder work condition determination program |
| JP2020145526A (en) | 2019-03-05 | 2020-09-10 | 住友重機械工業株式会社 | Information processor for work machine, information management system and information processing program for work machine |
| JP2020170475A (en) | 2019-04-05 | 2020-10-15 | コベルコ建機株式会社 | Skill information presentation system and skill information presentation method |
Family Cites Families (17)
| Publication number | Priority date | Publication date | Assignee | Title |
|---|---|---|---|---|
| JP2006144349A (en) * | 2004-11-18 | 2006-06-08 | Hitachi Constr Mach Co Ltd | Safety device for construction equipment |
| US8768581B2 (en) * | 2010-05-24 | 2014-07-01 | Hitachi Construction Machinery Co., Ltd. | Work machine safety device |
| KR101751405B1 (en) * | 2010-10-22 | 2017-06-27 | 히다치 겡키 가부시키 가이샤 | Work machine peripheral monitoring device |
| FR3013546B1 (en) | 2013-11-15 | 2017-05-19 | Trixell | FIXING TWO COLUMNS OF PIXELS OF AN IMAGE DETECTOR |
| WO2017188230A1 (en) * | 2016-04-28 | 2017-11-02 | コベルコ建機株式会社 | Construction machine |
| JP6622148B2 (en) * | 2016-06-17 | 2019-12-18 | 日立オートモティブシステムズ株式会社 | Ambient environment recognition device |
| US10733460B2 (en) * | 2016-09-14 | 2020-08-04 | Nauto, Inc. | Systems and methods for safe route determination |
| JP7522532B2 (en) * | 2016-11-01 | 2024-07-25 | 住友建機株式会社 | Safety management systems for construction machinery, management devices |
| JP6805883B2 (en) | 2017-02-28 | 2020-12-23 | コベルコ建機株式会社 | Construction machinery |
| US11651316B2 (en) * | 2017-07-14 | 2023-05-16 | Allstate Insurance Company | Controlling vehicles using contextual driver and/or rider data based on automatic passenger detection and mobility status |
| US11227242B2 (en) * | 2018-08-28 | 2022-01-18 | Caterpillar Inc. | System and method for automatically triggering incident intervention |
| DE102019216598A1 (en) * | 2019-10-29 | 2021-04-29 | Deere & Company | Method for monitoring the surroundings of a vehicle and system for monitoring the surroundings of a vehicle |
| KR102757259B1 (en) * | 2020-03-27 | 2025-01-21 | 히다치 겡키 가부시키 가이샤 | work machine |
| US11465619B2 (en) * | 2020-05-27 | 2022-10-11 | Zoox, Inc. | Vehicle collision avoidance based on perturbed object trajectories |
| JP7466395B2 (en) * | 2020-07-28 | 2024-04-12 | 日立建機株式会社 | Risk Management System |
| JP7666514B2 (en) * | 2020-09-14 | 2025-04-22 | コニカミノルタ株式会社 | Safety monitoring device, safety monitoring method, and program |
| WO2024129832A1 (en) * | 2022-12-13 | 2024-06-20 | May Mobility, Inc. | Method and system for assessing and mitigating risks encounterable by an autonomous vehicle |
-
2020
- 2020-10-27 JP JP2020179855A patent/JP7548773B2/en active Active
-
2021
- 2021-10-18 KR KR1020237014083A patent/KR20230070310A/en active Pending
- 2021-10-18 WO PCT/JP2021/038419 patent/WO2022091838A1/en not_active Ceased
- 2021-10-18 DE DE112021004571.7T patent/DE112021004571T5/en active Pending
- 2021-10-18 CN CN202180072672.1A patent/CN116457534A/en active Pending
- 2021-10-18 US US18/032,835 patent/US20230392351A1/en active Pending
Patent Citations (5)
| Publication number | Priority date | Publication date | Assignee | Title |
|---|---|---|---|---|
| JP2016035707A (en) | 2014-08-04 | 2016-03-17 | 日立建機株式会社 | Conveyance vehicle for mine |
| JP2019167745A (en) | 2018-03-23 | 2019-10-03 | 日立建機株式会社 | Work machine |
| JP2019178479A (en) | 2018-03-30 | 2019-10-17 | 株式会社中電工 | Stepladder work condition determination system, stepladder work condition determination method and stepladder work condition determination program |
| JP2020145526A (en) | 2019-03-05 | 2020-09-10 | 住友重機械工業株式会社 | Information processor for work machine, information management system and information processing program for work machine |
| JP2020170475A (en) | 2019-04-05 | 2020-10-15 | コベルコ建機株式会社 | Skill information presentation system and skill information presentation method |
Also Published As
| Publication number | Publication date |
|---|---|
| DE112021004571T5 (en) | 2023-08-17 |
| KR20230070310A (en) | 2023-05-22 |
| US20230392351A1 (en) | 2023-12-07 |
| WO2022091838A1 (en) | 2022-05-05 |
| CN116457534A (en) | 2023-07-18 |
| JP2022070670A (en) | 2022-05-13 |
Similar Documents
| Publication | Publication Date | Title |
|---|---|---|
| JP6734485B2 (en) | Work machine | |
| CN109072589B (en) | construction machinery | |
| KR102458135B1 (en) | worker management system | |
| US11216664B2 (en) | Method and device for augmenting a person's view of a mining vehicle on a mining worksite in real-time | |
| MX2014011661A (en) | Overhead view system for a shovel. | |
| JP7264796B2 (en) | Fall risk presentation device and fall risk presentation method | |
| JP7623105B2 (en) | Working machine and detection method | |
| EP3985183A1 (en) | Construction machine work information generation system and work information generation method | |
| JP2019163669A (en) | Work vehicle | |
| JP7548773B2 (en) | Safety assessment system and safety assessment method | |
| JP7743721B2 (en) | Workplace Monitoring System | |
| KR20170115937A (en) | Construction safety System | |
| US12241232B2 (en) | Display system for work vehicle and display method for work vehicle | |
| JP7264795B2 (en) | Operating area presentation device and operating area presentation method | |
| JP7264794B2 (en) | Fall risk presentation device and fall risk presentation method | |
| JP7123877B2 (en) | system of record | |
| KR20230122795A (en) | Construction machine safety management system using lidar and camera | |
| KR20230147286A (en) | Mini excavator rollover and loss prevention system | |
| JP7492203B1 (en) | Monitoring device and monitoring method | |
| KR20220010221A (en) | Excavator bucket MONITORING APPARATUS BASED ON AROUND VIEW MONITORING AND METHOD THEREOF | |
| JP7698825B1 (en) | Compaction control unit and compaction control system |
Legal Events
| Date | Code | Title | Description |
|---|---|---|---|
| A621 | Written request for application examination |
Free format text: JAPANESE INTERMEDIATE CODE: A621 Effective date: 20230911 |
|
| A131 | Notification of reasons for refusal |
Free format text: JAPANESE INTERMEDIATE CODE: A131 Effective date: 20240206 |
|
| A521 | Request for written amendment filed |
Free format text: JAPANESE INTERMEDIATE CODE: A523 Effective date: 20240408 |
|
| A131 | Notification of reasons for refusal |
Free format text: JAPANESE INTERMEDIATE CODE: A131 Effective date: 20240604 |
|
| A521 | Request for written amendment filed |
Free format text: JAPANESE INTERMEDIATE CODE: A523 Effective date: 20240805 |
|
| TRDD | Decision of grant or rejection written | ||
| A01 | Written decision to grant a patent or to grant a registration (utility model) |
Free format text: JAPANESE INTERMEDIATE CODE: A01 Effective date: 20240820 |
|
| A61 | First payment of annual fees (during grant procedure) |
Free format text: JAPANESE INTERMEDIATE CODE: A61 Effective date: 20240829 |
|
| R150 | Certificate of patent or registration of utility model |
Ref document number: 7548773 Country of ref document: JP Free format text: JAPANESE INTERMEDIATE CODE: R150 |