JP6965864B2 - Electricity business profit and loss analysis system - Google Patents
Electricity business profit and loss analysis system Download PDFInfo
- Publication number
- JP6965864B2 JP6965864B2 JP2018199335A JP2018199335A JP6965864B2 JP 6965864 B2 JP6965864 B2 JP 6965864B2 JP 2018199335 A JP2018199335 A JP 2018199335A JP 2018199335 A JP2018199335 A JP 2018199335A JP 6965864 B2 JP6965864 B2 JP 6965864B2
- Authority
- JP
- Japan
- Prior art keywords
- profit
- loss
- unit
- scenario
- power generation
- Prior art date
- Legal status (The legal status is an assumption and is not a legal conclusion. Google has not performed a legal analysis and makes no representation as to the accuracy of the status listed.)
- Active
Links
Images


Classifications
-
- Y—GENERAL TAGGING OF NEW TECHNOLOGICAL DEVELOPMENTS; GENERAL TAGGING OF CROSS-SECTIONAL TECHNOLOGIES SPANNING OVER SEVERAL SECTIONS OF THE IPC; TECHNICAL SUBJECTS COVERED BY FORMER USPC CROSS-REFERENCE ART COLLECTIONS [XRACs] AND DIGESTS
- Y04—INFORMATION OR COMMUNICATION TECHNOLOGIES HAVING AN IMPACT ON OTHER TECHNOLOGY AREAS
- Y04S—SYSTEMS INTEGRATING TECHNOLOGIES RELATED TO POWER NETWORK OPERATION, COMMUNICATION OR INFORMATION TECHNOLOGIES FOR IMPROVING THE ELECTRICAL POWER GENERATION, TRANSMISSION, DISTRIBUTION, MANAGEMENT OR USAGE, i.e. SMART GRIDS
- Y04S10/00—Systems supporting electrical power generation, transmission or distribution
- Y04S10/50—Systems or methods supporting the power network operation or management, involving a certain degree of interaction with the load-side end user applications
Landscapes
- Management, Administration, Business Operations System, And Electronic Commerce (AREA)
Description
本発明は、電気事業者の将来の損益を計算する電気事業損益分析システムに関する発明である。 The present invention is an invention relating to an electric power business profit / loss analysis system for calculating future profit / loss of an electric power company.
電力の発電から販売までを実施する事業は、燃料の大部分を海外から購入し、これら燃料を発電機により電力に変換し、契約、需要変動等に合わせて電力を販売することにより成り立つ。 The business of generating and selling electric power consists of purchasing most of the fuel from overseas, converting these fuels into electric power with a generator, and selling the electric power according to contracts and fluctuations in demand.
このような事業を営む電気事業者における将来の事業損益の見積もりには、燃料価格、燃料購入のための通貨へ円を変換するレートである為替、電力需要と相関が強い気候変動等の不確定要因の変動の影響を大きく受ける。したがって、このような電気事業者の経営計画時等で利用する将来の事業損益の見積もりには、これら不確定要因を考慮し定量化された損益リスクが指標として必要である。損益リスクの定量化には、不確定要因のモデル化、及びモンテカルロシミュレーションによりモデルから多数のシナリオを生成し、全てのシナリオに対して損益を計算した後に、多数の損益計算結果を集計・分析する方法がある。 Estimates of future business profits and losses for electric power companies operating such businesses include uncertainties such as fuel prices, exchange rates that convert yen into currency for fuel purchase, and climate change that is strongly correlated with electricity demand. It is greatly affected by fluctuations in factors. Therefore, profit / loss risk quantified in consideration of these uncertain factors is necessary as an index for estimating future business profit / loss to be used at the time of business planning of such an electric power company. To quantify profit and loss risk, a large number of scenarios are generated from the model by modeling uncertain factors and Monte Carlo simulation, profit and loss are calculated for all scenarios, and then a large number of profit and loss calculation results are aggregated and analyzed. There is a way.
特許文献1では電気事業者の損益リスクを異なるパラメータセット(=ポートフォリオ)で算出し、比較する方法が述べられている。例えば、ポートフォリオAとポートフォリオBとで損益リスクを計算し、計算結果の比較からポートフォリオの優劣を判断している。
不確定要因を複数種類(例えば、燃料価格と為替)について考える場合で、一つの不確定要因における将来予測される値の変化をシナリオ、不確定要因の種類毎にシナリオを集めたものをケース(例えば、1つのケースは1つの為替シナリオと1つの燃料価格シナリオから構成される)と定義すると、先行技術では生成したケース全てに対し、同じ方法で発電計画を実施することで各ケースにおける損益計算を実施し、損益リスクを定量化している。 When considering multiple types of uncertain factors (for example, fuel price and exchange rate), a scenario is a scenario of changes in the value predicted in the future for one uncertain factor, and a case is a collection of scenarios for each type of uncertain factor (for example). For example, one case consists of one exchange scenario and one fuel price scenario), and the profit and loss calculation in each case is performed by implementing the power generation plan in the same way for all the cases generated by the prior technology. Is implemented to quantify profit and loss risk.
このため、多種の不確定要因を考慮したい場合、計算精度の向上を目的としてケース数を増加させた場合、特許文献1のように複数のポートフォリオにおける損益リスクを定量化する場合等には、計算時間のかかる発電計画をケース数だけ実施するため、損益リスクの定量化にかかる計算時間が増加する問題がある。
Therefore, when it is desired to consider various uncertain factors, when the number of cases is increased for the purpose of improving calculation accuracy, when quantifying profit / loss risk in a plurality of portfolios as in
電気事業の損益のリスクに関する不確定要因を含むデータを設定するデータ設定部と、不確定要因に関する将来予測のシナリオをN個生成するシナリオ生成部と、シナリオに基づく電力の需要及び供給の想定からシナリオ毎に損益をM個算出する発電計画部と、該M個のシナリオと損益との関係を損益モデルにするモデル作成部と、損益モデルに発電計画部で算出しなかった(N−M)個のシナリオを代入してシナリオ毎に損益を計算する省略計算部と、発電計画部で算出したM個の損益と省略計算部で計算した(N−M)個の損益とからリスクを計算するリスク量計算部と、リスク量計算部が計算した損益のリスクを表示する結果表示部とを備えたことを特徴とする電気事業損益分析システムである。但し、N及びMは自然数であり、M<Nの関係にある。 From the data setting unit that sets data including uncertain factors related to the risk of profit and loss of the electric power business, the scenario generation unit that generates N scenarios for future forecasts related to uncertain factors, and the assumption of power supply and demand based on the scenarios. The power generation planning department that calculates M profits and losses for each scenario, the model creation department that uses the relationship between the M scenarios and profits and losses as a profit and loss model, and the power generation planning department that calculates the profit and loss model (NM). The risk is calculated from the abbreviated calculation unit that substitutes the individual scenarios and calculates the profit and loss for each scenario, the M profit and loss calculated by the power generation planning unit, and the (NM) profit and loss calculated by the abbreviated calculation unit. It is an electric business profit and loss analysis system characterized by having a risk amount calculation unit and a result display unit that displays the profit and loss risk calculated by the risk amount calculation unit. However, N and M are natural numbers, and there is a relationship of M <N.
また、電気事業の損益のリスクに関する不確定要因を含むデータを設定するデータ設定部と、不確定要因に関する将来予測のシナリオをN個生成するシナリオ生成部と、シナリオに基づく電力の需要及び供給の想定からシナリオ毎に損益をM個算出する発電計画部と、該M個のシナリオと損益との関係を電力の需要を発電機の容量で区分した損益モデルにする区分モデル作成部と、損益モデルに発電計画部で算出しなかった(N−M)個のシナリオを代入してシナリオ毎に損益を計算する省略計算部と、発電計画部で算出したM個の損益と省略計算部で計算した(N−M)個の損益とからリスクを計算するリスク量計算部と、リスク量計算部が計算した損益のリスクを表示する結果表示部とを備えたことを特徴とする電気事業損益分析システムである。但し、N及びMは自然数であり、M<Nの関係にある。 In addition, a data setting unit that sets data including uncertain factors related to the risk of profit and loss of the electric power business, a scenario generation unit that generates N scenarios for future forecasts related to uncertain factors, and a demand and supply of electricity based on the scenarios. A power generation planning unit that calculates M profits and losses for each scenario from assumptions, a division model creation department that divides the relationship between the M scenarios and profits and losses into a profit and loss model that divides the demand for electricity by the capacity of the generator, and a profit and loss model. The abbreviated calculation unit that calculates the profit and loss for each scenario by substituting the (NM) scenarios that were not calculated by the power generation planning department, and the M profit and loss and the abbreviated calculation unit that were calculated by the power generation planning department. An electric business profit and loss analysis system characterized by having a risk amount calculation unit that calculates risk from (NM) pieces of profit and loss, and a result display unit that displays the risk of profit and loss calculated by the risk amount calculation unit. Is. However, N and M are natural numbers, and there is a relationship of M <N.
省略計算部を構成要素として含むので、全ケースにおける損益を算出し損益リスクの定量化にかかる計算時間を短縮できる。 Since the abbreviated calculation unit is included as a component, the calculation time required for calculating the profit and loss in all cases and quantifying the profit and loss risk can be shortened.
実施の形態1.
図1は本発明の実施の形態1による電気事業損益分析システムのブロック図である。電気事業損益分析システムは、電気事業による将来の損益リスクを定量化するために、データ設定10で設定されたデータを用いて、シナリオ生成部12において不確定要因に関するシナリオを多数生成し、発電計画部13にて各ケースにおける発電計画、損益等を計算する。この際、全てのケースについて発電計画部13で損益を算出すると発電計画部13の処理に計算時間がかかるため、不確定要因の数、損益リスクの計算期間によっては実運用上耐えられないことになる。
FIG. 1 is a block diagram of an electric utility profit / loss analysis system according to the first embodiment of the present invention. The electric power business profit / loss analysis system uses the data set in the
このため本実施の形態1では、モデル作成部14及び省略計算部15の機能によって、各ケースにおける損益を発電計画部13と比較して高速に求める。全てのケースに対する損益を計算し終えると、リスク量計算部16にて損益計算結果を集計し、結果を結果表示部17で表示する。データ格納部11は、データ設定部10からデータを受け取り、シナリオ生成部12、発電計画部13、モデル作成部14、省略計算部15、及びリスク量計算部16との間ではデータの入出力をし、結果表示部17に計算結果を出力する。
Therefore, in the first embodiment, the profit and loss in each case is obtained at a higher speed than that of the power
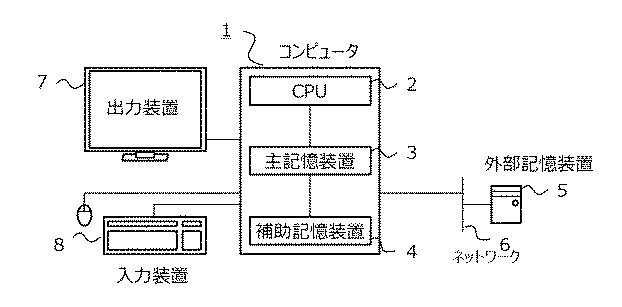
図2は一般的なハード装置の構成を示す。コンピュータ1は、CPU2、主記憶装置3、補助記憶装置4及び外部記憶装置5から構成されている。外部記憶装置5はネットワーク6を介して接続されていてもよい。出力装置7はコンピュータ1からの出力結果を表示し、入力装置8はコンピュータ1へ情報を入力する。
FIG. 2 shows the configuration of a general hardware device. The
本発明の実施の形態1において、図1に示すデータ設定部10は、例えば、図2に示す入力装置8、主記憶装置3、補助記憶装置4、ネットワーク6、外部記憶装置5のいずれか、あるいは複数を組み合わせて実現される。データ設定部10は、例えば、損益リスク計算に関するデータを入力または取得し、データ格納部11である記憶装置(例えば、主記憶装置3、補助記憶装置4、外部記憶装置5の少なくともいずれか)に保存する。損益リスク計算に関するデータは、例えば、シナリオ生成部12における演算の際に参照する実績データ、実績データの参照期間、生成するケース数、損益リスクの計算期間、発電計画部13における発電機の燃料費関数及び運転制約、モデル作成部14におけるモデル生成に利用するケース数等である。
In the first embodiment of the present invention, the
データ格納部11は、例えば、図2に示す主記憶装置3、補助記憶装置4、ネットワーク6、外部記憶装置5の少なくともいずれかで実現され、データ設定部10、シナリオ生成部12、発電計画部13、モデル作成部14、省略計算部15、リスク量計算部16の計算結果を格納する。
The
シナリオ生成部12は、コンピュータ1の内部演算処理としてCPU2を用いて実現できる。シナリオ生成部12は、例えば、プログラムとして図2に示す主記憶装置3上に展開したものをCPU2上で実行するものである。CPU2は、データ格納部11である主記憶装置3上のデータを読み込み、シナリオ生成部12の処理を行い、その結果得られた不確定要因に関するシナリオを主記憶装置3、補助記憶装置4、外部記憶装置5の少なくともいずれかに保存する。また、シナリオをディスプレイ等の出力装置7に表示し運用者に示してもよい。不確定要因に関するシナリオは、例えば、損益リスクの計算期間の長さを持つ為替の値動き、電力需要等である。
The
発電計画部13は、コンピュータ1の内部演算処理としてCPU2を用いて実現できる。発電計画部13は、例えば、プログラムとして図2に示す主記憶装置3上に展開したものをCPU2上で実行するものである。CPU2は、主記憶装置3上のデータを読み込み、発電計画部13の処理を行い、その結果得られた発電計画結果を主記憶装置3、補助記憶装置4、外部記憶装置5の少なくともいずれかに保存する。また、発電計画結果をディスプレイ等の出力装置7に表示し運用者に示してもよい。発電計画結果は、例えば、損益リスクの計算期間の長さを持つ発電機の起動停止計画、発電機出力等である。
The power
モデル作成部14は、コンピュータ1の内部演算処理としてCPU2を用いて実現できる。モデル作成部14は、例えば、プログラムとして図2に示す主記憶装置3上に展開したものをCPU2上で実行するものである。CPU2は、主記憶装置3上のデータを読み込み、モデル作成部14の処理を行い、その結果得られたモデルを主記憶装置3、補助記憶装置4、外部記憶装置5の少なくともいずれかに保存する。また、モデルをディスプレイ等の出力装置7に表示し運用者に示してもよい。モデルは、例えば、不確定要因を説明変数、損益を被説明変数とした線形回帰モデル等である。
The
省略計算部15は、コンピュータ1の内部演算処理としてCPU2を用いて実現できる。省略計算部15は、例えば、プログラムとして図2に示す主記憶装置3上に展開したものをCPU2上で実行するものである。CPU2は、主記憶装置3上のデータを読み込み、省略計算部15の処理を行い、その結果得られたシナリオに対する損益の計算結果を主記憶装置3、補助記憶装置4、外部記憶装置5の少なくともいずれかに保存する。また、シナリオに対する損益の計算結果をディスプレイ等の出力装置7に表示し運用者に示してもよい。
The
リスク量計算部16は、コンピュータ1の内部演算処理としてCPU2を用いて実現できる。リスク量計算部16は、例えば、プログラムとして図2に示す主記憶装置3上に展開したものをCPU2上で実行するものである。CPU2は、主記憶装置3上のデータを読み込み、リスク量計算部16の処理を行い、その結果得られたリスク量を主記憶装置3、補助記憶装置4、外部記憶装置5の少なくともいずれかに保存する。また、リスク量をディスプレイ等の出力装置7に表示し運用者に示してもよい。リスク量としては、例えば、損益の平均及び分散、ある信頼水準における最大損失を表すVaR等である。
The risk
結果表示部17は、主記憶装置3、補助記憶装置4、外部記憶装置5の少なくともいずれかに保存された発電計画部13、モデル作成部14、省略計算部15、リスク量計算部16の少なくともいずれかの演算結果を表示する。
The
図3は本実施の形態1に係る電気事業損益分析システムの動作を示すフローチャートである。以下、図3を用いて動作について説明する。 FIG. 3 is a flowchart showing the operation of the electric power business profit / loss analysis system according to the first embodiment. Hereinafter, the operation will be described with reference to FIG.
まず、データ設定部10において損益リスク計算に関するデータを設定する(ステップS100)。損益リスク計算に関するデータは、例えば、シナリオ生成部12における演算の際に参照する実績データ(為替、燃料価格、需要等)、実績データの参照期間R([日]、[月]、[年]等)、生成するケース数N[個]、損益リスクの計算期間T([日]、[月]、[年]等)、発電計画部13における発電機の燃料費関数、運転制約(最小停止時間、最小起動時間等)、小売単価[円/kWh]、モデル作成部14におけるモデル生成に利用するケース数M[個]である。これら損益リスク計算に関するパラメータはデータ格納部11に格納される。
First, the
次に、シナリオ生成部12において不確定要因に関するモデルパラメータを推定する(ステップS101)。シナリオを生成するための数理モデルは様々な種類があるが、例えば、為替を表すモデルとしてGBM(Geometric Brownian Motion)モデルを利用すると、式(1)のように表せる。
Next, the
ここで、μ:平均対数変化率、σ:ボラティリティ、dz:標準正規乱数(平均0、分散1)であり、また、P:為替として、xはx=lnPの変数変換を実施している。 Here, μ: average logarithmic rate of change, σ: volatility, dz: standard normal random number (mean 0, variance 1), and P: exchange, x is a variable transformation of x = lnP.
ステップS101のモデルパラメータの推定では、データ設定部10にて設定した実績データを実績データ参照期間Rだけ参照し、平均対数変化率μ及びボラティリティσについて統計的な解析を実施することで値を求める。なお、ここでは為替のモデルとしてGBMモデルを例示したが、本発明における不確定要因に関するシナリオを生成するためのモデルは、このモデルでなくてもよい。また、モデルパラメータについては統計的な解析により求めてもよく、ユーザの入力によって設定されてもよい。
In the estimation of the model parameters in step S101, the actual data set by the
ステップS102では、引き続きシナリオ生成部12において、ステップS101で求めた不確定要因に関するモデルに基づいて、シナリオ及びケースを生成する。ここで、シナリオとは、不確定要因を複数種類(例えば、燃料価格と為替)について考える場合に、一つの不確定要因における将来予測される値の変化のことである。また、ケースとは、不確定要因の種類毎にシナリオを集めたもののことである。例えば、1つのケースは1つの為替シナリオと1つの燃料価格シナリオから構成されることになる。
In step S102, the
例えば、為替に関するシナリオを式(1)のGBMモデルを利用して生成する場合は、初期値x0及び標準正規乱数dzを生成することで、x1を求める作業を損益リスクの計算期間Tにわたって実施する。ここで、生成するケース数Nだけ繰り返すことで、為替に関してTの長さを持つシナリオをN本得ることになる。 For example, when a scenario related to exchange is generated using the GBM model of equation (1), the work of obtaining x 1 is performed over the calculation period T of profit and loss risk by generating the initial value x 0 and the standard normal random number dz. implement. Here, by repeating the number of generated cases N, N scenarios having a length of T with respect to the exchange can be obtained.
図4にT=365、N=5として生成した為替及び燃料価格シナリオと、これらをケースとして整理した例を示す。図4の左側上段に為替シナリオ(縦軸は為替[円/ドル]、横軸は所定間隔による時間軸であり、ここでは日)、左側下段に燃料価格シナリオ(縦軸は燃料価格[ドル/バレル]、横軸は所定間隔による時間軸であり、ここでは日)を各5本示しており、右側のグラフ(縦軸は損益リスク、横軸は所定間隔による時間軸であり、ここでは日)には、それぞれ1本ずつ抽出し5個のケース(上段にケース1と下段にケース5を示して他を省略)として整理している。なお、所定間隔による時間軸とは、例えば、30分単位でプロットされることもあれば、一日単位でプロットされることもある。
FIG. 4 shows an exchange and fuel price scenario generated with T = 365 and N = 5, and an example of arranging these as cases. The upper left side of Fig. 4 is the exchange scenario (vertical axis is the exchange rate [yen / dollar], the horizontal axis is the time axis at predetermined intervals, here day), and the lower left side is the fuel price scenario (vertical axis is the fuel price [dollar / dollar / dollar / dollar). Barrel], the horizontal axis is the time axis according to the predetermined interval, here 5 days), and the graph on the right side (the vertical axis is the profit and loss risk, the horizontal axis is the time axis according to the predetermined interval, here the day) ), One case is extracted and five cases are arranged (
シナリオ生成部12は、不確定要因に関して損益分析期間以上の長さを持つ値を生成することになる。なお、これら不確定要因に関するケースはデータ格納部11に格納される。
The
ステップS103及びS104では、ケース毎に発電機の起動停止計画及び起動発電機の出力を決定する。想定する発電機台数及び損益リスクの計算期間Tの長さによっては、ステップS103及びS104の計算時間が実用上問題となる。このため、本実施の形態1ではステップS103及びS104を生成ケース数N回より少ないM回だけ実施することで、この問題を回避する。 In steps S103 and S104, the start / stop plan of the generator and the output of the start / generator are determined for each case. Depending on the assumed number of generators and the length of the calculation period T of the profit / loss risk, the calculation time of steps S103 and S104 may be a practical problem. Therefore, in the first embodiment, this problem is avoided by performing steps S103 and S104 only M times, which is less than the number of generation cases N times.
ステップS103では、発電計画部13において、ケース毎に損益リスクの計算期間Tにおける発電機の起動停止計画を決定する。起動停止計画は、発電機の運転制約(最小停止時間、最小起動時間、出力変化速度制約、出力上下限制約等)、燃料消費制約等を守りながら決定する。
In step S103, the power
本来、発電機の機器に関する制約は全てのケースで同一である。ところが、不確定要因として需要及び燃料価格を考えた場合には、起動すべき発電機の総台数及び発電機種別が変化するため、各ケースについて起動停止計画及び発電機出力の決定が必要となる。決定方法としては、例えば、数理計画法の一つである動的計画法の利用が考えられる。これら起動停止計画はデータ格納部11に格納される。
Originally, the restrictions on generator equipment are the same in all cases. However, when demand and fuel prices are considered as uncertain factors, the total number of generators to be started and the type of generator change, so it is necessary to determine the start / stop plan and generator output for each case. .. As a determination method, for example, the use of dynamic programming, which is one of the mathematical programming methods, can be considered. These start / stop plans are stored in the
ステップS104では、引き続き発電計画部13において、ケース毎にステップS103で決定した起動停止計画に基づいて、起動している発電機の出力を決定する。この出力決定は評価関数が最小または最大となるように決定され、評価関数としては、例えば、発電コストが挙げられる。また、出力決定方法としては、例えば、等λ法の利用が考えられる。
In step S104, the power
発電機出力の決定後は、出力と燃料費関数から期間Tにわたる発電コストを算出する。また、需要と小売単価より期間Tにわたる小売収入も算出する。これらより電気事業による損益を小売収入と発電コストとの差分と定義して算出する。これら発電機出力及び損益に関するデータはデータ格納部11に格納される。
After determining the generator output, the power generation cost over the period T is calculated from the output and the fuel cost function. In addition, the retail income over the period T is calculated from the demand and the retail unit price. From these, the profit and loss from the electric power business is defined as the difference between retail income and power generation cost and calculated. Data related to the generator output and profit / loss are stored in the
なお、本実施の形態1では起動停止計画(S103)と出力決定(S104)は別個に実施したが、同時に決定したり、繰り返し計算によって決定したりする方法等でもよい。また動的計画法と等λ法を例示したが、これら以外の方法でもよい。発電計画部13は、シナリオを利用した需要及び供給の想定から、各シナリオにおける損益を算出することになる。
In the first embodiment, the start / stop plan (S103) and the output determination (S104) are performed separately, but they may be determined at the same time or may be determined by repeated calculation. Moreover, although the dynamic programming method and the equal λ method are illustrated, other methods may be used. The power
ステップS105では、ステップS103及びS104がM回実施された時点で、各ケースに対して同じ長さTをもつ損益の結果がM個得られる。図5はケース毎の日次損益を説明するための図である。図5では5つのケースの日次損益を例示している。なお、縦軸は日次損益、横軸は所定間隔による時間軸であり、ここでは日である。 In step S105, when steps S103 and S104 are performed M times, M profit / loss results having the same length T are obtained for each case. FIG. 5 is a diagram for explaining daily profit / loss for each case. FIG. 5 illustrates daily profit and loss in five cases. The vertical axis is the daily profit / loss, and the horizontal axis is the time axis at predetermined intervals, which is the day here.
ステップS106では、モデル作成部14において、損益リスクの計算期間Tの長さを持つM個のケースと損益算出結果から、損益モデルを作成する。モデル作成部14は、シナリオと損益との関係をモデル化する。損益モデルは不確定要因に対する損益の関係をモデル化したものであり、例えば、不確定要因として為替、燃料、需要を想定した場合、時刻tにおける為替x1,t、燃料価格x2,t、需要x3,tを説明変数、損益ytを被説明変数とした線形回帰モデル式(2)で表せる。
In step S106, the
ここで、a0からa3はモデルパラメータである。これらモデルパラメータをステップS106以前で算出した期間TのM個のケースと、これらケースに対応する同期間Tの損益計算結果とを利用して算出することで、不確定要因と損益との関係がモデル化できる。 Here, a 0 to a 3 are model parameters. By calculating these model parameters using the M cases of the period T calculated before step S106 and the profit and loss calculation result of the period T corresponding to these cases, the relationship between the uncertain factor and the profit and loss can be obtained. Can be modeled.
ステップS107では、省略計算部15において、ステップS106で作成した損益モデルに残りのケース(N−M)個のシナリオを代入することで、発電計画部13を省略して各ケースにおける損益を算出する。
In step S107, the
省略計算部15は、作成したモデルにシナリオを代入することで、シナリオにおける損益を求めることになる。
The
また、これら損益はデータ格納部11に格納される。生成したケースN個について全て損益計算する場合は、M個についてはステップS103とステップS104とで既に損益計算が終了しているため、本ステップでは残りの(N−M)個のケースについて省略計算を実施し、損益を算出する。
Further, these profits and losses are stored in the
例えば、全体の数であるNが1000個である場合、M個は50個、(N−M)個は950個であったりする。電気事業者が損益のリスクを管理する上で、Nの数を十分に大きくしないと損益リスクを管理するのには、十分ではない。損益リスクを管理する上では、震災の発生等に起因する変動の大きいシナリオも考える必要があるからである。また、M個と(N−M)個とで、十分に差が無いと省略計算部15を設けたことの意味が半減する。
For example, when the total number of N is 1000, M is 50 and (NM) is 950. In order for the electric power company to manage the profit and loss risk, it is not enough to manage the profit and loss risk unless the number of N is sufficiently large. This is because when managing profit and loss risk, it is necessary to consider scenarios with large fluctuations due to the occurrence of an earthquake or the like. Further, if there is no sufficient difference between the M number and the (NM) number, the meaning of providing the omitted
これらを背景に、所望の計算時間内にN個の全ケースにおける損益計算結果を得るためのM個の数の決め方には、例えば、次の方法がある。ステップS103とS104との発電計画に1ケースあたりA[秒]、ステップS106のモデル化にB[秒]、ステップS107の省略計算に1ケースあたりC[秒]かかり、所望の計算時間がR[秒]である場合、所望の計算時間内にN個の全ケースにおける損益計算結果を得るためのMは、式(3)のように各ステップの計算時間の和によって示すことができる。
AM+B+C(N−M)≦R (3)
Against this background, for example, there are the following methods for determining the number of M pieces for obtaining the profit and loss calculation results in all N cases within a desired calculation time. It takes A [seconds] per case for the power generation plan of steps S103 and S104, B [seconds] for modeling step S106, and C [seconds] per case for the abbreviated calculation of step S107, and the desired calculation time is R [ In the case of [seconds], M for obtaining the profit and loss calculation results in all N cases within the desired calculation time can be indicated by the sum of the calculation times of each step as shown in the equation (3).
AM + B + C (N−M) ≤ R (3)
ここで、例えば、N:1000[回]、A:10[秒]、B:20[秒]、C:0.5[秒]、R:1000[秒]ある場合、M≦50.5となる。この場合、所望の時間内で精度の高い計算結果を得るためのMは50回、(N−M)は950回となる。さらなる高速化が必要な場合は、Mの回数を50回より減少させればよい。このように、M、Nの回数及び比は、一概に決めることができるものではなく、計算量のボリューム、電気事業者の都合等により左右されるものである。 Here, for example, when N: 1000 [times], A: 10 [seconds], B: 20 [seconds], C: 0.5 [seconds], R: 1000 [seconds], M ≦ 50.5. Become. In this case, M is 50 times and (NM) is 950 times in order to obtain a highly accurate calculation result within a desired time. If further speeding up is required, the number of Ms may be reduced from 50 times. As described above, the number and ratio of M and N cannot be unconditionally determined, but depend on the volume of calculation amount, the convenience of the electric power company, and the like.
ステップS108では、ステップS107が(N−M)回実施された時点で、期間Tの長さを持つ損益計算結果が(N−M)個得られる。 In step S108, when step S107 is executed (NM) times, (NM) profit and loss calculation results having a length of period T are obtained.
ステップS109では、リスク量計算部16において、ステップS105で得られたM個の損益計算結果と、ステップS107で得られた(N−M)個の損益計算結果とで、N個の損益計算結果が既に得られている。ステップS109では、このN個の損益計算結果から所望のリスク指標を算出する。リスク指標としては、例えば、損益計算結果の平均値及び分散、ある信頼水準における最大損失を表すVaR等がある。これらリスク指標はデータ格納部11に格納される。
In step S109, in the risk
ステップS110では、結果表示部17において、データ格納部11に格納された計算結果を表示する。
In step S110, the
本実施の形態1における電気事業損益分析システムでは、モデル作成部14及び省略計算部15の機能によって、各ケースにおける損益算出を発電計画部13と比較して高速に求めることができるので、システム全体における計算時間を従来と比較して短縮可能である。
In the electric power business profit and loss analysis system according to the first embodiment, the profit and loss calculation in each case can be obtained at a higher speed than that of the power
また、発電計画部13は数理計画法を利用するため各ケースにおいて、最適な発電機の運用状態が求められるが、求解に時間がかかる。本実施の形態1のように合計でNケースの損益を算出して損益リスクを定量化する場合に、発電計画部13の計算をM回だけ実施し、これらM回の計算結果を利用してモデル作成部14において1回だけ不確定要因と損益のモデル化を行い、残りN−M回のケースは省略計算部15においてモデル式にシナリオの数値を代入するのみの損益計算を実施するので、発電計画部13で損益計算をN回のケース分実施した場合と比較し、全ケースにおける損益を高速に求めることが可能である。
Further, since the power
さらに、省略計算部15を構成要素として含むので、計算時間のかかる発電計画をスキップし各ケースに対する損益を計算可能であるため、全ケースにおける損益を算出し損益リスクの定量化にかかる計算時間を短縮できる。
Further, since the omitted
例えば、モンテカルロシミュレーションの中で、不確定要因と損益の関係をモデル化し、発電計画の回数を減少させて全ケースにおける損益を算出することで、モンテカルロシミュレーションにかかる時間を短縮できる。省略計算部15を構成要素として含むことで、計算時間のかかる発電計画をスキップし、シナリオに対する損益が計算でき、損益リスクの定量化にかかる計算時間を短縮できる。
For example, in the Monte Carlo simulation, the time required for the Monte Carlo simulation can be shortened by modeling the relationship between uncertain factors and profit and loss, reducing the number of power generation plans, and calculating the profit and loss in all cases. By including the
なお、本実施の形態1では発電機でエネルギーの供給可能な需要の例に電力需要を挙げて説明したが、他のエネルギーでもよく、他には熱エネルギー等が考えられる。 In the first embodiment, the electric power demand has been described as an example of the demand that can be supplied with energy by the generator, but other energy may be used, and thermal energy or the like may be considered.
以上のように、電気事業損益分析システムは、電気事業の損益のリスクに関する不確定要因を含むデータを設定するデータ設定部と、不確定要因に関する将来予測のシナリオをN個生成するシナリオ生成部と、シナリオに基づく電力の需要及び供給の想定からシナリオ毎に損益をM個算出する発電計画部と、該M個のシナリオと損益との関係を損益モデルにするモデル作成部と、損益モデルに発電計画部で算出しなかった(N−M)個のシナリオを代入してシナリオ毎に損益を計算する省略計算部と、発電計画部で算出したM個の損益と省略計算部で計算した(N−M)個の損益とからリスクを計算するリスク量計算部と、リスク量計算部が計算した損益のリスクを表示する結果表示部とを備えている。但し、N及びMは自然数であり、M<Nの関係にある。 As described above, the electric business profit and loss analysis system includes a data setting unit that sets data including uncertain factors related to the risk of profit and loss of the electric business, and a scenario generation unit that generates N future forecast scenarios related to uncertain factors. , A power generation planning department that calculates M profits and losses for each scenario from the assumption of power supply and demand based on the scenario, a model creation department that uses the relationship between the M scenarios and profits and losses as a profit and loss model, and power generation in the profit and loss model. The abbreviated calculation unit that calculates the profit and loss for each scenario by substituting the (NM) scenarios that were not calculated by the planning unit, and the M profit and loss and the abbreviated calculation unit that were calculated by the power generation planning unit calculated (N). -M) It has a risk amount calculation unit that calculates the risk from the profit and loss, and a result display unit that displays the risk of the profit and loss calculated by the risk amount calculation unit. However, N and M are natural numbers, and there is a relationship of M <N.
実施の形態2.
実施の形態1では、不確定要因に関して生成した全てのケースの電気事業損益を高速に求める電気事業損益分析システムの動作を示した。損益を高速に求めるために不確定要因と損益との関係に関してモデル化を行ったが、本実施の形態2では、このモデル化の精度向上方法について説明する。
In the first embodiment, the operation of the electric power business profit / loss analysis system for quickly obtaining the electric power business profit / loss in all cases generated for uncertain factors is shown. In order to obtain profit and loss at high speed, the relationship between uncertain factors and profit and loss was modeled. In the second embodiment, a method for improving the accuracy of this modeling will be described.
本実施の形態2は、図6に示すように、実施の形態1のモデル作成部14に代わりに区分モデル作成部20を備える。なお、図において、同一の符号を付したものは、同一またはこれに相当するものであり、このことは明細書の全文、図面の全図において共通することである。さらに、明細書全文に表れている構成要素の形態は、あくまで例示であってこれらの記載に限定されるものではない。
As shown in FIG. 6, the second embodiment includes a division
区分モデル作成部20は、例えば、プログラムとして図2に示す主記憶装置3上に展開したものをCPU2上で実行するものである。CPU2は、主記憶装置3上のデータを読み込み、区分モデル作成部20の処理を行い、その結果得られたモデルを主記憶装置3、補助記憶装置4、外部記憶装置5の少なくともいずれかに保存する。また、モデルをディスプレイ等の出力装置7に表示し運用者に示してもよい。モデルは、例えば、不確定要因を説明変数、損益を被説明変数とした線形回帰モデルである。また、不確定要因の中には発電及び発熱により満たす需要を含み、起動する発電機の容量に応じてモデル化に利用するデータの範囲を区分し、区分毎にモデル化を実施する。
The division
図7は本実施の形態2に係る電気事業損益分析システムの動作を示すフローチャートである。以下、図7を用いて動作について説明する。なお、図7において実施の形態1と同様の処理は同じ番号を割り振り、説明を省略する。 FIG. 7 is a flowchart showing the operation of the electric power business profit / loss analysis system according to the second embodiment. Hereinafter, the operation will be described with reference to FIG. 7. In FIG. 7, the same processing as in the first embodiment is assigned the same number, and the description thereof will be omitted.
図7のステップS200では、区分モデル作成部20において、損益リスクの計算期間Tの長さを持つM個のケースと損益算出結果とから損益モデルを作成する。損益モデルは不確定要因に対する損益の関係をモデル化したものであり、例えば、不確定要因として為替、燃料、需要を想定した場合、時刻tにおける為替x1,t、燃料価格x2,t、需要x3,tを説明変数、損益ytを被説明変数とした線形回帰モデル式で表せる。
In step S200 of FIG. 7, the division
ここで、不確定要因の中に発電により満たす需要が含まれている場合、需要を満たすために必要な起動発電機の台数・種類によって平均発電単価が変化する性質を考慮して、起動発電機の容量に応じてモデル化に利用するデータの範囲を区分し、区分毎にモデル化を行うことによって、需要と損益の関係に関するモデル化の精度を向上させる。 Here, if the uncertain factors include the demand to be satisfied by power generation, the starting generator will change in consideration of the property that the average power generation unit price changes depending on the number and type of starting generators required to meet the demand. By dividing the range of data used for modeling according to the capacity of the model and modeling for each category, the accuracy of modeling regarding the relationship between demand and profit / loss is improved.
図8を用いて区分モデルを説明する。縦軸は損益[万円]、横軸は需要[MWh]である。図8は、電力需要に関するシナリオを含むM個のケースと損益計算結果とから、電力需要と損益とに着目してこれらの関係をプロットした図である。横軸は需要、縦軸は損益を示し、区分Aから区分Dまでの4つの区分毎にモデル式を求めている。ここでは、線形性のあるモデル式であるが、モデル化(モデル式)は非線形のモデルでもよい。なお、一つのプロットはt時のあるケースの電力需要における損益を示している。 The division model will be described with reference to FIG. The vertical axis is profit / loss [10,000 yen], and the horizontal axis is demand [MWh]. FIG. 8 is a diagram plotting the relationship between M cases including scenarios related to electric power demand and profit / loss calculation results, focusing on electric power demand and profit / loss. The horizontal axis shows demand and the vertical axis shows profit and loss, and model formulas are obtained for each of the four categories from category A to category D. Here, the model formula has linearity, but the modeling (model formula) may be a non-linear model. In addition, one plot shows the profit and loss in the electric power demand in a certain case at t time.
電力需要が450[MWh]前後での損益に着目し、需要が450[MWh]より小さい範囲を区分A、450[MWh]より大きい範囲を区分Bとすると、区分Bにおける損益は区分Aにおける損益と比較して全体的に減少している。これは電力需要が450[MWh]を超える場合は新たな発電機が起動し電力需要を満たすことに起因する。 Focusing on the profit and loss when the power demand is around 450 [MWh], if the range where the demand is smaller than 450 [MWh] is Category A and the range where the demand is larger than 450 [MWh] is Category B, the profit and loss in Category B is the profit and loss in Category A. Compared to the overall decrease. This is because when the power demand exceeds 450 [MWh], a new generator is started to meet the power demand.
通常、発電機は発電単価が安価な順番に起動するため、新たに起動が発生した場合は平均発電単価としては上昇し、損益は減少する。このように区分の前後において損益分布の様相が変化するため、区分A及び区分Bの不確定要因と損益との関係を1つのモデルで表した場合はモデル化誤差が大きくなる。このことは、次のステップS107における損益の省略計算の精度が悪化する可能に繋がる。 Normally, generators are started in the order in which the unit price of power generation is cheaper, so when a new start occurs, the average unit price of power generation rises and profit or loss decreases. Since the aspect of the profit and loss distribution changes before and after the classification in this way, the modeling error becomes large when the relationship between the uncertain factors of the classification A and the classification B and the profit and loss is represented by one model. This leads to the possibility that the accuracy of the profit / loss omission calculation in the next step S107 deteriorates.
このため、発電単価の安価な順に各発電機の発電容量でモデル化に利用するデータの範囲を区分し、区分毎にモデル化することで、区分前と比較し精度のよいモデル化を実施する。 For this reason, the range of data used for modeling is divided according to the power generation capacity of each generator in ascending order of power generation unit price, and by modeling for each division, more accurate modeling is carried out compared to before the division. ..
例えば、ある電気事業者の所有する発電機が5台で1台あたりの発電容量が100[MW]であり、供給すべき需要が300[MW]から500[MW]まで変動するとする。この場合は区分を2つ設け、2つの区分A・Bそれぞれを、区分A:300[MW]から400[MW]、区分B:400[MW]から500[MW]として不確定要因と損益データを区分Aまたは区分Bに分離し、式(4)及び式(5)のようにそれぞれの区分でモデル式を作成する。 For example, suppose that there are five generators owned by an electric power company, the power generation capacity of each generator is 100 [MW], and the demand to be supplied fluctuates from 300 [MW] to 500 [MW]. In this case, two categories are provided, and each of the two categories A and B is classified as category A: 300 [MW] to 400 [MW] and category B: 400 [MW] to 500 [MW], and uncertain factors and profit / loss data. Is divided into categories A and B, and model equations are created in each category as in equations (4) and (5).
![]()
![]()
![]()
![]()
ここで、添え字a,bは各区分を表し、a0からa3はモデルパラメータである。これらモデルパラメータを区分毎に分離したデータを利用して算出することで、区分毎に不確定要因と損益の関係がモデル化できる。 Here, the subscripts a and b represent each division, and a 0 to a 3 are model parameters. By calculating these model parameters using data separated for each category, the relationship between uncertainties and profit and loss can be modeled for each category.
区分モデル作成部20は、不確定要因と損益との関係をモデル化する際に、電気事業者がエネルギーを供給可能な需要に関して、発電機の容量に応じてモデル化に利用するデータの範囲を区分し、区分ごとにモデル化を行うことになる。
When modeling the relationship between uncertainties and profit and loss, the division
区分ごとにモデル化を行うことによって、区分しない場合における、区分の前後における損益分布の様相の変化に起因するモデル化誤差の増大を回避して、不確定要因と損益との関係に関するモデル化の精度を向上させることができる。 By modeling for each category, it is possible to avoid an increase in modeling error due to changes in the appearance of the profit and loss distribution before and after the category when no category is used, and to model the relationship between uncertain factors and profit and loss. The accuracy can be improved.
本実施の形態2に係る電気事業損益分析システムは、需要を満たすために必要な起動発電機の台数・種類によって平均発電単価が異なる性質を考慮して、区分モデル作成部20において起動発電機の容量に応じてモデル化に利用するデータの範囲を区分し、区分毎にモデル化を行うことによって、不確定要因と損益との関係に関するモデル化の精度を向上させることが可能である。
In the electric power business profit / loss analysis system according to the second embodiment, in consideration of the property that the average power generation unit price differs depending on the number and type of start-up generators required to satisfy the demand, the division
なお、本実施の形態2では発電機でエネルギーの供給可能な需要の例に電力需要を挙げて説明したが、他のエネルギーでもよく、他には熱エネルギー等が考えられる。 In the second embodiment, the electric power demand has been described as an example of the demand that can be supplied with energy by the generator, but other energy may be used, and thermal energy or the like may be considered.
以上のように、電気事業損益分析システムは、電気事業の損益のリスクに関する不確定要因を含むデータを設定するデータ設定部と、不確定要因に関する将来予測のシナリオをN個生成するシナリオ生成部と、シナリオに基づく電力の需要及び供給の想定からシナリオ毎に損益をM個算出する発電計画部と、該M個のシナリオと損益との関係を電力の需要を発電機の容量で区分した損益モデルにする区分モデル作成部と、損益モデルに発電計画部で算出しなかった(N−M)個のシナリオを代入してシナリオ毎に損益を計算する省略計算部と、発電計画部で算出したM個の損益と省略計算部で計算した(N−M)個の損益とからリスクを計算するリスク量計算部と、リスク量計算部が計算した損益のリスクを表示する結果表示部とを備えている。但し、N及びMは自然数であり、M<Nの関係にある。 As described above, the electric power business profit and loss analysis system includes a data setting unit that sets data including uncertain factors related to the risk of profit and loss of the electric business, and a scenario generation unit that generates N future forecast scenarios related to uncertain factors. , The power generation planning department that calculates M profits and losses for each scenario from the assumption of power demand and supply based on the scenario, and the profit and loss model that divides the relationship between the M scenarios and profits and losses by the capacity of the generator. The division model creation unit, the abbreviated calculation unit that calculates the profit and loss for each scenario by substituting (NM) scenarios that were not calculated by the power generation planning department into the profit and loss model, and the M that was calculated by the power generation planning department. It is equipped with a risk amount calculation unit that calculates the risk from the profit and loss of each unit and the (NM) number of profit and loss calculated by the abbreviated calculation unit, and a result display unit that displays the risk of the profit and loss calculated by the risk amount calculation unit. There is. However, N and M are natural numbers, and there is a relationship of M <N.
実施の形態3.
実施の形態1では、不確定要因に関して生成した全てのケースの電気事業損益を高速に求める電気事業損益分析システムの動作を示した。また、実施の形態2では、需要の大きさで利用するデータを区分し、区分毎にモデル化することで、モデル化の精度を向上可能であった。本実施の形態3では、モデル化のためのデータを得る方法に関する説明であり、実施の形態2と同様にモデル化精度の向上を目的とする。
In the first embodiment, the operation of the electric power business profit / loss analysis system for quickly obtaining the electric power business profit / loss in all cases generated for uncertain factors is shown. Further, in the second embodiment, the accuracy of modeling can be improved by classifying the data to be used according to the magnitude of demand and modeling for each class. In the third embodiment, a method for obtaining data for modeling is described, and the purpose is to improve the modeling accuracy as in the second embodiment.
本実施の形態3は、図9に示すように、実施の形態1に加えてシナリオ抽出部30を備える。なお、図9においては、実施の形態1と同様の構成には同じ番号を割り振る。
As shown in FIG. 9, the third embodiment includes a
シナリオ抽出部30は、例えば、プログラムとして図2に示す主記憶装置3上に展開したものをCPU2上で実行するものである。CPU2は、主記憶装置3上のデータを読み込み、シナリオ抽出部30の処理を行い、その結果得られたモデルを主記憶装置3、補助記憶装置4、外部記憶装置5の少なくともいずれかに保存する。また、処理結果をディスプレイ等の出力装置7に表示し運用者に示してもよい。
The
図10は本実施の形態3に係る電気事業損益分析システムの動作を示すフローチャートである。以下、図10を用いて動作について説明する。なお、図10において実施の形態1と同様の処理は同じ番号を割り振り、説明を省略する。 FIG. 10 is a flowchart showing the operation of the electric power business profit / loss analysis system according to the third embodiment. Hereinafter, the operation will be described with reference to FIG. In FIG. 10, the same processing as in the first embodiment is assigned the same number, and the description thereof will be omitted.
図10のステップS300では、シナリオ抽出部30において、シナリオ生成部12が生成したシナリオに順位付けをして、モデル生成に利用するケースM[個]のシナリオを、順位をもとに抽出する。
In step S300 of FIG. 10, the
例えば、図11には不確定要因として燃料価格シナリオを20本示している。横軸は所定間隔による時間軸であり、ここでは日、縦軸は燃料価格[ドル/バレル]である。シナリオが生成された順番が図中に示したとおりだとすると、M=5の場合は、燃料価格が損益計算期間中に比較的高かったシナリオのみについて、次ステップのS103及びS104の起動停止計画及び出力決定で扱って損益計算する可能性がある。これらのシナリオ及び損益から損益モデルを作成すると、シナリオデータの偏りによって、燃料価格が下降したシナリオにおける損益については、損益モデルからは精度よく求まらない可能性がある。 For example, FIG. 11 shows 20 fuel price scenarios as uncertain factors. The horizontal axis is the time axis at predetermined intervals, where the day and the vertical axis are the fuel price [dollar / barrel]. Assuming that the order in which the scenarios were generated is as shown in the figure, in the case of M = 5, only the scenarios in which the fuel price was relatively high during the profit and loss calculation period are the start / stop plans and outputs of S103 and S104 in the next step. There is a possibility to handle it in a decision and calculate profit and loss. If a profit / loss model is created from these scenarios and profit / loss, the profit / loss in the scenario where the fuel price falls due to the bias of the scenario data may not be accurately obtained from the profit / loss model.
このため、シナリオ抽出部30において予めS103、S104で利用するシナリオを抽出しておくことで、データの偏りを防止でき、モデル化の精度悪化を防ぐことができる。
Therefore, by extracting the scenarios to be used in S103 and S104 in advance in the
シナリオ抽出方法としては、例えば、各シナリオの平均値を算出後、平均値について降順に順位付けし、順位が一番のシナリオから順に等間隔にN番のシナリオまでM本抽出する方法がある。不確定要因が複数ある場合は、各不確定要因に対し、上述した順位付け及びシナリオ抽出を実施し、同じ順位のシナリオ(例えば、1位の為替・燃料価格シナリオをケース1、5位の為替・燃料シナリオをケース2等)をまとめてケースとする方法がある。
As a scenario extraction method, for example, there is a method of calculating the average value of each scenario, ranking the average value in descending order, and extracting M scenarios from the scenario with the highest ranking to the Nth scenario at equal intervals. If there are multiple uncertain factors, the above-mentioned ranking and scenario extraction will be performed for each uncertain factor, and scenarios with the same ranking (for example, the 1st place exchange / fuel price scenario will be the 1st and 5th place exchanges). -There is a method to make the fuel scenario into a case by collecting
シナリオ抽出部30は、生成したシナリオに順位付け及び発電計画部13で利用するシナリオの選択を実施する。
The
本実施の形態3に係る電気事業損益分析システムは、生成したシナリオに順位付け及び順位に基づいた選択を実施し、不確定要因と損益との関係をモデル化する際の入力データの偏りを防止することによって、モデル化の精度が向上可能である。 The electric power business profit / loss analysis system according to the third embodiment ranks the generated scenarios and makes selections based on the rankings to prevent bias of input data when modeling the relationship between uncertain factors and profit / loss. By doing so, the accuracy of modeling can be improved.
なお、本実施の形態3では発電機でエネルギーの供給可能な需要の例に電力需要を挙げて説明したが、他のエネルギーでもよく、他には熱エネルギー等が考えられる。 In the third embodiment, the electric power demand has been described as an example of the demand that can be supplied with energy by the generator, but other energy may be used, and thermal energy or the like may be considered.
電気事業損益分析システムは、電気事業の損益のリスクに関する不確定要因を含むデータを設定するデータ設定部と、不確定要因に関する将来予測のシナリオをN個生成するシナリオ生成部と、シナリオに基づく電力の需要及び供給の想定からシナリオ毎に損益をM個算出する発電計画部と、該M個のシナリオと損益との関係を損益モデルにするモデル作成部と、損益モデルに発電計画部で算出しなかった(N−M)個のシナリオを代入してシナリオ毎に損益を計算する省略計算部と、発電計画部で算出したM個の損益と省略計算部で計算した(N−M)個の損益とからリスクを計算するリスク量計算部と、リスク量計算部が計算した損益のリスクを表示する結果表示部とを備えている。但し、N及びMは自然数であり、M<Nの関係にある。 The electric business profit and loss analysis system has a data setting unit that sets data including uncertain factors related to the risk of profit and loss of the electric business, a scenario generation unit that generates N future forecast scenarios related to uncertain factors, and power based on the scenarios. The power generation planning department calculates M profits and losses for each scenario from the demand and supply assumptions, the model creation department that uses the relationship between the M scenarios and profits and losses as a profit and loss model, and the power generation planning department that calculates the profit and loss model. The abbreviated calculation unit that substitutes the missing (NM) scenarios and calculates the profit and loss for each scenario, and the M profit and loss calculated by the power generation planning unit and the (NM) number calculated by the abbreviated calculation unit. It has a risk amount calculation unit that calculates the risk from the profit and loss, and a result display unit that displays the profit and loss risk calculated by the risk amount calculation unit. However, N and M are natural numbers, and there is a relationship of M <N.
また、シナリオ生成部で生成したN個のシナリオから優先順位の高いものから順にM個のシナリオを抽出するシナリオ抽出部を備え、発電計画部は、シナリオ抽出部で抽出されたM個のシナリオを用いている。 In addition, it is equipped with a scenario extraction unit that extracts M scenarios in descending order of priority from the N scenarios generated by the scenario generation unit, and the power generation planning unit extracts the M scenarios extracted by the scenario extraction unit. I am using it.
実施の形態4.
実施の形態2では、需要の大きさで利用するデータを区分し、区分毎にモデル化することで、モデル化の精度を向上可能であった。また、実施の形態3では、モデル化のためのデータを得る方法を工夫することで、モデル化精度を向上させるものであった。本実施の形態4は、実施の形態2と実施の形態3とを組み合わせたものである。より具体的には、実施の形態1に対して、モデル作成部14を区分モデル作成部20に置き換え、シナリオ抽出部30を加えた構成である。
In the second embodiment, the accuracy of modeling can be improved by classifying the data to be used according to the magnitude of demand and modeling for each class. Further, in the third embodiment, the modeling accuracy is improved by devising a method for obtaining data for modeling. The fourth embodiment is a combination of the second embodiment and the third embodiment. More specifically, the
図12は実施の形態4における電気事業損益分析システムの機能を示すブロック図である。また、図13は実施の形態4における電気事業損益分析システムの動作を示すフローチャートである。各構成要素及びステップは、実施の形態1から実施の形態3までで説明したとおりである。
FIG. 12 is a block diagram showing the function of the electric power business profit / loss analysis system according to the fourth embodiment. Further, FIG. 13 is a flowchart showing the operation of the electric power business profit / loss analysis system according to the fourth embodiment. Each component and step is as described in
本実施の形態4に係る電気事業損益分析システムは、需要を満たすために必要な起動発電機の台数・種類によって平均発電単価が異なる性質を考慮して、区分モデル作成部20において起動発電機の容量に応じてモデル化に利用するデータの範囲を区分し、区分毎にモデル化を行うことによって、不確定要因と損益との関係に関するモデル化の精度を向上させることが可能である。
In the electric power business profit / loss analysis system according to the fourth embodiment, in consideration of the property that the average power generation unit price differs depending on the number and type of start-up generators required to satisfy the demand, the division
また、本実施の形態4に係る電気事業損益分析システムは、生成したシナリオに順位付け及び順位に基づいた選択を実施し、不確定要因と損益との関係をモデル化する際の入力データの偏りを防止することによって、モデル化の精度が向上可能である。 In addition, the electric power business profit / loss analysis system according to the fourth embodiment ranks the generated scenarios and makes selections based on the rankings, and biases the input data when modeling the relationship between uncertain factors and profit / loss. By preventing this, the accuracy of modeling can be improved.
なお、本実施の形態4では発電機でエネルギーの供給可能な需要の例に電力需要を挙げて説明したが、他のエネルギーでもよく、他には熱エネルギー等が考えられる。 In the fourth embodiment, the electric power demand has been described as an example of the demand that can be supplied with energy by the generator, but other energy may be used, and thermal energy or the like may be considered.
電気事業損益分析システムは、電気事業の損益のリスクに関する不確定要因を含むデータを設定するデータ設定部と、不確定要因に関する将来予測のシナリオをN個生成するシナリオ生成部と、シナリオに基づく電力の需要及び供給の想定からシナリオ毎に損益をM個算出する発電計画部と、該M個のシナリオと損益との関係を電力の需要を発電機の容量で区分した損益モデルにする区分モデル作成部と、損益モデルに発電計画部で算出しなかった(N−M)個のシナリオを代入してシナリオ毎に損益を計算する省略計算部と、発電計画部で算出したM個の損益と省略計算部で計算した(N−M)個の損益とからリスクを計算するリスク量計算部と、リスク量計算部が計算した損益のリスクを表示する結果表示部とを備えている。但し、N及びMは自然数であり、M<Nの関係にある。 The electric business profit and loss analysis system has a data setting unit that sets data including uncertain factors related to the risk of profit and loss of the electric business, a scenario generation unit that generates N future forecast scenarios related to uncertain factors, and power based on the scenarios. The power generation planning department that calculates M profits and losses for each scenario from the demand and supply assumptions of Omission calculation unit that calculates profit and loss for each scenario by substituting (NM) scenarios that were not calculated by the power generation planning department into the profit and loss model, and M profit and loss and omission calculated by the power generation planning department. It is provided with a risk amount calculation unit that calculates the risk from (NM) pieces of profit and loss calculated by the calculation unit, and a result display unit that displays the risk of the profit and loss calculated by the risk amount calculation unit. However, N and M are natural numbers, and there is a relationship of M <N.
また、シナリオ生成部で生成したN個のシナリオから優先順位の高いものから順にM個のシナリオを抽出するシナリオ抽出部を備え、発電計画部は、シナリオ抽出部で抽出されたM個のシナリオを用いている。 In addition, it is equipped with a scenario extraction unit that extracts M scenarios in descending order of priority from the N scenarios generated by the scenario generation unit, and the power generation planning unit extracts the M scenarios extracted by the scenario extraction unit. I am using it.
実施の形態5.
本発明の実施の形態1では、全シナリオに対して発電計画を計算した場合の損益分布に対し、省略計算をすることにより近似した損益分布を高速に得られることを示した。経営判断をする上では、損益分布の全体的な傾向は大まかに把握した上で、損益を被る可能性があるかどうかを見極めるために、損益分布の裾野(特に、損失が発生する側)はできる限り正確に把握しておくことが望ましい。
In the first embodiment of the present invention, it was shown that an approximate profit / loss distribution can be obtained at high speed by performing an abbreviated calculation with respect to the profit / loss distribution when the power generation plan is calculated for all scenarios. When making a management decision, after roughly grasping the overall tendency of the profit and loss distribution, the base of the profit and loss distribution (especially the side where the loss occurs) is determined in order to determine whether or not there is a possibility of suffering a profit or loss. It is desirable to know as accurately as possible.
そこで、実施の形態5では、図14に示すような実施の形態1の省略計算部15で得た損益のシナリオ分布のうち、損益が小さくなる或いは損失となる側の裾野にある部分のシナリオに対して、発電計画部13で再計算して、損益を被るかどうかを正確に把握することを目的とする。図14では、横軸を損益、縦軸を度数として、省略計算後の損益の分布を示し、特に、損益の軸が損失又は利益が小さい箇所に絞って再計算の対象とすることを示している。
Therefore, in the fifth embodiment, in the scenario distribution of the profit / loss obtained by the omitted
本実施の形態5は、図15に示すように、実施の形態1に加えて再計算対象決定部50を備える。なお、図15においては、実施の形態1と同様の構成には同じ番号を割り振る。
As shown in FIG. 15, the fifth embodiment includes a recalculation
再計算対象決定部50は、例えば、プログラムとして図2に示す主記憶装置3上に展開したものをCPU2上で実行するものである。CPU2は、主記憶装置3上のデータを読み込み、再計算対象決定部50の処理を行い、その結果得られた再計算対象シナリオを主記憶装置3、補助記憶装置4、外部記憶装置5のいずれか、あるいは複数に保存する。また、処理結果をディスプレイ等の出力装置7に表示し運用者に示してもよい。
The recalculation
また、再計算対象決定部50で再計算対象シナリオを決定するために、あらかじめデータ設定部10に、再計算させる範囲を指定するために損益分布のうち損益の小さい、換言すると損益がマイナスになりやすいシナリオをどれだけ選択するかを決める再計算対象割合(%)、或いは損益の額が所定の値以下となるシナリオのみを選択するための再計算対象損益額(円)を、入力または取得し、指定する記憶装置に保存する。
Further, in order for the recalculation
図16は本実施の形態5に係る電気事業損益分析システムの動作を示すフローチャートである。以下、図16を用いて動作について説明する。なお、図16において実施の形態1と同様の処理は同じ番号を割り振り、説明を省略する。 FIG. 16 is a flowchart showing the operation of the electric power business profit / loss analysis system according to the fifth embodiment. Hereinafter, the operation will be described with reference to FIG. In FIG. 16, the same processing as in the first embodiment is assigned the same number, and the description thereof will be omitted.
図16のステップS500では、再計算対象決定部50において、再計算対象シナリオを決定する。より具体的には、例えば、損益の小さいシナリオから再計算対象割合(%)だけ再計算対象シナリオを選択する、損益の額が再計算対象損益額(円)よりも小さいシナリオを再計算対象シナリオとして選択する。
In step S500 of FIG. 16, the recalculation
ステップS501では、ステップS500で選択した再計算対象シナリオに対して、発電計画部13で再計算を実施する。
In step S501, the power
ステップS502では、リスク量計算部16において、再計算した結果を含むN個の損益計算結果から所望のリスク指標を算出し、データ格納部11に格納する。
In step S502, the risk
ステップS503では、結果表示部17において、データ格納部11に格納された再計算結果を含む計算結果を表示する。
In step S503, the
本実施の形態5に係る電気事業損益分析システムは、省略計算で得た損益分布のうち、損益が小さくなる、あるいは損失となる側の裾野にある一部のシナリオに対して、発電計画部13で再計算することによって、損益を被るかどうかを正確に把握することが可能である。
The electric power business profit / loss analysis system according to the fifth embodiment has a power
電気事業損益分析システムは、電気事業の損益のリスクに関する不確定要因を含むデータを設定するデータ設定部と、不確定要因に関する将来予測のシナリオをN個生成するシナリオ生成部と、シナリオに基づく電力の需要及び供給の想定からシナリオ毎に損益をM個算出する発電計画部と、該M個のシナリオと損益との関係を電力の需要を発電機の容量で区分した損益モデルにする区分モデル作成部と、損益モデルに発電計画部で算出しなかった(N−M)個のシナリオを代入してシナリオ毎に損益を計算する省略計算部と、発電計画部で算出したM個の損益と省略計算部で計算した(N−M)個の損益とからリスクを計算するリスク量計算部と、リスク量計算部が計算した損益のリスクを表示する結果表示部とを備えている。但し、N及びMは自然数であり、M<Nの関係にある。 The electric business profit and loss analysis system has a data setting unit that sets data including uncertain factors related to the risk of profit and loss of the electric business, a scenario generation unit that generates N future forecast scenarios related to uncertain factors, and power based on the scenarios. The power generation planning department that calculates M profits and losses for each scenario from the demand and supply assumptions of Omission calculation unit that calculates profit and loss for each scenario by substituting (NM) scenarios that were not calculated by the power generation planning department into the profit and loss model, and M profit and loss and omission calculated by the power generation planning department. It is provided with a risk amount calculation unit that calculates the risk from (NM) pieces of profit and loss calculated by the calculation unit, and a result display unit that displays the risk of the profit and loss calculated by the risk amount calculation unit. However, N and M are natural numbers, and there is a relationship of M <N.
また、省略計算部から得られた損益の分布から損失側となる所定のシナリオを選定する再計算対象決定部を備え、発電計画部は、再計算対象決定部で選定したシナリオを再計算する。 In addition, the power generation planning unit recalculates the scenario selected by the recalculation target determination unit, which includes a recalculation target determination unit that selects a predetermined scenario on the loss side from the distribution of profit and loss obtained from the omission calculation unit.
実施の形態6.
本発明の実施の形態1では、省略計算に入る前に発電計画部13で所定のM個のシナリオに対して計算を行う。所定の計算時間で終わらせることを目的とするのであれば、実施の形態1のようにあらかじめMの値を設定しても良い。しかしながら、損益分布を効率良く再現するための適切なMの値は、発電計画部13で必要最小限だけ行う計算回数である。
In the first embodiment of the present invention, the power
発電計画部13で計算を進めていくと、計算済みのシナリオから算出される損益の期待値、分散などの指標は収束していくことになる。この際に、所定の誤差範囲内でこれらの指標が収まれば収束したと判定でき、発電計画部13での計算の終了判定が可能となる。
As the power
そこで、実施の形態6では、実施の形態1の発電計画部で計算する回数を限定せず、図17に示すように、発電計画部13で計算した結果を蓄積して得られた損益の期待値、分散などの指標が収束した時点で発電計画部13での計算を終了して、発電計画部13での計算回数を適正化することを目的とする。これによって、無駄な計算時間を短種することができる。
Therefore, in the sixth embodiment, the number of calculations performed by the power generation planning unit of the first embodiment is not limited, and as shown in FIG. 17, the expected profit / loss obtained by accumulating the results calculated by the power
図17の横軸はシナリオ計算回数であり、縦軸は収束判定指標である。収束を判定する指標が収束して所定の範囲に収まる(点線で囲った箇所)と、収束したと判定し、ここで発電計画部13の計算を終了できる。
The horizontal axis of FIG. 17 is the number of scenario calculations, and the vertical axis is the convergence test index. When the index for determining convergence converges and falls within a predetermined range (the portion surrounded by the dotted line), it is determined that the index has converged, and the calculation of the power
ここで、収束を判定する指標としては、損益の期待値、分散に限られるものではなく、歪度、尖度、VaR、CVaRなどであってもよい。判定に用いる指標は、これらのうち1つでもよいし、複数を組み合わせて用いてもよい。 Here, the index for determining convergence is not limited to the expected value of profit and loss and variance, but may be skewness, kurtosis, VaR, CVaR, and the like. The index used for the determination may be one of these, or a plurality of indexes may be used in combination.
ここで、VaRとは、Value at Risk(バリュー・アット・リスク)の略で、通常発生し得る損益の範囲を考え、その範囲の中で最悪の損失をリスク量と捉える考え方である。例えば、信頼区間を99%としたとき、損益の良い方から99%に相当する値がVaRとなる。 Here, VaR is an abbreviation for Value at Risk, and is a concept that considers the range of profit and loss that can normally occur and regards the worst loss in that range as the amount of risk. For example, when the confidence interval is 99%, the value corresponding to 99% from the one with the best profit and loss is VaR.
また、CVaRとは、Conditional Value at Rist(条件付バリュー・アット・リスク)の略で、通常発生し得る損益の範囲を超える場合の平均損益のことである。例えば、信頼区間を99%としたとき、損益の良い方から99%を除いた値の平均値がCVaRとなる。 CVaR is an abbreviation for Conditional Value at Risk, and is an average profit or loss when it exceeds the range of profit or loss that can normally occur. For example, when the confidence interval is 99%, the average value of the values obtained by excluding 99% from the one with the best profit and loss is CVaR.
例えば、計算済みのシナリオ数をn、シナリオi(i:1,2,・・・,n)の損益の額をx(i)、x(i)の平均値をx_ave、標準偏差をsとすると、分布の非対称性を示す歪度は、例えば、次の式(6)で算出することができる。 For example, the calculated number of scenarios is n, the amount of profit / loss of scenario i (i: 1, 2, ..., N) is x (i), the average value of x (i) is x_ave, and the standard deviation is s. Then, the skewness indicating the asymmetry of the distribution can be calculated by, for example, the following equation (6).
また、分布の鋭さを示す尖度は例えば次の式(7)で算出することができる。 Further, the kurtosis indicating the sharpness of the distribution can be calculated by, for example, the following equation (7).
本実施の形態6は、図18に示すように、実施の形態1に加えて収束判定部60を備える。なお、図18においては、実施の形態1と同様の構成には同じ番号を割り振る。
As shown in FIG. 18, the sixth embodiment includes a
収束判定部60は、例えば、プログラムとして図2に示す主記憶装置3上に展開したものをCPU2上で実行するものである。CPU2は、主記憶装置3上のデータを読み込み、収束判定部60の処理を行い、その結果得られた損益の期待値や分散などの収束判定指標を主記憶装置3、補助記憶装置4、外部記憶装置5のいずれか、或いは複数に保存する。また、処理結果をディスプレイ等の出力装置7に表示し運用者に示してもよい。また、収束判定部60は、損益の期待値、分散などの収束判定指標が、所定の誤差範囲内に収まっていれば収束したものと判定し、発電計画部13に計算を終了するように指令する。
The
また、収束判定部60で収束したかどうかを判定するために、予めデータ設定部10に、損益の期待値、分散などの収束判定指標が所定の誤差範囲内に収まっているかどうかを見極めるための誤差基準εを、入力または取得し、指定する記憶装置に保存する。この誤差基準εを使い、例えば、次の式のように、ある収束判定指標Xの前回値X(t−1)と今回値X(t)との差の絶対値が、誤差基準ε未満であれば収束したものと判定する。
Further, in order to determine whether or not the
|X(t)−X(t−1)|<ε ・・・(8) | X (t) -X (t-1) | <ε ・ ・ ・ (8)
また、偶然性を排除するために、収束判定指標が所定の誤差範囲内に1回収まっただけで収束したものと判定するのではなく、数回続けて収まっていることをもって収束したものと判定してもよい。 In addition, in order to eliminate chance, it is not determined that the convergence test index has converged only by collecting one within a predetermined error range, but that it has converged when it has been settled several times in a row. You may.
さらに、図17に示すように、ある計算回数(判定開始タイミング)から別の計算回数(判定終了タイミング)の間で判定を行うように、判定開始タイミング(回)と判定終了タイミング(回)を設定してもよい。ただし、判定開始タイミング<判定終了タイミングが成り立つものとする。 Further, as shown in FIG. 17, the determination start timing (times) and the determination end timing (times) are set so that the determination is performed between a certain number of calculations (judgment start timing) and another calculation number (judgment end timing). It may be set. However, it is assumed that the judgment start timing <judgment end timing holds.
図19は本実施の形態6に係る電気事業損益分析システムの動作を示すフローチャートである。以下、図19を用いて動作について説明する。なお、図19において実施の形態1と同様の処理は同じ番号を割り振り、説明を省略する。 FIG. 19 is a flowchart showing the operation of the electric power business profit / loss analysis system according to the sixth embodiment. Hereinafter, the operation will be described with reference to FIG. In FIG. 19, the same processing as in the first embodiment is assigned the same number, and the description thereof will be omitted.
図19のステップS600では、収束判定部60において、判定開始タイミング以上であれば、ステップS601に進み、判定開始タイミン未満であれば、ステップS103に戻る。より具体的には、収束判定部60において、発電計画部13での計算回数が判定開始タイミング以上であるかどうかを判定し、判定開始タイミング以上であればステップS601を、判定開始タイミング以下であればS103に戻る。
In step S600 of FIG. 19, in the
ステップS601では、収束判定部60が収束したと判断した場合にはステップS106に進み、収束していないと判断した場合にはステップS602に進む。より具体的には、発電計画部13で各シナリオの計算をする度に、計算した全シナリオに対する損益の期待値、分散などの収束判定指標を計算し、収束判定指標が、データ設定部10で設定した誤差基準に基づく所定の誤差範囲内に収まっているかどうかを判定し、1回あるいは数回続けて誤差範囲内であれば、発電計画部13に計算を終了するように指令してステップS106を実行し、誤差範囲外であれば、ステップS602に進む。
In step S601, if it is determined that the
ステップS602では、発電計画部13での計算回数が判定終了タイミング以上であるかを判定し、判定終了タイミング以上であれば発電計画部13に計算を終了するように指令してステップS106に進み、判定終了タイミング以下であればステップS103を実行する。
In step S602, it is determined whether the number of calculations in the power
発電計画部13のM個のシナリオと、省略計算部15の(N−M)個のシナリオから得られた損益の分布から損失側となる所定のシナリオを選定する再計算対象決定部50を備えている。もっとも、発電計画部13で既に損益を計算したM個について、同じ計算になる場合は再計算を省略することができるのは、当然のことである。
Equipped with a recalculation
本実施の形態6に係る電気事業損益分析システムは、発電計画部13で計算する回数を限定せず、発電計画部13で計算した結果を蓄積して得られた損益の期待値、分散などの指標が収束した時点で発電計画部13での計算を終了することによって、発電計画部13での計算回数を適正化することが可能である。
The electric power business profit / loss analysis system according to the sixth embodiment does not limit the number of times of calculation by the power
発電計画部13の損益が収束しているか否かが重要であり、その判断の指標はいずれでも構わない。また、収束しているか否かの判断基準は、許容される計算時間との関係で問題になることであり、一概に決めることができるものでもない。
It is important whether or not the profit and loss of the power
電気事業損益分析システムは、電気事業の損益のリスクに関する不確定要因を含むデータを設定するデータ設定部と、不確定要因に関する将来予測のシナリオをN個生成するシナリオ生成部と、シナリオに基づく電力の需要及び供給の想定からシナリオ毎に損益をM個算出する発電計画部と、該M個のシナリオと損益との関係を電力の需要を発電機の容量で区分した損益モデルにする区分モデル作成部と、損益モデルに発電計画部で算出しなかった(N−M)個のシナリオを代入してシナリオ毎に損益を計算する省略計算部と、発電計画部で算出したM個の損益と省略計算部で計算した(N−M)個の損益とからリスクを計算するリスク量計算部と、リスク量計算部が計算した損益のリスクを表示する結果表示部とを備えている。但し、N及びMは自然数であり、M<Nの関係にある。 The electric business profit and loss analysis system has a data setting unit that sets data including uncertain factors related to the risk of profit and loss of the electric business, a scenario generation unit that generates N future forecast scenarios related to uncertain factors, and power based on the scenarios. The power generation planning department that calculates M profits and losses for each scenario from the demand and supply assumptions of Omission calculation unit that calculates profit and loss for each scenario by substituting (NM) scenarios that were not calculated by the power generation planning department into the profit and loss model, and M profit and loss and omission calculated by the power generation planning department. It is provided with a risk amount calculation unit that calculates the risk from (NM) pieces of profit and loss calculated by the calculation unit, and a result display unit that displays the risk of the profit and loss calculated by the risk amount calculation unit. However, N and M are natural numbers, and there is a relationship of M <N.
発電計画部の損益が収束しているか否かを判定する収束判定部を備え、発電計画部は、収束判定部が収束と判定した場合は計算を終了する。 The power generation planning unit includes a convergence determination unit that determines whether or not the profit and loss of the power generation planning unit has converged, and the power generation planning unit ends the calculation when the convergence determination unit determines that the convergence has occurred.
実施の形態7.
本発明の実施の形態5では、損益分布の裾野を正確に把握するために、損益が小さくなる、或いは損失となる側の裾野にある一部のシナリオに対して、発電計画部13で再計算することを示した。損益分布の裾野をさらに精度良く把握するためには、損益分布の裾野に存在するシナリオを多く生成して、損益分布の裾野のサンプル数を増やし、裾野の形状をより細やかに表現する必要がある。
In the fifth embodiment of the present invention, in order to accurately grasp the base of the profit / loss distribution, the power
そこで、実施の形態7では、実施の形態1のシナリオ生成部12が、損益分布の裾野に存在する可能性の高いシナリオを生成するようにし、損益分布の裾野の形状をより細やかに精度良く表現することを目的とする。
Therefore, in the seventh embodiment, the
これを実現するために、図20に示すような特徴抽出部70を備え、特徴抽出部70では、不確定要因に関する将来予測に基づいて生成したシナリオを損益モデルに代入した結果、損益分布の裾野に存在するシナリオに着目し、そのシナリオの特徴を抽出する。シナリオの特徴を表す不確定要因は、例えば、為替の高低、燃料価格の高低、需要の大小等がある。これらの特徴から、シナリオ生成部12でシナリオを生成する際に、不確定要因の取りうる値の幅を狭め、損益分布の裾野に存在する可能性の高いシナリオを生成する。
In order to realize this, a
このようにすることで、例えば、需要が大きいシナリオが損益分布の裾野に存在する可能性が高い場合には、需要が大きいシナリオのみを生成するようにし、損益分布の裾野のサンプル数を増やして、裾野の形状をより細やかに精度良く表現することが可能となる。一つの不確定要因に限らず、複数の不確定要因の組み合わせを特徴としても良く、例えば、為替が高く、かつ需要が大きいことを特徴とするシナリオが損益分布の裾野に存在する可能性が高い場合には、為替が高く、かつ需要が大きいシナリオのみを生成するようにしても良い。 By doing so, for example, when there is a high possibility that a scenario with high demand exists at the base of the profit and loss distribution, only the scenario with high demand is generated, and the number of samples at the base of the profit and loss distribution is increased. , It is possible to express the shape of the base more finely and accurately. Not limited to one uncertain factor, it may be characterized by a combination of multiple uncertain factors. For example, there is a high possibility that a scenario characterized by high exchange rate and high demand exists at the base of the profit and loss distribution. In some cases, only scenarios with high exchange rates and high demand may be generated.
本実施の形態7に係る電気事業損益分析システムは、損益分布の裾野に存在するシナリオの特徴を抽出し、抽出した特徴に基づいてシナリオ生成部12でシナリオを生成することによって、損益分布の裾野のサンプル数を増やし、損益分布の裾野の形状をより細やかに精度良く表現することが可能である。
The electric business profit / loss analysis system according to the seventh embodiment extracts the characteristics of the scenario existing at the base of the profit / loss distribution, and the
電気事業損益分析システムは、電気事業の損益のリスクに関する不確定要因を含むデータを設定するデータ設定部と、不確定要因に関する将来予測のシナリオをN個生成するシナリオ生成部と、シナリオに基づく電力の需要及び供給の想定からシナリオ毎に損益をM個算出する発電計画部と、該M個のシナリオと損益との関係を電力の需要を発電機の容量で区分した損益モデルにする区分モデル作成部と、損益モデルに発電計画部で算出しなかった(N−M)個のシナリオを代入してシナリオ毎に損益を計算する省略計算部と、発電計画部で算出したM個の損益と省略計算部で計算した(N−M)個の損益とからリスクを計算するリスク量計算部と、リスク量計算部が計算した損益のリスクを表示する結果表示部とを備えている。但し、N及びMは自然数であり、M<Nの関係にある。 The electric business profit and loss analysis system has a data setting unit that sets data including uncertain factors related to the risk of profit and loss of the electric business, a scenario generation unit that generates N future forecast scenarios related to uncertain factors, and power based on the scenarios. The power generation planning department that calculates M profits and losses for each scenario from the demand and supply assumptions of Omission calculation unit that calculates profit and loss for each scenario by substituting (NM) scenarios that were not calculated by the power generation planning department into the profit and loss model, and M profit and loss and omission calculated by the power generation planning department. It is provided with a risk amount calculation unit that calculates the risk from (NM) pieces of profit and loss calculated by the calculation unit, and a result display unit that displays the risk of the profit and loss calculated by the risk amount calculation unit. However, N and M are natural numbers, and there is a relationship of M <N.
また、発電計画部及び省略計算部から得られた損益からシナリオの特徴を抽出する特徴抽出部を備え、シナリオ生成部は、特徴抽出部で抽出した特徴を持つシナリオを生成する。 Further, a feature extraction unit for extracting the characteristics of the scenario from the profit and loss obtained from the power generation planning unit and the abbreviated calculation unit is provided, and the scenario generation unit generates a scenario having the characteristics extracted by the feature extraction unit.
本願発明は、これまで述べてきた実施の形態に限定されるものではなく、本願発明の範囲内で種々に改変することができる。すなわち、これまで述べてきた実施の形態の構成を適宜改良してもよく、また、少なくとも一部を他の構成に代替させてもよい。さらに、その配置について特に限定のない構成要件は、実施の形態で開示した配置に限らず、その機能を達成できる位置に配置することができる。また、これまで述べてきた実施の形態に開示されている複数の構成要素を適宜組み合わせることにより発明を形成してもよい。さらに、本願発明は、これまで述べてきた実施の形態の範囲ではなく、特許請求の範囲によって示され、特許請求の範囲と均等の意味および範囲内でのすべての変更を含むものである。 The invention of the present application is not limited to the embodiments described so far, and can be variously modified within the scope of the invention of the present application. That is, the configuration of the embodiments described so far may be appropriately improved, or at least a part thereof may be replaced with another configuration. Further, the configuration requirement without particular limitation on the arrangement is not limited to the arrangement disclosed in the embodiment, and can be arranged at a position where the function can be achieved. In addition, the invention may be formed by appropriately combining a plurality of components disclosed in the embodiments described so far. Furthermore, the invention of the present application is shown by the scope of claims, not the scope of the embodiments described so far, and includes all modifications within the meaning and scope equivalent to the scope of claims.
1 コンピュータ、2 CPU、3 主記憶装置、4 補助記憶装置、5 外部記憶装置、6 ネットワーク、7 出力装置、8 入力装置、10 データ設定部、11 データ格納部、12 シナリオ生成部、13 発電計画部、14 モデル作成部、15 省略計算部、16 リスク量計算部、17 結果表示部、20 区分モデル作成部、30 シナリオ抽出部、50 再計算対象決定部、60 収束判定部、70 特徴抽出部。 1 Computer, 2 CPU, 3 Main memory, 4 Auxiliary storage, 5 External storage, 6 Network, 7 Output, 8 Input, 10 Data setting, 11 Data storage, 12 Scenario generator, 13 Power generation plan Unit, 14 Model creation unit, 15 Omission calculation unit, 16 Risk amount calculation unit, 17 Result display unit, 20 Division model creation unit, 30 Scenario extraction unit, 50 Recalculation target determination unit, 60 Convergence judgment unit, 70 Feature extraction unit ..
Claims (7)
前記不確定要因に関する将来予測のシナリオをN個生成するシナリオ生成部と、
前記シナリオに基づく電力の需要及び供給の想定から前記シナリオ毎に前記損益をM個算出する発電計画部と、
該M個の前記シナリオと前記損益との関係を損益モデルにするモデル作成部と、
前記損益モデルに前記発電計画部で算出しなかった(N−M)個の前記シナリオを代入して前記シナリオ毎に前記損益を計算する省略計算部と、
前記発電計画部で算出した前記M個の前記損益と前記省略計算部で計算した前記(N−M)個の前記損益とから前記リスクを計算するリスク量計算部と、
前記リスク量計算部が計算した前記損益の前記リスクを表示する結果表示部とを備えたことを特徴とする電気事業損益分析システム。
但し、N及びMは自然数であり、M<Nの関係にある。 A data setting unit that sets data including uncertainties regarding the risk of profit and loss in the electric power business,
A scenario generator that generates N future prediction scenarios for the uncertain factors,
A power generation planning unit that calculates M profits and losses for each scenario from the assumption of power demand and supply based on the scenario.
A model creation unit that uses the relationship between the M scenarios and the profit and loss as a profit and loss model,
An abbreviated calculation unit that calculates the profit and loss for each scenario by substituting (NM) the scenarios that were not calculated by the power generation planning unit into the profit and loss model.
A risk amount calculation unit that calculates the risk from the M profits and losses calculated by the power generation planning unit and the (NM) profits and losses calculated by the abbreviated calculation unit.
An electric utility profit / loss analysis system including a result display unit for displaying the risk of the profit / loss calculated by the risk amount calculation unit.
However, N and M are natural numbers, and there is a relationship of M <N.
前記不確定要因に関する将来予測のシナリオをN個生成するシナリオ生成部と、
前記シナリオに基づく電力の需要及び供給の想定から前記シナリオ毎に前記損益をM個算出する発電計画部と、
該M個の前記シナリオと前記損益との関係を前記電力の前記需要を発電機の容量で区分した損益モデルにする区分モデル作成部と、
前記損益モデルに前記発電計画部で算出しなかった(N−M)個の前記シナリオを代入して前記シナリオ毎に前記損益を計算する省略計算部と、
前記発電計画部で算出した前記M個の前記損益と前記省略計算部で計算した前記(N−M)個の前記損益とから前記リスクを計算するリスク量計算部と、
前記リスク量計算部が計算した前記損益の前記リスクを表示する結果表示部とを備えたことを特徴とする電気事業損益分析システム。
但し、N及びMは自然数であり、M<Nの関係にある。 A data setting unit that sets data including uncertainties regarding the risk of profit and loss in the electric power business,
A scenario generator that generates N future prediction scenarios for the uncertain factors,
A power generation planning unit that calculates M profits and losses for each scenario from the assumption of power demand and supply based on the scenario.
A division model creation unit that converts the relationship between the M scenarios and the profit / loss into a profit / loss model in which the demand for the electric power is divided by the capacity of the generator.
An abbreviated calculation unit that calculates the profit and loss for each scenario by substituting (NM) the scenarios that were not calculated by the power generation planning unit into the profit and loss model.
A risk amount calculation unit that calculates the risk from the M profits and losses calculated by the power generation planning unit and the (NM) profits and losses calculated by the abbreviated calculation unit.
An electric utility profit / loss analysis system including a result display unit for displaying the risk of the profit / loss calculated by the risk amount calculation unit.
However, N and M are natural numbers, and there is a relationship of M <N.
前記シナリオ生成部で生成した前記N個の前記シナリオから優先順位の高いものから順に前記M個の前記シナリオを抽出するシナリオ抽出部を備え、
前記発電計画部は、前記シナリオ抽出部で抽出された前記M個の前記シナリオを用いることを特徴とする電気事業損益分析システム。 The electric utility profit / loss analysis system according to claim 1 or 2.
It is provided with a scenario extraction unit that extracts the M scenarios in descending order of priority from the N scenarios generated by the scenario generation unit.
The power generation planning unit is an electric power business profit / loss analysis system characterized by using the M scenarios extracted by the scenario extraction unit.
前記損益モデルは、モンテカルロシミュレーションを用いたことを特徴とする電気事業損益分析システム。 The electric utility profit / loss analysis system according to any one of claims 1 to 3.
The profit and loss model is an electric utility profit and loss analysis system characterized by using Monte Carlo simulation.
前記省略計算部から得られた損益の分布から損失側となる所定の前記シナリオを選定する再計算対象決定部を備え、
前記発電計画部は、前記再計算対象決定部で選定した前記シナリオを再計算することを特徴とする電気事業損益分析システム。 The electric utility profit / loss analysis system according to any one of claims 1 to 4.
It is provided with a recalculation target determination unit that selects a predetermined scenario on the loss side from the distribution of profit and loss obtained from the omitted calculation unit.
The power generation planning unit is an electric power business profit / loss analysis system characterized in that the scenario selected by the recalculation target determination unit is recalculated.
前記発電計画部の前記損益が収束しているか否かを判定する収束判定部を備え、
前記発電計画部は、前記収束判定部が収束と判定した場合は計算を終了することを特徴とする電気事業損益分析システム。 The electric utility profit / loss analysis system according to any one of claims 1 to 5.
A convergence test unit for determining whether or not the profit and loss of the power generation planning unit has converged is provided.
The power generation planning unit is an electric power business profit / loss analysis system characterized in that the calculation is completed when the convergence determination unit determines that the convergence is achieved.
前記発電計画部及び前記省略計算部から得られた前記損益から前記シナリオの特徴を抽出する特徴抽出部を備え、
前記シナリオ生成部は、前記特徴抽出部で抽出した特徴を持つシナリオを生成することを特徴とする電気事業損益分析システム。 The electric utility profit / loss analysis system according to any one of claims 1 to 6.
It is provided with a feature extraction unit that extracts the characteristics of the scenario from the profit and loss obtained from the power generation planning unit and the abbreviated calculation unit.
The scenario generation unit is an electric utility profit / loss analysis system characterized by generating a scenario having features extracted by the feature extraction unit.
Applications Claiming Priority (2)
| Application Number | Priority Date | Filing Date | Title |
|---|---|---|---|
| JP2017205088 | 2017-10-24 | ||
| JP2017205088 | 2017-10-24 |
Publications (2)
| Publication Number | Publication Date |
|---|---|
| JP2019079537A JP2019079537A (en) | 2019-05-23 |
| JP6965864B2 true JP6965864B2 (en) | 2021-11-10 |
Family
ID=66627931
Family Applications (1)
| Application Number | Title | Priority Date | Filing Date |
|---|---|---|---|
| JP2018199335A Active JP6965864B2 (en) | 2017-10-24 | 2018-10-23 | Electricity business profit and loss analysis system |
Country Status (1)
| Country | Link |
|---|---|
| JP (1) | JP6965864B2 (en) |
Family Cites Families (4)
| Publication number | Priority date | Publication date | Assignee | Title |
|---|---|---|---|---|
| JP2000293569A (en) * | 1999-04-02 | 2000-10-20 | Rg Asset Management Co Ltd | Portfoilo presentation method, device and system, and storage medium of computer program |
| JP3791503B2 (en) * | 2003-03-12 | 2006-06-28 | 株式会社日立製作所 | Power generation plan / power trading plan creation method, apparatus and program |
| JP2006227952A (en) * | 2005-02-18 | 2006-08-31 | Hitachi Ltd | Service cost variation analyzing method |
| JP4722794B2 (en) * | 2006-08-30 | 2011-07-13 | 東北電力株式会社 | Electricity business profit and loss analysis system |
-
2018
- 2018-10-23 JP JP2018199335A patent/JP6965864B2/en active Active
Also Published As
| Publication number | Publication date |
|---|---|
| JP2019079537A (en) | 2019-05-23 |
Similar Documents
| Publication | Publication Date | Title |
|---|---|---|
| JP6034890B2 (en) | Specification, estimation, causal driver discovery and market response elasticity or lift coefficient automation | |
| Morales et al. | Scenario reduction for futures market trading in electricity markets | |
| JP5248372B2 (en) | Power generation plan creation method, device, program, and storage device | |
| JP5777404B2 (en) | Time series data prediction apparatus, prediction method, prediction program, and storage medium | |
| JP7059960B2 (en) | Power supply and demand planning device and power supply and demand planning method | |
| JP2019082935A (en) | Management device and management method | |
| JP2014124065A (en) | Power demand prediction device and program | |
| JP2018163516A (en) | Transaction planning apparatus and transaction planning method | |
| JP2019087030A (en) | Prediction model generation device, prediction model generation method and prediction model generation program | |
| JP2012010489A (en) | Simultaneous commensurate device, its control method, and its program | |
| CN112801410A (en) | Electricity charge inflow prediction analysis method based on big data technology | |
| CN115564152A (en) | Carbon emission prediction method and device based on STIRPAT model | |
| JP2022090134A (en) | Management device and management method | |
| KR102217886B1 (en) | Exploration System and Method of Optimal Weight of Big Data-based Commodity Investment Recommendation Algorithm Using Artificial Intelligence | |
| JP2005122438A (en) | Prediction method, prediction device, prediction program, and recording medium | |
| Acosta-Ramirez et al. | Application of Lean Manufacturing tools under DMAIC approach to increase the NPS in a real estate company: A Research in Peru | |
| JP2016148945A (en) | Power trading support system, power trading support method and program | |
| JP6965864B2 (en) | Electricity business profit and loss analysis system | |
| JP4812269B2 (en) | Demand fluctuation risk minimum production plan generation method | |
| JP2005135347A (en) | Fuel forward curve estimation method and system using estimated fuel forward curve | |
| JP2016136313A (en) | Optimal transaction volume determination system, optimal transaction volume determination method and program | |
| JP2008289262A (en) | Distribution facility plan creation support system, method and program | |
| CN116011698B (en) | Method, device, computer equipment and storage medium for determining unit combination | |
| JP2016213987A (en) | Electricity retail price menu development device | |
| JP2005004435A (en) | Power generation facility operation support system |
Legal Events
| Date | Code | Title | Description |
|---|---|---|---|
| A80 | Written request to apply exceptions to lack of novelty of invention |
Free format text: JAPANESE INTERMEDIATE CODE: A80 Effective date: 20181031 |
|
| A621 | Written request for application examination |
Free format text: JAPANESE INTERMEDIATE CODE: A621 Effective date: 20201104 |
|
| TRDD | Decision of grant or rejection written | ||
| A977 | Report on retrieval |
Free format text: JAPANESE INTERMEDIATE CODE: A971007 Effective date: 20210917 |
|
| A01 | Written decision to grant a patent or to grant a registration (utility model) |
Free format text: JAPANESE INTERMEDIATE CODE: A01 Effective date: 20210921 |
|
| A61 | First payment of annual fees (during grant procedure) |
Free format text: JAPANESE INTERMEDIATE CODE: A61 Effective date: 20211004 |
|
| R151 | Written notification of patent or utility model registration |
Ref document number: 6965864 Country of ref document: JP Free format text: JAPANESE INTERMEDIATE CODE: R151 |
|
| R250 | Receipt of annual fees |
Free format text: JAPANESE INTERMEDIATE CODE: R250 |
|
| R250 | Receipt of annual fees |
Free format text: JAPANESE INTERMEDIATE CODE: R250 |