JP4922265B2 - Plant monitoring apparatus and plant monitoring method - Google Patents
Plant monitoring apparatus and plant monitoring method Download PDFInfo
- Publication number
- JP4922265B2 JP4922265B2 JP2008211088A JP2008211088A JP4922265B2 JP 4922265 B2 JP4922265 B2 JP 4922265B2 JP 2008211088 A JP2008211088 A JP 2008211088A JP 2008211088 A JP2008211088 A JP 2008211088A JP 4922265 B2 JP4922265 B2 JP 4922265B2
- Authority
- JP
- Japan
- Prior art keywords
- monitoring
- plant
- principal component
- estimated deviation
- data
- Prior art date
- Legal status (The legal status is an assumption and is not a legal conclusion. Google has not performed a legal analysis and makes no representation as to the accuracy of the status listed.)
- Active
Links
Images


Landscapes
- Testing Or Calibration Of Command Recording Devices (AREA)
- Testing And Monitoring For Control Systems (AREA)
Description
本発明は、プラントの運転状態の変化を監視する監視装置および監視方法に係り、特に、種々の異常に対する汎用性をより高めたプラント監視装置およびプラント監視方法に関する。 The present invention relates to a monitoring apparatus and a monitoring method for monitoring changes in the operating state of a plant, and more particularly, to a plant monitoring apparatus and a plant monitoring method with higher versatility for various abnormalities.
原子力発電プラントあるいは火力発電プラント等の大規模プラントにおいては、多数のプラント信号を計算機に取り込み、監視画面にプラントデータを表示して監視することが行われている。プラント信号の数は数千点に及ぶため、全てのプラントデータを運転員が常時監視するのは困難であることから、主要なプラントデータについては予め設定された管理しきい値との比較による監視が計算機により行われている。タービンからの抽気蒸気で給水を加熱する原子力あるいは火力発電プラントの給・復水系の例を引くまでも無く、大規模プラントのプラント信号は相互に密接な関係をもって変化するため、運転員は関連するプラントデータのトレンドを表示して監視する他、相関図等を確認しながら監視を行っている。プラントに異常が発生し、プラント信号のレベルが管理しきい値を超えた場合には、警報が発報されて運転員による対応がとられるようになっている。 In a large-scale plant such as a nuclear power plant or a thermal power plant, a large number of plant signals are taken into a computer and plant data is displayed on a monitoring screen for monitoring. Since there are thousands of plant signals, it is difficult for operators to constantly monitor all plant data. Therefore, monitoring of main plant data by comparison with preset control thresholds Is done by the computer. Operators are relevant because the plant signals of large plants change in close relation to each other, not to mention examples of feed and condensate systems in nuclear or thermal power plants that heat feed water with steam extracted from turbines. In addition to displaying and monitoring plant data trends, monitoring is performed while checking correlation diagrams and the like. When an abnormality occurs in the plant and the level of the plant signal exceeds the management threshold value, an alarm is issued and an operator can take action.
しかしながら、異常の初期段階に現れる兆候を、多数のプラントデータの中から早期に検知し、運転条件の変化の影響と識別して異常と認識することは、運転員にとって非常に困難な作業となる。発電プラントのような大規模プラントではなく、複数の設備の運転状態を遠隔で集中監視する場合等においても、多数の信号のデータを少数の要員で監視する困難は同様である。 However, it is a very difficult task for operators to detect signs that appear in the initial stage of abnormalities from a large number of plant data at an early stage and identify them as abnormal due to the effects of changes in operating conditions. . Even when a large-scale plant such as a power plant is used, and the operation state of a plurality of facilities is remotely monitored centrally, the difficulty of monitoring data of a large number of signals with a small number of personnel is the same.
このため、多数のプラントデータに対して統計的プロセス管理技術の分野で一般的に用いられる主成分分析を適用して、元のプラントデータの特徴を捉えた少数の統計量データに変換し、変換後の統計量データの時間トレンドあるいは統計量データ同士の相関特性に管理しきい値を設けて監視する技術が考案されている(例えば特許文献1〜3参照)。
For this reason, principal component analysis generally used in the field of statistical process management technology is applied to a large number of plant data to convert it into a small number of statistical data that captures the characteristics of the original plant data. A technique has been devised in which a management threshold value is provided for monitoring a temporal trend of statistical data later or correlation characteristics between statistical data (see, for example,
また、前記変換された少数の統計量データの相関特性のパターンを正常時のパターンと比較することにより監視する技術が考案されている(特許文献4,5参照)。
Further, a technique has been devised for monitoring by comparing a pattern of correlation characteristics of a small number of converted statistic data with a normal pattern (see
さらに、前記変換された少数の統計量データにウェーブレット変換を適用した結果に管理しきい値を設けて監視する技術が考案されている(特許文献6参照)。 Furthermore, a technique has been devised in which a management threshold is provided for monitoring the result of applying wavelet transform to the small number of converted statistical data (see Patent Document 6).
これとは別に、監視対象データと、プラントデータ間の関係を表わすモデルを用いて推定した当該データの推定値との偏差に対して主成分分析を適用し、得られた統計量データに監視しきい値を設けて監視する技術も考案されている(特許文献7参照)。あるいは、モデルによる推定偏差に対して統計的プロセス管理で行われている種々の管理チャートを作成し、これに管理しきい値を設けて監視する方法も考案されている(特許文献8参照)。
上述の従来の主成分分析により変換された統計量データに直接管理しきい値を設定して監視する技術のうち、特許文献1に記載の技術においては、相互に関連した3つのプロセス状態量の変化から外乱の影響を判定するために、主成分分析を行って得られる3次元主成分空間を特定の主成分方向からの視点に回転させたデータに対して最小二乗法による近似曲線を作成し、その曲線からの距離を許容範囲と比較することで異常を判定しているが、特定の主成分方向から見た2次元平面において、1つの状態量の影響を除去あるいは強調することが可能か否かは全て対象プロセスの特性に依存しており、広く一般のプロセスに適用できるものではないという問題があった。
Among the techniques for setting and monitoring the management threshold value directly on the statistical data converted by the above-described conventional principal component analysis, the technique described in
また、特許文献2に記載の技術は、後述する特許文献7においても指摘されているように、プラントの運転条件が変更された場合に、異常ではない状態を異常として検出する問題があった。そして、特許文献3に記載された技術においては、主成分分析により変換した統計量データのうち、Q統計量のみを用いて監視を行っているが、プラントに生じる可能性のある種々の異常の中には、Q統計量では検知されず、主成分得点あるいはT2統計量にのみ影響が現われるものがあることを考えると、汎用性に欠けるという問題があった。
In addition, the technique described in
一方、前記主成分分析によって変換された少数の統計量データの相関特性のパターンを正常時のパターンと比較することにより監視する技術のうち特許文献4に記載された方法では累積寄与率が規定値の範囲内となる主成分を選択し、これらをパラメータとする直交座標系上で算出した被判定データと履歴データとの距離がしきい値を超える場合に異常と判定しているが、この方法では正常な状態から徐々に異常が進展するような状態を把握することができず、また一過性のノイズの影響等を受けやすいという問題があった。
On the other hand, among the techniques for monitoring by comparing the pattern of correlation characteristics of a small number of statistical data converted by the principal component analysis with a normal pattern, the cumulative contribution ratio is a specified value in the method described in
また、特許文献5に記載された技術では、前記特許文献3の場合とは逆に主成分得点のみを用いているため、汎用性に欠ける問題があった。
Further, the technique described in
主成分分析によって変換された少数の統計量データにウェーブレット変換を適用した結果に管理しきい値を設けて監視する特許文献6、7に記載の技術は何れも、前記特許文献2と同様にプラント運転条件の変化の影響を異常と判定する可能性が高いという問題があった。
The techniques described in Patent Documents 6 and 7 that monitor the result of applying the wavelet transform to a small number of statistical data converted by principal component analysis are managed in the same manner as in
また、特許文献6に記載の技術ではT2統計量あるいはQ統計量のウェーブレット変換に管理しきい値を設けて、T2統計量あるいはQ統計量そのもの、あるいはそれらの寄与量に対して管理しきい値を設けているが、T2統計量とQ統計量は何れも二乗量であることから、仮に管理しきい値設定に用いるデータに含まれる異常データの割合が既知であったとしても、設定された管理しきい値のデータ依存性が高くなる問題があった。 In the technique described in Patent Document 6, a management threshold is provided for the wavelet transform of the T 2 statistic or Q statistic to manage the T 2 statistic or the Q statistic itself or their contribution. Although thresholds are provided, since both the T 2 statistic and the Q statistic are square quantities, even if the ratio of abnormal data included in the data used for setting the management threshold is known, There was a problem that the data dependency of the set management threshold became high.
以上の従来技術で指摘されたプラント運転条件の変化の影響を受ける問題に対して、特許文献7に記載の技術では複数のプロセスデータを運転条件の変更を直接的に表わす外部変数とそれ以外の主変数に分け、外部変数の主変数への影響を最小二乗法で得た偏回帰係数により推定除去し、得られた推定偏差に対して主成分分析を適用してT2統計量あるいはQ統計量に変換し監視する方法が開示されている。しかしながら、この方法では変換後の統計量に対する監視しきい値は統計量の分布特性を考慮することなく、例えば参照データの99%が含まれる値(換言すると参照データの1%が超える値)、というように試行錯誤的に決定していた。管理しきい値をこのように決定する方法は、例えば参照データに一瞬でも大きいノイズが入ると、参照データの1%が超える値(管理しきい値と設定する値)が高い値となり、管理しきい値が高くなる、といったように、前記特許文献6の場合と同様に検出性能のデータ依存性が大きいという問題あった。 In contrast to the problem affected by changes in the plant operating conditions pointed out in the prior art described above, the technique described in Patent Document 7 uses a plurality of process data as external variables that directly represent changes in operating conditions and other variables. divided into main variable, estimated removed by partial regression coefficient of influence of the main variables were obtained by least squares method of external variables, by applying the principal component analysis on the resulting estimated differential T 2 statistic or Q statistic A method of converting to a quantity and monitoring is disclosed. However, in this method, the monitoring threshold for the converted statistic does not consider the distribution characteristics of the statistic, for example, a value including 99% of the reference data (in other words, a value exceeding 1% of the reference data), It was determined by trial and error. The management threshold value is determined in this way. For example, if a large amount of noise enters the reference data even for a moment, the value exceeding 1% of the reference data (the value set as the management threshold value) becomes a high value. As in the case of Patent Document 6, there is a problem that the data dependence of the detection performance is large, such that the threshold value becomes high.
特許文献8には主成分分析を用いない技術として、プロセス変数の観測値、またはARIMA(Autoregressive Integrated Moving Average)モデルによる推定偏差に対して従来の統計的プロセス管理で行われている形式の制御チャート、例えば平均値、標準偏差、等のチャートを作成して、これを通常時に設定した管理しきい値と比較することにより監視を行う方法が開示されている。しかしながら、制御チャートの管理しきい値の設定は試行錯誤的であり、検出性能のデータ依存性が大きいという問題があった。また、例えば測定器の不具合によりプラントデータにドリフトを生じた場合にも、ARIMAモデルの自己回帰項の効果によって推定偏差にはその影響が現われず、従って種々の異常に対して汎用性のあるモデルとはなっていない問題があった。 As a technique that does not use principal component analysis, Patent Document 8 discloses a control chart in a format that is used in the conventional statistical process management with respect to an observation value of a process variable or an estimated deviation based on an ARIMA (Autogressive Integrated Moving Average) model. For example, a method is disclosed in which monitoring is performed by creating a chart of average values, standard deviations, etc., and comparing the chart with a management threshold value set in a normal state. However, the setting of the control threshold value of the control chart is a trial and error, and there is a problem that the data dependence of the detection performance is large. In addition, for example, when the plant data drifts due to a malfunction of the measuring instrument, the estimated deviation is not affected by the effect of the autoregressive term of the ARIMA model, so that the model is versatile for various abnormalities. There was a problem that was not.
本発明はかかる従来の事情に対処してなされたものであり、プラントの運転状態が変化した場合にもそれが正常な変化であれば異常と判定することが無く、また監視指標に対する管理しきい値の設定に用いた参照データへの監視性能の依存性が少なく、さらにプラント特性の異常から測定器のドリフトまで種々の異常に対して適用可能な汎用性の高いプラント監視装置を提供することを目的とする。 The present invention has been made in response to such a conventional situation, and even when the operation state of the plant is changed, if it is a normal change, it is not determined to be abnormal, and the management threshold for the monitoring index is not limited. To provide a highly versatile plant monitoring device that is less dependent on the monitoring performance to the reference data used to set the value, and that can be applied to various abnormalities from abnormal plant characteristics to drift in measuring instruments. Objective.
本発明に係るプラント監視装置は、プラントの入力変数および出力変数の測定データを入力し時系列データとして保存するプラントデータ入力・保存手段と、前記プラントデータ入力・保存手段で保存された時系列データに基づいて監視モデルを作成する監視モデル作成手段と、前記監視モデルを前記測定データに適用してプラント状態の正常/異常を判定し、当該判定結果を出力する監視処理手段と、を備えたプラント監視装置であって、前記監視モデル作成手段は、前記時系列データを用いて出力誤差モデルを同定する出力誤差モデル同定部と、前記出力誤差モデルを前記時系列データに適用して算出した前記出力変数の推定偏差の統計的特性を評価する推定偏差特性評価部と、を具備し、前記監視処理手段は、前記測定データに前記出力誤差モデルを適用して前記出力変数の推定偏差を算出する出力推定偏差算出部と、前記推定偏差に逐次確率比検定を適用して前記推定偏差の分散値変化仮説を検定する推定偏差検定処理部と、前記推定偏差の分散値変化仮説の採択率に基づいてプラントの異常を監視する仮説採択率判定部と、を具備することを特徴とする。 A plant monitoring apparatus according to the present invention includes plant data input / storage means for inputting measurement data of input variables and output variables of a plant and storing them as time series data, and time series data stored by the plant data input / storage means. A monitoring model generating means for generating a monitoring model based on the monitoring data, and a monitoring processing means for applying the monitoring model to the measurement data to determine normality / abnormality of the plant state and outputting the determination result In the monitoring apparatus, the monitoring model creating means includes an output error model identifying unit that identifies an output error model using the time series data, and the output calculated by applying the output error model to the time series data. An estimated deviation characteristic evaluation unit that evaluates a statistical characteristic of the estimated deviation of the variable, and the monitoring processing means outputs the output to the measurement data. An output estimated deviation calculation unit that calculates an estimated deviation of the output variable by applying an error model, and an estimated deviation test processing unit that tests a variance value change hypothesis of the estimated deviation by applying a sequential probability ratio test to the estimated deviation And a hypothesis adoption rate determination unit that monitors plant abnormality based on the adoption rate of the estimated deviation variance change hypothesis.
また、本発明に係るプラント監視装置は、プラントの入力変数および出力変数の測定データを入力し時系列データとして保存するプラントデータ入力・保存手段と、前記プラントデータ入力・保存手段で保存された時系列データに基づいて監視モデルを作成する監視モデル作成手段と、前記監視モデルを前記測定データに適用してプラント状態の正常/異常を判定し、当該判定結果を出力する監視処理手段と、を備えたプラント監視装置であって、前記監視モデル作成手段は前記時系列データに主成分分析を適用して寄与率の大きな複数の主成分に対する負荷行列を構成する主成分分析部と、前記負荷行列を前記時系列データに適用して算出した推定偏差の統計的特性を評価する推定偏差特性評価部と、を具備し、前記監視処理手段は、前記測定データに前記負荷行列を適用して推定偏差を算出する出力推定偏差部と、前記推定偏差に逐次確率比検定を適用して前記推定偏差の分散値変化仮説を検定する推定偏差検定処理部と、前記推定偏差の分散値変化仮説の採択率に基づいてプラントの異常を監視する仮説採択率判定部と、を具備することを特徴とする。 Further, the plant monitoring apparatus according to the present invention includes plant data input / storage means for inputting measurement data of plant input variables and output variables and storing them as time-series data, and when the data is stored by the plant data input / storage means Monitoring model creating means for creating a monitoring model based on series data; and monitoring processing means for applying the monitoring model to the measurement data to determine normality / abnormality of the plant state and outputting the determination result. The monitoring model creating means is configured to apply a principal component analysis to the time series data to construct a load matrix for a plurality of principal components having a large contribution rate, and to calculate the load matrix. An estimated deviation characteristic evaluation unit that evaluates a statistical characteristic of the estimated deviation calculated by applying to the time series data, and the monitoring processing means includes the An output estimated deviation unit that calculates an estimated deviation by applying the load matrix to constant data; an estimated deviation test processing unit that tests a variance value change hypothesis of the estimated deviation by applying a sequential probability ratio test to the estimated deviation; And a hypothesis adoption rate determination unit that monitors plant abnormality based on the adoption rate of the estimated deviation variance change hypothesis.
また、本発明に係るプラント監視装置は、プラントの入力変数および出力変数の測定データを入力し時系列データとして保存するプラントデータ入力・保存手段と、前記プラントデータ入力・保存手段で保存された時系列データに基づいて監視モデルを作成する監視モデル作成手段と、前記監視モデルを前記測定データに適用してプラント状態の正常/異常を判定し、当該判定結果を出力する監視処理手段と、を備えたプラント監視装置であって、前記監視モデル作成手段は前記時系列データに主成分分析を適用して寄与率の小さな複数の主成分に対する負荷行列を構成する主成分分析部と、前記負荷行列を前記時系列データに適用して算出した主成分得点の統計的特性を評価する主成分得点特性評価部と、を具備し、前記監視処理手段は、前記測定データに前記負荷行列を適用して主成分得点を算出する主成分得点算出部と、前記主成分得点に逐次確率比検定を適用して前記主成分得点の分散値変化仮説を検定する主成分得点検定処理部と、前記主成分得点の分散値変化仮説の採択率に基づいてプラントの異常を監視する仮説採択率判定部と、を具備することを特徴とする。 Further, the plant monitoring apparatus according to the present invention includes plant data input / storage means for inputting measurement data of plant input variables and output variables and storing them as time-series data, and when the data is stored by the plant data input / storage means Monitoring model creating means for creating a monitoring model based on series data; and monitoring processing means for applying the monitoring model to the measurement data to determine normality / abnormality of the plant state and outputting the determination result. The monitoring model creating means is configured to apply a principal component analysis to the time series data to construct a load matrix for a plurality of principal components having a small contribution rate; and the load matrix A principal component score characteristic evaluation unit that evaluates a statistical characteristic of the principal component score calculated by applying to the time series data, the monitoring processing means, A principal component score calculation unit that calculates the principal component score by applying the load matrix to the measured data, and a principal value test for the variance value change hypothesis of the principal component score by applying a sequential probability ratio test to the principal component score A component score test processing unit; and a hypothesis adoption rate determination unit that monitors plant abnormality based on the adoption rate of the variance change hypothesis of the principal component score.
また、本発明に係るプラント監視装置は、プラントの入力変数および出力変数の測定データを入力し時系列データとして保存するプラントデータ入力・保存手段と、前記プラントデータ入力・保存手段で保存された時系列データに基づいて監視モデルを作成する監視モデル作成手段と、前記監視モデルを前記測定データに適用してプラント状態の正常/異常を判定し、当該判定結果を出力する監視処理手段と、を備えたプラント監視装置であって、前記監視モデル作成手段は前記時系列データに主成分分析を適用して寄与率の大きな複数の主成分に対する第1の負荷行列を構成する第1の主成分分析部と、前記主成分分析の結果から寄与率の小さな複数の主成分に対する第2の負荷行列を構成する第2の主成分分析部と、前記第1の負荷行列を前記時系列データに適用して算出した推定偏差の統計的特性を評価する推定偏差特性評価部と、前記第2の負荷行列を前記時系列データに適用して算出した主成分得点の統計的特性を評価する主成分得点特性評価部と、を具備し、前記監視処理手段は前記測定データに前記第1の負荷行列を適用して推定偏差を算出する推定偏差算出部と、前記測定データに前記第2の負荷行列を適用して主成分得点を算出する主成分得点算出部と、前記推定偏差に逐次確率比検定を適用して前記推定偏差の分散値変化仮説を検定する推定偏差検定処理部と、前記主成分得点に逐次確率比検定を適用して前記主成分得点の分散値変化仮説を検定する主成分得点検定処理部と、前記推定偏差の分散値変化仮説の採択率および主成分得点の分散値変化仮説の採択率に基づいてプラントの異常を監視する仮説採択率判定部と、を具備することを特徴とする。 Further, the plant monitoring apparatus according to the present invention includes plant data input / storage means for inputting measurement data of plant input variables and output variables and storing them as time-series data, and when the data is stored by the plant data input / storage means Monitoring model creating means for creating a monitoring model based on series data; and monitoring processing means for applying the monitoring model to the measurement data to determine normality / abnormality of the plant state and outputting the determination result. A first principal component analyzer configured to apply a principal component analysis to the time-series data to form a first load matrix for a plurality of principal components having a large contribution ratio. A second principal component analysis unit constituting a second load matrix for a plurality of principal components having a small contribution rate from the result of the principal component analysis, and the first load matrix An estimated deviation characteristic evaluation unit that evaluates a statistical characteristic of an estimated deviation calculated by applying to the time series data, and a statistical characteristic of a principal component score calculated by applying the second load matrix to the time series data A principal component score characteristic evaluation unit that evaluates the estimated deviation calculation unit that calculates an estimated deviation by applying the first load matrix to the measurement data; and A principal component score calculation unit that calculates a principal component score by applying a second load matrix; and an estimated deviation test processing unit that tests a variance value change hypothesis of the estimated deviation by applying a sequential probability ratio test to the estimated deviation A principal component score test processing unit that applies a sequential probability ratio test to the principal component score to test the variance value change hypothesis of the principal component score, and the adoption rate and principal component score of the variance deviation hypothesis of the estimated deviation Adoption of the variance change hypothesis Characterized in that it comprises a a hypothesis adoption rate determination unit for monitoring the abnormality of the plant based on.
また、本発明に係るプラント監視方法は、プラントの入力変数および出力変数の測定データを入力し時系列データとして保存するプラントデータ入力保存ステップと、前記プラントデータ入力保存ステップで保存された時系列データに基づいて監視モデルを作成する監視モデル作成ステップと、前記監視モデルを前記測定データに適用してプラント状態の正常/異常を判定し、当該判定結果を出力する監視処理ステップと、を備えるプラント監視方法であって、記監視モデル作成ステップは、前記時系列データを用いて出力誤差モデルを同定する出力誤差モデル同定ステップと、前記出力誤差モデルを前記時系列データに適用して算出した前記出力変数の推定偏差の統計的特性を評価する推定偏差特性評価ステップと、を具備し、前記出力監視処理ステップは、前記測定データに前記出力誤差モデルを適用して前記出力変数の推定偏差を算出する出力推定偏差算出ステップと、前記推定偏差に逐次確率比検定を適用して前記推定偏差の分散値変化仮説を検定する推定偏差検定処理ステップと、前記分散値変化仮説の採択率に基づいてプラントの異常を監視する仮説採択率判定ステップと、を具備することを特徴とする。 Further, the plant monitoring method according to the present invention includes a plant data input storage step for inputting measurement data of input variables and output variables of a plant and storing them as time series data, and time series data stored in the plant data input storage step. A monitoring model creating step for creating a monitoring model based on the above, and a monitoring processing step for applying the monitoring model to the measurement data to determine normality / abnormality of the plant state and outputting the determination result The monitoring model creation step includes an output error model identification step for identifying an output error model using the time series data, and the output variable calculated by applying the output error model to the time series data. An estimated deviation characteristic evaluation step for evaluating a statistical characteristic of the estimated deviation of the output deviation, The processing step includes an output estimated deviation calculating step of calculating the estimated deviation of the output variable by applying the output error model to the measurement data, and a variance value of the estimated deviation by applying a sequential probability ratio test to the estimated deviation. It comprises an estimated deviation test processing step for testing a change hypothesis, and a hypothesis adoption rate determination step for monitoring a plant abnormality based on the adoption rate of the variance change hypothesis.
また、本発明に係るプラント監視方法は、プラントの入力変数および出力変数の測定データを入力し時系列データとして保存するプラントデータ入力保存ステップと、前記プラントデータ入力保存ステップで保存された時系列データに基づいて監視モデルを作成する監視モデル作成ステップと、前記監視モデルを前記測定データに適用してプラント状態の正常/異常を判定し、当該判定結果を出力する監視処理ステップと、を備えるプラント監視方法であって、前記監視モデル作成ステップは前記時系列データに主成分分析を適用して寄与率の大きな複数の主成分に対する第1の負荷行列を構成する第1の主成分分析ステップと、前記第1の負荷行列を前記時系列データに適用して算出した推定偏差の統計的特性を評価する推定偏差特性評価ステップと、を具備し、前記出力監視処理ステップは、前記測定データに前記負荷行列を適用して推定偏差を算出する出力推定偏差ステップと、前記推定偏差に逐次確率比検定を適用して前記推定偏差の分散値変化仮説を検定する推定偏差検定処理ステップと、前記推定偏差の分散値変化仮説の採択率に基づいてプラントの異常を監視する第1の仮説採択率判定ステップと、を具備することを特徴とする。 Further, the plant monitoring method according to the present invention includes a plant data input storage step for inputting measurement data of input variables and output variables of a plant and storing them as time series data, and time series data stored in the plant data input storage step. A monitoring model creating step for creating a monitoring model based on the above, and a monitoring processing step for applying the monitoring model to the measurement data to determine normality / abnormality of the plant state and outputting the determination result In the method, the monitoring model creation step includes applying a principal component analysis to the time series data to form a first load matrix for a plurality of principal components having a large contribution rate; Estimated deviation characteristic evaluation for evaluating a statistical characteristic of the estimated deviation calculated by applying the first load matrix to the time series data The output monitoring processing step includes an output estimated deviation step for calculating an estimated deviation by applying the load matrix to the measurement data, and a sequential probability ratio test is applied to the estimated deviation. An estimated deviation test processing step for testing a variance variation change hypothesis of the deviation, and a first hypothesis adoption rate determination step for monitoring a plant abnormality based on the adoption rate of the variance variation hypothesis of the estimated deviation. It is characterized by.
本発明に係るプラント監視装置およびプラント監視方法によれば、プラントの運転条件の変化に起因してプラントの状態が変化した場合であっても、それが正常な変化であれば、異常と判定することが無い。すなわち、プラントの運転条件の変更に伴うプラント状態の変化を考慮した上でプラントの状態が正常か異常かを正しく判断して監視を行うことができる。 According to the plant monitoring apparatus and the plant monitoring method according to the present invention, even if the state of the plant is changed due to a change in the operating condition of the plant, it is determined as abnormal if it is a normal change. There is nothing. That is, monitoring can be performed by correctly determining whether the state of the plant is normal or abnormal in consideration of changes in the plant state accompanying changes in the operating conditions of the plant.
また、監視指標に対する管理しきい値の設定の際には、統計的特性を考慮して設定しているため、参照データへの監視性能の依存性が少なくなり、監視結果の信頼性をより高まめることができる。 In addition, when setting management thresholds for monitoring indicators, they are set in consideration of statistical characteristics, so the dependency of the monitoring performance on the reference data is reduced, and the reliability of the monitoring results is improved. Can be blistered.
さらに、プラント特性の異常から測定器のドリフトまで種々の異常に対して適用することが可能となるので、従来のプラント監視装置およびプラント監視方法よりも、さらに汎用性を高めたプラント監視装置およびプラント監視方法を提供することができる。 Furthermore, since it can be applied to various abnormalities from abnormality of plant characteristics to drift of measuring instruments, a plant monitoring apparatus and a plant with higher versatility than the conventional plant monitoring apparatus and plant monitoring method. A monitoring method can be provided.
以下、本発明に係るプラント監視装置およびプラント監視方法について、図面を参照して説明する。 Hereinafter, a plant monitoring device and a plant monitoring method according to the present invention will be described with reference to the drawings.
図1は、本発明に係るプラント監視装置の一例であるプラント監視装置1の基本構成を示した概略図である。
FIG. 1 is a schematic diagram showing a basic configuration of a
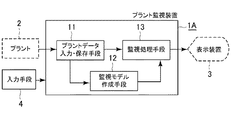
図1に示されるプラント監視装置1は、監視対象となるプラント2からプラントの運転条件の変化の入力となる変数とその影響を受けて変化する出力変数の測定信号を入力し保存するプラントデータ入力・保存手段11と、監視実行に先立って監視モデルを作成する監視モデル作成手段12と、監視実行開始後にプラントデータ入力・保存手段11によって入力された入力変数データ及び出力変数データに監視モデル作成手段12で作成された監視モデルを適用して得られる出力変数データの推定偏差の統計的特性の変化を監視することにより異常を検出し、処理結果を外部へ出力する監視処理手段13とを具備して構成される。
A
また、プラント監視装置1は、ユーザの要求をプラントデータ入力・保存手段11、監視モデル作成手段12および監視処理手段13に与える入力手段4を具備しており、例えば後述する図4に示される参照データの設定(ステップS1)等の処理要求や設定範囲の情報等の処理実行に必要な情報を、当該処理実行手段に与える際に使用される。入力手段4は、例えばタッチスクリーンやマウスとキーボード等で構成する。
Further, the
プラントデータ入力・保存手段11は、監視対象となるプラントからプラントの運転条件の変化の入力となる変数とその影響を受けて変化する出力変数の測定信号をプラント監視装置1に入力する機能と、入力機能を用いて取り込んだ信号を測定結果として保存する機能とを有する。プラントデータ入力・保存手段11では、監視対象となるプラントからプラントの運転条件の変化の入力となる変数とその影響を受けて変化する出力変数の測定信号が連続的又は所定の周期毎に入力され、各変数の測定結果(時系列データ)は履歴データとして保存される。以降、入力変数と出力変数の双方を指す場合は入出力変数と記述する。
The plant data input / storage means 11 has a function of inputting, to the
監視モデル作成手段12は、プラント2の監視を実行する際に必要となる監視モデルを作成する機能および作成した監視モデルを保存する機能を有する。監視モデル作成手段12では、プラントデータ入力・保存手段11によって入力された入出力の変数の履歴データ(時系列データ)を使ってプラント2の監視実行に必要な監視モデルが作成され、保存される。上記監視モデル作成機能には、監視モデル作成時に入力手段4を介して必要なユーザ要求を受け付ける機能および当該ユーザ要求に従い監視モデルの作成に必要な処理を実行する機能も含まれる。
The monitoring model creating means 12 has a function of creating a monitoring model necessary for executing monitoring of the
監視処理手段13は、監視実行開始後にプラントデータ入力・保存手段11によって入力された入出力変数データについて監視モデル作成手段12に保存された監視モデルを適用して得られる出力変数データの推定偏差の統計的特性の変化を監視することによって、正常の範囲を脱した状態、すなわち、異常状態を検出する機能と、入力手段4を介して監視処理実行に必要な情報を受け付ける機能と、当該入力情報に従って処理を実行する機能を有する。監視処理手段13では、監視実行開始後にプラントデータ入力・保存手段11によって入力された入出力変数データに監視モデル作成手段12に保存された監視モデルを適用して、プラント2の異常の有無が検出される。
The
プラント2の異常の有無の検出結果(監視処理結果)は、監視処理手段13からプラント監視装置1と接続された外部装置の一例である表示装置3へ送られ、表示装置3の表示部に表示される。ユーザは表示装置3の表示部に表示された監視処理結果を見ることでプラント2の異常の有無を視認することができる。
The detection result (monitoring processing result) of whether there is an abnormality in the
次に、本発明の各実施の形態に係るプラント監視装置1A〜1Fについて説明する。以下に説明するプラント監視装置1A〜1Fは、図1に示される監視モデル作成手段12および監視処理手段13の少なくとも何れかに特徴があり、それぞれのプラント監視装置1A〜1Fにおいて監視モデル作成手段12および監視処理手段13の少なくとも何れかが相違するが、その他の構成要素については各実施形態で共通である。そこで、以下の各実施の形態に係るプラント監視装置1A〜1Fおよびプラント監視方法の説明では、監視モデル作成手段12および監視処理手段13を中心に説明し、その他の構成要素については、適宜説明を簡略又は省略する。
Next, the
[第1の実施の形態]
本発明の第1の実施の形態に係るプラント監視装置1Aの構成は、図1において、プラント監視装置1、監視モデル作成手段12および監視処理手段13を、それぞれ、プラント監視装置1A、監視モデル作成手段12Aおよび監視処理手段13Aと読み替えた構成である。すなわち、プラント監視装置1Aは、プラントデータ入力・保存手段11、監視モデル作成手段12Aおよび監視処理手段13Aを具備する。
[First Embodiment]
The configuration of the
図2は、本発明の第1の実施の形態に係るプラント監視装置1Aが具備する監視モデル作成手段12Aの構成を示した概略図である。
FIG. 2 is a schematic diagram showing the configuration of the monitoring
図2に示されるように、監視モデル作成手段12Aは、プラント2の監視を実行する際に必要となる出力誤差モデル(Output error model)を同定する出力誤差モデル同定部21と、同定された出力誤差モデルにより生成される推定偏差の統計的特性を評価する第1の推定偏差特性評価部22とを備える。
As shown in FIG. 2, the monitoring
図3は、プラント監視装置1Aに具備される監視処理手段13Aの構成を示した概略図である。
FIG. 3 is a schematic diagram showing the configuration of the monitoring processing means 13A provided in the
図3に示されるように、監視処理手段13Aは、入出力変数データに前記監視モデル作成手段12Aで作成された監視モデルを適用して出力変数の推定偏差を算出する出力推定偏差算出部(以下、「第1の出力推定偏差算出部」と称する)25と、第1の出力推定偏差算出部25が算出した推定偏差に対して逐次確率比検定を適用して推定偏差の分散値が変化したか否かの仮説を検定する推定偏差検定処理部(以下、「第1の推定偏差検定処理部」と称する)26と、逐次確率比検定の結果の分散変化仮説の採択率を算定し、採択率が管理しきい値を超えたことにより異常を検出する仮説採択率判定部27とを備える。
As shown in FIG. 3, the
プラント監視装置1Aが実行する処理内容について概説すると、まず、プラントデータ入力・保存手段11は、監視対象となるプラント2の入力変数および出力変数の測定信号を取り込んで保存する(プラントデータ入力・保存ステップ)。ここで、プラントデータ入力・保存ステップにおいて、プラントデータ入力・保存手段11に保存される測定結果の時系列データが履歴データである。
The processing contents executed by the
プラントデータ入力・保存ステップに続いて、監視モデル作成手段12Aは、プラントデータ入力・保存手段11に保存される履歴データを使ってプラント2の監視実行に必要な監視モデルを作成し保存する(監視モデル作成・保存ステップ)。
Following the plant data input / storing step, the monitoring
監視モデル作成・保存ステップの後、監視処理手段13Aは、プラントデータ入力・保存手段11によって入力された入出力変数データに監視モデル作成手段12Aに保存された監視モデルを適用してプラント2の異常の検出を試みる(監視処理ステップ)。監視処理手段13Aがプラント2の異常の有無の検出を行った結果は、監視処理手段13Aから表示装置3へ送られ(監視処理結果出力ステップ)、表示装置3の表示部に表示される(監視処理結果表示ステップ)。
After the monitoring model creating / storing step, the
次に、監視モデル作成手段12Aで実行される処理内容(監視モデル作成・保存ステップ)および監視処理手段13Aで実行される処理内容(監視処理ステップ)について、より詳細に説明する。
Next, the processing content (monitoring model creation / storing step) executed by the monitoring
図4は、監視モデル作成手段12Aで実行される処理内容(監視モデル作成・保存ステップ)を示した処理フロー図である。 FIG. 4 is a process flow diagram showing the processing contents (monitoring model creation / storing step) executed by the monitoring model creation means 12A.
図4に示されるように、監視モデル作成・保存ステップは、参照データを設定するステップ(ステップS1)と、出力誤差モデルを同定するステップ(ステップS2)と、ステップS2で同定された出力誤差モデルによる推定偏差の特性評価を行うステップ(ステップS3)とを有する。 As shown in FIG. 4, the monitoring model creation / storing step includes a step of setting reference data (step S1), a step of identifying an output error model (step S2), and an output error model identified in step S2. (Step S3).
監視モデル作成・保存ステップ開始直後のステップS1では、例えばプラント2の設計情報や入力変数と出力変数の因果関係等のプラント2の動的および静的特性に関する事前知識を基に、履歴データのうちでプラントの運転条件の変化を直接的に表わす入力変数uと、その影響を受けて変化するプラントの出力変数zを定義し、これらの集合を参照データとして設定するとともに、参照データを出力誤差モデル同定部21において使用するモデル作成用データと、第1の推定偏差特性評価部22において使用する特性評価用データに分割する。参照データの設定は、ユーザが入力手段4から入力して設定することによって行われ、当該参照データの設定情報は、入力手段4から出力誤差モデル同定部21および第1の推定偏差特性評価部22に与えられる。
In step S1 immediately after the start of the monitoring model creation / storing step, for example, based on prior knowledge about the
ステップS1に続いて、ステップS2では、出力誤差モデル同定部21が、モデル作成用データを用いて、以下の式(1)で定義される出力誤差モデルを同定する。

式(1)において、B(q)は以下の式(2)で定義される伝達関数、e(k)は白色雑音、kは時刻tkを表わす。 In equation (1), B (q) is a transfer function defined by the following equation (2), e (k) is white noise, and k is time t k .
式(2)において、q−1はq−1u(k)≡u(k−1)のように定義される時間シフトオペレータである。このとき、次数nbと遅れndを変えてモデルのパラメータを求めた中から、以下の式(3)で計算した最終予測誤差(FPE: Final prediction error)を最小とする次数と遅れ、およびパラメータの組を使用する。 In equation (2), q −1 is a time shift operator defined as q −1 u (k) ≡u (k−1). At this time, the order n b and delay n d from which to determine the parameters of the model by changing the following formula (3) with the calculated final prediction error (FPE: Final prediction error) the orders and delays to minimize, and Use a set of parameters.
上記式(3)において、Nはモデルの作成に用いた参照データの点数であり、Vは前記次数nbと遅れndとパラメータ[b1,・・・,bnb]を与えて計算した推定誤差の分散を表わす。 In the above formula (3), N is the number of the reference data used to create the model, V is calculated to give the degree n b and delay n d and the parameter [b 1, ···, b nb ] This represents the variance of the estimation error.
このようにして出力誤差モデルが同定されると、ステップS2に続いて、ステップS3で、推定偏差の特性評価部22が、ステップS2で同定された出力誤差モデルを特性評価用データに適用して、入力変数uの参照データから以下の式(4)で表わされる出力変数zの推定値を算出する。
When the output error model is identified in this way, following step S2, in step S3, the estimated deviation
ステップS3で出力変数の推定偏差dzの統計的特性値である平均および分散値が算出されると、監視モデル作成・保存ステップ(ステップS1〜ステップS3)は、全処理ステップを完了して終了となる。 When the mean and variance values, which are statistical characteristic values of the estimated deviation dz of the output variable, are calculated in step S3, the monitoring model creation / storing step (steps S1 to S3) is completed after completing all the processing steps. Become.
図5は、監視処理手段13Aで実行される処理内容(監視処理ステップ)を示した処理フロー図である。 FIG. 5 is a processing flow diagram showing the processing contents (monitoring processing step) executed by the monitoring processing means 13A.
図5に示されるように、監視処理ステップは、監視データを設定するステップ(ステップS11)と、出力誤差モデルによる推定偏差を算出するステップ(ステップS12)と、推定偏差dzの分散値の逐次確率比検定を行うステップ(ステップS13)と、仮説採択率を監視するステップ(ステップS14)とを有する。 As shown in FIG. 5, the monitoring processing step includes a step of setting monitoring data (step S11), a step of calculating an estimated deviation based on the output error model (step S12), and a sequential probability of a variance value of the estimated deviation dz. A step of performing a ratio test (step S13) and a step of monitoring a hypothesis acceptance rate (step S14) are included.
監視処理ステップ開始直後のステップS11では、監視実行開始後にプラントデータ入力・保存手段11によって入力されたプラントデータのうち、監視モデル作成手段12Aにおいて参照データを設定したのと同じ条件で監視に使用する入出力変数データ(以下、「監視データ」と称する。)を設定する。監視データの設定は、ユーザが入力手段4から入力して設定することによって行われ、当該監視データの設定情報は、入力手段4から第1の推定処理部25に与えられる。
In step S11 immediately after the start of the monitoring process step, the plant data input by the plant data input / save
監視データの設定(ステップS11)が終わると、続くステップS12では、第1の推定処理部25が、ステップS11で設定された監視データに対して、監視モデル作成手段12Aで作成された出力誤差モデルを適用して、出力変数の推定偏差dzを算出する。
When the monitoring data setting (step S11) is completed, in the subsequent step S12, the first
出力変数の推定偏差の算出(ステップS12)が終わると、続くステップS13では、第1の推定偏差検定処理部26が、ステップS12で算出された推定偏差dzに対して逐次確率比検定(Sequential probability ratio test)を適用し、次のような方法で推定偏差の分散値が変化したか否かを判定する。
When the calculation of the estimated deviation of the output variable (step S12) is completed, in the subsequent step S13, the first estimated deviation
より詳細には、推定偏差の時系列dZk={dz(i),i=1〜k}が第1の推定偏差特性評価部22で求めた正常状態の特性と同じ特性を持つとする仮説H0、正常状態に対して分散値が増加したとする仮説H1、および正常状態に対して分散値が減少したとする仮説H2の3つの間で、次式(5)で定義される対数尤度比を検定指標λ1,kおよびλ2,kとして算出し、これらの検定指標を予め与えた誤検出確率(False−alarm rate)αと検出失敗確率(Miss−alarm rate)βより後述する式(7)で定まるしきい値A、Bとそれぞれ比較することにより前記仮説を検定する。
More specifically, the hypothesis that the time series of estimated deviations dZ k = {dz (i), i = 1 to k} has the same characteristics as the characteristics of the normal state obtained by the first estimated deviation
推定偏差dzが相互に独立な正規分布変数の場合、そしてこの仮定は監視モデルが妥当な場合にはほぼ成立し、上式(5)のλi,k(i=1,2)は下記の逐次式(6)のように変形される。 When the estimated deviation dz is a normally distributed variable independent from each other, and this assumption is almost valid when the monitoring model is valid, λ i, k (i = 1, 2) in the above equation (5) is It is transformed as the sequential formula (6).
推定偏差dzの分散値が変化したか否かの判定(ステップS13)が終わると、続くステップS14では、仮説採択率判定部27が予め与えられた時間幅内における分散変化仮説Hi(i=1,2)の採択率を算定し、算定した仮説採択率が管理しきい値を超えた場合に異常と判断することによって異常を検出する。
When the determination of whether or not the variance value of the estimated deviation dz has changed (step S13) is completed, in step S14, the hypothesis acceptance
推定偏差dzが相互に独立な正規分布変数の場合、正常状態において一定の時間幅内での分散変化仮説の採択率は二項分布に従い、同時間幅内での総採択回数と誤検出確率αで決まる。ここでは分散変化仮説の採択率に対して二項分布の分散値も考慮して決まる正常時の誤判定率を管理しきい値として設定し、監視を行う。 When the estimated deviation dz is a mutually independent normal distribution variable, the adoption rate of the variance change hypothesis within a certain time width in a normal state follows a binomial distribution, and the total number of adoptions and the false detection probability α within the same time width. Determined by. Here, monitoring is performed by setting a normal misjudgment rate determined by considering the variance value of the binomial distribution with respect to the adoption rate of the variance change hypothesis as a management threshold value.
仮説採択率を監視するステップ(ステップS14)が終わると、監視処理ステップ(ステップS11〜ステップS14)は、全処理ステップを完了して終了となる。 When the step of monitoring the hypothesis acceptance rate (step S14) is completed, the monitoring processing steps (step S11 to step S14) are completed after completing all the processing steps.
図6は、第1のプラント監視装置1Aの監視処理結果の一例を示す図であって、どの様にプラント2を監視するかを説明する説明図である。より詳細には、図6(a)〜(e)の何れの図も横軸をステップ数としたグラフであって、それぞれ縦軸を、図6(a)では出力(測定値(実線)28,推定値(破線)29)とし、図6(b)では入力とし、図6(c)では推定偏差とし、図6(d)では検定指標とし、図6(e)では仮説採択率として表わしたものである。また、図7は図6(a)の900ステップから1100ステップの範囲を拡大して示した部分拡大図である。
FIG. 6 is a diagram illustrating an example of a monitoring process result of the first
図6に示される監視結果は、1〜999ステップまでは正常状態にあり、1000ステップ目以降でプラントの伝達ゲインが約20%低下した場合のデータに対する結果の一例である。 The monitoring result shown in FIG. 6 is an example of the result for the data when the 1st to 999th steps are in a normal state and the transfer gain of the plant is reduced by about 20% after the 1000th step.
図6(a)および図7に示される実線は測定値28であり、破線は図6(b)に示される入力変数を監視モデルに適用して式(4)で求めた推定値29である。図6(a)および図7を見ると測定値29を見ても1000ステップ目の前後で顕著な変化は見られないが、図6(c)に示されるように、推定偏差では1000ステップ辺りから大きな変化が現われており、図6(d)に示される検定指標によれば、分散増加仮説H1に対する検定指標λ1,kが同図中に破線で示されたしきい値Aを1000ステップ目以降で頻繁に超えている。ここで、前記誤検出確率αおよび検出失敗確率βはともに0.1%としている。
The solid line shown in FIGS. 6 (a) and 7 is the measured
図6(e)に示される仮説採択率は、400ステップの時間幅を与えて算出した分散増加仮説H1の採択率であり、図6(e)によれば、仮説採択率でも同図に示された管理しきい値を1000点目以降で大きく超えており、異常が検出されている。 Hypothesis acceptance rate shown in FIG. 6 (e), 400 is a selection rate of the dispersion increases hypothesis H 1 which is calculated by giving the time width of the step, according to FIG. 6 (e), the in FIG even hypothesis acceptance rate The indicated management threshold value is greatly exceeded after the 1000th point, and an abnormality is detected.
本実施の形態によれば、プラントの運転条件が変化したために出力変数が変化した場合には監視モデルによる推定偏差には変化が現われないため、誤って異常と判定することはない。また、監視モデルに出力誤差モデルを用いているため、出力変数の測定信号にドリフトを生じた場合にも、推定偏差に変化が現われるため正しく検出することができ、これにより種々の異常の検出に対して適用可能である。 According to the present embodiment, when the output variable changes because the operating condition of the plant has changed, no change appears in the estimated deviation by the monitoring model, so that it is not erroneously determined to be abnormal. In addition, since an output error model is used for the monitoring model, even if a drift occurs in the measurement signal of the output variable, the estimated deviation changes, so that it can be detected correctly, thereby detecting various abnormalities. It is applicable to.
さらに、監視指標に対する管理しきい値を統計的特性を考慮して設定しているため、参照データに対する依存性が小さい。逐次確率比検定の結果は、設定した誤検出率に対応して正常状態においても一定の割合で分散変化仮説が採択されるが、一定時間幅内での採択率に対して統計的特性を考慮した管理しきい値を設定しているので、一過性のノイズによる誤検出は発生せず、監視結果の信頼性が高まる。 Furthermore, since the management threshold for the monitoring index is set in consideration of statistical characteristics, the dependency on the reference data is small. As for the result of the sequential probability ratio test, the variance change hypothesis is adopted at a constant rate in the normal state corresponding to the set false detection rate, but the statistical characteristics are taken into account for the adoption rate within a certain time range. Since the management threshold is set, no erroneous detection due to transient noise occurs, and the reliability of the monitoring result is improved.
[第2の実施の形態]
本発明の第2の実施の形態に係るプラント監視装置およびプラント監視方法について説明する。尚、プラント監視装置1Bと同一の構成要素には同一の符号を付し、重複する説明は省略する。
[Second Embodiment]
A plant monitoring apparatus and a plant monitoring method according to the second embodiment of the present invention will be described. In addition, the same code | symbol is attached | subjected to the component same as the
本発明の第2の実施の形態に係るプラント監視装置1Bの構成は、図1において、プラント監視装置1、監視モデル作成手段12および監視処理手段13を、それぞれ、プラント監視装置1B、監視モデル作成手段12Bおよび監視処理手段13Bと読み替えた構成である。すなわち、プラント監視装置1Bは、プラントデータ入力・保存手段11、監視モデル作成手段12Bおよび監視処理手段13Bを具備する。
The configuration of the
図8は、本発明の第2の実施の形態に係るプラント監視装置(以下、「第2の監視モデル作成手段」と称する。)1Bが具備する監視モデル作成手段12Bの構成を示した概略図である。 FIG. 8 is a schematic diagram showing the configuration of the monitoring model creating means 12B included in the plant monitoring apparatus (hereinafter referred to as “second monitoring model creating means”) 1B according to the second embodiment of the present invention. It is.
図8に示されるように、第2の監視モデル作成手段12Bは、主成分分析を行い固有値の一番大きい方からの累積寄与率が予め設定した値以上となる個数r個までの主成分を選択し対応するr個の固有ベクトルを列に持つ負荷行列を監視モデルとして作成する第1の主成分分析部31と、第1の主成分分析部31が作成した監視モデルにより生成される推定偏差の特性を評価する第2の推定偏差特性評価部32とを備える。
As shown in FIG. 8, the second monitoring model creating means 12B performs principal component analysis and displays up to r principal components whose cumulative contribution rate from the largest eigenvalue is equal to or greater than a preset value. A first principal
図9は、プラント監視装置1Bに具備される監視処理手段13B(以下、「第2の監視処理手段」と称する。)の構成を示した概略図である。
FIG. 9 is a schematic diagram showing the configuration of the monitoring processing means 13B (hereinafter referred to as “second monitoring processing means”) provided in the
第2の監視処理手段13Bは、入出力変数データに前記監視モデル作成手段12Bで作成された監視モデルを適用して入出力変数に相当する監視変数の推定偏差を算出する第2の出力推定偏差算出部35と、前記推定偏差に対して逐次確率比検定を適用して推定偏差の分散値が変化したか否かの仮説を検定する第2の推定偏差検定処理部36と、前記逐次確率比検定の結果の分散変化仮説の採択率を算定し、採択率が管理しきい値を超えた状態を異常と判定することによって異常を検出する仮説採択率判定部27とを備える。
The second monitoring processing means 13B applies the monitoring model created by the monitoring model creating means 12B to the input / output variable data to calculate the estimated deviation of the monitoring variable corresponding to the input / output variable. A calculating
プラント監視装置1Bが実行する処理内容は、プラント監視装置1Aで実行される処理内容に対して、作成され適用される監視モデルが異なるものの、本質的な処理ステップについては同様である。すなわち、プラント監視装置1Bでは、まず、プラントデータ入力・保存ステップが実行され、続いて、監視モデル作成・保存ステップが実行され、当該処理ステップでは、プラントデータ入力・保存手段11に保存される履歴データを使ってプラント2の監視実行に必要な監視モデルとなる負荷行列が第2の監視モデル作成手段12Bによって作成され保存される。
The processing content executed by the
監視モデル作成・保存ステップに続いては、監視処理ステップが実行され、当該処理ステップでは、第2の監視処理手段13Bによって、第2の監視モデル作成手段12Bに保存された監視モデルを適用したプラント2の異常の検出がなされる。監視処理ステップ後は、監視処理結果出力ステップおよび監視処理結果表示ステップが実行され、第2の監視処理手段13Bがプラント2の異常の有無の検出を行った結果が表示装置3の表示部に表示される。
Following the monitoring model creation / storage step, a monitoring processing step is executed, and in this processing step, a plant to which the monitoring model stored in the second monitoring model creation means 12B is applied by the second monitoring processing means 13B. Two abnormalities are detected. After the monitoring processing step, the monitoring processing result output step and the monitoring processing result display step are executed, and the result of the second monitoring processing means 13B detecting whether there is an abnormality in the
次に、第2の監視モデル作成手段12Bで実行される処理内容(以下、「第2の監視モデル作成・保存ステップ」と称する。)および第2の監視処理手段13Bで実行される処理内容(「第2の監視処理ステップ」と称する。)について、より詳細に説明する。 Next, the processing contents executed by the second monitoring model creation means 12B (hereinafter referred to as “second monitoring model creation / storage step”) and the processing contents executed by the second monitoring processing means 13B ( The “second monitoring process step” will be described in more detail.
図10は、第2の監視モデル作成手段12Bで実行される第2の監視モデル作成・保存ステップを示した処理フロー図である。 FIG. 10 is a process flow diagram showing the second monitoring model creation / storing step executed by the second monitoring model creation means 12B.
図10に示されるように、第2の監視モデル作成・保存ステップは、参照データを設定するステップ(ステップS21)と、主成分分析をするステップ(ステップS22)と寄与率の大きな主成分に対する負荷行列を構成するステップ(ステップS23)と、ステップS23で構成された負荷行列(監視モデル)を適用した場合における推定偏差を算出するステップ(ステップS24)と、ステップS24で算出された推定偏差の特性評価を行うステップ(ステップS25)とを有する。 As shown in FIG. 10, the second monitoring model creation / storing step includes a step of setting reference data (step S21), a step of performing principal component analysis (step S22), and a load on the principal component having a large contribution rate. A step of forming a matrix (step S23), a step of calculating an estimated deviation when the load matrix (monitoring model) configured in step S23 is applied (step S24), and a characteristic of the estimated deviation calculated in step S24 And a step of performing an evaluation (step S25).
第2の監視モデル作成・保存ステップは、開始直後のステップS21では、プラント2の動的および静的特性に関する事前知識を基に、履歴データのうちでプラントの運転条件の変化を直接的に表わす変数およびその影響を受けて変化する変数を含む監視変数xを定義し、これらの集合を参照データとして設定するとともに、参照データを第1の主成分分析部31において使用するモデル作成用データと、推定偏差の特性評価部32において使用する特性評価用データXに分割する。参照データの設定は、ユーザが入力手段4から入力して設定することによって行われ、当該参照データの設定情報は、入力手段4から出力第1の主成分分析部31および第2の推定偏差特性評価部32に与えられる。
In the step S21 immediately after the start of the second monitoring model creation / storing step, the change in the operating condition of the plant is directly expressed in the history data based on the prior knowledge regarding the dynamic and static characteristics of the
ステップS21に続いて、ステップS22では、第1の主成分分析部31が、モデル作成用データを用いて、主成分分析を行う。そして、ステップS23では、第1の主成分分析部31が、固有値の一番大きい方からの累積寄与率、すなわち、順に固有値を加算した値が全固有値の総和に占める割合が予め設定した値以上となる個数r個までの主成分を選択し、対応するr個の固有ベクトルを列に持つ負荷行列Aを構築する。ステップS23で構築された負荷行列Aがプラント監視装置1Bで適用される監視用モデルとなる。
Subsequent to step S21, in step S22, the first principal
ステップS24に続いて、ステップS25では、第2の推定偏差特性評価部32が、ステップS24で算出された推定偏差の統計的特性値である平均値と分散値を算出する。これらの特性値は第2の監視処理手段13Bの逐次確率比検定の処理に用いられる。ステップS25で推定偏差dXの統計的特性値である平均および分散値が算出されると、第2の監視モデル作成・保存ステップ(ステップS21〜ステップS25)は、全処理ステップを完了して終了となる。
Subsequent to step S24, in step S25, the second estimated deviation
図11は、第2の監視処理手段13Bで実行される第2の監視処理ステップを示した処理フロー図である。 FIG. 11 is a process flow diagram showing the second monitoring processing step executed by the second monitoring processing means 13B.
図11に示されるように、第2の監視処理ステップは、監視データを設定するステップ(ステップS31)と、負荷行列による推定偏差を算出するステップ(ステップS32)と、推定偏差dXの分散値の逐次確率比検定を行うステップ(ステップS33)と、仮説採択率を監視するステップ(ステップS14)とを有する。 As shown in FIG. 11, the second monitoring processing step includes a step of setting monitoring data (step S31), a step of calculating an estimated deviation based on a load matrix (step S32), and a variance value of the estimated deviation dX. A step of performing a sequential probability ratio test (step S33) and a step of monitoring a hypothesis acceptance rate (step S14).
監視処理ステップ開始直後のステップS31では、監視実行開始後にプラントデータ入力・保存手段11により入力されたプラントデータのうち、前記監視モデル作成手段2において参照データを設定したのと同じ監視変数に対する監視データを設定する。監視データの設定は、ユーザが入力手段4から入力して設定することによって行われ、当該監視データの設定情報は、入力手段4から第2の推定処理部35に与えられる。
In step S31 immediately after the start of the monitoring process step, among the plant data input by the plant data input / save
監視データの設定(ステップS31)が終わると、続くステップS32では、第2の出力推定算出部35が、監視データに対して、第2の監視モデル作成手段12Bによって作成された監視モデル(負荷行列)を適用して監視変数の推定偏差dXを算出する。
When the monitoring data setting (step S31) is completed, in the subsequent step S32, the second output
監視変数の推定偏差の算出(ステップS32)が終わると、続くステップS33では、第2の推定偏差検定処理部36が、ステップS32で算出された推定偏差dXに対して逐次確率比検定を適用し、推定偏差の分散値が変化したか否かを判定する。判定手法は、ステップS13の場合と実質的に同様である。
When the calculation of the estimated deviation of the monitoring variable (step S32) is completed, in the subsequent step S33, the second estimated deviation
推定偏差dXの分散値が変化したか否かの判定(ステップS33)が終わると、続くステップS14では、仮説採択率判定部27が予め与えられた時間幅内における分散変化仮説Hi(i=1,2)の採択率を算定し、算定した仮説採択率が管理しきい値を超えた場合に異常と判断することによって異常を検出する。仮説採択率を監視するステップ(ステップS14)が終わると、第2の監視処理ステップ(ステップS31〜ステップS14)は、全処理ステップを完了して終了となる。
When the determination of whether or not the variance value of the estimated deviation dX has changed (step S33) is completed, in step S14, the hypothesis acceptance
図12は、第2のプラント監視装置1Bが、どの様にプラント2を監視するかを説明する説明図であって、第1のプラント監視装置1Aの監視処理結果の一例を示した図6に相当する図である。
FIG. 12 is an explanatory diagram for explaining how the second
より詳細には、図12(a)〜(e)の何れの図も横軸をステップ数としたグラフであって、それぞれ縦軸を、図12(a)では、プラント2の運転条件の変化の影響を受けて変化する出力相当の変数zとし、図12(b)ではプラント2の運転条件の変化を直接表わす入力相当の変数uとし、図12(c)では推定偏差とし、図12(d)では検定指標とし、図12(e)では仮説採択率として表わしたものである。
More specifically, each of FIGS. 12A to 12E is a graph in which the horizontal axis indicates the number of steps, and the vertical axis indicates the change in operating conditions of the
図12に示される例では監視変数xとして
図12で示される例の場合、2つの主成分の累積寄与率は99%以上となった。図12(c)乃至(e)においても、プラント2の出力変数に相当する変数zの推定偏差dzには異常が発生した1000ステップ目以降で大きな変化が現われている。特に図12(d)に示される推定偏差dzの分散増加仮説に対する検定指標は1000ステップ目以降で非常に大きな値を示している。図12(e)に示される仮説採択率は、400ステップの時間幅を与えて算出した分散増加仮説の採択率であり、同図中に破線で示された管理しきい値を1000ステップ目以降で大きく超えており、これにより異常が検出されている。
In the case of the example shown in FIG. 12, the cumulative contribution ratio of the two main components is 99% or more. 12C to 12E, a large change appears in the estimated deviation dz of the variable z corresponding to the output variable of the
本実施の形態によれば、プラントの運転条件が変化したために出力変数が変化した場合には監視モデルによる推定が良好に行われるために推定偏差には変化が現われず、従って誤って異常と判定することはない。 According to the present embodiment, when the output variable changes due to a change in the operating conditions of the plant, the estimation by the monitoring model is performed well, so the estimated deviation does not appear, and thus it is erroneously determined as abnormal. Never do.
また、監視変数をプラントの入出力変数に相当する変数より構成することにより、出力変数相当の変数の測定信号にドリフトを生じた場合には推定偏差に変化が現われるため、正しく異常として検出することができる。このように種々の異常に対して適用が可能である。 In addition, by constructing the monitoring variables from variables corresponding to plant input / output variables, if the measurement signal of the variable corresponding to the output variable drifts, the estimated deviation will change. Can do. Thus, it can be applied to various abnormalities.
さらに、監視指標に対する管理しきい値を統計的特性を考慮して設定しているため、参照データに対する異常検出性能の依存性が小さい。また、逐次確率比検定の結果から一定時間幅内での採択率を求め、その統計的特性を考慮した管理しきい値を設定して監視しているために、一過性のノイズによる誤検出は発生せず、監視結果の信頼性が高い。このように、本実施の形態においても、第1の実施の形態と同様の効果を奏し得る。 Furthermore, since the management threshold for the monitoring index is set in consideration of statistical characteristics, the dependency of the abnormality detection performance on the reference data is small. In addition, the adoption rate within a certain time range is obtained from the results of the sequential probability ratio test, and monitoring is performed by setting a management threshold considering its statistical characteristics. The monitoring results are highly reliable. As described above, also in this embodiment, the same effect as that of the first embodiment can be obtained.
[第3の実施の形態]
本発明の第3の実施の形態に係るプラント監視装置およびプラント監視方法について説明する。尚、プラント監視装置1A,1Bと同一の構成要素には同一の符号を付し、重複する説明は省略する。
[Third Embodiment]
A plant monitoring apparatus and a plant monitoring method according to a third embodiment of the present invention will be described. In addition, the same code | symbol is attached | subjected to the component same as
本発明の第3の実施の形態に係るプラント監視装置1Cの構成は、図1において、プラント監視装置1、監視モデル作成手段12および監視処理手段13を、それぞれ、プラント監視装置1C、監視モデル作成手段12Cおよび監視処理手段13Cと読み替えた構成である。すなわち、プラント監視装置1Cは、プラントデータ入力・保存手段11、監視モデル作成手段12Cおよび監視処理手段13Cを具備する。
The configuration of the
図13は、本発明の第3の実施の形態に係るプラント監視装置1Cが具備する監視モデル作成手段(以下、「第3の監視モデル作成手段」と称する。)12Cの構成を示した概略図である。
FIG. 13 is a schematic diagram showing the configuration of a monitoring model creation means (hereinafter referred to as “third monitoring model creation means”) 12C included in the
図13に示されるように、監視モデル作成手段12Cは、主成分分析を行い固有値の一番小さい方からの累積寄与率が予め設定した値以下となる個数s個までの主成分を選択し、対応するs個の固有ベクトルを列に持つ負荷行列を監視モデルとして作成する第2の主成分分析部41と、第2の主成分分析部41が作成した監視モデルにより生成される主成分得点の特性評価を行う主成分得点特性評価部42を備える。
As shown in FIG. 13, the monitoring model creation means 12C performs principal component analysis, selects up to s principal components whose cumulative contribution rate from the smallest eigenvalue is equal to or less than a preset value, A second principal
図14は、プラント監視装置1Cに具備される監視処理手段13C(以下、「第3の監視処理手段」と称する。)の構成を示した概略図である。
FIG. 14 is a schematic diagram showing the configuration of the monitoring processing means 13C (hereinafter referred to as “third monitoring processing means”) provided in the
監視処理手段13Cは、監視変数のデータに監視モデル作成手段12Cで作成された監視モデルを適用して主成分得点を算出する主成分得点算出部45と、主成分得点算出部45が算出した主成分得点に対して逐次確率比検定を適用して前記主成分得点の分散値が変化したか否かの仮説を検定する主成分得点検定処理部46と、前記逐次確率比検定の結果の分散変化仮説の採択率を算定し、採択率が管理しきい値を超えた状態を異常と判定することによって異常を検出する仮説採択率判定部27とを備える。
The
プラント監視装置1Cが実行する処理内容は、プラント監視装置1Bで実行される処理内容に対して、作成され適用される監視モデルが異なるものの、本質的な処理ステップについては同様である。すなわち、プラント監視装置1Cでは、まず、プラントデータ入力・保存ステップが実行され、続いて、監視モデル作成・保存ステップが実行され、当該処理ステップでは、プラントデータ入力・保存手段11に保存される履歴データを使ってプラント2の監視実行に必要な監視モデルとなる負荷行列が第3の監視モデル作成手段12Cによって作成され保存される。
The processing contents executed by the
監視モデル作成・保存ステップに続いては、監視処理ステップが実行され、当該処理ステップでは、第3の監視処理手段13Cによって、第3の監視モデル作成手段12Cに保存された監視モデルを適用したプラント2の異常の検出がなされる。監視処理ステップ後は、監視処理結果出力ステップおよび監視処理結果表示ステップが実行され、第3の監視処理手段13Cがプラント2の異常の有無の検出を行った結果が表示装置3の表示部に表示される。
Subsequent to the monitoring model creation / storage step, a monitoring processing step is executed. In this processing step, a plant to which the monitoring model stored in the third monitoring model creation means 12C is applied by the third monitoring processing means 13C. Two abnormalities are detected. After the monitoring processing step, a monitoring processing result output step and a monitoring processing result display step are executed, and the result of detection of the presence or absence of abnormality of the
次に、第3の監視モデル作成手段12Cで実行される処理内容(以下、「第3の監視モデル作成・保存ステップ」と称する。)および第3の監視処理手段13Cで実行される処理内容(「第3の監視処理ステップ」と称する。)について、より詳細に説明する。 Next, the processing contents executed by the third monitoring model creation means 12C (hereinafter referred to as “third monitoring model creation / storing step”) and the processing contents executed by the third monitoring processing means 13C ( The “third monitoring processing step” will be described in more detail.
図15は、第3の監視モデル作成手段12Cで実行される第3の監視モデル作成・保存ステップを示した処理フロー図である。 FIG. 15 is a process flow diagram showing a third monitoring model creation / storing step executed by the third monitoring model creation means 12C.
図15に示されるように、第3の監視モデル作成・保存ステップは、参照データを設定するステップ(ステップS21)と、主成分分析をするステップ(ステップS22)と寄与率の小さな主成分に対する負荷行列を構成するステップ(ステップS43)と、ステップS43で構成された負荷行列(監視モデル)を適用した場合における主成分得点を算出するステップ(ステップS44)と、ステップS44で算出された主成分得点の特性評価を行うステップ(ステップS45)とを有する。 As shown in FIG. 15, the third monitoring model creation / storing step includes a step of setting reference data (step S21), a step of performing principal component analysis (step S22), and a load on a principal component having a small contribution rate. A step of constructing a matrix (step S43), a step of calculating principal component scores when the load matrix (monitoring model) constructed in step S43 is applied (step S44), and a principal component score calculated in step S44 (Step S45).
第3の監視モデル作成・保存ステップでは、まず、第2の監視モデル作成・保存ステップと同様に、ステップS21およびステップS22が実行される。ステップS22の主成分分析が終わると、続くステップS43で、第2の主成分分析部41が、ステップS22で行われた主成分分析の結果に基づき、固有値の一番小さい方からの累積寄与率が予め設定した値以下となる個数s個までの主成分を選択し、対応するs個の固有ベクトルを列に持つ負荷行列Aを構成する。ステップS43で構築された負荷行列Aがプラント監視装置1Cで適用される監視用モデルとなる。
In the third monitoring model creation / storing step, first, similarly to the second monitoring model creating / storing step, steps S21 and S22 are executed. When the principal component analysis of step S22 is completed, in the subsequent step S43, the second principal
ステップS43に続いて、ステップS44では、主成分得点検定処理部46が、ステップS43で構築された負荷行列AをステップS21で設定した特性評価用データXに適用し、以下の式(10)で与えられる主成分得点Tを算出する。
![]()
![]()
ステップS44に続いて、ステップS45では、主成分得点検定処理部46が、ステップS44で算出された主成分得点Tの統計的特性値である平均値と分散値を算出する。これらの特性値は第3の監視処理手段13Cの逐次確率比検定の処理に用いられる。
Subsequent to step S44, in step S45, the principal component score
ステップS45で主成分得点Tの統計的特性値である平均および分散値が算出されると、第3の監視モデル作成・保存ステップ(ステップS21〜ステップS45)は、全処理ステップを完了して終了となる。 When the mean and variance values, which are statistical characteristic values of the principal component score T, are calculated in step S45, the third monitoring model creation / storing step (steps S21 to S45) is completed after completing all the processing steps. It becomes.
図16は、第3の監視処理手段13Cで実行される第3の監視処理ステップを示した処理フロー図である。 FIG. 16 is a process flow diagram showing the third monitoring processing step executed by the third monitoring processing means 13C.
図16に示されるように、第3の監視処理ステップは、監視データを設定するステップ(ステップS31)と、負荷行列による主成分得点を算出するステップ(ステップS52)と、主成分得点分散値の逐次確率比検定を行うステップ(ステップS53)と、仮説採択率を監視するステップ(ステップS14)とを有する。 As shown in FIG. 16, the third monitoring processing step includes a step of setting monitoring data (step S31), a step of calculating principal component scores based on the load matrix (step S52), and a principal component score variance value. A step of performing a sequential probability ratio test (step S53) and a step of monitoring a hypothesis acceptance rate (step S14).
第3の監視処理ステップでは、まず、第2の監視処理ステップと同様に、ステップS31が実行される。監視データの設定(ステップS31)が終わると、続くステップS52では、主成分得点算出部45が、監視データに対して前記監視モデル作成手段12Cで作成された負荷行列を適用して主成分得点を算出する。
In the third monitoring process step, step S31 is first executed as in the second monitoring process step. When the monitoring data setting (step S31) is completed, in the subsequent step S52, the principal component
負荷行列による主成分得点の算出(ステップS52)が終わると、続くステップS53では、主成分得点検定処理部46が、ステップS52で算出された主成分得点に対して逐次確率比検定を適用し、主成分得点の分散値が変化したか否かを判定する。主成分得点の分散値が変化したか否かの判定(ステップS53)が終わると、続いてステップS14が実行され、ステップS14が終わると、第3の監視処理ステップ(ステップS31〜ステップS14)は、全処理ステップを完了して終了となる。
When the calculation of the principal component score using the load matrix (step S52) ends, in the subsequent step S53, the principal component score
第2のプラント監視装置1Bが正常時の変数間の相関関係では説明の付けられない、新たな成分が異常の影響により発生したことを検出するのに対し、第3のプラント監視装置1Cは、正常時にはほとんど認められないほど小さかった相関成分が異常の発生によって増大したことを検出するものといえる。
Whereas the second
図17は、第3のプラント監視装置1Cが、どの様にプラント2を監視するかを説明する説明図であって、第1のプラント監視装置1Aの監視処理結果の一例を示した図6や第2のプラント監視装置1Bの監視処理結果の一例を示した図12に相当する図である。
FIG. 17 is an explanatory diagram for explaining how the third
より詳細には、図17(a)〜(e)の何れの図も横軸をステップ数としたグラフであって、それぞれ縦軸を、図17(a)では、プラント2の運転条件の変化の影響を受けて変化する出力相当の変数zとし、図17(b)ではプラント2の運転条件の変化を直接表わす入力相当の変数uとし、図17(c)では主成分得点とし、図17(d)では検定指標とし、図17(e)では仮説採択率として表わしたものである。
More specifically, each of the diagrams of FIGS. 17A to 17E is a graph in which the horizontal axis indicates the number of steps, and the vertical axis indicates the change in the operating condition of the
尚、監視変数xは図12の場合と同様に式(9)により構成した例であって、最小固有値に対応する固有ベクトルより負荷行列を構成している。図12で示される例の場合には、2つの主成分の累積寄与率は99%以上となったが、図17に示される例では、累積寄与率は1%以下のため、図17(a)および図17(b)に示される推定値29は、測定値28とは大きく異なる(乖離している)。
Note that the monitoring variable x is an example configured by Expression (9) as in the case of FIG. 12, and a load matrix is configured from the eigenvector corresponding to the minimum eigenvalue. In the example shown in FIG. 12, the cumulative contribution ratio of the two principal components is 99% or more. However, in the example shown in FIG. 17, the cumulative contribution ratio is 1% or less. ) And the estimated
図17(c)に示される主成分得点Tには異常が発生した1000ステップ目以降で大きな変化が現われており、図17(d)に示される主成分得点の分散増加仮説に対する検定指標は1000ステップ目以降で非常に大きな値を示している。また、図17(e)に示される仮説採択率は、400ステップの時間幅を与えて算出した分散増加仮説の採択率であり、同図中に破線で示された管理しきい値を1000ステップ目以降で大きく超えており、これにより異常が検出されている。 The principal component score T shown in FIG. 17 (c) shows a large change after the 1000th step when the abnormality occurred, and the test index for the variance increase hypothesis of the principal component score shown in FIG. Very large values are shown after the step. Further, the hypothesis adoption rate shown in FIG. 17 (e) is the adoption rate of the variance increase hypothesis calculated by giving a time width of 400 steps, and the management threshold indicated by the broken line in the figure is 1000 steps. This is greatly exceeded after the first eye, and an abnormality is detected.
本実施の形態によれば、監視変数をプラントの入出力変数に相当する変数によって構成することで、出力変数相当の変数の測定信号にドリフトを生じた場合にも推定偏差に変化が現われるため、正しく検出することができ、種々の異常に対して適用可能である。 According to the present embodiment, by configuring the monitoring variable by a variable corresponding to the input / output variable of the plant, a change appears in the estimated deviation even when a drift occurs in the measurement signal of the variable corresponding to the output variable. It can be detected correctly and can be applied to various abnormalities.
また、監視指標に対する管理しきい値を統計的特性を考慮して設定しているため、参照データに対する依存性が小さい。さらに、逐次確率比検定の結果から一定時間幅内での採択率を求め、その統計的特性を考慮した管理しきい値を設定して監視しているために、一過性のノイズによる誤検出は発生せず、監視結果の信頼性が高い。このように、本実施の形態においても、第1の実施の形態と同様の効果を奏し得る。 In addition, since the management threshold for the monitoring index is set in consideration of statistical characteristics, the dependence on the reference data is small. In addition, the adoption rate within a certain time range is obtained from the results of the sequential probability ratio test, and monitoring is performed by setting a management threshold considering its statistical characteristics. The monitoring results are highly reliable. As described above, also in this embodiment, the same effect as that of the first embodiment can be obtained.
[第4の実施の形態]
本発明の第4の実施の形態に係るプラント監視装置およびプラント監視方法について説明する。尚、プラント監視装置1A,1B,1Cと同一の構成要素には同一の符号を付し、重複する説明は省略する。
[Fourth Embodiment]
A plant monitoring apparatus and a plant monitoring method according to the fourth embodiment of the present invention will be described. In addition, the same code | symbol is attached | subjected to the component same as
本発明の第4の実施の形態に係るプラント監視装置1Dの構成は、図1において、プラント監視装置1、監視モデル作成手段12および監視処理手段13を、それぞれ、プラント監視装置1D、監視モデル作成手段12Dおよび監視処理手段13Dと読み替えた構成である。すなわち、プラント監視装置1Dは、プラントデータ入力・保存手段11、監視モデル作成手段12Dおよび監視処理手段13Dを具備する。
The configuration of the
図18は、本発明の第4の実施の形態に係るプラント監視装置1Dが具備する監視モデル作成手段(以下、「第4の監視モデル作成手段」と称する。)12Dの構成を示した概略図である。
FIG. 18 is a schematic diagram showing the configuration of a monitoring model creation means (hereinafter referred to as “fourth monitoring model creation means”) 12D provided in the
図18に示されるように、第4の監視モデル作成手段12Dは、第1の主成分分析部31と第2の主成分分析部41とを有して構成された主成分分析部51と、主成分分析部51が作成した監視モデルにより生成される推定偏差および主成分得点から成る統計量データ特性評価52とを備える。
As shown in FIG. 18, the fourth monitoring
統計量データ特性評価52は、第2の推定偏差特性評価部32および主成分得点特性評価部42が持つ機能を有しており、第1の主成分分析部31が作成した監視モデルにより生成される監視変数の推定偏差の特性評価については第2の推定偏差特性評価部32の機能を、第2の主成分分析部41が作成した監視モデルにより生成される主成分得点の特性評価については主成分得点特性評価部42の機能を用いて特性評価を行う。
The statistic data
図19は、プラント監視装置1Dに具備される監視処理手段13D(以下、「第4の監視処理手段」と称する。)の構成を示した概略図である。
FIG. 19 is a schematic diagram showing the configuration of the monitoring processing means 13D (hereinafter referred to as “fourth monitoring processing means”) provided in the
図19に示されるように、第4の監視処理手段13Dは、入出力変数データに監視モデル作成手段12Dで作成された監視モデルである負荷行列を適用して入出力変数の推定偏差および主成分得点を算出する統計量データ算出部55と、統計量データ算出部55で算出された推定偏差および主成分得点から成る統計量データに対して逐次確率比検定を適用して当該統計量データの分散値が変化したか否かの仮説を検定する統計量データ検定処理部56と、前記逐次確率比検定の結果の分散変化仮説の採択率を算定し、採択率が管理しきい値を超えた状態を異常と判定することによって異常を検出する仮説採択率判定部27とを備える。
As shown in FIG. 19, the fourth
統計量データ算出部55は、第2の出力推定偏差算出部35および主成分得点算出部45が持つ機能を有し、第1の主成分分析部31が作成した監視モデルを適用しての推定偏差の算出については第2の出力推定偏差算出部35の機能を、第2の主成分分析部41が作成した監視モデルを適用しての主成分得点の算出については、主成分得点算出部45の機能を用いて計算を行う。
The statistic
統計量データ検定処理部56は、第2の推定偏差検定処理部36および主成分得点検定処理部46が持つ機能を有し、算出された推定偏差の検定については第2の推定偏差検定処理部36の機能を、算出された主成分得点の検定については主成分得点検定処理部46の機能を用いて計算を行う。
The statistic data
プラント監視装置1Dが実行する処理内容は、他のプラント監視装置1A,1B,1C等で実行される処理内容と同様に、まず、プラントデータ入力・保存手段11によるプラントデータ入力・保存ステップが実行され、続いて、第4の監視モデル作成手段12Dによる監視モデル作成・保存ステップが実行され、続いて、第4の監視処理手段13Dによる監視処理ステップが実行される。そして、監視処理ステップ後は、監視処理結果出力ステップおよび監視処理結果表示ステップが実行され、第4の監視処理手段13Dがプラント2の異常の有無の検出を行った結果が表示装置3の表示部に表示される。
The processing contents executed by the
また、プラント監視装置1Dが実行する処理内容は、プラント監視装置1B,1Cで実行される処理内容に対して、それぞれの一部の処理ステップを組み合わせたステップと考えることができる。すなわち、第4の監視モデル作成手段12Dで実行される処理内容(以下、「第4の監視モデル作成・保存ステップ」と称する。)では、まず、主成分分析部51によって参照データを設定するステップS21、主成分分析をするステップS22、寄与率の大きな主成分に対する負荷行列を構成するステップS23、寄与率の小さな主成分に対する負荷行列を構成するステップS43が実行される。続いて、統計量データの特性評価として統計量データ特性評価部52によって、ステップS23で構成された負荷行列(監視モデル)を適用した場合における推定偏差を算出するステップS24、ステップS24で算出された推定偏差の特性評価を行うステップS25、ステップS43で構成された負荷行列(監視モデル)を適用した場合における主成分得点を算出するステップS44、ステップS44で算出された主成分得点の特性評価を行うステップS45が実行される。
Further, the processing content executed by the
主成分分析部51および統計量データ特性評価部52が一連の処理ステップを完了すると、第4の監視モデル作成・保存ステップは終了する。換言すれば、第4の監視モデル作成・保存ステップは、第2の監視モデル作成・保存ステップと第3の監視モデル作成・保存ステップとを備え、第2の監視モデル作成・保存ステップおよび第3の監視モデル作成・保存ステップを別個に処理する処理ステップである。
When the principal
第4の監視処理手段13Dで実行される処理内容(「第4の監視処理ステップ」と称する。)では、まず、統計量データ算出部55によって、監視データを設定するステップS31、負荷行列による推定偏差を算出するステップS32および負荷行列による主成分得点の算出をするステップS52が実行される。続いて、統計量データ検定処理部56によって推定偏差dXの分散値の逐次確率比検定を行うステップS33、主成分得点分散値の逐次確率比検定を行うステップS53が実行される。続いて、仮説採択率判定部27が統計量データ検定処理部56でなされた統計量データに対する逐次確率比検定の結果の分散変化仮説の採択率を算定し、算定した仮説採択率が管理しきい値を超えた場合に異常と判断することによって異常を検出する。仮説採択率を監視するステップ(ステップS14)が終わると、第4の監視処理ステップは、全処理ステップを完了して終了となる。
In the processing contents (referred to as “fourth monitoring processing step”) executed by the fourth monitoring processing means 13D, first, the statistical
上述したように本実施の形態によれば、第1乃至第3の実施の形態で説明したプラント監視装置1A,1B,1Cおよび各プラント監視方法と同様の効果を奏する他、正常時の変数間の相関関係では説明の付けられない新たな成分が発生するような広い範囲の異常と、正常時にも存在する弱い相関成分が増大するようなタイプの異常の何れにも適用可能な汎用性の高い監視が可能になる。
As described above, according to the present embodiment, the same effects as those of the
[第5の実施の形態]
本発明の第5の実施の形態に係るプラント監視装置およびプラント監視方法について説明する。尚、プラント監視装置1A,1B,1C,1Dと同一の構成要素には同一の符号を付し、重複する説明は省略する。
[Fifth Embodiment]
A plant monitoring apparatus and a plant monitoring method according to the fifth embodiment of the present invention will be described. In addition, the same code | symbol is attached | subjected to the component same as
本発明の第5の実施の形態に係るプラント監視装置1Eの構成は、図1において、プラント監視装置1、監視モデル作成手段12および監視処理手段13を、それぞれ、プラント監視装置1E、監視モデル作成手段12Eおよび監視処理手段13Eと読み替えた構成である。すなわち、プラント監視装置1Eは、プラントデータ入力・保存手段11、監視モデル作成手段12Eおよび監視処理手段13Eを具備する。
The configuration of the
図20は、本発明の第5の実施の形態に係るプラント監視装置1Eの概略を示しており、特にプラント監視装置1Eが具備する監視モデル作成手段(以下、「第5の監視モデル作成手段」と称する。)12Eの構成を詳細に示した概略図である。
FIG. 20 shows an outline of a
図20に示されるように、第5の監視モデル作成手段12Eは、出力誤差モデル同定部21および第1の推定偏差特性評価部22に加え、プラント2の運転状態の変化を直接的に引き起こす入力変数特性を評価する入力変数特性評価部58をさらに備えたものである。すなわち、第5の監視モデル作成手段12Eは、第1の監視モデル作成手段12Aに、入力変数特性評価部58をさらに備えて構成される。
As shown in FIG. 20, in addition to the output error
図21は、プラント監視装置1Eの概略を示しており、特にプラント監視装置1Eが具備する監視処理手段13E(以下、「第5の監視処理手段」と称する。)の構成を詳細に示した概略図である。
FIG. 21 shows an outline of the
図21に示されるように、第5の監視処理手段13Eは、第1の監視処理手段13Aと、入力変数特性の異常の有無について監視する入力異常監視処理手段60を備える。
プラント監視装置1Eが実行する処理内容は、他のプラント監視装置1A,1B,1C,1D等で実行される処理内容と同様に、まず、プラントデータ入力・保存手段11によるプラントデータ入力・保存ステップが実行され、続いて、第5の監視モデル作成手段12Eによる監視モデル作成・保存ステップが実行され、続いて、第5の監視処理手段13Eによる監視処理ステップが実行される。そして、監視処理ステップ後は、監視処理結果出力ステップおよび監視処理結果表示ステップが実行され、第5の監視処理手段13Eがプラント2の異常の有無の検出を行った結果が表示装置3の表示部に表示される。
The processing content executed by the
第5の監視処理手段13Eによる監視処理ステップのうち、第1の監視処理手段13Aが行う処理内容については、第1の実施の形態で説明した通りである。プラント監視装置1Eでは、プラント2の入力変数の測定値から出力誤差モデルによりプラント2の出力変数の値を推定し、出力変数の測定値と推定値との偏差を監視することにより、入力変数の変化では説明の付けられない出力変数の変化を監視する。つまり、第1の監視処理手段13Aでは、入出力変数の変化が出力誤差モデルに従っている限りは、入力変数がどのような変化をしても異常は検出されない。
Of the monitoring processing steps by the fifth monitoring processing means 13E, the processing contents performed by the first monitoring processing means 13A are as described in the first embodiment. In the
これに対して、入力異常監視処理手段60では、予め与えられた時間幅内における入力変数の分散値が正常状態における分散値と同じか否かを分散検定により監視する。分散検定は次のように行う。
図22は、第5のプラント監視装置1Eの入力異常監視処理結果の一例を示した図であって、入力変数の分散値が変化した場合のデータに適用した例を示している。
FIG. 22 is a diagram showing an example of the input abnormality monitoring processing result of the fifth
図22(a)が入力変数の測定値を示すグラフ、図22(b)が式(11)で算出される分散監視指標を示すグラフ、図22(c)が前記の分散変化仮説の採択率、すなわち異常検出率である。図22(c)では式(12)のnを200ステップ、異常検出率を算出する時間幅を400ステップとしている。図22によれば、異常が発生した1000ステップ目以降で異常検出率が大きく変化を始めており、破線で示された管理しきい値を超えた時点で異常と検出されている。 22A is a graph showing the measured values of the input variables, FIG. 22B is a graph showing the dispersion monitoring index calculated by the equation (11), and FIG. 22C is the adoption rate of the dispersion change hypothesis. That is, the abnormality detection rate. In FIG. 22C, n in the equation (12) is 200 steps, and the time width for calculating the abnormality detection rate is 400 steps. According to FIG. 22, the abnormality detection rate starts to change greatly after the 1000th step when an abnormality has occurred, and an abnormality is detected when the management threshold value indicated by the broken line is exceeded.
上述したように、本実施の形態によれば第1の実施の形態と同様の効果を奏する他、第1の実施の形態では検出できないプラントの入力変数の異常な変化も検出することができ、適用範囲をより拡大することができる。 As described above, according to the present embodiment, in addition to the same effects as the first embodiment, it is also possible to detect abnormal changes in plant input variables that cannot be detected in the first embodiment, The scope of application can be further expanded.
[第6の実施の形態]
本発明の第6の実施の形態に係るプラント監視装置およびプラント監視方法について説明する。尚、プラント監視装置1A,1B,1C,1D,1Eと同一の構成要素には同一の符号を付し、重複する説明は省略する。
[Sixth Embodiment]
A plant monitoring apparatus and a plant monitoring method according to a sixth embodiment of the present invention will be described. In addition, the same code | symbol is attached | subjected to the component same as
本発明の第6の実施の形態に係るプラント監視装置1Fの構成は、図1において、プラント監視装置1、監視モデル作成手段12および監視処理手段13を、それぞれ、プラント監視装置1F、監視モデル作成手段12Fおよび監視処理手段13Fと読み替えた構成である。すなわち、プラント監視装置1Fは、プラントデータ入力・保存手段11、監視モデル作成手段12Fおよび監視処理手段13Fを具備する。
The configuration of the
図23は、本発明の第6の実施の形態に係るプラント監視装置1Fと、プラント監視装置1Fが具備する監視モデル作成手段(以下、「第6の監視モデル作成手段」と称する。)12Fおよび監視処理手段13F(以下、「第6の監視処理手段」と称する。)の構成を示した概略図である。
FIG. 23 shows a
第6の監視モデル作成手段12Fは、図23に示されるように、主成分分析部51と、統計量データ特性評価部52と、入力変数特性評価部58を備えて構成される。また、第6の監視処理手段13Fは、第4の監視処理手段13Dと、入力異常監視処理手段60とを備えて構成される。
As shown in FIG. 23, the sixth monitoring
プラント監視装置1Fが実行する処理内容は、他のプラント監視装置1A,1B,1C,1D,1E等で実行される処理内容と同様に、まず、プラントデータ入力・保存手段11によるプラントデータ入力・保存ステップが実行され、続いて、第6の監視モデル作成手段12Fによる監視モデル作成・保存ステップ(以下、「第6の監視モデル作成・保存ステップ」と称する。)、続いて、第6の監視処理手段13Fによる監視処理ステップ(「第6の監視処理ステップ」と称する。)が実行される。
The processing content executed by the
第6の監視処理ステップが実行された後は、監視処理結果出力ステップおよび監視処理結果表示ステップが実行され、第6の監視処理手段13Fがプラント2の異常の有無の検出を行った結果が表示装置3の表示部に表示される。
After the sixth monitoring processing step is executed, the monitoring processing result output step and the monitoring processing result display step are executed, and the result of the sixth monitoring processing means 13F detecting whether there is an abnormality in the
第6の監視モデル作成・保存ステップのうち、主成分分析手段51および統計量データ特性評価部52が実行する処理内容は、第4の監視モデル作成・保存ステップと同様に実行される処理内容である。また、入力変数特性評価部58が実行する処理内容は、第5の監視モデル作成手段12Eによる監視モデル作成・保存ステップと同様に実行される処理内容である。
Of the sixth monitoring model creation / storage step, the processing contents executed by the principal component analysis means 51 and the statistic data
一方、第6の監視処理ステップのうち、第4の監視処理手段13Dが実行する処理内容については、第4の監視処理ステップと同様に実行される処理内容であり、入力異常監視処理手段60が実行する処理内容については、第5の監視処理ステップで説明したように、予め与えられた時間幅内における入力変数の分散値が正常状態における分散値と同じか否かを分散検定により監視する。 On the other hand, in the sixth monitoring processing step, the processing content executed by the fourth monitoring processing means 13D is the processing content executed in the same manner as the fourth monitoring processing step, and the input abnormality monitoring processing means 60 As to the processing content to be executed, as described in the fifth monitoring processing step, whether or not the variance value of the input variable within the predetermined time width is the same as the variance value in the normal state is monitored by variance test.
上述したように、本実施の形態によれば第4の実施の形態と同様の効果を奏する他、第4の実施の形態では検出できないプラントの入力変数の異常な変化も検出することができ、適用範囲をより拡大することができる。 As described above, according to this embodiment, in addition to the same effects as the fourth embodiment, it is also possible to detect abnormal changes in plant input variables that cannot be detected by the fourth embodiment, The scope of application can be further expanded.
また、上述した第2の実施の形態および第3の実施の形態においては、主成分分析の対象として、プラントの入力変数uと出力変数zの異なる時間の測定値より式(9)のように構成した監視変数xを用いたが、入出力関係が必ずしも明確ではないプラントにおいては全てを出力変数zとみなして、以下の式(13)又は(14)で示されるように、監視変数を構成してもよい。
[数14]
x(t)=z(t) ・・・(13)
又は
x(t)=[z(t−1) z(t)] ・・・(14)
Further, in the second embodiment and the third embodiment described above, as an object of principal component analysis, the measured values at different times of the plant input variable u and the output variable z are expressed as shown in Equation (9). In the plant where the configured monitoring variable x is used but the input / output relationship is not necessarily clear, all are regarded as the output variable z, and the monitoring variable is configured as shown in the following formula (13) or (14). May be.
[Formula 14]
x (t) = z (t) (13)
Or x (t) = [z (t−1) z (t)] (14)
さらに、プラント2の動特性に比べてプラントデータの入力時間間隔が短いような場合には、以下の式(15)で示されるように、より長い区間のデータで監視変数を構成してもよい。
[数15]
x(t)=[z(t−h) … z(t−1) z(t)] ・・・(15)
Furthermore, when the input time interval of the plant data is shorter than the dynamic characteristics of the
[Equation 15]
x (t) = [z (t−h)... z (t−1) z (t)] (15)
尚、本発明は上記の各実施形態そのままに限定されるものではなく、実施段階ではその要旨を逸脱しない範囲で構成要素を変形して具体化しても良い。例えば、図1に示すプラント監視装置1の例では、プラント監視装置1と表示装置3とは独立した装置として示されているが、一体的な装置として構成される場合もある。すなわち、プラント監視装置1は、表示装置3又はこれと同等の機能を有する表示手段を具備していても良い。
Note that the present invention is not limited to the above-described embodiments as they are, and may be embodied by modifying constituent elements without departing from the scope of the invention in the implementation stage. For example, in the example of the
また、上記の各実施形態に開示されている複数の構成要素の適宜な組み合わせにより、種々の発明を形成したり、実施形態に示される全構成要素から幾つかの構成要素を削除したりすることによって本発明を構成しても良い。 Also, various inventions can be formed by appropriately combining a plurality of constituent elements disclosed in the above embodiments, or some constituent elements can be deleted from all the constituent elements shown in the embodiments. The present invention may be configured as follows.
さらに、上述した各実施形態において記載した手法は、コンピュータに実行させることのできるプログラムとして、例えば磁気ディスク、光ディスク、半導体メモリなどの記憶媒体に書き込んで各種装置に適用したり、通信媒体により伝送して各種装置に適用することも可能である。本装置を実現するコンピュータは、記憶媒体に記録されたプログラムを読み込み、このプログラムによって動作が制御されることにより、上述した処理を実行する。 Further, the method described in each of the above-described embodiments is applied as a program that can be executed by a computer to a storage medium such as a magnetic disk, an optical disk, or a semiconductor memory and applied to various apparatuses, or transmitted by a communication medium. It can also be applied to various devices. A computer that implements the apparatus reads the program recorded in the storage medium, and executes the above-described processing by controlling the operation by the program.
1(1A〜1F) プラント監視装置
2 プラント
3 表示装置
4 入力手段
11 プラントデータ入力・保存手段
12(12A〜12F) 監視モデル作成手段
13(13A〜13F) 監視処理手段
21 出力誤差モデル同定部
22 第1の推定偏差特性評価部
25 第1の出力推定偏差算出部
26 第1の推定偏差検定処理部
27 仮説採択率判定部
31 第1の主成分分析部
32 第2の推定偏差特性評価部
35 第2の出力推定偏差算出部
36 第2の推定偏差検定処理部
41 第2の主成分分析部
42 主成分得点特性評価部
45 主成分得点算出部
46 主成分得点検定処理部
51 主成分分析部
52 統計量データ特性評価部
55 統計量データ算出部
56 統計量データ検定処理部
58 入力変数特性評価部
60 入力異常監視処理手段
61 統計量算出部
62 仮説検定処理部
1 (1A to 1F)
Claims (10)
前記プラントデータ入力・保存手段で保存された時系列データに基づいて監視モデルを作成する監視モデル作成手段と、
前記監視モデルを前記測定データに適用してプラント状態の正常/異常を判定し、当該判定結果を出力する監視処理手段と、を備えたプラント監視装置であって、
前記監視モデル作成手段は、前記時系列データを用いて出力誤差モデルを同定する出力誤差モデル同定部と、
前記出力誤差モデルを前記時系列データに適用して算出した前記出力変数の推定偏差の統計的特性を評価する推定偏差特性評価部と、を具備し、
前記監視処理手段は、前記測定データに前記出力誤差モデルを適用して前記出力変数の推定偏差を算出する出力推定偏差算出部と、
前記推定偏差に逐次確率比検定を適用して前記推定偏差の分散値変化仮説を検定する推定偏差検定処理部と、
前記推定偏差の分散値変化仮説の採択率に基づいてプラントの異常を監視する仮説採択率判定部と、
を具備することを特徴とするプラント監視装置。 Plant data input / storage means for inputting measured data of plant input variables and output variables and storing them as time series data,
Monitoring model creating means for creating a monitoring model based on the time-series data stored in the plant data input / storing means;
A monitoring processing unit that applies the monitoring model to the measurement data to determine normality / abnormality of a plant state and outputs the determination result;
The monitoring model creating means includes an output error model identifying unit that identifies an output error model using the time series data;
An estimated deviation characteristic evaluation unit that evaluates a statistical characteristic of the estimated deviation of the output variable calculated by applying the output error model to the time series data, and
The monitoring processing means applies an output error model to the measurement data to calculate an estimated deviation of the output variable;
An estimated deviation test processing unit that tests a variance value change hypothesis of the estimated deviation by applying a sequential probability ratio test to the estimated deviation;
A hypothesis adoption rate determination unit that monitors plant abnormalities based on the adoption rate of the variance variation hypothesis of the estimated deviation;
A plant monitoring apparatus comprising:
前記プラントデータ入力・保存手段で保存された時系列データに基づいて監視モデルを作成する監視モデル作成手段と、
前記監視モデルを前記測定データに適用してプラント状態の正常/異常を判定し、当該判定結果を出力する監視処理手段と、を備えたプラント監視装置であって、
前記監視モデル作成手段は前記時系列データに主成分分析を適用して寄与率の大きい複数の主成分に対する負荷行列を構成する主成分分析部と、
前記負荷行列を前記時系列データに適用して算出した推定偏差の統計的特性を評価する推定偏差特性評価部と、を具備し、
前記監視処理手段は、前記測定データに前記負荷行列を適用して推定偏差を算出する出力推定偏差部と、
前記推定偏差に逐次確率比検定を適用して前記推定偏差の分散値変化仮説を検定する推定偏差検定処理部と、
前記推定偏差の分散値変化仮説の採択率に基づいてプラントの異常を監視する仮説採択率判定部と、を具備することを特徴とするプラント監視装置。 Plant data input / storage means for inputting measured data of plant input variables and output variables and storing them as time series data,
Monitoring model creating means for creating a monitoring model based on the time-series data stored in the plant data input / storing means;
A monitoring processing unit that applies the monitoring model to the measurement data to determine normality / abnormality of a plant state and outputs the determination result;
The monitoring model creating means applies a principal component analysis to the time series data to constitute a load matrix for a plurality of principal components having a large contribution rate;
An estimated deviation characteristic evaluation unit that evaluates a statistical characteristic of the estimated deviation calculated by applying the load matrix to the time series data; and
The monitoring processing means includes an output estimated deviation unit that calculates an estimated deviation by applying the load matrix to the measurement data;
An estimated deviation test processing unit that tests a variance value change hypothesis of the estimated deviation by applying a sequential probability ratio test to the estimated deviation;
A hypothesis adoption rate determination unit that monitors a plant abnormality based on an adoption rate of a variance value change hypothesis of the estimated deviation.
前記プラントデータ入力・保存手段で保存された時系列データに基づいて監視モデルを作成する監視モデル作成手段と、
前記監視モデルを前記測定データに適用してプラント状態の正常/異常を判定し、当該判定結果を出力する監視処理手段と、を備えたプラント監視装置であって、
前記監視モデル作成手段は前記時系列データに主成分分析を適用して寄与率の小さい複数の主成分に対する負荷行列を構成する主成分分析部と、
前記負荷行列を前記時系列データに適用して算出した主成分得点の統計的特性を評価する主成分得点特性評価部と、を具備し、
前記監視処理手段は、前記測定データに前記負荷行列を適用して主成分得点を算出する主成分得点算出部と、
前記主成分得点に逐次確率比検定を適用して前記主成分得点の分散値変化仮説を検定する主成分得点検定処理部と、
前記主成分得点の分散値変化仮説の採択率に基づいてプラントの異常を監視する仮説採択率判定部と、を具備することを特徴とするプラント監視装置。 Plant data input / storage means for inputting measured data of plant input variables and output variables and storing them as time series data,
Monitoring model creating means for creating a monitoring model based on the time-series data stored in the plant data input / storing means;
A monitoring processing unit that applies the monitoring model to the measurement data to determine normality / abnormality of a plant state and outputs the determination result;
The monitoring model creating means applies a principal component analysis to the time series data to constitute a load matrix for a plurality of principal components having a small contribution rate;
A principal component score characteristic evaluation unit that evaluates a statistical characteristic of the principal component score calculated by applying the load matrix to the time series data, and
The monitoring processing means includes a principal component score calculation unit that calculates a principal component score by applying the load matrix to the measurement data;
A principal component score test processing unit that tests a variance value change hypothesis of the principal component score by applying a sequential probability ratio test to the principal component score;
A hypothesis adoption rate determination unit that monitors a plant abnormality based on an acceptance rate of a variance value change hypothesis of the principal component score.
前記プラントデータ入力・保存手段で保存された時系列データに基づいて監視モデルを作成する監視モデル作成手段と、
前記監視モデルを前記測定データに適用してプラント状態の正常/異常を判定し、当該判定結果を出力する監視処理手段と、を備えたプラント監視装置であって、
前記監視モデル作成手段は前記時系列データに主成分分析を適用して寄与率の大きな複数の主成分に対する第1の負荷行列を構成する第1の主成分分析部と、
前記主成分分析の結果から寄与率の小さな複数の主成分に対する第2の負荷行列を構成する第2の主成分分析部と、
前記第1の負荷行列を前記時系列データに適用して算出した推定偏差の統計的特性を評価する推定偏差特性評価部と、
前記第2の負荷行列を前記時系列データに適用して算出した主成分得点の統計的特性を評価する主成分得点特性評価部と、を具備し、
前記監視処理手段は前記測定データに前記第1の負荷行列を適用して推定偏差を算出する推定偏差算出部と、
前記測定データに前記第2の負荷行列を適用して主成分得点を算出する主成分得点算出部と、
前記推定偏差に逐次確率比検定を適用して前記推定偏差の分散値変化仮説を検定する推定偏差検定処理部と、
前記主成分得点に逐次確率比検定を適用して前記主成分得点の分散値変化仮説を検定する主成分得点検定処理部と、
前記推定偏差の分散値変化仮説の採択率および主成分得点の分散値変化仮説の採択率に基づいてプラントの異常を監視する仮説採択率判定部と、を具備することを特徴とするプラント監視装置。 Plant data input / storage means for inputting measured data of plant input variables and output variables and storing them as time series data,
Monitoring model creating means for creating a monitoring model based on the time-series data stored in the plant data input / storing means;
A monitoring processing unit that applies the monitoring model to the measurement data to determine normality / abnormality of a plant state and outputs the determination result;
The monitoring model creating means applies a principal component analysis to the time series data to form a first load matrix for a plurality of principal components having a large contribution rate;
A second principal component analysis unit constituting a second load matrix for a plurality of principal components having a small contribution rate from the result of the principal component analysis;
An estimated deviation characteristic evaluation unit that evaluates a statistical characteristic of the estimated deviation calculated by applying the first load matrix to the time series data;
A principal component score characteristic evaluation unit that evaluates a statistical characteristic of the principal component score calculated by applying the second load matrix to the time-series data; and
The monitoring processing means applies an estimated deviation by applying the first load matrix to the measurement data;
A principal component score calculating unit for calculating a principal component score by applying the second load matrix to the measurement data;
An estimated deviation test processing unit that tests a variance value change hypothesis of the estimated deviation by applying a sequential probability ratio test to the estimated deviation;
A principal component score test processing unit that tests a variance value change hypothesis of the principal component score by applying a sequential probability ratio test to the principal component score;
And a hypothesis adoption rate determination unit that monitors plant abnormalities based on the adoption rate of the variance deviation hypothesis of the estimated deviation and the adoption rate of the variance change hypothesis of the principal component score. .
前記プラントデータ入力保存ステップで保存された時系列データに基づいて監視モデルを作成する監視モデル作成ステップと、
前記監視モデルを前記測定データに適用してプラント状態の正常/異常を判定し、当該判定結果を出力する監視処理ステップと、を備えるプラント監視方法であって、
前記監視モデル作成ステップは、前記時系列データを用いて出力誤差モデルを同定する出力誤差モデル同定ステップと、
前記出力誤差モデルを前記時系列データに適用して算出した前記出力変数の推定偏差の統計的特性を評価する推定偏差特性評価ステップと、を具備し、
前記出力監視処理ステップは、前記測定データに前記出力誤差モデルを適用して前記出力変数の推定偏差を算出する出力推定偏差算出ステップと、
前記推定偏差に逐次確率比検定を適用して前記推定偏差の分散値変化仮説を検定する推定偏差検定処理ステップと、
前記分散値変化仮説の採択率に基づいてプラントの異常を監視する仮説採択率判定ステップと、を具備することを特徴とするプラント監視方法。 A plant data input saving step for inputting measurement data of plant input variables and output variables and saving them as time series data,
A monitoring model creating step for creating a monitoring model based on the time-series data saved in the plant data input saving step;
A monitoring process step of applying the monitoring model to the measurement data to determine normality / abnormality of the plant state and outputting the determination result,
The monitoring model creation step includes an output error model identification step for identifying an output error model using the time series data;
An estimated deviation characteristic evaluation step for evaluating a statistical characteristic of an estimated deviation of the output variable calculated by applying the output error model to the time series data, and
The output monitoring processing step calculates an estimated deviation of the output variable by applying the output error model to the measurement data,
An estimated deviation test processing step of testing a variance value change hypothesis of the estimated deviation by applying a sequential probability ratio test to the estimated deviation;
A hypothesis adoption rate determination step for monitoring a plant abnormality based on the adoption rate of the variance value change hypothesis.
前記プラントデータ入力保存ステップで保存された時系列データに基づいて監視モデルを作成する監視モデル作成ステップと、
前記監視モデルを前記測定データに適用してプラント状態の正常/異常を判定し、当該判定結果を出力する監視処理ステップと、を備えるプラント監視方法であって、
前記監視モデル作成ステップは前記時系列データに主成分分析を適用して寄与率の大きな複数の主成分に対する第1の負荷行列を構成する第1の主成分分析ステップと、
前記第1の負荷行列を前記時系列データに適用して算出した推定偏差の統計的特性を評価する推定偏差特性評価ステップと、を具備し、
前記出力監視処理ステップは、前記測定データに前記負荷行列を適用して推定偏差を算出する出力推定偏差ステップと、
前記推定偏差に逐次確率比検定を適用して前記推定偏差の分散値変化仮説を検定する推定偏差検定処理ステップと、
前記推定偏差の分散値変化仮説の採択率に基づいてプラントの異常を監視する第1の仮説採択率判定ステップと、を具備することを特徴とするプラント監視方法。 A plant data input saving step for inputting measurement data of plant input variables and output variables and saving them as time series data,
A monitoring model creating step for creating a monitoring model based on the time-series data saved in the plant data input saving step;
A monitoring process step of applying the monitoring model to the measurement data to determine normality / abnormality of the plant state and outputting the determination result,
The monitoring model creation step includes applying a principal component analysis to the time series data to form a first load matrix for a plurality of principal components having a large contribution rate;
An estimated deviation characteristic evaluation step for evaluating a statistical characteristic of the estimated deviation calculated by applying the first load matrix to the time series data, and
The output monitoring processing step includes an output estimated deviation step of calculating an estimated deviation by applying the load matrix to the measurement data;
An estimated deviation test processing step of testing a variance value change hypothesis of the estimated deviation by applying a sequential probability ratio test to the estimated deviation;
And a first hypothesis adoption rate determination step of monitoring a plant abnormality based on an adoption rate of the estimated deviation variance change hypothesis.
前記第2の負荷行列を前記時系列データに適用して算出した主成分得点の統計的特性を評価する主成分得点特性評価ステップとをさらに備え、
前記出力監視処理ステップは、前記測定データに前記第2の負荷行列を適用して主成分得点を算出する主成分得点算出ステップと、
前記主成分得点に逐次確率比検定を適用して前記主成分得点の分散値変化仮説を検定する主成分得点検定処理ステップと、
前記主成分得点の分散値変化仮説の採択率に基づいてプラントの異常を監視する第2の仮説採択率判定ステップとをさらに備えたことを特徴とする請求項8記載のプラント監視方法。 The monitoring model creation step includes applying a principal component analysis to the time series data to configure a second load matrix for a plurality of principal components having a small contribution rate;
A principal component score characteristic evaluation step for evaluating a statistical characteristic of the principal component score calculated by applying the second load matrix to the time series data;
The output monitoring processing step includes a principal component score calculating step of calculating a principal component score by applying the second load matrix to the measurement data;
A principal component score test processing step of testing a variance value change hypothesis of the principal component score by applying a sequential probability ratio test to the principal component score;
9. The plant monitoring method according to claim 8, further comprising a second hypothesis adoption rate determination step of monitoring an abnormality of the plant based on an acceptance rate of the variance value change hypothesis of the principal component score.
Priority Applications (1)
| Application Number | Priority Date | Filing Date | Title |
|---|---|---|---|
| JP2008211088A JP4922265B2 (en) | 2008-08-19 | 2008-08-19 | Plant monitoring apparatus and plant monitoring method |
Applications Claiming Priority (1)
| Application Number | Priority Date | Filing Date | Title |
|---|---|---|---|
| JP2008211088A JP4922265B2 (en) | 2008-08-19 | 2008-08-19 | Plant monitoring apparatus and plant monitoring method |
Publications (2)
| Publication Number | Publication Date |
|---|---|
| JP2010049359A JP2010049359A (en) | 2010-03-04 |
| JP4922265B2 true JP4922265B2 (en) | 2012-04-25 |
Family
ID=42066408
Family Applications (1)
| Application Number | Title | Priority Date | Filing Date |
|---|---|---|---|
| JP2008211088A Active JP4922265B2 (en) | 2008-08-19 | 2008-08-19 | Plant monitoring apparatus and plant monitoring method |
Country Status (1)
| Country | Link |
|---|---|
| JP (1) | JP4922265B2 (en) |
Cited By (4)
| Publication number | Priority date | Publication date | Assignee | Title |
|---|---|---|---|---|
| JP2018014093A (en) * | 2016-07-06 | 2018-01-25 | Jfeスチール株式会社 | Process state diagnosis method and state diagnosis device |
| US11112782B2 (en) | 2017-06-19 | 2021-09-07 | Jfe Steel Corporation | Process anomalous state diagnostic device and process anomalous state diagnosis method |
| WO2022085350A1 (en) | 2020-10-22 | 2022-04-28 | Jfeスチール株式会社 | Method for building abnormality diagnosis model, abnormality diagnosis method, device for building abnormality diagnosis model, and abnormality diagnosis device |
| WO2022091639A1 (en) | 2020-10-27 | 2022-05-05 | Jfeスチール株式会社 | Abnormality diagnosing model construction method, abnormality diagnosing method, abnormality diagnosing model construction device, and abnormality diagnosing device |
Families Citing this family (4)
| Publication number | Priority date | Publication date | Assignee | Title |
|---|---|---|---|---|
| US8892382B2 (en) * | 2011-09-26 | 2014-11-18 | General Electric Company | Systems and methods for condition-based power plant sensor calibration |
| JP2016031568A (en) * | 2014-07-28 | 2016-03-07 | 株式会社Ihi | Abnormality diagnosis apparatus, abnormality diagnosis method, and abnormality diagnosis program |
| KR102492514B1 (en) * | 2022-10-21 | 2023-01-30 | 가온플랫폼 주식회사 | Alarm method using sequential probability ratio |
| CN116384817B (en) * | 2023-03-30 | 2024-01-09 | 沧州市农林科学院 | Method for evaluating stress resistance of plants |
Family Cites Families (3)
| Publication number | Priority date | Publication date | Assignee | Title |
|---|---|---|---|---|
| JP2721799B2 (en) * | 1994-04-14 | 1998-03-04 | 四国電力株式会社 | Machine abnormality judgment method |
| JP4046309B2 (en) * | 1999-03-12 | 2008-02-13 | 株式会社東芝 | Plant monitoring device |
| JP2001356818A (en) * | 2000-06-12 | 2001-12-26 | Mitsubishi Heavy Ind Ltd | On-line maintenance device for in-plant detector |
-
2008
- 2008-08-19 JP JP2008211088A patent/JP4922265B2/en active Active
Cited By (4)
| Publication number | Priority date | Publication date | Assignee | Title |
|---|---|---|---|---|
| JP2018014093A (en) * | 2016-07-06 | 2018-01-25 | Jfeスチール株式会社 | Process state diagnosis method and state diagnosis device |
| US11112782B2 (en) | 2017-06-19 | 2021-09-07 | Jfe Steel Corporation | Process anomalous state diagnostic device and process anomalous state diagnosis method |
| WO2022085350A1 (en) | 2020-10-22 | 2022-04-28 | Jfeスチール株式会社 | Method for building abnormality diagnosis model, abnormality diagnosis method, device for building abnormality diagnosis model, and abnormality diagnosis device |
| WO2022091639A1 (en) | 2020-10-27 | 2022-05-05 | Jfeスチール株式会社 | Abnormality diagnosing model construction method, abnormality diagnosing method, abnormality diagnosing model construction device, and abnormality diagnosing device |
Also Published As
| Publication number | Publication date |
|---|---|
| JP2010049359A (en) | 2010-03-04 |
Similar Documents
| Publication | Publication Date | Title |
|---|---|---|
| JP4922265B2 (en) | Plant monitoring apparatus and plant monitoring method | |
| US10747188B2 (en) | Information processing apparatus, information processing method, and, recording medium | |
| JP5306902B2 (en) | System and method for high performance condition monitoring of asset systems | |
| JP5179086B2 (en) | Industrial process monitoring method and monitoring system | |
| JP4046309B2 (en) | Plant monitoring device | |
| CN111459700A (en) | Method and apparatus for diagnosing device failure, diagnostic device, and storage medium | |
| US11657121B2 (en) | Abnormality detection device, abnormality detection method and computer readable medium | |
| JP3651693B2 (en) | Plant monitoring diagnosis apparatus and method | |
| JP6521096B2 (en) | Display method, display device, and program | |
| US20190265088A1 (en) | System analysis method, system analysis apparatus, and program | |
| KR20190025474A (en) | Apparatus and Method for Predicting Plant Data | |
| WO2017138238A1 (en) | Monitoring device, and method for controlling monitoring device | |
| JP6164311B1 (en) | Information processing apparatus, information processing method, and program | |
| TWI755794B (en) | Abnormality diagnosis method, abnormality diagnosis apparatus, and abnormality diagnosis program | |
| WO2019087508A1 (en) | Monitoring target selecting device, monitoring target selecting method and program | |
| US7949497B2 (en) | Machine condition monitoring using discontinuity detection | |
| JP7604486B2 (en) | Abnormal modulation cause identification device, abnormal modulation cause identification method, and abnormal modulation cause identification program | |
| JP6915693B2 (en) | System analysis method, system analyzer, and program | |
| WO2017138239A1 (en) | Monitoring device, and method for controlling monitoring device | |
| EP3999983B1 (en) | Time-series data condensation and graphical signature analysis | |
| JP6734362B2 (en) | Monitoring device, monitoring method, program | |
| KR102340395B1 (en) | Apparatus for diagnosing plant failure and method therefor | |
| JP2016080585A (en) | Plant state analysis device | |
| JP6973445B2 (en) | Display method, display device, and program | |
| JP5948998B2 (en) | Abnormality diagnosis device |
Legal Events
| Date | Code | Title | Description |
|---|---|---|---|
| RD04 | Notification of resignation of power of attorney |
Free format text: JAPANESE INTERMEDIATE CODE: A7424 Effective date: 20100424 |
|
| A621 | Written request for application examination |
Free format text: JAPANESE INTERMEDIATE CODE: A621 Effective date: 20101214 |
|
| A977 | Report on retrieval |
Free format text: JAPANESE INTERMEDIATE CODE: A971007 Effective date: 20111220 |
|
| RD01 | Notification of change of attorney |
Free format text: JAPANESE INTERMEDIATE CODE: A7421 Effective date: 20111217 |
|
| TRDD | Decision of grant or rejection written | ||
| A01 | Written decision to grant a patent or to grant a registration (utility model) |
Free format text: JAPANESE INTERMEDIATE CODE: A01 Effective date: 20120110 |
|
| A01 | Written decision to grant a patent or to grant a registration (utility model) |
Free format text: JAPANESE INTERMEDIATE CODE: A01 |
|
| A61 | First payment of annual fees (during grant procedure) |
Free format text: JAPANESE INTERMEDIATE CODE: A61 Effective date: 20120203 |
|
| R151 | Written notification of patent or utility model registration |
Ref document number: 4922265 Country of ref document: JP Free format text: JAPANESE INTERMEDIATE CODE: R151 |
|
| FPAY | Renewal fee payment (event date is renewal date of database) |
Free format text: PAYMENT UNTIL: 20150210 Year of fee payment: 3 |