JP2019219415A - Test strip and method of reading test strip - Google Patents
Test strip and method of reading test strip Download PDFInfo
- Publication number
- JP2019219415A JP2019219415A JP2019155196A JP2019155196A JP2019219415A JP 2019219415 A JP2019219415 A JP 2019219415A JP 2019155196 A JP2019155196 A JP 2019155196A JP 2019155196 A JP2019155196 A JP 2019155196A JP 2019219415 A JP2019219415 A JP 2019219415A
- Authority
- JP
- Japan
- Prior art keywords
- color
- area
- test strip
- reaction
- image
- Prior art date
- Legal status (The legal status is an assumption and is not a legal conclusion. Google has not performed a legal analysis and makes no representation as to the accuracy of the status listed.)
- Granted
Links
Images


Classifications
-
- G—PHYSICS
- G01—MEASURING; TESTING
- G01N—INVESTIGATING OR ANALYSING MATERIALS BY DETERMINING THEIR CHEMICAL OR PHYSICAL PROPERTIES
- G01N21/00—Investigating or analysing materials by the use of optical means, i.e. using sub-millimetre waves, infrared, visible or ultraviolet light
- G01N21/84—Systems specially adapted for particular applications
- G01N21/8483—Investigating reagent band
-
- G—PHYSICS
- G01—MEASURING; TESTING
- G01N—INVESTIGATING OR ANALYSING MATERIALS BY DETERMINING THEIR CHEMICAL OR PHYSICAL PROPERTIES
- G01N33/00—Investigating or analysing materials by specific methods not covered by groups G01N1/00 - G01N31/00
- G01N33/48—Biological material, e.g. blood, urine; Haemocytometers
- G01N33/50—Chemical analysis of biological material, e.g. blood, urine; Testing involving biospecific ligand binding methods; Immunological testing
- G01N33/5005—Chemical analysis of biological material, e.g. blood, urine; Testing involving biospecific ligand binding methods; Immunological testing involving human or animal cells
- G01N33/5094—Chemical analysis of biological material, e.g. blood, urine; Testing involving biospecific ligand binding methods; Immunological testing involving human or animal cells for blood cell populations
-
- G—PHYSICS
- G01—MEASURING; TESTING
- G01N—INVESTIGATING OR ANALYSING MATERIALS BY DETERMINING THEIR CHEMICAL OR PHYSICAL PROPERTIES
- G01N33/00—Investigating or analysing materials by specific methods not covered by groups G01N1/00 - G01N31/00
- G01N33/48—Biological material, e.g. blood, urine; Haemocytometers
- G01N33/50—Chemical analysis of biological material, e.g. blood, urine; Testing involving biospecific ligand binding methods; Immunological testing
- G01N33/66—Chemical analysis of biological material, e.g. blood, urine; Testing involving biospecific ligand binding methods; Immunological testing involving blood sugars, e.g. galactose
-
- G—PHYSICS
- G06—COMPUTING OR CALCULATING; COUNTING
- G06F—ELECTRIC DIGITAL DATA PROCESSING
- G06F18/00—Pattern recognition
- G06F18/20—Analysing
- G06F18/22—Matching criteria, e.g. proximity measures
-
- G—PHYSICS
- G06—COMPUTING OR CALCULATING; COUNTING
- G06T—IMAGE DATA PROCESSING OR GENERATION, IN GENERAL
- G06T7/00—Image analysis
- G06T7/0002—Inspection of images, e.g. flaw detection
- G06T7/0012—Biomedical image inspection
-
- G—PHYSICS
- G06—COMPUTING OR CALCULATING; COUNTING
- G06T—IMAGE DATA PROCESSING OR GENERATION, IN GENERAL
- G06T7/00—Image analysis
- G06T7/90—Determination of colour characteristics
-
- G—PHYSICS
- G01—MEASURING; TESTING
- G01N—INVESTIGATING OR ANALYSING MATERIALS BY DETERMINING THEIR CHEMICAL OR PHYSICAL PROPERTIES
- G01N21/00—Investigating or analysing materials by the use of optical means, i.e. using sub-millimetre waves, infrared, visible or ultraviolet light
- G01N21/84—Systems specially adapted for particular applications
- G01N21/8483—Investigating reagent band
- G01N2021/8488—Investigating reagent band the band presenting reference patches
-
- G—PHYSICS
- G01—MEASURING; TESTING
- G01N—INVESTIGATING OR ANALYSING MATERIALS BY DETERMINING THEIR CHEMICAL OR PHYSICAL PROPERTIES
- G01N21/00—Investigating or analysing materials by the use of optical means, i.e. using sub-millimetre waves, infrared, visible or ultraviolet light
- G01N21/75—Systems in which material is subjected to a chemical reaction, the progress or the result of the reaction being investigated
- G01N21/77—Systems in which material is subjected to a chemical reaction, the progress or the result of the reaction being investigated by observing the effect on a chemical indicator
- G01N21/78—Systems in which material is subjected to a chemical reaction, the progress or the result of the reaction being investigated by observing the effect on a chemical indicator producing a change of colour
-
- Y—GENERAL TAGGING OF NEW TECHNOLOGICAL DEVELOPMENTS; GENERAL TAGGING OF CROSS-SECTIONAL TECHNOLOGIES SPANNING OVER SEVERAL SECTIONS OF THE IPC; TECHNICAL SUBJECTS COVERED BY FORMER USPC CROSS-REFERENCE ART COLLECTIONS [XRACs] AND DIGESTS
- Y10—TECHNICAL SUBJECTS COVERED BY FORMER USPC
- Y10T—TECHNICAL SUBJECTS COVERED BY FORMER US CLASSIFICATION
- Y10T436/00—Chemistry: analytical and immunological testing
- Y10T436/14—Heterocyclic carbon compound [i.e., O, S, N, Se, Te, as only ring hetero atom]
- Y10T436/142222—Hetero-O [e.g., ascorbic acid, etc.]
- Y10T436/143333—Saccharide [e.g., DNA, etc.]
- Y10T436/144444—Glucose
Landscapes
- Engineering & Computer Science (AREA)
- Health & Medical Sciences (AREA)
- Life Sciences & Earth Sciences (AREA)
- General Physics & Mathematics (AREA)
- Physics & Mathematics (AREA)
- Immunology (AREA)
- Chemical & Material Sciences (AREA)
- Molecular Biology (AREA)
- General Health & Medical Sciences (AREA)
- Theoretical Computer Science (AREA)
- Hematology (AREA)
- Biochemistry (AREA)
- Analytical Chemistry (AREA)
- Pathology (AREA)
- Urology & Nephrology (AREA)
- Biomedical Technology (AREA)
- Computer Vision & Pattern Recognition (AREA)
- Cell Biology (AREA)
- Microbiology (AREA)
- Data Mining & Analysis (AREA)
- Medicinal Chemistry (AREA)
- Food Science & Technology (AREA)
- Biotechnology (AREA)
- Diabetes (AREA)
- Artificial Intelligence (AREA)
- Medical Informatics (AREA)
- Radiology & Medical Imaging (AREA)
- Tropical Medicine & Parasitology (AREA)
- Quality & Reliability (AREA)
- Ecology (AREA)
- Nuclear Medicine, Radiotherapy & Molecular Imaging (AREA)
- Bioinformatics & Cheminformatics (AREA)
- Bioinformatics & Computational Biology (AREA)
- Evolutionary Biology (AREA)
- Evolutionary Computation (AREA)
- General Engineering & Computer Science (AREA)
- Investigating Or Analysing Materials By The Use Of Chemical Reactions (AREA)
- Spectrometry And Color Measurement (AREA)
- Investigating Or Analysing Biological Materials (AREA)
Abstract
Description
一般に、本発明は、試験紙に塗布された1以上の検体の光分析に関する。 In general, the invention relates to optical analysis of one or more analytes applied to a test strip.
図1は、反応領域102を備えた従来の標本試験紙100を示す。反応領域102は、血液サンプル中のグルコース等の標本サンプル中の検体に反応する検体を含有する。標本サンプルが反応領域102に到達すると、反応領域102は、血液中のグルコース等の検体の特性に応じて色彩を変化させる。ユーザは、反応領域102の色彩を検体の特性と関連付けるために、図面104の反応領域102の色彩と視覚により比較する。また、ユーザは、標本試験紙100を計量器内に挿入し、光学的に検体の特性を測定する。
FIG. 1 shows a conventional
本開示の一態様によれば、標本サンプル中の検体の特性を検査するための標本試験紙には、標本サンプルを受け取るように構成された反応領域と、標本サンプルを受け取った後、反応領域の色彩を測定するように構成された色彩較正領域とが設けられている。幾つかの実施形態では、多数の反応領域が設けられ、それぞれ検体の特性値の異なる範囲を検出するように構成されている。 According to one aspect of the present disclosure, a specimen test strip for examining a property of a specimen in a specimen sample includes a reaction area configured to receive the specimen sample, and a reaction area configured to receive the specimen sample. A color calibration area configured to measure color. In some embodiments, multiple reaction zones are provided, each configured to detect a different range of analyte characteristic values.
本開示の他の態様によれば、標本サンプル中の検体の特性を検出するために、標本試験紙を読み取る撮像装置を備えたコンピュータのための方法が提供されている。幾つかの実施形態では、その方法は、1以上の標本試験紙の画像を取り込むステップを備えており、各画像は試験紙の反応領域と色彩較正領域とを含む。これらの実施形態では、その方法はさらに、色彩較正領域に基づいて1以上の画像から反応領域の色彩を測定することと、反応領域の色彩を検体の特性値に関連付けることとを備える。 According to another aspect of the present disclosure, a method is provided for a computer with an imaging device that reads a specimen test strip to detect characteristics of an analyte in a specimen sample. In some embodiments, the method includes capturing images of one or more specimen test strips, each image including a test strip reaction area and a color calibration area. In these embodiments, the method further comprises measuring a color of the reaction region from the one or more images based on the color calibration region, and associating the color of the reaction region with a characteristic value of the analyte.
幾つかの実施形態では、標本試験紙の少なくとも2つの画像を取り込むことを備えた方法が提供されており、各画像は反応領域を含む。その方法はさらに、画像から反応領域の色彩強度の変化を決定することと、画像が取り込まれるときの時間の違いを測定することとを備える。またその方法は、色彩強度の変化と、検体の特性値の時間変位とを関連付けることとを備える。 In some embodiments, a method is provided that comprises capturing at least two images of a specimen test strip, wherein each image includes a reaction area. The method further comprises determining a change in the color intensity of the reaction area from the image and measuring a difference in time when the image is captured. The method also includes associating a change in color intensity with a temporal displacement of a characteristic value of the specimen.
幾つかの実施形態では、標本試験紙の第1画像を取り込むことを備える方法が提供されている。その画像は、反応領域を有し、各反応領域は異なる範囲の検体の特性値を検出するように構成されている。その方法はさらに、反応領域の1つを選択することと、選択された反応領域を検体の特性値に関連付けることとを備える。 In some embodiments, a method is provided that comprises capturing a first image of a specimen test strip. The image has reaction regions, each reaction region configured to detect a different range of analyte characteristic values. The method further comprises selecting one of the reaction regions and associating the selected reaction region with a characteristic value of the analyte.
図2は、本開示の1以上の例に於ける、標本試験紙200の実施形態を示す。標本試験紙200は、標本サンプルを受け取るための反応領域202を有する。反応領域202は、標本サンプル中の検体と化学的に反応する試薬を有し、標本サンプル中の検体の特性値に比例した1以上の色彩パラメータを生成する。幾つかの実施形態では、1以上の色彩パラメータは、反応領域202の色彩、又は、色彩及び色彩強度を有する。一例では、色彩は反応領域202の色調であり、色彩強度は反応領域202の明度である。色調及び明度は、色調、彩度、及び明度(HSL)の色彩スペースでの色彩要素であり、それらはカメラによって取り込まれた赤、緑及び青(RGB)の画素数である。便宜上、色彩及び色彩強度はまとめて色彩として言及する。試薬は、特定の検体であってもよいし、1以上の酵素、1以上の抗体、又は、1以上の色素を有してもよい。例えば、血液中のグルコースの検査のための試薬は、グルコースオキシダーゼ、ヘテロポリ酸、及び、テトラジルアミン硝酸ソーダを有してもよい。
FIG. 2 illustrates an embodiment of a
一例では、標本試験紙200は、その一部である色彩較正領域204を有する。一例では、色彩較正領域204は、明度の相違する条件下で反応領域202の色彩を測定するために使用されている。そのような例では、色彩較正領域204は、公知の色彩サンプルの配置を有する色彩グラフであってもよい。他の例では、色彩較正領域204は、光条件の効果を除去するために反応領域202の検査色彩を補正するために使用される。そのような例では、色彩較正領域204は色彩補正のためのホワイトバランス基準値として機能する公知の基準値(例えば、18%)のグレーカードであってもよい。またグレーカード204は、コンピュータ210が標本試験紙200の画像212を取り込むときの露出基準値として機能させてもよい。一例では、色彩グラフすなわちグレーカード204は標本試験紙200に印刷されている。
In one example, the
一例では、色彩較正領域204は、1以上の公知の色彩を有するダミー反応領域である。使用中、ダミー反応領域204は、1以上の酵素、1以上の抗体、又は、1以上の色素が欠けているため、同一色彩を維持する。他の例では、ダミーの反応領域204は、いかなる標本サンプルをも受け取ることがないので同一色彩を維持する。
In one example,
一例では、標本試験紙200は、反応領域202と色彩較正領域204とに沿う標本試験紙200の一部である温度較正領域206を有する。温度較正領域206は、その温度に従って色彩を変化させ、試薬と検体の間の化学反応が標本試験紙200の温度の影響を受けるので、反応領域202の色彩を補正するために使用される。一例では、温度較正領域206は、熱変色性色素(例えば、スピロラクトン、フルオラン、スピロピラン又はフルギト類等)、ロイコ色素等の有機材料、二酸化チタン、酸化亜鉛又は酸化インジウム等の無機材料、あるいは、熱変色性液晶媒体を含有する。他の実施形態では、温度較正領域206は、温度を示すチップ、機械的装置、あるいは、電気機械装置である。温度較正領域206に代えて、あるいは、これに加えて、コンピュータ210は、反応領域202の温度を概算するか、あるいは、測定する内蔵温度センサを使用してもよい。
In one example, the
コンピュータ210で撮像装置208を使用することにより、ユーザは反応領域202、色彩較正領域204及び温度較正領域206の画像212の少なくともいずれか1つを取り込む。撮像装置208は、カメラ、センサあるいは他の同様な装置であればよく、コンピュータ210は、スマートフォン、タブレットコンピュータ、ラップトップパソコン、デスクトップパソコンあるいは他の同様な装置であればよい。コンピュータ210は、反応領域202の色彩から検体の特性を決定するために、画像212を分析する診断アプリケーションを実行する。
By using the
一例では、診断アプリケーションケーションは、画像212中の色彩較正領域204を使用して反応領域202の色彩を決定する。色彩較正領域204が色彩グラフであれば、診断アプリケーションは、反応領域202の色彩を決定するために、反応領域202の全部又は一部の色彩を、色彩較正領域204の公知の色彩サンプルの1つと比較する。また診断アプリケーションは、色彩グラフ204がその公知の色彩と比較し、反応領域202の色彩の全部又は一部を読み取るまで画像212を処理する。色彩領域204がグレーカードであれば、診断アプリケーションは、画像212内のグレーカード204が適切なホワイトバランスを有し、反応領域202の色彩を読み取るまで画像212を処理する。
In one example, the diagnostic application uses the
他の例では、診断アプリケーションは、画像212中の色彩較正領域204を使用して反応領域202の色彩を決定し、画像212中の温度較正領域206を使用して色彩を補正する。診断アプリケーションは、温度較正領域206又はコンピュータ210の内蔵温度センサから標本試験紙200の温度を決定し、反応領域202の温度と色彩との間の公知の関係を使用して、反応領域の色彩を温度に補正する。この関係は、実験的、数学的あるいはその両方によって決定してもよい。診断アプリケーションは、本開示に記載された他のどのような補正の前後であっても、温度較正領域206を使用して色彩の補正を実行するようにしてもよい。
In another example, the diagnostic application uses the
一例では、診断アプリケーションは、色彩補正領域204及び温度補正領域206を使用する前に、画像212の照度を測定する。診断アプリケーションは、照度が均一であるか否かを決定するために、反応領域202の照明プロファイルを評価する。診断アプリケーションは、反応領域202又は色彩較正領域204(例えば、図5中、対向するコーナーピクセル506及び508)にわたる少なくとも2つの位置のRGB値から照明プロファイルを決定する。2つの位置の間の照明プロファイルが閾値によるノイズレベルよりも大きいとき(例えば、照明プロファイルがノイズレベルの2倍のとき)、反応領域202の照度は均一ではなく、診断アプリケーションは画像212の照度を補正する。一例では、診断アプリケーションは画像212の照度を補正するために以下の数式を使用する。
新RGB=i×(R(x,y), G(x,y), B(x,y))/(R est (x,y), G est (x,y), B est (x,y))
R(x,y), G(x,y), B(x,y)は、ピクセルの初期RGB値であり、R est (x,y), G est (x,y), B est (x,y)は、同一ピクセルでの照明プロファイルの評価RGB値であり、iは、反応領域の色彩の最大RGB値である。
例えば、色彩較正領域204は、反応領域102周囲のホワイトリングを含んでもよい。画像212では、コーナー506のRGB値は(200,200,200)であり、コーナー508のRGB値は(100,100,100)であると仮定される。さらに、照明プロファイルは直線であると仮定される。これらの仮定に基づけば、図5の反応領域502に於ける中心ピクセル510のホワイトポイントは(150,150,150)のRGB値を有することになる。ピクセル510の色彩が白色でなく、代わりに(125,75,75)のRGB値を有すると言われるとき、中心点の新RGB値はi×(125,75,75)/(150,150,150)であり、iは(255,255,255)である。
In one example, the diagnostic application measures the illuminance of the
New RGB = i × (R (x, y), G (x, y), B (x, y)) / (R est (x, y), G est (x, y), B est (x, y))
R (x, y), G (x, y), B (x, y) are the initial RGB values of the pixel, and are Rest (x, y), Gest (x, y), Best (x , y) is the evaluation RGB value of the illumination profile at the same pixel, and i is the maximum RGB value of the color of the reaction area.
For example, the
本開示に記載された1以上の測定の後、診断アプリケーションは、反応領域202(例えば、50から100ピクセル)からピクセルの見本を取得し、1以上の色彩パラメータ(例えば、色彩、又は、色彩及び色彩強度)の値を決定する。診断アプリケーションは、1以上の色彩パラメータの値を平均し、1以上の平均色彩パラメータを検体の特性値(例えば、血液中のグルコース濃度レベル)に関連付ける。 After one or more of the measurements described in this disclosure, the diagnostic application obtains a sample of the pixel from the reaction area 202 (eg, 50-100 pixels) and obtains one or more color parameters (eg, color or color and Color intensity). The diagnostic application averages the values of the one or more color parameters and associates the one or more average color parameters with a characteristic value of the analyte (eg, a glucose concentration level in blood).
一例では、反応領域202、色彩較正領域204及び温度較正領域206は矩形状で、領域204及び206は領域202の上方側及び下方側にそれぞれ隣接して配置される。反応領域202、色彩較正領域204及び温度較正領域206は他の形状及び配列であってもよい。
In one example, the
図3は、本開示の1以上の例に於ける、反応領域302、色彩較正領域304及び温度較正領域306を異なる配列とした標本試験紙300を示す。色彩温度領域306は部位306Aと306Bに分割され、反応領域302は部位306Aと306Bによって左右から挟まれる。色彩較正領域304は反応領域302及び温度較正領域306の組み合わせの下方側に隣接している。
FIG. 3 illustrates a
図4は、本開示の1以上の例に於ける、反応領域402と色彩較正領域404の配列を示す。色彩較正領域404は反応領域402を囲んでいる。一例では、反応領域402は円形状を有し、色彩較正領域404はリング形状を有する。
FIG. 4 illustrates an arrangement of a
図5は、本開示の1以上の例の反応領域502及び色彩較正領域504の配列を示す。配列400(図4)のように、色彩較正領域504は反応領域502を囲んでいる。しかしながら、反応領域502は矩形状を有し、色彩較正領域504は矩形リング状を有する。
FIG. 5 illustrates an arrangement of a
図6は、本開示の1以上の例に於ける、タイマー毛細管を備えた標本試験紙600の一部を示す。標本試験紙600は、本開示に記載した反応、色彩較正及び温度測定の配列を備えた標本試験紙を示す。標本試験紙600は、毛細管入口604、反応毛細管606及び反応領域608を有する。反応毛細管606は、毛細管入口604を反応領域608に接続する。タイマー毛細管602は、毛細管入口604に接続されている。タイマー毛細管602は反応毛細管606よりも断面が小さい。標本サンプルが毛細管入口64に受け取られると、反応毛細管606は、検体の特性を検出するために、標本サンプルの殆どを反応領域608へと搬送する。標本サンプルのごく一部はタイマー毛細管602に沿って移動し、経過時間をマークするので、タイマー毛細管602での標本サンプルの処理は、標本試験紙600がいつ読み取られるべきであるのかを示すタイマーとして使用される。
FIG. 6 illustrates a portion of a
図7は、本開示の1以上の実施形態の反応領域702及びタイマー領域704を備えた標本試験紙700を示す。標本試験紙700は、本開示で記載した反応領域、色彩較正及び温度測定の配列の全てを備えた標本試験紙700を示す。タイマー領域704は標本サンプルを受け取るための他の反応領域である。例えば、標本試験紙600と同様に、標本試験紙700は、毛細管入口に接続される反応毛細管と、毛細管入口をタイマー領域704に接続するタイマー毛細管とを有してもよい。反応領域702は、標本サンプルに非線形反応する検体を有するものの、タイマー領域704は、標本サンプルにほぼ線形反応する検体を有するので、タイマー領域704の色彩変化は、いつ標本試験紙700が読み取られるべきであるのかを示すタイマーとして使用される。一例では、タイマー領域704は密封され、標本サンプルの水粒子に反応して青からピンクに変化するコバルト塩化物(塩化コバルト)を含有する。また標本試験紙700は、色彩較正領域706及び温度較正領域708を有してもよい。
FIG. 7 illustrates a
一例では、タイマー領域704は、一旦、標本試験紙700が不透明シールパッケージから除去されると、光に反応して色彩を変化させる。タイマー領域704は、標本試験紙700がそのパッケージから取り除かれた経過時間を示すために光に反応して線形に色彩を変化させ、いつ標本試験紙700が読み取られるべきであるのかを示すために、標本サンプルに応じて反応領域702の反応時間を予想するようにしてもよい。タイマー領域704は、透明な保護膜で覆われてもよい。一例では、タイマー領域704は、アゾベンゼン、サリチリデンアニリン、フルギト類、スピロピランあるいはスピロオキサジン等のフォトクロミック染料を含有してもよい。
In one example, the
一例では、タイマー領域704は、一旦、標本試験紙700が密封パッケージから除去されると、湿気のために色彩を変化させる。タイマー領域704は、標本試験紙700がそのパッケージから取り除かれるので、経過時間を示すために湿気に反応して線形に色彩を変化させ、いつ標本試験紙700が読み取られるべきかを示すために、標本サンプルに応じて反応領域702の反応時間を予想するようにしてもよい。タイマー領域704は、湿気に晒されるのを調整する、穴の空いた透明な保護膜によって覆われるようにしてもよい。一例では、タイマー領域704は、青からピンクに変化する塩化コバルトを含有する。
In one example, the
タイマー領域704を使用する代わりに、コンピュータ210が標本サンプルに応じて反応領域702の反応時間を予想するために内蔵タイマーを使用してもよい。
Instead of using the
図8は、本開示の1以上の例に於ける、標本試験紙(例えば、図2の標本試験紙200)を読み取るために、診断アプリケーションを実行するコンピュータ(例えば、図2のコンピュータ210)のための方法800のフローチャートである。本開示に記載される全ての方法では、ブロックが連続する命令で図示されているが、これらブロックは並列又はここに記載したのとは異なる命令で実行されてもよい。また、種々のブロックが数少ないブロックに統合されてもよいし、付加的なブロックに分割されてもよいし、あるいは、望ましい実施に基づいて削除してもよい。方法800はブロック802で始めてもよい。
FIG. 8 illustrates a computer (eg,
ブロック802では、コンピュータ210は標本試験紙200の1以上の画像212を読み取る。手ぶれのない安定した画像が画像212から選択されるようにして複数の画像212が取り込まれる。画像212は矢継ぎ早に(例えば、連続又は速射モードで)、あるいは、ビデオからフレームで取り込まれてもよい。一例では、各画像212は、反応領域202と色彩較正領域204とを有する。他の例では、各画像212は温度較正領域206を有してもよい。追加の他の例では、各画像212はさらにタイマー領域602又は704を有してもよい。
At
色彩較正領域204がグレーカードであるとき、コンピュータ210は、画像212を取り込むための露出基準値として色彩較正領域204を使用してもよい。また、コンピュータ210は、露出基準値として約18%の反射率を有する標本試験紙の近くの物体(例えば、グラスや人肌)を使用してもよい。コンピュータ210が自動的に露出基準値を認識してもよいし、ユーザが適切な基準値を設定するために露出基準値に撮像装置208を操作してもよい。
When
一例では、コンピュータ210は、標本サンプルが標本試験紙200に置かれた後、適切な時間で画像212を取り込む。前述のように、タイマー領域602又は704は、画像212がいつ取り込まれるべきかを示すようにしてもよい。コンピュータ210がタイマー602又は704を監視し、自動的に画像212を取り込むようにしてもよいし、ユーザがタイマー602又は704を視覚によって検査して、画像212を取り込むために撮像装置208を操作してもよい。ブロック802にはオプションブロック803が続く。
In one example,
オプションブロック803では、コンピュータ210は手ぶれのない安定した画像212を選択する。診断アプリケーションは、コンピュータ210が画像212を取り込んだとき安定していたか否かを決定するために、内蔵の加速度計を使用することにより画像が安定しているか否かを決定するようにしてもよい。診断アプリケーションは、画像212がまさに取り込まれようとしているとき、ユーザがコンピュータ210を安定させた状態に維持していなければ、警告を発するように内蔵の加速度計を使用するようにしてもよい。オプションブロック803にはブロック804が続く。
In
ブロック804では、コンピュータ210は、画像212の反応領域202の照度を測定する。前述のように、コンピュータ210は、画像212の照明プロファイルを評価し、照度が均一でないとき、画像212の反応領域202の照度を補正する。ブロック803にはブロック806が続く。
At
ブロック806では、コンピュータ210は、画像212の反応領域の色彩を決定する。前述のように、コンピュータ210は、画像212中の色彩較正領域204が色彩グラフであるとき、その色彩較正領域204に基づいて反応領域202の色彩を決定してもよい。またコンピュータ210は単に、画像212から反応領域202の色彩を読み取る。ブロック806にはブロック807が続く。
At
ブロック807では、コンピュータ210は、1以上の較正領域に基づいて反応領域202の色彩を補正する。一例では、コンピュータ210は、画像212の色彩較正領域204がグレーカードであるとき、その色彩較正領域204に基づいてホワイトバランスのために反応領域202の色彩を補正する。一例では、コンピュータ210は、画像212中の温度較正領域206に基づいて温度のために反応領域202の色彩を補正する。なお、ブロック806及び807の順番は変更してもよい。ブロック807にはブロック808が続く。
At
ブロック808では、コンピュータ210は、特性値(例えば、グルコースレベル)を分析するために、画像212中の反応領域202からサンプルピクセルの色彩、又は、色彩及び色彩強度の両方を関連付ける。
At
反応領域202の色彩パラメータの変化率は、分析物の特性値に依存してもよい。各分析物の特性値のため、色彩パラメータの変化率は時間に対する曲線として描かれてもよい。図9は、3つの分析物の特性値(例えば、3つのグルコースレベル)のための時間に対する色彩パラメータ(例えば、色彩強度)の変化を描く3つの曲線902、904及び906を図示するグラフ900である。各曲線は、対応する分析物の特性値に特有の時間窓(例えば、時間窓908)で異なる勾配を有する。これにより、少なくとも2つの色彩パラメータの値の違いと、2つの値が取り込まれるときの違いとを、対応する分析物の特性を確認するために使用してもよい。時間窓は、標本サンプルが標本試験紙200に置かれた後、例えば、10秒以上で先の標本試験紙を読み取るために待機すべき時間よりも、例えば、2、3秒早く配置される。
The rate of change of the color parameter of the
図10は、本開示の1以上の例に於ける、標本試験紙(例えば、図2の標本試験紙200)を速く読み取るために異なる計算を使用した診断アプリケーションを実行するコンピュータ(例えば、図2のコンピュータ210)のための方法1000のフローチャートである。方法1000は、ブロック1002から始まる。
FIG. 10 illustrates a computer (eg, FIG. 2) executing a diagnostic application that uses different calculations to quickly read a specimen test strip (eg,
ブロック1002では、コンピュータ210は、時間窓908の標本試験紙200の少なくとも2つの画像212を読み取る。画像212は、矢継ぎ早に(例えば、連続又は速射モードで)、あるいは、ビデオからフレームで取り込まれた画像であればよい。例えば、第1画像212は第1時間で取り込まれ、第2画像212は第2時間で取り込まれる。第1時間と第2時間の間の時間差は、時間窓(例えば、図9に示す時間窓908)として計算される。各画像212は、標本試験紙200に反応領域202を有する。一例では、各画像212は、標本試験紙200に色彩較正領域204を含んでもよい。他の例では、各画像はさらに、標本試験紙200に、温度較正領域206等の1以上の追加較正領域を有する。一例では、コンピュータ210は、タイマー領域602又は704に基づいて時間窓908で取り込まれた画像212を選択する。ブロック1002にはブロック1004が続く。
At
ブロック1004では、コンピュータ210は、照度補正、色彩補正及び温度補正を含む、本開示に記載された全ての方法を使用して、各画像212の反応領域202の色彩を決定する。ブロック1004にはブロック1006が続く。
At
ブロック1006では、コンピュータ210は、画像212から反応領域202の色彩強度の変化を決定する。ブロック1006にはブロック1008が続く。
At
ブロック1008では、コンピュータ210は、分析物の特性値に対する色彩強度の変化を補正する。コンピュータ210は、分析物の特性値を決定するために、グラフ900、あるいは、グラフ900の数学的表現を使用してもよい。特に、コンピュータ210は、曲線902、904及び906に沿って時間窓908を移動させる。時間窓のカーブの変化度合いが反応領域202の変化度合いに合致する場合、反応領域202はその曲線の分析特性値を有する。
At
図11は、本開示の1以上の例に於ける、分析特性に従ってユーザのダイエットを追跡するために、診断アプリケーションを実行するコンピュータ(例えば、図2のコンピュータ210)のための方法1100のフローチャートである。方法1100はブロック1102から始まる。
FIG. 11 is a flowchart of a
ブロック1102では、コンピュータ210は食事の画像を取り込む。ブロック1102にはブロック1104が続く。
At
ブロック1104では、コンピュータ210は食事の時間を記録する。ブロック1104にはブロック1106が続く。
At
ブロック1106では、コンピュータ210は、食事と時間を関連付け、ほぼ同時に決定される特性値に対して、この関連付けを記録する。分析物の特性値は、本開示に記載された全ての方法で使用するようにして決定してもよい。ブロック1102、1104及び1106は、時間に対するユーザのダイエットを追跡するために繰り返されてもよい。ブロック1106にはブロック118が続く。
At
ブロック1108では、コンピュータ210は、処置目的のため、医師のコンピュータ等の他のコンピュータに、コンピュータネットワークを介して記録された関連付けを表示する。図12は、本開示の1以上の例に於ける、1日を通じて、食事、時間及び分析物の特性値を関連付けたグラフ表示している。
At
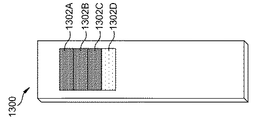
図13Aは、本開示の1以上の例の標本試験紙1300を示す。標本試験紙1300は、(全体の「反応領域1302」として、又は、個々の一般的な「反応領域1302」として)一連の反応領域1302A、1302B、1302C及び1302Dを有する。各反応領域1302は、標本サンプルの分析物の特性値の異なる範囲を検出するためである。一例では、グルコースレベルを検出するため、反応領域1302Aは0から100(mg/dl)を検出し、反応領域1302Bは0から200(mg/dl)を検出し、反応領域1302Cは0から400mg/dlを検出し、反応領域1302Dは0から800mg/dlを検出する。異なる範囲の分析物の特性値を検出するため、反応領域1302は1以上の検体を異なる場所に集中させる。また反応領域1302は異なる検体を有する。
FIG. 13A illustrates a
標本試験紙1300は、毛細管入口と、標本サンプルを搬送するために反応領域1302に接触して移動する毛細管とを有してもよい。また、標本試験紙1300は、サンプルを反応領域1302に供給するために反応領域1302に重なって接触する拡張領域を有してもよい。ユーザは、サンプルを反応領域1302に搬送するために、特別な構成なしに一例としての反応領域1302にサンプルを手作業で広げるようにしてもよい。標本試験紙1300は、さらに色彩較正領域1304及び温度較正領域1306を有してもよい。
The
図13Aは、予試験状態での標本試験紙1300を示す。図13Bは、本開示の1以上の例の150mg/dlのグルコースの標本サンプルを保持する標本試験紙1300を示す。グルコースが反応領域1302Aの範囲よりも集中するので、過彩度の色彩を有し、グルコースレベルを決定するためには使用しない。しかしながら、反応領域1302B、1302C及び1302Dは使用してもよい。反応領域1302Bの色彩は、良好な彩度を有しているので、反応領域1302C及び1302Dよりも良く読み取られる。
FIG. 13A shows the
図13Cは、本開示の1以上の例に於ける、300mg/dlのグルコースの標本サンプルを保持する標本試験紙1300を示す。グルコースが反応領域1302A及び1302Bの範囲よりも集中しているので、それらは過彩度を有し、それらはグルコースレベルを決定するために使用されない。しかしながら、反応領域1302C及び1302Dは使用してもよい。反応領域1302Cの色彩は良好な彩度を有しているので、反応領域1302Dよりもより良く読み取られる。
FIG. 13C illustrates a
図13Dは、本開示の1以上の例に於ける、600mg/dlのグルコースの標本サンプルを保持する標本試験紙1300を示す。グルコースは、反応領域1302A、1302B及び1302Cの範囲よりも集中しているため、それらは過彩度の色彩となり、グルコースレベルを決定するためには使用されない。反応領域1302Dの色彩は良好な彩度であるので、グルコースレベルを決定するために使用される。
FIG. 13D illustrates a
一例では、反応領域1302は矩形状で、全体として矩形変数を有するために同一線上に配置されている。反応領域1302は他の形状や配置であってもよい。 In one example, the reaction areas 1302 are rectangular and are collinear to have rectangular variables as a whole. The reaction area 1302 may have other shapes and arrangements.
図14は、本開示の1以上の例に於ける、反応領域1402A、1402B、1402C及び1402D(全体として「反応領域1402」)のための異なる配列を備えた標本試験紙1400を示す。標本試験紙1400では、反応領域1402は正方形の外側パラメータを有するように配置されている。標本試験紙1300と同様に、標本試験紙1400は、サンプルを反応領域1402に搬送するための構造を有してもよいし、ユーザは反応領域1402に手動でサンプルを広げるようにしてもよい。
FIG. 14 illustrates a
図15は、本開示の1以上の例に於ける、反応領域1502A、1502B、1502C及び1502D(まとめて「反応領域1502」)のための異なる配列を備えた標本試験紙1500を示す。標本試験紙1500では、反応サブ領域1502は三角形状で、四角形の外形を有するように配置されている。標本試験紙1300と同様に、標本試験紙1500はサンプルを反応領域に搬送するための構造を備えてもよいし、ユーザが手動により反応領域1502を超えて広げてもよい。
FIG. 15 illustrates a
図16は、本開示の1以上の例に於ける、反応領域1602A、1602B、1602C及び1602D(まとめて、「反応領域1602」)のための異なる配列を備えた標本試験紙1600を示す。標本試験紙1600では、毛細管入口1604は毛細管1606によって反応領域1602に接続されている。反応領域1602は、毛細管入口1604から同じ距離で、毛細管入口1604の周囲に均等に配置されている。
FIG. 16 shows a
図17は、本開示の1以上の例に於ける、分析物の特性値の異なる範囲を検出するための多数の反応領域を備えた標本試験紙(例えば、図13の標本試験紙1300)を読み取る診断アプリケーションを実行するコンピュータ(例えば、図2のコンピュータ210)のための方法1700のフローチャートである。方法1700はブロック170から始まる。
FIG. 17 illustrates a sample test strip (eg,
ブロック1702では、コンピュータ210は、標本試験紙1300の画像を取り込む。その画像は反応領域1302を有する。前述のように、各反応領域1302は、分析物の特性値の異なる範囲を検出するためのものである。コンピュータ210は、本開示に記載された全ての方法を使用する各反応領域1302の色彩を決定してもよい。ブロック1702はブロック1704へと続く。
At
ブロック1704では、コンピュータ210は、適切な彩度の反応領域1302を選択する。コンピュータ210は、最も小さい範囲を有するものから最も大きい範囲を有するものまで反応領域1302を検査する。反応領域1302の平均RGB値がノイズレベル(例えば、〜10)に近く、分析物の濃度がその検出限界を超えていることが示されているとき、コンピュータ210は次の反応領域1302を検査する。この処理は、コンピュータ210によって平均RGB値がノイズレベルよりも大きい反応領域1302を選択するまで続く。ブロック1704はブロック1706へと続く。
At block 1704, the
ブロック1706では、コンピュータ210は、選択された反応領域1302の色彩、又は、色彩強度と、分析物の特性値とを関連付ける。
At
方法1700は、本開示の1以上の例に於ける、標本試験紙1300の多数の画像を多数の露出で撮影することによって拡張してもよい。図18は、本開示の1以上の例に於ける、1/60、1/30及び1/15のそれぞれの標本試験紙1300の画像1802、1804及び1806を示す。1つの極端な例では、画像1802はより高い濃度(例えば、反応領域1302D)を検出する1以上の反応領域の詳細をはっきりさせるために露出不足とされており、その結果これら反応領域の感度が増大する。他の極端な例では、画像1806はより低い濃度(例えば、反応領域1302B)を検出するための1以上の反応領域の詳細をはっきりさせるために露出過剰とされており、その結果これらの反応領域の感度が増大する。極端な例の間の露出であれば、画像184は中間濃度を検出するために1以上の反応領域の詳細をはっきりさせ、その結果これら反応領域の感度が増大する。
The
コンピュータ210は、各画像の反応領域1302の全ての平均RGB値に基づいて画像1802、1804及び1806の1つを選択してもよい。全ての画像の全ての反応領域1302の平均RGB値があまりに低いか(例えば、<30)、あるいは、あまりに高く(例えば、>240)、この画像の露出時間が不適切であることを示しているとき、コンピュータ210は他の画像を選択する。
The
露出を調整する代わりに、方法1700は、本開示の1以上の例に於ける、標本試験紙1300の多数の画像を多数の照明強度で撮影することにより拡張してもよい。図19は、本開示の1以上の例に於ける、低、中、高のフラッシュ強さでの標本試験紙1300の画像1902、1904及び1906をそれぞれ示す。1つの極端な例では、画像1902はより低い濃度(例えば、反応領域1302A)を検出するために1以上の反応領域の詳細をはっきりさせる低照明強度下にあり、その結果これら反応領域の感度が増大する。他の極端な例では、画像1906はより高い濃度(例えば、反応領域1302D)を検出するために1以上の反応領域の詳細をはっきりさせる高照明強度下にあり、その結果これら反応領域の感度が増大する。中間の照明強度によれば、画像1904は中間濃度(例えば、反応領域1302C)を検出するために1以上の反応領域の詳細をはっきりし、その結果これら反応領域の感度が増大する。
Instead of adjusting the exposure, the
このモードでは、コンピュータ210は、適切に駆動することを保証するために、画像1902、1904及び1906を先に取り込む照明源(例えば、フラッシュ)をテストしてもよい。例えば、コンピュータ210は、少なくとも1度フラッシュを駆動し、フラッシュが駆動するか否かを決定するために検出強度の変化を使用する。
In this mode, the
コンピュータ210は、各画像の反応領域1302の全体又は一部の平均RGB値に基づいて画像1902、1904及び1906の1つを選択してもよい。画像の反応領域1302の平均RGB値があまりに低いか(例えば、<30)、あるいは、あまりに高く(例えば、>240)、この画像の照明強度が不適切であることを示すとき、コンピュータ210は他の画像を選択する。
The
図20は、本開示の1以上の例に於ける、標本試験紙2000を示す。標本試験紙2000は、異なる分析物の特性値を検出するための多数の反応領域を有する。一例では、標本試験紙2000は、標本サンプル中の第1分析物の特性を検出するための反応領域2002、標本サンプル中の第2分析物の特性を検出するための反応領域2004(例えば、2つの反応領域2004)、及び、標本サンプル中の第3分析物の特性を検出するための反応領域2006(例えば、3つの反応領域2006)を有する。図13Aに示す反応領域1302と同様に、多数の反応領域2004のそれぞれは第2分析物の特性値の異なる範囲を検出し、多数の反応領域2006のそれぞれは第3分析物の特性値の異なる範囲を検出する。
FIG. 20 illustrates a
一例では、標本サンプルの1分析物が他の分析物の検出に影響を及ぼすことが知られている。例えば、反応領域2006は血液サンプル中のグルコースを検出し、反応領域2004は血液サンプル中のヘマトクリット(HCT)のレベルを検出する。HCTレベルは直接又は間接的に(すなわち、血液サンプル中の他の物質のレベルを決定することにより)検出してもよい。診断アプリケーションはHCTレベルを決定し、HCTとグルコースレベルとの間の公知の関係を使用してグルコースレベルを補正する。この関係は、実験、計算又はその両方によって決定すればよい。診断アプリケーションは、本開示に記載された他の全ての補正の前後でHCTの補正を行うようにしてもよい。
In one example, it is known that one analyte in a sample sample affects the detection of another analyte. For example,
コンピュータ210は、標本試験紙から他の方法でHCTレベルを決定してもよい。図21は、本開示の1以上の例に於ける標本試験紙2100の断面図である。標本試験紙2100では、穴が血液サンプルの通路に設けられ、光が血液サンプルに照射され、その結果としての光色は、HCTレベルに関連付けされる。一例では、標本試験紙2100は、毛細管入口2102、毛細管入口2102に接続される毛細管2104及び毛細管2104に接続される反応領域2106を備える。穴2108が毛細管2104に形成されている。穴2108の上端開口2110は透明フィルム2112によって覆われ、下端開口2114は透明フィルム2116によって覆われている。コンピュータ210は、穴2108に光を透過させ、光が通過した穴2108の色彩を取り込み、血液中の赤色の血液セルの割合に依存して、HCTレベルに関連付けする。他の例では、フィルム2116はフィルム2112よりも反射する。光の一部は上端開口2110で反射又は散乱し、HCTレベルを決定するためにコンピュータ210によって取り込まれる。
他の例では、赤色の血液セルを濾過し、リンパ液を吸収する材料の矩形片が標本試験紙に設けられている。そして、HCTレベルは、吸収されたリンパ液の量に関連付けされ、距離から決定され、血液サンプルは紙片を移動する。 In another example, a rectangular strip of material that filters the red blood cells and absorbs lymph fluid is provided on the specimen strip. The HCT level is then related to the amount of lymph fluid absorbed, determined from distance, and the blood sample travels on a piece of paper.
反応領域(例えば、タイマー領域602又は704)から分離したタイマー領域を使用する代わりに、方法800は、時間を検出するための反応領域の第2色彩要素と、本開示の1以上の例に於ける、分析物の特性を検出するために反応領域の第1色彩要素とを使用することにより拡張してもよい。
Instead of using a timer area separate from the reaction area (e.g.,
図22は、本開示の1以上の例に於ける、分析物の特性値(例えば、血液中のグルコースレベル)を時間軸で反応領域の第1色彩要素(例えば、赤)の変化をプロットしたカーブを図示したグラフ2200である。図示されるように、第1色彩要素のカーブは、迅速に一定値に落ち着き、その結果分析物の特性の各値を示すように使用してもよい FIG. 22 plots a characteristic value of an analyte (eg, glucose level in blood) over time in a change in a first color component (eg, red) of a reaction region in one or more examples of the present disclosure. Fig. 2 is a graph 2200 illustrating a curve. As shown, the curve of the first color component quickly settles to a constant value, and may be used to indicate each value of the characteristic of the analyte.
図23は、本開示の1以上の例に於ける、分析物の特性値を時間軸で反応領域の第2色彩要素(例えば、青色要素)の変化をプロットしたカーブを図示するグラフ2300である。図示されるように、第2色彩要素のカーブは時間の経過に従って変化し、その結果、いつ第1色彩要素を読み取り、分析物の特性値を決定するのか(すなわち、第1色彩要素が安定した後)を示すためのタイマーとして使用することができる。一例では、方法800のブロック802で、コンピュータ210は多数の画像212を取り込み、いつ第2色彩要素が第1色彩要素を読み取る適切な時間を示すのか、そしてそのとき、分析物の特性値を決定するために第1色彩要素を読み取るのかを決定してもよい。
FIG. 23 is a graph 2300 illustrating a curve plotting a change in a second color component (eg, a blue component) of a reaction region over time with a characteristic value of an analyte in one or more examples of the present disclosure. . As shown, the curve of the second color element changes over time so that when the first color element is read and the characteristic value of the analyte is determined (ie, the first color element is stable) Can be used as a timer to indicate after). In one example, at
ここに開示された試験紙、システム及び方法は、これには限定されないが、グルコース、コレステロール、尿酸、トロポニンI、ケトン、プロテイン、亜硝酸塩、及び、白血球等のある検体の存在又は濃度のあめのテストに使用してもよい。これには限定されないが、血液、間質液、尿、唾液、及び、他の体液等の種々の液体をテストしてもよい。 The test strips, systems and methods disclosed herein may be used to control the presence or concentration of certain analytes such as, but not limited to, glucose, cholesterol, uric acid, troponin I, ketones, proteins, nitrites, and leukocytes. May be used for testing. Various fluids, such as, but not limited to, blood, interstitial fluid, urine, saliva, and other bodily fluids may be tested.
前述のように、本開示の種々の実施形態が実例の目的のために記載されており、種々の変形例が本開示の範囲及び意図から逸脱することなく形成されることが理解されるであろう。また、ここに記載された種々の実施形態はそのものに限定されることを意図するものではなく、本発明によって示される範囲及び意図の範疇であればよい。 As mentioned above, it is understood that various embodiments of the present disclosure have been described for purposes of illustration, and that various modifications may be made without departing from the scope and spirit of the present disclosure. Would. In addition, the various embodiments described herein are not intended to be limited to the embodiments themselves, but may be within the scope and intention shown by the present invention.
Claims (57)
前記標本サンプルを保持した後、反応領域の色彩を決定するように構成された色彩較正領域と、
を備えたことを特徴とする標本サンプル中の分析物の特性を検出するための標本試験紙。 A reaction region configured to hold a sample sample;
After holding the sample sample, a color calibration area configured to determine the color of the reaction area;
A specimen test strip for detecting a characteristic of an analyte in a specimen sample, comprising:
前記穴の上端開口を覆う、透明な第1フィルムと、
前記穴の下端開口を覆う第2フィルムと、
をさらに備えたことを特徴とする請求項1に記載の標本試験紙。 A hole through which the sample sample passes;
A transparent first film covering an upper end opening of the hole,
A second film covering a lower end opening of the hole;
The specimen test paper according to claim 1, further comprising:
前記色彩較正領域に基づいて、前記1以上の画像から反応領域の色彩を決定するステップと、
前記反応領域の記載を分析物の特性値に関連付けるステップと、
を備える、標本サンプル中の分析物の特性を検出するための標本試験紙を読み取る撮像装置を備えたコンピュータのための方法。 Capturing one or more images of the specimen test strip, each image having a reaction area and a color calibration area on the specimen test strip;
Determining a color of a reaction area from the one or more images based on the color calibration area;
Associating a description of the reaction area with a characteristic value of the analyte;
A method for a computer with an imaging device that reads a specimen test strip for detecting a property of an analyte in a specimen sample, the method comprising:
前記関連付けるステップは、反応領域の色彩を分析物の特性値に関連付けることに加えて、色彩強度を関連付けるステップを備えることを特徴とする請求項17に記載の方法。 The determining step includes, in addition to determining the color of the reaction area from one or more images based on the color calibration area, determining a color intensity,
18. The method of claim 17, wherein the associating comprises associating a color intensity of the reaction area with a characteristic value of the analyte, in addition to associating a color intensity.
前記画像の照度が均一でない場合、画像の照明効果を補正するステップと、
をさらに備えることを特徴とする請求項17に記載の方法。 Determining whether the illuminance of the image is uniform from at least two locations in the color calibration area;
Correcting the lighting effect of the image if the illuminance of the image is not uniform;
The method of claim 17, further comprising:
前記反応領域のピクセルの照明プロファイルのRGB値を推定するステップと、
次式によりピクセルの補正RGB値を決定するステップと、
[数1]
RGB new = i×(R(x,y), G(x,y), B(x,y))/(R est (x,y), G est (x,y), B est (x,y))
R(x,y), G(x,y), B(x,y):ピクセルの元のRGB値
R est (x,y), G est (x,y), B est (x,y):ピクセルでの照明プロファイルの推定されたRGB値
i:反応領域での色彩の最大RGB値
を備えることを特徴とする請求項21に記載の方法。 Correcting the lighting effect of the image comprises determining a lighting profile from at least two locations in the color calibration area;
Estimating the RGB value of the illumination profile of the pixels in the reaction area;
Determining a corrected RGB value for the pixel according to the following equation:
[Equation 1]
RGB new = i × (R (x, y), G (x, y), B (x, y)) / (R est (x, y), G est (x, y), B est (x, y))
R (x, y), G (x, y), B (x, y): Original RGB value of pixel
R est (x, y), G est (x, y), B est (x, y): estimated RGB value of the illumination profile at the pixel i: having the maximum RGB value of the color in the reaction area The method according to claim 21, characterized in that:
前記上端開口から前記穴の下端開口から出るか、あるいは、上端開口から反射する光の他の色彩を決定するステップと、
他の色彩を、他の分析物の他の特性値に関連付けるステップと、
をさらに備えたことを特徴とする請求項17に記載の方法。 Directing light through the top opening of the hole through which the specimen sample in the specimen test strip passes;
Either exiting from the lower end opening of the hole from the upper end opening, or determining another color of light reflected from the upper end opening;
Associating other colors with other characteristic values of other analytes;
The method of claim 17, further comprising:
前記画像から反応領域の色彩強度の変化を決定するステップと、
前記画像が取り込まれるときの時間差を決定するステップと、
前記色彩強度の変化と時間差を分析物の特性値に関連付けるステップと、
を備えることを特徴とする、標本サンプル中の分析物の特性を検出するために標本試験紙を読み取るための撮像装置を備えるコンピュータのための方法。 Reading at least two images of the specimen test strip, each image including a reaction area;
Determining a change in the color intensity of the reaction area from the image,
Determining a time difference when the image is captured;
Associating the change in color intensity and the time difference with a characteristic value of the analyte;
A method for a computer comprising an imaging device for reading a specimen test strip to detect a property of an analyte in a specimen sample, the method comprising:
前記画像の照度が均一でないとき、画像の照明効果を補正するステップと、をさらに備えることを特徴とする請求項34に記載の方法。 Determining, for each said image, whether the illuminance of the image is uniform in at least two places of the reaction area or the color calibration area;
35. The method of claim 34, further comprising: correcting illumination effects of the image when the illumination of the image is not uniform.
色彩較正領域の少なくとも2つの場所から照明プロファイルを決定するステップと、
反応領域のピクセルに於ける照明プロファイルのRGB値を推定するステップと、
次式に従ってピクセルの補正したRGB値を決定するステップと、
[数2]
RGB new = i×(R(x,y), G(x,y), B(x,y))/(R est (x,y), G est (x,y), B est (x,y))
R(x,y), G(x,y), B(x,y):ピクセルの元のRGB値
R est (x,y), G est (x,y), B est (x,y):ピクセルでの照明プロファイルの推定されたRGB値
i:反応領域での色彩の最大RGB値
を備えることを特徴とする請求項36に記載の方法。 Correcting the lighting effect of the image,
Determining an illumination profile from at least two locations in the color calibration area;
Estimating the RGB values of the illumination profile at the pixels of the reaction area;
Determining a corrected RGB value for the pixel according to the following equation:
[Equation 2]
RGB new = i × (R (x, y), G (x, y), B (x, y)) / (R est (x, y), G est (x, y), B est (x, y))
R (x, y), G (x, y), B (x, y): Original RGB value of pixel
R est (x, y), G est (x, y), B est (x, y): estimated RGB value of the illumination profile at the pixel i: having the maximum RGB value of the color in the reaction area 37. The method of claim 36, wherein the method comprises:
他の測定領域に基づいて反応領域の色彩強度を補正するステップをさらに備え、前記反応領域はグルコースレベルを検出し、他の反応領域はヘマトクリットレベルを検出することを特徴とする請求項34に記載の方法。 Each of the images further has another reaction area of the specimen test strip,
35. The method of claim 34, further comprising correcting a color intensity of the reaction area based on another measurement area, wherein the reaction area detects a glucose level, and the other reaction area detects a hematocrit level. the method of.
前記反応領域の1つを選択するステップと、
前記選択された反応領域を分析物の特性値に関連付けるステップと、
を備えることを特徴とする標本サンプル中の分析物の特性を検出するために標本試験紙を読み取る撮像装置を備えたコンピュータのための方法。 Capturing a first image of a specimen test strip, the image including a reaction region each configured to detect a different range of characteristic values of the analyte;
Selecting one of the reaction regions;
Associating the selected reaction region with a characteristic value of an analyte;
A method for a computer with an imaging device that reads a specimen test strip to detect a property of an analyte in a specimen sample, the method comprising:
前記第1画像に代えて第2画像を選択するステップと、
をさらに備えることを特徴とする請求項52に記載の方法。 Capturing a second image of the specimen test strip under a different exposure than the first image;
Selecting a second image instead of the first image;
53. The method of claim 52, further comprising:
Priority Applications (1)
| Application Number | Priority Date | Filing Date | Title |
|---|---|---|---|
| JP2021107606A JP7271611B2 (en) | 2013-01-07 | 2021-06-29 | Test strips and test strip reading methods |
Applications Claiming Priority (5)
| Application Number | Priority Date | Filing Date | Title |
|---|---|---|---|
| US201361749811P | 2013-01-07 | 2013-01-07 | |
| US61/749,811 | 2013-01-07 | ||
| US13/798,175 | 2013-03-13 | ||
| US13/798,175 US9063091B2 (en) | 2012-04-06 | 2013-03-13 | Test strips and method for reading test strips |
| JP2017118541A JP6580627B2 (en) | 2013-01-07 | 2017-06-16 | Test paper and test paper reading method |
Related Parent Applications (1)
| Application Number | Title | Priority Date | Filing Date |
|---|---|---|---|
| JP2017118541A Division JP6580627B2 (en) | 2013-01-07 | 2017-06-16 | Test paper and test paper reading method |
Related Child Applications (1)
| Application Number | Title | Priority Date | Filing Date |
|---|---|---|---|
| JP2021107606A Division JP7271611B2 (en) | 2013-01-07 | 2021-06-29 | Test strips and test strip reading methods |
Publications (2)
| Publication Number | Publication Date |
|---|---|
| JP2019219415A true JP2019219415A (en) | 2019-12-26 |
| JP6906573B2 JP6906573B2 (en) | 2021-07-21 |
Family
ID=54250587
Family Applications (4)
| Application Number | Title | Priority Date | Filing Date |
|---|---|---|---|
| JP2015543250A Active JP6322643B2 (en) | 2013-01-07 | 2013-04-16 | Test paper and test paper reading method |
| JP2017118541A Active JP6580627B2 (en) | 2013-01-07 | 2017-06-16 | Test paper and test paper reading method |
| JP2019155196A Active JP6906573B2 (en) | 2013-01-07 | 2019-08-28 | Test paper and reading method of test paper |
| JP2021107606A Active JP7271611B2 (en) | 2013-01-07 | 2021-06-29 | Test strips and test strip reading methods |
Family Applications Before (2)
| Application Number | Title | Priority Date | Filing Date |
|---|---|---|---|
| JP2015543250A Active JP6322643B2 (en) | 2013-01-07 | 2013-04-16 | Test paper and test paper reading method |
| JP2017118541A Active JP6580627B2 (en) | 2013-01-07 | 2017-06-16 | Test paper and test paper reading method |
Family Applications After (1)
| Application Number | Title | Priority Date | Filing Date |
|---|---|---|---|
| JP2021107606A Active JP7271611B2 (en) | 2013-01-07 | 2021-06-29 | Test strips and test strip reading methods |
Country Status (4)
| Country | Link |
|---|---|
| EP (3) | EP2941630B1 (en) |
| JP (4) | JP6322643B2 (en) |
| CN (2) | CN105899935B (en) |
| ES (1) | ES2746070T3 (en) |
Families Citing this family (25)
| Publication number | Priority date | Publication date | Assignee | Title |
|---|---|---|---|---|
| EP3442415B1 (en) * | 2016-04-14 | 2025-05-28 | Morgan Innovation & Technology Ltd | Methods for measuring the levels of analytes in body fluids |
| JP2018205208A (en) * | 2017-06-07 | 2018-12-27 | 富士通株式会社 | Test value output program, test value output method and test value output device |
| JP2019052887A (en) * | 2017-09-13 | 2019-04-04 | 株式会社 オルタステクノロジー | CHARACTERISTIC VALUE MEASUREMENT DEVICE, METHOD, AND PROGRAM USING COLORED IMAGE |
| CN107860766A (en) * | 2017-10-24 | 2018-03-30 | 吉林大学 | Dry chemical method accurate detection device and method based on color sensor |
| KR102016989B1 (en) | 2017-11-29 | 2019-09-02 | 한양대학교 산학협력단 | Urine test strip including timer, method for detecting and analyzing urine test strip |
| CN108037120A (en) * | 2017-12-14 | 2018-05-15 | 长春理工大学 | A method for detecting hemoglobin before blood donation |
| KR102340166B1 (en) | 2018-02-26 | 2021-12-16 | 에프. 호프만-라 로슈 아게 | Methods and systems for calibrating and using a camera to detect an analyte in a sample |
| JP6677273B2 (en) * | 2018-05-31 | 2020-04-08 | 佳則 山口 | Micro-sampling chip and inspection device using the micro-sampling chip |
| JP7242476B2 (en) * | 2018-08-30 | 2023-03-20 | 株式会社J-オイルミルズ | Oil deterioration degree measuring device, oil deterioration degree measuring method and oil deterioration degree measuring program |
| ES2921005T3 (en) * | 2018-10-31 | 2022-08-16 | Hoffmann La Roche | Devices and method for measuring an analyte concentration in a body fluid sample |
| KR102605420B1 (en) * | 2018-11-30 | 2023-11-22 | 에프. 호프만-라 로슈 아게 | How to measure the concentration of an analyte in body fluids |
| CN110196250A (en) * | 2019-05-29 | 2019-09-03 | 江汉大学 | The detection method and processing equipment of Cr VI based on color component value |
| KR102226943B1 (en) * | 2019-06-07 | 2021-03-11 | 주식회사 큐에스택 | Detection method and detection pad |
| WO2021023961A1 (en) * | 2019-08-08 | 2021-02-11 | Testcard Ltd. | Bodily fluid testing equipment |
| PL3825691T3 (en) * | 2019-11-25 | 2023-03-13 | F. Hoffmann-La Roche Ag | Method of determining a concentration of an analyte in a bodily fluid |
| EP3865862A1 (en) | 2020-02-13 | 2021-08-18 | Roche Diabetes Care GmbH | Method for enhanced determination of analyte concentration in bodily fluid |
| WO2021180442A1 (en) * | 2020-03-07 | 2021-09-16 | Immundiagnostik Ag | Calibration of a digital camera for use as a scanner |
| EP3985382A1 (en) * | 2020-10-14 | 2022-04-20 | Roche Diabetes Care GmbH | A method of controlling auto-exposure settings of a mobile device having a camera |
| JP2022175888A (en) * | 2021-05-14 | 2022-11-25 | 株式会社日立産機システム | Print and reading system |
| PL4141860T3 (en) * | 2021-08-27 | 2025-10-06 | F. Hoffmann-La Roche Ag | Methods and devices for controlling auto white balance settings of a mobile device for a color based measurement using a color reference card |
| CN115259213A (en) * | 2022-07-20 | 2022-11-01 | 南京钛白化工有限责任公司 | Hydrolysis seed crystal preparation regulation and control method, device, equipment and storage medium |
| CN115512136A (en) * | 2022-08-26 | 2022-12-23 | 华南师范大学 | Test paper color difference identification method and device, electronic equipment and storage medium |
| CN120380329A (en) | 2022-12-22 | 2025-07-25 | 豪夫迈·罗氏有限公司 | Method for enhanced determination of analyte concentration in body fluids |
| WO2025103968A1 (en) * | 2023-11-15 | 2025-05-22 | F. Hoffmann-La Roche Ag | Ivd system and method of using an ivd consumable device susceptible to environmental conditions |
| WO2025115714A1 (en) * | 2023-11-28 | 2025-06-05 | Toppanホールディングス株式会社 | Biological information inference device, biological information inference method, and program |
Citations (11)
| Publication number | Priority date | Publication date | Assignee | Title |
|---|---|---|---|---|
| US4877580A (en) * | 1988-02-09 | 1989-10-31 | Technimed Corporation | Assay kit including an analyte test strip and a color comparator |
| JPH09101305A (en) * | 1995-10-06 | 1997-04-15 | Kdk Corp | Urine test paper capable of measuring time simultaneously |
| JPH09105750A (en) * | 1995-10-09 | 1997-04-22 | Kdk Corp | Measuring method corrected in hematocrit value |
| JP2004535576A (en) * | 2001-06-29 | 2004-11-25 | インターナショナル・ビジネス・マシーンズ・コーポレーション | Blood sample measurement test |
| JP2005009866A (en) * | 2003-06-16 | 2005-01-13 | Fuji Photo Film Co Ltd | Data reader in analyzer |
| JP2007101482A (en) * | 2005-10-07 | 2007-04-19 | Matsushita Electric Ind Co Ltd | Measuring chip and analysis method thereof |
| JP2008116234A (en) * | 2006-11-01 | 2008-05-22 | Nippon Telegr & Teleph Corp <Ntt> | Environment sensing apparatus and method using image |
| JP2009025290A (en) * | 2007-06-19 | 2009-02-05 | Fujifilm Corp | Inspection sheet |
| JP2010091470A (en) * | 2008-10-09 | 2010-04-22 | Nippon Telegr & Teleph Corp <Ntt> | System and method of measuring gas concentration by electronic image colorimetric method |
| JP2010281728A (en) * | 2009-06-05 | 2010-12-16 | Nippon Telegr & Teleph Corp <Ntt> | Gas concentration measuring apparatus and gas concentration measuring method |
| WO2012131386A1 (en) * | 2011-03-31 | 2012-10-04 | Albagaia Limited | Testing apparatus |
Family Cites Families (40)
| Publication number | Priority date | Publication date | Assignee | Title |
|---|---|---|---|---|
| AU601635B2 (en) * | 1987-11-09 | 1990-09-13 | Boehringer Mannheim Corporation | Test sample color comparison device |
| JPH01138458A (en) * | 1987-11-25 | 1989-05-31 | Dainippon Printing Co Ltd | body fluid test body |
| JPH0612961U (en) * | 1992-07-17 | 1994-02-18 | 凸版印刷株式会社 | Test pieces |
| US5843691A (en) * | 1993-05-15 | 1998-12-01 | Lifescan, Inc. | Visually-readable reagent test strip |
| JPH0735703A (en) * | 1993-06-28 | 1995-02-07 | Kawasaki Steel Corp | Image processing method |
| US5408535A (en) * | 1993-09-07 | 1995-04-18 | Miles Inc. | Video test strip reader and method for evaluating test strips |
| US5719034A (en) * | 1995-03-27 | 1998-02-17 | Lifescan, Inc. | Chemical timer for a visual test strip |
| US5972715A (en) * | 1996-12-23 | 1999-10-26 | Bayer Corporation | Use of thermochromic liquid crystals in reflectometry based diagnostic methods |
| JPH11133027A (en) * | 1997-10-30 | 1999-05-21 | Kdk Corp | Instrument for analyzing component in red blood corpuscle |
| US6830934B1 (en) * | 1999-06-15 | 2004-12-14 | Lifescan, Inc. | Microdroplet dispensing for a medical diagnostic device |
| JP2003173375A (en) * | 2001-09-28 | 2003-06-20 | Toshiba Corp | Life management terminal device, life management method and life management system |
| US7267799B1 (en) * | 2002-08-14 | 2007-09-11 | Detekt Biomedical, L.L.C. | Universal optical imaging and processing system |
| WO2004074827A1 (en) * | 2003-02-21 | 2004-09-02 | Matsushita Electric Industrial Co., Ltd. | Measuring instrument for biosensor and measuring method using same |
| JP2004302498A (en) * | 2003-03-28 | 2004-10-28 | Matsushita Electric Ind Co Ltd | Eating habit improvement support device |
| DE10343896A1 (en) * | 2003-09-19 | 2005-04-28 | Roche Diagnostics Gmbh | Testing device for the examination of body fluids |
| JP4626938B2 (en) * | 2003-12-10 | 2011-02-09 | 旭化成ファーマ株式会社 | Test tool and measuring method |
| KR100639776B1 (en) * | 2004-01-05 | 2006-10-27 | 바이오메드포토닉스 주식회사 | Lateral flow quantitative assay and strip and laser-induced surface fluorescence detection device and small scanner |
| WO2005088519A1 (en) * | 2004-03-05 | 2005-09-22 | Bayer Healthcare Llc | Hadheld optical diagnostic device having image system array |
| US20080267821A1 (en) * | 2004-04-16 | 2008-10-30 | Ngk Insulators, Ltd. | Test Piece for Analysis |
| US20060024835A1 (en) * | 2004-07-30 | 2006-02-02 | Matzinger David P | Analytical test strip with control zone |
| US20060281187A1 (en) * | 2005-06-13 | 2006-12-14 | Rosedale Medical, Inc. | Analyte detection devices and methods with hematocrit/volume correction and feedback control |
| EP1943499B1 (en) * | 2005-10-26 | 2010-02-10 | General Electric Company | Methods and systems for delivery of fluidic samples to sensor arrays |
| EP1801568A1 (en) * | 2005-12-21 | 2007-06-27 | Micronas Holding GmbH | Test strip and method for measuring analyte concentration in a biological fluid sample |
| WO2007116675A1 (en) * | 2006-03-28 | 2007-10-18 | Terumo Kabushiki Kaisha | Body fluid components measuring device |
| JP2009020026A (en) * | 2007-07-12 | 2009-01-29 | Fujifilm Corp | Inspection sheet |
| US8005280B2 (en) * | 2007-12-12 | 2011-08-23 | Jadak, Llc | Optical imaging clinical sampler |
| JP5427362B2 (en) * | 2008-03-25 | 2014-02-26 | テルモ株式会社 | Method and apparatus for measuring hematocrit value or blood component concentration |
| ATE481643T1 (en) * | 2008-06-05 | 2010-10-15 | Hoffmann La Roche | METHOD FOR DETERMINING AN ANALYTE IN A LIQUID SAMPLE AND ANALYZING DEVICE |
| EP2380009B1 (en) * | 2008-12-18 | 2015-01-28 | Bayer HealthCare LLC | Assembly for determining the temperature of a test sensor |
| WO2010081219A1 (en) * | 2009-01-13 | 2010-07-22 | Fio Corporation | A handheld diagnostic test device and method for use with an electronic device and a test cartridge in a rapid diagnostic test |
| EP2221608B1 (en) * | 2009-02-18 | 2015-08-12 | F. Hoffmann-La Roche AG | Test method for examining a bodily fluid |
| CN102576007A (en) * | 2009-04-15 | 2012-07-11 | 瑞莱诊断体系股份有限公司 | Expanding the dynamic range of a test strip |
| CN102028542B (en) * | 2009-09-29 | 2015-03-11 | 理康互联科技(北京)有限公司 | Information acquisition display system, method, device, medium, equipment and terminal |
| CN201662554U (en) * | 2010-01-18 | 2010-12-01 | 长庚医疗器材股份有限公司 | Test system and test piece structure thereof |
| US8391940B2 (en) * | 2010-02-04 | 2013-03-05 | Lifescan, Inc. | Methods and systems to correct for hematocrit effects |
| CN101832926B (en) * | 2010-03-19 | 2011-10-05 | 江南大学 | A non-destructive detection method for apple flourization using hyperspectral image technology |
| JP2012150096A (en) * | 2011-01-20 | 2012-08-09 | Middleland Sensing Technology Inc | Method and system for automatically determining test paper |
| CN102608107A (en) * | 2011-01-20 | 2012-07-25 | 中研应用感测科技股份有限公司 | Automatic test piece interpretation method and system |
| US20120188378A1 (en) * | 2011-01-20 | 2012-07-26 | Middleland Sensing Technology Inc. | Automatic analyzing method and system for test strips |
| CN102608042B (en) * | 2012-03-13 | 2014-07-16 | 北京航空航天大学 | Method for extrinsic allergen quantitative detection based on multispectral imaging |
-
2013
- 2013-04-16 JP JP2015543250A patent/JP6322643B2/en active Active
- 2013-04-16 EP EP13771998.5A patent/EP2941630B1/en active Active
- 2013-04-16 EP EP19182695.7A patent/EP3575781A3/en not_active Withdrawn
- 2013-04-16 ES ES13771998T patent/ES2746070T3/en active Active
- 2013-04-16 CN CN201380072319.9A patent/CN105899935B/en active Active
- 2013-04-16 CN CN201910536291.9A patent/CN110376192A/en active Pending
- 2013-04-16 EP EP19182663.5A patent/EP3578959A3/en not_active Withdrawn
-
2017
- 2017-06-16 JP JP2017118541A patent/JP6580627B2/en active Active
-
2019
- 2019-08-28 JP JP2019155196A patent/JP6906573B2/en active Active
-
2021
- 2021-06-29 JP JP2021107606A patent/JP7271611B2/en active Active
Patent Citations (12)
| Publication number | Priority date | Publication date | Assignee | Title |
|---|---|---|---|---|
| US4877580A (en) * | 1988-02-09 | 1989-10-31 | Technimed Corporation | Assay kit including an analyte test strip and a color comparator |
| JPH09101305A (en) * | 1995-10-06 | 1997-04-15 | Kdk Corp | Urine test paper capable of measuring time simultaneously |
| JPH09105750A (en) * | 1995-10-09 | 1997-04-22 | Kdk Corp | Measuring method corrected in hematocrit value |
| JP2004535576A (en) * | 2001-06-29 | 2004-11-25 | インターナショナル・ビジネス・マシーンズ・コーポレーション | Blood sample measurement test |
| JP2005009866A (en) * | 2003-06-16 | 2005-01-13 | Fuji Photo Film Co Ltd | Data reader in analyzer |
| JP2007101482A (en) * | 2005-10-07 | 2007-04-19 | Matsushita Electric Ind Co Ltd | Measuring chip and analysis method thereof |
| JP2008116234A (en) * | 2006-11-01 | 2008-05-22 | Nippon Telegr & Teleph Corp <Ntt> | Environment sensing apparatus and method using image |
| JP2009025290A (en) * | 2007-06-19 | 2009-02-05 | Fujifilm Corp | Inspection sheet |
| JP2010091470A (en) * | 2008-10-09 | 2010-04-22 | Nippon Telegr & Teleph Corp <Ntt> | System and method of measuring gas concentration by electronic image colorimetric method |
| JP2010281728A (en) * | 2009-06-05 | 2010-12-16 | Nippon Telegr & Teleph Corp <Ntt> | Gas concentration measuring apparatus and gas concentration measuring method |
| WO2012131386A1 (en) * | 2011-03-31 | 2012-10-04 | Albagaia Limited | Testing apparatus |
| JP2014514547A (en) * | 2011-03-31 | 2014-06-19 | アルバガイア リミテッド | Test equipment |
Also Published As
| Publication number | Publication date |
|---|---|
| JP7271611B2 (en) | 2023-05-11 |
| EP2941630A4 (en) | 2016-08-24 |
| EP3575781A2 (en) | 2019-12-04 |
| JP6322643B2 (en) | 2018-05-09 |
| JP6580627B2 (en) | 2019-09-25 |
| CN105899935A (en) | 2016-08-24 |
| JP2021177181A (en) | 2021-11-11 |
| JP2017201315A (en) | 2017-11-09 |
| JP6906573B2 (en) | 2021-07-21 |
| EP3578959A3 (en) | 2020-02-26 |
| CN110376192A (en) | 2019-10-25 |
| ES2746070T3 (en) | 2020-03-04 |
| JP2015536465A (en) | 2015-12-21 |
| EP2941630A1 (en) | 2015-11-11 |
| EP2941630B1 (en) | 2019-08-21 |
| EP3575781A3 (en) | 2020-02-26 |
| EP3578959A2 (en) | 2019-12-11 |
| CN105899935B (en) | 2019-06-18 |
Similar Documents
| Publication | Publication Date | Title |
|---|---|---|
| JP6906573B2 (en) | Test paper and reading method of test paper | |
| US9063091B2 (en) | Test strips and method for reading test strips | |
| KR102767313B1 (en) | Detection method for detecting an analyte in a sample | |
| EP3650843B1 (en) | Methods and devices for performing an analytical measurement | |
| US12455247B2 (en) | Devices and method for measuring an analyte concentration in a sample of bodily fluid | |
| TWI534430B (en) | Test strips and method for reading test strips | |
| TWI846721B (en) | Devices and method for measuring an analyte concentration in a sample of bodily fluid | |
| RU2797009C9 (en) | Devices and method for measuring analyte concentration in physiological fluid sample | |
| RU2797009C2 (en) | Devices and method for measuring analyte concentration in physiological fluid sample | |
| RU2792659C2 (en) | Methods and devices for carrying out analytical measurements | |
| BR112021008828B1 (en) | METHOD FOR PERFORMING AN ANALYTICAL MEASUREMENT, COMPUTER READABLE MEDIUM, MOBILE DEVICE AND KIT | |
| HK40050710A (en) | Devices and method for measuring an analyte concentration in a sample of bodily fluid |
Legal Events
| Date | Code | Title | Description |
|---|---|---|---|
| A521 | Request for written amendment filed |
Free format text: JAPANESE INTERMEDIATE CODE: A523 Effective date: 20190905 |
|
| A621 | Written request for application examination |
Free format text: JAPANESE INTERMEDIATE CODE: A621 Effective date: 20190905 |
|
| A977 | Report on retrieval |
Free format text: JAPANESE INTERMEDIATE CODE: A971007 Effective date: 20200826 |
|
| A131 | Notification of reasons for refusal |
Free format text: JAPANESE INTERMEDIATE CODE: A131 Effective date: 20200908 |
|
| A521 | Request for written amendment filed |
Free format text: JAPANESE INTERMEDIATE CODE: A523 Effective date: 20201207 |
|
| TRDD | Decision of grant or rejection written | ||
| A01 | Written decision to grant a patent or to grant a registration (utility model) |
Free format text: JAPANESE INTERMEDIATE CODE: A01 Effective date: 20210601 |
|
| A61 | First payment of annual fees (during grant procedure) |
Free format text: JAPANESE INTERMEDIATE CODE: A61 Effective date: 20210629 |
|
| R150 | Certificate of patent or registration of utility model |
Ref document number: 6906573 Country of ref document: JP Free format text: JAPANESE INTERMEDIATE CODE: R150 |
|
| S201 | Request for registration of exclusive licence |
Free format text: JAPANESE INTERMEDIATE CODE: R314201 |
|
| R350 | Written notification of registration of transfer |
Free format text: JAPANESE INTERMEDIATE CODE: R350 |
|
| R250 | Receipt of annual fees |
Free format text: JAPANESE INTERMEDIATE CODE: R250 |
|
| R250 | Receipt of annual fees |
Free format text: JAPANESE INTERMEDIATE CODE: R250 |