JP2016127390A - Information processing system, control method for information processing system, control program for management device - Google Patents
Information processing system, control method for information processing system, control program for management device Download PDFInfo
- Publication number
- JP2016127390A JP2016127390A JP2014265797A JP2014265797A JP2016127390A JP 2016127390 A JP2016127390 A JP 2016127390A JP 2014265797 A JP2014265797 A JP 2014265797A JP 2014265797 A JP2014265797 A JP 2014265797A JP 2016127390 A JP2016127390 A JP 2016127390A
- Authority
- JP
- Japan
- Prior art keywords
- calculated
- calculation unit
- traffic
- communication device
- information
- Prior art date
- Legal status (The legal status is an assumption and is not a legal conclusion. Google has not performed a legal analysis and makes no representation as to the accuracy of the status listed.)
- Withdrawn
Links
- 230000010365 information processing Effects 0.000 title claims abstract description 27
- 238000000034 method Methods 0.000 title claims description 36
- 238000004364 calculation method Methods 0.000 claims abstract description 103
- 238000004891 communication Methods 0.000 claims abstract description 59
- 238000012545 processing Methods 0.000 claims description 26
- 238000013508 migration Methods 0.000 claims description 7
- 230000005012 migration Effects 0.000 claims description 7
- 238000007726 management method Methods 0.000 description 44
- 238000010586 diagram Methods 0.000 description 21
- 238000013500 data storage Methods 0.000 description 10
- 108700028516 Lan-7 Proteins 0.000 description 4
- 238000012935 Averaging Methods 0.000 description 2
- 238000010606 normalization Methods 0.000 description 2
- 230000003247 decreasing effect Effects 0.000 description 1
- 230000006870 function Effects 0.000 description 1
- 238000012544 monitoring process Methods 0.000 description 1
- 239000004065 semiconductor Substances 0.000 description 1
- 238000012731 temporal analysis Methods 0.000 description 1
- 238000000700 time series analysis Methods 0.000 description 1
Images


Classifications
-
- H—ELECTRICITY
- H04—ELECTRIC COMMUNICATION TECHNIQUE
- H04L—TRANSMISSION OF DIGITAL INFORMATION, e.g. TELEGRAPHIC COMMUNICATION
- H04L43/00—Arrangements for monitoring or testing data switching networks
- H04L43/08—Monitoring or testing based on specific metrics, e.g. QoS, energy consumption or environmental parameters
- H04L43/0876—Network utilisation, e.g. volume of load or congestion level
-
- H—ELECTRICITY
- H04—ELECTRIC COMMUNICATION TECHNIQUE
- H04L—TRANSMISSION OF DIGITAL INFORMATION, e.g. TELEGRAPHIC COMMUNICATION
- H04L41/00—Arrangements for maintenance, administration or management of data switching networks, e.g. of packet switching networks
- H04L41/14—Network analysis or design
- H04L41/142—Network analysis or design using statistical or mathematical methods
-
- H—ELECTRICITY
- H04—ELECTRIC COMMUNICATION TECHNIQUE
- H04L—TRANSMISSION OF DIGITAL INFORMATION, e.g. TELEGRAPHIC COMMUNICATION
- H04L43/00—Arrangements for monitoring or testing data switching networks
- H04L43/06—Generation of reports
- H04L43/062—Generation of reports related to network traffic
-
- H—ELECTRICITY
- H04—ELECTRIC COMMUNICATION TECHNIQUE
- H04L—TRANSMISSION OF DIGITAL INFORMATION, e.g. TELEGRAPHIC COMMUNICATION
- H04L43/00—Arrangements for monitoring or testing data switching networks
- H04L43/06—Generation of reports
- H04L43/067—Generation of reports using time frame reporting
Landscapes
- Engineering & Computer Science (AREA)
- Computer Networks & Wireless Communication (AREA)
- Signal Processing (AREA)
- Environmental & Geological Engineering (AREA)
- Mathematical Analysis (AREA)
- General Physics & Mathematics (AREA)
- Algebra (AREA)
- Mathematical Optimization (AREA)
- Mathematical Physics (AREA)
- Probability & Statistics with Applications (AREA)
- Pure & Applied Mathematics (AREA)
- Physics & Mathematics (AREA)
- Data Exchanges In Wide-Area Networks (AREA)
- Small-Scale Networks (AREA)
Abstract
Description
本発明は、情報処理システム、情報処理システムの制御方法、及び管理装置の制御プログラムに関する。 The present invention relates to an information processing system, an information processing system control method, and a management apparatus control program.
データセンタ内部等に構築された情報処理システムにおいては、複数の仮想オブジェクト(例えば、仮想マシンや仮想ルータ等)が複数の物理マシン上で実行される。そのため、特定の物理マシンに仮想オブジェクトが集中的に配置されると、物理マシンをつなぐネットワークのトラフィックが特定の経路に集中し、所望のスループットを得られなくなる場合がある。但し、ネットワークのトラフィックの予測値を求めることができれば、求めた予測値に応じて仮想オブジェクトのマイグレーション等を行うことで、トラフィックの偏りを解消することができる。 In an information processing system built inside a data center or the like, a plurality of virtual objects (for example, virtual machines and virtual routers) are executed on a plurality of physical machines. For this reason, if virtual objects are concentrated on a specific physical machine, network traffic connecting the physical machines may be concentrated on a specific path and a desired throughput may not be obtained. However, if a predicted value of network traffic can be obtained, migration of virtual objects or the like according to the obtained predicted value can eliminate the traffic bias.
ネットワークのトラフィックは基本的には時々刻々と変動するが、一定の周期で一定の変動を繰り返すような場合がある。時系列解析においては、変動の性質が時点に依存せず一定であるようなデータを、定常性(Stationarity)を有するデータと呼ぶ。より具体的には、(1)期待値E[vt]が時点によらず(すなわち、任意の時間tに関して)一定であるという条件、及び、(2)自己共分散C(vt,vt+k)が時間差kのみに依存するという条件、の両方を満たすデータが定常性を有するデータである。 Basically, network traffic fluctuates from moment to moment, but there are cases in which constant fluctuations are repeated at regular intervals. In the time series analysis, data in which the nature of fluctuation is constant without depending on the time point is referred to as data having stationarity. More specifically, (1) the condition that the expected value E [v t ] is constant regardless of the time point (that is, regarding an arbitrary time t), and (2) the autocovariance C (v t , v Data satisfying both of the conditions that t + k ) depends only on the time difference k is data having continuity.
図1に、定常性を有するトラフィックの一例を示す。図1には、時点t1からt12までの間におけるトラフィック(単位はMbps(Mega bit per second))の時系列データが示されている。図1の例では、トラフィックは100Mbpsになった後に300Mbpsになり、300Mbpsになった後に100Mbpsになるという変化を繰り返している。 FIG. 1 shows an example of traffic having continuity. FIG. 1 shows time-series data of traffic (unit: Mbps (Mega bit per second)) between time points t 1 and t 12 . In the example of FIG. 1, the traffic changes to 300 Mbps after reaching 100 Mbps, and repeatedly changes to 100 Mbps after reaching 300 Mbps.
ここで、予測値の算出に単純移動平均(Simple Moving Average)を利用することを考える。時点t12において、時点t8乃至t12におけるトラフィックの単純平均を時点t13のトラフィックの予測値として算出すると、トラフィックの予測値は220Mbpsになる。また、仮に時点t13におけるトラフィックが100Mbpsであるとし、時点t13において、時点t9乃至t13におけるトラフィックの単純平均を時点t14のトラフィックの予測値として算出すると、トラフィックの予測値は180Mbpsになる。時刻t15以降の予測値も同様に単純移動平均で予測値を算出すると、トラフィックの予測値は180Mbps或いは220Mbpsになり、実際のトラフィックの変動を正確に予測することができない。 Here, it is considered that a simple moving average is used to calculate a predicted value. At time t 12, when calculating the simple average of the traffic at time t 8 to t 12 as the predicted value of the traffic time t 13, the predicted value of the traffic becomes 220 Mbps. Further, the traffic is 100Mbps in if the time t 13, at time t 13, when calculating the simple average of the traffic at time t 9 to t 13 as the predicted value of the traffic time t 14, the predicted value of traffic to 180Mbps Become. Similarly, if the predicted value after time t 15 is calculated by a simple moving average, the predicted value of traffic becomes 180 Mbps or 220 Mbps, and the actual traffic fluctuation cannot be accurately predicted.
定常性を有するトラフィックの予測に、単純移動平均以外の手法(例えば、加重平均(Weighted Average))を利用する技術も存在する。しかし、加重平均を利用する場合、何らかの方法で重みを適切に設定しなければ、予測値を高い精度で算出することはできない。 There is also a technique that uses a method other than a simple moving average (for example, a weighted average) for prediction of traffic having continuity. However, when the weighted average is used, the predicted value cannot be calculated with high accuracy unless the weight is appropriately set by some method.
従って、本発明の目的は、1つの側面では、定常性を有するトラフィックについて、予測値をより高い精度で算出するための技術を提供することである。 Accordingly, an object of the present invention is, in one aspect, to provide a technique for calculating a predicted value with higher accuracy for traffic having continuity.
本発明に係る情報処理システムは、通信装置と、通信装置を管理する管理装置とを有する。そして、上で述べた管理装置は、通信装置から、通信装置のポートにおける通信量の情報を複数の時点について取得する取得部と、取得部が取得した、複数の時点についての通信量の情報に基づき、複数の自己相関係数を算出する第1算出部と、第1算出部が算出した複数の自己相関係数に基づき、複数の重みを算出する第2算出部と、第2算出部が算出した複数の重みと、複数の時点についての通信量の情報とに基づき、複数の時点における通信量の加重平均を算出する第3算出部とを有する。 An information processing system according to the present invention includes a communication device and a management device that manages the communication device. Then, the management device described above includes, from the communication device, an acquisition unit that acquires communication amount information at a port of the communication device for a plurality of time points, and information on the communication amount at a plurality of time points that is acquired by the acquisition unit. A first calculator that calculates a plurality of autocorrelation coefficients, a second calculator that calculates a plurality of weights based on the plurality of autocorrelation coefficients calculated by the first calculator, and a second calculator A third calculating unit configured to calculate a weighted average of the traffic at a plurality of times based on the calculated weights and the information on the traffic at the plurality of times;
1つの側面では、定常性を有するトラフィックについて、予測値をより高い精度で算出できるようになる。 In one aspect, a predicted value can be calculated with higher accuracy for traffic having continuity.
以下で説明する実施の形態においては、予測値の算出に加重移動平均(Weighted Moving Average)を利用し、且つ、加重移動平均の重みの算出に自己相関係数を利用することで、予測値をより正確に算出できるようにする。 In the embodiment described below, a predicted value is calculated by using a weighted moving average for calculating a predicted value and using an autocorrelation coefficient for calculating a weight of the weighted moving average. To be able to calculate more accurately.
[実施の形態1]
図2に、第1の実施の形態におけるシステムの概要を示す。本実施の形態における主要な処理を実行する管理サーバ1は、管理用のLAN(Local Area Network)である管理LAN7に接続される。
[Embodiment 1]
FIG. 2 shows an overview of the system according to the first embodiment. The
物理スイッチ31は管理LAN7に接続され、物理スイッチ31はポート31A及び31Bを有する。物理スイッチ32はポート32A及び32Bを有し、ポート32Aとポート31Aとを接続するリンクによって物理スイッチ32と物理スイッチ31とが接続される。
The physical switch 31 is connected to the management LAN 7, and the physical switch 31 has
物理スイッチ33はポート33A及び33Bを有し、ポート33Aとポート31Bとを接続するリンクによって物理スイッチ33と物理スイッチ31とが接続される。
The
物理サーバ51はポート51Aを有し、VM(Virtual Machine)511と、VSW(Virtual SWitch)512と、VR(Virtual Router)513とを実行する。物理サーバ51は、ポート51Aとポート32Bとを接続するリンクによって物理スイッチ32に接続される。VM511はポート(例えば仮想ポート)511Aを有し、VSW512はポート(例えば仮想ポート)512A乃至512Cを有し、VR513はポート(例えば仮想ポート)513A及び513Bを有する。
The
物理サーバ52はポート52Aを有し、VM521と、VSW522と、VR523とを実行する。物理サーバ52は、ポート52Aとポート33Bとを接続するリンクによって物理スイッチ33に接続される。VM521はポート(例えば仮想ポート)521Aを有し、VSW522はポート(例えば仮想ポート)522A乃至522Cを有し、VR523はポート(例えば仮想ポート)523A及び523Bを有する。
The
なお、図2においては管理サーバ1及び物理スイッチ31のみが管理LAN7に接続されているが、管理サーバ1及び物理スイッチ31以外の物理スイッチ及び物理サーバが管理LAN7に接続されてもよい。また、図2に示したシステムにおいては中継装置として物理スイッチを利用するが、中継装置として物理ルータを利用するシステムであってもよい。
In FIG. 2, only the
本実施の形態においては、VM511のポート511A及びVM521のポート521A以外のポートにおけるトラフィックが管理サーバ1により監視される。具体的には、図3に示すように、管理サーバ1は、ポート31A及び31Bと、ポート32A及び32Bと、ポート33A及び33Bと、ポート51Aと、ポート512A乃至512Cと、ポート513A及び513Bと、ポート52Aと、ポート522A乃至522Cと、ポート523A及び523Bとを監視する。
In the present embodiment, the
図4に、第1の実施の形態における管理サーバ1の機能ブロック図を示す。管理サーバ1は、収集部10と、トラフィックデータ格納部11と、算出部12と、自己相関係数格納部13と、重み格納部14と、予測値格納部16と、制御部17とを有する。算出部12は、第1算出部121と、第2算出部122と、第3算出部123とを有する。
FIG. 4 shows a functional block diagram of the
収集部10は、監視の対象であるポートから、定期的に(例えば10秒毎に)トラフィックデータを収集し、トラフィックデータ格納部11に格納する。算出部12における第1算出部121は、トラフィックデータ格納部11に格納されたトラフィックデータを用いて自己相関係数を算出し、自己相関係数を自己相関係数格納部13に格納する。算出部12における第2算出部122は、自己相関係数格納部13に格納された自己相関係数に基づき加重平均の重みを算出し、重み格納部14に格納する。算出部12における第3算出部123は、トラフィックデータ格納部11に格納されたトラフィックデータ、自己相関係数格納部13に格納された自己相関係数、及び重み格納部14に格納された重みに基づきトラフィックの予測値を算出し、予測値格納部16に格納する。制御部17は、予測値格納部16に格納された予測値に基づき、仮想オブジェクトのマイグレーションを制御する。
The
図5に、トラフィックデータ格納部11に格納されるデータの一例を示す。図5の例では、各時点についてトラフィックの値が格納される。本実施の形態においては、トラフィックデータ格納部11には、監視の対象であるポート毎に、各時点についてのトラフィックの値が格納される。
FIG. 5 shows an example of data stored in the traffic
次に、図6乃至図13を用いて、管理サーバ1の動作について説明する。説明を簡単にするため、ここでは、特定の1ポートについて予測値を算出する場合の動作について説明する。
Next, the operation of the
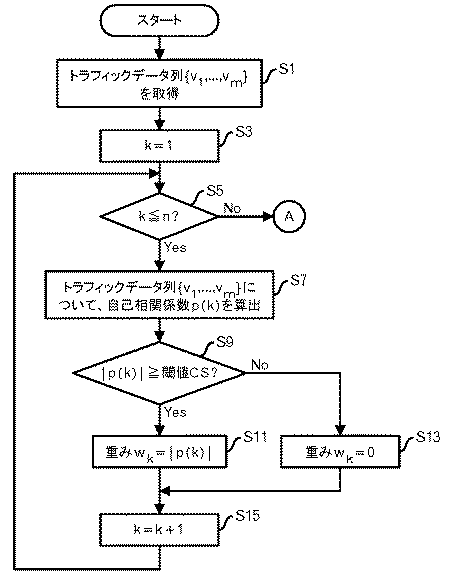
まず、管理サーバ1における第1算出部121は、トラフィックデータ格納部11から、特定のポートについてトラフィックデータ列{v1,...,vm-1,vm}を取得する(図6:ステップS1)。ここで、mはトラフィックデータ列の長さを表す変数であり、vmは最新のトラフィック値である。mの値は、管理者により予め設定される。mの値を大きくすれば、より長い期間について平均を算出することができる。
First, the
第1算出部121は、ラグを表す変数であるkをk=1に設定し(ステップS3)、k≦nが成立するか判断する(ステップS5)。ここで、nはラグkの最大値を表す変数であり、管理者により、n<mとなるように予め設定される。
The
k≦nが成立する場合(ステップS5:Yesルート)、第1算出部121は、トラフィックデータ列{v1,...,vm}について、自己相関係数p(k)を算出し(ステップS7)、自己相関係数格納部13に格納する。ラグがkである場合、トラフィックデータ列{v1,...,vm-k}及びトラフィックデータ列{vk+1,...,vm}から、以下の式により自己相関係数p(k)が算出される。
When k ≦ n holds (step S5: Yes route), the
ここで、avg(v)はトラフィックデータ列{v1,...,vm}の平均値を表し、上で述べたように、kはラグを表す。算出されるp(k)は、−1≦p(k)≦1を満たす。 Here, avg (v) is a traffic data string {v 1 ,. . . , V m }, and as described above, k represents lag. The calculated p (k) satisfies −1 ≦ p (k) ≦ 1.
図7に示す例を用いて、自己相関係数の算出について具体的に説明する。図7の例においては、m=5であり、k=2であるとする。この場合、トラフィックデータ列{v1,v2,v3}及びトラフィックデータ列{v3,v4,v5}からp(2)が算出される。なお、k=3である場合には、トラフィックデータ列{v1,v2}及びトラフィックデータ列{v4,v5}からp(3)が算出される。 The calculation of the autocorrelation coefficient will be specifically described using the example shown in FIG. In the example of FIG. 7, it is assumed that m = 5 and k = 2. In this case, p (2) is calculated from the traffic data sequence {v 1 , v 2 , v 3 } and the traffic data sequence {v 3 , v 4 , v 5 }. When k = 3, p (3) is calculated from the traffic data sequence {v 1 , v 2 } and the traffic data sequence {v 4 , v 5 }.
図8に、自己相関係数格納部13に格納されるデータの一例を示す。図8の例では、kの値毎に自己相関係数p(k)が格納される。本実施の形態においては、自己相関係数格納部13には、監視の対象である各ポートについて、kの値毎にp(k)の値が格納される。
FIG. 8 shows an example of data stored in the autocorrelation
図6の説明に戻り、第2算出部122は、|p(k)|≧CSが成立するか判断する(ステップS9)。CSは、自己相関計数についての閾値であり、例えば0.6である。|p(k)|≧CSが成立する場合(ステップS9:Yesルート)、第2算出部122は、重みwkをwk=|p(k)|に設定し(ステップS11)、重みwkを重み格納部14に格納する。|p(k)|≧CSが成立しない場合(ステップS9:Noルート)、第2算出部122は、重みwkをwk=0に設定し(ステップS13)、重みwkを重み格納部14に格納する。
Returning to the description of FIG. 6, the
図9に、重み格納部14に格納されるデータの一例を示す。図9の例では、kの値毎に重みwkが格納される。本実施の形態においては、重み格納部14には、監視の対象である各ポートについて、kの値毎にwkの値が格納される。
FIG. 9 shows an example of data stored in the
そして、第2算出部122は、ラグkを1インクリメントする(ステップS15)。そしてステップS5の処理に戻る。
Then, the
一方、k≦nが成立しない場合(ステップS5:Noルート)、処理は端子Aを介して図10のステップS17に移行する。 On the other hand, if k ≦ n does not hold (step S5: No route), the process proceeds to step S17 in FIG.
図10の説明に移行し、第3算出部123は、全てのk(k=1,2,...,n)についてwk=0が成立するか判断する(ステップS17)。全てのk(k=1,2,...,n)についてwk=0が成立する場合(ステップS17:Yesルート)、第3算出部123は、予測値vをv=(v1+...+vm)/mによって算出し(ステップS19)、予測値格納部16に格納する。すなわち、単純平均によって予測値vを算出する。そして処理を終了する。
10, the
一方、全てのk(k=1,2,...,n)についてwk=0が成立するわけではない場合(ステップS17:Noルート)、第3算出部123は、予測値vをv=0に設定する(ステップS21)。
On the other hand, when w k = 0 does not hold for all k (k = 1, 2,..., N) (step S17: No route), the
第3算出部123は、ラグを表す変数kをk=1に設定し(ステップS23)、k≦nが成立するか判断する(ステップS25)。k≦nが成立する場合(ステップS25:Yesルート)、第3算出部123は、p(k)>0が成立するか判断する(ステップS29)。
The
p(k)>0が成立する場合(ステップS29:Yesルート)、第3算出部123は、予測値vをv=v+wn-k*vkに設定する(ステップS31)。そしてステップS37の処理に移行する。
When p (k)> 0 is satisfied (step S29: Yes route), the
p(k)>0が成立しない場合(ステップS29:Noルート)、第3算出部123は、p(k)<0が成立するか判断する(ステップS33)。p(k)<0が成立する場合(ステップS33:Yesルート)、第3算出部123は、予測値vをv=v+wn-k*(2*avg(v)−vk)に設定する(ステップS35)。そしてステップS37の処理に移行する。図11を用いて、ステップS35の処理について説明する。図11に示すように、2*avg(v)−vkはavg(v)より(vk−avg(k))小さい値であり、vkはavg(v)より(vk−avg(k))大きい値である。このようにすれば、自己相関係数が負である場合にはより小さな値がvに加算されるようになり、自己相関係数が正である場合にはより大きな値がvに加算されるようになる。
When p (k)> 0 is not satisfied (step S29: No route), the
一方、p(k)<0が成立しない場合(ステップS33:Noルート)、第3算出部123は、kを1インクリメントする(ステップS37)。そしてステップS25の処理に戻る。
On the other hand, when p (k) <0 is not satisfied (step S33: No route), the
そして、k≦nが成立しないと判断された場合(ステップS25:Noルート)、第3算出部123は、予測値vをv=v/(w1+...+wn)に設定し(ステップS27)、予測値vを予測値格納部16に格納する。本処理は正規化に相当する。そして処理を終了する。
If it is determined that k ≦ n does not hold (step S25: No route), the
図12に、予測値格納部16に格納されるデータの一例を示す。図12の例では、各ポートについて、或る時点における予測値が格納される。本実施の形態においては、トラフィックデータ格納部11に新たな時点のトラフィックデータが格納される度に算出部12が処理を実行し、予測値格納部16に格納された予測値を更新する。
FIG. 12 shows an example of data stored in the predicted
以上のように自己相関係数を算出すれば、自己相関係数は、トラフィックデータ列とトラフィックデータ列を時間シフトしたデータ列との類似の度合いを表す。そして、自己相関係数に基づき加重平均の重みを算出するので、元のトラフィックデータ列との類似度が高いデータ列の影響を強く受けるようにすることができる。これにより、定常性を有するトラフィックについて、予測値をより高い精度で算出できるようになる。特に、自己相関係数の絶対値が閾値CSより小さい場合にはその自己相関係数に対応するトラフィックを予測値の算出に利用しないので、予測値の精度が低下することを抑制できるようになる。 If the autocorrelation coefficient is calculated as described above, the autocorrelation coefficient represents the degree of similarity between the traffic data string and the data string obtained by time-shifting the traffic data string. Since the weighted average weight is calculated based on the autocorrelation coefficient, it is possible to strongly influence the data string having a high degree of similarity with the original traffic data string. As a result, the predicted value can be calculated with higher accuracy for the traffic having continuity. In particular, when the absolute value of the autocorrelation coefficient is smaller than the threshold value CS, traffic corresponding to the autocorrelation coefficient is not used for calculation of the predicted value, so that it is possible to suppress a decrease in accuracy of the predicted value. .
例えば図1の例において、m=5、n=2、CS=0.6として、時点t6におけるトラフィックを予測することを考える。この場合、トラフィックデータ列は{100,300,100,300,100}であり、p(1)=−0.8、p(2)=0.6となり、w(1)=0.8、w(2)=0.6となる。すると、予測値vは、v=(w1*v5+w2*v4)/(w1+w2)=(0.8*(2*180−100)+0.6*300)/(0.8+0.6)≒277となる。よって、単純平均を利用する場合よりも予測値の精度が向上する。 For example, in the example of FIG. 1, it is assumed that m = 5, n = 2, and CS = 0.6, and that traffic at time t 6 is predicted. In this case, the traffic data sequence is {100, 300, 100, 300, 100}, p (1) = − 0.8, p (2) = 0.6, and w (1) = 0.8. w (2) = 0.6. Then, the predicted value v is v = (w 1 * v 5 + w 2 * v 4 ) / (w 1 + w 2 ) = (0.8 * (2 * 180−100) + 0.6 * 300) / (0 .8 + 0.6) ≈277. Therefore, the accuracy of the predicted value is improved as compared with the case of using the simple average.
次に、図13を用いて、予測値に基づきトラフィックを制御する処理について説明する。本処理は、例えば、予測値格納部16に格納された予測値が更新される度に実行される。
Next, processing for controlling traffic based on the predicted value will be described with reference to FIG. This process is executed each time the predicted value stored in the predicted
まず、制御部17は、予測値格納部16から、各ポートについての予測値を読み出す(図13:ステップS41)。そして、制御部17は、ステップS41において読み出された予測値に応じて、仮想オブジェクトのマイグレーションを実行する(ステップS43)。そして処理を終了する。
First, the
例えば、或るポート(ポートAとする)におけるトラフィックが他のポートにおけるトラフィックより極端に多い場合、ポートAを有する装置内の仮想オブジェクトを他の装置に移動することで、ポートAにおけるトラフィックを減らす。なお、場合によっては、仮想オブジェクトのマイグレーションが行われない場合もある。 For example, if the traffic on a certain port (referred to as port A) is extremely greater than the traffic on another port, the traffic on port A is reduced by moving the virtual object in the device having port A to the other device. . In some cases, virtual object migration may not be performed.
[実施の形態2]
第2の実施の形態においては、階差データ列を用いて算出した自己相関係数に基づき加重平均の重みを決定する方法について説明する。
[Embodiment 2]
In the second embodiment, a method for determining a weighted average weight based on an autocorrelation coefficient calculated using a difference data string will be described.
図14に、第2の実施の形態における管理サーバ1の機能ブロック図を示す。管理サーバ1は、収集部10と、トラフィックデータ格納部11と、算出部12と、自己相関係数格納部13と、重み格納部14と、階差データ列格納部15と、予測値格納部16と、制御部17とを有する。算出部12は、第1算出部121と、第2算出部122と、第3算出部123とを有する。第2の実施の形態における管理サーバ1は、第1の実施の形態の管理サーバ1とは階差データ列格納部15を有するという点で異なる。
FIG. 14 shows a functional block diagram of the
次に、図15乃至図19を用いて、管理サーバ1の動作について説明する。説明を簡単にするため、ここでは、特定の1ポートについて予測値を算出する場合の動作について説明する。
Next, the operation of the
まず、管理サーバ1における第1算出部121は、トラフィックデータ格納部11から、特定のポートについてトラフィックデータ列{v1,...,vm-1,vm}を取得する(図15:ステップS51)。ここで、mはトラフィックデータ列の長さを表す変数であり、vmは最新のトラフィック値である。mの値は、管理者により予め設定される。
First, the
第1算出部121は、ステップS51において取得したトラフィックデータ列から、階差データ列{d1,...,dm-1}を生成する(ステップS53)。なお、或るデータ列{x1,...,xm}についての階差データ列は、{(x2−x1),...,(xm−xm-1)}である。
The
第1算出部121は、ラグを表す変数であるkをk=1に設定し(ステップS55)、k≦nが成立するか判断する(ステップS57)。ここで、nはラグkの最大値を表す変数であり、管理者により、n<mとなるように予め設定される。
The
k≦nが成立する場合(ステップS57:Yesルート)、第1算出部121は、階差データ列{d1,...,dm-1}について、自己相関係数p(k)を算出し(ステップS59)、自己相関係数格納部13に格納する。
When k ≦ n is satisfied (step S57: Yes route), the
第2算出部122は、|p(k)|≧CSが成立するか判断する(ステップS61)。CSは、自己相関計数についての閾値である。|p(k)|≧CSが成立する場合(ステップS61:Yesルート)、第2算出部122は、重みwkをwk=|p(k)|に設定し(ステップS63)、重みwkを重み格納部14に格納する。|p(k)|≧CSが成立しない場合(ステップS61:Noルート)、第2算出部122は、重みwkをwk=0に設定し(ステップS65)、重みwkを重み格納部14に格納する。
The
そして、第2算出部122は、ラグkを1インクリメントする(ステップS67)。そしてステップS57の処理に戻る。
Then, the
一方、k≦nが成立しない場合(ステップS57:Noルート)、処理は端子Bを介して図16のステップS69に移行する。 On the other hand, if k ≦ n does not hold (step S57: No route), the process proceeds to step S69 in FIG.
図16の説明に移行し、第3算出部123は、全てのk(k=1,2,...,n)についてwk=0が成立するか判断する(図16:ステップS69)。全てのk(k=1,2,...,n)についてwk=0が成立する場合(ステップS69:Yesルート)、第3算出部123は、予測値vとvmとの差を表すΔvをΔv=(d1+...+dm-1)/(m−1)によって算出し(ステップS71)、予測値v=vm+Δvを予測値格納部16に格納する。すなわち、単純平均によってΔvを算出する。そして処理を終了する。
Shifting to the description of FIG. 16, the
一方、全てのk(k=1,2,...,n)についてwk=0が成立するわけではない場合(ステップS69:Noルート)、第3算出部123は、ΔvをΔv=0に設定する(ステップS73)。
On the other hand, if w k = 0 does not hold for all k (k = 1, 2,..., N) (step S69: No route), the
第3算出部123は、ラグを表す変数kをk=1に設定し(ステップS75)、k≦nが成立するか判断する(ステップS77)。k≦nが成立する場合(ステップS77:Yesルート)、第3算出部123は、p(k)>0が成立するか判断する(ステップS81)。
The
p(k)>0が成立する場合(ステップS81:Yesルート)、第3算出部123は、ΔvをΔv=Δv+wn-k*dkに設定する(ステップS83)。そしてステップS89の処理に移行する。
When p (k)> 0 is satisfied (step S81: Yes route), the
p(k)>0が成立しない場合(ステップS81:Noルート)、第3算出部123は、p(k)<0が成立するか判断する(ステップS85)。p(k)<0が成立する場合(ステップS85:Yesルート)、第3算出部123は、ΔvをΔv=Δv+wn-k*(2*avg(d)−dk)に設定する(ステップS87)。そしてステップS89の処理に移行する。ここで、avg(d)は階差データ列{d1,...,dm-1}の平均値を表す。
When p (k)> 0 is not satisfied (step S81: No route), the
一方、p(k)<0が成立しない場合(ステップS85:Noルート)、第3算出部123は、kを1インクリメントする(ステップS89)。そしてステップS77の処理に戻る。
On the other hand, when p (k) <0 is not satisfied (step S85: No route), the
そして、k≦nが成立しないと判断された場合(ステップS77:Noルート)、第3算出部123は、ΔvをΔv=Δv/(w1+...+wn)に設定し(ステップS79)、予測値v=vm+Δvを予測値格納部16に格納する。本処理は正規化に相当する。そして処理を終了する。
If it is determined that k ≦ n is not satisfied (step S77: No route), the
たとえトラフィックデータ列が定常性を有しないとしても、階差データ列が定常性を有する場合がある。従って、階差データ列の定常性を利用することで、予測値を高精度で算出できるようになる。 Even if the traffic data sequence does not have continuity, the difference data sequence may have continuity. Therefore, the predicted value can be calculated with high accuracy by utilizing the continuity of the difference data string.
例えば図1の例において、m=5、n=2、CS=0.6として、時点t6におけるトラフィックを予測することを考える。この場合、階差データ列は{200,−200,200,−200}であり、p(1)=−0.8、p(2)=0.5となり、w1=0.8、w2=0となる。すると、予測値vは、v=v5+(w1*d4+w2*d3)/(w1+w2)=100+(0.8*(2*0−(−200))+0*200)/(0.8)=300となる。よって、単純平均を利用する場合よりも予測値の精度が向上する。 For example, in the example of FIG. 1, it is assumed that m = 5, n = 2, and CS = 0.6, and that traffic at time t 6 is predicted. In this case, the difference data string is {200, −200, 200, −200}, p (1) = − 0.8, p (2) = 0.5, and w 1 = 0.8, w 2 = 0. Then, the predicted value v is v = v 5 + (w 1 * d 4 + w 2 * d 3 ) / (w 1 + w 2 ) = 100 + (0.8 * (2 * 0 − (− 200)) + 0 * 200) / (0.8) = 300. Therefore, the accuracy of the predicted value is improved as compared with the case of using the simple average.
図17乃至図19を用いて、第2の実施の形態に基づき算出した予測値と実際のトラフィックとの誤差について説明する。 An error between the predicted value calculated based on the second embodiment and the actual traffic will be described with reference to FIGS. 17 to 19.
図17に、トラフィックの変動の第1の例を示す。図17において、実線はトラフィックの実績値を表し、一点鎖線は単純平均に基づく予測値を表し、破線は第2の実施の形態に基づく予測値(m=12,n=5,CS=0.6とする)を表す。 FIG. 17 shows a first example of traffic fluctuation. In FIG. 17, the solid line represents the actual traffic value, the alternate long and short dash line represents the predicted value based on the simple average, and the broken line represents the predicted value based on the second embodiment (m = 12, n = 5, CS = 0. 6).
実際のトラフィックは、100Mbpsになった後に300Mbpsになり、300Mbpsになった後に100Mbpsになるという変化を繰り返している。単純平均に基づく予測値は100Mbpsと200Mbpsとの間の値になり、時間の経過とともに200Mbpsに収束する。第2の実施の形態に基づく予測値については、時点t5までは予測誤差が比較的大きいものの、時点t6以降は予測誤差が比較的小さくなる。 The actual traffic repeatedly changes to 300 Mbps after reaching 100 Mbps, and to 100 Mbps after reaching 300 Mbps. The predicted value based on the simple average is a value between 100 Mbps and 200 Mbps, and converges to 200 Mbps with the passage of time. Regarding the prediction value based on the second embodiment, the prediction error is relatively large until time t 5, but the prediction error is relatively small after time t 6 .
図18に、トラフィックの変動の第2の例を示す。図18において、実線はトラフィックの実績値を表し、一点鎖線は単純平均に基づく予測値を表し、破線は第2の実施の形態に基づく予測値(m=12,n=5,CS=0.6とする)を表す。 FIG. 18 shows a second example of traffic fluctuation. In FIG. 18, the solid line represents the actual value of traffic, the alternate long and short dash line represents the predicted value based on the simple average, and the broken line represents the predicted value based on the second embodiment (m = 12, n = 5, CS = 0. 6).
実際のトラフィックは、100Mbpsになった後に200Mbpsになり、200Mbpsになった後に300Mbpsになり、300Mbpsになった後に200Mbpsになり、200Mbpsになった後に100Mbpsになるという変化を繰り返している。単純平均に基づく予測値は100Mbpsと200Mbpsとの間の値になり、時間の経過とともに200Mbpsに収束する。第2の実施の形態に基づく予測値については、時点t7までは予測誤差が比較的大きく、時点t4においては予測誤差が200Mbpsに達する。しかしながら、時点t8以降は予測誤差が比較的小さくなる。 The actual traffic repeats the change of 200 Mbps after reaching 100 Mbps, 300 Mbps after reaching 200 Mbps, 200 Mbps after reaching 300 Mbps, and 100 Mbps after reaching 200 Mbps. The predicted value based on the simple average is a value between 100 Mbps and 200 Mbps, and converges to 200 Mbps with the passage of time. For the prediction value based on the second embodiment, the prediction error is relatively large until time t 7, and the prediction error reaches 200 Mbps at time t 4 . However, the prediction error becomes relatively small after time t 8 .
図19に、トラフィックの変動の第3の例を示す。図19において、実線はトラフィックの実績値を表し、一点鎖線は単純平均に基づく予測値を表し、破線は第2の実施の形態に基づく予測値(m=12,n=5,CS=0.6とする)を表す。 FIG. 19 shows a third example of traffic fluctuation. In FIG. 19, the solid line represents the actual traffic value, the alternate long and short dash line represents the predicted value based on the simple average, and the broken line represents the predicted value based on the second embodiment (m = 12, n = 5, CS = 0. 6).
実際のトラフィックは、300Mbpsになった後に0Mbpsになり、0Mbpsの状態が1インターバル続き、その後に300Mbpsに戻るという変化を繰り返している。単純平均に基づく予測値は、時点t4までは徐々に減少し、時点t4以降は100Mbpsと150Mbpsとの間の値になり、時間の経過とともに100Mbpsに収束する。第2の実施の形態に基づく予測値については、時点t7までは予測誤差が比較的大きく、時点t2、時点t4、時点t5、及び時点t7においては予測誤差が300Mbpsに達する。しかしながら、時点t8以降は予測誤差が無くなる。 The actual traffic is changed to 0 Mbps after reaching 300 Mbps, the state of 0 Mbps continues for one interval, and thereafter returns to 300 Mbps. Predicted value based on the simple average decreased gradually until time t 4, the time t 4 subsequent to the value of between 100Mbps and 150Mbps, converges to 100Mbps over time. The predicted value based on the second embodiment, until the time t 7 is the prediction error is relatively large, the time t 2, time t 4, the prediction error at time t 5 and time t 7, reaches 300 Mbps. However, the time t 8 or later there is no prediction error.
このように、第2の実施の形態に予測値によれば、定常性を有するトラフィックについての予測値の精度を、時間の経過とともに高めることができるようになる。 Thus, according to the predicted value in the second embodiment, the accuracy of the predicted value for traffic having continuity can be increased with the passage of time.
以上本発明の一実施の形態を説明したが、本発明はこれに限定されるものではない。例えば、上で説明した管理サーバ1の機能ブロック構成は実際のプログラムモジュール構成に一致しない場合もある。
Although one embodiment of the present invention has been described above, the present invention is not limited to this. For example, the functional block configuration of the
また、上で説明したデータ保持構成は一例であって、上記のような構成でなければならないわけではない。さらに、処理フローにおいても、処理結果が変わらなければ処理の順番を入れ替えることも可能である。さらに、並列に実行させるようにしても良い。 In addition, the data holding configuration described above is an example, and the above configuration is not necessarily required. Further, in the processing flow, the processing order can be changed if the processing result does not change. Further, it may be executed in parallel.
なお、上ではトラフィックデータ列を利用する処理(図6及び図10)と階差データ列を利用する処理(図15及び図16)とを別々に説明したが、前者の処理と後者の処理とを連動して実行してもよい。例えば、ステップS17において全てのk(k=1,2,...,n)についてwk=0が成立すると判断された場合に、後者の処理を実行してもよい。 In the above, the process using the traffic data string (FIGS. 6 and 10) and the process using the difference data string (FIGS. 15 and 16) have been described separately, but the former process and the latter process May be executed in conjunction with each other. For example, when it is determined in step S17 that w k = 0 holds for all k (k = 1, 2,..., N), the latter processing may be executed.
なお、上で述べた管理サーバ1、物理サーバ51及び物理サーバ52は、コンピュータ装置であって、図20に示すように、メモリ2501とCPU(Central Processing Unit)2503とハードディスク・ドライブ(HDD:Hard Disk Drive)2505と表示装置2509に接続される表示制御部2507とリムーバブル・ディスク2511用のドライブ装置2513と入力装置2515とネットワークに接続するための通信制御部2517とがバス2519で接続されている。オペレーティング・システム(OS:Operating System)及び本実施例における処理を実施するためのアプリケーション・プログラムは、HDD2505に格納されており、CPU2503により実行される際にはHDD2505からメモリ2501に読み出される。CPU2503は、アプリケーション・プログラムの処理内容に応じて表示制御部2507、通信制御部2517、ドライブ装置2513を制御して、所定の動作を行わせる。また、処理途中のデータについては、主としてメモリ2501に格納されるが、HDD2505に格納されるようにしてもよい。本発明の実施例では、上で述べた処理を実施するためのアプリケーション・プログラムはコンピュータ読み取り可能なリムーバブル・ディスク2511に格納されて頒布され、ドライブ装置2513からHDD2505にインストールされる。インターネットなどのネットワーク及び通信制御部2517を経由して、HDD2505にインストールされる場合もある。このようなコンピュータ装置は、上で述べたCPU2503、メモリ2501などのハードウエアとOS及びアプリケーション・プログラムなどのプログラムとが有機的に協働することにより、上で述べたような各種機能を実現する。
The
以上述べた本発明の実施の形態をまとめると、以下のようになる。 The embodiment of the present invention described above is summarized as follows.
本実施の形態の第1の態様に係る情報処理システムは、(A)通信装置と、(B)通信装置を管理する管理装置とを有する。そして、上で述べた管理装置は、(b1)通信装置から、通信装置のポートにおける通信量の情報を複数の時点について取得する取得部と、(b2)取得部が取得した、複数の時点についての通信量の情報に基づき、複数の自己相関係数を算出する第1算出部と、(b3)第1算出部が算出した複数の自己相関係数に基づき、複数の重みを算出する第2算出部と、(b4)第2算出部が算出した複数の重みと、複数の時点についての通信量の情報とに基づき、複数の時点における通信量の加重平均を算出する第3算出部とを有する。 The information processing system according to the first aspect of the present embodiment includes (A) a communication device and (B) a management device that manages the communication device. The management device described above includes (b1) an acquisition unit that acquires information on the amount of communication at a port of the communication device from a communication device at a plurality of time points, and (b2) a plurality of time points that the acquisition unit has acquired. A first calculating unit that calculates a plurality of autocorrelation coefficients based on the information on the traffic volume of the second, and (b3) a second that calculates a plurality of weights based on the plurality of autocorrelation coefficients calculated by the first calculating unit. A calculation unit; and (b4) a third calculation unit that calculates a weighted average of the traffic volume at a plurality of time points based on the plurality of weights calculated by the second calculation unit and the information on the traffic volume at a plurality of time points. Have.
定常性が有る通信量について自己相関係数を算出した場合、特定のラグについては自己相関係数が大きくなると考えられる。そこで、上で述べたようにすれば、例えば自己相関係数が大きい場合に重みを大きくできるので、予測値の精度を高められるようになる。 When the autocorrelation coefficient is calculated for the communication amount having continuity, it is considered that the autocorrelation coefficient increases for a specific lag. Thus, as described above, for example, when the autocorrelation coefficient is large, the weight can be increased, so that the accuracy of the predicted value can be increased.
また、上で述べた第2算出部は、(b3−1)複数の自己相関係数の各々について、当該自己相関係数の絶対値が所定の閾値以上であるか判断し、当該自己相関係数の絶対値が所定の閾値以上である場合、当該自己相関係数の絶対値を重みに設定し、当該自己相関係数の絶対値が第1の値未満である場合、重みを第2の値に設定してもよい。このようにすれば、予測値の算出に寄与すると考えられる通信量と、予測値の算出に寄与しないと考えられる通信量との扱いを変えることができるようになる。 In addition, the second calculation unit described above determines whether the absolute value of the autocorrelation coefficient is greater than or equal to a predetermined threshold for each of the plurality of autocorrelation coefficients (b3-1). If the absolute value of the number is greater than or equal to a predetermined threshold, the absolute value of the autocorrelation coefficient is set as a weight, and if the absolute value of the autocorrelation coefficient is less than the first value, the weight is set to the second It may be set to a value. In this way, it is possible to change the handling of the traffic that is considered to contribute to the calculation of the predicted value and the traffic that is considered not to contribute to the calculation of the predicted value.
また、上で述べた第3算出部は、(b4−1)第2算出部が算出した複数の重みのいずれも第2の値である場合、複数の重みの各々を1に設定して加重平均を算出してもよい。このようにすれば、定常性を有しない通信量については、単純平均と同じ値を算出できるようになる。 Further, the third calculation unit described above is (b4-1) When all of the plurality of weights calculated by the second calculation unit are the second value, the weights are set by setting each of the plurality of weights to 1. An average may be calculated. In this way, it becomes possible to calculate the same value as the simple average for the communication amount having no continuity.
また、複数の時点の数をmとし、nをn<mを満たす自然数とし、時点nにおける通信量をvnとし、時点nにおける重みをwnとし、複数の時点についての通信量の平均値をavgとすると、上で述べた第3算出部は、(b4−2)第1算出部が算出した自己相関係数が0より大きい場合、wn-k*vkを算出し、第1算出部が算出した自己相関係数が0より小さい場合、wn-k*(2*avg−vk)を算出することにより、複数の時点における通信量の加重平均を算出してもよい。このようにすれば、加重平均が適切に算出されるようになる。 Further, the number of a plurality of time points is m, n is a natural number satisfying n <m, the traffic volume at the time point n is v n , the weight at the time point n is w n, and the average value of the traffic volume at the plurality of time points Is avg, the third calculation unit described above calculates (b4-2) w nk * v k when the autocorrelation coefficient calculated by the first calculation unit is greater than 0, and the first calculation unit When the autocorrelation coefficient calculated by is smaller than 0, a weighted average of traffic at a plurality of time points may be calculated by calculating w nk * (2 * avg−v k ). In this way, the weighted average is appropriately calculated.
また、上で述べた第1算出部は、(b2−1)複数の時点についての通信量の情報から階差データ列を生成し、生成された当該階差データ列に基づき、複数の自己相関係数を算出してもよい。複数の時点についての通信量が定常性を有しない場合であっても、階差データ列であれば定常性を有する場合がある。従って、上で述べたようにすれば、階差データ列の定常性を利用して高精度な予測値を算出できるようになる。 In addition, the first calculation unit described above generates (b2-1) a difference data sequence from the communication amount information for a plurality of time points, and a plurality of self-phases based on the generated difference data sequence. The number of relationships may be calculated. Even if the communication amount for a plurality of time points does not have continuity, the difference data string may have continuity. Therefore, as described above, a highly accurate predicted value can be calculated using the continuity of the difference data string.
また、上記管理装置は、(b5)第3算出部が算出した加重平均に基づき、通信装置が実行する仮想オブジェクトのマイグレーションを行う制御部をさらに有してもよい。このようにすれば、通信量に偏りが生じることを抑制できるようになる。 The management device may further include (b5) a control unit that performs migration of virtual objects executed by the communication device based on the weighted average calculated by the third calculation unit. In this way, it is possible to suppress the occurrence of bias in the traffic.
また、上で述べた第2の値が0であってもよい。これにより、予測値の算出に寄与しないと考えられる通信量を完全に無視できるようになる。 The second value described above may be 0. This makes it possible to completely ignore the traffic that is considered not to contribute to the calculation of the predicted value.
本実施の形態の第2の態様に係る、情報処理システムの制御方法は、通信装置と通信装置を管理する管理装置とを有する情報処理システムにおいて、管理装置が、(C)通信装置から、通信装置のポートにおける通信量の情報を複数の時点について取得し、(D)取得部が取得した、複数の時点についての通信量の情報に基づき、複数の自己相関係数を算出し、(E)第1算出部が算出した複数の自己相関係数に基づき、複数の重みを算出し、(F)第2算出部が算出した複数の重みと、複数の時点についての通信量の情報とに基づき、前記複数の時点における通信量の加重平均を算出する処理を含む。 The information processing system control method according to the second aspect of the present embodiment is the information processing system having the communication device and the management device that manages the communication device. (E) Obtaining information on the traffic volume at a port of the apparatus for a plurality of time points, (D) calculating a plurality of autocorrelation coefficients based on the information on the traffic volume for the plurality of time points acquired by the acquisition unit, Based on a plurality of autocorrelation coefficients calculated by the first calculation unit, a plurality of weights are calculated, and (F) based on a plurality of weights calculated by the second calculation unit and information on traffic at a plurality of points in time. , Including a process of calculating a weighted average of traffic at the plurality of times.
なお、上記方法による処理をコンピュータに行わせるためのプログラムを作成することができ、当該プログラムは、例えばフレキシブルディスク、CD−ROM、光磁気ディスク、半導体メモリ、ハードディスク等のコンピュータ読み取り可能な記憶媒体又は記憶装置に格納される。尚、中間的な処理結果はメインメモリ等の記憶装置に一時保管される。 A program for causing a computer to perform the processing according to the above method can be created. The program can be a computer-readable storage medium such as a flexible disk, a CD-ROM, a magneto-optical disk, a semiconductor memory, a hard disk, or the like. It is stored in a storage device. The intermediate processing result is temporarily stored in a storage device such as a main memory.
以上の実施例を含む実施形態に関し、さらに以下の付記を開示する。 The following supplementary notes are further disclosed with respect to the embodiments including the above examples.
(付記1)
通信装置と、
前記通信装置を管理する管理装置と、
を有し、
前記管理装置は、
前記通信装置から、前記通信装置のポートにおける通信量の情報を複数の時点について取得する取得部と、
前記取得部が取得した、前記複数の時点についての通信量の情報に基づき、複数の自己相関係数を算出する第1算出部と、
前記第1算出部が算出した前記複数の自己相関係数に基づき、複数の重みを算出する第2算出部と、
前記第2算出部が算出した前記複数の重みと、前記複数の時点についての通信量の情報とに基づき、前記複数の時点における通信量の加重平均を算出する第3算出部と、
を有する情報処理システム。
(Appendix 1)
A communication device;
A management device for managing the communication device;
Have
The management device
From the communication device, an acquisition unit for acquiring information on a traffic amount at a port of the communication device for a plurality of time points,
A first calculation unit that calculates a plurality of autocorrelation coefficients based on information on the amount of communication for the plurality of time points acquired by the acquisition unit;
A second calculation unit that calculates a plurality of weights based on the plurality of autocorrelation coefficients calculated by the first calculation unit;
A third calculator that calculates a weighted average of traffic at the plurality of times based on the plurality of weights calculated by the second calculator and information on the traffic at the plurality of times;
An information processing system.
(付記2)
前記第2算出部は、
前記複数の自己相関係数の各々について、当該自己相関係数の絶対値が所定の閾値以上であるか判断し、当該自己相関係数の絶対値が所定の閾値以上である場合、当該自己相関係数の絶対値を重みに設定し、当該自己相関係数の絶対値が第1の値未満である場合、重みを第2の値に設定する
付記1記載の情報処理システム。
(Appendix 2)
The second calculator is
For each of the plurality of autocorrelation coefficients, it is determined whether the absolute value of the autocorrelation coefficient is equal to or greater than a predetermined threshold value, and when the absolute value of the autocorrelation coefficient is equal to or greater than the predetermined threshold value, The information processing system according to
(付記3)
前記第3算出部は、
前記第2算出部が算出した前記複数の重みのいずれも前記第2の値である場合、前記複数の重みの各々を1に設定して前記加重平均を算出する
付記2記載の情報処理システム。
(Appendix 3)
The third calculator is
The information processing system according to
(付記4)
前記複数の時点の数をmとし、
nをn<mを満たす自然数とし、
ラグを表す自然数をkとし、
時点nにおける通信量をvnとし、
時点nにおける重みをwnとし、
前記複数の時点についての通信量の平均値をavgとすると、
前記第3算出部は、
前記第1算出部が算出した自己相関係数が0より大きい場合、wn-k*vkを算出し、前記第1算出部が算出した自己相関係数が0より小さい場合、wn-k*(2*avg−vk)を算出することにより、前記複数の時点における通信量の加重平均を算出する
付記1記載の情報処理システム。
(Appendix 4)
The number of the plurality of time points is m,
n is a natural number satisfying n <m,
Let k be the natural number representing the lag,
Let v n be the traffic at time n,
Let w n be the weight at time n,
When the average value of the traffic for the plurality of time points is avg,
The third calculator is
When the autocorrelation coefficient calculated by the first calculation unit is greater than 0, w nk * v k is calculated, and when the autocorrelation coefficient calculated by the first calculation unit is less than 0, w nk * (2 The information processing system according to
(付記5)
前記第1算出部は、
前記複数の時点についての通信量の情報から階差データ列を生成し、生成された当該階差データ列に基づき、複数の自己相関係数を算出する
付記1記載の情報処理システム。
(Appendix 5)
The first calculation unit includes:
The information processing system according to
(付記6)
前記第3算出部が算出した前記加重平均に基づき、前記通信装置が実行する仮想オブジェクトのマイグレーションを行う制御部
をさらに有する付記1記載の情報処理システム。
(Appendix 6)
The information processing system according to
(付記7)
前記第2の値が0である
付記2記載の情報処理システム。
(Appendix 7)
The information processing system according to
(付記8)
通信装置を管理する管理装置の制御プログラムにおいて、
前記管理装置に、
前記通信装置から、前記通信装置のポートにおける通信量の情報を複数の時点について取得させ、
前記取得部が取得した、前記複数の時点についての通信量の情報に基づき、複数の自己相関係数を算出させ、
前記第1算出部が算出した前記複数の自己相関係数に基づき、複数の重みを算出させ、
前記第2算出部が算出した前記複数の重みと、前記複数の時点についての通信量の情報とに基づき、前記複数の時点における通信量の加重平均を算出させる、
管理装置の制御プログラム。
(Appendix 8)
In the control program of the management device that manages the communication device,
In the management device,
From the communication device, to obtain information on the amount of communication at the port of the communication device for a plurality of time points,
Based on the traffic information about the plurality of times acquired by the acquisition unit, a plurality of autocorrelation coefficients are calculated,
Based on the plurality of autocorrelation coefficients calculated by the first calculation unit, a plurality of weights are calculated,
Based on the plurality of weights calculated by the second calculation unit and the information on the traffic volume for the multiple time points, a weighted average of the traffic volume at the multiple time points is calculated.
Control program for management device.
(付記9)
通信装置と、前記通信装置を管理する管理装置とを有する情報処理システムにおいて、
前記管理装置が、
前記通信装置から、前記通信装置のポートにおける通信量の情報を複数の時点について取得し、
前記取得部が取得した、前記複数の時点についての通信量の情報に基づき、複数の自己相関係数を算出し、
前記第1算出部が算出した前記複数の自己相関係数に基づき、複数の重みを算出し、
前記第2算出部が算出した前記複数の重みと、前記複数の時点についての通信量の情報とに基づき、前記複数の時点における通信量の加重平均を算出する、
処理を実行する、情報処理システムの制御方法。
(Appendix 9)
In an information processing system having a communication device and a management device that manages the communication device,
The management device is
From the communication device, information on the amount of communication at the port of the communication device is obtained for a plurality of time points,
Based on the traffic information for the plurality of time points acquired by the acquisition unit, calculate a plurality of autocorrelation coefficients,
Calculating a plurality of weights based on the plurality of autocorrelation coefficients calculated by the first calculation unit;
Based on the plurality of weights calculated by the second calculation unit and information on the traffic volume for the plurality of time points, a weighted average of the traffic volume at the plurality of time points is calculated.
A method for controlling an information processing system that executes processing.
1 管理サーバ 31,32,33 物理スイッチ
51,52 物理サーバ 7 管理LAN
511,521 VM 512,522 VSW
513,523 VR
31A,31B,32A,32B,33A,33B,51A,511A,512A,512B,512C,513A,513B,52A,521A,522A,522B,522C,523A,523B ポート
10 収集部 11 トラフィックデータ格納部
12 算出部 121 第1算出部
122 第2算出部 123 第3算出部
13 自己相関係数格納部 14 重み格納部
15 階差データ列格納部 16 予測値格納部
17 制御部
1
511, 521
513,523 VR
31A, 31B, 32A, 32B, 33A, 33B, 51A, 511A, 512A, 512B, 512C, 513A, 513B, 52A, 521A, 522A, 522B, 522C, 523A,
Claims (8)
前記通信装置を管理する管理装置と、
を有し、
前記管理装置は、
前記通信装置から、前記通信装置のポートにおける通信量の情報を複数の時点について取得する取得部と、
前記取得部が取得した、前記複数の時点についての通信量の情報に基づき、複数の自己相関係数を算出する第1算出部と、
前記第1算出部が算出した前記複数の自己相関係数に基づき、複数の重みを算出する第2算出部と、
前記第2算出部が算出した前記複数の重みと、前記複数の時点についての通信量の情報とに基づき、前記複数の時点における通信量の加重平均を算出する第3算出部と、
を有する情報処理システム。 A communication device;
A management device for managing the communication device;
Have
The management device
From the communication device, an acquisition unit for acquiring information on a traffic amount at a port of the communication device for a plurality of time points,
A first calculation unit that calculates a plurality of autocorrelation coefficients based on information on the amount of communication for the plurality of time points acquired by the acquisition unit;
A second calculation unit that calculates a plurality of weights based on the plurality of autocorrelation coefficients calculated by the first calculation unit;
A third calculator that calculates a weighted average of traffic at the plurality of times based on the plurality of weights calculated by the second calculator and information on the traffic at the plurality of times;
An information processing system.
前記複数の自己相関係数の各々について、当該自己相関係数の絶対値が所定の閾値以上であるか判断し、当該自己相関係数の絶対値が所定の閾値以上である場合、当該自己相関係数の絶対値を重みに設定し、当該自己相関係数の絶対値が第1の値未満である場合、重みを第2の値に設定する
請求項1記載の情報処理システム。 The second calculator is
For each of the plurality of autocorrelation coefficients, it is determined whether the absolute value of the autocorrelation coefficient is equal to or greater than a predetermined threshold value, and when the absolute value of the autocorrelation coefficient is equal to or greater than the predetermined threshold value, The information processing system according to claim 1, wherein the absolute value of the number of relations is set as a weight, and the weight is set as the second value when the absolute value of the autocorrelation coefficient is less than the first value.
前記第2算出部が算出した前記複数の重みのいずれも前記第2の値である場合、前記複数の重みの各々を1に設定して前記加重平均を算出する
請求項2記載の情報処理システム。 The third calculator is
The information processing system according to claim 2, wherein when all of the plurality of weights calculated by the second calculation unit are the second value, the weighted average is calculated by setting each of the plurality of weights to 1. .
nをn<mを満たす自然数とし、
ラグを表す自然数をkとし、
時点nにおける通信量をvnとし、
時点nにおける重みをwnとし、
前記複数の時点についての通信量の平均値をavgとすると、
前記第3算出部は、
前記第1算出部が算出した自己相関係数が0より大きい場合、wn-k*vkを算出し、前記第1算出部が算出した自己相関係数が0より小さい場合、wn-k*(2*avg−vk)を算出することにより、前記複数の時点における通信量の加重平均を算出する
請求項1記載の情報処理システム。 The number of the plurality of time points is m,
n is a natural number satisfying n <m,
Let k be the natural number representing the lag,
Let v n be the traffic at time n,
Let w n be the weight at time n,
When the average value of the traffic for the plurality of time points is avg,
The third calculator is
When the autocorrelation coefficient calculated by the first calculation unit is greater than 0, w nk * v k is calculated, and when the autocorrelation coefficient calculated by the first calculation unit is less than 0, w nk * (2 The information processing system according to claim 1, wherein a weighted average of traffic at the plurality of points in time is calculated by calculating * avg−v k ).
前記複数の時点についての通信量の情報から階差データ列を生成し、生成された当該階差データ列に基づき、複数の自己相関係数を算出する
請求項1記載の情報処理システム。 The first calculation unit includes:
The information processing system according to claim 1, wherein a difference data sequence is generated from information on the traffic volume at the plurality of points in time, and a plurality of autocorrelation coefficients are calculated based on the generated difference data sequence.
をさらに有する請求項1記載の情報処理システム。 The information processing system according to claim 1, further comprising: a control unit that performs migration of a virtual object executed by the communication device based on the weighted average calculated by the third calculation unit.
前記管理装置に、
前記通信装置から、前記通信装置のポートにおける通信量の情報を複数の時点について取得させ、
前記取得部が取得した、前記複数の時点についての通信量の情報に基づき、複数の自己相関係数を算出させ、
前記第1算出部が算出した前記複数の自己相関係数に基づき、複数の重みを算出させ、
前記第2算出部が算出した前記複数の重みと、前記複数の時点についての通信量の情報とに基づき、前記複数の時点における通信量の加重平均を算出させる、
管理装置の制御プログラム。 In the control program of the management device that manages the communication device,
In the management device,
From the communication device, to obtain information on the amount of communication at the port of the communication device for a plurality of time points,
Based on the traffic information about the plurality of times acquired by the acquisition unit, a plurality of autocorrelation coefficients are calculated,
Based on the plurality of autocorrelation coefficients calculated by the first calculation unit, a plurality of weights are calculated,
Based on the plurality of weights calculated by the second calculation unit and the information on the traffic volume for the multiple time points, a weighted average of the traffic volume at the multiple time points is calculated.
Control program for management device.
前記管理装置が、
前記通信装置から、前記通信装置のポートにおける通信量の情報を複数の時点について取得し、
前記取得部が取得した、前記複数の時点についての通信量の情報に基づき、複数の自己相関係数を算出し、
前記第1算出部が算出した前記複数の自己相関係数に基づき、複数の重みを算出し、
前記第2算出部が算出した前記複数の重みと、前記複数の時点についての通信量の情報とに基づき、前記複数の時点における通信量の加重平均を算出する、
処理を実行する、情報処理システムの制御方法。 In an information processing system having a communication device and a management device that manages the communication device,
The management device is
From the communication device, information on the amount of communication at the port of the communication device is obtained for a plurality of time points,
Based on the traffic information for the plurality of time points acquired by the acquisition unit, calculate a plurality of autocorrelation coefficients,
Calculating a plurality of weights based on the plurality of autocorrelation coefficients calculated by the first calculation unit;
Based on the plurality of weights calculated by the second calculation unit and information on the traffic volume for the plurality of time points, a weighted average of the traffic volume at the plurality of time points is calculated.
A method for controlling an information processing system that executes processing.
Priority Applications (2)
| Application Number | Priority Date | Filing Date | Title |
|---|---|---|---|
| JP2014265797A JP2016127390A (en) | 2014-12-26 | 2014-12-26 | Information processing system, control method for information processing system, control program for management device |
| US14/886,154 US9866462B2 (en) | 2014-12-26 | 2015-10-19 | Information processing system and information processing method |
Applications Claiming Priority (1)
| Application Number | Priority Date | Filing Date | Title |
|---|---|---|---|
| JP2014265797A JP2016127390A (en) | 2014-12-26 | 2014-12-26 | Information processing system, control method for information processing system, control program for management device |
Publications (1)
| Publication Number | Publication Date |
|---|---|
| JP2016127390A true JP2016127390A (en) | 2016-07-11 |
Family
ID=56165629
Family Applications (1)
| Application Number | Title | Priority Date | Filing Date |
|---|---|---|---|
| JP2014265797A Withdrawn JP2016127390A (en) | 2014-12-26 | 2014-12-26 | Information processing system, control method for information processing system, control program for management device |
Country Status (2)
| Country | Link |
|---|---|
| US (1) | US9866462B2 (en) |
| JP (1) | JP2016127390A (en) |
Cited By (3)
| Publication number | Priority date | Publication date | Assignee | Title |
|---|---|---|---|---|
| JP2019024154A (en) * | 2017-07-21 | 2019-02-14 | 日本電信電話株式会社 | Quality control apparatus, communication quality prediction method, and program |
| WO2020040006A1 (en) * | 2018-08-24 | 2020-02-27 | 日本電信電話株式会社 | Control device and control method |
| WO2022157862A1 (en) * | 2021-01-20 | 2022-07-28 | 日本電信電話株式会社 | Traffic change prediction device, traffic change prediction method, and traffic change prediction program |
Families Citing this family (2)
| Publication number | Priority date | Publication date | Assignee | Title |
|---|---|---|---|---|
| CN105337858B (en) * | 2015-11-20 | 2019-10-18 | 北京百度网讯科技有限公司 | Virtual router cluster, data forwarding method and device |
| CN113837383B (en) * | 2021-10-18 | 2023-06-23 | 中国联合网络通信集团有限公司 | Model training method and device, electronic equipment and storage medium |
Family Cites Families (13)
| Publication number | Priority date | Publication date | Assignee | Title |
|---|---|---|---|---|
| EP1162798A3 (en) * | 2000-06-09 | 2007-12-26 | Broadcom Corporation | Packet forwarding among different types of gigabit switches |
| JP2003188769A (en) | 2001-12-20 | 2003-07-04 | Yrp Mobile Telecommunications Key Tech Res Lab Co Ltd | Synchronism capturing method and device |
| US20030189904A1 (en) * | 2002-04-04 | 2003-10-09 | Li Jonathan Q. | Sampling fractal internet protocol traffic with bounded error tolerance and response time |
| US7362762B2 (en) * | 2003-11-12 | 2008-04-22 | Cisco Technology, Inc. | Distributed packet processing with ordered locks to maintain requisite packet orderings |
| US7701884B2 (en) * | 2004-04-19 | 2010-04-20 | Insors Integrated Communications | Network communications bandwidth control |
| JP4688083B2 (en) | 2007-06-12 | 2011-05-25 | 日本電信電話株式会社 | Reference value prediction method, system and program |
| US8799429B1 (en) * | 2008-05-06 | 2014-08-05 | American Megatrends, Inc. | Boot acceleration by consolidating client-specific boot data in a data storage system |
| JP2011128917A (en) * | 2009-12-18 | 2011-06-30 | Fujitsu Ltd | Data allocation control program, data allocation control method, and data allocation control apparatus |
| JP5707037B2 (en) | 2009-12-25 | 2015-04-22 | 日本電産エレシス株式会社 | Electronic scanning radar apparatus, received wave direction estimation method, and received wave direction estimation program |
| PT2413612E (en) * | 2010-07-30 | 2015-04-15 | Deutsche Telekom Ag | Methods and apparatuses for temporal synchronization between the video bit stream and the output video sequence |
| US9836696B2 (en) * | 2014-07-23 | 2017-12-05 | Cisco Technology, Inc. | Distributed machine learning autoscoring |
| US9906425B2 (en) * | 2014-07-23 | 2018-02-27 | Cisco Technology, Inc. | Selective and dynamic application-centric network measurement infrastructure |
| US9577937B2 (en) * | 2014-07-23 | 2017-02-21 | Cisco Technology, Inc. | Ensuring dynamic traffic shaping fairness |
-
2014
- 2014-12-26 JP JP2014265797A patent/JP2016127390A/en not_active Withdrawn
-
2015
- 2015-10-19 US US14/886,154 patent/US9866462B2/en not_active Expired - Fee Related
Cited By (5)
| Publication number | Priority date | Publication date | Assignee | Title |
|---|---|---|---|---|
| JP2019024154A (en) * | 2017-07-21 | 2019-02-14 | 日本電信電話株式会社 | Quality control apparatus, communication quality prediction method, and program |
| WO2020040006A1 (en) * | 2018-08-24 | 2020-02-27 | 日本電信電話株式会社 | Control device and control method |
| US11924082B2 (en) | 2018-08-24 | 2024-03-05 | Nippon Telegraph And Telephone Corporation | Control device and control method |
| WO2022157862A1 (en) * | 2021-01-20 | 2022-07-28 | 日本電信電話株式会社 | Traffic change prediction device, traffic change prediction method, and traffic change prediction program |
| JP7464891B2 (en) | 2021-01-20 | 2024-04-10 | 日本電信電話株式会社 | Traffic Fluctuation Prediction Device, Traffic Fluctuation Prediction Method, and Traffic Fluctuation Prediction Program |
Also Published As
| Publication number | Publication date |
|---|---|
| US9866462B2 (en) | 2018-01-09 |
| US20160191360A1 (en) | 2016-06-30 |
Similar Documents
| Publication | Publication Date | Title |
|---|---|---|
| Lohrmann et al. | Elastic stream processing with latency guarantees | |
| JP2016127390A (en) | Information processing system, control method for information processing system, control program for management device | |
| WO2018076791A1 (en) | Resource load balancing control method and cluster scheduler | |
| JP4659850B2 (en) | Network monitoring program, network monitoring method, and network monitoring apparatus | |
| CN107480028B (en) | Method and device for acquiring usable residual time of disk | |
| US20160349992A1 (en) | Provisioning advisor | |
| EP2629490A1 (en) | Optimizing traffic load in a communications network | |
| JP6493400B2 (en) | Service chain management device, service chain management system, service chain management method, and program | |
| US10362098B2 (en) | Load balancing back-end application services utilizing derivative-based cluster metrics | |
| US9602418B2 (en) | Apparatus and method for selecting a flow to be changed upon congestion occurrence | |
| CN105960779B (en) | Data routing method and device with machine learning-based routing model | |
| US20220100548A1 (en) | Network performance assurance system and network performance assurance method | |
| CN116055406B (en) | Training method and device for congestion window prediction model | |
| US8793106B2 (en) | Continuous prediction of expected chip performance throughout the production lifecycle | |
| CA2637987C (en) | Method for autonomic system management using adaptive allocation of resources | |
| US11995460B2 (en) | Resource determination device, method, and program | |
| US12067430B2 (en) | Adaptive idle detection in a software-defined data center in a hyper-converged infrastructure | |
| JP2017220840A (en) | Network monitoring / control device, network monitoring / control method, and network monitoring / control program | |
| JP5742981B1 (en) | Route calculation apparatus, method, and program | |
| US9537740B2 (en) | Monitoring device usage | |
| US9998347B2 (en) | Monitoring device usage | |
| CN106936611B (en) | Method and device for predicting network state | |
| JP2017091001A (en) | Virtual instance arrangement position determination device, virtual instance arrangement position determination method, and virtual instance arrangement position determination program | |
| JP2008199451A (en) | Bandwidth control apparatus and method | |
| US10169182B2 (en) | Monitoring levels of utilization of device |
Legal Events
| Date | Code | Title | Description |
|---|---|---|---|
| A621 | Written request for application examination |
Free format text: JAPANESE INTERMEDIATE CODE: A621 Effective date: 20171113 |
|
| A761 | Written withdrawal of application |
Free format text: JAPANESE INTERMEDIATE CODE: A761 Effective date: 20171225 |