EP3761869B1 - Atrial fibrillation prediction using heart rate variability - Google Patents
Atrial fibrillation prediction using heart rate variability Download PDFInfo
- Publication number
- EP3761869B1 EP3761869B1 EP19763588.1A EP19763588A EP3761869B1 EP 3761869 B1 EP3761869 B1 EP 3761869B1 EP 19763588 A EP19763588 A EP 19763588A EP 3761869 B1 EP3761869 B1 EP 3761869B1
- Authority
- EP
- European Patent Office
- Prior art keywords
- event
- program instructions
- patient
- distribution
- data segments
- Prior art date
- Legal status (The legal status is an assumption and is not a legal conclusion. Google has not performed a legal analysis and makes no representation as to the accuracy of the status listed.)
- Active
Links
Images


Classifications
-
- A—HUMAN NECESSITIES
- A61—MEDICAL OR VETERINARY SCIENCE; HYGIENE
- A61B—DIAGNOSIS; SURGERY; IDENTIFICATION
- A61B5/00—Measuring for diagnostic purposes; Identification of persons
- A61B5/24—Detecting, measuring or recording bioelectric or biomagnetic signals of the body or parts thereof
- A61B5/316—Modalities, i.e. specific diagnostic methods
- A61B5/318—Heart-related electrical modalities, e.g. electrocardiography [ECG]
- A61B5/346—Analysis of electrocardiograms
- A61B5/349—Detecting specific parameters of the electrocardiograph cycle
- A61B5/361—Detecting fibrillation
-
- A—HUMAN NECESSITIES
- A61—MEDICAL OR VETERINARY SCIENCE; HYGIENE
- A61B—DIAGNOSIS; SURGERY; IDENTIFICATION
- A61B5/00—Measuring for diagnostic purposes; Identification of persons
- A61B5/02—Detecting, measuring or recording for evaluating the cardiovascular system, e.g. pulse, heart rate, blood pressure or blood flow
- A61B5/024—Measuring pulse rate or heart rate
- A61B5/02405—Determining heart rate variability
-
- A—HUMAN NECESSITIES
- A61—MEDICAL OR VETERINARY SCIENCE; HYGIENE
- A61B—DIAGNOSIS; SURGERY; IDENTIFICATION
- A61B5/00—Measuring for diagnostic purposes; Identification of persons
- A61B5/72—Signal processing specially adapted for physiological signals or for diagnostic purposes
- A61B5/7235—Details of waveform analysis
- A61B5/7264—Classification of physiological signals or data, e.g. using neural networks, statistical classifiers, expert systems or fuzzy systems
- A61B5/7267—Classification of physiological signals or data, e.g. using neural networks, statistical classifiers, expert systems or fuzzy systems involving training the classification device
Definitions
- Cardiac fibrillation is one of the leading causes of morbidity and mortality in the developed world, where atrial fibrillation (AF) is the most common sustained arrhythmia ( Wolf PA et al. Stroke. 1991;22:983-8 ), affecting approximately 2.2 million patients in the United States, and its prevalence increases with age ( Feinberg WM et al. Archives of internal medicine. 1995;155:469-73 ). Although AF is not considered a life-threating arrhythmia, it affects the circulatory system of patients and their general health and quality of life; further, it poses a significant burden on the healthcare system ( Feinberg WM et al. Archives of internal medicine.
- US 2016/135706 describes a method for medical premonitory event estimation includes one or more processors to perform operations. This method comprises: acquiring a first set of physiological information of a subject, and a second set of physiological information of the subject received during a second period of time; calculating a first and second risk scores associated with estimating a risk of a potential cardiac arrhythmia event for the subject based on applying the first and second sets of physiological information to one or more machine learning classifier models; providing at least the first and second risk scores associated with the potential cardiac arrhythmia event as a time changing series of risk scores; and classifying the first and second risk scores associated with estimating the risk of the potential cardiac arrhythmia event for the subject based on the one or more thresholds.
- WO 2016/183515 describes a system for cardiac monitoring, that may be used to sense the presence of an intermittent arrhythmia in an individual.
- US8417326B2 discloses an apparatus and method for ambulatory, real-time detection of Atrial Fibrillation (AF) providing an overall accuracy that refers to detection of AF, irrespective of the duration of AF and beat-to-beat classification.
- AF Atrial Fibrillation
- a method comprising receiving a plurality of data segments each representing human cardiac activity; calculating, from each of said data segments, a first value representing a distribution of a heart rate variability (HRV) parameter; acquiring a signal representing cardiac activity in a patient; deriving a second value representing distribution of an HRV parameter in said signal; and indicating an atrial fibrillation (AF) event in said patient, when a difference between said first and second values is above a predetermined threshold.
- HRV heart rate variability
- a system comprising at least one hardware processor; and a non-transitory computer-readable storage medium having stored thereon program instructions, the program instructions executable by the at least one hardware processor to: receive a plurality of data segments each representing human cardiac activity, calculate, from each of said data segments, a first value representing a distribution of a heart rate variability (HRV) parameter, acquire a signal representing cardiac activity in a patient, derive a second value representing distribution of an HRV parameter in said signal, and indicate an atrial fibrillation (AF) event in said patient, when a difference between said first and second values is above a predetermined threshold.
- HRV heart rate variability
- a computer program product comprising a non-transitory computer-readable storage medium having program instructions embodied therewith, the program instructions executable by at least one hardware processor to: receive a plurality of data segments each representing human cardiac activity; calculate, from each of said data segments, a first value representing a distribution of a heart rate variability (HRV) parameter; acquire a signal representing cardiac activity in a patient; derive a second value representing distribution of an HRV parameter in said signal; and indicate an atrial fibrillation (AF) event in said patient, when a difference between said first and second values is above a predetermined threshold.
- HRV heart rate variability
- said plurality of data segments represent cardiac activity in a plurality of subjects.
- At least some of said data segments are acquired from said patient.
- said HRV parameter is an entropy parameter.
- said entropy parameter is modified Shannon entropy.
- said calculating comprises calculating a distribution of said HRV parameter in all said data segments.
- each of said data segments is acquired over a period of between 1 and 10 minutes.
- said signal is acquired over a period of between 0.5 and 5 minutes.
- the method further comprises training, and the program instructions are further executable to train, at a training stage, a machine learning classifier on a training set comprising: (i) said plurality of data segment, wherein at least some of said segments comprise cardiac activity reflecting an arrythmia event, and (ii) labels indicating the occurrence of an arrythmia event in said cardiac activity.
- said data segments are labelled with said labels.
- said indicating is performed by applying, at an inference stage, said machine learning classifier to said signal, to indicate an AF event in said patient.
- said indicating comprises at least one of detecting an ongoing AF event, and predicting an upcoming AF event.
- said upcoming AF event occurs between 1 and 5 minutes after said indicating.
- said detecting is based, at least in part, on calculating statistical estimators of said distribution.
- said statistical estimators comprise at least standard deviation and deviation from normal distribution.
- said deviation from normal distribution is based on the Kolmogorov-Smirnov statistic.
- the method further comprises applying, and the program instructions are further executable to apply, a clustering algorithm to said plurality of data segments, to cluster at least some of said data segments based, at least in part, on said HRV parameter.
- said clustering algorithm is a spectral clustering algorithm.
- a system and method are disclosed herein for detecting and/or predicting atrial fibrillation (AF) or other irregular regularity.
- the present invention provides for real-time prediction or detection of AF or other irregular regularity by employing an algorithm based on pattern classification of the distribution of a modified Shannon entropy of beating intervals of heart beats intervals.
- the present method and system produce a real-time alarm when certain changes occur in the modified Shannon entropy of a patient.
- the present invention is based on the finding that persistent AF is associated with an increased HRV on average ( L. Bergfeldt and Y. Haga, "Power spectral and Poincaré plot characteristics in sinus node dysfunction," J. Appl. Physiol., vol. 94, no. 6, pp. 2217-2224, 2003 ).
- reduced HRV indices are observed just prior to events ( O. Akyurek, E. Diker, M. Guldal, and D. Oral, "Predictive value of heart rate variability for the recurrence of chronic atrial fibrillation after electrical cardioversion," Clin Cardiol, vol. 26, no. 4, pp. 196-200, 2003 ). Therefore, an atypical decrease in HRV might be predictive for an upcoming episode of AF, and thus a useful marker to be used in the detection, prevention, research and treatment of AF.
- the present invention provides clinical and diagnostic tools for early prediction and detection of AF events by examining changes in HRV.
- Real-time analysis of HRV of a patient, based on short segments of heartbeat intervals, according to the present method may help to detect and prevent AF events, thereby reducing the probability of associated events, such as strokes.
- the disclosed invention allows for prediction of AF events shortly (e.g., 5 min.) before they occur. Early prediction of AF events thus will allow to determine which hemodynamic, mechanical or electrical parameters change just before each episode, and help during ablation procedure.
- the present invention can be implemented, for example, as an early detection and prediction system for atrial fibrillation based on continuous heart rate monitoring, as well as for early prediction of arrhythmia episodes in general.
- heart beat segments can be acquired from a mobile device, a wearable device, a device that is used to monitor or diagnose medical conditions by medical experts, and/or based on a smart implantable cardiac defibrillator. Because the disclosed method provides for quantifying the HRV accurately based on relatively short segments of heart beats, it can be implemented based on, e.g., a remote ECG acquiring system. Thus, the present method can provide for efficient and cost-effective local and/or remote monitoring of multiple AF patients.
- the present disclosure can be implemented, for example, as a diagnostic system used for assessing the underlying etiology and/or the arrythmia profile of each patient's AF events, allowing personalized treatment.
- methods for predicting and/or detecting AF comprise a first step of acquiring and/or receiving one or more prerecorded baseline segments of cardiac activity comprising multiple heart beat intervals of a subject.
- the baseline segments comprise a plurality of heart beat intervals taken, e.g., at rest, when no arrythmia event was in progress.
- the recording of the baseline signal is performed over a period of, e.g., 1 to 10 minutes.
- a modified Shannon entropy distribution and/or other HRV indices are may then be calculated for the baseline signal.
- the present method further comprises calculating a difference in Shannon entropies between every two or more consecutive heart beat intervals of the baseline signal, wherein the calculation of the baseline distribution is based on the calculated differences in Shannon entropies.
- the modified Shannon Entropy is used to separate patients into groups by, e.g., Spectral Clustering.
- a second, shorter, segment of the patient cardiac activity measurement is acquired (the "real-time segment” ), wherein a modified Shannon entropy distribution and/or other HRV indices are calculated for the real-time segment as well.
- the distributions of the baseline and real-time segments are compared to one another. In some embodiments, when a difference in distribution width between the baseline and second segments is above a predetermined threshold, an AF event is predicted and/or detected. In some embodiments, the recording of the real-time segment is performed over a period of 30 seconds to 5 minutes.
- the present disclosure may be implemented as a machine leanring classifier trained on a training set comprising a plurality of cardiac activity segments acquired from a population of subjects, wherein at an inference stage the classifier may be configured to predict and/or detect AF event in a real-time segment acquired from a monitored subject.
- a machine leanring classifier may be trained, e.g., on a training set comprising a plurality of recorded baseline segments measurements from, e.g., a group of subjects.
- the baseline segments may comprise a plurality of heart beat intervals of each subject taken, e.g., at rest, when no arrythmia event was in progress.
- each segment may comprise, e.g., 1 to 10 minutes of recorded cardiac activity.
- an existing database of cardiac activity recordings form a plurality of subjects may comprise at least a portion of the training set.
- modified Shannon entropy distribution and/or other HRV indices are may be derived for each segment within the training set.
- modified Shannon entropy may be derived, e.g., by calculating a difference in Shannon entropies between every two or more consecutive heart beat intervals of the baseline signal.
- the training set may be labelled with appropriate labels indicating the existence of an AF event within each segment.
- the machine learning classifier may be trained on the training set to classify a segment of cardiac activity as indicative of a concurrent and/or imminent (e.g., within a time horizon of 1-5 mins.) AF event.
- a trained classifier of the present disclosure may be used to detect and or predict an AF event, based, at least in part, on a segment of cardiac activity measurement acquired in real time from a subject, wherein the segment may comprise a recording of cardiac activity over a period of 30 seconds to 5 minutes.
- an exemplary system 100 in accordance with the present disclosure comprises processing unit 102, comprising at least one hardware processor.
- Processing unit 102 is communicatively connected to a non-transient computer readable storage device 104.
- Processing unit 102 is configured to automatically control the operation of system 100, based on one or more applications, sets of software instructions, and algorithms stored storage device 104.
- Storage device 104 may be configured to have stored thereon digital representations of cardiac signals and/or measurements.
- processing unit 102 is configured to receive and process one or more cardiac signals and/or measurements collected by one or more cardiac signal sensors 106.
- System 100 may further comprise a communication module 108, which may be configured to connect system 100 through a communication network, such as the Internet, a local area network, a wide area network, and/or a wireless network.
- a communication network such as the Internet, a local area network, a wide area network, and/or a wireless network.
- system 100 may be configured to receive cardiac signals from a remote acquisition unit over a network via communication module 108.
- System 100 described herein is only an exemplary embodiment, and may have more or fewer components than shown, may combine two or more components, or a may have a different configuration or arrangement of the components.
- the various components of system 100 may be implemented in hardware, software, or a combination of both hardware and software.
- processing unit 102 or processing tasks performed thereby may be implemented by a handheld or worn computing device such as, but not limited to, a smart phone, a tablet computer, a notepad computer, smart watch, and the like.
- a handheld or worn computing device such as, but not limited to, a smart phone, a tablet computer, a notepad computer, smart watch, and the like.
- aspects of the present system which can be implemented by computer program instructions, may be executed on a general-purpose computer, a special-purpose computer, or other programmable data processing apparatus.
- Fig. 2 is a flowchart illustrating the functional steps of an exemplary prediction and/or detection machine leanring classifier 200, according to some embodiments of the present disclosure.
- Classifier 200 is configured to calculate HRV over relatively short real-time segments of heart beat, based on pattern classification of distribution of the modified Shannon entropy of beating intervals.
- Classifier 200 works in two stages: a learning stage (steps 202-206 ) and an inference stage (steps 208-214 ).
- a training set of baseline cardiac activity segments of a single or a plurality of subjects may be acquired or received.
- the baseline segments can be acquired using an ECG and/or similar acquiring methodology from the subjects at rest.
- the baseline segments comprise a segment of ECG and/or other bio-signal measurement which can be used to calculate the heart beating intervals (e.g., saturated oxygen, pulse detector, blood pressure, etc.).
- each segment is recorded over a time period that is sufficient to create a reliable distribution curve for statistics, for example, 5 minutes.
- the recording of the baseline segments is performed over a period of 1 to 10 minutes where no arrhythmia events are present.
- modified Shannon entropy is calculated with respect to each segment in the training set. For example, the difference in Shannon entropy of a pair in each three consecutive beats (or more beats with N-1 combination) is calculated (to reduce noise in the signal). The absolute value between each pair of beats is calculated, to provide a modified Shannon entropy value.
- the distribution of modified Shannon entropy values is calculated for the entire segment.
- the distribution is normalized for the average modified Shannon entropy, and the shape of this probability density function is calculated.
- the distribution of the modified Shannon entropy of the segment is represented by estimation of statistical parameters.
- a machine learning classifier is trained on the training set acquired and processed in steps 202-206.
- a real-time sample segment is taken over a relatively short period of time, e.g., 1 min.
- the real-time recording of is performed over a period of 30 seconds to 5 minutes.
- classifier 200 is applied to the real-time segment, to predict and/or detect an AF event, based, at least in part, on a distribution parameter of Shannon entropy and/or other HRV indices in the real-time segment.
- the real-time measurements and processing may be repeated, e.g., between 2 and 6 times.
- the present disclosure employs, at least in part, the following definitions and assumptions for predicting and/or detecting AF events.
- ⁇ might be a multi-dimensional parameter set, for which distribution there will be used the notion Y ( ⁇ ). Satisfying that for every possible set D of consecutive beat intervals from the same subject exists a ⁇ ⁇ ⁇ , such that S ⁇ i M ⁇ Y ⁇ ⁇ BI ⁇ D .
- the prediction algorithm defines a "narrow" distribution as: Y ⁇ W f X x ⁇ ⁇ T W ⁇ ,
- T ( w ) is a function T : R ⁇ R used in threshold determination.
- T ( w ) is a function determining how low a value of W should be to satisfy P ( w ⁇ W ) ⁇ ⁇ .
- n is a predetermined constant number, which can be chosen based on either heuristic methods, or through statistical analysis. If n or more consecutive real-time calculation sets are considered "narrow,” it is considered as an "alarm.”
- the implementation of the present prediction algorithm requires determination of an estimator for the distribution width W and a threshold estimating function T .
- the present disclosure can be implemented, for example, as a diagnostic system used for assessing the underlying etiology and/or the arrythmia profile of each patient's AF events, allowing personalized treatment.
- the modified Shannon Entropy is used to separate patients into groups by Spectral Clustering (see, e.g., Andrew Y. Ng , Michael I. Jordan , Yair Weiss, "On spectral clustering: analysis and an algorithm", Proceedings of the 14th International Conference on Neural Information Processing Systems: Natural and Synthetic, December 03-08, 2001 ).
- the threshold estimating function, T may be implemented using classic statistical estimators. In some embodiments, threshold estimating function, T, may be implemented using a machine learning algorithm.
- Fig. 3 illustrates a density function fitting calculated and plotted by a Matlab Distribution fitting toolbox, in which a discrepancy between the histogram and the best fitting is evident.
- the algorithm is configured to try to estimate the distribution width directly from the samples, some examples for such an estimator are described below.
- the algorithm directly assesses the need for an alarm from the beat intervals sequence. Nevertheless, in some embodiments, the full process of distribution parametric family determination, parameter estimation and threshold estimation is utilized.
- Fig. 4 shows multiple empirical distribution functions of 1-minute sets of beat intervals from the same subject on the same figure. Difference can be noted between panel A, plotted using a recording from a subject with occasional AF episodes, and panel B, plotted using a recording from a healthy subject. In the healthy subject, it can qualitatively be seen that although some variability between the distribution of different sets exists, the variability is low and there are no distinct groups of curves. Conversely, in panel A, representing the AF patient's records, larger variability can be seen with 2 distinguishable groups of distribution width. Another, more subtle difference is the presence of some very narrow curves in the AF patient's results, which are absent in the healthy patient's results. These differences suggest that the empirical distribution width might hold the information needed to differentiate patients with and without AF.
- a natural choice for a parameter to estimate distribution width is variance.
- a moving average filter may be used, which produce a smoother signal.
- Fig. 5 shows a time plot with the ⁇ 2 estimator
- Fig. 6 shows the same time interval with the filtered estimator, wherein annotations of AF onset are marked by Xs. Higher values during arrhythmia episodes can be seen, with and the low values often preceding their onset.
- Figs. 7A-7B shows a plot of the ⁇ 2 estimator after a running average filter in a representative time interval from an AF subject. Annotations of AF onset are marked by Xs, and alarms are marked by Xs of lighter shade.
- Fig. 7B shows a similar plot of another time interval from the same subject.
- Fig. 8 shows a similar plot from a healthy subject. Even though some fluctuating does occur in healthy subjects, extremely low values are rare, and therefore in most of healthy subjects, no alarms are produced.
- the clustering method herein is used to classify patients to groups to assist the personalization of medical treatment.
- Atrial fibrillation is classically defined as "...a supraventricular arrhythmia characterized electrocardiographically by low-amplitude baseline oscillations (fibrillatory or f waves) and an irregularly irregular ventricular rhythm" (see, Mann, Douglas L. et al., "Braunwald's Heart Disease: A Textbook of Cardiovascular Medicine.” 10th edition. Philadelphia, PA: Elsevier/Saunders, 2015 ).
- an algorithm identifying irregular irregularity of heart rate is used to detect atrial fibrillation episodes.
- Heart rate irregularity show a strong correlation with the standard deviation of the modified Shannon entropy, but does not tell regular irregularity and irregular irregularity apart.
- the normality measure described above tell regular irregularity and irregular irregularity apart but is not specific for irregular irregularity and may give similar results in irregular irregularity and in normal sinus rhythm with complex dynamics.
- both measures are used together to detect AF episodes.
- the standard deviation denoted "var” in the legend
- the normality measure denoted "ks” in the legend
- aspects of the present invention may be embodied as a system, method or computer program product. Accordingly, aspects of the present invention may take the form of an entirely hardware embodiment, an entirely software embodiment (including firmware, resident software, micro-code, etc.) or an embodiment combining software and hardware aspects that may all generally be referred to herein as a "circuit,” “module” or “system.” Furthermore, aspects of the present invention may take the form of a computer program product embodied in one or more computer readable medium(s) having computer readable program code embodied thereon.
- the computer readable medium may be a computer readable signal medium or a computer readable storage medium.
- a computer readable storage medium may be, for example, but not limited to, an electronic, magnetic, optical, electromagnetic, infrared, or semiconductor system, apparatus, or device, or any suitable combination of the foregoing.
- a computer readable storage medium may be any tangible medium that can contain, or store a program for use by or in connection with an instruction execution system, apparatus, or device.
- a computer readable signal medium may include a propagated data signal with computer readable program code embodied therein, for example, in baseband or as part of a carrier wave. Such a propagated signal may take any of a variety of forms, including, but not limited to, electromagnetic, optical, or any suitable combination thereof.
- a computer readable signal medium may be any computer readable medium that is not a computer readable storage medium and that can communicate, propagate, or transport a program for use by or in connection with an instruction execution system, apparatus, or device.
- Program code embodied on a computer readable medium may be transmitted using any appropriate medium, including but not limited to wireless, wireline, optical fiber cable, RF, etc., or any suitable combination of the foregoing.
- Computer program code for carrying out operations for aspects of the present invention may be written in any combination of one or more programming languages, including an object-oriented programming language such as Java, Smalltalk, C++ or the like and conventional procedural programming languages, such as the "C" programming language or similar programming languages.
- the program code may execute entirely on the user's computer, partly on the user's computer, as a stand-alone software package, partly on the user's computer and partly on a remote computer or entirely on the remote computer or server.
- the remote computer may be connected to the user's computer through any type of network, including a local area network (LAN) or a wide area network (WAN), or the connection may be made to an external computer (for example, through the Internet using an Internet Service Provider).
- LAN local area network
- WAN wide area network
- Internet Service Provider for example, AT&T, MCI, Sprint, EarthLink, MSN, GTE, etc.
- These computer program instructions may also be stored in a computer readable medium that can direct a computer, other programmable data processing apparatus, or other devices to function in a particular manner, such that the instructions stored in the computer readable medium produce an article of manufacture including instructions which implement the function/act specified in the flowchart and/or block diagram block or blocks.
- the computer program instructions may also be loaded onto a computer, other programmable data processing apparatus, or other devices to cause a series of operational steps to be performed on the computer, other programmable apparatus or other devices to produce a computer implemented process such that the instructions which execute on the computer or other programmable apparatus provide processes for implementing the functions/acts specified in the flowchart and/or block diagram block or blocks.
- each block in the flowchart or block diagrams may represent a module, segment, or portion of code, which comprises one or more executable instructions for implementing the specified logical function(s).
- the functions noted in the block may occur out of the order noted in the figures. For example, two blocks shown in succession may, in fact, be executed substantially concurrently, or the blocks may sometimes be executed in the reverse order, depending upon the functionality involved.
Landscapes
- Health & Medical Sciences (AREA)
- Life Sciences & Earth Sciences (AREA)
- Engineering & Computer Science (AREA)
- Cardiology (AREA)
- Physics & Mathematics (AREA)
- Animal Behavior & Ethology (AREA)
- Public Health (AREA)
- Biomedical Technology (AREA)
- Heart & Thoracic Surgery (AREA)
- Medical Informatics (AREA)
- Molecular Biology (AREA)
- Surgery (AREA)
- Biophysics (AREA)
- General Health & Medical Sciences (AREA)
- Pathology (AREA)
- Veterinary Medicine (AREA)
- Artificial Intelligence (AREA)
- Physiology (AREA)
- Evolutionary Computation (AREA)
- Fuzzy Systems (AREA)
- Mathematical Physics (AREA)
- Computer Vision & Pattern Recognition (AREA)
- Psychiatry (AREA)
- Signal Processing (AREA)
- Measurement And Recording Of Electrical Phenomena And Electrical Characteristics Of The Living Body (AREA)
Description
- The heart rate never reaches a steady state, as it is controlled by complex, dynamic, chaotic processes and oscillates at different periods over different, continuously shifting time scales (Goldberger AL et al. Sci Am. 1990;262:42-9). Therefore, it is not surprising that ECG recordings in mammals, even under resting conditions, reveal complex beat-to-beat variations in heartbeat intervals (Papaioannou V et al. Frontiers in physiology. 2013;4:174). While a decrease in this complexity in humans with cardiovascular disease correlates with increased morbidity and mortality (Hillebrand Set al. Europace. 2013;15:742-9), an increase in heart rate variability (HRV) above a certain threshold, or in mathematical terms, in system entropy, leads to the abnormal electrical impulse conductance that is defined as fibrillation.
- Cardiac fibrillation is one of the leading causes of morbidity and mortality in the developed world, where atrial fibrillation (AF) is the most common sustained arrhythmia (Wolf PA et al. Stroke. 1991;22:983-8), affecting approximately 2.2 million patients in the United States, and its prevalence increases with age (Feinberg WM et al. Archives of internal medicine. 1995;155:469-73). Although AF is not considered a life-threating arrhythmia, it affects the circulatory system of patients and their general health and quality of life; further, it poses a significant burden on the healthcare system (Feinberg WM et al. Archives of internal medicine. 1995;155:469-73): e.g., AF is a significant risk factor for stroke, with about 15% of strokes occurring in people with AF (Go et al. JAMA. 2001;285:2370-5). Unfortunately, currently available drug treatments for AF are less than satisfactory. An expert panel convened by the Heart, Lung and Blood Institute to resolve this issue determined that "AF detection by using emerging methods and technologies" constitutes an important future direction in preventing AF (Benjamin EJ et al. Circulation. 2009;119:606-18). To date, there is no effective clinical method for early prediction and precise identification of AF events.
- Interestingly, while persistent AF is associated with an increased HRV on average (Bergfeldt L et al. J Appl Physiol. 2003;94:2217-24), reduced HRV indices are observed just prior to arrhythmogenic events (Akyurek O et al. Clinical cardiology. 2003;26:196-200). Although the correlation between changes in heart beat complexity and prevalence of AF has been known for more than three decades (Akyurek O et al. Clinical cardiology. 2003;26:196-200; Vaziri SM et al. Circulation. 1994;89:724-30; Seaborn GE et al. Annals of noninvasive electrocardiology : the official journal of the International Society for Holter and Noninvasive Electrocardiology, Inc. 2014;19:23-33), a method to detect HRV changes on line and in short period before AF event occurs does not exist.
-
US 2016/135706 describes a method for medical premonitory event estimation includes one or more processors to perform operations. This method comprises: acquiring a first set of physiological information of a subject, and a second set of physiological information of the subject received during a second period of time; calculating a first and second risk scores associated with estimating a risk of a potential cardiac arrhythmia event for the subject based on applying the first and second sets of physiological information to one or more machine learning classifier models; providing at least the first and second risk scores associated with the potential cardiac arrhythmia event as a time changing series of risk scores; and classifying the first and second risk scores associated with estimating the risk of the potential cardiac arrhythmia event for the subject based on the one or more thresholds. -
WO 2016/183515 describes a system for cardiac monitoring, that may be used to sense the presence of an intermittent arrhythmia in an individual.US8417326B2 discloses an apparatus and method for ambulatory, real-time detection of Atrial Fibrillation (AF) providing an overall accuracy that refers to detection of AF, irrespective of the duration of AF and beat-to-beat classification. - The invention is as defined in the appended claims.
- There is provided, in an embodiment, a method comprising receiving a plurality of data segments each representing human cardiac activity; calculating, from each of said data segments, a first value representing a distribution of a heart rate variability (HRV) parameter; acquiring a signal representing cardiac activity in a patient; deriving a second value representing distribution of an HRV parameter in said signal; and indicating an atrial fibrillation (AF) event in said patient, when a difference between said first and second values is above a predetermined threshold.
- There is also provided in an embodient, a system comprising at least one hardware processor; and a non-transitory computer-readable storage medium having stored thereon program instructions, the program instructions executable by the at least one hardware processor to: receive a plurality of data segments each representing human cardiac activity, calculate, from each of said data segments, a first value representing a distribution of a heart rate variability (HRV) parameter, acquire a signal representing cardiac activity in a patient, derive a second value representing distribution of an HRV parameter in said signal, and indicate an atrial fibrillation (AF) event in said patient, when a difference between said first and second values is above a predetermined threshold.
- There is further provided, in an embodiment, a computer program product comprising a non-transitory computer-readable storage medium having program instructions embodied therewith, the program instructions executable by at least one hardware processor to: receive a plurality of data segments each representing human cardiac activity; calculate, from each of said data segments, a first value representing a distribution of a heart rate variability (HRV) parameter; acquire a signal representing cardiac activity in a patient; derive a second value representing distribution of an HRV parameter in said signal; and indicate an atrial fibrillation (AF) event in said patient, when a difference between said first and second values is above a predetermined threshold.
- In some embodiments, said plurality of data segments represent cardiac activity in a plurality of subjects.
- In some embodiments, at least some of said data segments are acquired from said patient.
- In some embodiments, said HRV parameter is an entropy parameter.
- In some embodiments, said entropy parameter is modified Shannon entropy.
- In some embodiments, said calculating comprises calculating a distribution of said HRV parameter in all said data segments.
- In some embodiments, each of said data segments is acquired over a period of between 1 and 10 minutes.
- In some embodiments, said signal is acquired over a period of between 0.5 and 5 minutes.
- In some embodiments, the method further comprises training, and the program instructions are further executable to train, at a training stage, a machine learning classifier on a training set comprising: (i) said plurality of data segment, wherein at least some of said segments comprise cardiac activity reflecting an arrythmia event, and (ii) labels indicating the occurrence of an arrythmia event in said cardiac activity.
- In some embodiments, said data segments are labelled with said labels.
- In some embodiments, said indicating is performed by applying, at an inference stage, said machine learning classifier to said signal, to indicate an AF event in said patient.
- In some embodiments, said indicating comprises at least one of detecting an ongoing AF event, and predicting an upcoming AF event.
- In some embodiments, said upcoming AF event occurs between 1 and 5 minutes after said indicating.
- In some embodiments, said detecting is based, at least in part, on calculating statistical estimators of said distribution.
- In some embodiments, said statistical estimators comprise at least standard deviation and deviation from normal distribution.
- In some embodiments, said deviation from normal distribution is based on the Kolmogorov-Smirnov statistic.
- In some embodiments, the method further comprises applying, and the program instructions are further executable to apply, a clustering algorithm to said plurality of data segments, to cluster at least some of said data segments based, at least in part, on said HRV parameter. In some embodiments, said clustering algorithm is a spectral clustering algorithm.
- In addition to the exemplary aspects and embodiments described above, further aspects and embodiments will become apparent by reference to the figures and by study of the following detailed description.
- Exemplary embodiments are illustrated in referenced figures. Dimensions of components and features shown in the figures are generally chosen for convenience and clarity of presentation and are not necessarily shown to scale. The figures are listed below.
-
Fig. 1 is a block diagram of a system for predicting and/or detecting atrial fibrillation or other irregular regularity, according to an embodiment; -
Fig. 2 is a flowchart of a method for predicting and/or detecting atrial fibrillation or other irregular regularity, according to an embodiment; and -
Figs. 3 ,4A-B ,5 ,6 ,7A-B ,8 ,9A-B and10 illustrate experimental results of a method for predicting and/or detecting atrial fibrillation or other irregular regularity, according an embodiment. - A system and method are disclosed herein for detecting and/or predicting atrial fibrillation (AF) or other irregular regularity. In some embodiments, the present invention provides for real-time prediction or detection of AF or other irregular regularity by employing an algorithm based on pattern classification of the distribution of a modified Shannon entropy of beating intervals of heart beats intervals. The present method and system produce a real-time alarm when certain changes occur in the modified Shannon entropy of a patient.
- The present invention is based on the finding that persistent AF is associated with an increased HRV on average (L. Bergfeldt and Y. Haga, "Power spectral and Poincaré plot characteristics in sinus node dysfunction," J. Appl. Physiol., vol. 94, no. 6, pp. 2217-2224, 2003). However, reduced HRV indices are observed just prior to events (O. Akyurek, E. Diker, M. Guldal, and D. Oral, "Predictive value of heart rate variability for the recurrence of chronic atrial fibrillation after electrical cardioversion," Clin Cardiol, vol. 26, no. 4, pp. 196-200, 2003). Therefore, an atypical decrease in HRV might be predictive for an upcoming episode of AF, and thus a useful marker to be used in the detection, prevention, research and treatment of AF.
- The present invention provides clinical and diagnostic tools for early prediction and detection of AF events by examining changes in HRV. Real-time analysis of HRV of a patient, based on short segments of heartbeat intervals, according to the present method may help to detect and prevent AF events, thereby reducing the probability of associated events, such as strokes. In some embodiments, the disclosed invention allows for prediction of AF events shortly (e.g., 5 min.) before they occur. Early prediction of AF events thus will allow to determine which hemodynamic, mechanical or electrical parameters change just before each episode, and help during ablation procedure.
- The present invention can be implemented, for example, as an early detection and prediction system for atrial fibrillation based on continuous heart rate monitoring, as well as for early prediction of arrhythmia episodes in general. In some embodiments, heart beat segments can be acquired from a mobile device, a wearable device, a device that is used to monitor or diagnose medical conditions by medical experts, and/or based on a smart implantable cardiac defibrillator. Because the disclosed method provides for quantifying the HRV accurately based on relatively short segments of heart beats, it can be implemented based on, e.g., a remote ECG acquiring system. Thus, the present method can provide for efficient and cost-effective local and/or remote monitoring of multiple AF patients.
- In some embodiments, the present disclosure can be implemented, for example, as a diagnostic system used for assessing the underlying etiology and/or the arrythmia profile of each patient's AF events, allowing personalized treatment.
- In some embodiments, methods for predicting and/or detecting AF according to the present disclosure comprise a first step of acquiring and/or receiving one or more prerecorded baseline segments of cardiac activity comprising multiple heart beat intervals of a subject. The baseline segments comprise a plurality of heart beat intervals taken, e.g., at rest, when no arrythmia event was in progress. In some embodiments, the recording of the baseline signal is performed over a period of, e.g., 1 to 10 minutes. A modified Shannon entropy distribution and/or other HRV indices are may then be calculated for the baseline signal. In some embodiments, the present method further comprises calculating a difference in Shannon entropies between every two or more consecutive heart beat intervals of the baseline signal, wherein the calculation of the baseline distribution is based on the calculated differences in Shannon entropies.
- In some embodiments, the modified Shannon Entropy is used to separate patients into groups by, e.g., Spectral Clustering.
- In real time, a second, shorter, segment of the patient cardiac activity measurement is acquired (the "real-time segment" ), wherein a modified Shannon entropy distribution and/or other HRV indices are calculated for the real-time segment as well. The distributions of the baseline and real-time segments are compared to one another. In some embodiments, when a difference in distribution width between the baseline and second segments is above a predetermined threshold, an AF event is predicted and/or detected. In some embodiments, the recording of the real-time segment is performed over a period of 30 seconds to 5 minutes.
- In some embodiments, the present disclosure may be implemented as a machine leanring classifier trained on a training set comprising a plurality of cardiac activity segments acquired from a population of subjects, wherein at an inference stage the classifier may be configured to predict and/or detect AF event in a real-time segment acquired from a monitored subject.
- Accordingly, in some embodiments, a machine leanring classifier may be trained, e.g., on a training set comprising a plurality of recorded baseline segments measurements from, e.g., a group of subjects. In some embodiments, the baseline segments may comprise a plurality of heart beat intervals of each subject taken, e.g., at rest, when no arrythmia event was in progress. In some embodiments, each segment may comprise, e.g., 1 to 10 minutes of recorded cardiac activity. In some embodiments, an existing database of cardiac activity recordings form a plurality of subjects may comprise at least a portion of the training set. In some embodiments, a modified Shannon entropy distribution and/or other HRV indices are may be derived for each segment within the training set. In some embodiments, modified Shannon entropy may be derived, e.g., by calculating a difference in Shannon entropies between every two or more consecutive heart beat intervals of the baseline signal.
- In some embodiments, the training set may be labelled with appropriate labels indicating the existence of an AF event within each segment. In some embodiments, the machine learning classifier may be trained on the training set to classify a segment of cardiac activity as indicative of a concurrent and/or imminent (e.g., within a time horizon of 1-5 mins.) AF event. In some embodiments, a trained classifier of the present disclosure may be used to detect and or predict an AF event, based, at least in part, on a segment of cardiac activity measurement acquired in real time from a subject, wherein the segment may comprise a recording of cardiac activity over a period of 30 seconds to 5 minutes.
- With reference to
Fig. 1 , in some embodiments, anexemplary system 100 in accordance with the present disclosure comprises processingunit 102, comprising at least one hardware processor.Processing unit 102 is communicatively connected to a non-transient computerreadable storage device 104.Processing unit 102 is configured to automatically control the operation ofsystem 100, based on one or more applications, sets of software instructions, and algorithms storedstorage device 104.Storage device 104 may be configured to have stored thereon digital representations of cardiac signals and/or measurements. In some embodiments, processingunit 102 is configured to receive and process one or more cardiac signals and/or measurements collected by one or morecardiac signal sensors 106.System 100 may further comprise acommunication module 108, which may be configured to connectsystem 100 through a communication network, such as the Internet, a local area network, a wide area network, and/or a wireless network. For example,system 100 may be configured to receive cardiac signals from a remote acquisition unit over a network viacommunication module 108.System 100 described herein is only an exemplary embodiment, and may have more or fewer components than shown, may combine two or more components, or a may have a different configuration or arrangement of the components. The various components ofsystem 100 may be implemented in hardware, software, or a combination of both hardware and software. According to various other embodiments, processingunit 102 or processing tasks performed thereby may be implemented by a handheld or worn computing device such as, but not limited to, a smart phone, a tablet computer, a notepad computer, smart watch, and the like. In addition, aspects of the present system which can be implemented by computer program instructions, may be executed on a general-purpose computer, a special-purpose computer, or other programmable data processing apparatus. -
Fig. 2 is a flowchart illustrating the functional steps of an exemplary prediction and/or detectionmachine leanring classifier 200, according to some embodiments of the present disclosure.Classifier 200 is configured to calculate HRV over relatively short real-time segments of heart beat, based on pattern classification of distribution of the modified Shannon entropy of beating intervals.Classifier 200 works in two stages: a learning stage (steps 202-206) and an inference stage (steps 208-214). - At a learning stage, starting at 202, a training set of baseline cardiac activity segments of a single or a plurality of subjects may be acquired or received. The baseline segments can be acquired using an ECG and/or similar acquiring methodology from the subjects at rest. In some embodiments, the baseline segments comprise a segment of ECG and/or other bio-signal measurement which can be used to calculate the heart beating intervals (e.g., saturated oxygen, pulse detector, blood pressure, etc.). In some embodiments, each segment is recorded over a time period that is sufficient to create a reliable distribution curve for statistics, for example, 5 minutes. In some embodiments, the recording of the baseline segments is performed over a period of 1 to 10 minutes where no arrhythmia events are present.
- At 204, modified Shannon entropy is calculated with respect to each segment in the training set. For example, the difference in Shannon entropy of a pair in each three consecutive beats (or more beats with N-1 combination) is calculated (to reduce noise in the signal). The absolute value between each pair of beats is calculated, to provide a modified Shannon entropy value.
- At 206, the distribution of modified Shannon entropy values is calculated for the entire segment. In some embodiments, the distribution is normalized for the average modified Shannon entropy, and the shape of this probability density function is calculated. In some embodiments, the distribution of the modified Shannon entropy of the segment is represented by estimation of statistical parameters.
- At 208, a machine learning classifier is trained on the training set acquired and processed in steps 202-206.
- At an
inference stage 210, a real-time sample segment is taken over a relatively short period of time, e.g., 1 min. In some embodiments, the real-time recording of is performed over a period of 30 seconds to 5 minutes. - At 212,
classifier 200 is applied to the real-time segment, to predict and/or detect an AF event, based, at least in part, on a distribution parameter of Shannon entropy and/or other HRV indices in the real-time segment. - At 214, in case of significant differences from the baseline distribution, the real-time measurements and processing may be repeated, e.g., between 2 and 6 times.
- In some embodiments, the present disclosure employs, at least in part, the following definitions and assumptions for predicting and/or detecting AF events. For example, in the case of a finite set of consecutive beat intervals from a certain subject (time intervals between consecutive heart beats):

order 2 may be defined as
- And for a general order M where


- It is further assumed that there exists a probability density function parametric family

- It should be noted that θ might be a multi-dimensional parameter set, for which distribution there will be used the notion Y(θ). Satisfying that for every possible set D of consecutive beat intervals from the same subject exists a θ ∈ Θ, such that

- For the probability density function fX (x, θ), there is defined a "distribution width" function:

- At the learning stage, the prediction algorithm works to estimate the characteristic θ for a certain subject in an arrhythmia-free time interval. For example, in the case of a learning set


- In the real-time calculation stage, the prediction algorithm defines a "narrow" distribution as:


- Accordingly, with every new beat, the prediction algorithm estimates the current Ŵ for n iterations. In some embodiments, n is a predetermined constant number, which can be chosen based on either heuristic methods, or through statistical analysis. If n or more consecutive real-time calculation sets are considered "narrow," it is considered as an "alarm." The implementation of the present prediction algorithm requires determination of an estimator for the distribution width W and a threshold estimating function T.
- In some embodiments, the present disclosure can be implemented, for example, as a diagnostic system used for assessing the underlying etiology and/or the arrythmia profile of each patient's AF events, allowing personalized treatment. In some embodiments, the modified Shannon Entropy is used to separate patients into groups by Spectral Clustering (see, e.g., Andrew Y. Ng , Michael I. Jordan , Yair Weiss, "On spectral clustering: analysis and an algorithm", Proceedings of the 14th International Conference on Neural Information Processing Systems: Natural and Synthetic, December 03-08, 2001). In some embodiments, the spectral clustering is based on a Laplace Kernel distance metric:

- In some embodiments, the threshold estimating function, T, may be implemented using classic statistical estimators. In some embodiments, threshold estimating function, T, may be implemented using a machine learning algorithm.
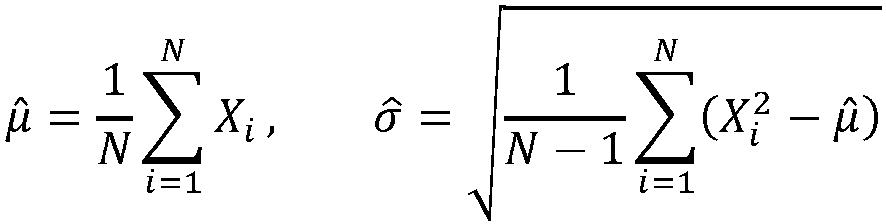
- In some embodiments, an exemplary detection algorithm according to some embodiments is based on the assumptions and definitions above, with the following additional definitions. For a set of N observations

- The estimators for the expectancy standard deviation are defined as the maximum likelihood estimators:


- Although under the present algorithm assumptions described above, the probability density function of the modified entropy exists, even if it is assumed that beat intervals are normally distributed, the use of a sum of absolute values in the modified entropy calculation might result in a different parametric family for the modified entropy. Moreover, the calculation of consecutive modified entropies used overlapping beat intervals, thus, one cannot assume Ŝi and Ŝ i+1 to be statistically independent. Thus, under different assumptions, different parametric families of distribution functions may be used.
- This theoretical result was clearly observed in numerical attempts to fit a normal distribution density function to sets of modified entropy samples, even when calculated from signals taken from the healthy subjects.
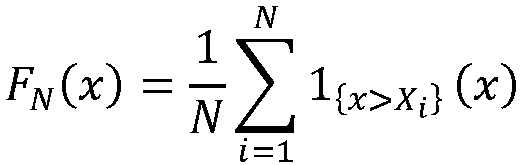
Fig. 3 illustrates a density function fitting calculated and plotted by a Matlab Distribution fitting toolbox, in which a discrepancy between the histogram and the best fitting is evident. Accordingly, instead of finding a parametric family and truly calculating the distribution width from the estimated probability density function, in some embodiments, the algorithm is configured to try to estimate the distribution width directly from the samples, some examples for such an estimator are described below. In some embodiments the algorithm directly assesses the need for an alarm from the beat intervals sequence. Nevertheless, in some embodiments, the full process of distribution parametric family determination, parameter estimation and threshold estimation is utilized. - For a set of N modified entropy samples


tail 


- The estimator to the distribution width is then:

- The use of empirical distribution functions yielded an interesting observation.
Fig. 4 shows multiple empirical distribution functions of 1-minute sets of beat intervals from the same subject on the same figure. Difference can be noted between panel A, plotted using a recording from a subject with occasional AF episodes, and panel B, plotted using a recording from a healthy subject. In the healthy subject, it can qualitatively be seen that although some variability between the distribution of different sets exists, the variability is low and there are no distinct groups of curves. Conversely, in panel A, representing the AF patient's records, larger variability can be seen with 2 distinguishable groups of distribution width. Another, more subtle difference is the presence of some very narrow curves in the AF patient's results, which are absent in the healthy patient's results. These differences suggest that the empirical distribution width might hold the information needed to differentiate patients with and without AF. - A natural choice for a parameter to estimate distribution width is variance. The estimation of variance was made by the unbiased version of the maximum likelihood estimator:

- To reduce the noise, a moving average filter may be used, which produce a smoother signal.
Fig. 5 shows a time plot with the σ̂ 2 estimator, whileFig. 6 shows the same time interval with the filtered estimator, wherein annotations of AF onset are marked by Xs. Higher values during arrhythmia episodes can be seen, with and the low values often preceding their onset. - An example of the threshold determination from a learning set

- Calculate the modified entropy for each possible time point to yield a set of modified entropies


- Then calculate the mean of the variance estimator:


- Using this threshold, the preliminary definition for an alarm is:

-
Figs. 7A-7B shows a plot of the σ̂ 2 estimator after a running average filter in a representative time interval from an AF subject. Annotations of AF onset are marked by Xs, and alarms are marked by Xs of lighter shade. -
Fig. 7A shows the same interval from the previous figures, now with the alarms (using α =
Fig. 7B shows a similar plot of another time interval from the same subject. - As a point of comparison,
Fig. 8 shows a similar plot from a healthy subject. Even though some fluctuating does occur in healthy subjects, extremely low values are rare, and therefore in most of healthy subjects, no alarms are produced. - Using the Laplace Kernel distance metric for the Spectral Clustering algorithm, we clustered a patients cohort of both AF and healthy patients into 3 groups. Than we calculated the mean Multi-Scale Entropy (see, Costa M. at. Al., Physical review letters 89, no. 6 (2002): 068102) measure for each group. In
Figs. 9A-9B , one can see the correlation between the 3 groups from a controlled rabbits' experiment (Fig. 9A , see, e.g., Rosenberg, A.A. (2018), "Non-Invasive In-Vivo Analysis of Intrinsic Clock-Like Pacemaker Mechanisms: Decoupling Neural Input Using Heart Rate Variability Measurements" (master's thesis)) to that of the clustering (Fig. 9B ). On further investigation, the clustering was found to group patients with similar pattern of arrhythmia. - In some embodiments, the clustering method herein is used to classify patients to groups to assist the personalization of medical treatment.
- Atrial fibrillation is classically defined as "...a supraventricular arrhythmia characterized electrocardiographically by low-amplitude baseline oscillations (fibrillatory or f waves) and an irregularly irregular ventricular rhythm..." (see, Mann, Douglas L. et al., "Braunwald's Heart Disease: A Textbook of Cardiovascular Medicine." 10th edition. Philadelphia, PA: Elsevier/Saunders, 2015). Thus, in some embodiments, an algorithm identifying irregular irregularity of heart rate is used to detect atrial fibrillation episodes.
- Heart rate irregularity show a strong correlation with the standard deviation of the modified Shannon entropy, but does not tell regular irregularity and irregular irregularity apart. The normality measure described above tell regular irregularity and irregular irregularity apart but is not specific for irregular irregularity and may give similar results in irregular irregularity and in normal sinus rhythm with complex dynamics. Thus, in some embodiments, both measures are used together to detect AF episodes. In
Fig. 10 one may see that although both the standard deviation (denoted "var" in the legend) and the normality measure (denoted "ks" in the legend) can rise separately on non-AF times, they rise together only during the AF episodes. - As will be appreciated by one skilled in the art, aspects of the present invention may be embodied as a system, method or computer program product. Accordingly, aspects of the present invention may take the form of an entirely hardware embodiment, an entirely software embodiment (including firmware, resident software, micro-code, etc.) or an embodiment combining software and hardware aspects that may all generally be referred to herein as a "circuit," "module" or "system." Furthermore, aspects of the present invention may take the form of a computer program product embodied in one or more computer readable medium(s) having computer readable program code embodied thereon.
- Any combination of one or more computer readable medium(s) may be utilized. The computer readable medium may be a computer readable signal medium or a computer readable storage medium. A computer readable storage medium may be, for example, but not limited to, an electronic, magnetic, optical, electromagnetic, infrared, or semiconductor system, apparatus, or device, or any suitable combination of the foregoing. More specific examples (a non-exhaustive list) of the computer readable storage medium would include the following: an electrical connection having one or more wires, a portable computer diskette, a hard disk, a random access memory (RAM), a read-only memory (ROM), an erasable programmable read-only memory (EPROM or Flash memory), an optical fiber, a portable compact disc read-only memory (CD-ROM), an optical storage device, a magnetic storage device, or any suitable combination of the foregoing. In the context of this document, a computer readable storage medium may be any tangible medium that can contain, or store a program for use by or in connection with an instruction execution system, apparatus, or device.
- A computer readable signal medium may include a propagated data signal with computer readable program code embodied therein, for example, in baseband or as part of a carrier wave. Such a propagated signal may take any of a variety of forms, including, but not limited to, electromagnetic, optical, or any suitable combination thereof. A computer readable signal medium may be any computer readable medium that is not a computer readable storage medium and that can communicate, propagate, or transport a program for use by or in connection with an instruction execution system, apparatus, or device.
- Program code embodied on a computer readable medium may be transmitted using any appropriate medium, including but not limited to wireless, wireline, optical fiber cable, RF, etc., or any suitable combination of the foregoing.
- Computer program code for carrying out operations for aspects of the present invention may be written in any combination of one or more programming languages, including an object-oriented programming language such as Java, Smalltalk, C++ or the like and conventional procedural programming languages, such as the "C" programming language or similar programming languages. The program code may execute entirely on the user's computer, partly on the user's computer, as a stand-alone software package, partly on the user's computer and partly on a remote computer or entirely on the remote computer or server. In the latter scenario, the remote computer may be connected to the user's computer through any type of network, including a local area network (LAN) or a wide area network (WAN), or the connection may be made to an external computer (for example, through the Internet using an Internet Service Provider).
- Aspects of the present invention are described herein with reference to flowchart illustrations and/or block diagrams of methods, apparatus (systems) and computer program products according to embodiments of the invention. It will be understood that each block of the flowchart illustrations and/or block diagrams, and combinations of blocks in the flowchart illustrations and/or block diagrams, can be implemented by computer program instructions. These computer program instructions may be provided to a hardware processor of a general-purpose computer, special purpose computer, or other programmable data processing apparatus to produce a machine, such that the instructions, which execute via the processor of the computer or other programmable data processing apparatus, create means for implementing the functions/acts specified in the flowchart and/or block diagram block or blocks.
- These computer program instructions may also be stored in a computer readable medium that can direct a computer, other programmable data processing apparatus, or other devices to function in a particular manner, such that the instructions stored in the computer readable medium produce an article of manufacture including instructions which implement the function/act specified in the flowchart and/or block diagram block or blocks.
- The computer program instructions may also be loaded onto a computer, other programmable data processing apparatus, or other devices to cause a series of operational steps to be performed on the computer, other programmable apparatus or other devices to produce a computer implemented process such that the instructions which execute on the computer or other programmable apparatus provide processes for implementing the functions/acts specified in the flowchart and/or block diagram block or blocks.
- The flowcharts and block diagrams in the Figures illustrate the architecture, functionality, and operation of possible implementations of systems, methods and computer program products according to various embodiments of the present invention. In this regard, each block in the flowchart or block diagrams may represent a module, segment, or portion of code, which comprises one or more executable instructions for implementing the specified logical function(s). It should also be noted that, in some alternative implementations, the functions noted in the block may occur out of the order noted in the figures. For example, two blocks shown in succession may, in fact, be executed substantially concurrently, or the blocks may sometimes be executed in the reverse order, depending upon the functionality involved. It will also be noted that each block of the block diagrams and/or flowchart illustration, and combinations of blocks in the block diagrams and/or flowchart illustration, can be implemented by special purpose hardware-based systems that perform the specified functions or acts, or combinations of special purpose hardware and computer instructions.
- The descriptions of the various embodiments of the present invention have been presented for purposes of illustration, but are not intended to be exhaustive or limited to the embodiments disclosed. Many modifications and variations will be apparent to those of ordinary skill in the art without departing from the scope of the described embodiments. The terminology used herein was chosen to best explain the principles of the embodiments, the practical application or technical improvement over technologies found in the marketplace, or to enable others of ordinary skill in the art to understand the embodiments disclosed herein.
Claims (14)
- A system comprising: an electrocardiogram (ECG) acquiring system (106); at least one hardware processor (102); and a non-transitory computer-readable storage medium (104) having stored thereon program instructions, the program instructions executable by the at least one hardware processor to receive (202), from the ECG acquiring system, data segments representing human cardiac activity, wherein the program instructions are characterized by:recording a baseline signal, comprising a plurality of data segments over a first period;calculating (204) a difference in Shannon entropies between every two or more consecutive heartbeat intervals of the baseline signal, to obtain from each of said data segments a first value representing distribution of modified Shannon entropy ;acquiring a real-time segment (210) representing cardiac activity in a patient over a second period, shorter than the first period;calculating a second value representing distribution of modified Shannon entropy of the real-time segment;calculating a difference between said first and second values; andindicating an atrial fibrillation (AF) event in said patient when the calculated difference is above a predetermined threshold.
- The system of claim 1, wherein the program instructions are further configured to calculate a difference between said first and second values by:calculating a normalized distribution F̃(x) of the modified Shannon entropy distributions;calculating (206) a standard deviation of the normalized distributions; andcalculating a normality measure KS, representing deviation from normal distribution of the modified Shannon entropy distributions.
- The system of claim 2, wherein the program instructions are further configured to calculate difference between said first and second values by calculating difference in the normality measure and the standard deviation.
- The system of claim 2, wherein the program instructions are further configured to detect an AF event based on rise of both the normality measure and the standard deviation
- The system of claim 2, wherein the program instructions are further configured to calculate the normality measure KS based on the Kolmogorov-Smirnov (KS) statistic.
- The system of claim 1, wherein at least some of said data segments are acquired from said patient.
- The system of any one of claims 1-6, wherein said program instructions are further executable to train (208), at a training stage, a machine learning classifier on a training set comprising:(i) said plurality of data segments, wherein at least some of said segments comprise cardiac activity reflecting an arrythmia event, and(ii) labels indicating the occurrence of an arrythmia event in said cardiac activity.
- The system of claim 7, wherein said indicating is performed by applying (210), at an inference stage, said machine learning classifier to said real-time segment, to indicate an AF event in said patient.
- The system of claim 1, wherein the program instructions are further configured to:perform spectral clustering of patients, based on the modified Shannon entropy distribution, into groups having similar patterns of arrhythmia; anddetermine an etiology of a patient's AF event, based on the clustering.
- The system of claim 9, wherein the program instructions are configured to perform the spectral clustering of patients using Laplace Kernel distance as a distance metric.
- A computer program product comprising instructions which, when the program is executed by the system of claim 1, receive a plurality of data segments each representing human cardiac activity, wherein the computer program product is characterized as configured to:record a baseline signal (202), comprising a plurality of data segments over a first period;calculate (204) a difference in Shannon entropies between every two or more consecutive heartbeat intervals of the baseline signal, to obtain from each of said data segments, a first value representing distribution of modified Shannon entropy;acquire a real-time segment (210) representing cardiac activity in a patient over a second period, shorter than the first period;calculate a second value representing distribution of modified Shannon entropy of the real-time segment;calculate a difference between said first and second values; andindicate an atrial fibrillation (AF) event in said patient when the calculated difference is above a predetermined threshold.
- The computer program product of claim 11, wherein at least some of said data segments are acquired from said patient.
- The computer program product of claim 11, wherein said program instructions are further executable to train (208), at a training stage, a machine learning classifier on a training set comprising:(i) said plurality of data segments, wherein at least some of said segments comprise cardiac activity reflecting an arrythmia event, and(ii) labels indicating the occurrence of an arrythmia event in said cardiac activity.
- The computer program product of claim 13, wherein said indicating is performed by applying (210), at an inference stage, said machine learning classifier to said signal, to indicate an AF event in said patient.
Applications Claiming Priority (2)
| Application Number | Priority Date | Filing Date | Title |
|---|---|---|---|
| US201862639543P | 2018-03-07 | 2018-03-07 | |
| PCT/IL2019/050256 WO2019171384A1 (en) | 2018-03-07 | 2019-03-07 | Atrial fibrillation prediction using heart rate variability |
Publications (3)
| Publication Number | Publication Date |
|---|---|
| EP3761869A1 EP3761869A1 (en) | 2021-01-13 |
| EP3761869A4 EP3761869A4 (en) | 2021-12-01 |
| EP3761869B1 true EP3761869B1 (en) | 2025-05-07 |
Family
ID=67846471
Family Applications (1)
| Application Number | Title | Priority Date | Filing Date |
|---|---|---|---|
| EP19763588.1A Active EP3761869B1 (en) | 2018-03-07 | 2019-03-07 | Atrial fibrillation prediction using heart rate variability |
Country Status (3)
| Country | Link |
|---|---|
| US (1) | US11653871B2 (en) |
| EP (1) | EP3761869B1 (en) |
| WO (1) | WO2019171384A1 (en) |
Families Citing this family (7)
| Publication number | Priority date | Publication date | Assignee | Title |
|---|---|---|---|---|
| WO2020049571A1 (en) | 2018-09-06 | 2020-03-12 | Technion Research & Development Foundation Limited | Predicting ventricular fibrillation |
| US12053287B2 (en) * | 2018-10-26 | 2024-08-06 | Mayo Foundation For Medical Education And Research | Neural networks for atrial fibrillation screening |
| CN110840443B (en) * | 2019-11-29 | 2022-06-10 | 京东方科技集团股份有限公司 | Electrocardiosignal processing method, electrocardiosignal processing device and electronic equipment |
| CN116204783B (en) * | 2022-12-23 | 2025-10-31 | 恒玄科技(上海)股份有限公司 | Model training method, device, electronic equipment and computer readable storage medium |
| DE102022134912A1 (en) * | 2022-12-28 | 2024-07-04 | PERI Consultancy BVBA | Use of a data processing device for analyzing a short-term electrocardiogram |
| US12493661B2 (en) | 2023-12-19 | 2025-12-09 | Ebay Inc. | Similarity sensitive diversity |
| CN117807551B (en) * | 2024-02-29 | 2024-05-24 | 深圳市魔样科技股份有限公司 | Heart rate abnormality capturing method and system based on intelligent ring |
Citations (1)
| Publication number | Priority date | Publication date | Assignee | Title |
|---|---|---|---|---|
| US8417326B2 (en) * | 2007-08-02 | 2013-04-09 | The Research Foundation Of State University Of New York | RR interval monitoring method and blood pressure cuff utilizing same |
Family Cites Families (11)
| Publication number | Priority date | Publication date | Assignee | Title |
|---|---|---|---|---|
| WO2005067790A1 (en) * | 2004-01-16 | 2005-07-28 | Compumedics Ltd | Method and apparatus for ecg-derived sleep disordered breathing monitoring, detection and classification |
| WO2008128034A1 (en) * | 2007-04-12 | 2008-10-23 | University Of Virginia Patent Foundation | Method, system and computer program product for non-invasive classification of cardiac rhythm |
| US9320448B2 (en) * | 2008-04-18 | 2016-04-26 | Pacesetter, Inc. | Systems and methods for improved atrial fibrillation (AF) monitoring |
| US8795173B2 (en) * | 2011-05-17 | 2014-08-05 | Massachusetts Institute Of Technology | Methods and apparatus for assessment of atypical brain activity |
| EP3079571A4 (en) * | 2013-12-12 | 2017-08-02 | Alivecor, Inc. | Methods and systems for arrhythmia tracking and scoring |
| US20160081566A1 (en) * | 2014-09-22 | 2016-03-24 | Xerox Corporation | Identifying a type of cardiac event from a cardiac signal segment |
| CN104367318A (en) | 2014-11-07 | 2015-02-25 | 北京海思敏医疗技术有限公司 | Detection method and device for atrial fibrillation |
| EP3204881B1 (en) | 2014-11-14 | 2021-05-26 | Zoll Medical Corporation | Medical premonitory event estimation |
| EP3282933B1 (en) | 2015-05-13 | 2020-07-08 | Alivecor, Inc. | Discordance monitoring |
| CN106073755A (en) | 2016-05-27 | 2016-11-09 | 成都信汇聚源科技有限公司 | The implementation method that in a kind of miniature holter devices, atrial fibrillation identifies automatically |
| JP7670483B2 (en) | 2017-10-06 | 2025-04-30 | アライヴコア・インコーポレーテッド | Continuous monitoring of user health using mobile devices |
-
2019
- 2019-03-07 EP EP19763588.1A patent/EP3761869B1/en active Active
- 2019-03-07 US US16/978,724 patent/US11653871B2/en active Active
- 2019-03-07 WO PCT/IL2019/050256 patent/WO2019171384A1/en not_active Ceased
Patent Citations (1)
| Publication number | Priority date | Publication date | Assignee | Title |
|---|---|---|---|---|
| US8417326B2 (en) * | 2007-08-02 | 2013-04-09 | The Research Foundation Of State University Of New York | RR interval monitoring method and blood pressure cuff utilizing same |
Also Published As
| Publication number | Publication date |
|---|---|
| US11653871B2 (en) | 2023-05-23 |
| WO2019171384A1 (en) | 2019-09-12 |
| EP3761869A4 (en) | 2021-12-01 |
| EP3761869A1 (en) | 2021-01-13 |
| US20210282692A1 (en) | 2021-09-16 |
Similar Documents
| Publication | Publication Date | Title |
|---|---|---|
| EP3761869B1 (en) | Atrial fibrillation prediction using heart rate variability | |
| US11647963B2 (en) | System and method for predicting acute cardiopulmonary events and survivability of a patient | |
| Eerikäinen et al. | Detecting atrial fibrillation and atrial flutter in daily life using photoplethysmography data | |
| US20210275046A1 (en) | Peak Detection System and Method for Calculation of Signal-Derived Metrics | |
| EP2944251B1 (en) | Method, apparatus and computer-readable medium for confidence level determination of ambulatory hr algorithm based on a three-way rhythm classifier | |
| US9585589B2 (en) | Computerized systems and methods for stability-theoretic prediction and prevention of sudden cardiac death | |
| US9801553B2 (en) | System, method, and computer program product for the real-time mobile evaluation of physiological stress | |
| Melillo et al. | Wearable technology and ECG processing for fall risk assessment, prevention and detection | |
| US12539087B2 (en) | ECG-based age and sex estimation | |
| Tadi et al. | Comprehensive analysis of cardiogenic vibrations for automated detection of atrial fibrillation using smartphone mechanocardiograms | |
| EP3111830B1 (en) | Computer program and system for predicting of acute hypotensive episodes | |
| Vanitha et al. | Hierarchical SVM to detect mental stress in human beings using Heart Rate Variability | |
| Rezaei Yousefi et al. | Atrial fibrillation detection from wrist photoplethysmography data using artificial neural networks | |
| Trardi et al. | Computationally efficient algorithm for atrial fibrillation detection using linear and geometric features of RR time-series derivatives | |
| Fujiwara et al. | IoT-Based Atrial Fibrillation Screening System, Development, and Prospective Study | |
| US20250176905A1 (en) | Devices and methods for predicting effect of a cardiovascular medication administration program | |
| Yousefi et al. | Photoplethysmography Data Using Artificial | |
| Ramirez-Villegas et al. | Heart Rate Variability Dynamics for the |
Legal Events
| Date | Code | Title | Description |
|---|---|---|---|
| STAA | Information on the status of an ep patent application or granted ep patent |
Free format text: STATUS: THE INTERNATIONAL PUBLICATION HAS BEEN MADE |
|
| PUAI | Public reference made under article 153(3) epc to a published international application that has entered the european phase |
Free format text: ORIGINAL CODE: 0009012 |
|
| STAA | Information on the status of an ep patent application or granted ep patent |
Free format text: STATUS: REQUEST FOR EXAMINATION WAS MADE |
|
| 17P | Request for examination filed |
Effective date: 20201007 |
|
| AK | Designated contracting states |
Kind code of ref document: A1 Designated state(s): AL AT BE BG CH CY CZ DE DK EE ES FI FR GB GR HR HU IE IS IT LI LT LU LV MC MK MT NL NO PL PT RO RS SE SI SK SM TR |
|
| AX | Request for extension of the european patent |
Extension state: BA ME |
|
| DAV | Request for validation of the european patent (deleted) | ||
| DAX | Request for extension of the european patent (deleted) | ||
| REG | Reference to a national code |
Ref country code: DE Ref legal event code: R079 Free format text: PREVIOUS MAIN CLASS: A61B0005046000 Ipc: A61B0005000000 Ref document number: 602019069651 Country of ref document: DE |
|
| A4 | Supplementary search report drawn up and despatched |
Effective date: 20211028 |
|
| RIC1 | Information provided on ipc code assigned before grant |
Ipc: A61B 5/024 20060101ALI20211022BHEP Ipc: A61B 5/00 20060101AFI20211022BHEP |
|
| P01 | Opt-out of the competence of the unified patent court (upc) registered |
Effective date: 20230711 |
|
| GRAP | Despatch of communication of intention to grant a patent |
Free format text: ORIGINAL CODE: EPIDOSNIGR1 |
|
| STAA | Information on the status of an ep patent application or granted ep patent |
Free format text: STATUS: GRANT OF PATENT IS INTENDED |
|
| INTG | Intention to grant announced |
Effective date: 20241028 |
|
| GRAS | Grant fee paid |
Free format text: ORIGINAL CODE: EPIDOSNIGR3 |
|
| GRAA | (expected) grant |
Free format text: ORIGINAL CODE: 0009210 |
|
| STAA | Information on the status of an ep patent application or granted ep patent |
Free format text: STATUS: THE PATENT HAS BEEN GRANTED |
|
| AK | Designated contracting states |
Kind code of ref document: B1 Designated state(s): AL AT BE BG CH CY CZ DE DK EE ES FI FR GB GR HR HU IE IS IT LI LT LU LV MC MK MT NL NO PL PT RO RS SE SI SK SM TR |
|
| REG | Reference to a national code |
Ref country code: GB Ref legal event code: FG4D |
|
| REG | Reference to a national code |
Ref country code: CH Ref legal event code: EP |
|
| REG | Reference to a national code |
Ref country code: DE Ref legal event code: R096 Ref document number: 602019069651 Country of ref document: DE |
|
| REG | Reference to a national code |
Ref country code: IE Ref legal event code: FG4D |
|
| REG | Reference to a national code |
Ref country code: NL Ref legal event code: MP Effective date: 20250507 |
|
| PG25 | Lapsed in a contracting state [announced via postgrant information from national office to epo] |
Ref country code: PT Free format text: LAPSE BECAUSE OF FAILURE TO SUBMIT A TRANSLATION OF THE DESCRIPTION OR TO PAY THE FEE WITHIN THE PRESCRIBED TIME-LIMIT Effective date: 20250908 Ref country code: ES Free format text: LAPSE BECAUSE OF FAILURE TO SUBMIT A TRANSLATION OF THE DESCRIPTION OR TO PAY THE FEE WITHIN THE PRESCRIBED TIME-LIMIT Effective date: 20250507 Ref country code: FI Free format text: LAPSE BECAUSE OF FAILURE TO SUBMIT A TRANSLATION OF THE DESCRIPTION OR TO PAY THE FEE WITHIN THE PRESCRIBED TIME-LIMIT Effective date: 20250507 |
|
| REG | Reference to a national code |
Ref country code: LT Ref legal event code: MG9D |
|
| PG25 | Lapsed in a contracting state [announced via postgrant information from national office to epo] |
Ref country code: GR Free format text: LAPSE BECAUSE OF FAILURE TO SUBMIT A TRANSLATION OF THE DESCRIPTION OR TO PAY THE FEE WITHIN THE PRESCRIBED TIME-LIMIT Effective date: 20250808 Ref country code: NO Free format text: LAPSE BECAUSE OF FAILURE TO SUBMIT A TRANSLATION OF THE DESCRIPTION OR TO PAY THE FEE WITHIN THE PRESCRIBED TIME-LIMIT Effective date: 20250807 |
|
| PG25 | Lapsed in a contracting state [announced via postgrant information from national office to epo] |
Ref country code: PL Free format text: LAPSE BECAUSE OF FAILURE TO SUBMIT A TRANSLATION OF THE DESCRIPTION OR TO PAY THE FEE WITHIN THE PRESCRIBED TIME-LIMIT Effective date: 20250507 Ref country code: NL Free format text: LAPSE BECAUSE OF FAILURE TO SUBMIT A TRANSLATION OF THE DESCRIPTION OR TO PAY THE FEE WITHIN THE PRESCRIBED TIME-LIMIT Effective date: 20250507 |
|
| REG | Reference to a national code |
Ref country code: AT Ref legal event code: MK05 Ref document number: 1791527 Country of ref document: AT Kind code of ref document: T Effective date: 20250507 |
|
| PG25 | Lapsed in a contracting state [announced via postgrant information from national office to epo] |
Ref country code: BG Free format text: LAPSE BECAUSE OF FAILURE TO SUBMIT A TRANSLATION OF THE DESCRIPTION OR TO PAY THE FEE WITHIN THE PRESCRIBED TIME-LIMIT Effective date: 20250507 |
|
| PG25 | Lapsed in a contracting state [announced via postgrant information from national office to epo] |
Ref country code: HR Free format text: LAPSE BECAUSE OF FAILURE TO SUBMIT A TRANSLATION OF THE DESCRIPTION OR TO PAY THE FEE WITHIN THE PRESCRIBED TIME-LIMIT Effective date: 20250507 |
|
| PG25 | Lapsed in a contracting state [announced via postgrant information from national office to epo] |
Ref country code: AT Free format text: LAPSE BECAUSE OF FAILURE TO SUBMIT A TRANSLATION OF THE DESCRIPTION OR TO PAY THE FEE WITHIN THE PRESCRIBED TIME-LIMIT Effective date: 20250507 |
|
| PG25 | Lapsed in a contracting state [announced via postgrant information from national office to epo] |
Ref country code: RS Free format text: LAPSE BECAUSE OF FAILURE TO SUBMIT A TRANSLATION OF THE DESCRIPTION OR TO PAY THE FEE WITHIN THE PRESCRIBED TIME-LIMIT Effective date: 20250807 |
|
| PG25 | Lapsed in a contracting state [announced via postgrant information from national office to epo] |
Ref country code: IS Free format text: LAPSE BECAUSE OF FAILURE TO SUBMIT A TRANSLATION OF THE DESCRIPTION OR TO PAY THE FEE WITHIN THE PRESCRIBED TIME-LIMIT Effective date: 20250907 |
|
| PG25 | Lapsed in a contracting state [announced via postgrant information from national office to epo] |
Ref country code: LV Free format text: LAPSE BECAUSE OF FAILURE TO SUBMIT A TRANSLATION OF THE DESCRIPTION OR TO PAY THE FEE WITHIN THE PRESCRIBED TIME-LIMIT Effective date: 20250507 |
|
| PG25 | Lapsed in a contracting state [announced via postgrant information from national office to epo] |
Ref country code: SM Free format text: LAPSE BECAUSE OF FAILURE TO SUBMIT A TRANSLATION OF THE DESCRIPTION OR TO PAY THE FEE WITHIN THE PRESCRIBED TIME-LIMIT Effective date: 20250507 Ref country code: DK Free format text: LAPSE BECAUSE OF FAILURE TO SUBMIT A TRANSLATION OF THE DESCRIPTION OR TO PAY THE FEE WITHIN THE PRESCRIBED TIME-LIMIT Effective date: 20250507 |
|
| PG25 | Lapsed in a contracting state [announced via postgrant information from national office to epo] |
Ref country code: CZ Free format text: LAPSE BECAUSE OF FAILURE TO SUBMIT A TRANSLATION OF THE DESCRIPTION OR TO PAY THE FEE WITHIN THE PRESCRIBED TIME-LIMIT Effective date: 20250507 |
|
| PG25 | Lapsed in a contracting state [announced via postgrant information from national office to epo] |
Ref country code: EE Free format text: LAPSE BECAUSE OF FAILURE TO SUBMIT A TRANSLATION OF THE DESCRIPTION OR TO PAY THE FEE WITHIN THE PRESCRIBED TIME-LIMIT Effective date: 20250507 |
|
| PG25 | Lapsed in a contracting state [announced via postgrant information from national office to epo] |
Ref country code: RO Free format text: LAPSE BECAUSE OF FAILURE TO SUBMIT A TRANSLATION OF THE DESCRIPTION OR TO PAY THE FEE WITHIN THE PRESCRIBED TIME-LIMIT Effective date: 20250507 Ref country code: SK Free format text: LAPSE BECAUSE OF FAILURE TO SUBMIT A TRANSLATION OF THE DESCRIPTION OR TO PAY THE FEE WITHIN THE PRESCRIBED TIME-LIMIT Effective date: 20250507 |
|
| PG25 | Lapsed in a contracting state [announced via postgrant information from national office to epo] |
Ref country code: IT Free format text: LAPSE BECAUSE OF FAILURE TO SUBMIT A TRANSLATION OF THE DESCRIPTION OR TO PAY THE FEE WITHIN THE PRESCRIBED TIME-LIMIT Effective date: 20250507 |