EP2963443A1 - Device, method and program for processing signal, underwater detecting device and radar apparatus - Google Patents
Device, method and program for processing signal, underwater detecting device and radar apparatus Download PDFInfo
- Publication number
- EP2963443A1 EP2963443A1 EP15174237.6A EP15174237A EP2963443A1 EP 2963443 A1 EP2963443 A1 EP 2963443A1 EP 15174237 A EP15174237 A EP 15174237A EP 2963443 A1 EP2963443 A1 EP 2963443A1
- Authority
- EP
- European Patent Office
- Prior art keywords
- signal
- echo signal
- sample
- high resolution
- module
- Prior art date
- Legal status (The legal status is an assumption and is not a legal conclusion. Google has not performed a legal analysis and makes no representation as to the accuracy of the status listed.)
- Granted
Links
- 238000012545 processing Methods 0.000 title claims abstract description 22
- 238000000034 method Methods 0.000 title claims description 31
- 230000002194 synthesizing effect Effects 0.000 claims abstract description 95
- 238000001914 filtration Methods 0.000 claims abstract description 61
- 238000001228 spectrum Methods 0.000 claims description 50
- 230000005540 biological transmission Effects 0.000 claims description 42
- XLYOFNOQVPJJNP-UHFFFAOYSA-N water Substances O XLYOFNOQVPJJNP-UHFFFAOYSA-N 0.000 claims description 32
- 230000008569 process Effects 0.000 claims description 9
- 238000005192 partition Methods 0.000 claims description 4
- 230000006835 compression Effects 0.000 claims description 3
- 238000007906 compression Methods 0.000 claims description 3
- 241000251468 Actinopterygii Species 0.000 description 48
- 230000004048 modification Effects 0.000 description 44
- 238000012986 modification Methods 0.000 description 44
- 230000006870 function Effects 0.000 description 23
- 238000010586 diagram Methods 0.000 description 18
- 230000010355 oscillation Effects 0.000 description 11
- 230000001131 transforming effect Effects 0.000 description 7
- 230000002123 temporal effect Effects 0.000 description 6
- 230000005684 electric field Effects 0.000 description 4
- 230000012447 hatching Effects 0.000 description 4
- 230000007547 defect Effects 0.000 description 3
- 230000006866 deterioration Effects 0.000 description 2
- 238000002592 echocardiography Methods 0.000 description 2
- 230000000694 effects Effects 0.000 description 2
- 238000002474 experimental method Methods 0.000 description 2
- 239000000284 extract Substances 0.000 description 2
- 238000003384 imaging method Methods 0.000 description 2
- 238000005305 interferometry Methods 0.000 description 2
- 230000009466 transformation Effects 0.000 description 2
- 230000003044 adaptive effect Effects 0.000 description 1
- 238000004458 analytical method Methods 0.000 description 1
- 230000015572 biosynthetic process Effects 0.000 description 1
- 238000004364 calculation method Methods 0.000 description 1
- 230000015556 catabolic process Effects 0.000 description 1
- 238000004891 communication Methods 0.000 description 1
- 239000012141 concentrate Substances 0.000 description 1
- 230000021615 conjugation Effects 0.000 description 1
- 238000006731 degradation reaction Methods 0.000 description 1
- 230000001419 dependent effect Effects 0.000 description 1
- 238000001514 detection method Methods 0.000 description 1
- 238000002059 diagnostic imaging Methods 0.000 description 1
- 238000009434 installation Methods 0.000 description 1
- 238000003672 processing method Methods 0.000 description 1
- 230000004044 response Effects 0.000 description 1
- 230000000630 rising effect Effects 0.000 description 1
- 238000003786 synthesis reaction Methods 0.000 description 1
- 230000017105 transposition Effects 0.000 description 1
- 230000002792 vascular Effects 0.000 description 1
Images


Classifications
-
- G—PHYSICS
- G01—MEASURING; TESTING
- G01S—RADIO DIRECTION-FINDING; RADIO NAVIGATION; DETERMINING DISTANCE OR VELOCITY BY USE OF RADIO WAVES; LOCATING OR PRESENCE-DETECTING BY USE OF THE REFLECTION OR RERADIATION OF RADIO WAVES; ANALOGOUS ARRANGEMENTS USING OTHER WAVES
- G01S15/00—Systems using the reflection or reradiation of acoustic waves, e.g. sonar systems
- G01S15/02—Systems using the reflection or reradiation of acoustic waves, e.g. sonar systems using reflection of acoustic waves
- G01S15/06—Systems determining the position data of a target
- G01S15/08—Systems for measuring distance only
- G01S15/10—Systems for measuring distance only using transmission of interrupted, pulse-modulated waves
-
- G—PHYSICS
- G01—MEASURING; TESTING
- G01S—RADIO DIRECTION-FINDING; RADIO NAVIGATION; DETERMINING DISTANCE OR VELOCITY BY USE OF RADIO WAVES; LOCATING OR PRESENCE-DETECTING BY USE OF THE REFLECTION OR RERADIATION OF RADIO WAVES; ANALOGOUS ARRANGEMENTS USING OTHER WAVES
- G01S15/00—Systems using the reflection or reradiation of acoustic waves, e.g. sonar systems
- G01S15/88—Sonar systems specially adapted for specific applications
- G01S15/89—Sonar systems specially adapted for specific applications for mapping or imaging
-
- G—PHYSICS
- G01—MEASURING; TESTING
- G01S—RADIO DIRECTION-FINDING; RADIO NAVIGATION; DETERMINING DISTANCE OR VELOCITY BY USE OF RADIO WAVES; LOCATING OR PRESENCE-DETECTING BY USE OF THE REFLECTION OR RERADIATION OF RADIO WAVES; ANALOGOUS ARRANGEMENTS USING OTHER WAVES
- G01S15/00—Systems using the reflection or reradiation of acoustic waves, e.g. sonar systems
- G01S15/88—Sonar systems specially adapted for specific applications
- G01S15/96—Sonar systems specially adapted for specific applications for locating fish
-
- G—PHYSICS
- G01—MEASURING; TESTING
- G01S—RADIO DIRECTION-FINDING; RADIO NAVIGATION; DETERMINING DISTANCE OR VELOCITY BY USE OF RADIO WAVES; LOCATING OR PRESENCE-DETECTING BY USE OF THE REFLECTION OR RERADIATION OF RADIO WAVES; ANALOGOUS ARRANGEMENTS USING OTHER WAVES
- G01S3/00—Direction-finders for determining the direction from which infrasonic, sonic, ultrasonic, or electromagnetic waves, or particle emission, not having a directional significance, are being received
- G01S3/80—Direction-finders for determining the direction from which infrasonic, sonic, ultrasonic, or electromagnetic waves, or particle emission, not having a directional significance, are being received using ultrasonic, sonic or infrasonic waves
- G01S3/8006—Multi-channel systems specially adapted for direction-finding, i.e. having a single aerial system capable of giving simultaneous indications of the directions of different signals
-
- G—PHYSICS
- G01—MEASURING; TESTING
- G01S—RADIO DIRECTION-FINDING; RADIO NAVIGATION; DETERMINING DISTANCE OR VELOCITY BY USE OF RADIO WAVES; LOCATING OR PRESENCE-DETECTING BY USE OF THE REFLECTION OR RERADIATION OF RADIO WAVES; ANALOGOUS ARRANGEMENTS USING OTHER WAVES
- G01S7/00—Details of systems according to groups G01S13/00, G01S15/00, G01S17/00
- G01S7/02—Details of systems according to groups G01S13/00, G01S15/00, G01S17/00 of systems according to group G01S13/00
- G01S7/28—Details of pulse systems
- G01S7/285—Receivers
- G01S7/292—Extracting wanted echo-signals
-
- G—PHYSICS
- G01—MEASURING; TESTING
- G01S—RADIO DIRECTION-FINDING; RADIO NAVIGATION; DETERMINING DISTANCE OR VELOCITY BY USE OF RADIO WAVES; LOCATING OR PRESENCE-DETECTING BY USE OF THE REFLECTION OR RERADIATION OF RADIO WAVES; ANALOGOUS ARRANGEMENTS USING OTHER WAVES
- G01S7/00—Details of systems according to groups G01S13/00, G01S15/00, G01S17/00
- G01S7/52—Details of systems according to groups G01S13/00, G01S15/00, G01S17/00 of systems according to group G01S15/00
- G01S7/523—Details of pulse systems
- G01S7/526—Receivers
- G01S7/527—Extracting wanted echo signals
-
- H—ELECTRICITY
- H04—ELECTRIC COMMUNICATION TECHNIQUE
- H04B—TRANSMISSION
- H04B11/00—Transmission systems employing sonic, ultrasonic or infrasonic waves
-
- G—PHYSICS
- G01—MEASURING; TESTING
- G01S—RADIO DIRECTION-FINDING; RADIO NAVIGATION; DETERMINING DISTANCE OR VELOCITY BY USE OF RADIO WAVES; LOCATING OR PRESENCE-DETECTING BY USE OF THE REFLECTION OR RERADIATION OF RADIO WAVES; ANALOGOUS ARRANGEMENTS USING OTHER WAVES
- G01S13/00—Systems using the reflection or reradiation of radio waves, e.g. radar systems; Analogous systems using reflection or reradiation of waves whose nature or wavelength is irrelevant or unspecified
- G01S13/02—Systems using reflection of radio waves, e.g. primary radar systems; Analogous systems
- G01S13/06—Systems determining position data of a target
- G01S13/08—Systems for measuring distance only
- G01S13/10—Systems for measuring distance only using transmission of interrupted, pulse modulated waves
- G01S13/26—Systems for measuring distance only using transmission of interrupted, pulse modulated waves wherein the transmitted pulses use a frequency- or phase-modulated carrier wave
- G01S13/28—Systems for measuring distance only using transmission of interrupted, pulse modulated waves wherein the transmitted pulses use a frequency- or phase-modulated carrier wave with time compression of received pulses
-
- G—PHYSICS
- G01—MEASURING; TESTING
- G01S—RADIO DIRECTION-FINDING; RADIO NAVIGATION; DETERMINING DISTANCE OR VELOCITY BY USE OF RADIO WAVES; LOCATING OR PRESENCE-DETECTING BY USE OF THE REFLECTION OR RERADIATION OF RADIO WAVES; ANALOGOUS ARRANGEMENTS USING OTHER WAVES
- G01S13/00—Systems using the reflection or reradiation of radio waves, e.g. radar systems; Analogous systems using reflection or reradiation of waves whose nature or wavelength is irrelevant or unspecified
- G01S13/88—Radar or analogous systems specially adapted for specific applications
- G01S13/93—Radar or analogous systems specially adapted for specific applications for anti-collision purposes
- G01S13/937—Radar or analogous systems specially adapted for specific applications for anti-collision purposes of marine craft
-
- G—PHYSICS
- G01—MEASURING; TESTING
- G01S—RADIO DIRECTION-FINDING; RADIO NAVIGATION; DETERMINING DISTANCE OR VELOCITY BY USE OF RADIO WAVES; LOCATING OR PRESENCE-DETECTING BY USE OF THE REFLECTION OR RERADIATION OF RADIO WAVES; ANALOGOUS ARRANGEMENTS USING OTHER WAVES
- G01S7/00—Details of systems according to groups G01S13/00, G01S15/00, G01S17/00
- G01S7/52—Details of systems according to groups G01S13/00, G01S15/00, G01S17/00 of systems according to group G01S15/00
- G01S7/539—Details of systems according to groups G01S13/00, G01S15/00, G01S17/00 of systems according to group G01S15/00 using analysis of echo signal for target characterisation; Target signature; Target cross-section
Definitions
- This disclosure generally relates to a device, method and program for processing signal, an underwater detecting device, and a radar apparatus, in which an intensity spectrum of a reception signal is estimated.
- an azimuth resolution of detecting devices is dependent on a beam width, and the beam width is defined by an aperture length of an antenna.
- the azimuth resolution is defined by the aperture length of the antenna, and the azimuth resolution can be improved by extending the aperture length of the antenna.
- the aperture length of the antenna is extended to improve the azimuth resolution, the size of the radar apparatus will become large. Therefore, it is requested to improve the azimuth resolution without extending the aperture length of the antenna.
- a range resolution (temporal resolution) of radar apparatuses is defined by a frequency bandwidth of the system and can be improved by extending the frequency bandwidth of the system.
- extending the frequency bandwidth of the system is technically difficult and also leads to a cost increase; therefore, it is requested to improve the range resolution without extending the frequency bandwidth.
- JP3160580B discloses an art for improving the azimuth resolution by performing the inverse filtering. Specifically, first, a reception radio wave received by an antenna is converted into a reception electric field signal by a reception circuit, and the electric field signal is Fourier-transformed by a Fourier transformer. Next, the Fourier-transformed electric field signal is divided by a Fourier-transformed antenna pattern. After such inverse filtering, inverse Fourier transform is performed on the electric field signal, and this signal is outputted. By performing the inverse filtering as above, the azimuth resolution can be improved. The range resolution can also be improved in a similar manner.
- the false image is reduced by using the moving average as described above, a part of the echo image where the false image is not generated may also be influenced by the false image.
- the purpose of this disclosure relates to reducing a false image while maintaining a resolution of an echo image component generated based on an echo signal from a target object.
- a signal processor for processing target echo signal includes a filtering module configured to generate a filtered echo signal by extracting echo signal components within a predetermined frequency band from the target echo signal, a high resolution signal generating unit configured to generate a high resolution signal based on the target echo signal, the high resolution signal having higher resolution than the filtered echo signal, and a synthesizing module configured to synthesize the filtered echo signal with the high resolution signal.
- the synthesizing module preferably synthesizes the filtered echo signal with the high resolution signal based on an intensity of the filtered echo signal and an intensity of the high resolution signal.
- the synthesizing module preferably synthesizes the filtered echo signal with the high resolution signal based on an intensity of a first sample sampled from the high resolution signal and an intensity of a second sample sampled from the filtered echo signal, said first and second samples being corresponding samples.
- the synthesizing module preferably synthesizes the filtered echo signal with the high resolution signal by selecting a sample with a lowest intensity between the first and second samples.
- the synthesizing module preferably synthesizes the filtered echo signal with the high resolution signal by adding a value obtained by multiplying the first sample by a first coefficient to a value obtained by multiplying the second sample by a second coefficient.
- the synthesizing module preferably selects one of the first sample and the second sample based on a comparison between the intensities of the first and second samples.
- the target echo signal is preferably generated based on a reflection wave caused by a transmission wave transmitted from a transmitter and reflected on a target object.
- the synthesizing module preferably includes a zone discriminating submodule configured to partition a distance range into a first zone where the intensity of the first sample is the same as or higher than the intensity of the second sample and a second zone where the intensity of the first sample is lower than the intensity of the second sample, said distance range corresponding to a time length from transmission of the transmission wave until reception of the reflection wave by a receiver.
- the synthesizing module preferably selects among a plurality of said first zones the first sample for a first zone having a length smaller than a predetermined threshold.
- the target echo signal is preferably generated based on a reflection wave caused by a transmission wave transmitted from a transmitter and reflected on a target object.
- the synthesizing module preferably includes a zone discriminating submodule configured to partition a distance range into a first zone where the intensity of the first sample is the same as or higher than the intensity of the second sample and a second zone where the intensity of the first sample is lower than the intensity of the second sample, said distance range corresponding to a time length from transmission of the transmission wave until reception of the reflection wave by a receiver.
- the synthesizing module preferably selects among a plurality of said first zones the first sample for a first zone when a first sample with a highest intensity among first samples within said first zone is at a position other than at a boundary of said first zone with the second zone adjacent thereto and when a maximum value among ratios between first and second corresponding samples within said first zone is lower than a predetermined threshold.
- the high resolution signal generating unit preferably includes an inverse filtering module configured to perform inverse filtering of the target echo signal and an intensity spectrum calculating module configured to calculate an intensity spectrum of the inverse-filtered target echo signal.
- the high resolution signal generating unit preferably includes a pulse compressing module configured to perform pulse compression of the target echo signal.
- an underwater detecting device includes a receiver configured to receive a target echo signal to be processed, the target echo signal being caused by an acoustic wave transmitted underwater, the signal processor in any one of the above descriptions, configured to process the target echo signal received by the receiver, and a display unit configured to display a synthesized signal generated by the synthesizing module of the signal processor.
- the signal processor further preferably includes a water bottom detecting module configured to detect a depth position of a water bottom, and a synthesizing range specifying module configured to specify a target range within which the synthesizing module of the signal processor synthesizes the filtered echo signal with the high resolution signal, the target range being a predetermined depth range including the depth position of the water bottom detected by the water bottom detecting module.
- a radar apparatus includes an antenna configured to receive a target echo signal to be processed, the signal processor in any one of the above descriptions, configured to process the target echo signal received by the antenna, and a display unit configured to display a synthesized signal generated by the synthesizing module of the signal processor.
- a method of processing target echo signal includes generating a filtered echo signal by extracting echo signal components within a predetermined frequency band from the target echo signal, generating a high resolution signal based on the target echo signal, the high resolution signal having higher resolution than the filtered echo signal, and synthesizing the filtered echo signal with the high resolution signal.
- computer readable media configured to store a computer executable program in a non-transitory manner, which upon execution by a processor of a computer causes the computer to process target echo signal.
- Processing the target echo signal includes causing a computer to generate a filtered echo signal by extracting echo signal components within a predetermined frequency band from the target echo signal, causing a computer to generate a high resolution signal based on the target echo signal, the high resolution signal having higher resolution than the filtered echo signal, and causing a computer to synthesize the filtered echo signal with the high resolution signal.
- the false image can be reduced, while maintaining the resolution of the echo image component generated based on the echo signal from the target object.
- FIG. 1 is a block diagram illustrating a configuration of an underwater detecting device 1 according to this embodiment of this disclosure.
- the underwater detecting device 1 includes a transducer 2, a transceiver 3, a signal processor 10, and a user-interface display unit 4 (display unit).
- the underwater detecting device 1 is installed in a ship (hereinafter, may be referred to as "the ship concerned” or simply as “the ship"), such as a fishing boat, and mainly used for detecting a target object (e.g., a single fish or a school of fish).
- the transducer 2 functions as both a transmitter configured to transmit an ultrasonic wave (transmission wave) and a receiver configured to receive an ultrasonic wave (reception wave).
- the transducer 2 converts an electric signal (transmission signal) into the transmission wave, transmits the transmission wave underwater at every predetermined timing, and converts the reception waves into electric signals (reception signals).
- the transceiver 3 includes a transmission and reception switch 5, a transmission unit 6, and a reception unit 7.
- the transmission and reception switch 5 switches the connection in the transceiver 3 such that each transmission signal is transmitted by the transmission unit 6 to the transducer 2.
- the transmission and reception switch 5 switches the connection in the transceiver 3 such that each electric signal converted from the reception wave by the transducer 2 is transmitted from the transducer 2 to the reception unit 7.
- the transmission unit 6 outputs the transmission signal generated based on a condition set by the user-interface display unit 4, to the transducer 2 via the transmission and reception switch 5.
- the reception unit 7 amplifies the signal received by the transducer 2 and A/D converts it into a digital signal (reception data). Then, the reception unit 7 outputs the digitally converted reception data (target echo signal) to the signal processor 10.
- the signal processor 10 processes the reception data outputted by the reception unit 7 and performs processing for generating an image signal of the target object.
- the configuration of the signal processor 10 is described later in detail.
- the user-interface display unit 4 displays on a display screen an image corresponding to the image signal outputted by the signal processor 10. An operator can estimate a situation of an underwater area below the ship (e.g., whether a single fish and/or a school of fish exist therein) by looking at the display screen. Moreover, the user-interface display unit 4 has an input unit with various input keys, etc... so that various settings or various parameters required for the transmission and reception of the ultrasonic wave, the signal processing or the image display can be inputted therethrough.
- Fig. 2 is a block diagram illustrating the configuration of the signal processor 10.
- the signal processor 10 includes an inverse filtering module 11, an intensity spectrum calculating module 15, a band-pass filtering module 20 (filtering module), a synthesizing module 21, and an image generating module 22.
- the signal processor 10 is constituted with devices including for example a CPU, an FPGA, and a memory (not illustrated).
- the CPU reads a signal processing program from a memory and executes it to perform the functions of the inverse filtering module 11, the intensity spectrum calculating module 15, the band-pass filtering module 20, the synthesizing module 21, and the image generating module 22.
- the signal processing program causes the signal processor 10 to implement a signal processing method of one embodiment of this disclosure.
- the program may be installed from outside. Such a program acquired by installation is stored in a storage medium so as to be distributed.
- the hardware and software described above are configured to operate in cooperation with each other.
- the signal processor 10 can function as the inverse filtering module 11, the intensity spectrum calculating module 15, the band-pass filtering module 20, the synthesizing module 21, and the image generating module 22.
- the inverse filtering module 11 performs inverse filtering so as to remove influence of an instrumental function of the transducer 2 from the reception data. As illustrated in Fig. 2 , the inverse filtering module 11 includes a Fourier transforming submodule 12, an instrumental function output submodule 13, and a dividing submodule 14.
- the Fourier transforming submodule 12 performs Fourier transform on the reception data outputted by the reception unit 7 and outputs it to the dividing submodule 14.
- T indicates transposition. Note that, if a so-called zero padding is performed in the Fourier transform, the number of elements in the complex vector Y becomes larger than M; however, the number of elements in the complex vector Y of this embodiment is M which is the same as the number of the samples of reception data in the time direction.
- the instrumental function output submodule 13 Fourier-transforms the instrumental function of the transducer 2.
- the instrumental function of the transducer 2 of this embodiment is a predetermined function determined based on the pulse wave transmitted by the transducer 2, and one example of the instrumental function is impulse response. This instrumental function is measured or modeled, and is stored in a memory, for example.
- the number of elements in the output of the Fourier transforming submodule 12 is the same as that of the instrumental function output submodule 13.
- the result obtained by Fourier-transforming the instrumental function may be, for example, stored in a memory to be suitably read by the instrumental function output submodule 13.
- the above processing is the inverse filtering, and by this inverse filtering, the influence of the instrumental function can be removed from the reception data.
- the intensity spectrum calculating module 15 processes the complex vector X (a signal corresponding to the reception data from which the influence of the instrumental function is already removed) outputted by the inverse filtering module 11, so as to calculate an intensity spectrum P(t) in every ping. Each intensity spectrum P(t) is outputted to the synthesizing module 21. Examples of the method of calculating the intensity spectrum P(t) include inverse Fourier transform and known methods referred to as the super-resolution methods (e.g., Capon method, MUSIC method and Prony method). Thus, the intensity spectrum calculating module 15 calculates in each ping a high resolution signal having high resolution in the time direction.
- the inverse filtering module 11 and the intensity spectrum calculating module 15 described above are provided as a high resolution signal generating unit 16 configured to generate the high resolution signal of which temporal resolution is higher than that of a filtered echo signal generated by the band-pass filtering module 20 (described later). Moreover, the intensity spectrum P(t) which is calculated by the intensity spectrum calculating module 15 is calculated as the high resolution signal.
- the band-pass filtering module 20 extracts reception data in a predetermined frequency band, from the reception data outputted by the reception unit 7.
- the reception data extracted by the band-pass filtering module 20 is outputted to the synthesizing module 21 as the filtered echo signal.
- the filtering module configured to extract the reception data in the predetermined frequency band from all the reception data is configured as the band-pass filtering module; however, without limiting to this, other filtering module (e.g., a low-pass filtering module) may be adopted.
- the synthesizing module 21 synthesizes each sample constituting the intensity spectrum P(t) (hereinafter, referred to as the first sample) with one of the samples of the filtered echo signal corresponding to the first sample (hereinafter, the sample corresponding to the first sample is referred to as the second sample). Specifically, the synthesizing module 21 compares the first sample of the intensity spectrum P(t) with the second sample at the same depth position and in the same ping as the first sample. If the intensity of the first sample is lower than that of the second sample, the synthesizing module 21 selects the first sample and outputs it to the image generating module 22 as the output sample. On the other hand, if the intensity of the first sample is the same as or higher than that of the second sample, the synthesizing module 21 selects the second sample and outputs it to the image generating module 22 as the output sample.
- Fig. 3 is a view illustrating an example of an echo image displayed on the user-interface display unit 4.
- the image generating module 22 generates the echo image based on the output samples outputted by the synthesizing module 21.
- up/down direction corresponds to water depth
- left/right direction indicates pings each corresponding to the transmission time point of the pulse wave transmitted from the transducer 2 at every predetermined timing.
- the image generating module 22 displays at each pixel in the depth-ping coordinate each output sample in a color tone corresponding to the intensity of the output sample.
- the color tone is gradually changed in the order of red, orange, yellow, green, blue, and dark blue, as the intensity of the output sample is lower. Note that in Fig. 3 , for the sake of convenience, the color tone for higher intensity is illustrated as finer hatching and the color tone for lower intensity is illustrated as rougher hatching.
- a section extending in the left/right direction and illustrated as the finest hatching in the upper half of the echo image is a so-called oscillation line, indicating a position of the transducer 2 installed to the bottom of the ship.
- a section extending in the left/right direction and illustrated as the finest hatching in the lower half of the echo image is a so-called water bottom line, indicating the bottom of water.
- the two bow-shaped echo image components located slightly above the water bottom line can be estimated as caused by two single fishes.
- Fig. 4 is a flowchart for describing the operation of the signal processor 10. The operation of the signal processor 10 described above is described with reference to Fig. 4 .
- the inverse filtering module 11 performs the inverse filtering on the target echo signal outputted from the transducer 2 at each ping, with respect to target echo signal along the time direction (water depth direction). Specifically, the Fourier transforming submodule 12 Fourier-transforms the target echo signal in terms of time t, and outputs the transformation result to the dividing submodule 14. Meanwhile, the instrumental function output submodule 13 Fourier-transforms the instrumental function in terms of time t, and outputs the transformation result to the dividing submodule 14.
- the intensity spectrum calculating module 15 processes the complex vector X outputted from the inverse filtering module 11, so as to calculate the intensity spectrum P(t) for every ping.
- the band-pass filtering module 20 extracts, as the filtered echo signal, the echo signal in the predetermined frequency band from the target echo signal outputted by the transducer 2.
- Fig. 5 is a chart illustrating the intensity spectrum P(t) in a certain ping t 1 (see Fig. 8 ).
- Fig. 6 is a chart illustrating an echo intensity signal based on the filtered echo signal in the same ping t 1 .
- the first and second samples P1 n and P2 n at the corresponding position are compared with each other.
- the synthesizing module 21 selects the first sample P1 n (S6) and outputs it to the image generating module 22 as the output sample.
- the synthesizing module 21 selects the second sample P2 n (S7) and outputs it to the image generating module 22 as the output sample.
- the synthesizing module 21 selects the first sample P1 1 , and between the first and second samples P1 2 and P2 2 , the synthesizing module 21 selects the second sample P2 2 .
- the synthesizing module 21 performs this comparison for all the samples of the intensity spectrum P(t) of each ping.
- the comparison result is the echo signal as illustrated in Fig. 7 .
- the image generating module 22 generates the echo image based on the output samples outputted from the synthesizing module 21.
- One example of the echo image is illustrated in Fig. 3 as described above.
- the echo image generated by the underwater detecting device 1 will be described.
- the first echo image a case where the echo image is generated by only using the first samples described above
- the second echo image a case where the echo image is generated by only using the second samples described above
- Fig. 8 is a view illustrating one example of the first echo image
- Fig. 9 is a view illustrating one example of the second echo image.
- the first echo image illustrated in Fig. 8 echo image components A 1 resolved by high resolution are displayed. Therefore, in the example of Fig. 8 , it can be estimated that the echo image components A 1 are caused by two single fishes.
- an echo image component B false image
- the first echo image an echo image component B (false image) which does not actually exist is generated as noise near the water bottom, which causes confusion to the operator. Additionally, if a single fish or a school of fish exists near the water bottom, it may overlap with the false image and the single fish or the school of fish may be lost.
- the cause of the false image is mismatch in the waveform between the instrumental function and the echo signal. Due to this mismatch, a pure sine wave cannot be obtained from the output result of the dividing submodule 14, and a sharply rising echo signal corresponding to the water bottom cannot be obtained from the intensity spectrum calculated by the intensity spectrum calculating module 15. This undulating portion is displayed as the false image.
- the second echo image illustrated in Fig. 9 different from the first echo image illustrated in Fig. 8 , the false image is not generated near the water bottom. Therefore, a single fish or a school of fish near the water bottom is easily distinguished.
- the echo image components which are resolved by high resolution in the first echo image described above are displayed in a blurry way as echo image components A 2 . Thus, whether the echo image components A 2 are caused by a single fish or caused by a school of fish formed by a plurality of small-sized single fishes cannot be determined.
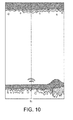
- Fig. 10 is one example of the echo image generated by the underwater detecting device 1.
- the sample with the lowest intensity between the first and second samples corresponding to each other in terms of position is selected, and the selected sample is used as the output sample.
- the false image near the water bottom in the first echo image illustrated in Fig. 8 echo image generated only by the first samples
- the target objects e.g., the single fishes and/or the school of fish
- the intensity spectrum P(t) calculated by the intensity spectrum calculating module 15 is synthesized with the filtered echo signal generated by the band-pass filtering module 20.
- the false image B (see Fig. 8 ) which is generated near the water bottom can be reduced while maintaining the high resolution of the echo image components of the target objects.
- the false image can be reduced while maintaining the resolution of the echo image components caused by the echo signals from the target objects.
- the intensity spectrum P(t) is synthesized with the filtered echo signal based on the intensity of the intensity spectrum P(t) and the intensity of the filtered echo signal.
- the intensity spectrum P(t) can suitably be synthesized with the filtered echo signal.
- the intensity spectrum P(t) is synthesized with the filtered echo signal based on each of the first samples constituting the intensity spectrum P(t) and the second samples, corresponding to the respective first samples, constituting the filtered echo signal.
- the intensity spectrum P(t) can suitably be synthesized with the filtered echo signal for each sample.
- the echo image is generated as the information regarding the echo signal.
- the information regarding the echo signal can suitably be recognized by the operator as image information.
- the sample with the lowest intensity between the first and second samples is generated as the output sample.
- the false image B generated near the water bottom can be removed without degradation of the resolution of the echo image component.
- the high resolution signal with higher temporal resolution than the filtered echo signal generated by the band-pass filtering module 20 can suitably be generated by the inverse filtering module 11 and the intensity spectrum calculating module 15.
- the underwater detecting device including the signal processor 10 which can reduce the false image while maintaining the resolution of the echo image component as described above can be provided. Furthermore, with the underwater detecting device 1, the echo image generated as described above can be displayed on the user-interface display unit 4. Therefore, the information regarding the echo signal can suitably be recognized by the operator as image information.
- Fig. 11 is a block diagram illustrating a configuration of a signal processor 10a of the underwater detecting device according to a first modification.
- the signal processor 10a of the first modification has a synthesizing module 23 with a significantly different configuration from the synthesizing module of the signal processor 10 of the above embodiment.
- the configuration of the synthesizing module 23 is mainly described, and the description of other parts is omitted.
- the synthesizing module 23 of this modification weights the first and second samples. Further, the weighted first and second samples are added and synthesized with each other, so as to generate the output sample.
- the synthesizing module 23 includes a first coefficient multiplying submodule 23a, a second coefficient multiplying submodule 23b, and an adding submodule 23c.
- the first coefficient multiplying submodule 23a multiplies each of the first samples of the intensity spectrum P(t) calculated by the intensity spectrum calculating module 15 by a first coefficient.
- the second coefficient multiplying submodule 23b multiplies each of the second samples outputted from the band-pass filtering module 20 by a second coefficient.
- the adding submodule 23c generates the output sample by adding the first sample multiplied by the first coefficient to the second sample multiplied by the second coefficient.
- the image generating module 22 generates the echo image based on the output sample. Also by generating the echo image in the above manner, the false image which is caused near the water bottom can be reduced while maintaining the resolution of the echo image components caused by the target objects. Note that, the first and second coefficients described above are set to values whose sum equals 1.
- Fig. 12 is a block diagram illustrating a configuration of a signal processor 10b of the underwater detecting device according to a second modification.
- the signal processor 10b of this modification selects, as the output sample, the sample with the lowest intensity between the first and second samples, as in the above embodiment.
- the signal processor 10b selects the first sample as the output sample.
- the signal processor 10b of this modification includes an oscillation line position detecting module 24, a water bottom detecting module 25, and a comparison range specifying module 26 (synthesizing range specifying module) in addition to the components provided to the signal processor 10 of the above embodiment (e.g., the inverse filtering module 11 and the intensity spectrum calculating module 15).
- the oscillation line position detecting module 24 detects the position of the oscillation line based on the output results from the intensity spectrum calculating module 15, the band-pass filtering module 20 and the like. Note that, the oscillation line indicates the position of the transducer 2, and depending for example on a frequency of the ultrasonic wave transmitted from the transducer 2, a width of the oscillating line changes.
- the water bottom detecting module 25 detects the depth position of the water bottom based on the output results from the intensity spectrum calculating module 15, the band-pass filtering module 20 and the like.
- the comparison range specifying module 26 specifies depth ranges (comparison ranges) within which the two samples (first and second samples) are compared by a synthesizing module 21a, based on the position of the oscillation line detected by the oscillation line position detecting module 24 and the depth position of the water bottom detected by the water bottom detecting module 25. Specifically, the comparison range specifying module 26 specifies the comparison ranges to be a predetermined depth range including the position of the oscillation line and a predetermined depth range including the depth position of the water bottom, respectively.
- the synthesizing module 21a operates differently from the synthesizing module 21 of the above embodiment. Specifically, within the comparison ranges, similar to the above embodiment, the synthesizing module 21a compares the first and second samples with each other and selects the sample with the lowest intensity as the output sample. On the other hand, for the first and second samples outside the comparison ranges, the synthesizing module 21a selects the first sample as the output sample without performing the above comparison.
- the false image is easily caused within a range near the water bottom or near the oscillation line of the image generated based on the first samples.
- the false image is not easily caused other than near the water bottom or near the oscillation line. Therefore, as this modification, within the ranges where the false image is easily caused (comparison ranges), by comparing the first sample with the second sample and selecting the sample with the lowest intensity, the false image can be reduced.
- comparison ranges by selecting the first sample as the output sample, a calculation load in signal processing performed by the signal processor 10b can be reduced.
- the example of applying the signal processor 10 to the underwater detecting device 1 is described; however, without limiting to this, the signal processor may be applied to a radar apparatus.
- Fig. 13 is a block diagram illustrating a configuration of a radar apparatus 1a according to a second embodiment.
- the radar apparatus 1a includes an antenna unit 30, a signal processor 10c, and a user-interface display unit 4.
- the radar apparatus 1a is a ship radar provided to a ship (e.g., fishing boat) and is used for mainly detecting a target object (e.g., another ship).
- the antenna unit 30 includes an antenna 31, a transmission and reception switch 32, a transmission unit 33, and a reception unit 34.
- the antenna 31 transmits a pulse-shaped radio wave having a directivity and receives an echo (reflection wave) from the target object.
- the radar apparatus 1a can acquire a distance r from the radar apparatus 1a to the target object by measuring a time length from the transmission of the pulse-shaped radio wave until the reception of the echo by the antenna 31.
- the antenna 31 is rotatable by 360 degrees on the horizontal plane, and repeats the transmission and reception of the radio wave while changing the transmission direction of the pulse-shaped radio wave (changing an antenna angle ⁇ ).
- the antenna 31 can detect the target object over 360 degrees on the plane around the ship. Examples of the antenna 31 include a slot array antenna, a patch antenna, and a parabola antenna.
- the transmission and reception switch 32 switches the connection in the antenna unit 30 such that the transmission signal is transmitted from the transmission unit 33 to the antenna 31.
- the transmission and reception switch 32 switches the connection in the antenna unit 30 such that the echo received by the antenna 31 is transmitted from the antenna 31 to the reception unit 34.
- the transmission unit 33 has, for example, a D/A converter, a frequency converter, and an electric amplifier (all not illustrated) to create microwave oscillation.
- the transmission unit 33 generates a radar transmission signal and outputs it to the antenna 31.
- the reception unit 34 amplifies the signal received by the antenna 31 and A/D converts the amplified reception signal. Then, the reception unit 34 outputs the digitally converted reception data (target echo signal) to the signal processor 10c.
- Fig. 14 is a block diagram illustrating a configuration of the signal processor 10c of the radar apparatus 1a in Fig. 13 .
- the signal processor 10c generates an echo image by processing the reception data outputted from the antenna unit 30 similarly to the case of the signal processor 10 of the underwater detecting device 1 described above.
- the echo image generated as described above is displayed on the user-interface display unit 4, as the information regarding the echo signal.
- the inverse filtering module 11 is not limited to perform the processing described in the above embodiments, as long as the influence of the instrumental function of the transducer 2 can be removed.
- the inverse filtering module 11 performs Wiener filtering.
- the complex vector X may be obtained based on the following Equation 1 by the dividing submodule 14 and outputted to the intensity spectrum calculating module 15.
- the high resolution signal is generated by the inverse filtering module 11 and the intensity spectrum calculating module 15; however, it is not limited to this. Specifically, in a fourth modification described below, the high resolution signal is generated by so-called pulse compression.
- Fig. 15 is a block diagram illustrating a configuration of a signal processor 10d of the underwater detecting device of the fourth modification.
- a high resolution signal generating unit 16a may be configured with a pulse compressing module 17.
- the transducer transmits a chirp signal of which frequency changes linearly with time, at every predetermined timing for a predetermined period of time.
- the pulse compressing module 17 has a matched filtering submodule 18.
- the matched filtering submodule 18 pulse-compresses the reception signal by correlating the signal received by the transducer 2 with a reference signal predetermined based on the transmission signal (chirp signal).
- the high resolution signal with high temporal resolution can be generated.
- the synthesizing module 21 synthesizes the filtered echo signal extracted by the band-pass filtering module 20 with the signal generated by the pulse compressing module 17, similar to the above embodiment.
- the echo image component B (false image) as illustrated in Fig. 8 is caused similarly to the above embodiment.
- the synthesizing module 21 Similar to the above embodiment, the false image can be reduced while maintaining the resolution of the echo image caused by the echo signal from the target object.
- Fig. 16 is a block diagram illustrating a configuration of a signal processor 10e according a fifth modification. As illustrated in Fig. 16 , this disclosure is applicable to a signal processor which does not include a transducer or a user-interface display unit, different from the case of the underwater detecting device 1 of the above embodiment. Moreover, a high resolution signal generating unit 16b of the signal processor 10e may have the inverse filtering module 11 and the intensity spectrum calculating module 15 described above, or may be configured with the pulse compressing module 17. Further, without limiting to these, the high resolution signal generating unit 16b may have any configuration as long as it can generate a signal with higher temporal resolution than the filtered echo signal generated by the band-pass filtering module 20.
- Fig. 17A is a view for describing the signal processing performed by the signal processor of the above embodiments
- Fig. 17B is a view for describing signal processing performed by a signal processor according to a sixth modification.
- the intensity spectrum is calculated for every azimuth (i.e., every ping).
- the high resolution signal resolved by high resolution in the time direction (distance direction) is calculated.
- the false image caused due to the high resolution signal with high temporal resolution can be reduced.
- a low-pass filtering module moving average filtering module
- an order-statistic filtering module to reduce spike-like noise caused by interference signal from a radar of another ship
- the filtering module may be used as the filtering module.
- the inverse filtering module and the intensity spectrum calculating module may be used similar to the above embodiments, or a matched filtering module may be used.
- Fig. 18 is a block diagram illustrating a configuration of a synthesizing module 27 of the underwater detecting device according to a seventh modification.
- Fig. 19 is a flowchart for describing operation of the signal processor of the underwater detecting device according to the seventh modification.
- the signal processor of this modification is different in the configuration and operation of the synthesizing module compared to the signal processor of the above embodiment.
- the synthesizing module 27 of the underwater detecting device of this modification includes a zone discriminating submodule 27a and three determining submodules (a first determining submodule 27b, a second determining submodule 27c, and a third determining submodule 27d).
- the synthesizing module 27 selects one of the first and second samples by comparing the intensity of the first sample with the intensity of the second sample corresponding to the first sample.
- Fig. 20 is a chart for describing first zones R1 m and second zones R2 p which are defined by the zone discriminating submodule 27a.
- the zone discriminating submodule 27a compares the first sample P1 n of the high resolution signal with the second sample P2 n which is at the same depth position and in the same ping as the first sample P1 n . Then, as illustrated in Fig.
- the first determining submodule 27b determines whether a value of a depth range width ⁇ D m (distance range) of each first zone R1 m is lower than a predetermined threshold Thr1.
- the threshold Thr1 is set to a suitable value based on experiments conducted in advance, for example.
- the synthesizing module 27 outputs the first sample P1 n as the output sample to the image generating module 22.
- the determination of the sample (between the first and second samples P1 n and P2 n ) to be outputted as the output sample to the image generating module 22 is passed on to determination performed by the second determining submodule 27c or determination thereafter.
- the second determining submodule 27c performs the following determination within each zone R1 m where the value of the depth range width ⁇ D m is determined to be the threshold Thr1 or higher by the first determining submodule 27b. Specifically, the second determining submodule 27c determines whether the first sample P1 n with the highest intensity within the first zone R1 m as described above is on a boundary with the second zone R2 p adjacent to the first zone R1 m . Within the first zone R1 m , if the first sample P1 n with the highest intensity is on the boundary of this first zone R1 m , the synthesizing module 27 outputs the second sample P2 n as the output sample to the image generating module 22.
- the determination of the sample (between the first and second samples P1 n and P2 n ) to be outputted as the output sample to the image generating module 22 is passed on to determination performed by the third determining submodule 27d.
- the third determining submodule 27d performs the following determination within each zone R1 m where the first sample P1 n with the highest intensity is determined to be not on the boundary described above by the second determining submodule 27c. Specifically, the third determining submodule 27d determines whether a maximum value among ratios between the intensities of the first and second samples P1 n and P2 n at the same depth position as each other (more specifically, the ratio of the intensity of P1 n with respect to the intensity of P2 n ) exceeds a predetermined threshold Thr2.
- the threshold Thr2 is set to a suitable value based on experiments conducted in advance, for example.
- the synthesizing module 27 outputs the second sample P2 n as the output sample to the image generating module 22.
- the synthesizing module 27 outputs the first sample P1 n as the output sample to the image generating module 22. Note that in this modification, the intensity of each sample is expressed on a linear scale.
- the third determining submodule 27d determines whether the maximum value among differences between the intensities of the first and second samples P1 n and P2 n at the same depth position as each other (more specifically, values obtained by subtracting the intensity of P1 n by the intensity of P2 n ) exceeds the predetermined threshold Thr2.
- the intensity spectrum calculating module 15 and the like calculate the intensity spectrum P(t), in other words the high resolution signal, in every ping by operating similar to the above embodiment.
- the band-pass filtering module 20 generates the filtered echo signal by operating similar to the above embodiment.
- the synthesizing module 27 compares the first sample P1 n with the second sample P2 n .
- the zone discriminating submodule 27a discriminates between the first and second zones R1 m and R2 p , and as illustrated in Fig. 20 , the entire range of each of the high resolution signal and the filtered echo signal in the depth direction is divided into the first and second zones R1 m and R2 p . Further, within the second zone R2 p , the synthesizing module 27 selects the first sample P1 n (S11) and outputs it as the output sample to the image generating module 22.
- the first determining submodule 27b compares the value of depth range width ⁇ D m of each first zone R1 m with the threshold Thr1 to determine whether the value of depth range width ⁇ D m is lower than the threshold Thr1 for all the first zones R1 m . If the value of depth range width ⁇ D m is lower than the threshold Thr1 (S12: YES), the synthesizing module 27 selects the first sample P1 n within the first zone R1 m (S13) and outputs it as the output sample to the image generating module 22. In the example of Fig.
- the synthesizing module 27 selects the first sample as the output sample within the first zones R1 4 , R1 5 , R1 6 and R1 7 .
- the value of the depth range width ⁇ D m is the threshold Thr1 or higher (S12: NO)
- the procedure proceeds to S14.
- the second determining submodule 27c determines whether the first sample P1 n with the highest intensity within the corresponding first zone R1 m is on the boundary of the first zone R1 m . If the first sample P1 n with the highest intensity is on the boundary of the first zone R1 m (S14: YES), the synthesizing module 27 selects the second sample P2 n within the corresponding first zone R1 m (S15) and outputs it as the output sample to the image generating module 22. In the example of Fig.
- the synthesizing module 27 selects the second sample as the output sample within the first zones R1 1 , R1 2 and R1 8 .
- the first sample P1 n with the highest intensity is not on the boundary of the first zone R1 m (S14: NO)
- the procedure proceeds to S16.
- the third determining submodule 27d performs the following determination within each zone R1 m where the first sample P1 n with the highest intensity is determined to be not on the boundary of the first zone R1 m by the second determining submodule 27c. Specifically, at S16, the third determining submodule 27d determines whether the maximum value among the ratios between the intensities of the first and second samples P1 n and P2 n at the same depth position as each other exceeds the predetermined threshold Thr2. If the maximum value exceeds the threshold Thr2 (S16: YES), the synthesizing module 27 selects the second sample P2 n within the corresponding first zone R1 m (S17) and outputs it as the output sample to the image generating module 22.
- the synthesizing module 27 selects the first sample P1 n within the first zone R1 m (S18) and outputs it as the output sample to the image generating module 22. In the example of Fig. 20 , the synthesizing module 27 selects the first sample as the output sample within the first zone R1 3 .
- the image generating module 22 generates the echo image based on the output sample outputted from the synthesizing module 27.
- each of these echo images indicates an example where a plurality of single fishes existing in a comparatively dense condition are displayed.
- Fig. 21 is a view illustrating one example of the first echo image in a state where single fishes exist in a dense condition.
- Fig. 22 is a view illustrating one example of the second echo image in a state where single fishes exist in a dense condition.
- Fig. 23 is a view illustrating one example of the echo image generated by the underwater detecting device in Fig. 1 , in a state where single fishes exist in a dense condition.
- the first echo image even in the state where single fishes exist underwater in a dense condition, as illustrated in Fig. 21 , echo image components of the respective single fishes resolved by high resolution are displayed.
- the second echo image in the state where single fishes exist underwater in a dense condition, as illustrated in Fig. 22 , echoes of single fishes close to each other interfere to cancel or enhance each other.
- the echo image generated based on the output samples synthesized by the synthesizing module 21 of the underwater detecting device 1 of the above embodiment as illustrated in Fig. 23 , the echo image components of the single fishes which are resolved by high resolution (see Fig. 21 ) are partially removed, causing severe deterioration in the visibility of the echo image components.
- Fig. 25 is a chart in which the echo signal generated based on the output samples by the synthesizing module 21 of the underwater detecting device 1 of the above embodiment in a certain ping is superimposed on the high resolution signal and the filtered echo signal in Fig. 20 .
- Fig. 26 is a chart in which the echo signal generated based on the output samples by the synthesizing module 27 of the underwater detecting device of this modification in a certain ping is superimposed on the high resolution signal and the filtered echo signal in Fig. 20 .
- the underwater detecting device 1 of the above embodiment since the sample with lower echo intensity between the first and second samples is selected (waveform indicated by the thick line in Fig. 25 ), for example, when a plurality of single fishes exist in a dense condition, the following situation may occur. Specifically, in a part of the filtered echo signal generated based on the second samples corresponding to a depth range where the single fishes are densely concentrated (a range from R1 3 to about R1 7 in Fig. 25 ), the echo intensity of the echo signal may be lower than parts of the high resolution signal generated based on the first samples and caused by single fishes, respectively (R1 3 , R1 4 , R1 5 , R1 6 and R1 7 in Fig. 25 ). Thus, with the underwater detecting device 1, sharp peaks caused by single fishes are clipped as illustrated in Fig. 25 .
- one of the corresponding first and second samples is selected based on the comparison of the intensity of the first sample with the intensity of the second sample.
- the first sample is selected in each zone where the depth range width ⁇ D m is comparatively narrow among the plurality of first zones (zones where the intensity of the first sample is higher than that of the second sample).
- the depth range width ⁇ D m of the first zone tends to become narrow.
- the processings at S 14 and S16 described above are performed by the synthesizing module 27 of this modification. Specifically, among the plurality of first zones, the first sample is selected within each first zone within which the first sample with the highest intensity is not on the boundary with the second zone adjacent thereto and the maximum value among the ratios between the intensities of the corresponding first and second samples is the threshold Thr2 or lower.
- the first sample with the highest intensity is not on the boundary described above, there is a possibility that a peak caused by a single fish exists within the first zone including the first sample. Therefore, such first zones become target zones where the first sample may be selected. Further, the first sample is selected within each first zone where the maximum value among the ratios between the intensities of the first and second samples is the threshold Thr2 or lower among these target zones. Within a range where a plurality of single fishes densely concentrate, although the echoes caused by the plurality of single fishes interfere to cancel or enhance each other, the influence thereof is about twice the level of the echo intensity caused by each single fish at most.
- the first sample when the ratio between the intensities of the first and second samples is extremely large, the first sample can be considered as not corresponding to the echo caused by the single fish. Therefore, by selecting the first sample within each first zone where the maximum value among the ratios between the intensities of the first and second samples is the threshold Thr2 or lower among the target zones described above, among the peaks caused by the single fishes, it can be avoided that a peak (e.g., the high resolution signal within the first zone R1 3 in Fig. 26 ) that is not significantly sharp is clipped.
- a peak e.g., the high resolution signal within the first zone R1 3 in Fig. 26
- the underwater detecting device 1 of the above embodiment when the single fishes exist in a dense condition, the peaks of the single fishes resolved by high resolution are clipped, causing deterioration in the visibility thereof in the echo image (see Figs. 23 and 25 ).
- the underwater detecting device of this modification the peaks of the single fishes resolved by high resolution are displayed in the echo image without defect (see Figs. 24 and 26 ). Therefore, with the underwater detecting device of this modification, even in the state where the target objects exist in a dense condition, the high resolution of the target objects can be maintained and, similar to the above embodiment, the false image which is caused near the water bottom can be reduced.
- the processings from S 14 to S18 in Fig. 19 may be omitted.
- the echo signal caused by the target objects although the echo having a peak in a wide depth range width is clipped, the echo having a peak in a narrow depth range width can, similar to the case described above, be avoided from being clipped.
- S12 and S13 in Fig. 19 may be omitted in this modification.
- the example of applying the signal processor to the underwater detecting device is described; however, without limiting to this, it is also applicable to a radar, a sonar, etc.
Landscapes
- Engineering & Computer Science (AREA)
- Radar, Positioning & Navigation (AREA)
- Remote Sensing (AREA)
- Physics & Mathematics (AREA)
- General Physics & Mathematics (AREA)
- Computer Networks & Wireless Communication (AREA)
- Acoustics & Sound (AREA)
- Signal Processing (AREA)
- Measurement Of Velocity Or Position Using Acoustic Or Ultrasonic Waves (AREA)
- Radar Systems Or Details Thereof (AREA)
Abstract
Description
- This disclosure generally relates to a device, method and program for processing signal, an underwater detecting device, and a radar apparatus, in which an intensity spectrum of a reception signal is estimated.
- Generally, an azimuth resolution of detecting devices (e.g., radar apparatuses) is dependent on a beam width, and the beam width is defined by an aperture length of an antenna. Specifically, the azimuth resolution is defined by the aperture length of the antenna, and the azimuth resolution can be improved by extending the aperture length of the antenna. However, if the aperture length of the antenna is extended to improve the azimuth resolution, the size of the radar apparatus will become large. Therefore, it is requested to improve the azimuth resolution without extending the aperture length of the antenna. Also a range resolution (temporal resolution) of radar apparatuses is defined by a frequency bandwidth of the system and can be improved by extending the frequency bandwidth of the system. However, extending the frequency bandwidth of the system is technically difficult and also leads to a cost increase; therefore, it is requested to improve the range resolution without extending the frequency bandwidth.
- To improve the azimuth resolution without extending the aperture length of the antenna and improve the range resolution without extending the frequency bandwidth, a method is known to perform inverse filtering on a reception signal. For example,
JP3160580B - Moreover, as the processing performed after the inverse filtering, other methods using so-called super-resolution methods, such as the Capon method, the MUSIC method and the Prony method, are also proposed instead of the inverse Fourier transform, so as to improve the azimuth resolution or the range resolution even more (see
JP3032186B JP2010-183979A JP3160581B Chapter 13 of "Adaptive Signal Processing by Array Antenna" by Nobuyoshi Kikuma published by Kagaku Gijutsu Shuppan (2004 - Furthermore, "High Range Resolution Ultrasonographic Vascular Imaging Using Frequency Domain Interferometry with the Capon Method" (IEEE Transactions on medical imaging, Vol. 31, No. 2, February 2012) discloses an art for reducing a false image generated in an echo image due to using any of the super-resolution methods described above, by using a moving average.
- However, if the false image is reduced by using the moving average as described above, a part of the echo image where the false image is not generated may also be influenced by the false image.
- The purpose of this disclosure relates to reducing a false image while maintaining a resolution of an echo image component generated based on an echo signal from a target object.
- According to one aspect of this disclosure, a signal processor for processing target echo signal is provided. The signal processor includes a filtering module configured to generate a filtered echo signal by extracting echo signal components within a predetermined frequency band from the target echo signal, a high resolution signal generating unit configured to generate a high resolution signal based on the target echo signal, the high resolution signal having higher resolution than the filtered echo signal, and a synthesizing module configured to synthesize the filtered echo signal with the high resolution signal.
- The synthesizing module preferably synthesizes the filtered echo signal with the high resolution signal based on an intensity of the filtered echo signal and an intensity of the high resolution signal.
- The synthesizing module preferably synthesizes the filtered echo signal with the high resolution signal based on an intensity of a first sample sampled from the high resolution signal and an intensity of a second sample sampled from the filtered echo signal, said first and second samples being corresponding samples.
- The synthesizing module preferably synthesizes the filtered echo signal with the high resolution signal by selecting a sample with a lowest intensity between the first and second samples.
- The synthesizing module preferably synthesizes the filtered echo signal with the high resolution signal by adding a value obtained by multiplying the first sample by a first coefficient to a value obtained by multiplying the second sample by a second coefficient.
- The synthesizing module preferably selects one of the first sample and the second sample based on a comparison between the intensities of the first and second samples.
- The target echo signal is preferably generated based on a reflection wave caused by a transmission wave transmitted from a transmitter and reflected on a target object. The synthesizing module preferably includes a zone discriminating submodule configured to partition a distance range into a first zone where the intensity of the first sample is the same as or higher than the intensity of the second sample and a second zone where the intensity of the first sample is lower than the intensity of the second sample, said distance range corresponding to a time length from transmission of the transmission wave until reception of the reflection wave by a receiver. The synthesizing module preferably selects among a plurality of said first zones the first sample for a first zone having a length smaller than a predetermined threshold.
- The target echo signal is preferably generated based on a reflection wave caused by a transmission wave transmitted from a transmitter and reflected on a target object. The synthesizing module preferably includes a zone discriminating submodule configured to partition a distance range into a first zone where the intensity of the first sample is the same as or higher than the intensity of the second sample and a second zone where the intensity of the first sample is lower than the intensity of the second sample, said distance range corresponding to a time length from transmission of the transmission wave until reception of the reflection wave by a receiver. The synthesizing module preferably selects among a plurality of said first zones the first sample for a first zone when a first sample with a highest intensity among first samples within said first zone is at a position other than at a boundary of said first zone with the second zone adjacent thereto and when a maximum value among ratios between first and second corresponding samples within said first zone is lower than a predetermined threshold.
- The high resolution signal generating unit preferably includes an inverse filtering module configured to perform inverse filtering of the target echo signal and an intensity spectrum calculating module configured to calculate an intensity spectrum of the inverse-filtered target echo signal.
- The high resolution signal generating unit preferably includes a pulse compressing module configured to perform pulse compression of the target echo signal.
- According to another aspect of this disclosure, an underwater detecting device is provided. The underwater detecting device includes a receiver configured to receive a target echo signal to be processed, the target echo signal being caused by an acoustic wave transmitted underwater, the signal processor in any one of the above descriptions, configured to process the target echo signal received by the receiver, and a display unit configured to display a synthesized signal generated by the synthesizing module of the signal processor.
- The signal processor further preferably includes a water bottom detecting module configured to detect a depth position of a water bottom, and a synthesizing range specifying module configured to specify a target range within which the synthesizing module of the signal processor synthesizes the filtered echo signal with the high resolution signal, the target range being a predetermined depth range including the depth position of the water bottom detected by the water bottom detecting module.
- According to further another aspect of this disclosure, a radar apparatus is provided. The radar apparatus includes an antenna configured to receive a target echo signal to be processed, the signal processor in any one of the above descriptions, configured to process the target echo signal received by the antenna, and a display unit configured to display a synthesized signal generated by the synthesizing module of the signal processor.
- According to further another aspect of this disclosure, a method of processing target echo signal is provided. The method includes generating a filtered echo signal by extracting echo signal components within a predetermined frequency band from the target echo signal, generating a high resolution signal based on the target echo signal, the high resolution signal having higher resolution than the filtered echo signal, and synthesizing the filtered echo signal with the high resolution signal.
- According to further another aspect of this disclosure, computer readable media configured to store a computer executable program in a non-transitory manner, which upon execution by a processor of a computer causes the computer to process target echo signal is provided. Processing the target echo signal includes causing a computer to generate a filtered echo signal by extracting echo signal components within a predetermined frequency band from the target echo signal, causing a computer to generate a high resolution signal based on the target echo signal, the high resolution signal having higher resolution than the filtered echo signal, and causing a computer to synthesize the filtered echo signal with the high resolution signal.
- According to this disclosure, the false image can be reduced, while maintaining the resolution of the echo image component generated based on the echo signal from the target object.
- The present disclosure is illustrated by way of example and not by way of limitation in the figures of the accompanying drawings, in which the like reference numerals indicate like elements and in which:
-
Fig. 1 is a block diagram illustrating a configuration of an underwater detecting device according to one embodiment of this disclosure; -
Fig. 2 is a block diagram illustrating a configuration of a signal processor of the underwater detecting device inFig. 1 ; -
Fig. 3 is a view illustrating an example of an echo image displayed on a user-interface display unit; -
Fig. 4 is a flowchart illustrating operation of the signal processor inFig. 2 ; -
Fig. 5 is a chart illustrating an intensity spectrum in a ping t1; -
Fig. 6 is a chart illustrating an echo intensity signal based on a filtered echo signal in the ping t1; -
Fig. 7 is a chart illustrating an echo signal generated by a synthesizing module in the ping t1; -
Fig. 8 is a view illustrating an example of a first echo image; -
Fig. 9 is a view illustrating an example of a second echo image; -
Fig. 10 is a view illustrating an example of an echo image generated by the underwater detecting device inFig. 1 ; -
Fig. 11 is a block diagram illustrating a configuration of a signal processor of the underwater detecting device of a first modification; -
Fig. 12 is a block diagram illustrating a configuration of a signal processor of the underwater detecting device of a second modification; -
Fig. 13 is a block diagram illustrating a configuration of a radar apparatus according to a second embodiment; -
Fig. 14 is a block diagram illustrating a configuration of a signal processor of the radar apparatus inFig. 13 ; -
Fig. 15 is a block diagram illustrating a configuration of a signal processor of the underwater detecting device of a fourth modification; -
Fig. 16 is a block diagram illustrating a configuration of a signal processor according a fifth modification; -
Fig. 17A is a view for describing signal processing performed by a signal processor inFig. 2 , andFig. 17B is a view for describing signal processing performed by a signal processor according to a sixth modification; -
Fig. 18 is a block diagram illustrating a configuration of a synthesizing module of the underwater detecting device according to a seventh modification; -
Fig. 19 is a flowchart for describing operation of the signal processor of the underwater detecting device according to the seventh modification; -
Fig. 20 is a chart illustrating a high resolution signal and a filtered echo signal in a certain ping, for describing first and second zones which are defined by a zone discriminating submodule inFig. 18 ; -
Fig. 21 is a view illustrating one example of the first echo image in a state where single fishes exist in a dense condition; -
Fig. 22 is a view illustrating one example of the second echo image in a state where single fishes exist in a dense condition; -
Fig. 23 is a view illustrating one example of an echo image generated by the underwater detecting device inFig. 1 , in a state where single fishes exist in a dense condition; -
Fig. 24 is a view illustrating one example of an echo image generated by the underwater detecting device of the seventh modification, in a state where single fishes exist in a dense condition; -
Fig. 25 is a chart in which the echo signal generated by the synthesizing module of the underwater detecting device inFig. 1 in a certain ping is superimposed on the high resolution signal and the filtered echo signal inFig. 20 ; and -
Fig. 26 is a chart in which the echo signal generated by the synthesizing module of the underwater detecting device of the seventh modification in a certain ping is superimposed on the high resolution signal and the filtered echo signal inFig. 20 . - Hereinafter, one embodiment of a signal processor and an underwater detecting device using the signal processor according to this disclosure is described with reference to the drawings.
Fig. 1 is a block diagram illustrating a configuration of an underwater detectingdevice 1 according to this embodiment of this disclosure. - As illustrated in
Fig. 1 , the underwater detectingdevice 1 includes atransducer 2, atransceiver 3, asignal processor 10, and a user-interface display unit 4 (display unit). The underwater detectingdevice 1 is installed in a ship (hereinafter, may be referred to as "the ship concerned" or simply as "the ship"), such as a fishing boat, and mainly used for detecting a target object (e.g., a single fish or a school of fish). - The
transducer 2 functions as both a transmitter configured to transmit an ultrasonic wave (transmission wave) and a receiver configured to receive an ultrasonic wave (reception wave). Thetransducer 2 converts an electric signal (transmission signal) into the transmission wave, transmits the transmission wave underwater at every predetermined timing, and converts the reception waves into electric signals (reception signals). - The
transceiver 3 includes a transmission andreception switch 5, atransmission unit 6, and a reception unit 7. In transmission, the transmission andreception switch 5 switches the connection in thetransceiver 3 such that each transmission signal is transmitted by thetransmission unit 6 to thetransducer 2. In reception, the transmission andreception switch 5 switches the connection in thetransceiver 3 such that each electric signal converted from the reception wave by thetransducer 2 is transmitted from thetransducer 2 to the reception unit 7. - The
transmission unit 6 outputs the transmission signal generated based on a condition set by the user-interface display unit 4, to thetransducer 2 via the transmission andreception switch 5. - The reception unit 7 amplifies the signal received by the
transducer 2 and A/D converts it into a digital signal (reception data). Then, the reception unit 7 outputs the digitally converted reception data (target echo signal) to thesignal processor 10. - The
signal processor 10 processes the reception data outputted by the reception unit 7 and performs processing for generating an image signal of the target object. The configuration of thesignal processor 10 is described later in detail. - The user-
interface display unit 4 displays on a display screen an image corresponding to the image signal outputted by thesignal processor 10. An operator can estimate a situation of an underwater area below the ship (e.g., whether a single fish and/or a school of fish exist therein) by looking at the display screen. Moreover, the user-interface display unit 4 has an input unit with various input keys, etc... so that various settings or various parameters required for the transmission and reception of the ultrasonic wave, the signal processing or the image display can be inputted therethrough. -
Fig. 2 is a block diagram illustrating the configuration of thesignal processor 10. As illustrated inFig. 2 , thesignal processor 10 includes aninverse filtering module 11, an intensityspectrum calculating module 15, a band-pass filtering module 20 (filtering module), a synthesizingmodule 21, and animage generating module 22. Thesignal processor 10 is constituted with devices including for example a CPU, an FPGA, and a memory (not illustrated). For example, the CPU reads a signal processing program from a memory and executes it to perform the functions of theinverse filtering module 11, the intensityspectrum calculating module 15, the band-pass filtering module 20, the synthesizingmodule 21, and theimage generating module 22. - The signal processing program causes the
signal processor 10 to implement a signal processing method of one embodiment of this disclosure. The program may be installed from outside. Such a program acquired by installation is stored in a storage medium so as to be distributed. The hardware and software described above are configured to operate in cooperation with each other. Thus, thesignal processor 10 can function as theinverse filtering module 11, the intensityspectrum calculating module 15, the band-pass filtering module 20, the synthesizingmodule 21, and theimage generating module 22. - The
inverse filtering module 11 performs inverse filtering so as to remove influence of an instrumental function of thetransducer 2 from the reception data. As illustrated inFig. 2 , theinverse filtering module 11 includes aFourier transforming submodule 12, an instrumentalfunction output submodule 13, and a dividingsubmodule 14. - The
Fourier transforming submodule 12 performs Fourier transform on the reception data outputted by the reception unit 7 and outputs it to the dividingsubmodule 14. When the number of samples of the reception data in a time direction (time samples) is M, the output of theFourier transforming submodule 12 can be expressed as a complex vector Y= [y1, y2, ..., yM]T. Here, T indicates transposition. Note that, if a so-called zero padding is performed in the Fourier transform, the number of elements in the complex vector Y becomes larger than M; however, the number of elements in the complex vector Y of this embodiment is M which is the same as the number of the samples of reception data in the time direction. - The instrumental
function output submodule 13 Fourier-transforms the instrumental function of thetransducer 2. The instrumental function of thetransducer 2 of this embodiment is a predetermined function determined based on the pulse wave transmitted by thetransducer 2, and one example of the instrumental function is impulse response. This instrumental function is measured or modeled, and is stored in a memory, for example. The result obtained by Fourier-transforming the instrumental function as described above is expressed as a complex vector H= [h1, h2, ..., hM]T. Here, the number of elements in the output of theFourier transforming submodule 12 is the same as that of the instrumentalfunction output submodule 13. Note that, the result obtained by Fourier-transforming the instrumental function may be, for example, stored in a memory to be suitably read by the instrumentalfunction output submodule 13. - The dividing
submodule 14 divides the output Y from theFourier transforming submodule 12 by the output H from the instrumentalfunction output submodule 13 to obtain a complex vector X (=Y/H), and outputs the complex vector X to the intensityspectrum calculating module 15 as an inverse filtered signal. The above processing is the inverse filtering, and by this inverse filtering, the influence of the instrumental function can be removed from the reception data. - The intensity
spectrum calculating module 15 processes the complex vector X (a signal corresponding to the reception data from which the influence of the instrumental function is already removed) outputted by theinverse filtering module 11, so as to calculate an intensity spectrum P(t) in every ping. Each intensity spectrum P(t) is outputted to the synthesizingmodule 21. Examples of the method of calculating the intensity spectrum P(t) include inverse Fourier transform and known methods referred to as the super-resolution methods (e.g., Capon method, MUSIC method and Prony method). Thus, the intensityspectrum calculating module 15 calculates in each ping a high resolution signal having high resolution in the time direction. - Note that, the
inverse filtering module 11 and the intensityspectrum calculating module 15 described above are provided as a high resolutionsignal generating unit 16 configured to generate the high resolution signal of which temporal resolution is higher than that of a filtered echo signal generated by the band-pass filtering module 20 (described later). Moreover, the intensity spectrum P(t) which is calculated by the intensityspectrum calculating module 15 is calculated as the high resolution signal. - The band-
pass filtering module 20 extracts reception data in a predetermined frequency band, from the reception data outputted by the reception unit 7. The reception data extracted by the band-pass filtering module 20 is outputted to the synthesizingmodule 21 as the filtered echo signal. Note that, in this embodiment, the filtering module configured to extract the reception data in the predetermined frequency band from all the reception data is configured as the band-pass filtering module; however, without limiting to this, other filtering module (e.g., a low-pass filtering module) may be adopted. - The synthesizing
module 21 synthesizes each sample constituting the intensity spectrum P(t) (hereinafter, referred to as the first sample) with one of the samples of the filtered echo signal corresponding to the first sample (hereinafter, the sample corresponding to the first sample is referred to as the second sample). Specifically, the synthesizingmodule 21 compares the first sample of the intensity spectrum P(t) with the second sample at the same depth position and in the same ping as the first sample. If the intensity of the first sample is lower than that of the second sample, the synthesizingmodule 21 selects the first sample and outputs it to theimage generating module 22 as the output sample. On the other hand, if the intensity of the first sample is the same as or higher than that of the second sample, the synthesizingmodule 21 selects the second sample and outputs it to theimage generating module 22 as the output sample. -
Fig. 3 is a view illustrating an example of an echo image displayed on the user-interface display unit 4. Theimage generating module 22 generates the echo image based on the output samples outputted by the synthesizingmodule 21. In the echo image displayed on the user-interface display unit 4 of this embodiment, up/down direction corresponds to water depth, and left/right direction indicates pings each corresponding to the transmission time point of the pulse wave transmitted from thetransducer 2 at every predetermined timing. Theimage generating module 22 displays at each pixel in the depth-ping coordinate each output sample in a color tone corresponding to the intensity of the output sample. In this embodiment, the color tone is gradually changed in the order of red, orange, yellow, green, blue, and dark blue, as the intensity of the output sample is lower. Note that inFig. 3 , for the sake of convenience, the color tone for higher intensity is illustrated as finer hatching and the color tone for lower intensity is illustrated as rougher hatching. - Moreover, in
Fig. 3 , a section extending in the left/right direction and illustrated as the finest hatching in the upper half of the echo image is a so-called oscillation line, indicating a position of thetransducer 2 installed to the bottom of the ship. Moreover, a section extending in the left/right direction and illustrated as the finest hatching in the lower half of the echo image is a so-called water bottom line, indicating the bottom of water. Further, the two bow-shaped echo image components located slightly above the water bottom line can be estimated as caused by two single fishes. -
Fig. 4 is a flowchart for describing the operation of thesignal processor 10. The operation of thesignal processor 10 described above is described with reference toFig. 4 . - First at S1, the
inverse filtering module 11 performs the inverse filtering on the target echo signal outputted from thetransducer 2 at each ping, with respect to target echo signal along the time direction (water depth direction). Specifically, theFourier transforming submodule 12 Fourier-transforms the target echo signal in terms of time t, and outputs the transformation result to the dividingsubmodule 14. Meanwhile, the instrumentalfunction output submodule 13 Fourier-transforms the instrumental function in terms of time t, and outputs the transformation result to the dividingsubmodule 14. Further, the dividingsubmodule 14 divides the output Y from theFourier transforming submodule 12 by the output H from the instrumentalfunction output submodule 13, and outputs the complex vector X (=Y/H) which is the division result to the intensityspectrum calculating module 15. - Next at S2, the intensity
spectrum calculating module 15 processes the complex vector X outputted from theinverse filtering module 11, so as to calculate the intensity spectrum P(t) for every ping. - Meanwhile at S3, the band-
pass filtering module 20 extracts, as the filtered echo signal, the echo signal in the predetermined frequency band from the target echo signal outputted by thetransducer 2. - Next at S4, the synthesizing
module 21 compares the first samples P1n (n= 1, 2, ...) constituting each intensity spectrum P(t), with the second samples P2n (n= 1, 2, ...) of the filtered echo signal. -
Fig. 5 is a chart illustrating the intensity spectrum P(t) in a certain ping t1 (seeFig. 8 ).Fig. 6 is a chart illustrating an echo intensity signal based on the filtered echo signal in the same ping t1. At S4, the first and second samples P1n and P2n at the corresponding position (in the same ping and at the same depth position) are compared with each other. - Further, if the intensity of the first sample P1n is lower than that of the second sample P2n (S5: YES), the synthesizing
module 21 selects the first sample P1n (S6) and outputs it to theimage generating module 22 as the output sample. On the other hand, if the intensity of the first sample P1n is the same as that of the second sample P2n or higher (S5: NO), the synthesizingmodule 21 selects the second sample P2n (S7) and outputs it to theimage generating module 22 as the output sample. - To describe this procedure in detail with reference to
Figs. 5 and6 , between the first and second samples P11 and P21, the synthesizingmodule 21 selects the first sample P11, and between the first and second samples P12 and P22, the synthesizingmodule 21 selects the second sample P22. The synthesizingmodule 21 performs this comparison for all the samples of the intensity spectrum P(t) of each ping. The comparison result is the echo signal as illustrated inFig. 7 . - Then at S8, the
image generating module 22 generates the echo image based on the output samples outputted from the synthesizingmodule 21. One example of the echo image is illustrated inFig. 3 as described above. - Here, the echo image generated by the underwater detecting
device 1 according to this embodiment will be described. However, before that, a case where the echo image is generated by only using the first samples described above (hereinafter, referred to as the first echo image) and a case where the echo image is generated by only using the second samples described above (hereinafter, referred to as the second echo image) are described. -
Fig. 8 is a view illustrating one example of the first echo image, andFig. 9 is a view illustrating one example of the second echo image. In the first echo image illustrated inFig. 8 , echo image components A1 resolved by high resolution are displayed. Therefore, in the example ofFig. 8 , it can be estimated that the echo image components A1 are caused by two single fishes. However, in the first echo image, an echo image component B (false image) which does not actually exist is generated as noise near the water bottom, which causes confusion to the operator. Additionally, if a single fish or a school of fish exists near the water bottom, it may overlap with the false image and the single fish or the school of fish may be lost. Note that, the cause of the false image is mismatch in the waveform between the instrumental function and the echo signal. Due to this mismatch, a pure sine wave cannot be obtained from the output result of the dividingsubmodule 14, and a sharply rising echo signal corresponding to the water bottom cannot be obtained from the intensity spectrum calculated by the intensityspectrum calculating module 15. This undulating portion is displayed as the false image. - On the other hand, in the second echo image illustrated in
Fig. 9 , different from the first echo image illustrated inFig. 8 , the false image is not generated near the water bottom. Therefore, a single fish or a school of fish near the water bottom is easily distinguished. However, in the second echo image, the echo image components which are resolved by high resolution in the first echo image described above are displayed in a blurry way as echo image components A2. Thus, whether the echo image components A2 are caused by a single fish or caused by a school of fish formed by a plurality of small-sized single fishes cannot be determined. - In contrast, in the underwater detecting
device 1 of this embodiment, the echo image without the defects of the first and second echo images described above can be generated.Fig. 10 is one example of the echo image generated by the underwater detectingdevice 1. - As described above, in the underwater detecting
device 1 of this embodiment, the sample with the lowest intensity between the first and second samples corresponding to each other in terms of position is selected, and the selected sample is used as the output sample. Thus, the false image near the water bottom in the first echo image illustrated inFig. 8 (echo image generated only by the first samples) can be removed and also the target objects (e.g., the single fishes and/or the school of fish) resolved by high resolution can be displayed. - As described above, with the
signal processor 10 of this embodiment, the intensity spectrum P(t) calculated by the intensityspectrum calculating module 15 is synthesized with the filtered echo signal generated by the band-pass filtering module 20. Thus, as described above, the false image B (seeFig. 8 ) which is generated near the water bottom can be reduced while maintaining the high resolution of the echo image components of the target objects. - Therefore, with the
signal processor 10, the false image can be reduced while maintaining the resolution of the echo image components caused by the echo signals from the target objects. - Further, with the
signal processor 10 of this embodiment, the intensity spectrum P(t) is synthesized with the filtered echo signal based on the intensity of the intensity spectrum P(t) and the intensity of the filtered echo signal. Thus, the intensity spectrum P(t) can suitably be synthesized with the filtered echo signal. - Moreover, with the
signal processor 10 of this embodiment, the intensity spectrum P(t) is synthesized with the filtered echo signal based on each of the first samples constituting the intensity spectrum P(t) and the second samples, corresponding to the respective first samples, constituting the filtered echo signal. Thus, the intensity spectrum P(t) can suitably be synthesized with the filtered echo signal for each sample. - Also, with the
signal processor 10, the echo image is generated as the information regarding the echo signal. Thus, the information regarding the echo signal can suitably be recognized by the operator as image information. - Furthermore, with the
signal processor 10, the sample with the lowest intensity between the first and second samples is generated as the output sample. Thus, the false image B generated near the water bottom can be removed without degradation of the resolution of the echo image component. - Moreover, with the
signal processor 10, the high resolution signal with higher temporal resolution than the filtered echo signal generated by the band-pass filtering module 20 can suitably be generated by theinverse filtering module 11 and the intensityspectrum calculating module 15. - Additionally, in this embodiment, the underwater detecting device including the
signal processor 10 which can reduce the false image while maintaining the resolution of the echo image component as described above can be provided. Furthermore, with the underwater detectingdevice 1, the echo image generated as described above can be displayed on the user-interface display unit 4. Therefore, the information regarding the echo signal can suitably be recognized by the operator as image information. - Although the embodiment of this disclosure is described above, this disclosure is not limited to this, and various changes may be applied without deviating from the scope of this disclosure.
-
Fig. 11 is a block diagram illustrating a configuration of asignal processor 10a of the underwater detecting device according to a first modification. Thesignal processor 10a of the first modification has a synthesizingmodule 23 with a significantly different configuration from the synthesizing module of thesignal processor 10 of the above embodiment. Hereinafter, the configuration of the synthesizingmodule 23 is mainly described, and the description of other parts is omitted. - Differently from the synthesizing
module 21 of the above embodiment, the synthesizingmodule 23 of this modification weights the first and second samples. Further, the weighted first and second samples are added and synthesized with each other, so as to generate the output sample. The synthesizingmodule 23 includes a firstcoefficient multiplying submodule 23a, a secondcoefficient multiplying submodule 23b, and an addingsubmodule 23c. - The first
coefficient multiplying submodule 23a multiplies each of the first samples of the intensity spectrum P(t) calculated by the intensityspectrum calculating module 15 by a first coefficient. The secondcoefficient multiplying submodule 23b multiplies each of the second samples outputted from the band-pass filtering module 20 by a second coefficient. The addingsubmodule 23c generates the output sample by adding the first sample multiplied by the first coefficient to the second sample multiplied by the second coefficient. Theimage generating module 22 generates the echo image based on the output sample. Also by generating the echo image in the above manner, the false image which is caused near the water bottom can be reduced while maintaining the resolution of the echo image components caused by the target objects. Note that, the first and second coefficients described above are set to values whose sum equals 1. -
Fig. 12 is a block diagram illustrating a configuration of asignal processor 10b of the underwater detecting device according to a second modification. Within a predetermined depth range, thesignal processor 10b of this modification selects, as the output sample, the sample with the lowest intensity between the first and second samples, as in the above embodiment. On the other hand, differently from the above embodiment, outside of the predetermined depth range, thesignal processor 10b selects the first sample as the output sample. Thesignal processor 10b of this modification includes an oscillation lineposition detecting module 24, a waterbottom detecting module 25, and a comparison range specifying module 26 (synthesizing range specifying module) in addition to the components provided to thesignal processor 10 of the above embodiment (e.g., theinverse filtering module 11 and the intensity spectrum calculating module 15). - The oscillation line
position detecting module 24 detects the position of the oscillation line based on the output results from the intensityspectrum calculating module 15, the band-pass filtering module 20 and the like. Note that, the oscillation line indicates the position of thetransducer 2, and depending for example on a frequency of the ultrasonic wave transmitted from thetransducer 2, a width of the oscillating line changes. - The water
bottom detecting module 25 detects the depth position of the water bottom based on the output results from the intensityspectrum calculating module 15, the band-pass filtering module 20 and the like. - The comparison
range specifying module 26 specifies depth ranges (comparison ranges) within which the two samples (first and second samples) are compared by asynthesizing module 21a, based on the position of the oscillation line detected by the oscillation lineposition detecting module 24 and the depth position of the water bottom detected by the waterbottom detecting module 25. Specifically, the comparisonrange specifying module 26 specifies the comparison ranges to be a predetermined depth range including the position of the oscillation line and a predetermined depth range including the depth position of the water bottom, respectively. - The
synthesizing module 21a operates differently from the synthesizingmodule 21 of the above embodiment. Specifically, within the comparison ranges, similar to the above embodiment, the synthesizingmodule 21a compares the first and second samples with each other and selects the sample with the lowest intensity as the output sample. On the other hand, for the first and second samples outside the comparison ranges, the synthesizingmodule 21a selects the first sample as the output sample without performing the above comparison. - In the echo image, the false image is easily caused within a range near the water bottom or near the oscillation line of the image generated based on the first samples. On the other hand, the false image is not easily caused other than near the water bottom or near the oscillation line. Therefore, as this modification, within the ranges where the false image is easily caused (comparison ranges), by comparing the first sample with the second sample and selecting the sample with the lowest intensity, the false image can be reduced. On the other hand, outside the comparison ranges, by selecting the first sample as the output sample, a calculation load in signal processing performed by the
signal processor 10b can be reduced. - In the above embodiment, the example of applying the
signal processor 10 to the underwater detectingdevice 1 is described; however, without limiting to this, the signal processor may be applied to a radar apparatus. -
Fig. 13 is a block diagram illustrating a configuration of aradar apparatus 1a according to a second embodiment. As illustrated inFig. 13 , theradar apparatus 1a includes anantenna unit 30, asignal processor 10c, and a user-interface display unit 4. Theradar apparatus 1a is a ship radar provided to a ship (e.g., fishing boat) and is used for mainly detecting a target object (e.g., another ship). - The
antenna unit 30 includes anantenna 31, a transmission andreception switch 32, atransmission unit 33, and areception unit 34. - The
antenna 31 transmits a pulse-shaped radio wave having a directivity and receives an echo (reflection wave) from the target object. Theradar apparatus 1a can acquire a distance r from theradar apparatus 1a to the target object by measuring a time length from the transmission of the pulse-shaped radio wave until the reception of the echo by theantenna 31. Moreover, theantenna 31 is rotatable by 360 degrees on the horizontal plane, and repeats the transmission and reception of the radio wave while changing the transmission direction of the pulse-shaped radio wave (changing an antenna angle θ). Note that, theantenna 31 outputs an angular signal indicating the antenna angle (=azimuth angle) θ to thesignal processor 10c. With the above configuration, theantenna 31 can detect the target object over 360 degrees on the plane around the ship. Examples of theantenna 31 include a slot array antenna, a patch antenna, and a parabola antenna. - In the transmission, the transmission and
reception switch 32 switches the connection in theantenna unit 30 such that the transmission signal is transmitted from thetransmission unit 33 to theantenna 31. In the reception, the transmission andreception switch 32 switches the connection in theantenna unit 30 such that the echo received by theantenna 31 is transmitted from theantenna 31 to thereception unit 34. - The
transmission unit 33 has, for example, a D/A converter, a frequency converter, and an electric amplifier (all not illustrated) to create microwave oscillation. Thetransmission unit 33 generates a radar transmission signal and outputs it to theantenna 31. - The
reception unit 34 amplifies the signal received by theantenna 31 and A/D converts the amplified reception signal. Then, thereception unit 34 outputs the digitally converted reception data (target echo signal) to thesignal processor 10c. -
Fig. 14 is a block diagram illustrating a configuration of thesignal processor 10c of theradar apparatus 1a inFig. 13 . Thesignal processor 10c generates an echo image by processing the reception data outputted from theantenna unit 30 similarly to the case of thesignal processor 10 of the underwater detectingdevice 1 described above. - The echo image generated as described above is displayed on the user-
interface display unit 4, as the information regarding the echo signal. - Moreover, the
inverse filtering module 11 is not limited to perform the processing described in the above embodiments, as long as the influence of the instrumental function of thetransducer 2 can be removed. For example, in a third modification, theinverse filtering module 11 performs Wiener filtering. Specifically, the complex vector X may be obtained based on the followingEquation 1 by the dividingsubmodule 14 and outputted to the intensityspectrum calculating module 15.
- In the
above Equation 1, * indicates a complex conjugation and α indicates a Wiener parameter (0≤α≤1). - In the above embodiments, the high resolution signal is generated by the
inverse filtering module 11 and the intensityspectrum calculating module 15; however, it is not limited to this. Specifically, in a fourth modification described below, the high resolution signal is generated by so-called pulse compression. -
Fig. 15 is a block diagram illustrating a configuration of asignal processor 10d of the underwater detecting device of the fourth modification. In this modification, a high resolution signal generating unit 16a may be configured with apulse compressing module 17. Note that, in this modification, for example, the transducer transmits a chirp signal of which frequency changes linearly with time, at every predetermined timing for a predetermined period of time. - The
pulse compressing module 17 has a matchedfiltering submodule 18. The matchedfiltering submodule 18 pulse-compresses the reception signal by correlating the signal received by thetransducer 2 with a reference signal predetermined based on the transmission signal (chirp signal). Thus, the high resolution signal with high temporal resolution can be generated. - Then, the synthesizing
module 21 synthesizes the filtered echo signal extracted by the band-pass filtering module 20 with the signal generated by thepulse compressing module 17, similar to the above embodiment. - Note that, also with the high resolution signal generated by the
pulse compressing module 17, the echo image component B (false image) as illustrated inFig. 8 is caused similarly to the above embodiment. By performing the synthesis as described above by the synthesizingmodule 21 similar to the above embodiment, the false image can be reduced while maintaining the resolution of the echo image caused by the echo signal from the target object. -
Fig. 16 is a block diagram illustrating a configuration of asignal processor 10e according a fifth modification. As illustrated inFig. 16 , this disclosure is applicable to a signal processor which does not include a transducer or a user-interface display unit, different from the case of the underwater detectingdevice 1 of the above embodiment. Moreover, a high resolutionsignal generating unit 16b of thesignal processor 10e may have theinverse filtering module 11 and the intensityspectrum calculating module 15 described above, or may be configured with thepulse compressing module 17. Further, without limiting to these, the high resolutionsignal generating unit 16b may have any configuration as long as it can generate a signal with higher temporal resolution than the filtered echo signal generated by the band-pass filtering module 20. -
Fig. 17A is a view for describing the signal processing performed by the signal processor of the above embodiments, andFig. 17B is a view for describing signal processing performed by a signal processor according to a sixth modification. In the above embodiments, as illustrated inFig. 17A , the intensity spectrum is calculated for every azimuth (i.e., every ping). Thus, the high resolution signal resolved by high resolution in the time direction (distance direction) is calculated. Further, by synthesizing the high resolution signal with the filtered echo signal, the false image caused due to the high resolution signal with high temporal resolution can be reduced. - On the other hand, in this modification, as illustrated in
Fig. 17B , an intensity spectrum is calculated for every predetermined time interval (i.e., every predetermined distance). Thus, a high resolution signal resolved by high resolution in the azimuth direction is calculated. Further, by synthesizing the high resolution signal with the filtered echo signal by comparing the first and second samples having corresponding azimuth, the false image caused due to the high resolution signal with high azimuth resolution can be reduced. - Note that, in this modification, for example, either one of a low-pass filtering module (moving average filtering module) to reduce random noise and an order-statistic filtering module (rank filtering module) to reduce spike-like noise caused by interference signal from a radar of another ship may be used as the filtering module. Moreover, as the high resolution signal generating unit, the inverse filtering module and the intensity spectrum calculating module may be used similar to the above embodiments, or a matched filtering module may be used.
-
Fig. 18 is a block diagram illustrating a configuration of a synthesizingmodule 27 of the underwater detecting device according to a seventh modification.Fig. 19 is a flowchart for describing operation of the signal processor of the underwater detecting device according to the seventh modification. The signal processor of this modification is different in the configuration and operation of the synthesizing module compared to the signal processor of the above embodiment. - The synthesizing
module 27 of the underwater detecting device of this modification includes a zone discriminating submodule 27a and three determining submodules (a first determiningsubmodule 27b, a second determiningsubmodule 27c, and a third determiningsubmodule 27d). The synthesizingmodule 27 selects one of the first and second samples by comparing the intensity of the first sample with the intensity of the second sample corresponding to the first sample. -
Fig. 20 is a chart for describing first zones R1m and second zones R2p which are defined by the zone discriminating submodule 27a. The zone discriminating submodule 27a compares the first sample P1n of the high resolution signal with the second sample P2n which is at the same depth position and in the same ping as the first sample P1n. Then, as illustrated inFig. 20 , the zone discriminating submodule 27a defines a zone where the intensity of the first sample P1n is the same or higher than that of the second sample P2n as the first zone R1m (m=1, 2, ...), and defines a zone where the intensity of the first sample P1n is lower than that of the second sample P2n as the second zone R2p (p=1, 2, ...). Further, within the second zone R2p, the synthesizingmodule 27 outputs the first sample P1n as the output sample to theimage generating module 22. - The first determining
submodule 27b determines whether a value of a depth range width ΔDm (distance range) of each first zone R1m is lower than a predetermined threshold Thr1. The threshold Thr1 is set to a suitable value based on experiments conducted in advance, for example. Within the first zone R1m, if the value of the depth range width ΔDm is lower than the threshold Thr1, the synthesizingmodule 27 outputs the first sample P1n as the output sample to theimage generating module 22. On the other hand, within the first zone R1m, if the value of the depth range width ΔDm is the threshold Thr1 or higher, the determination of the sample (between the first and second samples P1n and P2n) to be outputted as the output sample to theimage generating module 22 is passed on to determination performed by the second determiningsubmodule 27c or determination thereafter. - The second determining
submodule 27c performs the following determination within each zone R1m where the value of the depth range width ΔDm is determined to be the threshold Thr1 or higher by the first determiningsubmodule 27b. Specifically, the second determiningsubmodule 27c determines whether the first sample P1n with the highest intensity within the first zone R1m as described above is on a boundary with the second zone R2p adjacent to the first zone R1m. Within the first zone R1m, if the first sample P1n with the highest intensity is on the boundary of this first zone R1m, the synthesizingmodule 27 outputs the second sample P2n as the output sample to theimage generating module 22. Within the first zone R1m, if the first sample P1n with the highest intensity is not on the boundary of the first zone R1m, the determination of the sample (between the first and second samples P1n and P2n) to be outputted as the output sample to theimage generating module 22 is passed on to determination performed by the third determiningsubmodule 27d. - The third determining
submodule 27d performs the following determination within each zone R1m where the first sample P1n with the highest intensity is determined to be not on the boundary described above by the second determiningsubmodule 27c. Specifically, the third determiningsubmodule 27d determines whether a maximum value among ratios between the intensities of the first and second samples P1n and P2n at the same depth position as each other (more specifically, the ratio of the intensity of P1n with respect to the intensity of P2n) exceeds a predetermined threshold Thr2. The threshold Thr2 is set to a suitable value based on experiments conducted in advance, for example. Within the first zone R1m, if the maximum value exceeds the threshold Thr2, the synthesizingmodule 27 outputs the second sample P2n as the output sample to theimage generating module 22. Within this first zone R1m, if the maximum value described above is the threshold Thr2 or lower, the synthesizingmodule 27 outputs the first sample P1n as the output sample to theimage generating module 22. Note that in this modification, the intensity of each sample is expressed on a linear scale. In a case where the intensity of each sample is expressed on a log scale, the third determiningsubmodule 27d determines whether the maximum value among differences between the intensities of the first and second samples P1n and P2n at the same depth position as each other (more specifically, values obtained by subtracting the intensity of P1n by the intensity of P2n) exceeds the predetermined threshold Thr2. - Next, the operation of the signal processor of this modification is described. With reference to
Fig. 19 , at S1 and S2, the intensityspectrum calculating module 15 and the like calculate the intensity spectrum P(t), in other words the high resolution signal, in every ping by operating similar to the above embodiment. Meanwhile, at S3, the band-pass filtering module 20 generates the filtered echo signal by operating similar to the above embodiment. Further, at S4, the synthesizingmodule 27 compares the first sample P1n with the second sample P2n. - Next, at S10, the zone discriminating submodule 27a discriminates between the first and second zones R1m and R2p, and as illustrated in
Fig. 20 , the entire range of each of the high resolution signal and the filtered echo signal in the depth direction is divided into the first and second zones R1m and R2p. Further, within the second zone R2p, the synthesizingmodule 27 selects the first sample P1n (S11) and outputs it as the output sample to theimage generating module 22. - Next, at S12, the first determining
submodule 27b compares the value of depth range width ΔDm of each first zone R1m with the threshold Thr1 to determine whether the the value of depth range width ΔDm is lower than the threshold Thr1 for all the first zones R1m. If the value of depth range width ΔDm is lower than the threshold Thr1 (S12: YES), the synthesizingmodule 27 selects the first sample P1n within the first zone R1m (S13) and outputs it as the output sample to theimage generating module 22. In the example ofFig. 20 , the synthesizingmodule 27 selects the first sample as the output sample within the first zones R14, R15, R16 and R17. On the other hand, if the value of the depth range width ΔDm is the threshold Thr1 or higher (S12: NO), the procedure proceeds to S14. - Next at S14, for each of the first zones R1m where the value of the depth range width ΔDm is determined to be the threshold Thr1 or higher by the first determining
submodule 27b, the second determiningsubmodule 27c determines whether the first sample P1n with the highest intensity within the corresponding first zone R1m is on the boundary of the first zone R1m. If the first sample P1n with the highest intensity is on the boundary of the first zone R1m (S14: YES), the synthesizingmodule 27 selects the second sample P2n within the corresponding first zone R1m (S15) and outputs it as the output sample to theimage generating module 22. In the example ofFig. 20 , the synthesizingmodule 27 selects the second sample as the output sample within the first zones R11, R12 and R18. On the other hand, if the first sample P1n with the highest intensity is not on the boundary of the first zone R1m (S14: NO), the procedure proceeds to S16. - Next at S16, the third determining
submodule 27d performs the following determination within each zone R1m where the first sample P1n with the highest intensity is determined to be not on the boundary of the first zone R1m by the second determiningsubmodule 27c. Specifically, at S16, the third determiningsubmodule 27d determines whether the maximum value among the ratios between the intensities of the first and second samples P1n and P2n at the same depth position as each other exceeds the predetermined threshold Thr2. If the maximum value exceeds the threshold Thr2 (S16: YES), the synthesizingmodule 27 selects the second sample P2n within the corresponding first zone R1m (S17) and outputs it as the output sample to theimage generating module 22. On the other hand, if the maximum value described above is the threshold Thr2 or lower (S16: NO), the synthesizingmodule 27 selects the first sample P1n within the first zone R1m (S18) and outputs it as the output sample to theimage generating module 22. In the example ofFig. 20 , the synthesizingmodule 27 selects the first sample as the output sample within the first zone R13. - Finally at S8, the
image generating module 22 generates the echo image based on the output sample outputted from the synthesizingmodule 27. - Here, the echo image generated by the underwater detecting device according to this modification will be described. However, before that, the first echo image generated by only using the first samples, the second echo image generated by only using the second samples, and the echo image generated by the underwater detecting
device 1 of the above embodiment are described. Note that, each of these echo images indicates an example where a plurality of single fishes existing in a comparatively dense condition are displayed. -
Fig. 21 is a view illustrating one example of the first echo image in a state where single fishes exist in a dense condition. Moreover,Fig. 22 is a view illustrating one example of the second echo image in a state where single fishes exist in a dense condition.Fig. 23 is a view illustrating one example of the echo image generated by the underwater detecting device inFig. 1 , in a state where single fishes exist in a dense condition. - In the first echo image, even in the state where single fishes exist underwater in a dense condition, as illustrated in
Fig. 21 , echo image components of the respective single fishes resolved by high resolution are displayed. On the other hand, in the second echo image, in the state where single fishes exist underwater in a dense condition, as illustrated inFig. 22 , echoes of single fishes close to each other interfere to cancel or enhance each other. As a result, in the echo image generated based on the output samples synthesized by the synthesizingmodule 21 of the underwater detectingdevice 1 of the above embodiment, as illustrated inFig. 23 , the echo image components of the single fishes which are resolved by high resolution (seeFig. 21 ) are partially removed, causing severe deterioration in the visibility of the echo image components. - In this regard, with the synthesizing
module 27 of this modification, by operating as described above, even when the plurality of single fishes exist in a dense condition, as illustrated inFig. 24 , the echo image components of the respective single fishes which are resolved by high resolution are displayed without the above defects, and the false image which may be caused near the water bottom can be removed. -
Fig. 25 is a chart in which the echo signal generated based on the output samples by the synthesizingmodule 21 of the underwater detectingdevice 1 of the above embodiment in a certain ping is superimposed on the high resolution signal and the filtered echo signal inFig. 20 . Moreover,Fig. 26 is a chart in which the echo signal generated based on the output samples by the synthesizingmodule 27 of the underwater detecting device of this modification in a certain ping is superimposed on the high resolution signal and the filtered echo signal inFig. 20 . - In the case of the underwater detecting
device 1 of the above embodiment, since the sample with lower echo intensity between the first and second samples is selected (waveform indicated by the thick line inFig. 25 ), for example, when a plurality of single fishes exist in a dense condition, the following situation may occur. Specifically, in a part of the filtered echo signal generated based on the second samples corresponding to a depth range where the single fishes are densely concentrated (a range from R13 to about R17 inFig. 25 ), the echo intensity of the echo signal may be lower than parts of the high resolution signal generated based on the first samples and caused by single fishes, respectively (R13, R14, R15, R16 and R17 inFig. 25 ). Thus, with the underwater detectingdevice 1, sharp peaks caused by single fishes are clipped as illustrated inFig. 25 . - On the other hand, with the synthesizing
module 27 of this modification, one of the corresponding first and second samples is selected based on the comparison of the intensity of the first sample with the intensity of the second sample. Thus, it can be avoided that the peaks caused by the single fishes are clipped. - Specifically, with the synthesizing
module 27 of this modification, as described above, the first sample is selected in each zone where the depth range width ΔDm is comparatively narrow among the plurality of first zones (zones where the intensity of the first sample is higher than that of the second sample). As illustrated inFig. 26 , in the high resolution signal generated based on the first samples, since each part caused by a single fish forms a comparatively sharp peak waveform (R14, R15, R16 and R17 inFig. 26 ), the depth range width ΔDm of the first zone tends to become narrow. Thus, in the zone where the depth range width ΔDm is comparatively narrow, by selecting the first sample, it can suitably be avoided that the sharp peaks caused by the single fishes are clipped. - Further, the processings at
S 14 and S16 described above are performed by the synthesizingmodule 27 of this modification. Specifically, among the plurality of first zones, the first sample is selected within each first zone within which the first sample with the highest intensity is not on the boundary with the second zone adjacent thereto and the maximum value among the ratios between the intensities of the corresponding first and second samples is the threshold Thr2 or lower. - When the first sample with the highest intensity is not on the boundary described above, there is a possibility that a peak caused by a single fish exists within the first zone including the first sample. Therefore, such first zones become target zones where the first sample may be selected. Further, the first sample is selected within each first zone where the maximum value among the ratios between the intensities of the first and second samples is the threshold Thr2 or lower among these target zones. Within a range where a plurality of single fishes densely concentrate, although the echoes caused by the plurality of single fishes interfere to cancel or enhance each other, the influence thereof is about twice the level of the echo intensity caused by each single fish at most. In other words, when the ratio between the intensities of the first and second samples is extremely large, the first sample can be considered as not corresponding to the echo caused by the single fish. Therefore, by selecting the first sample within each first zone where the maximum value among the ratios between the intensities of the first and second samples is the threshold Thr2 or lower among the target zones described above, among the peaks caused by the single fishes, it can be avoided that a peak (e.g., the high resolution signal within the first zone R13 in
Fig. 26 ) that is not significantly sharp is clipped. - As described above, with the underwater detecting
device 1 of the above embodiment, when the single fishes exist in a dense condition, the peaks of the single fishes resolved by high resolution are clipped, causing deterioration in the visibility thereof in the echo image (seeFigs. 23 and25 ). On the other hand, with the underwater detecting device of this modification, the peaks of the single fishes resolved by high resolution are displayed in the echo image without defect (seeFigs. 24 and26 ). Therefore, with the underwater detecting device of this modification, even in the state where the target objects exist in a dense condition, the high resolution of the target objects can be maintained and, similar to the above embodiment, the false image which is caused near the water bottom can be reduced. - Note that, in this modification, the processings from
S 14 to S18 inFig. 19 may be omitted. In this case, in the echo signal caused by the target objects, although the echo having a peak in a wide depth range width is clipped, the echo having a peak in a narrow depth range width can, similar to the case described above, be avoided from being clipped. Moreover, S12 and S13 inFig. 19 may be omitted in this modification. - Furthermore, in this modification, the example of applying the signal processor to the underwater detecting device is described; however, without limiting to this, it is also applicable to a radar, a sonar, etc.
Claims (15)
- A signal processor (10, 10a, 10b, 10c, 10d, 10e) for processing target echo signal, comprising:a filtering module (20) configured to generate a filtered echo signal by extracting echo signal components within a predetermined frequency band from the target echo signal;a high resolution signal generating unit (16, 16a, 16b) configured to generate a high resolution signal based on the target echo signal, the high resolution signal having higher resolution than the filtered echo signal; anda synthesizing module (21, 23, 21a, 27) configured to synthesize the filtered echo signal with the high resolution signal.
- The signal processor (10, 10a, 10b, 10c, 10d, 10e) of claim 1, wherein
the synthesizing module (21, 23, 21a, 27) synthesizes the filtered echo signal with the high resolution signal based on an intensity of the filtered echo signal and an intensity of the high resolution signal. - The signal processor (10, 10a, 10b, 10c, 10d, 10e) of claim 2, wherein
the synthesizing module (21, 23, 21a, 27) synthesizes the filtered echo signal with the high resolution signal based on an intensity of a first sample sampled from the high resolution signal and an intensity of a second sample sampled from the filtered echo signal, said first and second samples being corresponding samples. - The signal processor (10, 10a, 10b, 10c, 10d, 10e) of claim 3, wherein
the synthesizing module (21, 23, 21a, 27) synthesizes the filtered echo signal with the high resolution signal by selecting a sample with a lowest intensity between the first and second samples. - The signal processor (10, 10a, 10b, 10c, 10d, 10e) of claim 3, wherein
the synthesizing module (21, 23, 21a, 27) synthesizes the filtered echo signal with the high resolution signal by adding a value obtained by multiplying the first sample by a first coefficient to a value obtained by multiplying the second sample by a second coefficient. - The signal processor (10, 10a, 10b, 10c, 10d, 10e) of claim 3, wherein
the synthesizing module (21, 23, 21a, 27) selects one of the first sample and the second sample based on a comparison between the intensities of the first and second samples. - The signal processor (10, 10a, 10b, 10c, 10d, 10e) of claim 6, wherein
the target echo signal is generated based on a reflection wave caused by a transmission wave transmitted from a transmitter (2, 3) and reflected on a target object,
the synthesizing module (21, 23, 21a, 27) includes a zone discriminating submodule (27a) configured to partition a distance range into a first zone where the intensity of the first sample is the same as or higher than the intensity of the second sample and a second zone where the intensity of the first sample is lower than the intensity of the second sample, said distance range corresponding to a time length from transmission of the transmission wave until reception of the reflection wave by a receiver (2, 3), and
the synthesizing module (21, 23, 21a, 27) selects among a plurality of said first zones the first sample for a first zone having a length smaller than a predetermined threshold. - The signal processor (10, 10a, 10b, 10c, 10d, 10e) of claim 6, wherein
the target echo signal is generated based on a reflection wave caused by a transmission wave transmitted from a transmitter (2, 3) and reflected on a target object,
the synthesizing module (21, 23, 21a, 27) includes a zone discriminating submodule (27a) configured to partition a distance range into a first zone where the intensity of the first sample is the same as or higher than the intensity of the second sample and a second zone where the intensity of the first sample is lower than the intensity of the second sample, said distance range corresponding to a time length from transmission of the transmission wave until reception of the reflection wave by a receiver (2, 3), and
the synthesizing module (21, 23, 21a, 27) selects among a plurality of said first zones the first sample for a first zone when a first sample with a highest intensity among first samples within said first zone is at a position other than at a boundary of said first zone with the second zone adjacent thereto and when a maximum value among ratios between first and second corresponding samples within said first zone is lower than a predetermined threshold. - The signal processor (10, 10a, 10b, 10c, 10d, 10e) of any one of claims 1 to 8, wherein
the high resolution signal generating unit (16, 16a, 16b) includes:an inverse filtering module (11) configured to perform inverse filtering of the target echo signal; andan intensity spectrum calculating module (15) configured to calculate an intensity spectrum of the inverse-filtered target echo signal. - The signal processor (10, 10a, 10b, 10c, 10d, 10e) of any one of claims 1 to 8, wherein
the high resolution signal generating unit (16, 16a, 16b) includes a pulse compressing module (17) configured to perform pulse compression of the target echo signal. - An underwater detecting device (1), comprising:a receiver (2) configured to receive a target echo signal to be processed, the target echo signal being caused by an acoustic wave transmitted underwater;the signal processor (10, 10a, 10b, 10c, 10d, 10e) described in any one of claims 1 to 10, configured to process the target echo signal received by the receiver (2); anda display unit (4) configured to display a synthesized signal generated by the synthesizing module (21, 23, 21a, 27) of the signal processor (10, 10a, 10b, 10c, 10d, 10e).
- The underwater detecting device (1) of claim 11, wherein
the signal processor (10, 10a, 10b, 10c, 10d, 10e) further includes:a water bottom detecting module (25) configured to detect a depth position of a water bottom; anda synthesizing range specifying module (26) configured to specify a target range within which the synthesizing module (21, 23, 21a, 27) of the signal processor (10, 10a, 10b, 10c, 10d, 10e) synthesizes the filtered echo signal with the high resolution signal, the target range being a predetermined depth range including the depth position of the water bottom detected by the water bottom detecting module (25). - A radar apparatus (1a), comprising:an antenna (31) configured to receive a target echo signal to be processed;the signal processor (10, 10a, 10b, 10c, 10d, 10e) described in any one of claims 1 to 10, configured to process the target echo signal received by the antenna (31); anda display unit (4) configured to display a synthesized signal generated by the synthesizing module (21, 23, 21a, 27) of the signal processor (10, 10a, 10b, 10c, 10d, 10e).
- A method of processing target echo signal, comprising:generating a filtered echo signal by extracting echo signal components within a predetermined frequency band from the target echo signal;generating a high resolution signal based on the target echo signal, the high resolution signal having higher resolution than the filtered echo signal; andsynthesizing the filtered echo signal with the high resolution signal.
- Computer readable media configured to store a computer executable program in a non-transitory manner, which upon execution by a processor of a computer causes the computer to process target echo signal, comprising:causing a computer to generate a filtered echo signal by extracting echo signal components within a predetermined frequency band from the target echo signal;causing a computer to generate a high resolution signal based on the target echo signal, the high resolution signal having higher resolution than the filtered echo signal; andcausing a computer to synthesize the filtered echo signal with the high resolution signal.
Applications Claiming Priority (1)
| Application Number | Priority Date | Filing Date | Title |
|---|---|---|---|
| JP2014136062A JP6321471B2 (en) | 2014-07-01 | 2014-07-01 | Signal processing device, underwater detection device, radar device, signal processing method, and signal processing program |
Publications (2)
| Publication Number | Publication Date |
|---|---|
| EP2963443A1 true EP2963443A1 (en) | 2016-01-06 |
| EP2963443B1 EP2963443B1 (en) | 2017-11-29 |
Family
ID=53498851
Family Applications (1)
| Application Number | Title | Priority Date | Filing Date |
|---|---|---|---|
| EP15174237.6A Active EP2963443B1 (en) | 2014-07-01 | 2015-06-29 | Device, method and program for processing signal, underwater detecting device and radar apparatus |
Country Status (3)
| Country | Link |
|---|---|
| US (1) | US9857464B2 (en) |
| EP (1) | EP2963443B1 (en) |
| JP (1) | JP6321471B2 (en) |
Cited By (1)
| Publication number | Priority date | Publication date | Assignee | Title |
|---|---|---|---|---|
| US11467280B2 (en) * | 2018-10-11 | 2022-10-11 | Furuno Electric Company Limited | Underwater detection apparatus and underwater detection method |
Families Citing this family (2)
| Publication number | Priority date | Publication date | Assignee | Title |
|---|---|---|---|---|
| US10605789B2 (en) * | 2017-02-23 | 2020-03-31 | Southern Research Institute | Ultrasonic inspection system employing spectral and time domain processing of ultrasonic signal |
| JP7051625B2 (en) * | 2018-07-12 | 2022-04-11 | 古野電気株式会社 | Underwater detector and underwater detection method |
Citations (7)
| Publication number | Priority date | Publication date | Assignee | Title |
|---|---|---|---|---|
| JP3032186B2 (en) | 1998-09-22 | 2000-04-10 | 宇宙開発事業団 | Radio wave receiver with improved antenna resolution |
| JP3160580B2 (en) | 1998-09-21 | 2001-04-25 | 宇宙開発事業団 | Radio wave receiver with improved antenna resolution |
| JP3160581B2 (en) | 1998-09-30 | 2001-04-25 | 宇宙開発事業団 | Radio source information display device |
| US20060133210A1 (en) * | 2004-12-20 | 2006-06-22 | Furuno Electric Company Limited | Sonar |
| JP2010183979A (en) | 2009-02-10 | 2010-08-26 | Kyoto Univ | Biological information processing apparatus and biological information processing method |
| WO2010100868A1 (en) * | 2009-03-03 | 2010-09-10 | Canon Kabushiki Kaisha | Ultrasonic apparatus with adaptive and fixed beamforming |
| US20120263018A1 (en) * | 2011-04-14 | 2012-10-18 | Takeharu Yamaguchi | Underwater detection device and underwater detecting method |
Family Cites Families (21)
| Publication number | Priority date | Publication date | Assignee | Title |
|---|---|---|---|---|
| US6738697B2 (en) * | 1995-06-07 | 2004-05-18 | Automotive Technologies International Inc. | Telematics system for vehicle diagnostics |
| JPH0843525A (en) * | 1994-08-02 | 1996-02-16 | Japan Radio Co Ltd | Inverse filtering circuit |
| JPH08201516A (en) * | 1995-01-31 | 1996-08-09 | Japan Radio Co Ltd | Inverse filtering circuit |
| JPH09269370A (en) * | 1996-04-01 | 1997-10-14 | Furuno Electric Co Ltd | Detected-image-data processing method, object detection apparatus, ultrasonic diagnostic apparatus and radar |
| AU4169497A (en) * | 1996-08-29 | 1998-04-14 | David T. Borup | Apparatus and method for imaging with wavefields using inverse scattering techniques |
| JP3050200B2 (en) * | 1998-03-23 | 2000-06-12 | 日本電気株式会社 | Sonar signal processing device and processing method |
| US7199764B2 (en) * | 2002-04-10 | 2007-04-03 | Lockheed Martin Corporation | Maintenance platform for a rolling radar array |
| CN1653709A (en) * | 2002-04-10 | 2005-08-10 | 纳诺特罗恩技术有限责任公司 | Transceiver device |
| EP1576385A2 (en) * | 2002-11-26 | 2005-09-21 | James F. Munro | An apparatus for high accuracy distance and velocity measurement and methods thereof |
| US20050031051A1 (en) * | 2003-08-04 | 2005-02-10 | Lowell Rosen | Multiple access holographic communications apparatus and methods |
| US20050031016A1 (en) * | 2003-08-04 | 2005-02-10 | Lowell Rosen | Epoch-variant holographic communications apparatus and methods |
| US8315282B2 (en) * | 2005-01-20 | 2012-11-20 | Massachusetts Institute Of Technology | Fourier domain mode locking: method and apparatus for control and improved performance |
| JP4928171B2 (en) * | 2006-06-13 | 2012-05-09 | 古野電気株式会社 | Radar apparatus and radar image display method |
| US9084574B2 (en) * | 2006-11-10 | 2015-07-21 | Siemens Medical Solution Usa, Inc. | Transducer array imaging system |
| US20080112265A1 (en) * | 2006-11-10 | 2008-05-15 | Penrith Corporation | Transducer array imaging system |
| WO2009043036A2 (en) * | 2007-09-28 | 2009-04-02 | Quantum Magnifier Llc | Apparatus and method for sensors having improved angular resolution |
| GB2456426B (en) | 2008-01-19 | 2012-02-22 | Furuno Electric Co | Underwater detector |
| JP5301882B2 (en) * | 2008-05-29 | 2013-09-25 | 古野電気株式会社 | Pulse signal transmitter / receiver |
| JP5864894B2 (en) * | 2011-05-10 | 2016-02-17 | キヤノン株式会社 | Subject information acquisition apparatus and signal processing apparatus |
| US9182482B2 (en) | 2011-10-25 | 2015-11-10 | Navico Holding As | Radar beam sharpening system and method |
| JP6078246B2 (en) * | 2012-07-12 | 2017-02-08 | 古野電気株式会社 | Underwater detection device, underwater detection method, and underwater detection program |
-
2014
- 2014-07-01 JP JP2014136062A patent/JP6321471B2/en not_active Expired - Fee Related
-
2015
- 2015-06-25 US US14/750,892 patent/US9857464B2/en active Active
- 2015-06-29 EP EP15174237.6A patent/EP2963443B1/en active Active
Patent Citations (7)
| Publication number | Priority date | Publication date | Assignee | Title |
|---|---|---|---|---|
| JP3160580B2 (en) | 1998-09-21 | 2001-04-25 | 宇宙開発事業団 | Radio wave receiver with improved antenna resolution |
| JP3032186B2 (en) | 1998-09-22 | 2000-04-10 | 宇宙開発事業団 | Radio wave receiver with improved antenna resolution |
| JP3160581B2 (en) | 1998-09-30 | 2001-04-25 | 宇宙開発事業団 | Radio source information display device |
| US20060133210A1 (en) * | 2004-12-20 | 2006-06-22 | Furuno Electric Company Limited | Sonar |
| JP2010183979A (en) | 2009-02-10 | 2010-08-26 | Kyoto Univ | Biological information processing apparatus and biological information processing method |
| WO2010100868A1 (en) * | 2009-03-03 | 2010-09-10 | Canon Kabushiki Kaisha | Ultrasonic apparatus with adaptive and fixed beamforming |
| US20120263018A1 (en) * | 2011-04-14 | 2012-10-18 | Takeharu Yamaguchi | Underwater detection device and underwater detecting method |
Non-Patent Citations (7)
| Title |
|---|
| "High Range Resolution Ultrasonographic Vascular Imaging Using Frequency Domain Interferometry with the Capon Method", IEEE TRANSACTIONS ON MEDICAL IMAGING, vol. 31, no. 2, February 2012 (2012-02-01) |
| KEIICHI SAKURA; KAZUAKI TAKAO; IWANE KIMURA: "Study of Multi-path Propagation by Antenna Pattern Analysis", THE INSTITUTE OF ELECTRONICS, INFORMATION AND COMMUNICATION ENGINEERS (IEICE) TECHNICAL REPORT (ANTENNAS AND PROPAGATION, vol. 77, no. 101, 1977, pages 1 - 6 |
| MAKOTO ANZAI; MASARU OGAWA; KOICHI YAMADA; NOBUYOSHI KIKUMA; NAOKI INAGAKI: "Direction-of-Arrival Estimation of Indoor Multipath Waves by Rotatory Scanning of Antenna using MUSIC algorithm", EICE TECHNICAL REPORT (ELECTROMAGNETIC COMPATIBILITY, vol. 89, no. 349, 1989, pages 7 - 12 |
| NOBUYOSHI KIKUMA: "Adaptive Signal Processing by Array Antenna", 2004, KAGAKU GIJUTSU SHUPPAN, article "chapter 13" |
| TAKI H ET AL: "High Range Resolution Ultrasonographic Vascular Imaging Using Frequency Domain Interferometry With the Capon Method", IEEE TRANSACTIONS ON MEDICAL IMAGING, IEEE SERVICE CENTER, PISCATAWAY, NJ, US, vol. 31, no. 2, 1 February 2012 (2012-02-01), pages 417 - 429, XP011491032, ISSN: 0278-0062, DOI: 10.1109/TMI.2011.2170847 * |
| TOMOKI KIMURA ET AL: "Experimental Study of High-Range-Resolution Medical Acoustic Imaging for Multiple Target Detection by Frequency Domain Interferometry", JAPANESE JOURNAL OF APPLIED PHYSICS, vol. 48, no. 7, 1 July 2009 (2009-07-01), pages 07GJ07, XP055161547, ISSN: 0021-4922, DOI: 10.1143/JJAP.48.07GJ07 * |
| TOMOKI KIMURA; HIROFUMI TAKI; TAKUYA SAKAMOTO; TORU SATO: "Experimental Study of High-Range-Resolution Medical Acoustic Imaging for Multiple Target Detection by Frequency Domain Interferometry", JAPANESE JOURNAL OF APPLIED PHYSICS, 2009, pages 48 |
Cited By (1)
| Publication number | Priority date | Publication date | Assignee | Title |
|---|---|---|---|---|
| US11467280B2 (en) * | 2018-10-11 | 2022-10-11 | Furuno Electric Company Limited | Underwater detection apparatus and underwater detection method |
Also Published As
| Publication number | Publication date |
|---|---|
| JP6321471B2 (en) | 2018-05-09 |
| JP2016014565A (en) | 2016-01-28 |
| US20160003942A1 (en) | 2016-01-07 |
| EP2963443B1 (en) | 2017-11-29 |
| US9857464B2 (en) | 2018-01-02 |
Similar Documents
| Publication | Publication Date | Title |
|---|---|---|
| CN110837078B (en) | Target detection method under array ground wave radar sea clutter background based on correlation characteristics | |
| EP3153884B1 (en) | Detection apparatus, fish finder, and radar | |
| RU2339050C1 (en) | Method of sea noisy objects detection | |
| JP5980587B2 (en) | Radar apparatus and reflected signal processing method | |
| US8760340B2 (en) | Processing radar return signals to detect targets | |
| JP6489589B2 (en) | Radar signal processing device | |
| US9182488B2 (en) | Method and device for detecting target object | |
| WO2014092052A1 (en) | Radar apparatus | |
| EP2963443B1 (en) | Device, method and program for processing signal, underwater detecting device and radar apparatus | |
| US9075142B2 (en) | Device and method for selecting signal, and radar apparatus | |
| WO2017141352A1 (en) | Object detecting device and sensor device | |
| JP5116590B2 (en) | Wave number estimation device | |
| JP6339446B2 (en) | Detection device, detection method, and program | |
| JP5730083B2 (en) | Signal processing device, exploration device, signal processing program, and signal processing method | |
| JP5424572B2 (en) | Radar equipment | |
| JP6321472B2 (en) | Signal processing device, underwater detection device, radar device, signal processing method, and signal processing program | |
| JP5423713B2 (en) | Active sonar device and signal processing method thereof | |
| JP4533813B2 (en) | Target detection device | |
| US12076192B2 (en) | Ultrasound imaging device, signal processing device, and signal processing method | |
| JP4275425B2 (en) | Radar equipment | |
| Dixit et al. | Detection and localization of targets using millimeter wave radars: An experimental study | |
| JP6132576B2 (en) | Signal processing apparatus, radar apparatus, and signal processing method | |
| JP2012112922A (en) | Detection device, and device, method and program for hydrospace detection | |
| JP2015175776A (en) | Detection device, underwater detection device, detection method, and detection program | |
| JP2014020906A (en) | Signal processor, underwater searching device, signal processing method, and program |
Legal Events
| Date | Code | Title | Description |
|---|---|---|---|
| PUAI | Public reference made under article 153(3) epc to a published international application that has entered the european phase |
Free format text: ORIGINAL CODE: 0009012 |
|
| AK | Designated contracting states |
Kind code of ref document: A1 Designated state(s): AL AT BE BG CH CY CZ DE DK EE ES FI FR GB GR HR HU IE IS IT LI LT LU LV MC MK MT NL NO PL PT RO RS SE SI SK SM TR |
|
| AX | Request for extension of the european patent |
Extension state: BA ME |
|
| 17P | Request for examination filed |
Effective date: 20160601 |
|
| RBV | Designated contracting states (corrected) |
Designated state(s): AL AT BE BG CH CY CZ DE DK EE ES FI FR GB GR HR HU IE IS IT LI LT LU LV MC MK MT NL NO PL PT RO RS SE SI SK SM TR |
|
| GRAP | Despatch of communication of intention to grant a patent |
Free format text: ORIGINAL CODE: EPIDOSNIGR1 |
|
| STAA | Information on the status of an ep patent application or granted ep patent |
Free format text: STATUS: GRANT OF PATENT IS INTENDED |
|
| RIC1 | Information provided on ipc code assigned before grant |
Ipc: G01S 7/292 20060101ALI20170609BHEP Ipc: G01S 15/96 20060101AFI20170609BHEP Ipc: G01S 15/89 20060101ALI20170609BHEP Ipc: G01S 3/80 20060101ALI20170609BHEP Ipc: G01S 7/527 20060101ALI20170609BHEP |
|
| INTG | Intention to grant announced |
Effective date: 20170627 |
|
| GRAS | Grant fee paid |
Free format text: ORIGINAL CODE: EPIDOSNIGR3 |
|
| GRAA | (expected) grant |
Free format text: ORIGINAL CODE: 0009210 |
|
| STAA | Information on the status of an ep patent application or granted ep patent |
Free format text: STATUS: THE PATENT HAS BEEN GRANTED |
|
| AK | Designated contracting states |
Kind code of ref document: B1 Designated state(s): AL AT BE BG CH CY CZ DE DK EE ES FI FR GB GR HR HU IE IS IT LI LT LU LV MC MK MT NL NO PL PT RO RS SE SI SK SM TR |
|
| RIN1 | Information on inventor provided before grant (corrected) |
Inventor name: KOZUKI, KOHEI |
|
| REG | Reference to a national code |
Ref country code: CH Ref legal event code: EP |
|
| REG | Reference to a national code |
Ref country code: AT Ref legal event code: REF Ref document number: 950892 Country of ref document: AT Kind code of ref document: T Effective date: 20171215 |
|
| REG | Reference to a national code |
Ref country code: IE Ref legal event code: FG4D |
|
| REG | Reference to a national code |
Ref country code: DE Ref legal event code: R096 Ref document number: 602015006282 Country of ref document: DE |
|
| REG | Reference to a national code |
Ref country code: NL Ref legal event code: MP Effective date: 20171129 |
|
| REG | Reference to a national code |
Ref country code: LT Ref legal event code: MG4D |
|
| REG | Reference to a national code |
Ref country code: AT Ref legal event code: MK05 Ref document number: 950892 Country of ref document: AT Kind code of ref document: T Effective date: 20171129 |
|
| PG25 | Lapsed in a contracting state [announced via postgrant information from national office to epo] |
Ref country code: NO Free format text: LAPSE BECAUSE OF FAILURE TO SUBMIT A TRANSLATION OF THE DESCRIPTION OR TO PAY THE FEE WITHIN THE PRESCRIBED TIME-LIMIT Effective date: 20180228 Ref country code: SE Free format text: LAPSE BECAUSE OF FAILURE TO SUBMIT A TRANSLATION OF THE DESCRIPTION OR TO PAY THE FEE WITHIN THE PRESCRIBED TIME-LIMIT Effective date: 20171129 Ref country code: ES Free format text: LAPSE BECAUSE OF FAILURE TO SUBMIT A TRANSLATION OF THE DESCRIPTION OR TO PAY THE FEE WITHIN THE PRESCRIBED TIME-LIMIT Effective date: 20171129 Ref country code: LT Free format text: LAPSE BECAUSE OF FAILURE TO SUBMIT A TRANSLATION OF THE DESCRIPTION OR TO PAY THE FEE WITHIN THE PRESCRIBED TIME-LIMIT Effective date: 20171129 Ref country code: FI Free format text: LAPSE BECAUSE OF FAILURE TO SUBMIT A TRANSLATION OF THE DESCRIPTION OR TO PAY THE FEE WITHIN THE PRESCRIBED TIME-LIMIT Effective date: 20171129 |
|
| REG | Reference to a national code |
Ref country code: FR Ref legal event code: PLFP Year of fee payment: 4 |
|
| PG25 | Lapsed in a contracting state [announced via postgrant information from national office to epo] |
Ref country code: AT Free format text: LAPSE BECAUSE OF FAILURE TO SUBMIT A TRANSLATION OF THE DESCRIPTION OR TO PAY THE FEE WITHIN THE PRESCRIBED TIME-LIMIT Effective date: 20171129 Ref country code: BG Free format text: LAPSE BECAUSE OF FAILURE TO SUBMIT A TRANSLATION OF THE DESCRIPTION OR TO PAY THE FEE WITHIN THE PRESCRIBED TIME-LIMIT Effective date: 20180228 Ref country code: HR Free format text: LAPSE BECAUSE OF FAILURE TO SUBMIT A TRANSLATION OF THE DESCRIPTION OR TO PAY THE FEE WITHIN THE PRESCRIBED TIME-LIMIT Effective date: 20171129 Ref country code: LV Free format text: LAPSE BECAUSE OF FAILURE TO SUBMIT A TRANSLATION OF THE DESCRIPTION OR TO PAY THE FEE WITHIN THE PRESCRIBED TIME-LIMIT Effective date: 20171129 Ref country code: GR Free format text: LAPSE BECAUSE OF FAILURE TO SUBMIT A TRANSLATION OF THE DESCRIPTION OR TO PAY THE FEE WITHIN THE PRESCRIBED TIME-LIMIT Effective date: 20180301 Ref country code: RS Free format text: LAPSE BECAUSE OF FAILURE TO SUBMIT A TRANSLATION OF THE DESCRIPTION OR TO PAY THE FEE WITHIN THE PRESCRIBED TIME-LIMIT Effective date: 20171129 |
|
| PG25 | Lapsed in a contracting state [announced via postgrant information from national office to epo] |
Ref country code: NL Free format text: LAPSE BECAUSE OF FAILURE TO SUBMIT A TRANSLATION OF THE DESCRIPTION OR TO PAY THE FEE WITHIN THE PRESCRIBED TIME-LIMIT Effective date: 20171129 |
|
| PG25 | Lapsed in a contracting state [announced via postgrant information from national office to epo] |
Ref country code: CZ Free format text: LAPSE BECAUSE OF FAILURE TO SUBMIT A TRANSLATION OF THE DESCRIPTION OR TO PAY THE FEE WITHIN THE PRESCRIBED TIME-LIMIT Effective date: 20171129 Ref country code: SK Free format text: LAPSE BECAUSE OF FAILURE TO SUBMIT A TRANSLATION OF THE DESCRIPTION OR TO PAY THE FEE WITHIN THE PRESCRIBED TIME-LIMIT Effective date: 20171129 Ref country code: DK Free format text: LAPSE BECAUSE OF FAILURE TO SUBMIT A TRANSLATION OF THE DESCRIPTION OR TO PAY THE FEE WITHIN THE PRESCRIBED TIME-LIMIT Effective date: 20171129 Ref country code: EE Free format text: LAPSE BECAUSE OF FAILURE TO SUBMIT A TRANSLATION OF THE DESCRIPTION OR TO PAY THE FEE WITHIN THE PRESCRIBED TIME-LIMIT Effective date: 20171129 Ref country code: CY Free format text: LAPSE BECAUSE OF FAILURE TO SUBMIT A TRANSLATION OF THE DESCRIPTION OR TO PAY THE FEE WITHIN THE PRESCRIBED TIME-LIMIT Effective date: 20171129 |
|
| REG | Reference to a national code |
Ref country code: DE Ref legal event code: R097 Ref document number: 602015006282 Country of ref document: DE |
|
| PG25 | Lapsed in a contracting state [announced via postgrant information from national office to epo] |
Ref country code: RO Free format text: LAPSE BECAUSE OF FAILURE TO SUBMIT A TRANSLATION OF THE DESCRIPTION OR TO PAY THE FEE WITHIN THE PRESCRIBED TIME-LIMIT Effective date: 20171129 Ref country code: IT Free format text: LAPSE BECAUSE OF FAILURE TO SUBMIT A TRANSLATION OF THE DESCRIPTION OR TO PAY THE FEE WITHIN THE PRESCRIBED TIME-LIMIT Effective date: 20171129 Ref country code: SM Free format text: LAPSE BECAUSE OF FAILURE TO SUBMIT A TRANSLATION OF THE DESCRIPTION OR TO PAY THE FEE WITHIN THE PRESCRIBED TIME-LIMIT Effective date: 20171129 Ref country code: PL Free format text: LAPSE BECAUSE OF FAILURE TO SUBMIT A TRANSLATION OF THE DESCRIPTION OR TO PAY THE FEE WITHIN THE PRESCRIBED TIME-LIMIT Effective date: 20171129 |
|
| PLBE | No opposition filed within time limit |
Free format text: ORIGINAL CODE: 0009261 |
|
| STAA | Information on the status of an ep patent application or granted ep patent |
Free format text: STATUS: NO OPPOSITION FILED WITHIN TIME LIMIT |
|
| 26N | No opposition filed |
Effective date: 20180830 |
|
| PG25 | Lapsed in a contracting state [announced via postgrant information from national office to epo] |
Ref country code: SI Free format text: LAPSE BECAUSE OF FAILURE TO SUBMIT A TRANSLATION OF THE DESCRIPTION OR TO PAY THE FEE WITHIN THE PRESCRIBED TIME-LIMIT Effective date: 20171129 |
|
| REG | Reference to a national code |
Ref country code: DE Ref legal event code: R119 Ref document number: 602015006282 Country of ref document: DE |
|
| REG | Reference to a national code |
Ref country code: CH Ref legal event code: PL |
|
| REG | Reference to a national code |
Ref country code: BE Ref legal event code: MM Effective date: 20180630 |
|
| PG25 | Lapsed in a contracting state [announced via postgrant information from national office to epo] |
Ref country code: MC Free format text: LAPSE BECAUSE OF FAILURE TO SUBMIT A TRANSLATION OF THE DESCRIPTION OR TO PAY THE FEE WITHIN THE PRESCRIBED TIME-LIMIT Effective date: 20171129 Ref country code: LU Free format text: LAPSE BECAUSE OF NON-PAYMENT OF DUE FEES Effective date: 20180629 |
|
| REG | Reference to a national code |
Ref country code: IE Ref legal event code: MM4A |
|
| PG25 | Lapsed in a contracting state [announced via postgrant information from national office to epo] |
Ref country code: CH Free format text: LAPSE BECAUSE OF NON-PAYMENT OF DUE FEES Effective date: 20180630 Ref country code: IE Free format text: LAPSE BECAUSE OF NON-PAYMENT OF DUE FEES Effective date: 20180629 Ref country code: DE Free format text: LAPSE BECAUSE OF NON-PAYMENT OF DUE FEES Effective date: 20190101 Ref country code: LI Free format text: LAPSE BECAUSE OF NON-PAYMENT OF DUE FEES Effective date: 20180630 |
|
| PG25 | Lapsed in a contracting state [announced via postgrant information from national office to epo] |
Ref country code: BE Free format text: LAPSE BECAUSE OF NON-PAYMENT OF DUE FEES Effective date: 20180630 |
|
| PG25 | Lapsed in a contracting state [announced via postgrant information from national office to epo] |
Ref country code: MT Free format text: LAPSE BECAUSE OF NON-PAYMENT OF DUE FEES Effective date: 20180629 |
|
| PG25 | Lapsed in a contracting state [announced via postgrant information from national office to epo] |
Ref country code: TR Free format text: LAPSE BECAUSE OF FAILURE TO SUBMIT A TRANSLATION OF THE DESCRIPTION OR TO PAY THE FEE WITHIN THE PRESCRIBED TIME-LIMIT Effective date: 20171129 |
|
| PG25 | Lapsed in a contracting state [announced via postgrant information from national office to epo] |
Ref country code: PT Free format text: LAPSE BECAUSE OF FAILURE TO SUBMIT A TRANSLATION OF THE DESCRIPTION OR TO PAY THE FEE WITHIN THE PRESCRIBED TIME-LIMIT Effective date: 20171129 |
|
| PG25 | Lapsed in a contracting state [announced via postgrant information from national office to epo] |
Ref country code: HU Free format text: LAPSE BECAUSE OF FAILURE TO SUBMIT A TRANSLATION OF THE DESCRIPTION OR TO PAY THE FEE WITHIN THE PRESCRIBED TIME-LIMIT; INVALID AB INITIO Effective date: 20150629 Ref country code: MK Free format text: LAPSE BECAUSE OF NON-PAYMENT OF DUE FEES Effective date: 20171129 |
|
| PG25 | Lapsed in a contracting state [announced via postgrant information from national office to epo] |
Ref country code: AL Free format text: LAPSE BECAUSE OF FAILURE TO SUBMIT A TRANSLATION OF THE DESCRIPTION OR TO PAY THE FEE WITHIN THE PRESCRIBED TIME-LIMIT Effective date: 20171129 Ref country code: IS Free format text: LAPSE BECAUSE OF FAILURE TO SUBMIT A TRANSLATION OF THE DESCRIPTION OR TO PAY THE FEE WITHIN THE PRESCRIBED TIME-LIMIT Effective date: 20180329 |
|
| P01 | Opt-out of the competence of the unified patent court (upc) registered |
Effective date: 20230523 |
|
| PGFP | Annual fee paid to national office [announced via postgrant information from national office to epo] |
Ref country code: FR Payment date: 20230510 Year of fee payment: 9 |
|
| PGFP | Annual fee paid to national office [announced via postgrant information from national office to epo] |
Ref country code: GB Payment date: 20230511 Year of fee payment: 9 |
|
| GBPC | Gb: european patent ceased through non-payment of renewal fee |
Effective date: 20240629 |