EP2367850B1 - Human anti tshr antibodies - Google Patents
Human anti tshr antibodies Download PDFInfo
- Publication number
- EP2367850B1 EP2367850B1 EP09795799.7A EP09795799A EP2367850B1 EP 2367850 B1 EP2367850 B1 EP 2367850B1 EP 09795799 A EP09795799 A EP 09795799A EP 2367850 B1 EP2367850 B1 EP 2367850B1
- Authority
- EP
- European Patent Office
- Prior art keywords
- igg
- tshr
- tsh
- binding
- serum
- Prior art date
- Legal status (The legal status is an assumption and is not a legal conclusion. Google has not performed a legal analysis and makes no representation as to the accuracy of the status listed.)
- Active
Links
Images


Classifications
-
- C—CHEMISTRY; METALLURGY
- C07—ORGANIC CHEMISTRY
- C07K—PEPTIDES
- C07K16/00—Immunoglobulins [IGs], e.g. monoclonal or polyclonal antibodies
- C07K16/18—Immunoglobulins [IGs], e.g. monoclonal or polyclonal antibodies against material from animals or humans
- C07K16/28—Immunoglobulins [IGs], e.g. monoclonal or polyclonal antibodies against material from animals or humans against receptors, cell surface antigens or cell surface determinants
- C07K16/2869—Immunoglobulins [IGs], e.g. monoclonal or polyclonal antibodies against material from animals or humans against receptors, cell surface antigens or cell surface determinants against hormone receptors
-
- A—HUMAN NECESSITIES
- A61—MEDICAL OR VETERINARY SCIENCE; HYGIENE
- A61P—SPECIFIC THERAPEUTIC ACTIVITY OF CHEMICAL COMPOUNDS OR MEDICINAL PREPARATIONS
- A61P35/00—Antineoplastic agents
-
- A—HUMAN NECESSITIES
- A61—MEDICAL OR VETERINARY SCIENCE; HYGIENE
- A61P—SPECIFIC THERAPEUTIC ACTIVITY OF CHEMICAL COMPOUNDS OR MEDICINAL PREPARATIONS
- A61P35/00—Antineoplastic agents
- A61P35/04—Antineoplastic agents specific for metastasis
-
- A—HUMAN NECESSITIES
- A61—MEDICAL OR VETERINARY SCIENCE; HYGIENE
- A61P—SPECIFIC THERAPEUTIC ACTIVITY OF CHEMICAL COMPOUNDS OR MEDICINAL PREPARATIONS
- A61P43/00—Drugs for specific purposes, not provided for in groups A61P1/00-A61P41/00
-
- A—HUMAN NECESSITIES
- A61—MEDICAL OR VETERINARY SCIENCE; HYGIENE
- A61P—SPECIFIC THERAPEUTIC ACTIVITY OF CHEMICAL COMPOUNDS OR MEDICINAL PREPARATIONS
- A61P5/00—Drugs for disorders of the endocrine system
- A61P5/06—Drugs for disorders of the endocrine system of the anterior pituitary hormones, e.g. TSH, ACTH, FSH, LH, PRL, GH
-
- A—HUMAN NECESSITIES
- A61—MEDICAL OR VETERINARY SCIENCE; HYGIENE
- A61P—SPECIFIC THERAPEUTIC ACTIVITY OF CHEMICAL COMPOUNDS OR MEDICINAL PREPARATIONS
- A61P5/00—Drugs for disorders of the endocrine system
- A61P5/14—Drugs for disorders of the endocrine system of the thyroid hormones, e.g. T3, T4
-
- C—CHEMISTRY; METALLURGY
- C07—ORGANIC CHEMISTRY
- C07K—PEPTIDES
- C07K16/00—Immunoglobulins [IGs], e.g. monoclonal or polyclonal antibodies
- C07K16/18—Immunoglobulins [IGs], e.g. monoclonal or polyclonal antibodies against material from animals or humans
- C07K16/28—Immunoglobulins [IGs], e.g. monoclonal or polyclonal antibodies against material from animals or humans against receptors, cell surface antigens or cell surface determinants
-
- A—HUMAN NECESSITIES
- A61—MEDICAL OR VETERINARY SCIENCE; HYGIENE
- A61K—PREPARATIONS FOR MEDICAL, DENTAL OR TOILETRY PURPOSES
- A61K39/00—Medicinal preparations containing antigens or antibodies
- A61K2039/505—Medicinal preparations containing antigens or antibodies comprising antibodies
-
- C—CHEMISTRY; METALLURGY
- C07—ORGANIC CHEMISTRY
- C07K—PEPTIDES
- C07K2299/00—Coordinates from 3D structures of peptides, e.g. proteins or enzymes
-
- C—CHEMISTRY; METALLURGY
- C07—ORGANIC CHEMISTRY
- C07K—PEPTIDES
- C07K2317/00—Immunoglobulins specific features
- C07K2317/20—Immunoglobulins specific features characterized by taxonomic origin
- C07K2317/21—Immunoglobulins specific features characterized by taxonomic origin from primates, e.g. man
-
- C—CHEMISTRY; METALLURGY
- C07—ORGANIC CHEMISTRY
- C07K—PEPTIDES
- C07K2317/00—Immunoglobulins specific features
- C07K2317/20—Immunoglobulins specific features characterized by taxonomic origin
- C07K2317/24—Immunoglobulins specific features characterized by taxonomic origin containing regions, domains or residues from different species, e.g. chimeric, humanized or veneered
-
- C—CHEMISTRY; METALLURGY
- C07—ORGANIC CHEMISTRY
- C07K—PEPTIDES
- C07K2317/00—Immunoglobulins specific features
- C07K2317/50—Immunoglobulins specific features characterized by immunoglobulin fragments
- C07K2317/55—Fab or Fab'
-
- C—CHEMISTRY; METALLURGY
- C07—ORGANIC CHEMISTRY
- C07K—PEPTIDES
- C07K2317/00—Immunoglobulins specific features
- C07K2317/50—Immunoglobulins specific features characterized by immunoglobulin fragments
- C07K2317/56—Immunoglobulins specific features characterized by immunoglobulin fragments variable (Fv) region, i.e. VH and/or VL
- C07K2317/565—Complementarity determining region [CDR]
-
- C—CHEMISTRY; METALLURGY
- C07—ORGANIC CHEMISTRY
- C07K—PEPTIDES
- C07K2317/00—Immunoglobulins specific features
- C07K2317/70—Immunoglobulins specific features characterized by effect upon binding to a cell or to an antigen
- C07K2317/75—Agonist effect on antigen
-
- C—CHEMISTRY; METALLURGY
- C07—ORGANIC CHEMISTRY
- C07K—PEPTIDES
- C07K2317/00—Immunoglobulins specific features
- C07K2317/70—Immunoglobulins specific features characterized by effect upon binding to a cell or to an antigen
- C07K2317/76—Antagonist effect on antigen, e.g. neutralization or inhibition of binding
-
- C—CHEMISTRY; METALLURGY
- C07—ORGANIC CHEMISTRY
- C07K—PEPTIDES
- C07K2317/00—Immunoglobulins specific features
- C07K2317/90—Immunoglobulins specific features characterized by (pharmaco)kinetic aspects or by stability of the immunoglobulin
- C07K2317/92—Affinity (KD), association rate (Ka), dissociation rate (Kd) or EC50 value
Definitions
- the present invention relates to human monoclonal autoantibodies (MAbs) reactive with the thyroid stimulating hormone (TSH) receptor (TSHR).
- TSH thyroid stimulating hormone
- One of the human MAbs (K1-18) has the ability to bind to the TSHR and to stimulate TSHR cyclic AMP activity.
- the other human MAb (K1-70) has the ability to bind to the TSHR and to block stimulation of cyclic AMP mediated by TSH and TSHR stimulating antibodies.
- Both human MAbs were isolated from the peripheral lymphocytes of a patient who presented with clinical symptoms of hypothyroidism.
- Thyroid function is regulated by TSH secreted by the pituitary ( Szkudlinski MW, et al 2002. Physiological Reviews 82: 473-502 ).
- TSH binds to the TSHR on the surface of thyrocytes and this is the first step in initiating the TSHR signalling cascade. Binding of TSH to the TSHR leads to stimulation of formation and release of thyroid hormones; thyroxine (T4) and tri-iodothyronine (T3).
- TSHR thyrotropin releasing hormone
- TSHR autoantibodies There are two main types of TSHR autoantibodies (TRAbs); a stimulating type and a blocking type. Thyroid stimulating type autoantibodies bind to the TSHR and mimic the actions of TSH thereby stimulating the thyroid to produce high levels of T4 and T3; these autoantibodies are also described as TRAbs with stimulating activity or TSH agonist activity ( Rees Smith B, et al 2007. Thyroid 17: 923-938 ).
- the feedback control mechanism of thyroid function is no longer effective in the presence of thyroid stimulating autoantibodies and patients present with the clinical symptoms of a hyperactive thyroid characterised by an excess of thyroid hormones in serum and its metabolic consequences. This condition is known as Graves' disease.
- TRAbs with stimulating activity may also interact with the TSHRs in retroorbital tissue and contribute to the development of the eye signs of Graves' disease.
- a human monoclonal autoantibody which acts as a powerful thyroid stimulator (hMAb TSHR1; also referred to as M22) has been described in detail in WO 2004/050708A2 .
- the structure of the complex of M22 Fab bound to the TSHR LRD has been solved by x-ray crystallography at 2.55 A resolution as described in WO2008/025991A1 .
- Analysis of the structure of the TSHR - M22 complex provides detailed information about the receptor residues and the stimulating autoantibody residues involved in interactions with each other.
- M22 has been used in ELISA for TSHR antibody measurement ( Zöphel, K et al, Clinica Chimica Acta 2009 and Zöphel, K et al, Clinica Chimica Acta 2008 .
- Blocking type TRAbs occur less frequently in patients with AITD than stimulating autoantibodies.
- Blocking type autoantibodies bind to the TSHR, prevent TSH from binding to the receptor but have no ability to stimulate TSHR activity. Consequently formation and secretion of thyroid hormones (T4 and T3) is greatly reduced and the patients with this type of TRAb can present with clinical symptoms of an under-active thyroid (hypothyroidism).
- Blocking type autoantibodies are known as TRAbs with blocking activity or TSH antagonist activity (Rees Smith B, et al 1988 supra and Rees Smith B, 2007 et al supra ).
- TRAbs with blocking activity when present in serum of pregnant women cross the placenta and may block the TSHRs in the foetal thyroid leading to neonatal hypothyroidism and serious consequences for development. Furthermore, TRAbs with blocking activity can be found in breast milk of affected mothers and may cause clinical hypothyroidism in the baby ( Evans C, et al 2004 European Journal of Endocrinology 150: 265-268 ).
- a human autoantibody to the TSHR with TSH antagonist activity (5C9) has been described in detail in WO 2008/099185A1 . Clinical symptoms in patients with AITD and circulating TRAbs are related to the effect of autoantibodies on TSHR activity i.e. whether the TRAbs cause stimulation or blocking.
- the concentrations and/or activities of stimulating or blocking TRAb may vary in the same patient during the course of the disease and indeed fluctuation of symptoms from hypo- to hyperthyroidism in the same patient over time has been reported (Rees Smith B et al 1988 supra ; Furmaniak J and Rees Smith B 1993 supra and Schott M et al 2005 supra ).
- attempts to separate the TRAbs with different bioactivity or to differentiate between these TRAbs in serum samples using currently available bioassays is difficult.
- the invention described in WO2006/016121A1 provides a means to discriminate between stimulating and blocking types of TRAbs using bioassays that employ TSHR mutated at R255.
- Human recombinant TSH (Thyrogen ® ) is a preparation of human TSH produced under cGMP regulations as a recombinant protein and approved by the US FDA as an aid in the diagnosis of residual or recurrent thyroid cancer ( Duntas LH, Cooper DS 2008 Thyroid 18: 509-516 ).
- Monitoring of thyroid cancer patients after treatment includes stimulation of thyroid remnants or metastases with recombinant human TSH followed by a thyroid scan and/or measurement of serum thyroglobulin levels (Duntas LH and Cooper DS 2008 supra ).
- Human chorionic gonadotropin is a hormone produced during pregnancy which has mild thyroid stimulating effects ( Grossmann M et al 1997 Endocrine Reviews 18: 476-501 ).
- Characterisation of stimulating or blocking types of TRAbs and how they interact with the TSHR is of critical importance for development of improved methods to diagnose and manage different forms of AITD. In addition these studies are critical for developing new strategies for the management of diseases associated with an autoimmune response to the TSHR.
- the availability of potent thyroid stimulators other than recombinant human TSH provides new alternatives for monitoring and managing thyroid cancer patients.
- WO2004/050708A2 provides details of the properties of a human monoclonal autoantibody (MAb) with powerful stimulating activity and its interaction with the TSHR.
- MAb monoclonal autoantibody
- M22 monoclonal autoantibody
- TSHR LRD X-ray diffraction analysis
- WO2006/016121A1 discloses a mutated TSHR preparation including at least one point mutation which can be used in the differential screening and identification of patient serum stimulating TSHR autoantibodies, patient serum blocking TSHR autoantibodies and TSH in a sample of Summary of the Invention body fluid from a patient being screened.
- Generation and characterisation of a mouse MAb (9D33) with TSHR blocking activity is also described in WO2004/050708A2 .
- 9D33 binds to the TSHR with high affinity (2 x 10 10 L/mol) and is an effective antagonist of TSH, hMAb TSHR1 (M22) and patient serum TRAbs with stimulating or blocking activities.
- WO2008/099185A1 discloses the isolation and characterisation of human MAb (5C9) to the TSHR that is an effective antagonist of TSH and of stimulating TRAbs in patient sera.
- 5C9 has been found unexpectedly to inhibit TSHR constitutive activity (also referred to as the TSHR basal activity), that is to say the production of cyclic AMP in a test system in the absence of TSH or M22.
- TSHR basal activity also referred to as the TSHR basal activity
- 5C9 has been found to inhibit TSHR cyclic AMP activity associated with TSHR activating mutations.
- WO2008/091981A2 describes a mouse MAb that has the ability to suppress the constitutive activity of TSHR and the methods of using the MAb to treat thyroid diseases including hyperthyroidism and thyroid cancer.
- the properties of the MAb described in WO2008/091981A2 are also disclosed in Chen CR et al 2007 Endocrinology 148: 2375-2382 .
- Antibodies K1-18 and K1-70 have been isolated from the peripheral blood lymphocytes of a 54 year old female patient with hypothyroidism and high levels of TSHR autoantibodies.
- the patient had an 8 year history of AITD and first presented with hyperthyroidism and responded to treatment with methimazole which continued for 3 years. However, approximately 10 months after reaching the euthyroid state (i.e. having normal function) the patient developed hypothyroidism and was treated with thyroxine. The patient had been hypothyroid for approximately 4.5 years at the time of blood collection.
- serum TRAb levels were 160 Units/L measured by TSH binding inhibition assay.
- the serum also showed an ability to block TSH stimulation of the TSHR (cyclic AMP based assay).
- Serum autoantibodies to thyroid peroxidase were positive at >500 Units/mL (Units are of the reference preparation 66/387 from National Institute for Standards and Control (NIBSC) Potters Bar, UK).
- the patient's lymphocytes were immortalised by infection with Epstein Barr virus (EBV) and supernatants of cultures of the infected cells screened for their ability to inhibit 125 I-TSH binding to TSHR coated tubes.
- EBV Epstein Barr virus
- Cells from positive cell cultures were fused with a mouse/human cell line and screened as above. 2 stable clones secreting TSHR autoantibodies were obtained.
- IgGs were purified from supernatants of the clone cultures and the ability of the 2 MAbs (K1-18 and K1-70) IgGs to bind to the TSHR and influence TSHR activity assessed. In particular, the ability of K1-18 or K1-70 to inhibit TSH binding to the TSHR was studied.
- K1-18 to stimulate the TSHR was also studied and compared to the activity of various other thyroid stimulators.
- K1-70 to inhibit the ability of TSH to stimulate the TSHR was studied and compared to the activities of other TSH antagonists.
- stimulating or blocking patient serum TRAbs to inhibit TSHR binding and biological activity of K1-18 and K1-70 was assessed.
- K1-18 and K1-70 in assays for TSHR antibodies, TSH and related compounds was investigated.
- V region variable region genes of the heavy (HC) and light chains (LC) of K1-18 and K1-70 were sequenced and the complementarity determining regions (CDRs) assigned.
- K1-70 Fab purified preparations of K1-70 Fab were crystallised and analysed using X-ray diffraction methods. These analyses provided molecular level details about the overall structure of K1-70 Fab and the topography of the antigen binding site of K1-70.
- an isolated human antibody molecule which binds to a TSHR and which reduces ligand induced stimulation of said TSHR but has no effect on constitutive activity of said TSHR wherein the isolated human antibody molecule has the characteristic of patient serum TSHR autoantibodies of inhibiting TSH and M22 binding to the TSHR, and wherein the isolated human antibody molecule comprises SEQ ID No: 70 (CDR I), SEQ ID No: 71 (CDR II) and SEQ ID No: 72 (CDR III) and SEQ ID No: 42 or 52 (CDR I), SEQ ID No: 43 or 53 (CDR II) and SEQ ID No: 44 or 54 (CDR III).
- the isolated human antibody molecule or fragment thereof has at least one further characteristic of patient serum TSH receptor autoantibodies selected from having a binding affinity for the TSHR of at least 10 8 L/mol, preferably at least 10 9 L/mol and the ability to cause detectable blocking of ligand-induced TSHR stimulation at an antibody concentration of less than 1 ⁇ g/mL, preferably less than 0.1 ⁇ g/mL.
- the isolated human antibody may be an antagonist of TSH and/or thyroid stimulating autoantibodies and/or of human chorionic gonadotropin.
- the isolated antibody molecule may comprise an antibody VH domain selected from the amino acid sequence of Figure 5b and 5d (SEQ ID No 41 and 51, respectively).
- the isolated antibody molecule may comprise an antibody VH domain consisting preferably of the amino acid sequence of Figure 5b and 5d (SEQ ID No 41 and 51, respectively).
- the isolated antibody molecule may comprise an antibody VL domain selected preferably from an amino acid sequence of Figure 6d (SEQ ID No 69).
- the isolated antibody molecule may comprise an antibody VL domain consisting preferably of an amino acid sequence of Figure 6d (SEQ ID No 69).
- VH domain -in an antibody molecule according to the invention will be arranged with a VL domain to provide a TSHR binding site.
- a VH domain alone may be provided to bind a TSHR.
- antibody molecule and cognate terms, such as “antibody molecules”, used herein in relation to antibody molecules of the invention embraces, according to context, immunoglobulin-based binding moieties such as monoclonal, recombinant, synthetic and polyclonal antibodies, single chain antibodies, multi-specific antibodies and also binding moieties, which may be substituted by the skilled addressee for such immunoglobulin-based binding moieties, such as domain antibodies, diabodies, as well as IgG[Delta]CH2, F(ab') 2 ), Fab, scFv, VL, VH, dsFv, Minibody, Triabody, Tetrabody, (scFv) 2 , scFv-Fc, F(ab') 3 moieties ( Holliger P, et al 1993 Proc Natl Acad Sci USA 90: 6444-6448 .), ( Carter PJ 2006 Nat Rev Immunol 6: 343-357 ). The term also embraces fragments
- thyroid stimulating hormone receptor and "TSHR” refer to full length human TSHR having the amino acid sequence shown in Figure 7a (SEQ ID No 74) or variants or fragments thereof having high homology with such TSHR.
- such variants and fragments Preferably, such variants and fragments have 70 to 99.9% homology with the amino acid sequence shown in Figure 7a (SEQ ID No 74).
- such variants or fragments are at least 70% identical, more preferably at least 80% identical, highly preferably at least 90% identical, particularly preferred at least 95% identical and especially preferred 99.9% identical to that sequence.
- the isolated antibody of the invention may preferably be in the form of a monoclonal antibody, a recombinant antibody or a synthetic antibody.
- CDRs I, II or III from the K1-70 VH or VL domains may be incorporated into a suitable framework.
- Variants of the K1-70 VH and VL domains and their CDRs can be produced by modifications using methods well known to those skilled in the field. Such variants may comprise one or more amino acid sequence variations, including the addition, deletion, substitution or insertion mutations.
- the framework of K1-70 may also be modified in antibody molecules according to the invention.
- an isolated nucleotide encoding an isolated antibody molecule or fragment thereof according to the invention.
- the isolated nucleotide may comprise a nucleotide sequence of 5a (SEQ ID No 37), 5c (SEQ ID No 46) or 6c (SEQ ID No 64).
- a plurality of such nucleotides may be provided, for example in a bacteriophage display library.
- Such bacteriophage display libraries may be used to express a variety of antibody molecules or fragments thereof such as isolated domains.
- the invention also provides a vector including an isolated nucleotide according to the invention, or a host cell including such a vector or a nucleotide according to the invention.
- the vector may be a plasmid, virus or fragment thereof. _Many different types of vectors are known to the skilled addressee.
- the isolated cell may express an antibody according to the invention.
- the isolated cell secretes an antibody according to the invention.
- an isolated cell according to the invention is from a stable hetero-hybridoma cell line.
- composition comprising an isolated antibody molecule according to the invention, and, optionally, a carrier.
- a pharmaceutical composition according to the invention may be suitable for human administration.
- a pharmaceutical composition according to the invention has no significant adverse effect on the immune system of the subject.
- compositions according to the invention are contemplated for pharmaceutical compositions according to the invention.
- a pharmaceutical composition according to the invention for use in the treatment of a thyroid-related condition may be in an injectable format.
- a pharmaceutical composition according to the invention for use in the treatment of ophthalmic Graves' disease is preferably in the form of eye drops.
- Pharmaceutical compositions of this invention comprise an isolated antibody in accordance with the invention, with a pharmaceutically acceptable carrier, adjuvant or vehicle.
- Pharmaceutically acceptable carriers, adjuvants and vehicles that may be used in the pharmaceutical compositions of this invention include, but are not limited to, ion exchangers, alumina, aluminium stearate, lecithin, serum proteins, such as human serum albumin, buffer substances such as phosphates, glycine, sorbic acid, potassium sorbate, partial glyceride mixtures of saturated vegetable fatty acids, water, salts or electrolytes, such as protamine sulphate, disodium hydrogen phosphate, potassium hydrogen phosphate, sodium chloride, zinc salts, colloidal silica, magnesium trisilicate, polyvinyl pyrrolidone, cellulose-based substances, polyethylene glycol, sodium carboxymethylcellulose, polyacrylates, waxes, polyethylene- polyoxypropylene-block polymers, polyethylene glycol and wool fat.
- ion exchangers alumina, aluminium stearate, lecithin
- serum proteins such as human serum albumin
- buffer substances such as phosphat
- compositions of the invention may be administered orally, parenterally, by inhalation spray, topically, by eyedrops, rectally, nasally, buccally, vaginally or via an implanted reservoir.
- parenteral as used herein includes subcutaneous, intracutaneous, intravenous, intramuscular, intra-articular, intrasynovial, intrastemal, intrathecal, intralesional and intracranial injection or infusion techniques.
- the pharmaceutical compositions may be in the form of a sterile injectable preparation, for example, as a sterile injectable aqueous or oleaginous suspension.
- This suspension may be formulated according to techniques known in the art using suitable dispersing or wetting agents (such as, for example, Tween 80) and suspending agents.
- the sterile injectable preparation may also be a sterile injectable solution or suspension in a non-toxic parenterally- acceptable diluent or solvent, for example, as a solution in 1,3-butanediol.
- suitable vehicles and solvents that may be employed are mannitol, water, Ringer's solution and isotonic sodium chloride solution.
- sterile, fixed oils are conventionally employed as a solvent or suspending medium.
- any bland fixed oil may be employed including synthetic mono- or diglycerides.
- Fatty acids such as oleic acid and its glyceride derivatives are useful in the preparation of injectables, as are natural pharmaceutically-acceptable oils, such as olive oil or castor oil, especially in their polyoxyethylated versions. These oil solutions or suspensions may also contain a long-chain alcohol diluent or dispersant such as Ph. Helv or a similar alcohol.
- the pharmaceutical compositions of this invention may be orally administered in any orally acceptable dosage form including, but not limited to, capsules, tablets, and aqueous suspensions and solutions. In the case of tablets for oral use, carriers which are commonly used include lactose and corn starch. Lubricating agents, such as magnesium stearate, are also typically added.
- useful diluents include lactose and dried com starch.
- the active ingredient is combined with emulsifying and suspending agents.
- certain sweetening and/or flavouring and/or colouring agents may be added.
- the pharmaceutical compositions of this invention may also be provided in the form of suppositories for rectal administration. These compositions can be prepared by mixing a compound of this invention with a suitable non-irritating excipient which is solid at room temperature but liquid at the rectal temperature and therefore will melt in the rectum to release the active components.
- suitable non-irritating excipient include, but are not limited to, cocoa butter, beeswax and polyethylene glycols.
- Topical administration of the pharmaceutical compositions of this invention is especially useful when the desired treatment involves areas or organs readily accessible by topical application.
- the pharmaceutical composition should be formulated with a suitable ointment containing the active components suspended or dissolved in a carrier.
- Carriers for topical administration of the compounds of this invention include, but are not limited to, mineral oil, liquid petroleum, white petroleum, propylene glycol, polyoxyethylene polyoxypropylene compound, emulsifying wax and water.
- the pharmaceutical composition can be formulated with a suitable lotion or cream containing the active compound suspended or dissolved in a carrier.
- Suitable carriers include, but are not limited to, mineral oil, sorbitan monostearate, polysorbate 60, cetyl esters wax, cetearyl alcohol, 2-octyldodecanol, benzyl alcohol and water.
- the pharmaceutical compositions of this invention may also be topically applied to the lower intestinal tract by rectal suppository formulation or in a suitable enema formulation. Topically-transdermal patches are also included in this invention.
- the pharmaceutical compositions of this invention may be administered by nasal aerosol or inhalation.
- compositions are prepared according to techniques well-known in the art of pharmaceutical formulation and may be prepared as solutions in saline, employing benzyl alcohol or other suitable preservatives, absorption promoters to enhance bioavailability, fluorocarbons, and/or other solubilising or dispersing agents known in the art.
- Antibodies according to the first mentioned aspect of the invention have potential applications for management and control of conditions associated with TSHR activation for example: Graves' disease, Graves' opthalmopathy or hyperthyroidism due to abnormal levels of TSH or hCG.
- an isolated antibody molecule or a pharmaceutical composition according to the invention in therapy.
- the invention also provides an isolated antibody molecule or a pharmaceutical composition according to the invention for use in therapy.
- an in vitro method of characterising the activity of TSHR antibodies, TSH or human chorionic gonadotropin comprising a step including the use of an isolated antibody molecule according to the invention.
- an in vitro diagnostic method for detecting an analyte autoantibodies to the TSHR comprising contacting a sample, which has been isolated from a subject believed to contain such analyte autoantibodies, and an antibody molecule of the invention with a TSHR or a fragment thereof.
- the TSHR or fragment thereof may be mutated at arginine 255 so that it interacts preferentially with analyte blocking-type TSHR antibodies compared to analyte stimulating-type TSHR antibodies.
- Analyte binding to TSHR260 or TSHR260 mutated at arginine 255 may be detected by inhibition of binding of a directly or indirectly labelled TSHR antibody or fragment thereof to said TSHR260 or TSHR260 mutated at arginine 255.
- a suitable detectable label that can be employed in a method according to the present invention can be selected from the group consisting of enzymic labels, isotopic labels, chemiluminescent labels, fluorescent, dyes and the like.
- monitoring may therefore comprise measuring radioactivity dependent on binding of an antibody molecule according to the present invention. Radioactivity is generally measured using a gamma counter, or liquid scintillation counter.
- the present invention may provides new and/or improved means to:
- the monoclonal autoantibodies K1-18 and K1-70 were isolated using the procedure described in WO2004/050708A2 .
- Lymphocytes were isolated from a blood sample collected from a patient with an 8 year clinical history of AITD and high levels of TRAbs. Patient consent and Local Ethical Committee approval were obtained. The patient was first diagnosed with hyperthyroidism, reached the euthyroid state after treatment with methimazole, however, approximately 4.5 years prior to blood collection she developed hypothyroidism. At the time of blood collection the patient was being treated with thyroxine (50 ⁇ g daily).
- the lymphocytes were infected with Epstein Barr Virus (EBV) (European Collection of Cell Cultures - ECACC; Porton Down, SP4 0JG, UK) and cultured on mouse macrophage feeder layers as described in WO2004/050708A2 .
- Epstein Barr Virus EBV
- Immortalised lymphocytes secreting TSHR autoantibodies were fused with a mouse/human hybrid cell line K6H6/B5 (ECACC) and cloned four times by limiting dilution to obtain a single colony.
- the presence of TSHR autoantibody in cell culture supernatants at different stages of cloning was detected by inhibition of labelled TSH binding to the TSHR ( WO2004/050708A2 ).
- Two single clones producing the TSHR autoantibodies were expanded and supernatants from the cultures were harvested for autoantibody purification.
- One clone was designated as K1-18 and the other as K1-70.
- TSHR human MAbs IgGs were purified from culture supernatants using protein A affinity chromatography on MabSelect TM (GE Healthcare, UK) as described in Sanders J et at 2004. Thyroid 2004 14: 560-570 ) and purity assessed by SDS-polyacrylamide gel electrophoresis (PAGE).
- the heavy chain isotype was determined using a radial diffusion assay (The Binding Site; Birmingham, B29 6AT, UK), and the light chain isotype was determined by Western biotting with anti-human kappa chain and anti-human lambda chain specific mouse monoclonal antibodies (Sigma-Aldrich Company Ltd, Poole, UK).
- Purified K1-18 IgG was treated with mercuripapain (Sigma Aldrich, Poole, UK) at a IgG/enzyme ratio of 100:1 in phosphate buffered saline (PBS; 137 mmol/L NaCl, 8.1 mmol/L Na 2 HPO 4 , 2.7 mmol/L KCL, 1.47 mmol/L KH 2 PO 4 , pH 7.4 containing cysteine at final concentration of 1 mmol/L and EDTA at final concentration of 2 mmol/L) for 4 hours at 37°C. The reaction was stopped by addition of iodoacetamide (final concentration of 50 mmol/L) for 30 minutes at room temperature.
- PBS phosphate buffered saline
- iodoacetamide final concentration of 50 mmol/L
- the reaction mixture was then passed through a MabSelect column to remove any intact IgG or Fc fragments from the Fab preparation.
- the Fab containing solution was dialysed into PBS containing 3.1 mmol/l NaN 3 and concentrated using a Centriprep concentrator (Millipore, Watford, WD18 8YH, UK) when appropriate.
- K1-70 Fab were obtained using similar method except that an IgG/enzyme ratio of 200:1 was used and the digestion with enzyme was for 1 hour at 37°C. Analysis by SDS-PAGE indicated that intact IgG was undetectable in the Fab preparations.
- IgG preparations were labelled with 125 I as described in Sanders J et al 1999.
- Binding inhibition assays were carried out using TSHR coated tubes as described in WO2004/050708A2 .
- 100 ⁇ L of test sample (MAb preparation, patient serum or unlabelled TSH) and 50 ⁇ L of start buffer (RSR Ltd) were incubated in TSHR coated tubes for 2 hours at room temperature with gentle shaking. After aspiration, the tubes were washed and 100 ⁇ L of 121 I-labelled protein (5 x 10 4 cpm) added and incubated for 1 hour at room temperature with shaking. The tubes were then aspirated, washed and counted in a gamma counter.
- Inhibition of labelled protein binding was calculated as 100 x [1 -(cpm bound in the presence of test material/cpm bound in the presence of control material)].
- MAb preparations used in these experiments were K1-18, K1-70, M22, 5C9, 9D33 described above.
- TSMAbs 1-7 are mouse thyroid stimulating MAbs ( WO 03/01863 and Sanders J et al 2002 supra ).
- Control material was a pool of healthy blood donor sera or individual healthy blood donor sera or other materials as indicated in the results of various experiments.
- a TRAb ELISA based on TSH-biotin binding to TSHR coated ELISA wells was used as described previously ( Bolton J, et al 1999 Clinical Chemistry 45: 2285-2287 ).
- 75 ⁇ L of test sample was added to 75 ⁇ L of start buffer in the plate wells and incubated for 2 hours at room temperature with shaking at about 500 shakes/minute. After washing 100 ⁇ L of TSH-biotin was added and incubation continued for 25 minutes without shaking. The wells were washed again, the reaction developed using described standard procedures and the absorbance of each well read at 450nm.
- TSH-biotin binding was calculated as: 100 x [1 - (test sample absorbance at 450nm/negative control sample absorbance at 450nm)].
- MAb preparations used in these experiments were K1-18, K1-70, M22, 5C9, 9D33 described above.
- TSMAbs 1-7 are mouse thyroid stimulating MAbs ( WO03/01863 and Sanders J, et al 2002 supra).
- Control sample material was a pool of healthy blood donor sera or other materials as indicated in the results of various experiments.
- CHO cells expressing either approximately 5 x 10 4 or approximately 5x10 5 TSHR per cell were seeded into 96-well plates at 3 x 10 4 cells per well, adapted into DMEM (Invitrogen Ltd, Paisley, UK) without foetal calf serum and then test samples (TSH, IgG or patient serum) added (100 ⁇ L diluted in cyclic AMP assay buffer i.e.
- KRH buffer Krebs Ringer Hepes buffer
- Fresh KRH buffer was then added and the cells incubated for 30 minutes at 37°C. The buffer was then removed and replaced with fresh KRH buffer containing test sample. (TSH, MAb preparations, serum samples etc). The next steps were then carried out as described above for the experiments under the hypotonic conditions (i.e. in cyclic AMP assay buffer). In some experiments the effect of various MAbs on the TSHR stimulating activity of various preparations (for example, TSH, human MAbs, patient sera) measured as described above was assessed. This was carried out by comparing (a) the stimulating activity of the sample alone with (b) stimulating activity in the presence of various MAbs.
- K1-70 IgG and other preparations to inhibit the stimulating activity of porcine (p) TSH, native human (h) TSH and recombinant human (rh) TSH, MAb M22, MAb K1-18 and patient serum TRAbs in CHO cells expressing TSHRs was assessed. This was carried out by comparing the stimulatory effect of TSH, M22, K1-18 or TRAbs in the absence and in the presence of K1-70 IgG (or other preparations being tested).
- the assay was carried out as described above except 50 ⁇ L of K1-70 (or other preparations being tested) diluted in cyclic AMP assay buffer was added to the cell wells followed by 50 ⁇ L of TSH or M22 or K1-18 or patient serum (diluted as appropriate in cyclic AMP assay buffer) and incubated and tested as for the stimulating assay described above.
- Other MAbs and sera from patients with blocking type TRAbs were tested in this assay in addition to K1-70.
- the association and dissociation of K1-18 IgG, K1-18 Fab, K1-70 IgG and K1-70 Fab binding to the full length TSHR and the TSHR260 was studied using the method as described in: Nakatake N, et al Thyroid 2006, 16; 1077-1084 .
- the full length TSHR or TSHR260 were coated onto plastic tubes which had been pre-coated with an appropriate mouse MAb to the TSHR.
- 100 ⁇ L of 125 I-labelled IgG or Fab were incubated in the TSHR coated tubes at room temperature for 5-180 min. The tubes were then aspirated, washed with assay buffer and counted in a gamma counter.
- the TSHR 260 construct (coding amino acids 1-260 of the human TSHR; amino acids 1-21 being the leader sequence) was amplified using full length human TSHR as the template ( Oda Y, et al 1998. Journal of Molecular Endocrinology 20: 233-244 ) and joined to the coding sequence of a secreted alkaline phosphatase (minus the 17 amino acid alkaline phosphatase leader sequence) using the cloning vector pSEAP2-basic (Clontech) as the template.
- the second PCR was carried out using the cloning vector pSEAP2-basic amplified with the primersSEQ ID No 79 and SEQ ID No 80 which adds amino acids 254-260 of the TSHR and a 1 amino acid linker (Asparagine) to the N terminus of the secreted alkaline phosphatase and a 6 histidine tag, a stop codon and an Xhol restriction site at the C-terminus of the secreted alkaline phosphatase gene.
- the PCR reactions were carried out for 30 cycles of 1 minute at 94°C, 1 minute at 40°C and 1 minute at 72°C followed by 7 minutes at 72°C.
- PCR products were run on 1% agarose gels and the DNA extracted using a geneclean II kit (Anachem Ltd, Luton) following the manufacturer's instructions. Purified PCR products 1 and 2 were then used to set up a third PCR to construct the whole TSHR 260-alkaline phosphatase gene.
- the PCR 3 reaction contained 200 ng of PCR 1 and 200 ng of PCR 2 product and PCR 3 was carried out for 7 cycles at 94°C for 1.5 minutes, 65°C for 1.5 minutes and 72°C for 1.5 minutes. The temperature was then increased to 94°C again for 2 minutes and primers SEQ ID No 77 and 80 added followed by 30 cycles of 94°C for 1 minute, 52°C for 1 minute and 72°C for 2 minutes.
- PCR 3 product was cloned into pFastBac1 using EcoRI and Xhol restriction sites and the presence of the mutation was verified using sequencing by the Sanger-Coulson method ( Sanger F et al 1997. Proceedings of the National Academy of Sciences of the USA 74: 5463-5467 ).
- Recombinant DNA was made using the Bac to Bac Baculovirus expression system (Invitrogen, UK) and transfected into Sf-9 cells to obtain and amplify recombinant baculovirus stock as described in WO2008/025991A1 .
- TSHR260-AP was expressed in insect cells as described in WO2008/025991A1 .
- TSHR in the form of full length detergent-solubilised receptor expressed in CHO cells was coated onto ELISA plate wells via a C-terminal antibody as described previously (Bolton J et al 1999 supra).
- 75 ⁇ L of start buffer as described for TRAb ELISA; Bolton J.
- test sample patient sera or monoclonal antibodies
- wash buffer 50 mmol/L NaCl, 20 mmol/L Tris pH 7.8, 1% Triton X-100
- TSHR260-AP diluted in wash buffer containing 0.2 g/L MgCl 2 -6H 2 O and 2 g/L BSA
- the second PCR was carried out using the full length TSHR amplified with BGH reverse primer SEQ ID No 83 and the specific primer (SEQ ID No 84), which adds amino acids 298-305 of the TSHR to the N terminus of amino acid 385 of the TSHR.
- the PCR reactions were carried out for 30 cycles of 1 minute at 94°C, 1 minute at 40°C and 2 minutes at 72°C followed by 7 minutes at 72°C.
- the PCR products were run on 1% agarose gels and the DNA extracted using a Geneclean II kit (Anachem Ltd, Luton, UK) following the manufacturer's instructions.
- PCR 3 reaction which contained 200ng of PCR 1 and 200ng of PCR 2 product and PCR 3 was carried out for 7 cycles at 94°C for 1.5 minutes, 65°C for 1.5 minutes and 72°C for 1.5 minutes. The temperature was then increased to 94°C again for 2 minutes and T7 primer (SEQ ID No 81) and BGHR primer (SEQ ID No 83) were added followed by 30 cycles of 94°C for 1 minute, 52°C for 1 minute and 72°C for 2 minutes.
- the PCR 3 product containing TSHR sequence omitting amino acids 306-384 was then run on a 1% agarose gel and the DNA extracted using a Geneclean II kit (Anachem Ltd) following the manufacturer's instructions. Purified PCR3 product was used as the template for construction of the TSHR LRD C-CAP gene in PCR 4.
- the PCR 4 reaction contained 200ng of PCR 3 as template DNA and was amplified with T7 primer (SEQ ID No 81) and the specific primer (SEQ ID No 85) which adds a 6 histidine tag, a stop codon and an Xhol restriction site to the C-terminus of amino acid 409 of the TSHR sequence (1-409 with amino acids 306-384 deleted).
- PCR 4 was carried out for 30 cycles of 1 minute at 94°C, 1 minute at 40°C and 1 minute at 72°C, followed by 10 minutes at 72°C.
- the PCR 4 product was cloned into pFastBac1 using BamHI and Xhol restriction sites and the presence of the mutation was verified using sequencing by the Sanger-Coulson method ( Sanger F. et al 1997. Proceedings of the National Academy of Sciences of the USA 74: 5463-5467 ).
- Recombinant DNA was made using the Bac to Bac Baculovirus expression system (Invitrogen, Paisley, UK) and transfected into Sf-9 cells to obtain and amplify recombinant baculovirus stock as described in WO2008/025991A1 .
- TSHR LRD C-CAP ( Figure 7c ; SEQ ID No 76) was expressed in insect cells using the procedure described in WO2008/025991A1 .
- ELISA plate wells were coated with a F(ab') 2 preparation of the mouse TSHR MAb 14C4 ( Jeffreys J et al 2002, Thyroid 12: 1051-1061 and Sanders J et al2007 Thyroid 17: 395-410 ) at 1 ⁇ g/mL in coating buffer (Bolton J et al 1999 supra ).
- TSHR preparations under investigation were diluted in 20 mmol/L NaCl, 10 mmol/L Tris pH7.8,1% v/v Triton X-100,1g/L BSA, 200mg/L NaN3and 150 ⁇ L added to ELISA plate wells (in quadruplicate).
- the wells were washed and incubated with 75 ⁇ L of assay buffer (50 mmol/L NaCl, 20 mmol/L Tris pH7.8, 1% v/v Triton X-100, 1g/L BSA) and 75 ⁇ L of healthy blood donor serum for 1 hour at room temperature at 500 shakes per minute on an ELISA plate shaker. Thereafter the contents of the wells were emptied, the wells washed and 100 ⁇ L of M22 Fab-peroxidase conjugate (see above) added to each well.
- assay buffer 50 mmol/L NaCl, 20 mmol/L Tris pH7.8, 1% v/v Triton X-100, 1g/L BSA
- variable (V) region genes of K1-18 or K1-70 heavy and light chains were determined as described in WO2004/050708A2 , using total RNA prepared from 1x10 7 hetero-hybridoma cells (secreting K1-18 IgG or K1-70 IgG) to produce mRNA for RT-PCR (reverse transcriptase PCR) reactions.
- IgG1 HC and kappa LC sense and antisense strand oligonucleotide primers designed using the Medical Research Council's V-base (http://vbase.mrc-cpe.cam.ac.uk/) and synthesised by Invitrogen (Paisley, PA4 9RF, UK) were used in RT-PCR reactions with K1-18 mRNA.
- Specific IgG1 HC and lambda LC primers prepared as described above were used in RT-PCR reactions with K1-70 mRNA. The RT reaction was carried out at 50°C for 15 minutes followed by 40 cycles of PCR at 94°C for 15 seconds, 50°C for 30 seconds and 72°C for 30 seconds.
- DNA products were cloned into pUC18 and sequenced by the Sanger-Coulson method (Sanger F, et al 1977 supra). V region sequences were compared with available sequences of human Ig genes using Ig blast (http://www.ncbi.nlm.nih.gov/gblast/). The CDRs were assigned by the method of Kabat ( Kabat E et al 1991 Sequences of proteins of immunological interest (US Public Health service, Bethesda, MD) Fifth editi on) and Ig blast (http://www.ncbi.nlm.nih.gov/igblast/).
- V- region sequences (K1-18 HC, K1-18 LC, K1-70 HC and K1-70 LC) were obtained by RT-PCR from the mRNA followed by cloning and sequencing as described above. In addition the RT-PCR reactions were also carried out using specifically designed PCR primers corresponding to the 5' end of the respective leader sequences for each of the V regions. This allowed the identification of the actual oligonucleotide sequences (and derived amino acid sequences) at the N-termini of the HC and LC V regions of K1-18 and K1-70.
- K1-70 LC protein was analysed by Edman degradation reaction by Alta Bioscience (Birmingham, UK). This was possible after the N-terminal "deblocking" of the K1-70 LC protein preparation with pyroglutamate aminopeptidase.
- Purified K1-70 Fab (10 ⁇ g) was treated with 2.5mU of pyroglutamate aminopeptidase (in 50 mmol/L Na 2 HPO 4 pH 7.0; 10mmol/L dithiothreitol and 1mmol/L EDTA) for 6 hours at 75°C.
- the K1-70 LC sequence obtained in the repeat round of experiments was consistent with the protein sequence of the 2-21 consecutive N-terminal amino acids obtained by Edman reaction ( Figure 6e ; SEQ ID No 73) and the electron density of the LC amino acids in the crystal structure of K1-70 Fab ( Figure 8 ) and consequently concluded as the preferred K1-70 LC sequence ( Figures 6c and 6d ; (SEQ ID No 64 and 69. respectively).
- K1-70 Fab solutions prepared as described above were concentrated to 15.5mg/mL using iCON concentrators (ThermoFisher Scientific, Loughborough, UK) with a 9000Da cut off and stored at -20°C in aliquots. Crystals of K1-70 Fab were grown using the hanging drop method of vapour diffusion using the Structure Screen 1 sparse matrix screen from Molecular Dimensions (Newmarket, UK). Several crystals were obtained in a number of conditions and all were screened to identify the crystal most suitable for the X-ray diffraction analysis at Biofocus DPI (Saffron Walden, UK). A crystal grown in 30% PEG 400, 0.1 M sodium Hepes pH 7.5, 0.2 M magnesium chloride was chosen.
- the K1-70 HC RT-PCR product was cut with Xhol and Spel restriction endonucleases and the K1-70 LC PCR product was cut with Sacl and Xbal restriction endonucleases and both HC and LC cDNAs cloned into the Immunozap H/L vector (Stratagene Europe; Amsterdam, Netherlands) ( Matthews I, et al 2002 Laboratory Investigation 82: 1-11 ) under the control of the IacZ promoter.
- Plasmid DNA was prepared using the Qiagen midi plasmid purification kit (Qiagen Ltd, Crawley, UK) and the presence of K1-70 HC and LC cDNAs confirmed by sequencing using the Sanger-Coulson method (Sanger F, et al 1977 supra ). Plasmid DNA was transformed into the E coli strain HB2151 (GE Life Sciences, Little Chalfont, UK) and grown overnight at 37°C on LB ampicillin (Tryptone 10g/L, Yeast Extract 5g/L, NaCl 10g/L, 100 ⁇ g/mL final concentration ampicillin) agar plates (15g/L agar).
- Precultures (one colony in 3mL LB ampicillin + 1% glucose) were grown overnight at 30°C with shaking. Production of the recombinant Fab is inhibited in the presence of glucose. Precultures after overnight incubation were diluted 1/100 (0.5mL in 50mL LB ampicillin) and grown at 30°C until the OD 600 was 1.2 followed by addition of sucrose (final concentration 0.3mol/L) and culture grown at 30°C until OD 600 returned to 1.2. Thereafter isopropyl- ⁇ -D thiogalactoside (IPTG) was added to a final concentration of 1mmol/L and cultures continued to be incubated for 24 hours at 23°C with shaking.
- IPTG isopropyl- ⁇ -D thiogalactoside
- the cultures were then centrifuged at 3000rpm for 30 minutes at 4°C and the culture supernatants recovered.
- the culture supernatants were filtered through a 0.45 ⁇ m filter and dialysed overnight into PBS (8.1mmol/L Na 2 HPO 4 , 1.5mmol/L KH 2 PO 4 , 2.7mmol/L KCI, 137mmol/L NaCl pH 7.4).
- Culture supernatant from HB2151 cells transformed with K1-70 plasmid (HB2151/K1-70) grown with glucose without IPTG ie non-induced were used as negative controls.
- the culture supernatants were assayed for (a) their ability to inhibit TSH binding to the TSHR and (b) their ability to inhibit TSH mediated stimulation of cyclic AMP production in CHO cells expressing TSHR.
- Lymphocytes (26 x 10 6 ) obtained from 20 mL of patient's blood were infected with EBV and plated out at 1 x 10 6 cells per well in a 48 well plate on feeder layers of mouse macrophages. On day 13 post EBV infection the plate well supernatants were monitored for inhibition of 125 I-TSH binding. Positive clones were tested further for their effects (stimulating or blocking) on the TSHR. Cells from positive wells (positive in any of the assays used) were expanded and fused with the K6H6/B5 hybridoma cell line and plated out in 96 well plates. Two clones stably producing antibodies with 125 I-TSH binding inhibiting activity were obtained and re-cloned 4 times.
- K1-18 One of the clones secreted a human MAb designated as K1-18 that had TSHR stimulating activity.
- K1-18 antibody purified from the hetero-hybridoma culture supernatants was subclass IgG1 with kappa light chains.
- K1-70 antibody purified from hetero-hybridoma culture supernatants was subclass IgG1 with lambda light chains.
- K1-18 or K1-70 IgGs The ability of different concentrations of K1-18 or K1-70 IgGs to inhibit binding of labelled TSH to TSHR coated tubes is shown in Tables 1a and 1b.
- K1-18 IgG diluted in healthy blood donor (HBD) serum showed maximum inhibition of 125 I-TSH binding of approx 95% at 1 ⁇ g/mL concentrations.
- the inhibiting effect of K1-18 IgG at concentrations between 1- 0.001 ⁇ g/mL was dose dependent.
- the inhibiting effect of K1-18 was comparable to the effect of M22 IgG at the same concentrations.
- K1-18 IgG at 1 ⁇ g/mL is a more potent inhibitor of 125 I-TSH binding than 5C9 IgG, TSMAb 1-7 IgGs or 9D33 IgG (Table 1a).
- K1-70 IgG or Fab inhibiting effects on 125 I-TSH binding are shown in Table 1b.
- K1-70 IgG diluted in HBD serum showed dose dependent inhibition ranging from 13.5 ⁇ 2.3% at 0.03 ⁇ g/mL to 95.9 ⁇ 0.8% at 100 ⁇ g/mL.
- the inhibiting effects of K1-70 Fab was comparable to the effects of K1-70 IgG at the same concentrations (Table 1b).
- Tables 1a and 1b also show the effects on 125 I-TSH binding to TSHR coated tubes by K1-18 and K1-70 and different MAbs IgGs diluted in the coated tube assay buffer; in the case of all MAbs except 5C9 these effects were comparable to the results observed when MAbs were diluted in HBD serum.
- Table 2a shows inhibition of 125 I-TSH binding to TSHR coated tubes by different preparations of K1-18, K1 donor serum and K1-donor serum IgG.
- Donor serum at different dilutions also showed dose dependent inhibition of 125 I-TSH binding; 9.1 ⁇ 0.8% inhibition and 1/160 dilution to 81.1 ⁇ 0.4% inhibition at 1/10 dilution.
- the data in Table 2a showed that purified K1-18 IgG was 6600 times more active in terms of inhibition of TSH binding compared to K1 donor serum IgG.
- K1-18 IgG and donor serum IgG were diluted in assay buffer the ability of K1-18 IgG to inhibit TSH binding was 4700 times greater than that of the donor serum IgG (Table 2a).
- Table 2b shows inhibition of 12S I-TSH binding to the TSHR in coated tube assay by different preparations of K1-18 compared to the effect of Thyroid Stimulating Autoantibody reference preparation 90/672 from National Institute for Biological Standards and Control (NIBSC; Potters Bar, UK).
- K1-18 IgG diluted in HBD serum showed 125 I-TSH binding inhibiting activity of 69 NIBSC 90/672 units/mg (mean of activity calculated at three concentrations of K1-18 IgG; 30 ng/mL, 100ng/mL and 300 ng/mL) (Table 2b).
- 125 I-TSH binding inhibiting activity of K1-18 Fab (diluted in serum) calculated in the same experiment was 46 NIBSC 90/672 units/mg (activity at 30 ng/mL, 100 ng/ml and 300 ng/mL of K1-18 Fab was used for the calculations) (Table 2b). This can be compared with M22 IgG 125 I-TSH binding inhibiting activity of 131 NIBSC units/mg (Table 2b). 125 I-TSH binding inhibiting activities of dilutions of donor serum and donor serum IgG compared to the activity of NIBSC 90/672 are shown in Table 2c.
- 125 I-TSH binding inhibiting activity of the donor serum was 0.075 NIBSC 90/672 units/mL (mean of values at 40x and 20x dilutions) and of donor serum IgG diluted in HBD serum was 0.011 units/mg (mean of values at 0.1; 0.3 and 1.0 mg/mL) (Table 2c).
- K1-18 IgG The effects of K1-18 IgG on TSH-biotin binding to TSHR coated ELISA plate wells was studied and compared to the effects of various other MAbs.
- K1-18 IgG diluted in HBD serum had a dose dependent inhibiting effect on TSH-biotin binding with 10.0 ⁇ 0.8% inhibition at 0.01 ⁇ g/mL, essentially maximum inhibition of 96.2 ⁇ 0.2% at 1 ⁇ g/mL and a maximum inhibition plateau at concentrations of 3 ⁇ g/mL and above.
- TSH-biotin binding inhibiting activity of K1-18 IgG at 1 ⁇ g/mL was greater than 5C9 IgG, TSMAb 1-7 IgGs and 9D33 IgG as illustrated by the examples shown in Table 3a.
- K1-18 IgG was tested diluted in ELISA assay buffer (50 mmol/L NaCl, 10 mmol/L Tris pH 7.8.
- K1-70 IgG diluted in HBD serum had a dose dependent inhibiting effect on TSH-biotin binding with 13.6 ⁇ 1.4%; 74.1 ⁇ 0.4% and 97.4 ⁇ 0.2% inhibition at 0.01 ⁇ g/mL: 0.1 ⁇ g/mL and 1 ⁇ g/mL, respectively.
- K1-70 Fab was similarly active with inhibitions of 18.2 ⁇ 0.6%; 88.3 ⁇ 0.3% and 96.9 ⁇ 0.1% at 0.01 ⁇ g/mL; 0.1 ⁇ g/mL and 1 ⁇ g/mL, respectively.
- K1-70 IgG or Fab preparations were diluted in ELISA assay buffer the inhibiting activities were essentially the same compared to dilutions made in HBD serum (Table 3d).
- Table 3d The ability of K1-18 IgG to inhibit binding of M22 Fab-POD to TSHR coated ELISA plate wells is shown in Table 4a.
- K1-18 IgG diluted in HBD serum inhibited M22 Fab-POD binding in a dose dependent manner; in particular 21.0 ⁇ 1.3%, 81.6 ⁇ 0.5% and 97.2 ⁇ 0.1% inhibitions were observed at 0.03 ⁇ g/mL, 0.3 ⁇ g/mL and 3 ⁇ g/mL, respectively.
- K1-18 Fab showed similar ability to inhibit M22 Fab-POD binding as K1-18 IgG (Table 4b). As shown in Table 4a, K1-18 and M22 ability to inhibit labelled M22 binding to the TSHR were greater than the inhibiting activities of 5C9, TSMAbs 1-7 and 9D33. Inhibiting effects of all MAbs studied when diluted in ELISA assay buffer were similar to those observed when diluted in HBD serum (Table 4a and b).
- K1-70 IgG diluted in HBD serum showed 34.5 ⁇ 3.8%, 91.1 ⁇ 0.3% and 97.6 ⁇ 0.1% inhibition at 0.03 ⁇ g/mL, 0.3 ⁇ g/mL and 3 ⁇ g/ml, respectively. Similar percentage inhibitions were observed when K1-70 IgG was diluted in ELISA assay buffer (Table 4c). As illustrated in Table 4c K1-70 Fab diluted in HBD serum or in ELISA assay buffer showed similar M22-POD binding inhibiting activity as K1-70 IgG.
- K1-18 Fab tested at concentrations from 0.001 -100 ng/mL showed inhibitions ranged from 10.3 ⁇ 2.2% (at 0.03 ⁇ g/mL) to 84.8 ⁇ 0.9% (at 100 ⁇ g/mL) (Table 5b).
- K1-70 IgG and Fab both tested in the range of concentrations from 0.001 - 100 ⁇ g/mL
- Table 5c shows the effect of dilutions of sera from two patients with blocking TRAbs (B1 and B2) and sera from two patients with stimulating TRAbs (S1 and S2) on both I-K1-18 IgG and 125 I-TSH binding. Effect of various MAbs on 125 I-K1-18 Fab binding to the TSHR coated tubes is shown in Table 5d.
- K1-18 IgG stimulated cyclic AMP production in CHO cells expressing the TSHR in a dose dependent manner as shown in Table 6a.
- the levels of cyclic AMP in the presence of 0.1 ng/mL K1-18 IgG were 1.56 ⁇ 0.32 pmol/L, at 1.0 ng/mL were 4.08 ⁇ 0.28 pmol/L, at 10 ng/mL were 31.66 ⁇ 5.06 pmol/L, at 100 ng/mL were 64.95 ⁇ 9.61 pmol/L and at 1000 ng/mL they were 67.90 ⁇ 10.44 pmol/L.
- the cyclic AMP levels at different concentrations of K1-18 Fab in hypotonic buffer were 1.72 ⁇ 0.82 pmol/L, 9.99 ⁇ 3.52 pmol/ L, 53.22 pmol/L and 66.94 ⁇ 6.93 pmol/L at 1 ng/mL, 10 ng/mL, 100 ng/mL and 1000 ng/mL of K1-18 Fab, respectively.
- M22 Fab at 1 ng/mL in hypotonic buffer stimulated cyclic AMP production of 29.80 ⁇ 0.97 pmol/L and at 10 ng/mL of 57.41 ⁇ 5.05 pmol/L (Table 6a).
- Table 6a also shows the effect of K1-18 IgG or Fab on cyclic AMP stimulation in CHO cells expressing the TSHR tested under the isotonic conditions. As illustrated by examples in Table 6a both K1-18 IgG and Fab caused increase of cyclic AMP production under isotonic conditions although the levels of cyclic AMP produced were lower compared to experiments using hypotonic conditions. Comparison of stimulating activity of M22 IgG and K1-18 IgG tested in hypotonic buffer is shown in Table 6b. At 3 ng/mL concentration M22 IgG stimulated 24.3 ⁇ 2.3 pmol/mL of cyclic AMP while K1-18 IgG 8.3 ⁇ 0.5 pmol/mL.
- Cyclic AMP stimulating activity of K1-18 Fab calculated in the same experiment was 22 NIBSC 90/672 units/mg (activity at 10 ng/mL, 30 ng/mL and 100 ng/mL of K1-18 Fab were used for the calculations) (Table 6c). This can be compared with M22 IgG cyclic AMP stimulating activity of 286 NIBSC units/mg (Table 6c).
- the stimulating activities of porcine TSH, native human TSH and recombinant human TSH in isotonic and in hypotonic buffers are shown in Table 6d.
- Table 6e concern the stimulating effects of K1-18 IgG, M22 IgG or pTSH when mixed together in different combinations.
- the stimulating effect of pTSH, M22 or K1-18 appeared to be enhanced when two stimulators were mixed together compared to the effect of the stimulator alone at the same concentrations.
- cyclic AMP production of 11.01 ⁇ 0.99 pmol/mL (mean ⁇ SD) at 0.1 ng/mL pTSH alone and 35.17 ⁇ 6.38 pmol/mL (mean ⁇ SD) at 1 ng/mL of M22 IgG increased to 47.22 ⁇ 3.89 pmol/mL (mean ⁇ SD) when 0.1 ng/mL pTSH and 1 ng/mL of M22 IgG were mixed together.
- a mixture of 0.1 ng/mL of pTSH and 10ng/mL of K1-18 IgG had a greater stimulating effect than these stimulators alone (Table 6e).
- two stimulating antibodies mixed together were more potent than a single antibody at the same concentrations.
- donor serum diluted 30 times caused stimulation of cyclic AMP to 9.5 ⁇ 0.7 pmol/mL while donor serum IgG at 30 ⁇ g/mL caused stimulation to 15.6 ⁇ 0.7 pmol/mL which represented activity relative to NIBSC 90/672 of 0.014 units/mg (Table 6g).
- K1-18 IgG TSHR stimulating activity was inhibited by human MAbs with TSH antagonist activity (K1-70 and 5C9) as illustrated by the examples shown in Table 6h.
- K1-18 IgG at 10 ng/mL caused stimulation of cyclic AMP to 50.0 ⁇ 3.3 pmol/mL and this was reduced to 3.8 ⁇ 1.0 pmol/mL in the presence of 0.1 ⁇ g/mL of K1-70 IgG(92% inhibition).
- K1-18 IgG and 0.1 ⁇ g/mL of 5C9 IgG cyclic AMP levels were 4.4 ⁇ 1.5pmol/mL (91% inhibition).
- concentrations of K1-70 IgG or 5C9 IgG the inhibiting effect was complete (100% inhibition) (Table 6h).
- K1-70 IgG mixed together with 5C9 IgG was studied (Table 6i).
- K1-18 IgG stimulation at 10ng/mL was effectively inhibited by 0.1 ⁇ g/mL of 5C9 IgG or 0.1 ⁇ g/mL of K1-70 IgG.
- K1-70 IgG and 5C9 IgG were mixed to give a final total concentration of 0.1 ⁇ g/mL the stimulating activity of K1-18 IgG was also effectively inhibited (97.3% inhibition).
- K1-70 IgG and 5C9 IgG when mixed together were more effective inhbibitors of K1-18 IgG stimulating activity than one antibody alone.
- K1-70 IgG and 5C9 IgG individually caused no inhibition (0% and 1% respectively) while when mixed together to the same final concentration of total IgG (ie 0.001 ⁇ g/mL) the inhibition was 25.5%.
- Table 6i also shows that cyclic AMP concentration in the presence of K1-70 IgG (100 ⁇ g/mL) was similar to that observed in the presence of assay buffer while in the presence of 5C9 IgG (100 ⁇ g/mL) the concentration of cyclic AMP was lower (0.89 ⁇ 0.13 ; 0.89 ⁇ 0.15 and 0.55 ⁇ 0.14, respectively) (mean ⁇ SD of triplicate determinations).
- K1-70 IgG and 5C9 IgG were mixed together (final concentration of 100 ⁇ g/mL of total igG) cyclic AMP concentrations were not reduced below the levels observed in the presence of buffer (ie not lower than basal or constitutive activity levels).
- 9D33 IgG at 10 ⁇ g/ml was able to essentially completely inhibit M22 IgG cyclic AMP stimulation (94% inhibition) while lower concentrations of K1-70 IgG (1 ⁇ g/mL) had similar effect (96% inhibition) (Table 6l). Esentially complete inhibition of M22 activity (96% inhibition) was evident at 1 ⁇ g/mL of the 9D33 and K1-70 mixture (Table 6l). This is comparable to the inhibiting effect of a mixture of 9D33 and K1-70 (1 ⁇ g/mL) on TSH stimulating activity (97% inhibition) (Table 6m).
- TSH stimulating activity was inhibited more effectively by K1-70 IgG alone (98% inhibition at 1 ⁇ g/mL) than by 9D33 IgG alone (95% inhibition at 100 ⁇ g/mL) (Table 6m).
- Table 6n shows the effect of the lymphocyte donor serum and three patient sera containing TRAbs with blocking activity (B1-B3) on TSHR stimulating activity of TSH, M22 IgG and K1-18 IgG.
- the donor serum inhibited TSH, M22 IgG and K1-18 IgG stimulating activities (63.8%, 80.1% and 79.5% inhibitions, respectively).
- Blocking activity of K1-70 IgG was compared to the blocking activity of the lymphocyte donor serum as shown in Table 7d.
- Cyclic AMP levels after incubation with porcine TSH at 1 ng/mL were 61.7 ⁇ 4.3 pmol/mL and the levels dropped in the presence of donor serum (10x dilution) to 14.9 ⁇ 1.2 pmol/mL (75.9% inhibition) and to 51.6 ⁇ 2.6 pmol/mL with serum diluted 20 times (16.4% inhibition).
- Donor serum at higher dilutions did not have a detectable effect on TSH stimulating activity.
- K1-70 IgG had the ability to block cyclic AMP stimulating activity of porcine TSH, human TSH and human recombinant TSH as illustrated by the examples in Table 7e.
- K1-70 IgG at 0.1 ⁇ g/mL was an effective blocker of stimulating activity of all three TSH preparations tested under hypotonic medium conditions. Blocking activity of K1-70 IgG was less effective under isotonic medium conditions (Table 7e).
- K1-70 IgG showed the ability to block cyclic AMP stimulating activity of TRAbs in sera from patients with Graves' disease and the examples in Tables 7g -7k illustrate that 100 ⁇ g/mL concentrations of K1-70 IgG caused complete inhibition of stimulating activity in all 15 sera studied (inhibition of T1-T15 ranged from 90.8% to 98.7%).
- the effects of K1-70 IgG on the stimulating activities of sera T1-T15 were comparable to the effects of 5C9 IgG and 9D33 IgG tested in the same experiment except for one serum ie T11 (Table 7j).
- Stimulating activity of serum T11 was only weakly inhibited by 100 ⁇ g/mL of 5C9 IgG (8.5% inhibition) while in the presence of 100 ⁇ g/mL of K1-70 the inhibition was essentially complete (95.1% inhibition) (Table 7j). Effective inhibition (87.1%) of T11 was also observed with 100 ⁇ g/mL 9D33 (Table 7j).
- the effect of different blocking MAbs at different concentrations (0.01 - 100 ⁇ g/mL) on the stimulating activities of three Graves' sera (including serum T11) is shown in more detail in Tables 7l-7n.
- K1-70 IgG, 5C9 IgG and 9D33 IgG are effective inhibitors at concentrations as low as 0.1 ⁇ g/mL except in the case of serum T11 on which 5C9 IgG had little or no effect (Table 7n).
- Table 7o shows inhibition of porcine TSH stimulation by K1-70 IgG and 5C9 IgG when the two blocking MAbs were mixed together in one experiment.
- the two blocking MAbs were effective in combination in their ability to inhibit TSH stimulation of cyclic AMP production.
- the effect of K1-70 IgG and 5C9 IgG mixed together on the constitutive activity of the TSHR was tested.
- K1-70 IgG had no effect on TSHR basal activity in contrast to 5C9 IgG.
- TSHR mutations Glu61, Lys250 and Asp276 to alanine caused some effect (60-80% of the wild type) on K1-70 IgG blocking activity (Tables 15c, 15o, 15u) while TSHR mutation Ile60Ala caused reduction of K1-70 IgG blocking activity to 40-60% of the wild type activity (Table 15b).
- Binding of 125 I-K1-70 IgG to TSHR coated tubes was inhibited in a dose dependent manner by unlabelled K1-70 IgG and at concentrations of 0.003 ⁇ g/mL, 0.03 ⁇ g/mL, 0.3 ⁇ g/mL and 3 ⁇ g/mL (diluted in HBD serum) the inhibitions were 10.2 ⁇ 2.4%; 36.5 ⁇ 1.9%; 84.4 ⁇ 0.8% and 92.0 ⁇ 0.5%, respectively (Table 11 a).
- M22 Fab showed a greater potency to inhibit 125 I-K1-70 IgG binding at lower concentrations with the inhibitions of 16.7 ⁇ 6.0%; 60.2 ⁇ 1.8%; 89.9 ⁇ 01% and 92.0 ⁇ 0.3% at 0.003 ⁇ g/mL, 0.03 ⁇ g/mL, 0.3 ⁇ g/mL and 3 ⁇ g/mL concentrations (in HBD serum) (Table 11a). Also, K1-18 IgG and Fab inhibited 125 I-K1-70 IgG binding to the TSHR in a dose dependent manner (Table 11b).
- Tables 11a and 11b also show the effects of various human MAbs on 125 I-K1-70 binding in assay buffer. The effects are stronger when dilutions were made in assay buffer compared with HBD sera.
- the effects of different mouse monoclonal antibodies to the TSHR with TSHR stimulating activity (TSMAbs 1-7) and with TSHR blocking activity (9D33) on 125 I-K1-70 IgG binding to the TSHR are shown in Table 11c. All TSMAbs tested had the ability to inhibit 125 I-K1-70 IgG binding and 100 ⁇ g/mL concentrations (in HBD serum) caused inhibition ranging from 33.5 ⁇ 3.7% (TSMAb 3) to 59.6 ⁇ 0.6% (TSMAb 5) (Table 11c).
- Table 11e shows examples of experiments using two sera with TSHR stimulating activity (S1 and S2) and two sera with TSHR blocking activity (B1 and B2). Sera with either type of activity inhibited 125 I-labelled TSH, K1-70 IgG or Fab binding in a dose dependent manner and the degree of inhibition of binding of the different ligands was comparable for each serum (Table 11e).
- 125 I-labelled K1-70 IgG and Fab binding to TSHR (full length) coated tubes at room temperature reached a maximum after 180 min (45.5% and 37.1% binding respectively). 50% maximal binding occurred after about 35 min ( Figure 1a ).
- 125 I-labelled K1-70 IgG binding to TSHR260 coated tubes reached 36.2% at 180 min and 50% maximal binding was observed after 60 min incubation ( Figure 1b ).
- Time course of 125 I-labelled K1-70 Fab binding to the TSHR260 was similar to that observed for K1-70 IgG with the maximum binding after 60 min incubation of 37.3% and 50% maximal binding after approximately 60 min ( Figure 1c ).
- Porcine TSH, M22 IgG and K1-18 IgG had no effect while M22 Fab and K1-70 Fab caused approximately 30% of bound 125 I-labelled K1-70 IgG to dissociate from TSHR260 after 30 min incubation and thereafter dissociation did not increase further up to 180 min ( Figure 1 g) .
- K1-18 Fab had similar effect as shown in Figure 1h .
- 125 I-K1-70 Fab binding to TSHR260 coated tubes was not dissociated by incubation with unlabelled K1-70 IgG, K1-18 IgG, M22 IgG (all at 1mg/mL), porcine TSH (100mU/mL) or assay buffer.
- M22 Fab caused 29% dissociation of 125 I-K1-18 IgG bound to full length TSHR after 60 min incubation increasing to 43% dissociation after 180 min incubation (34.5% of 125 I-K1-18 IgG bound in the absence of M22 Fab compared to 24.5% and 19.8% after 60 and 180 min incubation with M22 Fab respectively) ( Figure 1k ).
- Figure 1l In the case of 125 I-labelled K1-18 IgG bound to TSHR260 coated tubes incubation with porcine TSH had no dissociating effect.
- OD405nm values increased in a dose dependent manner with increasing concentrations of K1-18 IgG (diluted in HBD sera).
- OD405 nm values were 0.013, 0.191, 0.511, 0.660 and 0.706 at 0.005, 0.05, 0.5, 10 and 100 ⁇ g/mL K1-18 IgG respectively compared to OD405nm of -0.002 in the presence of HBD serum alone.
- K1-70 IgG (diluted in HBD sera) also bound well in the bridging ELISA and showed OD 405 nm values of 0.045, 0.290, 0.661, 0.738 and 0.794 at 0.005, 0.05, 0.5, 10 and 100 ⁇ g/mL K1-70 IgG concentrations respectively (Table 12a).
- the effects of K1-18 and K1-70 IgGs can be compared to the ability of M22 IgG to bind to TSHR260-AP preparations as shown in Table 12a.
- Intact IgGs of human MAbs to the TSHR showed dose dependent binding in the ELISA while the monovalent Fab fragments of the same MAbs showed little or no response (Table 12b).
- Mouse TSMAbs 1-7 also bound well in the TSHR260-AP ELISA as illustrated by the examples in Table 12c.
- OD 405 nm signal ranged from 0.103 to 0.561 at 10 ⁇ g/mL concentrations of TSMAbs 1-7 (Table 12c).
- Mouse TSHR blocking MAb 9D33 also bound in this assay system with an OD 405 nm signal of 0.481 at 10 ⁇ g/mL (Table 12d).
- Patient sera containing TRAbs with stimulating activity i.e. sera that showed an ability to stimulate cyclic AMP activity in CHO cells expressing the TSHR reacted well in the TSHR260-AP ELISA.
- Table 12e shows examples of 6 different sera tested at different dilutions and the OD405 nm signal ranged from 0.407 to 0.924 at 1/5 dilutions in HBD sera.
- Table 12g shows more examples of binding of patient sera in the TSHR260-AP ELISA.
- TRAb concentrations in the TSHR260-AP ELISA were calculated from a calibration curve prepared from the NIBSC reference preparation 90/672 and compared to TRAb concentrations (expressed as NIBSC U/L) measured in the same sera using a TSHR coated tubes assay.
- NIBSC U/L TRAb concentrations
- Table 12h shows that patient serum TRAbs have the ability to inhibit binding of M22 Fab labelled with peroxidase to TSHR260 coated onto ELISA plate wells.
- Figure 2c and 2d Other comparison data are shown in Figures 2c and 2d .
- the effect of TSHR R255 mutation on binding of antibodies in the TSHR260-AP ELISA was tested. In these experiments full length preparations of TSHR containing the mutation R255D were coated on the plate wells and the ELISA carried out using the standard protocol described above.
- Table 121 shows binding of six stimulating sera (S1-S6 sera are the same as in Table 12e) to TSHR R255D. In the case of all six sera the OD 405nm values were lower in the assays with TSHR R255D compared to wild type TSHR. The degree of the signal reduction varied; in the case of sera S4, S5 and S6 (diluted 1:5 in HBD pool serum) the signal dropped from 0.646, 0.407 and 0.531 in the experiments with the wild type TSHR to 0.193, 0.133 and 0.342 in the experiments with TSHR R255D, respectively (Table 12l).
- OD 450 nm values of binding of M22 Fab-peroxidase to the full length TSHR in the ELISA were 1.748, 0.268 and 0.126 respectively for (a) preparations stored at -80°C (untreated), (b) incubated for 24 hours at room temperature followed by return to -80°C and (c) incubated for 48 hours at room temperature followed by return to -80°C, respectively. Consequently full length TSHR preparations stored at room temperature for 48 and 24 hours showed respectively only 7% and 15% activity relative to untreated preparations.
- M22 Fab-peroxidase binding OD 450 nm values were 2.293 for untreated TSHR260 and 1.836 and 1.676 for TSHR260 stored at room temperature for 24 and 48 hours respectively.
- the activity of TSHR260 stored at room temperature for 24 and 48 hours relative to untreated preparations was 80% and 73% respectively.
- Similar results were observed in the case of TSHR260-AP with OD 450 nm of 2.106 and 1.983 for samples stored at room temperature for 24 and 48 hours respectively compared to 2.395 for untreated samples. This represented 88% and 83% binding activity after 24 and 48 hours room temperature storage relative to untreated TSHR260-AP.
- TSHR LRD C-CAP showed 63% activity relative to untreated preparations after 24 and 48 hour storage at room temperature.
- the above described experiments showed that the ability to bind M22 of TSHR260, TSHR260-AP and TSHR LRD C-CAP after room temp treatment was greater than the full length TSHR preparations. This indicates that TSHR260, TSHR260-AP and TSHR LRD C-CAP are more stable at room temperature compared to full length TSHR.
- HC V region genes were from the VH5-51*01 family, the D genes from the D3-16*02 (or D3-16* 01) family and the JH genes from the J3*02 family.
- V region genes were from the V3-20*01 family and J region genes from the JK-1*01 germline.
- the HC nucleotide and amino acid sequences are shown in Figure 3 (SEQ ID No 1-18) and the LC nucleotide and amino acid sequences are shown in Figure 4 (SEQ ID No 19-36).
- LC sequence there are: 2 replacement mutations in CDR1, 1 silent mutation in FWR2 and 3 replacement mutations in CDR 3 with the overall R/S mutation ratio of 5.0 (FWRs and CDRs).
- the LC CDR 1 (SEQ ID No 24 and 34) is made up of 12 amino acids, CDR 2 (SEQ ID No 25 and 35) of 7 amino acids and CDR 3 (SEQ ID No 26 and 36) of 9 amino acids ( Figures 4b and 4d , respectively).
- K1-70 HC V region is from the VH5-51*01 germline, D genes from the D1-7*01 family and JH genes from the J4*02 family.
- LC genes are from the LV1-51*01germline combined with JL genes from the LJ7*01.
- the HC nucleotide and amino acid sequences are shown in Figure 5 (SEQ ID No 37-54) the preferred LC nucleotide and amino acid sequences are shown in Figures 6c and 6d (SEQ ID No 63-72).
- the K1-70 HC sequence there are three replacement mutations in FWR1, 3 replacement mutations in CDR1, 1 replacement mutation in FWR2, 2 silent mutation in CDR 2, 4 replacement mutations in FWR3 and 1 replacement mutation in FWR4.
- Overall (FWRs and CDRs) R/S mutation ratio is 6.0.
- HC CDR 1 (SEQ ID No 42 and 52) is 5 amino acids long
- CDR 2 (SEQ ID No 43 and 53) is 17 amino acids long
- CDR 3 (SEQ ID No 44 and 54) is 10 amino acids long ( Figures 5b and 5d , respectively).
- K1-70 LC genes show 1 silent mutation in FWR1, 1 silent and 1 replacement mutations in FWR2 and 1 replacement mutation in FWR3. There are 1 silent and 2 replacement mutations in the CDR1 and 2 replacement mutations in the CDR3.
- the LC CDR 1 (SEQ ID No 70) is made up of 13 amino acids, CDR 2 (SEQ ID No 71) of 7 amino acids and CDR 3 (SEQ ID No 72) 11 amino acids ( Figure 6d ).
- Fab K1-70 The structure of Fab K1-70 has been determined at 2.22 ⁇ resolution ( Figure 8 ). The Ramachandran plot parameters and the refinement statistics were within the range acceptable for correct structure refinement.
- the asymmetric unit contains two complete Fab K1-70 molecules, Fab A and Fab B.
- Fab A contains heavy chain A and light chain B
- Fab B contains heavy chain C and light chain D.
- Fab A heavy chain A and light chain B consist of residues 1 to 227 and 4 to 211, respectively, and in Fab B heavy chain C and light chain D consist of residues 1 to 227 and 2 to 212, respectively.
- the residues in Fab A and Fab B are numbered according to (Kabat's system (Kabat E et al 1991 supra ). See Figures 8 and 9a for details.
- the absence of these side chains in the electron density map indicates that they are highly mobile, mainly due to their being positioned in solvent accessible regions of the crystal structure.
- the root mean square deviation (r.m.s.d) for the two molecules of Fab calculated using LSQKAB (CCP4), are 0.20 ⁇ for VH domains (117 C ⁇ atoms), 0.23 ⁇ for VL domains (106 C ⁇ atoms), 0.22 A for CH domains (96 C ⁇ atoms) and 0.29 ⁇ for CL domains (97 C ⁇ atoms). This demonstrates that even though the elbow angles between the two Fab molecules differ, the domains themselves show minimal differences.
- K1-70 Fab is standard ( Figure 9a ); the canonical structures adopted by the six CDRs are 1,1 and 2 for LC CDR1, LC CDR2 and LC CDR3 respectively and 1 and 2A for HC CDR1 and HC CDR2 respectively.
- the HC CDR3 has not been assigned any canonical class due to greater variations in sequence and conformation. Disulphide bonds are present between cysteine residues LC23-LC88, LC134-LC194, HC22-HC92, HC142-HC208.
- LC CDR1 is 13 residues long
- LC CDR2 is 7 residues long
- LC CDR3 is 11 residues long.
- HC CDR1 is made up of 5 residues, HC CDR2 of 17 residues and HC CDR3 of 12 residues.
- side chains of LC CDR3 Arg94 and HC CDR2 Arg58 were added.
- brackets refer to the values obtained including these side chains.
- the solvent accessible surface area (ASA) for the LC CDR1 is 525(485) ⁇ 2
- LC CDR2 is 508(508) ⁇ 2
- LC CDR3 is 257(442) ⁇ 2
- HC CDR1 is 120 ⁇ 2
- HC CDR2 is 759 (842) ⁇ 2
- HC CDR3 is 557(528) A 2 .
- the distribution of charged amino acids on the surface of the antigen binding site of K1-70 Fab has been analysed and is shown in Figure 9b .
- the surface of the combining site is dominated by negatively charged residues on one side and by positively charged residues on the other side.
- the acidic patches on the antigen binding surface are contributed from LC residues: Asp27B (CDR1), Asp50 (CDR2), Asp92 (CDR3) and from HC residues: Asp31 (CDR1), Asp54 and Asp56 (CDR2) and Asp96 (CDR3).
- the basic patches are contributed from the LC residues: Lys53 and Arg54 (CDR1) and Arg94 (CDR3) and from the HC residues: Arg58 (CDR2) and Arg 101 (CDR3).
- LC Lys 66 which is outside the CDR regions also contributes to a basic patch on the surface.
- the positively charged area on the antigen binding surface of K1-70 is made up predominantly by the LC residues while the negatively charged area by the HC residues.
- the antigen binding surface of K1-70 is also rich in aromatic residues with 5 tyrosines, one phenylalanine and three tryptophans from the HC and the LC CDRs ( Figure 9c ).
- four tyrosines and one phenylalanine from the FRW regions contribute to the surface area.
- the overall surface of the K1-70 antigen binding area is highly irregular with a cavity near to the centre.
- the cavity is surrounded mostly by aromatic residues and by LC Asp50 ( Figures 9b and 9c ).
- the interior of the cavity is also populated by aromatic residues. This suggests that aromatic contacts may be important for the interaction between K1-70 and the TSHR with the prominent aromatic residue on the surface of the TSHR "fitting" into the cavity on the K1-70 surface.
- Table 17a shows that recombinant K1-70 Fab in E . coli culture supernatant had the ability to inhibit 125 I-TSH binding to the TSHR.
- the inhibiting effect was complete at lower dilutions of the culture supernatants (91.9% at 1:2 dilution) while increasing dilutions of the supernatant cause dose dependent inhibiting effect (27.9% inhibition at 1:256 dilution) (Table 17a).
- Table 17b The effect of recombinant K1-70 Fab on TSH mediated stimulation of cyclic AMP production in CHO cells expressing the TSHR is shown in Table 17b.
- a stimulating human MAb M22
- a blocking human MAb 5C9
- a blocking human Mab K1-70
- a blocking mouse MAb 9D33
- mouse stimulating MAbs TSMAbs 1-7
- K1-70 mouse stimulating MAbs 1-7
- a blocking human MAb 5C9
- a blocking mouse MAb 9D33
- a stimulating human MAb M22
- a stimulating human MAb K1-18
- TSMAbs 1-7 mouse stimulating MAbs
- the new human stimulating TSHR MAb K1-18 has properties similar to M22 in terms of:- inhibition of binding of labelled TSH to the TSHR, inhibition of binding of each other to the TSHR, inhibition of binding of blocking human MAbs (5C9 and K1-70) to the TSHR, inhibition of binding of mouse blocking and stimulating MAbs (9D33 and TSMAbs 1-7). Also the patient serum TRAbs inhibited binding of K1-18 to the TSHR. Furthermore, both M22 and K1-18 bind to the TSHR with a high affinity and are able to bind to a TSHR fragment consisting of amino acids 22-260 linked to alkaline phosphatase.
- Antibodies such as M22 and K1-18 have the ability to stimulate TSHR cyclic AMP activity although the potency of the two antibodies differs by about 1.5 fold.
- the studies show that the properties of TSHR stimulating autoantibodies are similar in different patients and they are representative of the properties of TSHR stimulating autoantibodies in all patients with Graves' disease studied so far.
- a summary of K1-18 characteristics is shown in Table 13a.
- the new blocking type human MAb K1-70 (obtained from the same sample of lymphocytes as the stimulating MAb K1-18) has the ability to:- inhibit binding of labelled TSH to the TSHR, inhibit binding of human MAbs (M22, K1-18 and 5C9) to the TSHR, inhibit binding of mouse blocking and stimulating MAbs (9D33 and TSMAbs 1-7) to the TSHR. Furthermore binding of K1-70 to the TSHR was inhibited by patient serum TRAbs. K1-70 showed potent TSH antagonist activity and the ability to block stimulation of the TSHR by all patient serum TRAbs tested. K1-70 was shown to be a more effective inhibitor of TSH binding to the TSHR than 5C9.
- K1-70 binds to the TSHR with a high affinity and is able to bind to the TSHR fragment of amino acids 22-260 linked to the alkaline phosphatase. Consequently, K1-70 has the characteristics of patient sera with blocking TRAbs including the high binding affinity for the TSHR, the ability to inhibit TSH and M22 binding to the TSHR and the ability to block ligand induced TSHR stimulation at low concentrations of antibody. However, K1-70 has no effect on TSHR constitutive activity while 5C9 does. A summary of K1-70 characteristics is shown in Table 13b.
- K1-18 ability to stimulate cyclic AMP activity in CHO cells expressing TSHRs was lost when TSHR was mutated at Glu157Ala, Lys183Ala, Tyr185Ala, Asp232Ala or Arg255Asp.
- K1-70 ability to block TSH mediated cyclic AMP activity in CHO cells expressing TSHRs was reduced in the case of TSHR mutations Lys58Ala, Ile60Ala, Arg109Ala, Lys183Ala, Lys250Ala and slightly reduced by the TSHR mutation Tyr82Ala. Both K1-18 and K1-70 as well as M22 reacted well with the TSHR fragment of 22-260 in an ELISA based on TSHR 260-AP.
- TSHR fragment of amino acids 22-260 appears to be sufficient for routine assays of TSHR autoantibodies.
- M22 also bound well to a longer fragment of the TSHR (TSHR LRD C-CAP).
- TSHR LRD C-CAP a longer fragment of the TSHR
- the TSHR mutation Arg255Asp had no effect on binding of K1-70 IgG while K1-18 IgG (at lower concentrations ie 0.1 ⁇ g/mL and below) bound less effectively to the mutated receptor.
- the experiments with different patient serum TRAbs indicate that sera with TSHR stimulating activities can be differentiated from sera with TSHR blocking activities on the basis of differences in binding to the TSHR containing R255D mutation. Binding of patient sera with stimulating activities is affected by the mutation while binding of patient sera with blocking activities is affected less or not at all.
- the experiments provide nucleotide and amino acid sequences of K1-18 and K1-70.
- heavy chain V genes of K1-18, K1-70 are derived from the same germline which belongs to the same family as the other stimulating human MAb M22 heavy chain V genes they are all combined with D and J genes from different families; furthermore K1-18 uses the kappa light chain, whereas M22 and K1-70 use lambda light chains.
- 5C9 (the other blocking type human MAb) germline genes are different from M22, K1-18 and K1-70 except that 5C9 and K1-70 use J4 heavy chain genes.
- Amino acid sequences of the CDRs of stimulating MAbs (M22 and K1-18) and blocking MAbs (5C9 and K1-70) are essentially different in particular within the heavy and the light chains CDR3s.
- HBD pool of healthy blood donor sera. 5B3 is a human MAb to glutamic acid decarboxylase (negative control). 125 I-TSH binding in the presence of assay buffer was 11%. 125 I-TSH binding in the presence of HBD pool was 11.5%. Assay buffer is 50 mmol/L NaCl, 10 mmol/L Tris pH 7.8, 0.1 % Triton X-100.
- 125 I-TSH binding in the presence of assay buffer was 13.4%.
- 125 I-TSH binding in the presence of HBD pool was 11.5%.
- Table 2a Inhibition of 125 I-TSH binding to TSHR coated tubes by K1 donor serum and IgG and by K1-18 IgG and Fab Test sample Inhibition of binding (%) Dilutions in assay buffer (mean ⁇ SD) Inhibition of binding (%) Dilutions in HBD (mean ⁇ SD) K1 donor serum dilution 1/10 94.7 ⁇ 0.9 81.1 ⁇ 0.4 1/20 89.3 ⁇ 0.7 62.4 ⁇ 3.5 1/40 67.0 ⁇ 1.0 39.0 ⁇ 0.9 1/80 34.0 ⁇ 3.8 19.8 ⁇ 1.9 1/160 13.1 ⁇ 3.1 9.1 ⁇ 0.8 1/320 6.6 ⁇ 0.9 2.17 ⁇ 1.5
- K1 donor serum IgG 1 mg/mL 89.6 ⁇ 0.8 76.5 ⁇ 1.5 0.5 mg/mL
- HBD pool of healthy blood donor sera.
- 5B3 is a human MAb to glutamic acid decarboxylase (negative control).
- Assay buffer is 50 mmol/L NaCl, 10 mmol/L Tris pH 7.8, 0.1% Triton X-100, 1 mg/mL BSA.
- Results of negative control MAb (5B3 IgG) are shown in Table 3a.
- Table 3c Inhibition of TSH-biotin binding to TSHR coated plate wells by K1-18 IgG (effect of different assay conditions)
- Test sample % Inhibition (mean ⁇ SD) Dilutions in assay buffer % Inhibition (mean ⁇ SD) Dilutions in HBD % Inhibition (mean ⁇ SD) Dilutions in assay buffer + 100 ⁇ g/mL 5B3 IgG K1-18 IgG 100 ⁇ g/mL 96.9 ⁇ 0.2 98.6 ⁇ 0.1 96.7 ⁇ 0.1 30 ⁇ g/mL 96.7 ⁇ 0.2 98.4 ⁇ 0.1 96.7 ⁇ 0.2 10 ⁇ g/mL 96.2 ⁇ 0.2 98.3 ⁇ 0.1 96.6 ⁇ 0.1 3 ⁇ g/mL 96.6 ⁇ 0.2 98.2 ⁇ 0.1 96.6 ⁇ 0.1 1
- results of negative control MAb are shown in Table 3a.
- Table 4a Inhibition of M22-peroxidase binding to TSHR coated ELISA plate wells by K1-18 IgG and different TSHR monoclonal antibodies
- Test sample Inhibition of binding (%) Dilutions in assay buffer (mean ⁇ SD)
- Inhibition of binding (%) Dilutions in HBD (mean ⁇ SD)
- K1-18 IgG 100 ⁇ g/mL 98.4 ⁇ 0.1 98.0 ⁇ 0.1 30 ⁇ g/mL 98.2 ⁇ 0.1 97.8 ⁇ 0.1 10 ⁇ g/mL 98.2 ⁇ 0.1 97.6 ⁇ 0.2 3 ⁇ g/mL 98.1 ⁇ 0.1 97.2 ⁇ 0.1 1 ⁇ g/mL 97.2 ⁇ 0.3 94.5 ⁇ 0.0 0.3 ⁇ g/mL 92.1 ⁇ 0.7 81.6 ⁇ 0.5 0.1 ⁇ g/mL 73.9 ⁇
- HBD pool of healthy blood donor sera.
- 5B3 is a human MAb to glutamic acid decarboxylase (negative control).
- Assay buffer is 50 mmol/L NaCl, 10 mmol/L Tris pH 7.8, 0.1% Triton X-100, 1 mg/mL BSA.
- results of negative control MAb are shown in Table 4a.
- Table 4c Inhibition of M22-peroxidase binding to TSHR coated ELISA plate wells by K1-70 IgG and K1-70 Fab preparations Test sample Inhibition of binding (%) Dilutions in assay buffer (mean ⁇ SD) Inhibition of binding (%) Dilutions in HBD (mean ⁇ SD) K1-70 IgG 100 ⁇ g/mL 98.5 ⁇ 0.3 98.3 ⁇ 0.2 30 ⁇ g/mL 98.2 ⁇ 0.1 97.9 ⁇ 0.1 10 ⁇ g/mL 97.9 ⁇ 0.2 97.8 ⁇ 0.1 3 ⁇ g/mL 98.1 ⁇ 0.2 97.6 ⁇ 0.1 1 ⁇ g/mL 98.1 ⁇ 0.1 96.4 ⁇ 0.2 0.3 ⁇ g/mL 97.3 ⁇ 0.3 91.1 ⁇ 0.3 0.1 ⁇ g/mL 93.0
- results of negative control MAb are shown in Table 4a.
- Table 5a Inhibition of 125 I-K1-18 IgG binding to TSHR coated tubes by K1-18 IgG, K1-18 Fab, K1-70 IgG and other MAbs Test sample Inhibition of binding (%) Dilutions in assay buffer (mean ⁇ SD) Inhibition of binding (%) Dilutions In HBD (mean ⁇ SD) K1-18 IgG 100 ⁇ g/mL 94.0 ⁇ 0.9 94.9 ⁇ 0.2 30 ⁇ g/mL 93.2 ⁇ 0.3 94.7 ⁇ 0.2 10 ⁇ g/mL 92.4 ⁇ 1.5 93.6 ⁇ 0.9 3 ⁇ g/mL 93.0 ⁇ 0.3 93.5 ⁇ 0.8 1 ⁇ g/mL 92.6 ⁇ 0.4 91.7 ⁇ 0.8 0.3 ⁇ g/ml 91.0 ⁇ 0.5 84.6 ⁇ 0.5 0.1 ⁇ g/mL 82.9 ⁇ 1.8 69.0
- HBD pool of healthy blood donor sera.
- 4B4 is a human MAb to glutamic acid decarboxylase (negative control).
- 5B3 is a human MAb to glutamic acid decarboxylase (negative control).
- 125 I-K1-18 IgG binding in the presence of assay buffer was 13.6%.
- 125 I-K1-18 IgG binding in the presence of HBD pool was 13.8%.
- Assay buffer is 50 mmol/L NaCl, 10 mmol/L Tris pH 7.8, 0.1% Triton X-100.
- 125 I-K1-18 IgG binding in the presence of assay buffer was 19.1 %.
- 125 I-K1-18 IgG binding in the presence of HBD pool was 15.3%.
- Table 5c Inhibition of 125 I-K1- 18 IgG binding to TSHR coated tubes by patient sera positive for TRAb (stimulating and blocking) and bv donor serum K1 Test sample % inhibition of 125 I-K1-18 IgG binding % Inhibition of 125 I-TSH binding G1 37.8 38.6 G2 43.1 31.5 G3 36.5 35.6 G4 44.1 47.1 G5 42.6 44.7 G6 54.5 52.1 G7 25.5 15.9 G8 48.2 41.8 G9 79.5 80.0 G10 63.1 68.7 G11 37.2 31.0 G12 37.2 29.7 G13 63.1 57.9 G14 56.4 49.3 G15 43.8 38.6 G16 44.0 42.9 G17 27.7 24.5 G18 44.5 39.1 G19 23.2 20.6
- HBD 1-10 are individual sera from healthy blood donors.
- B1and B2 are sera from patients with blocking type TRAb.
- S1 and S2 are sera from patients with stimulating type TRAb.
- Table 5d Inhibition of 125 I-K1-18 Fab binding to TSHR coated tubes by K1-18 IgG, K1-18 Fab and K1-70 IgG preparations Test sample Inhibition of binding (%) Dilutions In assay buffer (mean ⁇ SD) Inhibition of binding (%) Dilutions in HBD (mean ⁇ SD) K1-18 IgG 100 ⁇ g/ml 94.8 ⁇ 0.8 96.0 ⁇ 0.8 30 ⁇ g/mL 94.5 ⁇ 0.8 95.7 ⁇ 1.2 10 ⁇ g/mL 94.8 ⁇ 2.6 94.5 ⁇ 1.6 3 ⁇ g/mL 93.7 ⁇ 0.5 94.0 ⁇ 0.2 1 ⁇ g/mL 93.3 ⁇ 0.7 91.9 ⁇ 0.7 0.3 ⁇ g/mL 91.1 ⁇
- 125 I-K1-18 Fab binding in the presence of assay buffer was 10%.
- 125 I-K1-18 Fab binding in the presence of HBD pool was 9.4%.
- Table 6a Comparison of stimulation of cyclic AMP production by K1-18 IgG, K1-18 Fab and M22 Fab in CHO cells expressing the TSHR Test sample Stimulation of cyclic AMP production in isotonic buffer (pmol/mL cyclic AMP mean ⁇ SD) Stimulation of cyclic AMP production in hypotonic buffer (pmol/mL cyclic AMP mean ⁇ SD)
- 4B4 is a human MAb to glutamic acid decarboxylase (negative control).
- Test samples were diluted in hypotonic cyclic AMP buffer.
- Table 6d Comparison of stimulation of cyclic AMP production by porcine (p), native human (h) and recombinant human (rh) TSH in CHO cells expressing the TSHR Test sample Cyclic in isotonic buffer (pmol/mL mean ⁇ SD) Cyclic AMP concentration in hypotonic buffer (pmol/mL mean ⁇ SD) Cyclic AMP buffer 1.3 ⁇ 0.5 2.0 ⁇ 0.1 pTSH 20 ng/mL 73.9 ⁇ 12.7 89.9 ⁇ 10.1 3 ng/mL 46.6 ⁇ 3.3 76.6 ⁇ 0.0 2 ng/mL 49.5 ⁇ 3.9 77.6 ⁇ 9.2 1 ng/mL 37.8 ⁇ 3.8 69.0 ⁇ 1.4 0.3 ng/mL 14.3 ⁇ 1.1 34.1 ⁇ 2.8
- pTSH was from RSR Ltd, Cambridge, CF23 8HE, UK.
- Native hTSH was an NIBSC reference preparation 81/565.
- rhTSH was an NIBSC reference preparation 94/674.
- Cyclic AMP pmol/mL; mean ⁇ SD
- cyclic AMP buffer 1.00 ⁇ 0.72 10 ng/mL 5B3 IgG 1.58* 1 ng/mL 5B3 IgG 1.19* 0.1 ng/mL 5B3 IgG 1.53* 0.1 ng/mL pTSH 11.01 ⁇ 0.99 1 ng/mL M22 IgG 35.17 ⁇ 6.38 0.1 ng/mL pTSH + 1 ng/mL M22 IgG 47.22 ⁇ 3.89 0.05 ng
- 5B3 is a human MAb to glutamic acid decarboxylase (negative control).
- Test samples were diluted in hypotonic cyclic AMP buffer.
- Table 6f Stimulation of cyclic AMP production in TSHR transfected CHO cells by NIBSC reference preparation 90/672 and bv K1-18 IgG, donor serum and donor serum IgG (experiment 1)
- HBD serum from a healthy blood donor (HBD IgG was isolated from the same serum).
- Test samples were diluted in hypotonic cyclic AMP buffer.
- HBD serum from a healthy blood donor (HBD IgG was isolated from the same serum).
- Test samples were diluted in hypotonic cyclic AMP buffer.
- Table 6h Inhibition of K1-18 IgG TSHR stimulating activity by human MAbs K1-70 and 5C9 IgGs with TSH antagonist activity
- 5B3 is a human MAb to glutamic acid decarboxylase (negative control).
- Test samples were diluted in hypotonic cyclic AMP buffer.
- Table 6i Inhibition of K1-18 IgG stimulation of cyclic AMP production in TSHR transfected CHO cells by K1-70 and 5C9 IgGs mixed together
- Test sample Cyclic AMP concentration (pmol/mL; mean ⁇ SD) %
- Cyclic AMP buffer 0.89 ⁇ 0.15 10 ng/mL K1-18 IgG 50.3 ⁇ 4.97 100 ⁇ g/mL 5B3 IgG 1.20 ⁇ 0.24 100 ⁇ g/mL 5C9 IqG 0.55 ⁇ 0.14 100 ⁇ g/mL K1-70 IgG 0.89 ⁇ 0.13 100 ⁇ g/mL (K1-70 IgG + 5C9 IgG) a 0.86 ⁇ 0.17 10 ng/mL K1-18 + 100 ⁇ g/mL 5B3
- 5B3 is a human MAb to glutamic acid decarboxylase (negative control).
- a The total final concentration of IgG mixture is shown; ie in the case of 100 ⁇ g/mL (K1-70 IgG + 5C9 IgG) the mixture contains 50 ⁇ g/mL K1-70 IgG and 50 ⁇ g/mL 5C9 IgG. Consequently, the combined effect of two IgGs at 100 ⁇ g/mL can be compared to the effect of the single IgG at the same concentration (100 ⁇ g/mL).
- Test samples were diluted in hypotonic cyclic AMP buffer.
- the total final concentration of IgG mixture is shown; ie in the case of 100 ⁇ g/mL (K1-70 IgG + 9D33 IgG) the mixture contains 50 ⁇ g/mL K1-70 IgG and 50 ng/mL 9D33 IgG. Consequently, the combined effect of two IgGs at 100 ⁇ g/mL can be compared to the effect of the single IgG at the same concentration (100 ⁇ g/mL).
- the total final concentration of IgG mixture is shown; ie in the case of 100 ⁇ g/mL (K1-70 IgG + 9D33 IgG) the mixture contains 50 ⁇ g/mL K1-70 IgG and 50 ⁇ g/mL 9D33 IgG. Consequently, the combined effect of two IgGs at 100 ⁇ g/mL can be compared to the effect of the single IgG at the same concentration (100 ⁇ g/mL).
- pTSH porcine TSH.
- B1-B3 are sera from patients with blocking type TRAb.
- HBD healthy blood donor serum.
- Test samples were diluted in hypotonic cyclic AMP buffer.
- Table 7a Inhibition of porcine (p) TSH stimulation of cyclic AMP production in TSHR transfected CHO cells by K1-70 and 5C9 IgGs
- Cyclic AMP concentration (pmol/mL mean ⁇ SD) % Inhibition Cyclic AMP buffer only 1.6 ⁇ 0.3 3 ng/mL pTSH 62.6 ⁇ 3.9 0 5B3 IgG 100 ⁇ g/mL + 3 ng/mL pTSH 66.7 ⁇ 3.7 0 10 ⁇ g/mL + 3 ng/mL pTSH 67.8 ⁇ 3.7 0 K1-70 IgG 3 ⁇ g/mL + 3 ng/mL pTSH 1.7 ⁇ 0.6 97.3 1 ng/m
- 5B3 is a human MAb to glutamic acid decarboxylase (negative control).
- Test samples were diluted in hypotonic cyclic AMP buffer.
- Table 7b Inhibition of porcine (p) TSH stimulation of cyclic AMP production in TSHR transfected CHO cells by K1-70 IqG and Fab preparations
- Test sample Cyclic AMP concentration in hypotonic medium pmol/mL mean ⁇ SD
- Cyclic AMP concentration in isotonic medium pmol/mL mean ⁇ SD
- Test samples were diluted in cyclic AMP buffer.
- Table 7c The effect of human and mouse TSHR blocking MAbs (K1-70, 5C9 and 9D33) on the constitutive activity (ie basal activity) of the TSHR Test sample Cyclic AMP concentration (pmol/mL mean ⁇ SD) % Inhibition Cyclic AMP buffer only 18.7 ⁇ 2.3 0 K1-70 IgG 100 ⁇ g/mL 17.6 ⁇ 1.6 6 10 ⁇ g/mL 17.3 ⁇ 0.3 7 3 ⁇ g/ml 18.1 ⁇ 0.7 3 1 ⁇ g/mL 16.8 ⁇ 0.5 10 0.3 ⁇ g/ml 18.9 ⁇ 1.2 0 0.1 ⁇ g/mL 19.6 ⁇ 0.8 0 0.01 ⁇ g/mL 19.1 ⁇ 2.6 0 0.001 ⁇ g/mL 20.3 ⁇ 3.1 0 5C9 IgG 100 ⁇ g/mL 9.0 ⁇ 1.0 52 10 ⁇ g/
- HBD pool of healthy blood donor sera.
- pTSH porcine TSH.
- Table 7e Effect of K1-70 IgG on stimulation of cyclic AMP production by porcine (p), human (h) and recombinant human (rh) TSH in CHO cells expressing the TSHR Test sample Cyclic AMP concentration in hypotonic medium (pmol/mL mean ⁇ SD) Cyclic AMP concentration in isotonic medium (pmol/mL mean ⁇ SD) Cyclic AMP buffer 2.5 ⁇ 0.5 1.1 ⁇ 0.4 100 ⁇ g/mL 5B3 IgG 2.2 ⁇ 0.6 1.4 ⁇ 0.5 100 ⁇ g/mL K1-70 IgG 2.5 ⁇ 0.5 1.1 ⁇ 0.2 3 ng/mL 48.1 ⁇ 0.9 41.1 ⁇ 2.2 pTSH 3 ng/mL + 100 ⁇ g/mL K1-70 IgG 0.1 ⁇ 0.0 1.3 ⁇ 0.3 pTSH 3 ng/m
- HBD pool of healthy blood donor sera.
- Table 7g Effect of K1-70 IgG on TSHR stimulating activity of TRAb positive patient sera (T1-T3) Test sample Cyclic AMP concentration (pmol/mL mean ⁇ SD) % Inhibition Cyclic AMP buffer 2.0 ⁇ 0.6 HBD 1.7 ⁇ 0.2 HBD + 100 ⁇ g/mL 5B3 IgG 2.0 ⁇ 0.1 HBD + 100 ⁇ g/mL K1-70 IgG 1.2 ⁇ 0.1 HBD + 100 ⁇ g/mL 5C9 IgG 0.9 ⁇ 0.3 HBD + 100 ⁇ g/mL 9D33 IgG 1.9 ⁇ 0.1 T1 serum 99.8 ⁇ 6.1 0 T1 serum + 100 ⁇ g/mL 5B3 IgG 94.9 ⁇ 14.2 4.9 T1 serum + 100 ⁇ g/mL K1-70 IgG 1.4 ⁇ 0.3 98.6 T1 serum + 100 ⁇ g/mL 5C9 Ig
- HBD pool of healthy blood donor sera. Sera were diluted to a final concentration of 1:10 in hypotonic cyclic AMP assay buffer.
- Table 7h Effect of K1-70 IgG on TSHR stimulating activity of TRAb positive patient sera (T4-T6) Test sample Cyclic AMP concentration (pmol/mL mean ⁇ SD) % Inhibition Cyclic AMP buffer 1.9 ⁇ 0.4 HBD 2.4 ⁇ 0.1 HBD + 100 ⁇ g/mL 5B3 IgG 3.0 ⁇ 0.1 HBD + 100 ⁇ g/mL K1-70 IgG 2.1 ⁇ 0.2 HBD + 100 ⁇ g/mL 5C9 IqG 1.8 ⁇ 0.9 HBD + 100 ⁇ g/mL 9D33 3.9 ⁇ 0.5 T4 serum 78.9 ⁇ 8.2 0 T4 serum + 100 ⁇ g/mL 5B3 IgG 55.0 ⁇ 14.0 30.3 T4 serum + 100 ⁇ g/mL K1-70 IgG
- HBD pool of healthy blood donor sera.
- Table 7i Effect of K1-70 IgG on TSHR stimulating activity of TRAb positive patient sera (T7-T9)
- HBD pool of healthy blood donor sera. Table 7j Effect of K1-70 IgG on TSHR stimulating activity of TRAb positive patient sera (T10-T12) Test sample Cyclic AMP concentration (pmol/mL mean ⁇ SD) % Inhibition Cyclic AMP buffer 1.8 ⁇ 0.2 HBD 2.2 ⁇ 0.2 HBD + 100 ⁇ g/mL 5B3 IgG 2.4 ⁇ 0.4 HBD + 100 ⁇ g/mL K1-70 IgG 1.7 ⁇ 0.0 HBD + 100 ⁇ g/ml 5C9 IgG 1.1 ⁇ 0.3 HBD + 100 ⁇ g/mL 9D33 IgG 3.2 ⁇ 0.6 T10 serum 56.3 ⁇ 5.2 0 T10 serum + 100 ⁇ g/mL 5B3 IgG 59.3 ⁇ 7.1 0 T10 serum + 100 ⁇ g/mL K1-70 IgG 1.8 ⁇ 0.2 96.8 T10 serum + 100 ⁇ g/mL
- HBD pool of healthy blood donor sera. Table 7k Effect of K1-70 IgG on TSHR stimulating activity of TRAb positive patient sera (T13-T15) Test sample Cyclic AMP concentration (pmol/mL mean ⁇ SD) % Inhibition Cyclic AMP buffer 1.6 ⁇ 0.2 HBD 2.2 ⁇ 0.4 HBD + 100 ⁇ g/mL 5B3 IgG 5.1 ⁇ 1.2 HBD + 100 ⁇ g/mL K1-70 IgG 2.1 ⁇ 0.8 HBD + 100 ⁇ g/mL 5C9 IgG 1.0 ⁇ 0.2 HBD + 100 ⁇ g/mL 9D33 IgG 3.3 ⁇ 0.3 T13 serum 48.5 ⁇ 3.8 0 T13 serum + 100 ⁇ g/mL 5B3 IgG 37.6 ⁇ 3.4 22.5 T13 serum + 100 ⁇ g/mL K1-70 IgG 2.1 ⁇ 0.3 95.7 T13 serum + 100 ⁇ g/mL 5C9 IgG
- HBD pool of healthy blood donor sera. Table 7l Effect on T5 serum stimulating activity of different concentrations of TSHR blocking monoclonal antibodies (K1-70, 5C9, 9D33) Test sample Cyclic AMP concentration (pmol/mL mean ⁇ SD) % Inhibition Cyclic AMP buffer 1.4 ⁇ 0.5 HBD diluted 10x 2.8 ⁇ 0.7 Serum T5 diluted 10x 63.9 ⁇ 5.9 5B3 IgG (negative control) 100 ⁇ g/mL 1.1 ⁇ 0.5 100 ⁇ g/mL + T5 55.9 ⁇ 5.5 12.5 10 ⁇ g/mL + T5 61.9 ⁇ 2.6 3.1 1 ⁇ g/mL + T5 61.3 ⁇ 5.5 4.1 0.1 ⁇ g/mL + T5 59.4* 7.0 K1-70 IgG 100 ⁇ g/mL 1.0 ⁇ 0.3 100 ⁇ g/mL + T5 1.4 ⁇ 0.6 97.8 10
- T5 TRAb positive serum with thyroid stimulating activity; T5 serum was diluted to a final concentration of 1:10 in hypotonic cyclic AMP buffer.
- HBD pool of healthy blood donor sera. Table 7m Effect on T8 serum stimulating activity of different concentrations of TSHR blocking monoclonal antibodies (K1-70, 5C9, 9D33) Test sample Cyclic AMP concentration (pmol/mL mean ⁇ SD) % Inhibition Cyclic AMP buffer 1.7 ⁇ 0.2 HBD diluted 10x 2.5 ⁇ 1.0 Serum T8 diluted 10x 52.3 ⁇ 10.5 5B3 IgG 100 ⁇ g/mL 2.1 ⁇ 0.5 100 ⁇ g/mL + T8 50.5 ⁇ 3.1 3 10 ⁇ g/mL + T8 56.0 ⁇ 14.7 0 1 ⁇ g/mL + T8 51.4 ⁇ 2.7 2 0.1 ⁇ g/mL + T8 50.7 ⁇ 10.2 3 K1-70 IgG 100 ⁇ g/mL 1.8 ⁇
- Table 7n Effect on T11 serumstimulating activity of different concentrations of TSHR blocking monoclonal antibodies (K1-70, 5C9, 9D33) Test sample Cyclic AMP concentration (pmol/mL mean ⁇ SD) % Inhibition Cyclic AMP buffer 1.2 ⁇ 0.4 HBD diluted 10x 1.8 ⁇ 0.4 Serum T11 diluted 10x 25.2 ⁇ 4.4 5B3 IgG 100 ⁇ g/mL 1.0 ⁇ 0.2 100 ⁇ g/mL + T11 18.4 ⁇ 1.3 27.0 10 ⁇ g/mL + T11 18.8 ⁇ 1.3 25.4 1 ⁇ g/mL + T11 19.8 ⁇ 1.2 21.4 0.1 ⁇ g/mL + T11 17.7 ⁇ 2.1 29.8 K1-70 IgG 100
- T11 TRAb positive serum with TSH receptor stimulating activity; T11 serum was diluted to a final concentration of 1:10 in hypotonic cyclic AMP buffer.
- HBD pool of healthy blood donor sera.
- Table 7o Inhibition of porcine (p) TSH stimulation of cyclic AMP production in TSHR transfected CHO cells by K1-70 and 5C9 mixed together Test Sample Cyclic AMP concentration (pmol/mL mean ⁇ SD) % Inhibition Cyclic AMP buffer 0.6 ⁇ 0.1 pTSH 3ng/mL 64.2 ⁇ 3.5 100 ⁇ g/mL 5B3 0.9 ⁇ 0.2 100 ⁇ g/mL 5C9 0.2 ⁇ 0.0 100 ⁇ g/mL K1-70 0.6 ⁇ 0.2 100 ⁇ g/mL (K1-70 + 5C9) a 0.7 ⁇ 0.5 pTSH 3ng/mL + 100 ⁇ g/mL 5B3 63.9 ⁇ 5.1 0.5 pTSH 3ng/
- TSH final concentration 3ng/mL
- c % inhibition 100 x [1 - (cyclic AMP in the presence of test samples and TSH/cyclic AMP in the presence of cyclic AMP buffer and TSH)].
- 5B3 is a human monoclonal antibody to GAD (negative control for K1-70)
- Table 9b TSH induced cyclic AMP production in CHO cells expressing wild type TSHR and TSHR with Arg80 mutated to Ala.
- HBD pool of healthy blood donor sera. 5B3 is a human MAb to glutamic acid decarboxylase (negative control). 125 I-K1-70 IgG in the presence of assay buffer gave 20.4% binding. 125 I-K1-70 IgG in the presence of HBD pool gave 20.5% binding. Assay buffer is 50 mmol/L NaCl, 10 mmol/L Tris pH 7.8, 0.1% Triton X-100.
- HBD 1-10 healthy blood donor sera 1-10.
- B1, B2 sera from two different patients with TSHR blocking autoantibodies.
- S1, S2 sera from two different patients with TSHR stimulating autoantibodies.
- Table 12a Binding of human MAbs to TSHR260-AP in an ELISA Mean absorbance at 405nm Test sample Test sample diluted in HBD Test sample diluted in assay buffer Assay buffer -0.005 HBD serum -0.002 K1-18 IgG 250 ⁇ g/mL 0.722 1.197 100 ⁇ g/mL 0.706 0.993 10 ⁇ g/mL 0.660 0.800 1 ⁇ g/mL 0.578 0.715 0.5 ⁇ g/mL 0.511 0.673 0.1 ⁇ g/mL 0.292 0.545 0.05 ⁇ g/ml 0.191 0.396 0.01 ⁇ g/mL 0.053 0.255 0.005 ⁇ g/mL 0.013 0.136 K1-70 IgG 250 ⁇ g/mL 0.817 1.134 100 ⁇ g/mL 0.794 1.030 10 ⁇ g/mL 0.738 0.885 1 ⁇ g/mL 0.677 0.806 0.5 ⁇ g/mL 0.6
- TSMAb 1 10 ⁇ g/mL 0.166 0.5 ⁇ g/mL 0.036 0.05 ⁇ g/mL -0.002 0.005 ⁇ g/mL 0.006
- TSMAb 2 10 ⁇ g/mL 0.410 0.5 ⁇ g/mL 0.191 0.05 ⁇ g/mL 0.033 0.005 ⁇ g/mL 0.003
- TSMAb 3 10 ⁇ g/mL 0.103 0.5 ⁇ g/mL 0.029 0.05 ⁇ g/mL -0.001 0.005 ⁇ g/mL 0.003
- TSMAb 4 10 ⁇ g/mL 0.428 0.5 ⁇ g/mL 0.253 0.05 ⁇ g/mL 0.048 0.005 ⁇ g/g/
- Binding of 5B3 and 4B4 (human MAbs to glutamic acid decarboxylase; negative controls) is shown in Table 12b.
- Table 12d Bindina of mouse TSHR blocking MAb (9D33) in the TSHR260-AP ELISA Test sample Mean absorbance at 405nm Dilutions in HBD HBD 0.003 9D33 IgG 10 ⁇ g/mL 0.481 1 ⁇ g/mL 0.329 0.5 ⁇ g/ml 0.273 0.1 ⁇ g/mL 0.102 0.05 ⁇ g/mL 0.056 0.01 ⁇ g/mL 0.011 0.005 ⁇ g/mL 0.006 K1-70 IgG 10 ⁇ g/mL 1.324 1 ⁇ g/mL 1.164 0.5 ⁇ g/mL 1.083 0.1 ⁇ g/mL 0.639 0.05 ⁇ g/mL 0.388 0.01 ⁇ g/mL 0.094 0.005 ⁇ g/mL 0.059 M
- Binding of 5B3 and 4B4 (human MAbs to glutamic acid decarboxylase; negative controls) is shown in Table 12b.
- Table 12e Binding of patient sera with TSHR stimulating activity in the TSHR260-AP ELISA Test sample TSHR260-AP ELISA Inhibition of TSH binding ELISA Mean absorbance at 405nm TRAb conc 1 ( ⁇ g/mL) TRAb conc 2 (U/L) TRAb conc 2 (U/L) Stimulation of cyclic AMP production 3 (pmol/mL) HBD 0.003 0 0 0 S1 diluted 1:5 0.924 0.31 38.0 >40 37.2 diluted 1:10 0.788 0.18 19.7 31.1 diluted 1:20 0.583 0.10 9.5 16.2 diluted 1:40 0.378 0.05 5.2 7.1 S2 diluted 1:5 0.740 0.17 17.9 36.0 47.6 diluted 1:10 0.595 0.10 9.8 23.6 diluted 1:20
- TSHR stimulating patient serum 1 TSHR stimulating patient serum 1.
- S2 TSHR stimulating patient serum 2.
- S3 TSHR stimulating patient serum 3.
- S4 TSHR stimulating patient serum 4.
- S5 TSHR stimulating patient serum 5.
- S6 TSHR stimulating patient serum 6. Serum dilutions for both ELISAs were made in HBD.
- NT not tested.
- B1 TSHR blocking patient serum 1 (K1 lymphocyte donor serum).
- B2 TSHR blocking patient serum 2.
- B3 TSHR blocking patient serum 3.
- B4 TSHR blocking patient serum 4.
- B5 TSHR blocking patient serum 5.
- Serum dilutions were made in HBD or assay buffer. a the inhibition of 125 I-TSH binding was carried out using the PEG precipitation assay ( Southgate K, Creagh F, Teece M, Kingwood C, Rees Smith B. A receptor assay for the measurement of TSH receptor antibodies in unextracted serum. Clin Endocrinol 1984; 20: 539-548 ).
- Sera 1-39 are from patients diagnosed with or suspected of having Graves' disease. Sera 1-39 were positive for TRAb in the coated tube assay (based on inhibition of 125 I-binding to full length TSHR coated on the tubes). Sera 40-59 were from healthy blood donors and were negative for TRAb in the coated tube assay.
- Table 12h Measurement of serum TRAb by inhibition of M22-peroxidase binding to the TSHR260 in an ELISA Test sample TRAb ELISA (full length TSHR coated on plates) TRAb ELISA (TSHR260 coated on plates) Mean absorbance at 450nm % inhibition of TSH-biotin binding TRAb concentr.
- Sera 60-71 were positive for TRAb in the coated tube assay (based on inhibition of 125 I-TSH binding to full length TSHR coated on the tubes).
- Sera 72-81 were from healthy blood donors that were negative for TRAb in the coated tube assay.
- Table 12i Ability of TSHR MAbs to bind to full length wild type TSHR and TSHR Arg255 Asp coated on ELISA plate wells.
- TSHR260-AP used to detect MAb binding Wild type TSHR Arg255 Asp TSHR Test sample
- Mean absorbance at 405nm Mean absorbance at 405nm HBD 0.003 0.005 K1-70
- IgG 10 ⁇ g/mL 1.360 0.551 1 ⁇ g/mL 1.172 0.340
- Serum dilutions were made in HBD. Table 12j
- TSHR260-AP used to detect binding Test sample
- Wild type TSHR Arg255 Asp TSHR TRAb level in TSHR coated tube assay Mean absorbance at 405nm ⁇ g/mL (read off K1-70 IgG calibration)
- Serum 1 0.707 0.121 0.558 0.176 14.7 Serum 2 0.798 0.159 0.677 0.227 17.1
- Serum 3 0.647 0.102 0.237 0.076 8.1
- Serum 5 0.560 0.081 0.169 0.057 9.9 Serum 6 0.278 0.034 0.096 0.036 5.9
- Serum 5 0.560 0.081 0.169 0.057 9.9
- Serum 1-10 are from patients with detectable TRAb levels in the coated tube assay.
- a calibration curve using K1-70 IgG (0.005, 0.01, 0.05, 0.1, 0.5, 1.0 and 10 ⁇ g/mL) was run in each assay.
- Table 12k Ability of patient sera with TSHR blocking activity to bind to full length wild type TSHR and TSHR Arg255 Asp coated on ELISA plate wells.
- TSHR260-AP used to detect binding Test sample TSHR260-AP ELISA Wild type TSHR Arg255 Asp TSHR Mean absorbance at 405nm ⁇ g/mL IgG a read off M22 IgG calibration Mean absorbance at 405nm ⁇ g/mL IgG b read off K1-70 IgG calibration Serum 1 undiluted 0.859 0.30 0.879 0.47 1:10 0.484 0.09 0.202 0.08 1:20 0.284 0.05 NT NT 1:40 0.154 0.02 NT NT 1:50 NT NT 0.027 0.02 1:80 0.078 0.01 NT NT 1:100 NT NT 0.015 0.02 1:160 0.037 0.01 NT NT 1:320 0.021 0.00 NT NT Serum 2 undiluted 0.323 0.05 0.274 0.11 1:10 0.097 0.02 0.021 0.02 1:20 0.052 0.01 NT NT 1:40 0.029 0.00 NT NT 1:50 NT
- Serum 1 K1 lymphocyte donor serum.
- Serum 2 patient serum with TSHR blocking autoantibodies.
- Serum 3 patient serum with TSHR blocking autoantibodies.
- Serum 4 patient serum with TSHR blocking autoantibodies.
- Serum 5 patient serum with TSHR blocking autoantibodies.
- Serum dilutions were made in HBD. a A calibration curve using M22 IgG (0.005, 0.01, 0.05, 0.1, 0.5, 1.0 and 10 ⁇ g/mL) was run in each assay.
- b A calibration curve using K1-70 IgG (0.005, 0.01, 0.05, 0.1, 0.5, 1.0 and 10 ⁇ g/mL) was run in each assay.
- Table 12l Ability of patient sera with TSHR stimulating activity to bind to full length wild type TSHR and TSHR Arg255 Asp coated on ELISA plate wells.
- TSHR260-AP used to detect binding Test sample
- TSHR260-AP ELISA Wild type TSHR Arg255 Asp TSHR Mean absorbance at 405nm ⁇ g/mL IgG a read off M22
- IgG calibration Mean absorbance at 405nm ⁇ g/mL IgG b read off K1-70 IgG calibration HBD 0.003 0 -0.01 0
- Serum dilutions were made in HBD.
- Sera S1-S6 are the same sera shown in Table 12e.
- a A calibration curve using M22 IgG (0.005, 0.01, 0.05, 0.1, 0.5, 1.0 and 10 ⁇ g/ml) was run in each assay.
- b A calibration curve using K1-70 IgG (0.005, 0.01, 0.05, 0.1, 0.5, 1.0 and 10 ⁇ g/mL) was run in each assay.
- Table 13a Summary of stimulating MAb K1-18 (IgG1 kappa) properties TSHR binding affinity IgG 0.7 x 10 10 L/mol Fab 0.13 x 10 10 L/mol Inhibition of 125 I-TSH binding to the TSHR IgG (1 ⁇ g/mL) 94% Table 1a 181 units/mg (NIBSC 90/672) Table 2b Fab (1 ⁇ g/mL) 77% Table 2a 86 units/mg (NIBSC 90/672) Table 2b Inhibition of TSH-biotin binding to the TSHR IgG (1 ⁇ g/mL) 96% Table 3a Fab (1 ⁇ g/mL) 93% Table 3b Inhibition of M22 Fab peroxidase binding to the TSHR IgG (1 ⁇ g/mL) 95% Table 4a Fab (1 ⁇ g/mL) 88% Table 4b Stimulation of cyclic AMP in CHO cells expressing TSHR IgG (100 ng/
- c % inhibition 100 x [1 - (cydic AMP in the presence of test samples and TSH/cyclic AMP in the presence of cyclic AMP bufferand TSH)].
- 5B3 is a human monoclonal antibody to GAD (negative control for K1-70).
- ND not determined.
- TSH(2) run at the end of assay. Table 15b TSH induced cyclic AMP production in CHO cells expressing wild type TSHR and TSHR with Ile60 mutated to Ala.
- Table 16 Summary of effects of TSHR mutations (relative to wild type) on the ability of K1-18 IgG to stimulate cyclic AMP and K1-70 IgG to block TSH stimulation of cyclic AMP production in TSHR transfected CHO cells TSHR mutation Stimulation (relative to wild type) of cyclic AMP production by TSH Stimulation (relative to wild type) of cyclic AMP production by K1-18 IgG Blocking (relative to wild type) of TSH stimulation of cyclic AMP production by K1-70 IgG Wild type +++++ +++++ +++++ Asp43 Ala +++++ +++++ +++ IIe60 Ala +++++++++ ++ Glu61 Ala +++++ +++ +++ Thr104 Ala +++++ +++++ +++ His 105 Ala +++++ +++++ +++++ Asp151 Ala ++++ ++++++ +++++ Glu157 Ala +++++ 0 NT Glu178 Ala
Landscapes
- Health & Medical Sciences (AREA)
- Chemical & Material Sciences (AREA)
- Organic Chemistry (AREA)
- Life Sciences & Earth Sciences (AREA)
- Medicinal Chemistry (AREA)
- General Health & Medical Sciences (AREA)
- Immunology (AREA)
- General Chemical & Material Sciences (AREA)
- Pharmacology & Pharmacy (AREA)
- Animal Behavior & Ethology (AREA)
- Nuclear Medicine, Radiotherapy & Molecular Imaging (AREA)
- Public Health (AREA)
- Veterinary Medicine (AREA)
- Chemical Kinetics & Catalysis (AREA)
- Engineering & Computer Science (AREA)
- Genetics & Genomics (AREA)
- Molecular Biology (AREA)
- Proteomics, Peptides & Aminoacids (AREA)
- Biophysics (AREA)
- Biochemistry (AREA)
- Endocrinology (AREA)
- Bioinformatics & Cheminformatics (AREA)
- Diabetes (AREA)
- Biomedical Technology (AREA)
- Neurology (AREA)
- Oncology (AREA)
- Peptides Or Proteins (AREA)
- Preparation Of Compounds By Using Micro-Organisms (AREA)
- Medicines Containing Antibodies Or Antigens For Use As Internal Diagnostic Agents (AREA)
- Micro-Organisms Or Cultivation Processes Thereof (AREA)
Description
- The present invention relates to human monoclonal autoantibodies (MAbs) reactive with the thyroid stimulating hormone (TSH) receptor (TSHR). One of the human MAbs (K1-18) has the ability to bind to the TSHR and to stimulate TSHR cyclic AMP activity. The other human MAb (K1-70) has the ability to bind to the TSHR and to block stimulation of cyclic AMP mediated by TSH and TSHR stimulating antibodies. Both human MAbs were isolated from the peripheral lymphocytes of a patient who presented with clinical symptoms of hypothyroidism.
- Thyroid function is regulated by TSH secreted by the pituitary (Szkudlinski MW, et al 2002. Physiological Reviews 82: 473-502). TSH binds to the TSHR on the surface of thyrocytes and this is the first step in initiating the TSHR signalling cascade. Binding of TSH to the TSHR leads to stimulation of formation and release of thyroid hormones; thyroxine (T4) and tri-iodothyronine (T3). A feedback mechanism involving the levels of T4 and T3 in the circulation and thyrotropin releasing hormone (TRH) secreted by the hypothalamus controls the release of TSH that in turn controls thyroid stimulation and the levels of thyroid hormones in serum (Szkudlinski MW, et al, 2002 supra). The TSHR is a G-protein coupled receptor and is composed of three domains:- a leucine rich repeat domain (LRD), a cleavage domain (CD) and a transmembrane domain (TMD) (Nún̅ez Miguel R, et al 2004. Thyroid 14: 991-1011).
- It is well documented in the art that some patients with autoimmune thyroid disease (AITD) develop autoantibodies which are reactive with the TSHR (Rees Smith B, et al 1988. Endocrine Reviews 9: 106-121). There are two main types of TSHR autoantibodies (TRAbs); a stimulating type and a blocking type. Thyroid stimulating type autoantibodies bind to the TSHR and mimic the actions of TSH thereby stimulating the thyroid to produce high levels of T4 and T3; these autoantibodies are also described as TRAbs with stimulating activity or TSH agonist activity (Rees Smith B, et al 2007. Thyroid 17: 923-938). The feedback control mechanism of thyroid function is no longer effective in the presence of thyroid stimulating autoantibodies and patients present with the clinical symptoms of a hyperactive thyroid characterised by an excess of thyroid hormones in serum and its metabolic consequences. This condition is known as Graves' disease. TRAbs with stimulating activity may also interact with the TSHRs in retroorbital tissue and contribute to the development of the eye signs of Graves' disease. A human monoclonal autoantibody which acts as a powerful thyroid stimulator (hMAb TSHR1; also referred to as M22) has been described in detail in
WO 2004/050708A2 . The structure of the complex of M22 Fab bound to the TSHR LRD has been solved by x-ray crystallography at 2.55 A resolution as described inWO2008/025991A1 . Analysis of the structure of the TSHR - M22 complex provides detailed information about the receptor residues and the stimulating autoantibody residues involved in interactions with each other. - M22 has been used in ELISA for TSHR antibody measurement (Zöphel, K et al, Clinica Chimica Acta 2009 and Zöphel, K et al, Clinica Chimica Acta 2008.
- Blocking type TRAbs occur less frequently in patients with AITD than stimulating autoantibodies. Blocking type autoantibodies bind to the TSHR, prevent TSH from binding to the receptor but have no ability to stimulate TSHR activity. Consequently formation and secretion of thyroid hormones (T4 and T3) is greatly reduced and the patients with this type of TRAb can present with clinical symptoms of an under-active thyroid (hypothyroidism). Blocking type autoantibodies are known as TRAbs with blocking activity or TSH antagonist activity (Rees Smith B, et al 1988 supra and Rees Smith B, 2007 et al supra). TRAbs with blocking activity when present in serum of pregnant women cross the placenta and may block the TSHRs in the foetal thyroid leading to neonatal hypothyroidism and serious consequences for development. Furthermore, TRAbs with blocking activity can be found in breast milk of affected mothers and may cause clinical hypothyroidism in the baby (Evans C, et al 2004 European Journal of Endocrinology 150: 265-268). A human autoantibody to the TSHR with TSH antagonist activity (5C9) has been described in detail in
WO 2008/099185A1WO2006/016121A1 provides a means to discriminate between stimulating and blocking types of TRAbs using bioassays that employ TSHR mutated at R255. - Human recombinant TSH (Thyrogen®) is a preparation of human TSH produced under cGMP regulations as a recombinant protein and approved by the US FDA as an aid in the diagnosis of residual or recurrent thyroid cancer (Duntas LH, Cooper DS 2008 Thyroid 18: 509-516). Monitoring of thyroid cancer patients after treatment includes stimulation of thyroid remnants or metastases with recombinant human TSH followed by a thyroid scan and/or measurement of serum thyroglobulin levels (Duntas LH and Cooper DS 2008 supra). Human chorionic gonadotropin is a hormone produced during pregnancy which has mild thyroid stimulating effects (Grossmann M et al 1997 Endocrine Reviews 18: 476-501). Characterisation of stimulating or blocking types of TRAbs and how they interact with the TSHR is of critical importance for development of improved methods to diagnose and manage different forms of AITD. In addition these studies are critical for developing new strategies for the management of diseases associated with an autoimmune response to the TSHR. The availability of potent thyroid stimulators other than recombinant human TSH provides new alternatives for monitoring and managing thyroid cancer patients.
- Antibodies isolated from peripheral blood lymphocytes of patients with Graves' disease have been reported to block binding of TSH to TSHR by Valente et al (1982, Proceedings of the National Academy of Sciences of USA 79: 6680-6684) while antagonistic and agonistic human TSHR specific antibodies have been reported by Kohn et al (1997, Journal of Clinical Endocrinology and Metabolism 82: 3998-4009).
- The invention described in
WO2004/050708A2 provides details of the properties of a human monoclonal autoantibody (MAb) with powerful stimulating activity and its interaction with the TSHR. The interactions between this autoantibody (M22) and the TSHR LRD have been solved at the molecular level from an X-ray diffraction analysis (2.55 A resolution) of a complex between the two molecules as described inWO2008/025991A1 .WO2006/016121A1 discloses a mutated TSHR preparation including at least one point mutation which can be used in the differential screening and identification of patient serum stimulating TSHR autoantibodies, patient serum blocking TSHR autoantibodies and TSH in a sample of Summary of the Invention body fluid from a patient being screened. Generation and characterisation of a mouse MAb (9D33) with TSHR blocking activity is also described inWO2004/050708A2 . 9D33 binds to the TSHR with high affinity (2 x 10¹⁰ L/mol) and is an effective antagonist of TSH, hMAb TSHR1 (M22) and patient serum TRAbs with stimulating or blocking activities.WO2008/099185A1 discloses the isolation and characterisation of human MAb (5C9) to the TSHR that is an effective antagonist of TSH and of stimulating TRAbs in patient sera. 5C9 has been found unexpectedly to inhibit TSHR constitutive activity (also referred to as the TSHR basal activity), that is to say the production of cyclic AMP in a test system in the absence of TSH or M22. Furthermore, 5C9 has been found to inhibit TSHR cyclic AMP activity associated with TSHR activating mutations.WO2008/091981A2 describes a mouse MAb that has the ability to suppress the constitutive activity of TSHR and the methods of using the MAb to treat thyroid diseases including hyperthyroidism and thyroid cancer. The properties of the MAb described inWO2008/091981A2 are also disclosed in Chen CR et al 2007 Endocrinology 148: 2375-2382. - Antibodies K1-18 and K1-70 have been isolated from the peripheral blood lymphocytes of a 54 year old female patient with hypothyroidism and high levels of TSHR autoantibodies. The patient had an 8 year history of AITD and first presented with hyperthyroidism and responded to treatment with methimazole which continued for 3 years. However, approximately 10 months after reaching the euthyroid state (i.e. having normal function) the patient developed hypothyroidism and was treated with thyroxine. The patient had been hypothyroid for approximately 4.5 years at the time of blood collection. At the time of lymphocyte isolation serum TRAb levels were 160 Units/L measured by TSH binding inhibition assay. The serum also showed an ability to block TSH stimulation of the TSHR (cyclic AMP based assay). Serum autoantibodies to thyroid peroxidase were positive at >500 Units/mL (Units are of the
reference preparation 66/387 from National Institute for Standards and Control (NIBSC) Potters Bar, UK). - The patient's lymphocytes were immortalised by infection with Epstein Barr virus (EBV) and supernatants of cultures of the infected cells screened for their ability to inhibit 125I-TSH binding to TSHR coated tubes. Cells from positive cell cultures were fused with a mouse/human cell line and screened as above. 2 stable clones secreting TSHR autoantibodies were obtained. IgGs were purified from supernatants of the clone cultures and the ability of the 2 MAbs (K1-18 and K1-70) IgGs to bind to the TSHR and influence TSHR activity assessed. In particular, the ability of K1-18 or K1-70 to inhibit TSH binding to the TSHR was studied. The ability of K1-18 to stimulate the TSHR was also studied and compared to the activity of various other thyroid stimulators. The ability of K1-70 to inhibit the ability of TSH to stimulate the TSHR was studied and compared to the activities of other TSH antagonists. Furthermore, the ability of stimulating or blocking patient serum TRAbs to inhibit TSHR binding and biological activity of K1-18 and K1-70 was assessed. In addition, the use of K1-18 and K1-70 in assays for TSHR antibodies, TSH and related compounds was investigated. Variable region (V region) genes of the heavy (HC) and light chains (LC) of K1-18 and K1-70 were sequenced and the complementarity determining regions (CDRs) assigned. Furthermore, purified preparations of K1-70 Fab were crystallised and analysed using X-ray diffraction methods. These analyses provided molecular level details about the overall structure of K1-70 Fab and the topography of the antigen binding site of K1-70.
- According to one aspect of the invention there is provided an isolated human antibody molecule which binds to a TSHR and which reduces ligand induced stimulation of said TSHR but has no effect on constitutive activity of said TSHR wherein the isolated human antibody molecule has the characteristic of patient serum TSHR autoantibodies of inhibiting TSH and M22 binding to the TSHR, and wherein the isolated human antibody molecule comprises SEQ ID No: 70 (CDR I), SEQ ID No: 71 (CDR II) and SEQ ID No: 72 (CDR III) and SEQ ID No: 42 or 52 (CDR I), SEQ ID No: 43 or 53 (CDR II) and SEQ ID No: 44 or 54 (CDR III).
- Preferably the isolated human antibody molecule or fragment thereof has at least one further characteristic of patient serum TSH receptor autoantibodies selected from having a binding affinity for the TSHR of at least 108 L/mol, preferably at least 109 L/mol and the ability to cause detectable blocking of ligand-induced TSHR stimulation at an antibody concentration of less than 1µg/mL, preferably less than 0.1µg/mL. The isolated human antibody may be an antagonist of TSH and/or thyroid stimulating autoantibodies and/or of human chorionic gonadotropin.
- The isolated antibody molecule may comprise an antibody VH domain selected from the amino acid sequence of
Figure 5b and5d (SEQ ID No Figure 5b and5d (SEQ ID No Figure 6d (SEQ ID No 69). The isolated antibody molecule may comprise an antibody VL domain consisting preferably of an amino acid sequence ofFigure 6d (SEQ ID No 69). - In most applications a VH domain -in an antibody molecule according to the invention will be arranged with a VL domain to provide a TSHR binding site. In some applications a VH domain alone may be provided to bind a TSHR.
- Methods of grafting antibody domains are well known in the art such that an antibody molecule in accordance with the invention can be constructed using VH and VL domains or portions thereof from different sources.
- The term "antibody molecule" and cognate terms, such as "antibody molecules", used herein in relation to antibody molecules of the invention embraces, according to context, immunoglobulin-based binding moieties such as monoclonal, recombinant, synthetic and polyclonal antibodies, single chain antibodies, multi-specific antibodies and also binding moieties, which may be substituted by the skilled addressee for such immunoglobulin-based binding moieties, such as domain antibodies, diabodies, as well as IgG[Delta]CH2, F(ab')2), Fab, scFv, VL, VH, dsFv, Minibody, Triabody, Tetrabody, (scFv)2, scFv-Fc, F(ab')3 moieties (Holliger P, et al 1993 Proc Natl Acad Sci USA 90: 6444-6448.), (
Carter PJ 2006 Nat Rev Immunol 6: 343-357 - The terms "thyroid stimulating hormone receptor" and "TSHR" refer to full length human TSHR having the amino acid sequence shown in
Figure 7a (SEQ ID No 74) or variants or fragments thereof having high homology with such TSHR. Preferably, such variants and fragments have 70 to 99.9% homology with the amino acid sequence shown inFigure 7a (SEQ ID No 74). In preferred embodiments such variants or fragments are at least 70% identical, more preferably at least 80% identical, highly preferably at least 90% identical, particularly preferred at least 95% identical and especially preferred 99.9% identical to that sequence. - The isolated antibody of the invention may preferably be in the form of a monoclonal antibody, a recombinant antibody or a synthetic antibody. CDRs I, II or III from the K1-70 VH or VL domains may be incorporated into a suitable framework. Variants of the K1-70 VH and VL domains and their CDRs can be produced by modifications using methods well known to those skilled in the field. Such variants may comprise one or more amino acid sequence variations, including the addition, deletion, substitution or insertion mutations. The framework of K1-70 may also be modified in antibody molecules according to the invention.
- According to another aspect of the invention there is provided an isolated nucleotide encoding an isolated antibody molecule or fragment thereof according to the invention.
- The isolated nucleotide may comprise a nucleotide sequence of 5a (SEQ ID No 37), 5c (SEQ ID No 46) or 6c (SEQ ID No 64).
- A plurality of such nucleotides may be provided, for example in a bacteriophage display library. Such bacteriophage display libraries may be used to express a variety of antibody molecules or fragments thereof such as isolated domains.
- The invention also provides a vector including an isolated nucleotide according to the invention, or a host cell including such a vector or a nucleotide according to the invention. The vector may be a plasmid, virus or fragment thereof. _Many different types of vectors are known to the skilled addressee. The isolated cell may express an antibody according to the invention. Preferably, the isolated cell secretes an antibody according to the invention. Preferably an isolated cell according to the invention is from a stable hetero-hybridoma cell line.
- According to another aspect of the invention there is provided a pharmaceutical composition comprising an isolated antibody molecule according to the invention, and, optionally, a carrier.
- A pharmaceutical composition according to the invention may be suitable for human administration. Preferably a pharmaceutical composition according to the invention has no significant adverse effect on the immune system of the subject.
- Various formats are contemplated for pharmaceutical compositions according to the invention. A pharmaceutical composition according to the invention for use in the treatment of a thyroid-related condition may be in an injectable format. A pharmaceutical composition according to the invention for use in the treatment of ophthalmic Graves' disease is preferably in the form of eye drops. Pharmaceutical compositions of this invention comprise an isolated antibody in accordance with the invention, with a pharmaceutically acceptable carrier, adjuvant or vehicle. Pharmaceutically acceptable carriers, adjuvants and vehicles that may be used in the pharmaceutical compositions of this invention include, but are not limited to, ion exchangers, alumina, aluminium stearate, lecithin, serum proteins, such as human serum albumin, buffer substances such as phosphates, glycine, sorbic acid, potassium sorbate, partial glyceride mixtures of saturated vegetable fatty acids, water, salts or electrolytes, such as protamine sulphate, disodium hydrogen phosphate, potassium hydrogen phosphate, sodium chloride, zinc salts, colloidal silica, magnesium trisilicate, polyvinyl pyrrolidone, cellulose-based substances, polyethylene glycol, sodium carboxymethylcellulose, polyacrylates, waxes, polyethylene- polyoxypropylene-block polymers, polyethylene glycol and wool fat. The pharmaceutical compositions of the invention may be administered orally, parenterally, by inhalation spray, topically, by eyedrops, rectally, nasally, buccally, vaginally or via an implanted reservoir. We prefer oral administration or administration by injection. The term "parenteral" as used herein includes subcutaneous, intracutaneous, intravenous, intramuscular, intra-articular, intrasynovial, intrastemal, intrathecal, intralesional and intracranial injection or infusion techniques. The pharmaceutical compositions may be in the form of a sterile injectable preparation, for example, as a sterile injectable aqueous or oleaginous suspension. This suspension may be formulated according to techniques known in the art using suitable dispersing or wetting agents (such as, for example, Tween 80) and suspending agents. The sterile injectable preparation may also be a sterile injectable solution or suspension in a non-toxic parenterally- acceptable diluent or solvent, for example, as a solution in 1,3-butanediol. Among the acceptable vehicles and solvents that may be employed are mannitol, water, Ringer's solution and isotonic sodium chloride solution. In addition, sterile, fixed oils are conventionally employed as a solvent or suspending medium. For this purpose, any bland fixed oil may be employed including synthetic mono- or diglycerides. Fatty acids, such as oleic acid and its glyceride derivatives are useful in the preparation of injectables, as are natural pharmaceutically-acceptable oils, such as olive oil or castor oil, especially in their polyoxyethylated versions. These oil solutions or suspensions may also contain a long-chain alcohol diluent or dispersant such as Ph. Helv or a similar alcohol. The pharmaceutical compositions of this invention may be orally administered in any orally acceptable dosage form including, but not limited to, capsules, tablets, and aqueous suspensions and solutions. In the case of tablets for oral use, carriers which are commonly used include lactose and corn starch. Lubricating agents, such as magnesium stearate, are also typically added. For oral administration in a capsule form, useful diluents include lactose and dried com starch. When aqueous suspensions are administered orally, the active ingredient is combined with emulsifying and suspending agents. If desired, certain sweetening and/or flavouring and/or colouring agents may be added. The pharmaceutical compositions of this invention may also be provided in the form of suppositories for rectal administration. These compositions can be prepared by mixing a compound of this invention with a suitable non-irritating excipient which is solid at room temperature but liquid at the rectal temperature and therefore will melt in the rectum to release the active components. Such materials include, but are not limited to, cocoa butter, beeswax and polyethylene glycols. Topical administration of the pharmaceutical compositions of this invention is especially useful when the desired treatment involves areas or organs readily accessible by topical application. For application topically to the skin, the pharmaceutical composition should be formulated with a suitable ointment containing the active components suspended or dissolved in a carrier. Carriers for topical administration of the compounds of this invention include, but are not limited to, mineral oil, liquid petroleum, white petroleum, propylene glycol, polyoxyethylene polyoxypropylene compound, emulsifying wax and water. Alternatively, the pharmaceutical composition can be formulated with a suitable lotion or cream containing the active compound suspended or dissolved in a carrier. Suitable carriers include, but are not limited to, mineral oil, sorbitan monostearate,
polysorbate 60, cetyl esters wax, cetearyl alcohol, 2-octyldodecanol, benzyl alcohol and water. The pharmaceutical compositions of this invention may also be topically applied to the lower intestinal tract by rectal suppository formulation or in a suitable enema formulation. Topically-transdermal patches are also included in this invention. The pharmaceutical compositions of this invention may be administered by nasal aerosol or inhalation. Such compositions are prepared according to techniques well-known in the art of pharmaceutical formulation and may be prepared as solutions in saline, employing benzyl alcohol or other suitable preservatives, absorption promoters to enhance bioavailability, fluorocarbons, and/or other solubilising or dispersing agents known in the art. - Antibodies according to the first mentioned aspect of the invention have potential applications for management and control of conditions associated with TSHR activation for example: Graves' disease, Graves' opthalmopathy or hyperthyroidism due to abnormal levels of TSH or hCG.
- According to another aspect of the invention there is provided the use of an isolated antibody molecule or a pharmaceutical composition according to the invention in therapy. The invention also provides an isolated antibody molecule or a pharmaceutical composition according to the invention for use in therapy.
- According to another aspect of the invention there is provided an in vitro method of characterising the activity of TSHR antibodies, TSH or human chorionic gonadotropin, the method comprising a step including the use of an isolated antibody molecule according to the invention.
- According to another aspect of the invention there is provided an in vitro diagnostic method for detecting an analyte autoantibodies to the TSHR comprising contacting a sample, which has been isolated from a subject believed to contain such analyte autoantibodies, and an antibody molecule of the invention with a TSHR or a fragment thereof. The TSHR or fragment thereof may be mutated at
arginine 255 so that it interacts preferentially with analyte blocking-type TSHR antibodies compared to analyte stimulating-type TSHR antibodies. Analyte binding to TSHR260 or TSHR260 mutated atarginine 255 may be detected by inhibition of binding of a directly or indirectly labelled TSHR antibody or fragment thereof to said TSHR260 or TSHR260 mutated atarginine 255. - A suitable detectable label that can be employed in a method according to the present invention can be selected from the group consisting of enzymic labels, isotopic labels, chemiluminescent labels, fluorescent, dyes and the like.
- In the case where an isotopic label (such as 125I, 14C, 3H or 35S) is employed, monitoring may therefore comprise measuring radioactivity dependent on binding of an antibody molecule according to the present invention. Radioactivity is generally measured using a gamma counter, or liquid scintillation counter.
- The present invention may provides new and/or improved means to:
- 1 Prevent thyroid stimulating autoantibodies binding to the TSHR in the thyroid and thereby providing a new treatment for Graves' disease.
- 2 Prevent TSHR autoantibodies binding to the extra-thyroidal TSHRs (for example in retro-orbital tissue or pre-tibial tissue) and thereby providing improved opportunities for the management of Graves' ophthalmopathy and pre-tibial myxoedema.
- 3 Determine TSHR amino acids critical for binding TRAbs with stimulating activities.
- 4 Determine TSHR amino acids critical for binding TRAbs with blocking activities.
- 5 Compare the TSHR amino acids critical for binding of TRAbs with stimulating and blocking activities.
- 6 Develop new assays for TRAbs that differentiate between blocking and stimulating antibodies.
- 7 Develop new assays for TRAb based on using thermostable TSHR fragments.
- 8 Determine TSHR amino acids critical for ligand-induced TSHR activation.
- 9 Determine TSHR amino acids critical for ligand-induced TSHR inactivation.
- 10 Determine the blocking autoantibody amino acids critical for binding to the TSHR.
- 11 Determine the blocking autoantibody amino acids critical for affecting TSH or thyroid stimulating antibody-mediated TSHR activation.
- 12 Control hyperthyroidism of Graves' disease, neonatal hyperthyroidism and the eye signs of Graves' disease. Alternatively, the thyroid-related condition may be hypothyroidism related to the presence of TRAbs with blocking activity in patients with AITD, or neonatal hypothyroidism due to transfer of maternal blocking type TRAbs (via placenta or breast milk).
- 15 Understand molecular differences between TSHR autoantibodies with thyroid stimulating or blocking activity produced by the immune system of the same patient and by the immune system of different patients.
- 16 Understand the immunological mechanisms involved in development and production of stimulating and blocking TSHR autoantibodies.
- 17 Understand the mechanisms including evolutionary driving forces which are the basis of the molecular mimicry between TSH and TSHR autoantibodies.
- Antibody molecules and methods in accordance with the invention will now be described, by way of example only, with reference to the accompanying drawings,
Figures 1 to 9 , in which: -
Figure 1 shows association and dissociation characteristics of binding of 125I-labelled K1-70 or 125I-labelled K1-18 to the TSHR: (a) the time course of binding of 125I-labelled K1-70 IgG and Fab to full length TSHR; (b) the time course of binding of 125I-labelled K1-70 IgG to TSHR260; (c) the time course of 125I-labelled K1-70 Fab to TSHR260; (d) the dissociation of 125I-labelled K1-70 IgG from the TSHR(full length) in the presence of various ligands; (e) the dissociation of 125I-labelled K1-70 IgG from TSHR (full length) in the presence of K1-18 Fab; (f) the dissociation 125I-labelled K1-70 Fab from the TSHR(full length) in the presence of various ligands; (g) the dissociation of 125-labelled K1-70 IgG from TSHR260 in the presence of various ligands; (h) the dissociation of 125I-labelled K1-70 IgG from TSHR260 in the presence of K1-18 Fab; (i) the dissociation of 125I-labelled K1-70 Fab from the TSHR260 in the presence of various ligands; (j) the time course of binding of 125I-labelled K1-18 IgG to full length TSHR and TSHR260; (k) the dissociation of 125I-labelled K1-18 IgG from full length TSHR in the presence of various ligands; and (I) the dissociation of 125I-labelled K1-18 IgG from TSHR260 in the presence of various ligands; -
Figure 2 shows the results of measurements of TSHR autoantibodies in patient sera: (a) comparison of the measurements in a TRAb coated tube assay (based on inhibition of TSH binding) and in a TSHR260-AP ELISA; (b) comparison of measurements by ELISAs based on inhibition of M22 binding to full length TSHR and by inhibition of M22 Fab binding to TSHR260 in the ELISA; (c) comparison of measurements in a TRAb coated tube assay (based on inhibition of TSH binding) and by inhibition of M22 Fab binding to TSHR260 coated plates in an ELISA; and (d) comparison of the measurements in a TRAb ELISA (based on inhibition of M22 binding) and in a TSHR260-AP ELISA; -
Figure 3 gives the variable region sequences of K1-18 heavy chain (HC): (a) the oligonucleotide sequence of K1-18 HC (SEQ ID No 1) shown in unannotated and annotated forms. In the annotated forms, sequences used for PCR primers are underlined; for individual Complementarity Determining Regions (CDRs) are boxed; and constant regions are in bold; (b) the amino acid sequence of K1-18 HC (SEQ ID No 5) derived from the oligonucleotide sequence shown in (Figure 3a ) in unannotated and annotated forms; (c) the preferred oligonucleotide sequence of K1-18 HC (SEQ ID No 10) with the actual N-terminal sequence (the leader sequence) shown in unannotated and annotated forms. In the annotated forms, sequences used for PCR primers are underlined, the leader sequence is shown in lowercase letters; individual CDRs are boxed; and constant regions are in bold; and (d) the preferred amino acid sequence of K1-18 HC (SEQ ID No 15) with the leader sequence derived from the oligonucleotide sequence shown inFigure 3c in unannotated and annotated forms; -
Figure 4 gives the variable region sequences of K1-18 light chain (LC): (a) the oligonucleotide sequence of K1-18 LC (SEQ ID No 19) shown in unannotated and annotated forms. In the annotated forms, sequences used for PCR primers are underlined; individual CDRs are boxed; and constant regions are in bold; (b) the amino acid sequence of K1-18 LC (SEQ ID No 23) derived from the oligonucleotide sequence shown inFigure 4a in unannotated and annotated forms; (c) the preferred oligonucleotide sequence of K1-18 LC (SEQ ID No 28) with the actual N-terminal sequence (the leader sequence) shown in unannotated and annotated forms. In the annotated forms, sequences used for PCR primers are underlined, the leader sequence is shown in lowercase letters; individual CDRs are boxed; and constant regions are in bold; and (d) the preferred amino acid sequence of K1-18 LC (SEQ ID No 33) with the leader sequence derived from the oligonucleotide sequence shown inFigure 4c in unannotated and annotated forms; -
Figure 5 gives the variable region sequences of K1-70 heavy chain (HC): (a) the oligonucleotide sequence of K1-70 HC (SEQ ID No 37) shown in unannotated and annotated forms. In the annotated forms, sequences used for PCR primers are underlined; individual CDRs are boxed; and constant regions are in bold; (b) the amino acid sequence of K1-70 HC (SEQ ID No 41) derived from the oligonucleotide sequence shown inFigure 5a in unannotated and annotated forms; (c) the preferred oligonucleotide sequence of K1-70 HC (SEQ ID No 46) with the actual N-terminal sequence (the leader sequence) shown in unannotated and annotated forms. In the annotated forms, sequences used for PCR primers are underlined, the leader sequence is shown in lowercase letters; individual CDRs are boxed; and constant regions are in bold; and (d) the preferred amino acid sequence of K1-70 HC (SEQ ID No 51) with the leader sequence derived from the oligonucleotide sequence shown inFigure 5c in unannotated and annotated forms; -
Figure 6 gives the variable region sequences of K1-70 light chain (LC): (a) the oligonucleotide sequence of K1-70 LC (SEQ ID No 55) shown in unannotated and annotated forms. In the annotated forms, sequences used for PCR primers are underlined; individual CDRs are boxed; and constant regions are in bold; (b) the amino acid sequence of K1-70 LC (SEQ ID No 59) derived from the oligonucleotide sequence shown inFigure 6a in unannotated and annotated forms; (c) the preferred oligonucleotide sequence of K1-70 LC (SEQ ID No 64) with the actual N-terminal sequence (the leader sequence) shown in unannotated and annotated forms. In the annotated forms, sequences used for PCR primers are underlined, the leader sequence is shown in lowercase letters; individual CDRs are boxed; and constant regions are in bold; (d) the preferred amino acid sequence of K1-70 LC (SEQ ID No 69) with the leader sequence derived from the oligonucleotide sequence shown inFigure 6c in unannotated and annotated forms; and (e) the actual N-terminal amino acid sequence (amino acids 2-21) (SEQ ID No 73) determined by Edman degradation reaction; -
Figure 7 gives the amino acid sequence of the human TSHR: (a) illustrates the consensus amino acid sequence of the human TSHR (amino acids 1-764 (SEQ ID No 74) (accession no.P16473. http://www.ncbi.nlm.nih.govlentrezlviewer.fcgi?db=protein&val=62298994); (b) illustrates the consensus amino acid sequence of the human TSHR amino acids 1-260. The leader sequence (amino acids 1-21) is shown in lowercase and the histidine sequence added for purification purposes is shown at the C-terminus in bold (SEQ ID No 75); and (c) illustrates the amino acid sequence of the human TSHR LRD C-CAP. The leader sequence (amino acids 1-21) is shown in lowercase and the histidine sequence added for purification purposes is shown at the C-terminus in bold (SEQ ID No 76); -
Figure 8 gives the coordinates of K1-70 Fab at 2.22Å resolution. -
Figure 9 shows the: (a) Structure of K1-70 Fab - representation of structure in Joy format; (b) Electrostatic potential of the combining site of K1-70 Fab; and (c) Aromatic amino acids of the combining site of K1-70 Fab. - The monoclonal autoantibodies K1-18 and K1-70 were isolated using the procedure described in
WO2004/050708A2 . Lymphocytes were isolated from a blood sample collected from a patient with an 8 year clinical history of AITD and high levels of TRAbs. Patient consent and Local Ethical Committee approval were obtained. The patient was first diagnosed with hyperthyroidism, reached the euthyroid state after treatment with methimazole, however, approximately 4.5 years prior to blood collection she developed hypothyroidism. At the time of blood collection the patient was being treated with thyroxine (50µg daily). The lymphocytes were infected with Epstein Barr Virus (EBV) (European Collection of Cell Cultures - ECACC; Porton Down, SP4 0JG, UK) and cultured on mouse macrophage feeder layers as described inWO2004/050708A2 . Immortalised lymphocytes secreting TSHR autoantibodies were fused with a mouse/human hybrid cell line K6H6/B5 (ECACC) and cloned four times by limiting dilution to obtain a single colony. The presence of TSHR autoantibody in cell culture supernatants at different stages of cloning was detected by inhibition of labelled TSH binding to the TSHR (WO2004/050708A2 ). Two single clones producing the TSHR autoantibodies were expanded and supernatants from the cultures were harvested for autoantibody purification. One clone was designated as K1-18 and the other as K1-70. - TSHR human MAbs IgGs were purified from culture supernatants using protein A affinity chromatography on MabSelect™ (GE Healthcare, UK) as described in Sanders J et at 2004. Thyroid 2004 14: 560-570) and purity assessed by SDS-polyacrylamide gel electrophoresis (PAGE). The heavy chain isotype was determined using a radial diffusion assay (The Binding Site; Birmingham, B29 6AT, UK), and the light chain isotype was determined by Western biotting with anti-human kappa chain and anti-human lambda chain specific mouse monoclonal antibodies (Sigma-Aldrich Company Ltd, Poole, UK). Purified K1-18 IgG was treated with mercuripapain (Sigma Aldrich, Poole, UK) at a IgG/enzyme ratio of 100:1 in phosphate buffered saline (PBS; 137 mmol/L NaCl, 8.1 mmol/L Na2HPO4, 2.7 mmol/L KCL, 1.47 mmol/L KH2PO4, pH 7.4 containing cysteine at final concentration of 1 mmol/L and EDTA at final concentration of 2 mmol/L) for 4 hours at 37°C. The reaction was stopped by addition of iodoacetamide (final concentration of 50 mmol/L) for 30 minutes at room temperature. The reaction mixture was then passed through a MabSelect column to remove any intact IgG or Fc fragments from the Fab preparation. The Fab containing solution was dialysed into PBS containing 3.1 mmol/l NaN3 and concentrated using a Centriprep concentrator (Millipore, Watford, WD18 8YH, UK) when appropriate. K1-70 Fab were obtained using similar method except that an IgG/enzyme ratio of 200:1 was used and the digestion with enzyme was for 1 hour at 37°C. Analysis by SDS-PAGE indicated that intact IgG was undetectable in the Fab preparations. IgG preparations were labelled with125I as described in Sanders J et al 1999. Journal of Clinical Endocrinology and Metabolism. 1999 84: 3797-3802) or with biotin hydrazide (Perbio Science, Cramlington, UK) (Rees Smith et al 2004. Thyroid 14: 830-835).
- Binding inhibition assays were carried out using TSHR coated tubes as described in
WO2004/050708A2 . In the assay, 100 µL of test sample (MAb preparation, patient serum or unlabelled TSH) and 50 µL of start buffer (RSR Ltd) were incubated in TSHR coated tubes for 2 hours at room temperature with gentle shaking. After aspiration, the tubes were washed and 100 µL of 121I-labelled protein (5 x 10⁴cpm) added and incubated for 1 hour at room temperature with shaking. The tubes were then aspirated, washed and counted in a gamma counter. Inhibition of labelled protein binding was calculated as 100 x [1 -(cpm bound in the presence of test material/cpm bound in the presence of control material)]. MAb preparations used in these experiments were K1-18, K1-70, M22, 5C9, 9D33 described above. TSMAbs 1-7 are mouse thyroid stimulating MAbs (WO 03/01863 - Unlabelled K1-18 or K1-70 IgG in 50 µL of assay buffer (50 mmol/L NaCl, 10 mmol/L Tris pH 7.8 and 0.1 % Triton X-100) and 50 µL start buffer (RSR Ltd) and 50 µL of 125I-labelled K1-18 or K1-70 IgG respectively (30,000 cpm in assay buffer) were incubated in TSHR coated tubes for 2 hours at room temperature with shaking (maximum binding occurred under these conditions), aspirated, washed twice with 1 mL of assay buffer and counted in a gamma counter. The concentration of IgG bound vs bound/free was plotted (
Scatchard G 1949. Annals of the New York Academy of Sciences 51: 660-672 - A TRAb ELISA based on TSH-biotin binding to TSHR coated ELISA wells was used as described previously (Bolton J, et al 1999 Clinical Chemistry 45: 2285-2287). In the
assay 75 µL of test sample was added to 75 µL of start buffer in the plate wells and incubated for 2 hours at room temperature with shaking at about 500 shakes/minute. After washing 100 µL of TSH-biotin was added and incubation continued for 25 minutes without shaking. The wells were washed again, the reaction developed using described standard procedures and the absorbance of each well read at 450nm. - Inhibition of TSH-biotin binding was calculated as: 100 x [1 - (test sample absorbance at 450nm/negative control sample absorbance at 450nm)]. MAb preparations used in these experiments were K1-18, K1-70, M22, 5C9, 9D33 described above. TSMAbs 1-7 are mouse thyroid stimulating MAbs (
WO03/01863 - A TRAb ELISA based on labelled M22 (M22 Fab-POD) binding to TSHR coated ELISA wells was used (Rees Smith B, et al 2004 supra). The assay was carried out as the TSH-biotin based ELISA except the first incubation was for 1 hour. Results were expressed as inhibition of M22 binding using the formula: 100 x [1 - (test sample absorbance at 450nm/negative control sample absorbance at 450nm)]. MAb preparations used in these experiments were K1-18, K1-70, M22, 5C9, 9D33 described above. TSMAbs 1-7 are mouse thyroid stimulating MAbs (Patent application number
WO03/01863 - The ability of K1-18 or K1-70 IgG and other preparations to stimulate production of cyclic AMP in Chinese hamster ovary (CHO) cells transfected with the human TSHR was tested as described in
WO2004/050708A2 . CHO cells expressing either approximately 5 x 10⁴ or approximately 5x10⁵ TSHR per cell were seeded into 96-well plates at 3 x 10⁴ cells per well, adapted into DMEM (Invitrogen Ltd, Paisley, UK) without foetal calf serum and then test samples (TSH, IgG or patient serum) added (100 µL diluted in cyclic AMP assay buffer i.e. NaCl free Hank's Buffered Salts solution containing 1 g/L glucose, 20 mmol/L HEPES, 222 mmol/L sucrose, 15 g/L bovine serum albumin and 0.5 mmol/L 3 isobutyl-1-methylxanthine pH 7.4; cyclic AMP assay hypotonic buffer) and incubated for 1 hour at 37°C. After removal of test solutions, cells were lysed and cyclic AMP concentration in the lysates assayed using Direct Cyclic AMP Correlate - EIA kits from Assay Designs; Cambridge Bioscience, UK. Results are expressed as pmol/mL of cyclic AMP in the cell lysate (200 µL). Some experiments were carried out under isotonic buffer condition. In these experiments Krebs Ringer Hepes buffer (KRH buffer) was used (124 mmol/L NaCl, 5 mmol/L KCI, 1.25 mmol/L MgSO4, 1.45 mmol/L CaCl2, 1.25 mmol/L KH2PO4, 25 mmol/L HEPES, 8 mmol/glucose, 0.5 g/L bovine serum albumin, 0.5mmol/L 3 isobutyl-1-methylxanthine, pH 7.4). Cells were allowed to reach the required density, the culture medium removed and the cells washed with 1 mL of KRH buffer. Fresh KRH buffer was then added and the cells incubated for 30 minutes at 37°C. The buffer was then removed and replaced with fresh KRH buffer containing test sample. (TSH, MAb preparations, serum samples etc). The next steps were then carried out as described above for the experiments under the hypotonic conditions (i.e. in cyclic AMP assay buffer). In some experiments the effect of various MAbs on the TSHR stimulating activity of various preparations (for example, TSH, human MAbs, patient sera) measured as described above was assessed. This was carried out by comparing (a) the stimulating activity of the sample alone with (b) stimulating activity in the presence of various MAbs. - The ability of K1-70 IgG and other preparations to inhibit the stimulating activity of porcine (p) TSH, native human (h) TSH and recombinant human (rh) TSH, MAb M22, MAb K1-18 and patient serum TRAbs in CHO cells expressing TSHRs was assessed. This was carried out by comparing the stimulatory effect of TSH, M22, K1-18 or TRAbs in the absence and in the presence of K1-70 IgG (or other preparations being tested). The assay was carried out as described above except 50 µL of K1-70 (or other preparations being tested) diluted in cyclic AMP assay buffer was added to the cell wells followed by 50 µL of TSH or M22 or K1-18 or patient serum (diluted as appropriate in cyclic AMP assay buffer) and incubated and tested as for the stimulating assay described above. Other MAbs and sera from patients with blocking type TRAbs were tested in this assay in addition to K1-70.
- The association and dissociation of K1-18 IgG, K1-18 Fab, K1-70 IgG and K1-70 Fab binding to the full length TSHR and the TSHR260 was studied using the method as described in: Nakatake N, et al . The full length TSHR or TSHR260 were coated onto plastic tubes which had been pre-coated with an appropriate mouse MAb to the TSHR. In association experiments 100µL of 125I-labelled IgG or Fab were incubated in the TSHR coated tubes at room temperature for 5-180 min. The tubes were then aspirated, washed with assay buffer and counted in a gamma counter. In the dissociation experiments 100µL of 125I-labelled IgG or Fab were incubated in TSHR coated tubes for 180 min at room temperature followed by the addition of 10µL of 1mg/mL of various MAb IgG or Fab preparations and incubation for 0-180 min at room temperature. At different time points the tubes were aspirated, washed and counted. In some experiments TSH or buffer was added instead of a MAb preparation.
- The methods used to introduce specific mutations into the TSHR sequence have been described in patent application
WO2006/016121A . Furthermore, transfection of mutated TSHR constructs into CHO cells using the Flp-in system is also described inWO2006/016121A . Flp-In-CHO cells expressing either wild type or mutated TSHRs were seeded into 96 well plates and used to test the ability of various preparations to stimulate cyclic AMP activity in the CHO cells expressing the TSHR containing amino acid mutations. These experiments were compared to similar experiments carried out using CHO cells expressing wild type TSHR. Flp-In-CHO cells expressing either wild type or mutated TSHRs were also used in experiments to study the ability of various preparations to block the stimulating activity of TSH, stimulating antibodies or patient serum TRAbs as described above. - The
TSHR 260 construct (coding amino acids 1-260 of the human TSHR; amino acids 1-21 being the leader sequence) was amplified using full length human TSHR as the template (Oda Y, et al 1998. Journal of Molecular Endocrinology 20: 233-244) and joined to the coding sequence of a secreted alkaline phosphatase (minus the 17 amino acid alkaline phosphatase leader sequence) using the cloning vector pSEAP2-basic (Clontech) as the template. Two PCR reactions were carried out, the first used the full length TSHR amplified with specific primersSEQ ID No 77 andSEQ ID No 78 primers (Sigma Genosys) which added an EcoRI restriction site at the N-terminus, and a 1 amino acid linker (Asparagine) and the first 8 amino acids (excluding the 17 amino acid leader sequence) of the secreted alkaline phosphatase at the C terminus. The second PCR was carried out using the cloning vector pSEAP2-basic amplified with theprimersSEQ ID No 79 andSEQ ID No 80 which adds amino acids 254-260 of the TSHR and a 1 amino acid linker (Asparagine) to the N terminus of the secreted alkaline phosphatase and a 6 histidine tag, a stop codon and an Xhol restriction site at the C-terminus of the secreted alkaline phosphatase gene. The PCR reactions were carried out for 30 cycles of 1 minute at 94°C, 1 minute at 40°C and 1 minute at 72°C followed by 7 minutes at 72°C. The PCR products were run on 1% agarose gels and the DNA extracted using a geneclean II kit (Anachem Ltd, Luton) following the manufacturer's instructions.Purified PCR products PCR 3 reaction contained 200 ng ofPCR PCR 2 product andPCR 3 was carried out for 7 cycles at 94°C for 1.5 minutes, 65°C for 1.5 minutes and 72°C for 1.5 minutes. The temperature was then increased to 94°C again for 2 minutes and primersSEQ ID No PCR 3 product was cloned into pFastBac1 using EcoRI and Xhol restriction sites and the presence of the mutation was verified using sequencing by the Sanger-Coulson method (Sanger F et al 1997. Proceedings of the National Academy of Sciences of the USA 74: 5463-5467). Recombinant DNA was made using the Bac to Bac Baculovirus expression system (Invitrogen, UK) and transfected into Sf-9 cells to obtain and amplify recombinant baculovirus stock as described inWO2008/025991A1 . TSHR260-AP was expressed in insect cells as described inWO2008/025991A1 . - An ELISA was established based on the ability of divalent TSHR antibodies to bind with one antigen binding site to TSHR coated onto an ELISA plate well and with the other antigen binding site to TSHR260-AP in a liquid phase i.e. forming a bridge. TSHR in the form of full length detergent-solubilised receptor expressed in CHO cells was coated onto ELISA plate wells via a C-terminal antibody as described previously (Bolton J et al 1999 supra). In the
assay 75 µL of start buffer (as described for TRAb ELISA; Bolton J. et al 1999 supra) and 75 µL of test sample (patient sera or monoclonal antibodies) were added to the ELISA plate wells coated with the full length detergent solubilised TSHR and incubated for 2 hours at room temperature with shaking (500 rpm). Then the contents of the wells were removed, the wells washed 3 times with wash buffer (50 mmol/L NaCl, 20 mmol/L Tris pH 7.8, 1% Triton X-100) followed by addition of 100 µL of TSHR260-AP (diluted in wash buffer containing 0.2 g/L MgCl2-6H2O and 2 g/L BSA). After incubation for 1 hour at room temperature with shaking (500 rpm) the wells were emptied, washed (3 times) and 100 µL of p-nitrophenyl phosphate (pNpp) substrate (Europa Bioproducts Ltd, Ely, Cambridge UK) added and the plate incubated in the dark for 45 minutes. Thereafter 100 µL of stop solution (1 mol/L NaOH) was added and the absorbance read at 405 nm in an ELISA plate reader. The results were expressed as OD 405 nm absorbance values, values higher than those observed with a panel of healthy blood donor (HBD) sera indicated the presence of TSHR autoantibodies in the sample. In some experiments solubilised preparations of recombinant TSHR containing mutation R255D expressed in CHO cells were used to coat the ELISA plate wells. - The TSHR LRD C-CAP construct coding amino acids 1-409 of the human TSHR with amino acids 306-384 removed, was amplified using full length human TSHR as the template (Oda Y, et al 1998. Journal of Molecular Endocrinology 20: 233-244). Two PCR reactions were carried out, the first used the full length TSHR amplified with T7 primer (SEQ ID No 81) and specific primer SEQ ID No 82 (Sigma Genosys, Gillingham, Dorset, UK) which added amino acids 385-342 of the TSHR to the C terminus of
amino acid 305 of the TSHR. The second PCR was carried out using the full length TSHR amplified with BGH reverse primerSEQ ID No 83 and the specific primer (SEQ ID No 84), which adds amino acids 298-305 of the TSHR to the N terminus ofamino acid 385 of the TSHR. The PCR reactions were carried out for 30 cycles of 1 minute at 94°C, 1 minute at 40°C and 2 minutes at 72°C followed by 7 minutes at 72°C. The PCR products were run on 1% agarose gels and the DNA extracted using a Geneclean II kit (Anachem Ltd, Luton, UK) following the manufacturer's instructions.Purified PCR products PCR 3 reaction which contained 200ng ofPCR 1 and 200ng ofPCR 2 product andPCR 3 was carried out for 7 cycles at 94°C for 1.5 minutes, 65°C for 1.5 minutes and 72°C for 1.5 minutes. The temperature was then increased to 94°C again for 2 minutes and T7 primer (SEQ ID No 81) and BGHR primer (SEQ ID No 83) were added followed by 30 cycles of 94°C for 1 minute, 52°C for 1 minute and 72°C for 2 minutes. ThePCR 3 product containing TSHR sequence omitting amino acids 306-384 was then run on a 1% agarose gel and the DNA extracted using a Geneclean II kit (Anachem Ltd) following the manufacturer's instructions. Purified PCR3 product was used as the template for construction of the TSHR LRD C-CAP gene inPCR 4. ThePCR 4 reaction contained 200ng ofPCR 3 as template DNA and was amplified with T7 primer (SEQ ID No 81) and the specific primer (SEQ ID No 85) which adds a 6 histidine tag, a stop codon and an Xhol restriction site to the C-terminus ofamino acid 409 of the TSHR sequence (1-409 with amino acids 306-384 deleted).PCR 4 was carried out for 30 cycles of 1 minute at 94°C, 1 minute at 40°C and 1 minute at 72°C, followed by 10 minutes at 72°C. ThePCR 4 product was cloned into pFastBac1 using BamHI and Xhol restriction sites and the presence of the mutation was verified using sequencing by the Sanger-Coulson method (Sanger F. et al 1997. Proceedings of the National Academy of Sciences of the USA 74: 5463-5467). Recombinant DNA was made using the Bac to Bac Baculovirus expression system (Invitrogen, Paisley, UK) and transfected into Sf-9 cells to obtain and amplify recombinant baculovirus stock as described inWO2008/025991A1 . TSHR LRD C-CAP (Figure 7c ; SEQ ID No 76) was expressed in insect cells using the procedure described inWO2008/025991A1 . - Temperature stability of different preparations of recombinant TSHR was compared. Full length solubilised TSHR expressed in CHO cells, TSHR260 expressed in insect cells, TSHR260-AP expressed in insect cells and TSHR. LRD C-CAP expressed in insect cells were tested. An aliquot of each of the above listed preparations was removed from -80°C storage, thawed on ice, a sample returned to -80°C as a control while the bulk was stored at room temperature (20-25°C) for 24 or 48 hours. After 24 or 48 hours at room temperature the TSHR preparations were stored at -80°C and then tested as described below. ELISA plate wells were coated with a F(ab')2 preparation of the mouse TSHR MAb 14C4 (Jeffreys J et al 2002, Thyroid 12: 1051-1061 and Sanders J et al2007 Thyroid 17: 395-410) at 1µg/mL in coating buffer (Bolton J et al 1999 supra). TSHR preparations under investigation were diluted in 20 mmol/L NaCl, 10 mmol/L Tris pH7.8,1% v/v Triton X-100,1g/L BSA, 200mg/L NaN3and 150µL added to ELISA plate wells (in quadruplicate). After incubation overnight at 4°C to allow the TSHR preparations to bind to the antibody (14C4 F(ab')2) coated wells, the wells were washed and incubated with 75µL of assay buffer (50 mmol/L NaCl, 20 mmol/L Tris pH7.8, 1% v/v Triton X-100, 1g/L BSA) and 75µL of healthy blood donor serum for 1 hour at room temperature at 500 shakes per minute on an ELISA plate shaker. Thereafter the contents of the wells were emptied, the wells washed and 100µL of M22 Fab-peroxidase conjugate (see above) added to each well. After 25 minutes incubation at room temp without shaking the plate wells were washed again followed by addition of 100µL of tetramethylbenzidine and a further incubation of 25 minutes at room temperature without shaking. The reaction was stopped by addition of 50µL of 0.5 mol/L H2SO4 and the absorbance of each well read at 450nm on an ELISA plate reader.
- The variable (V) region genes of K1-18 or K1-70 heavy and light chains were determined as described in
WO2004/050708A2 , using total RNA prepared from 1x10⁷ hetero-hybridoma cells (secreting K1-18 IgG or K1-70 IgG) to produce mRNA for RT-PCR (reverse transcriptase PCR) reactions. Specific IgG1 HC and kappa LC sense and antisense strand oligonucleotide primers designed using the Medical Research Council's V-base (http://vbase.mrc-cpe.cam.ac.uk/) and synthesised by Invitrogen (Paisley, PA4 9RF, UK) were used in RT-PCR reactions with K1-18 mRNA. Specific IgG1 HC and lambda LC primers prepared as described above were used in RT-PCR reactions with K1-70 mRNA. The RT reaction was carried out at 50°C for 15 minutes followed by 40 cycles of PCR at 94°C for 15 seconds, 50°C for 30 seconds and 72°C for 30 seconds. DNA products were cloned into pUC18 and sequenced by the Sanger-Coulson method (Sanger F, et al 1977 supra). V region sequences were compared with available sequences of human Ig genes using Ig blast (http://www.ncbi.nlm.nih.gov/gblast/). The CDRs were assigned by the method of Kabat (Kabat E et al 1991 Sequences of proteins of immunological interest (US Public Health service, Bethesda, MD) Fifth edition) and Ig blast (http://www.ncbi.nlm.nih.gov/igblast/). A second round of mRNA isolation was carried out from both the K1-70 and K1-18 hybridoma cell lines that had undergone further recloning by limiting dilution. The V- region sequences (K1-18 HC, K1-18 LC, K1-70 HC and K1-70 LC) were obtained by RT-PCR from the mRNA followed by cloning and sequencing as described above. In addition the RT-PCR reactions were also carried out using specifically designed PCR primers corresponding to the 5' end of the respective leader sequences for each of the V regions. This allowed the identification of the actual oligonucleotide sequences (and derived amino acid sequences) at the N-termini of the HC and LC V regions of K1-18 and K1-70. In addition, the N-terminal amino acid sequence of K1-70 LC protein was analysed by Edman degradation reaction by Alta Bioscience (Birmingham, UK). This was possible after the N-terminal "deblocking" of the K1-70 LC protein preparation with pyroglutamate aminopeptidase. Purified K1-70 Fab (10µg) was treated with 2.5mU of pyroglutamate aminopeptidase (in 50 mmol/L Na2HPO4 pH 7.0; 10mmol/L dithiothreitol and 1mmol/L EDTA) for 6 hours at 75°C. An equal volume of SDS-PAGE sample buffer was added and after heating at 100°C for 5 minutes, K1-70 Fab was resolved into the HC (Fd part) and the LC on 15% SDS-PAGE. The LC band was carefully cut out of the gel and the N-terminal protein sequence determined. Repeat rounds of RT-PCR and sequencing of K1-18 HC, K1-18 LC and K1-70 HC confirmed the V region sequences were the same as obtained before while the K1-70 LC V region sequence differed. The K1-70 LC sequence obtained in the repeat round of experiments was consistent with the protein sequence of the 2-21 consecutive N-terminal amino acids obtained by Edman reaction (Figure 6e ; SEQ ID No 73) and the electron density of the LC amino acids in the crystal structure of K1-70 Fab (Figure 8 ) and consequently concluded as the preferred K1-70 LC sequence (Figures 6c and6d ; (SEQ ID No - K1-70 Fab solutions prepared as described above were concentrated to 15.5mg/mL using iCON concentrators (ThermoFisher Scientific, Loughborough, UK) with a 9000Da cut off and stored at -20°C in aliquots. Crystals of K1-70 Fab were grown using the hanging drop method of vapour diffusion using the
Structure Screen 1 sparse matrix screen from Molecular Dimensions (Newmarket, UK). Several crystals were obtained in a number of conditions and all were screened to identify the crystal most suitable for the X-ray diffraction analysis at Biofocus DPI (Saffron Walden, UK). A crystal grown in 30% PEG 400, 0.1 M sodium Hepes pH 7.5, 0.2 M magnesium chloride was chosen. It was washed in well solution and flash frozen by plunging into liquid nitrogen.The data set was collected on a Rigaku R-Axis IV image plate detector and was indexed, integrated and scaled using MOSFLM and SCALA (from CCP4 program suite (Collaborative computational project, ). Three structures from the Protein Data Bank (http://www.rcsb.org/pdb/home/home.do) 1LIL (VL and CL domains), 2BOS (VH domain) and 2EH7 (VL domain) were chosen for use in molecular replacement, based on sequence alignment. There were two complete Fab K1-70 molecules in the asymmetric unit and the resulting model was given ten cycles of atomic refinement with tight geometric weights using REFMAC5 (CCP4). The electron density maps calculated after molecular replacement and initial refinement were examined in the model building program COOT (Emsley P, Cowtan K 2004. Nature 355:472-475) and automated model rebuilding was performed using BUCCANEER (CCP4). The model was reexamined and any remaining missing features were built by hand and the model was refined using REFMAC5 (CCP4). Water molecules were then added using the water placement option in COOT and refined using REFMAC5 (CCP4). The structural geometry of Fab K1-70 was checked using PROCHECK (CCP4) and RAMPAGE (CCP4). Finally, the residues in the model were renumbered in accordance with the Kabat numbering system (Kabat E et al 1991 supra). - The K1-70 HC RT-PCR product was cut with Xhol and Spel restriction endonucleases and the K1-70 LC PCR product was cut with Sacl and Xbal restriction endonucleases and both HC and LC cDNAs cloned into the Immunozap H/L vector (Stratagene Europe; Amsterdam, Netherlands) (Matthews I, et al 2002 Laboratory Investigation 82: 1-11) under the control of the IacZ promoter. Plasmid DNA was prepared using the Qiagen midi plasmid purification kit (Qiagen Ltd, Crawley, UK) and the presence of K1-70 HC and LC cDNAs confirmed by sequencing using the Sanger-Coulson method (Sanger F, et al 1977 supra). Plasmid DNA was transformed into the E coli strain HB2151 (GE Life Sciences, Little Chalfont, UK) and grown overnight at 37°C on LB ampicillin (Tryptone 10g/L, Yeast Extract 5g/L, NaCl 10g/L, 100µg/mL final concentration ampicillin) agar plates (15g/L agar). Precultures (one colony in 3mL LB ampicillin + 1% glucose) were grown overnight at 30°C with shaking. Production of the recombinant Fab is inhibited in the presence of glucose. Precultures after overnight incubation were diluted 1/100 (0.5mL in 50mL LB ampicillin) and grown at 30°C until the OD600 was 1.2 followed by addition of sucrose (final concentration 0.3mol/L) and culture grown at 30°C until OD600 returned to 1.2. Thereafter isopropyl-β-D thiogalactoside (IPTG) was added to a final concentration of 1mmol/L and cultures continued to be incubated for 24 hours at 23°C with shaking. The cultures were then centrifuged at 3000rpm for 30 minutes at 4°C and the culture supernatants recovered. The culture supernatants were filtered through a 0.45µm filter and dialysed overnight into PBS (8.1mmol/L Na2HPO4, 1.5mmol/L KH2PO4, 2.7mmol/L KCI, 137mmol/L NaCl pH 7.4). Culture supernatant from HB2151 cells transformed with K1-70 plasmid (HB2151/K1-70) grown with glucose without IPTG ie non-induced were used as negative controls. The culture supernatants were assayed for (a) their ability to inhibit TSH binding to the TSHR and (b) their ability to inhibit TSH mediated stimulation of cyclic AMP production in CHO cells expressing TSHR.
- Lymphocytes (26 x 106) obtained from 20 mL of patient's blood were infected with EBV and plated out at 1 x 10⁶ cells per well in a 48 well plate on feeder layers of mouse macrophages. On
day 13 post EBV infection the plate well supernatants were monitored for inhibition of 125I-TSH binding. Positive clones were tested further for their effects (stimulating or blocking) on the TSHR. Cells from positive wells (positive in any of the assays used) were expanded and fused with the K6H6/B5 hybridoma cell line and plated out in 96 well plates. Two clones stably producing antibodies with 125I-TSH binding inhibiting activity were obtained and re-cloned 4 times. One of the clones secreted a human MAb designated as K1-18 that had TSHR stimulating activity. K1-18 antibody purified from the hetero-hybridoma culture supernatants was subclass IgG1 with kappa light chains. The other stable clone secreted a human MAb designated as K1-70 that had the ability to block TSH stimulation of cyclic AMP production in TSHR transfected CHO cells. K1-70 antibody purified from hetero-hybridoma culture supernatants was subclass IgG1 with lambda light chains. - The ability of different concentrations of K1-18 or K1-70 IgGs to inhibit binding of labelled TSH to TSHR coated tubes is shown in Tables 1a and 1b. As shown in Table 1a, K1-18 IgG diluted in healthy blood donor (HBD) serum showed maximum inhibition of 125I-TSH binding of approx 95% at 1 µg/mL concentrations. The inhibiting effect of K1-18 IgG at concentrations between 1- 0.001 µg/mL was dose dependent. The inhibiting effect of K1-18 was comparable to the effect of M22 IgG at the same concentrations. K1-18 IgG at 1 µg/mL is a more potent inhibitor of 125I-TSH binding than 5C9 IgG, TSMAb 1-7 IgGs or 9D33 IgG (Table 1a). K1-70 IgG or Fab inhibiting effects on 125I-TSH binding are shown in Table 1b. K1-70 IgG diluted in HBD serum showed dose dependent inhibition ranging from 13.5 ± 2.3% at 0.03 µg/mL to 95.9 ± 0.8% at 100 µg/mL. The inhibiting effects of K1-70 Fab was comparable to the effects of K1-70 IgG at the same concentrations (Table 1b). Tables 1a and 1b also show the effects on 125I-TSH binding to TSHR coated tubes by K1-18 and K1-70 and different MAbs IgGs diluted in the coated tube assay buffer; in the case of all MAbs except 5C9 these effects were comparable to the results observed when MAbs were diluted in HBD serum. Table 2a shows inhibition of 125I-TSH binding to TSHR coated tubes by different preparations of K1-18, K1 donor serum and K1-donor serum IgG. In this experiment, approximately 12% inhibition was observed with as little as 0.01 µg/mL of K1-18 IgG diluted in HBD sera and the inhibition increased in a dose dependent manner up to 95% inhibition at 10 µg/mL of K1-18 IgG. K1-18 Fab at 0.01 µg/mL in HBD sera showed 5.6 ± 7.3% inhibition and the inhibition increased in a dose dependent manner to a maximum inhibition of 82.2 ± 0.9% at 10 µg/mL. This can be compared to 125I-TSH binding inhibition by donor serum IgG diluted in HBD sera; 13.7 ± 1.3% inhibition at 0.125 mg/mL increasing in a dose dependent manner to 76.5 ± 1.5% inhibition at 1 mg/mL. Donor serum at different dilutions also showed dose dependent inhibition of 125I-TSH binding; 9.1 ±0.8% inhibition and 1/160 dilution to 81.1 ± 0.4% inhibition at 1/10 dilution. The data in Table 2a showed that purified K1-18 IgG was 6600 times more active in terms of inhibition of TSH binding compared to K1 donor serum IgG. When K1-18 IgG and donor serum IgG were diluted in assay buffer the ability of K1-18 IgG to inhibit TSH binding was 4700 times greater than that of the donor serum IgG (Table 2a). Table 2b shows inhibition of 12SI-TSH binding to the TSHR in coated tube assay by different preparations of K1-18 compared to the effect of Thyroid Stimulating
Autoantibody reference preparation 90/672 from National Institute for Biological Standards and Control (NIBSC; Potters Bar, UK). K1-18 IgG diluted in HBD serum showed 125I-TSH binding inhibiting activity of 69NIBSC 90/672 units/mg (mean of activity calculated at three concentrations of K1-18 IgG; 30 ng/mL, 100ng/mL and 300 ng/mL) (Table 2b). 125I-TSH binding inhibiting activity of K1-18 Fab (diluted in serum) calculated in the same experiment was 46NIBSC 90/672 units/mg (activity at 30 ng/mL, 100 ng/ml and 300 ng/mL of K1-18 Fab was used for the calculations) (Table 2b). This can be compared with M22 IgG 125I-TSH binding inhibiting activity of 131 NIBSC units/mg (Table 2b). 125I-TSH binding inhibiting activities of dilutions of donor serum and donor serum IgG compared to the activity ofNIBSC 90/672 are shown in Table 2c. 125I-TSH binding inhibiting activity of the donor serum was 0.075NIBSC 90/672 units/mL (mean of values at 40x and 20x dilutions) and of donor serum IgG diluted in HBD serum was 0.011 units/mg (mean of values at 0.1; 0.3 and 1.0 mg/mL) (Table 2c). This can be compared to the activity of K1-18 IgG (diluted in HBD serum) measured in the same experiment of 63.3NIBSC 90/672 units/mg (mean of values at 30, 100 and 300 ng/mL) and the activity of K1-70 IgG (diluted in HBD serum) of 114 units/mg (mean of values at 10, 30 and 100 ng/mL) (Table 2c). Consequently in this assay system the specific activity of K1-18 IgG was 5755x that of the donor serum IgG. Similarly, the specific activity of K1-70 IgG was 10,364x that of the donor serum IgG. - The binding affinity of K1-18 IgG for the TSHR (full length) was 6.7 ± 1.0 x 10⁹ L/mol (mean ± SD; n = 3) while binding affinity of K1-18 Fab was 1.8 ±1.0 x 10⁹L/mol (mean ± SD; n = 3). Binding affinity of K1-18 IgG for the TSHR260 was 5.9 ±1.0 x 10⁹ L/mol (mean ±SD; n = 3). K1-70 IgG binding affinity for the TSHR (full length) was 3.9 ± 0.8 x 10¹⁰ L/mol (mean ±SD; n = 3) while binding affinity of K1-70 Fab was 2.3 ±0.3 x 10¹⁰L/mol (mean ±SD; n=3). Binding affinity of K1-70 IgG for the TSHR260 was 3.1 ±0.4 x 10¹⁰ L/mol (mean±SD; n=3) and of K1-70 Fab it was 9.3 ±0.4 x 10⁹ L/mol (mean ±SD; n=3). This can be compared to binding affinity of porcine TSH to the TSHR (full length) of 6.0 ±0.9 x 10⁹ L/mol (mean ±SD, n=5) (Nakatake et al 2006 supra).
- The effects of K1-18 IgG on TSH-biotin binding to TSHR coated ELISA plate wells was studied and compared to the effects of various other MAbs. As shown in Table 3a K1-18 IgG diluted in HBD serum had a dose dependent inhibiting effect on TSH-biotin binding with 10.0 ± 0.8% inhibition at 0.01 µg/mL, essentially maximum inhibition of 96.2 ± 0.2% at 1 µg/mL and a maximum inhibition plateau at concentrations of 3 µg/mL and above. This can be compared to M22 IgG (diluted in HBD serum) inhibiting effect of 17.5 ± 2.0% at 0.01 µg/mL and 98.3 ± 0.0% at 1 µg/mL (Table 3a). TSH-biotin binding inhibiting activity of K1-18 IgG at 1 µg/mL (diluted in HBD serum) was greater than 5C9 IgG, TSMAb 1-7 IgGs and 9D33 IgG as illustrated by the examples shown in Table 3a. When K1-18 IgG was tested diluted in ELISA assay buffer (50 mmol/L NaCl, 10 mmol/L Tris pH 7.8. 0.1% v/v Triton X-100, 1 mg/mL BSA) the inhibiting effects were essentially the same as when the dilutions were made in HBD serum (Table 3a). As shown by the examples in Table 3b K1-18 Fab diluted in HBD serum or in ELISA assay buffer was also an effective inhibitor of TSH-biotin binding in the ELISA. The inhibiting effects of K1-18 IgG diluted in ELISA assay buffer with addition of control MAb IgG (5B3 which is a human MAb to glutamic acid decarboxylase) at 100 µg/mL is shown in Table 3c. When diluted in the buffer containing control MAb K1-18 IgG showed similar TSH-biotin binding inhibition activity as when diluted in buffer containing BSA or in HBD serum (Table 3c). Consequently, the presence of an unrelated human MAb IgG at high concentration (100 µg/mL) had no effect on the inhibiting activity of K1-18 IgG nor M22 IgG nor 5C9 IgG. Table 3d shows the effects of K1-70 on TSH-biotin binding to the TSHR and these are comparable to the effects of K1-18 or M22 (Tables 3a & 3b). K1-70 IgG diluted in HBD serum had a dose dependent inhibiting effect on TSH-biotin binding with 13.6 ± 1.4%; 74.1 ± 0.4% and 97.4 ± 0.2% inhibition at 0.01 µg/mL: 0.1 µg/mL and 1 µg/mL, respectively. K1-70 Fab was similarly active with inhibitions of 18.2 ± 0.6%; 88.3 ± 0.3% and 96.9 ± 0.1% at 0.01 µg/mL; 0.1 µg/mL and 1 µg/mL, respectively. When K1-70 IgG or Fab preparations were diluted in ELISA assay buffer the inhibiting activities were essentially the same compared to dilutions made in HBD serum (Table 3d). The ability of K1-18 IgG to inhibit binding of M22 Fab-POD to TSHR coated ELISA plate wells is shown in Table 4a. K1-18 IgG diluted in HBD serum inhibited M22 Fab-POD binding in a dose dependent manner; in particular 21.0±1.3%, 81.6 ± 0.5% and 97.2 ± 0.1% inhibitions were observed at 0.03 µg/mL, 0.3 µg/mL and 3 µg/mL, respectively. This effect was comparable to the inhibiting effect of M22 IgG (diluted in HBD serum) of 51.0 ± 2.4%, 93.2 ± 0.3% and 98.0 ± 0.2% at 0.03 µg/mL, 0.3 µg/mL and 3 µg/mL, respectively. K1-18 Fab showed similar ability to inhibit M22 Fab-POD binding as K1-18 IgG (Table 4b). As shown in Table 4a, K1-18 and M22 ability to inhibit labelled M22 binding to the TSHR were greater than the inhibiting activities of 5C9, TSMAbs 1-7 and 9D33. Inhibiting effects of all MAbs studied when diluted in ELISA assay buffer were similar to those observed when diluted in HBD serum (Table 4a and b). The inhibiting effects of K1-18 on M22 Fab-POD binding to the TSHR can be compared to the effects of K1-70 (Table 4c). K1-70 IgG diluted in HBD serum showed 34.5 ± 3.8%, 91.1 ± 0.3% and 97.6 ± 0.1% inhibition at 0.03 µg/mL, 0.3 µg/mL and 3 µg/ml, respectively. Similar percentage inhibitions were observed when K1-70 IgG was diluted in ELISA assay buffer (Table 4c). As illustrated in Table 4c K1-70 Fab diluted in HBD serum or in ELISA assay buffer showed similar M22-POD binding inhibiting activity as K1-70 IgG.
- In the presence of a control human MAb 4B4 IgG at concentrations from 0.01 -100 µg/ml (diluted in HBD serum) binding of 125I-K1-18 IgG was essentially not affected (Table 5a). This can be compared with the effects of different concentrations of unlabelled K1-18 IgG (diluted in HBD serum); increasing doses of 0.001; 0.01; 0.1 and 1.0 µg/mL caused inhibition of binding of 125I-labelled K1-18 of 11.1 ± 4.4%, 22.9 ± 2.4%, 69.0 ± 0.5% and 91.7 ± 0.8%, respectively. Untabelled K1-18 Fab tested at concentrations from 0.001 -100 ng/mL showed inhibitions ranged from 10.3 ± 2.2% (at 0.03 µg/mL) to 84.8 ± 0.9% (at 100µg/mL) (Table 5b). K1-70 IgG and Fab (both tested in the range of concentrations from 0.001 - 100µg/mL) also inhibited 125I-K1-18 IgG binding in a dose dependent manner to an essentially complete inhibition of 95.1 ± 0.3% at 10 µg/ml of K1-70 IgG and 92.8 ± 1.1% at 3 µg/mL of K1-70 Fab (Table 5b). In addition, binding of 125I-K1-18 IgG was inhibited in a dose dependent manner by M22 IgG, M22 Fab, 5C9 IgG, TSMAb 1-7 IgGs and 9D33 IgG (Table 5a and 5b). When the same experiments were carried out using various MAb preparations diluted in coated tube assay buffer the inhibiting effects of the respective preparations were comparable to the effect observed when diluted in HBD serum except in the case of 5C9 IgG (Table 5a). In the case of 5C9 diluted in assay buffer the maximum inhibition at 100 µg/mL was 91.3 ± 0.4% compared to 57.7 ± 2.4% when diluted in HBD serum and the inhibitions at 0.01 µg/mL were 11.7 ± 1.8% and -1.8 ± 2.7%, respectively (Table 5a). Binding of 125I-K1-18 IgG to TSHR coated tubes was inhibited by the lymphocyte donor serum resulting in 35.2% and 59.3% inhibition at serum dilutions of 1:20 and 1:10, respectively (Table 5c). Sera from 20 Graves' patients inhibited binding of 125I-K1-18 IgG and the inhibiting effect was comparable to the inhibiting effect on 125I-TSH binding (Table 5c). Table 5c also shows the effect of dilutions of sera from two patients with blocking TRAbs (B1 and B2) and sera from two patients with stimulating TRAbs (S1 and S2) on both I-K1-18 IgG and 125I-TSH binding. Effect of various MAbs on 125I-K1-18 Fab binding to the TSHR coated tubes is shown in Table 5d. Both, unlabelled K1-18 IgG and K1-18 Fab had dose dependent inhibiting effect on 125I-K1-18 Fab binding and these effects were comparable to the effects of M22 IgG, M22 Fab and K1-70 IgG (Table 5d). 5C9 IgG, TSMAbs 1-7 IgGs and 9D33 IgG also inhibited on 125I-K1-18 Fab binding, however, their effects were smaller compared to M22, K1-18 and K1-70 preparations (Table 5d).
- K1-18 IgG stimulated cyclic AMP production in CHO cells expressing the TSHR in a dose dependent manner as shown in Table 6a. In hypotonic buffer, the levels of cyclic AMP in the presence of 0.1 ng/mL K1-18 IgG were 1.56 ± 0.32 pmol/L, at 1.0 ng/mL were 4.08 ± 0.28 pmol/L, at 10 ng/mL were 31.66 ± 5.06 pmol/L, at 100 ng/mL were 64.95 ± 9.61 pmol/L and at 1000 ng/mL they were 67.90 ± 10.44 pmol/L. The cyclic AMP levels at different concentrations of K1-18 Fab in hypotonic buffer were 1.72 ± 0.82 pmol/L, 9.99 ± 3.52 pmol/ L, 53.22 pmol/L and 66.94 ± 6.93 pmol/L at 1 ng/mL, 10 ng/mL, 100 ng/mL and 1000 ng/mL of K1-18 Fab, respectively. M22 Fab at 1 ng/mL in hypotonic buffer stimulated cyclic AMP production of 29.80 ± 0.97 pmol/L and at 10 ng/mL of 57.41 ± 5.05 pmol/L (Table 6a). Table 6a also shows the effect of K1-18 IgG or Fab on cyclic AMP stimulation in CHO cells expressing the TSHR tested under the isotonic conditions. As illustrated by examples in Table 6a both K1-18 IgG and Fab caused increase of cyclic AMP production under isotonic conditions although the levels of cyclic AMP produced were lower compared to experiments using hypotonic conditions. Comparison of stimulating activity of M22 IgG and K1-18 IgG tested in hypotonic buffer is shown in Table 6b. At 3 ng/mL concentration M22 IgG stimulated 24.3 ± 2.3 pmol/mL of cyclic AMP while K1-18 IgG 8.3 ± 0.5 pmol/mL. At 10 ng/mL M22 IgG and K1-18 IgG caused stimulation of 50.3 ± 1.6 and 25.0 ± 1.0 pmol/mL of cyclic AMP respectively and at 100 ng/mL 64.6 ± 1.9 and 62.6 ± 2.7 pmol/mL respectively. The stimulating activity of K1-18 IgG and Fab was also assessed relative to the activity of
NIBSC reference preparation 90/672 (Table 6c). Calculated cyclic AMP stimulating activity of K1-18 IgG was 155NIBSC 90/672 units/mg (mean of activity calculated at three concentrations of K1-18 IgG; 1 ng/mL, 3 ng/mL and 10 ng/mL) (Table 6c). Cyclic AMP stimulating activity of K1-18 Fab calculated in the same experiment was 22NIBSC 90/672 units/mg (activity at 10 ng/mL, 30 ng/mL and 100 ng/mL of K1-18 Fab were used for the calculations) (Table 6c). This can be compared with M22 IgG cyclic AMP stimulating activity of 286 NIBSC units/mg (Table 6c). For comparative purposes the stimulating activities of porcine TSH, native human TSH and recombinant human TSH in isotonic and in hypotonic buffers are shown in Table 6d. - Further examples shown in Table 6e concern the stimulating effects of K1-18 IgG, M22 IgG or pTSH when mixed together in different combinations. The stimulating effect of pTSH, M22 or K1-18 appeared to be enhanced when two stimulators were mixed together compared to the effect of the stimulator alone at the same concentrations. In particular, cyclic AMP production of 11.01±0.99 pmol/mL (mean ±SD) at 0.1 ng/mL pTSH alone and 35.17±6.38 pmol/mL (mean ±SD) at 1 ng/mL of M22 IgG increased to 47.22±3.89 pmol/mL (mean ±SD) when 0.1 ng/mL pTSH and 1 ng/mL of M22 IgG were mixed together. Also a mixture of 0.1 ng/mL of pTSH and 10ng/mL of K1-18 IgG had a greater stimulating effect than these stimulators alone (Table 6e). Furthermore, two stimulating antibodies mixed together were more potent than a single antibody at the same concentrations. For example, 29.95±1.18 pmol/mL (mean ±SD) of cyclic AMP was produced in response to 5ng/mL of K1-18 IgG, 20.20±2.48 pmol/mL (mean ±SD) was produced in response to 0.5ng/mL of M22 IgG while 4.01±7.19 pmol/mL (mean ±SD) cyclic AMP was produced in response to 5ng/mL of K1-18 and 0.5ng/mL of M22 mixed together (Table 6e).
- The results of two experiments in which the ability of the K1-18 and K1-70 donor serum and donor serum IgG to stimulate cyclic AMP were compared to the stimulating activity of
NIBSC 90/672 are shown in Tables 6f and 6g. Inexperiment 1, the stimulating activity of donor serum was 4.7 ± 0.1 pmol/mL of cyclic AMP at 30 times dilution compared to the effect of HBD serum at the same dilution of 1.7 ± 0.4 pmol/mL while the stimulating activity of donor serum IgG was 7.7 ± 1.0 pmol/mL at 30 µg/mL which represented activity relative toNIBSC 90/672 of 0.013 units/mg (Table 6f). Inexperiment 2, donor serum diluted 30 times caused stimulation of cyclic AMP to 9.5 ± 0.7 pmol/mL while donor serum IgG at 30 µg/mL caused stimulation to 15.6 ± 0.7 pmol/mL which represented activity relative toNIBSC 90/672 of 0.014 units/mg (Table 6g). K1-18 IgG TSHR stimulating activity was inhibited by human MAbs with TSH antagonist activity (K1-70 and 5C9) as illustrated by the examples shown in Table 6h. In particular, K1-18 IgG at 10 ng/mL caused stimulation of cyclic AMP to 50.0 ± 3.3 pmol/mL and this was reduced to 3.8 ±1.0 pmol/mL in the presence of 0.1 µg/mL of K1-70 IgG(92% inhibition). In the presence of 10 ng/mL of K1-18 IgG and 0.1 µg/mL of 5C9 IgG cyclic AMP levels were 4.4 ± 1.5pmol/mL (91% inhibition). At higher concentrations of K1-70 IgG or 5C9 IgG the inhibiting effect was complete (100% inhibition) (Table 6h). In further experiments the effect of K1-70 IgG mixed together with 5C9 IgG on K1-18 IgG stimulating activity was studied (Table 6i). As shown in the Table 6i K1-18 IgG stimulation at 10ng/mL was effectively inhibited by 0.1µg/mL of 5C9 IgG or 0.1 µg/mL of K1-70 IgG. When K1-70 IgG and 5C9 IgG were mixed to give a final total concentration of 0.1 µg/mL the stimulating activity of K1-18 IgG was also effectively inhibited (97.3% inhibition). However at lower concentrations K1-70 IgG and 5C9 IgG when mixed together were more effective inhbibitors of K1-18 IgG stimulating activity than one antibody alone. For example, at 0.001 µg/mL K1-70 IgG and 5C9 IgG individually caused no inhibition (0% and 1% respectively) while when mixed together to the same final concentration of total IgG (ie 0.001 µg/mL) the inhibition was 25.5%. - Table 6i also shows that cyclic AMP concentration in the presence of K1-70 IgG (100 µg/mL) was similar to that observed in the presence of assay buffer while in the presence of 5C9 IgG (100 µg/mL) the concentration of cyclic AMP was lower (0.89 ±0.13 ; 0.89 ±0.15 and 0.55 ±0.14, respectively) (mean ±SD of triplicate determinations). When K1-70 IgG and 5C9 IgG were mixed together (final concentration of 100µg/mL of total igG) cyclic AMP concentrations were not reduced below the levels observed in the presence of buffer (ie not lower than basal or constitutive activity levels). For comparison essentially complete inhibition of M22 IgG (3 ng/mL) stimulating activity was observed at 1 µg/mL of 5C9 IgG or 1µg/mL of K1-70 IgG (97.1% and 96.6 % inhibition respectively) and inhibitions at 0.1 µg//mL of 5C9 IgG or 0.1 µg/mL of K1-70 IgG were 92.8% and 75.5%, respectively (Table 6j). However, when 5C9 and K1-70 were mixed together to a final total IgG concentration of 0.1 µg/mL 91.9% inhibition was observed (Table 6j). The effects of mixtures of K1-70 IgG and 9D33 IgG on K1-18 IgG stimulating activity are shown in Table 6k. In the case of
9D33 IgG 95% inhibition was observed at 1µg/mL while K1-70 IgG at 0.1µg/mL showed the same inhibition (95% inhibition). When the two blocking MAbs (9D33 and K1-70) were mixed together to a final total IgG concentration of 0.1µg/mL 95% inhibition was also observed (Table 6k). 9D33 IgG at 10µg/ml was able to essentially completely inhibit M22 IgG cyclic AMP stimulation (94% inhibition) while lower concentrations of K1-70 IgG (1µg/mL) had similar effect (96% inhibition) (Table 6l). Esentially complete inhibition of M22 activity (96% inhibition) was evident at 1µg/mL of the 9D33 and K1-70 mixture (Table 6l). This is comparable to the inhibiting effect of a mixture of 9D33 and K1-70 (1µg/mL) on TSH stimulating activity (97% inhibition) (Table 6m). However, it should be notedi that TSH stimulating activity was inhibited more effectively by K1-70 IgG alone (98% inhibition at 1µg/mL) than by 9D33 IgG alone (95% inhibition at 100µg/mL) (Table 6m). Table 6n shows the effect of the lymphocyte donor serum and three patient sera containing TRAbs with blocking activity (B1-B3) on TSHR stimulating activity of TSH, M22 IgG and K1-18 IgG. The donor serum inhibited TSH, M22 IgG and K1-18 IgG stimulating activities (63.8%, 80.1% and 79.5% inhibitions, respectively). Three different sera with blocking TRAbs that had a strong inhibiting effect on TSH and M22 IgG stimulation also inhibited the stimulating activity of K1-18 IgG (Table 6n). The inhibiting effects of the different patient sera on TSH, M22 IgG or K1-18 IgG stimulating activities were comparable. - Incubation of CHO cells expressing the TSHR with porcine TSH at 3 ng/mL caused stimulation of cyclic AMP production to 62.6 ± 3.9 pmol/mL (Table 7a). In the presence of increasing amounts of K1-70 IgG stimulating activity of porcine TSH was inhibited in a dose dependent manner. In particular in the presence of 0.01, 0.05, 0.1 and 1 µg/mL of K1-70 IgG the levels of cyclic AMP were 60.1 ± 1.6, 31.4 ± 1.9, 5.8 ± 2.8 and 2.0 ± 0.2 pmol/mL respectively which represent 4.0%, 49.8%, 90.7% and 96.8% inhibition respectively relative to the effect of control MAb IgG (5B3) (Table 7a). Table 7a also show the inhibiting effects of 5C9 IgG for comparison. The effects of K1-70 Fab on stimulating activity of porcine TSH under 2 different experimental conditions are shown in Table 7b. In the presence of K1-70 Fab at 1 µg/mL porcine TSH stimulating activity was essentially completely inhibited in both conditions (ie in isotonic and in hypotonic medium). The effect of K1-70 Fab was dose dependent in the range of concentrations studied (0.003 µg/mL to 3 µg/mL) with as little as 0.05 µg/ml of Fab showing an ability to reduce porcine TSH stimulation down to 28.9 ± 1.1 pmol/mL cyclic AMP from 39.5±1.9 pmol/mL in the presence of 1µg/mL of control MAb (under isotonic conditions) (Table 7b). The potency of K1-70 Fab under hypotonic conditions was similar to that observed under isotonic conditions (Table 7b).
- Increasing concentrations of K1-70 IgG (range 0.001 - 100 µg/mL) did not show any ability to inhibit TSHR constitutive (basal) activity as illustrated by the examples shown in Table 7c. This contrasts with the effects of 5C9 IgG as shown in Table 7c for comparison. The blocking mouse antibody 9D33 tested in the same experiment had no ability to affect TSHR constitutive activity (Table 7c) and some weak stimulating activity (about 2 x basal) was observed with high concentrations of 9D33.
- Blocking activity of K1-70 IgG was compared to the blocking activity of the lymphocyte donor serum as shown in Table 7d. Cyclic AMP levels after incubation with porcine TSH at 1 ng/mL were 61.7 ± 4.3 pmol/mL and the levels dropped in the presence of donor serum (10x dilution) to 14.9 ± 1.2 pmol/mL (75.9% inhibition) and to 51.6 ± 2.6 pmol/mL with serum diluted 20 times (16.4% inhibition). Donor serum at higher dilutions did not have a detectable effect on TSH stimulating activity. The effect of donor serum can be compared to the effect of K1-70 IgG that at 0.1 µg/mL had a similar effect as serum diluted 10 times (67.6% and 75.9% inhibition respectively) (Table 7d). K1-70 IgG had the ability to block cyclic AMP stimulating activity of porcine TSH, human TSH and human recombinant TSH as illustrated by the examples in Table 7e. K1-70 IgG at 0.1 µg/mL was an effective blocker of stimulating activity of all three TSH preparations tested under hypotonic medium conditions. Blocking activity of K1-70 IgG was less effective under isotonic medium conditions (Table 7e). Effects of K1-70 IgG on M22 IgG mediated stimulation of cyclic AMP production in CHO cells expressing the TSHR are shown in Table 7f. Cyclic AMP levels observed at 3 ng/mL of M22 IgG were 33.1 ± 1.8 pmol/mL and these decreased in the presence of K1-70 IgG for example, 4.3 ± 2.4 pmol/mL at 0.1 µg/mL (87% inhibition) (Table 7f). The effects of K1-70 IgG were comparable to the effects of 5C9 IgG tested in the same experiment (Table 7f). Furthermore, K1-70 IgG showed the ability to block cyclic AMP stimulating activity of TRAbs in sera from patients with Graves' disease and the examples in Tables 7g -7k illustrate that 100 µg/mL concentrations of K1-70 IgG caused complete inhibition of stimulating activity in all 15 sera studied (inhibition of T1-T15 ranged from 90.8% to 98.7%). The effects of K1-70 IgG on the stimulating activities of sera T1-T15 were comparable to the effects of 5C9 IgG and 9D33 IgG tested in the same experiment except for one serum ie T11 (Table 7j). Stimulating activity of serum T11 was only weakly inhibited by 100µg/mL of 5C9 IgG (8.5% inhibition) while in the presence of 100 µg/mL of K1-70 the inhibition was essentially complete (95.1% inhibition) (Table 7j). Effective inhibition (87.1%) of T11 was also observed with 100µg/mL 9D33 (Table 7j). The effect of different blocking MAbs at different concentrations (0.01 - 100 µg/mL) on the stimulating activities of three Graves' sera (including serum T11) is shown in more detail in Tables 7l-7n. These experiments showed that K1-70 IgG, 5C9 IgG and 9D33 IgG are effective inhibitors at concentrations as low as 0.1µg/mL except in the case of serum T11 on which 5C9 IgG had little or no effect (Table 7n). Table 7o shows inhibition of porcine TSH stimulation by K1-70 IgG and 5C9 IgG when the two blocking MAbs were mixed together in one experiment. These experiments showed that the two blocking MAbs were effective in combination in their ability to inhibit TSH stimulation of cyclic AMP production. In addition the effect of K1-70 IgG and 5C9 IgG mixed together on the constitutive activity of the TSHR was tested. As shown in Tables 7c and 7p K1-70 IgG had no effect on TSHR basal activity in contrast to 5C9 IgG. When K1-70 and 5C9 IgGs were mixed together to give a final IgG concentration of 2µg/mL cyclic AMP levels dropped slightly from 58.04 ±8.52 pmol/mL (mean ±SD, n= 3) in the presence of buffer only to 55.28 ±6.17 pmol/mL (mean ±SD, n=3) ie 4.8% inhibition (Table 7p). However, when 5C9 IgG was mixed with 5B3 IgG (control antibody to glutamic acid decarboxylase) to give a final IgG concentration of 2µg/mL constitutive activity of the TSHR was inhibited to 52.1% of basal values (cyclic AMP level 27.78 ±2.96 pmol/mL; mean ±SD, n=3) (Table 7p). These experiments show that in the presence of K1-70 IgG, 5C9 IgG is unable to act as an effective inhibitor of TSHR constitutive activity.
- The effect of K1-18 IgG on stimulation of cyclic AMP production was tested using CHO cells expressing TSHRs with the following amino acid mutations: Lys58Ala, Arg80Ala, Tyr82Ala, Glu107Ala, Arg109Ala, Lys129Ala, Phe130Ala, Phe134Ala, Lys183Ala, Asp203Ala, Arg255Asp (Table 8a-k and summarised in Table 10). Mutation of TSHR amino acids Lys58, Arg80, Tyr82, Glu107, Arg109, Lys129, Phe130,
Phe 134 and Asp203 to alanine had no effect on K1-18 IgG's ability to stimulate cyclic AMP production. The ability of K-18 IgG to stimulate cyclic AMP production was lost completely with CHO cells expressing TSHR containing mutations Lys183Ala and Arg255Asp and cyclic AMP concentrations in response to K1-18 IgG were similar to the concentrations observed in the presence of cyclic AMP buffer only (Table 8i and 8k). However, responsiveness to TSH was retained with the Lys183Ala and Arg255Asp mutations. In an additional series of experiments the effects of mutations of various amino acids of the TSHR on K1-18 IgG cyclic AMP stimulating activity was tested further (Tables 14a-14v and summarised in Table 16). Mutations (to alanine) of TSHR residues Asp43, Ile60, Glu61, Thr104, His105, Lys250, Arg255, Thr257, Asp276 and Ser281 had no effect on K1-18 IgG's ability to stimulate cyclic AMP production. Mutations of TSHR Asp151, Glu178, Lys209, Gln235, Glu251 to alanine caused a small reduction of K1-18 IgG stimulating activity, however, these mutations also affected TSH stimulating activity therefore the interactions with these TSHR residues were not considered specific for K1-18. In contrast, mutations of TSHR Glu157Ala, Lys183Asp, Tyr185Ala and Asp232Ala resulted in loss of the ability of K1-18 IgG to stimulate cyclic AMP (less than 20% of the wild type activity; Tables 14g, 14i, 14j, 14m). Furthermore, the ability of K1-18 IgG to stimulate the TSHR mutated at Tyr206, Trp258 and Arg274 to alanine was reduced to approximately 40-60% of the wild type activity (Tables 14k, 14s, 14t). - The effect of K1-70 IgG on TSH stimulation of cyclic AMP production was tested in CHO cells expressing TSHRs containing mutations of the following amino acids to alanine: Lys58, Arg80, Tyr82, Glu107, Arg109, Lys129, Phe130, Phe134, Lys183 and Asp203. In addition the effect of TSHR mutation Arg255Asp was tested. (Table 9 a-k and summarised in Table 10). Mutation of TSHR amino acids Arg80, Glu107, Lys129, Phe130, Phe134and Asp203 to alanine had no effect on K1-70 IgG's ability to inhibit TSH stimulated cyclic AMP production. The ability of K1-70 to inhibit TSH stimulated cyclic AMP production was reduced by mutation of TSHR Lys58, Tyr82, Arg109 and Lys183 to alanine. The mutation Lys58Ala had the greatest effect (Table 9a) followed by Arg109Ala, Lys183Ala and Tyr82Ala that had the smallest effect (Tables 9e, 9i, 9c respectively and Table 10). However, none of the mutations studied caused a complete loss of K1-70 IgG ability to block TSH stimulated cyclic AMP production. In an additional series of experiments the effects of mutations of various amino acids of the TSHR on K1-70 IgG blocking activity was tested further (Tables 15a-15v and summarised in Table 16).The ability of K1-70 to inhibit TSH stimulated cyclic AMP production in TSHR transfected CHO cells was not affected by the TSHR mutations Asp43, Thr104, His105, Asp151, Tyr185, Tyr206, Lys209, Asp232, Gln235, Glu251, Arg255, Thr257, Trp258, and Arg274 to alanine nor mutations Asp160Lys and Lys183Asp. Mutations (to alanine) at TSHR Glu178 and Ser281 had a small effect on the ability of K1-70 IgG to block the stimulating activity of TSH (80-100% of the wild type activity; Tables 15h and 15v). TSHR mutations Glu61, Lys250 and Asp276 to alanine caused some effect (60-80% of the wild type) on K1-70 IgG blocking activity (Tables 15c, 15o, 15u) while TSHR mutation Ile60Ala caused reduction of K1-70 IgG blocking activity to 40-60% of the wild type activity (Table 15b).
- Binding of 125I-K1-70 IgG to TSHR coated tubes was inhibited in a dose dependent manner by unlabelled K1-70 IgG and at concentrations of 0.003µg/mL, 0.03µg/mL, 0.3µg/mL and 3 µg/mL (diluted in HBD serum) the inhibitions were 10.2±2.4%; 36.5±1.9%; 84.4±0.8% and 92.0±0.5%, respectively (Table 11 a). As shown in Table 11a binding of 125I-K1-70 IgG was inhibited in a very similar way by M22 IgG (diluted in HBD serum); 6.2% (mean of duplicate determinations); 33.8±0.9%; 84.6±1.1% and 91.6±0.5% inhibitions at 0.003µg/mL, 0.03µg/mL, 0.3µg/mL and 3 µg/ml concentrations. M22 Fab showed a greater potency to inhibit 125I-K1-70 IgG binding at lower concentrations with the inhibitions of 16.7±6.0%; 60.2±1.8%; 89.9±01% and 92.0±0.3% at 0.003µg/mL, 0.03µg/mL, 0.3µg/mL and 3 µg/mL concentrations (in HBD serum) (Table 11a). Also, K1-18 IgG and Fab inhibited 125I-K1-70 IgG binding to the TSHR in a dose dependent manner (Table 11b). Dilutions of K1-18 IgG at 0.03µg/mL, 0.3µg/mL and 3 µg/mL (in HBD serum) showed 20.0±1.9%. 73.9±0.6% and 91.0 ±0.3% inhibition respectively and K1-18 Fab at 0.03µg/mL, 0.3µg/mL and 3 µg/mL (in HBD serum) showed 10.2±2.1%, 60.9±1.1% and 80.5±0.6% inhibition respectively (Table 11 b). In contrast higher concentrations of 5C9 IgG were required to inhibit 125I-K1-70 IgG binding; 1µg/mL was needed for 15.4±3.4% inhibition and 100µg/mL showed 68.5±0.7 % inhibition (Table 11a). Tables 11a and 11b also show the effects of various human MAbs on 125I-K1-70 binding in assay buffer. The effects are stronger when dilutions were made in assay buffer compared with HBD sera. The effects of different mouse monoclonal antibodies to the TSHR with TSHR stimulating activity (TSMAbs 1-7) and with TSHR blocking activity (9D33) on 125I-K1-70 IgG binding to the TSHR are shown in Table 11c. All TSMAbs tested had the ability to inhibit 125I-K1-70 IgG binding and 100µg/mL concentrations (in HBD serum) caused inhibition ranging from 33.5±3.7% (TSMAb 3) to 59.6±0.6% (TSMAb 5) (Table 11c). 9D33 IgG at 100µg/mL (in HBD serum) showed 51.1±1.7% inhibition (Table 11c). When these MAbs were diluted in assay buffer the % inhibitions were slightly higher compared with HBD sera in some cases and slightly lower in others (Table 11c). Further experiments showed that 125I-K1-70 Fab binding to the TSHR was also effectively inhibited by K1-18 IgG, K1-18 Fab, M22 IgG, M22 Fab, K1-70 IgG, K1-70 Fab, and mouse TSMAbs in a dose dependent manner (Table 11d). Graves' patient sera ( n=20) containing TSHR autoantibodies with 125I-TSH binding inhibition activity in the range from 15.9% to 80.0% (in the TSHR coated tube assay) also showed the ability to inhibit 125I-K1-70 IgG or Fab binding to the TSHR (range 19.2% to 77.6% and 15.9% to 72.8%, respectively) (Table 11e). The % inhibitions for the three labelled ligands tested were comparable in the case of each serum (Table 11e). None of the HBD sera (n=10) had an effect on 125I-labelled TSH, K1-70 IgG or Fab binding (Table 11e). Table 11e shows examples of experiments using two sera with TSHR stimulating activity (S1 and S2) and two sera with TSHR blocking activity (B1 and B2). Sera with either type of activity inhibited 125I-labelled TSH, K1-70 IgG or Fab binding in a dose dependent manner and the degree of inhibition of binding of the different ligands was comparable for each serum (Table 11e).
- 125I-labelled K1-70 IgG and Fab binding to TSHR (full length) coated tubes at room temperature reached a maximum after 180 min (45.5% and 37.1% binding respectively). 50% maximal binding occurred after about 35 min (
Figure 1a ). 125I-labelled K1-70 IgG binding to TSHR260 coated tubes reached 36.2% at 180 min and 50% maximal binding was observed after 60 min incubation (Figure 1b ). Time course of 125I-labelled K1-70 Fab binding to the TSHR260 was similar to that observed for K1-70 IgG with the maximum binding after 60 min incubation of 37.3% and 50% maximal binding after approximately 60 min (Figure 1c ). Addition of unlabelled K1-70 IgG or Fab, K1-18 IgG or Fab, M22 IgG (all at 1mg/mL), porcine TSH (100mU/mL) or assay buffer to either 125I-K1-70 IgG or 125I-K1-70 Fab bound to TSHR (full length) coated tubes did not result in detectable dissociation even after 180 min of incubation (Figure 1d ,1e and1f ). However, after addition of unlabelled M22 Fab (1 mg/mL) to 125I-K1-70 IgG or 125I-K1-70 Fab bound to TSHR coated tubes 41.2% and 27.9% respectively of the counts bound dissociated after 180 min incubation (Figure 1d and1f ). The dissociating effect of various unlabelled ligands on 125I-labelled K1-70 IgG bound to TSHR260 is shown inFigure 1g . Porcine TSH, M22 IgG and K1-18 IgG had no effect while M22 Fab and K1-70 Fab caused approximately 30% of bound 125I-labelled K1-70 IgG to dissociate from TSHR260 after 30 min incubation and thereafter dissociation did not increase further up to 180 min (Figure 1 g) . K1-18 Fab had similar effect as shown inFigure 1h . 125I-K1-70 Fab binding to TSHR260 coated tubes was not dissociated by incubation with unlabelled K1-70 IgG, K1-18 IgG, M22 IgG (all at 1mg/mL), porcine TSH (100mU/mL) or assay buffer. Incubation with unlabelled M22 Fab or K1-70 Fab (1 mg/mL) caused dissociation of 125I-K1-70 Fab binding to TSHR260 (58.9% and 62% respectively) (Figure 1i ). 125I-labelled K1-18 IgG binding to TSHR coated tubes at room temperature reached a maximum after 180min of 32.7% in the case of tubes coated with the full length TSHR and 23.3% in the case of tubes coated with TSHR260 (Figure 1j ). 50% maximal binding was observed after approx. 45 min in the case of full length TSHR and after approx. 50 min in the case of TSHR260 (Figure 1j ). 125I-labelled K1-18 IgG bound to full length TSHR coated tubes was not dissociated to a small extent by incubation with unlabelled porcine TSH while incubation with unlabelled K1-18 IgG, M22 IgG, K1-70 IgG, K1-18 Fab and K1-70 Fab had a slightly greater effect (approx. 25% dissociation after 180 min) (Figure 1k ). In contrast, M22 Fab caused 29% dissociation of 125I-K1-18 IgG bound to full length TSHR after 60 min incubation increasing to 43% dissociation after 180 min incubation (34.5% of 125I-K1-18 IgG bound in the absence of M22 Fab compared to 24.5% and 19.8% after 60 and 180 min incubation with M22 Fab respectively) (Figure 1k ). In the case of 125I-labelled K1-18 IgG bound to TSHR260 coated tubes incubation with porcine TSH had no dissociating effect (Figure 1l ). In contrast incubation with unlabelled M22 Fab, K1-70 Fab and K1-18 Fab caused bound 125I-K1-18 IgG to dissociate from TSHR260. In the presence of M22 Fab and K1-70 Fab dissociation was rapid (approximately 50% after 30 min incubation) while incubation with K1-18 Fab caused 50% dissociation after 90 min (Figure 1l ). Intact M22 IgG, K1-70 IgG and K1-18 IgG had lesser ability to dissociate 125I-K1-18 IgG from TSHR260 with approximately 30% dissociation observed after 180 min incubation (Figure 1l ). A separate series of experiments showed that 125I-labelled porcine TSH was not able to bind to TSHR260 coated tubes. Binding of 125I-TSH to tubes coated with the full length TSHR was described before (Nakatake et al 2006 supra). - The ability of K1-18 IgG to form a "bridge" between the full length TSHR immobilised on ELISA plate wells and TSHR260-AP in the liquid phase is illustrated by the examples shown in Table 12a. OD405nm values increased in a dose dependent manner with increasing concentrations of K1-18 IgG (diluted in HBD sera). In particular, OD405 nm values were 0.013, 0.191, 0.511, 0.660 and 0.706 at 0.005, 0.05, 0.5, 10 and 100 µg/mL K1-18 IgG respectively compared to OD405nm of -0.002 in the presence of HBD serum alone. K1-70 IgG (diluted in HBD sera) also bound well in the bridging ELISA and showed OD 405 nm values of 0.045, 0.290, 0.661, 0.738 and 0.794 at 0.005, 0.05, 0.5, 10 and 100 µg/mL K1-70 IgG concentrations respectively (Table 12a). The effects of K1-18 and K1-70 IgGs can be compared to the ability of M22 IgG to bind to TSHR260-AP preparations as shown in Table 12a. In the assay, increasing doses of M22 IgG (ranging from 0.005 µg/mL to 10 µg/mL diluted in HBD sera) bound increasing amounts of the TSHRs with the OD405nm values ranging between 0.045 and 0.796. When dilutions of MAbs were made in ELISA assay buffer rather than HBD sera, absorbances at 450nm were higher particularly in the case of 5C9 (Table 12a). The principle of the "bridge type" ELISA on which divalent IgG binds to two molecules of the TSHR has been validated further by the results of the experiments shown in Table 12b. Intact IgGs of human MAbs to the TSHR (M22, 5C9, K1-18 and K1-70) showed dose dependent binding in the ELISA while the monovalent Fab fragments of the same MAbs showed little or no response (Table 12b). Mouse TSMAbs 1-7 also bound well in the TSHR260-AP ELISA as illustrated by the examples in Table 12c. OD 405 nm signal ranged from 0.103 to 0.561 at 10µg/mL concentrations of TSMAbs 1-7 (Table 12c). Mouse TSHR blocking MAb 9D33 also bound in this assay system with an OD 405 nm signal of 0.481 at 10µg/mL (Table 12d). Patient sera containing TRAbs with stimulating activity i.e. sera that showed an ability to stimulate cyclic AMP activity in CHO cells expressing the TSHR reacted well in the TSHR260-AP ELISA. Table 12e shows examples of 6 different sera tested at different dilutions and the OD405 nm signal ranged from 0.407 to 0.924 at 1/5 dilutions in HBD sera. Furthermore sera from patients with blocking type TSHR autoantibodies bound well in the TSHR260-AP ELISA as illustrated by the examples in Table 12f with the OD 405 nm signal ranging from 0.323 to 0.896 at 1/10 dilutions in HBD sera. Table 12g shows more examples of binding of patient sera in the TSHR260-AP ELISA. TRAb concentrations in the TSHR260-AP ELISA were calculated from a calibration curve prepared from the
NIBSC reference preparation 90/672 and compared to TRAb concentrations (expressed as NIBSC U/L) measured in the same sera using a TSHR coated tubes assay. There was good overall agreement in TRAb measurements made using the TSHR260-AP ELISA and by inhibition of TSH binding to full length TSHR (coated tube assay) (r=0.913, n=57) (Figure 2a ). Table 12h shows that patient serum TRAbs have the ability to inhibit binding of M22 Fab labelled with peroxidase to TSHR260 coated onto ELISA plate wells. Comparison of TRAb measurement in an assay based on inhibition of M22 Fab binding to full length TSHR correlated well with results in the assay based on inhibition of M22 Fab binding to TSHR260 (r=0.761; n=56) (Figure 2b ). Other comparison data are shown inFigures 2c and2d . The effect of TSHR R255 mutation on binding of antibodies in the TSHR260-AP ELISA was tested. In these experiments full length preparations of TSHR containing the mutation R255D were coated on the plate wells and the ELISA carried out using the standard protocol described above. As shown in Table 12i binding of K1-70 IgG or 9D33 IgG were only affected slightly by the TSHR R255D mutation. In contrast, M22 IgG binding was markedly affected by TSHR R255D mutation with the OD signal reduced at all concentrations studied (Table 12i). The TSHR R255D mutation had little effect on higher concentrations of K1-18 IgG but lower concentrations (0.1µg/mL and below) were much less effective in the assay using the mutated receptor (Table 12i). Table 12j also shows that OD 405 nm signal with 10 Graves' sera (not selected for TSHR stimulating or blocking activity) was reduced when TSHR R255D coated plates were used compared to wild type TSHR. The degree of the signal reduction varied with different sera (Table 12j). Patient TSHR blocking sera bound well in the TSHR260-AP ELISA (Table 12f) and the binding of the same sera to TSHR R255D is shown in Table 12k. The OD 405nm signal values in experiments with wild type TSHR and TSHR mutated at R255D are similar and consequently the effect of TSHR R255D mutation on binding of the blocking sera does not appear evident in this assay system. The effect of R255D mutation on binding of patient blocking sera in the TSHR260-AP ELISA can be compared to the effect of the same mutation on binding of patient sera with thyroid stimulating activity. Table 121 shows binding of six stimulating sera (S1-S6 sera are the same as in Table 12e) to TSHR R255D. In the case of all six sera the OD 405nm values were lower in the assays with TSHR R255D compared to wild type TSHR. The degree of the signal reduction varied; in the case of sera S4, S5 and S6 (diluted 1:5 in HBD pool serum) the signal dropped from 0.646, 0.407 and 0.531 in the experiments with the wild type TSHR to 0.193, 0.133 and 0.342 in the experiments with TSHR R255D, respectively (Table 12l). The reduction in OD 405nm values in the case of sera with high levels of TRAb (sera S1-S3 in Table 12e and 12l) was clearly evident at higher serum dilutions. For example, OD 405 nm signal in the case of sera S1, S2 and S3 (diluted 1:20 in HBD pool) of 0.583, 0.407 and 0.453 in the experiments with the wild type TSHR were clearly reduced to 0.193, 0.117 and 0.210 in the experiments with TSHR R255D, respectively. The examples shown in Tables 12k and 121 suggest that sera with TSHR stimulating activities can be differentiated from sera with TSHR blocking activities in some cases at least on the basis of differences in binding to the TSHR containing R255D mutation. Binding of patient sera with stimulating activities tends to be affected by the mutation while binding of patient sera with blocking activities tends not to be. - In the temperature stability experiments OD450nm values of binding of M22 Fab-peroxidase to the full length TSHR in the ELISA were 1.748, 0.268 and 0.126 respectively for (a) preparations stored at -80°C (untreated), (b) incubated for 24 hours at room temperature followed by return to -80°C and (c) incubated for 48 hours at room temperature followed by return to -80°C, respectively. Consequently full length TSHR preparations stored at room temperature for 48 and 24 hours showed respectively only 7% and 15% activity relative to untreated preparations. M22 Fab-peroxidase binding OD450nm values were 2.293 for untreated TSHR260 and 1.836 and 1.676 for TSHR260 stored at room temperature for 24 and 48 hours respectively. The activity of TSHR260 stored at room temperature for 24 and 48 hours relative to untreated preparations was 80% and 73% respectively. Similar results were observed in the case of TSHR260-AP with OD450nm of 2.106 and 1.983 for samples stored at room temperature for 24 and 48 hours respectively compared to 2.395 for untreated samples. This represented 88% and 83% binding activity after 24 and 48 hours room temperature storage relative to untreated TSHR260-AP. In the experiments with untreated TSHR LRD C-CAP the OD450nm was 1.826 and after 24 and 48 hour room temp storeage 1.158 and 1.155, respectively. TSHR LRD C-CAP showed 63% activity relative to untreated preparations after 24 and 48 hour storage at room temperature. The above described experiments showed that the ability to bind M22 of TSHR260, TSHR260-AP and TSHR LRD C-CAP after room temp treatment was greater than the full length TSHR preparations. This indicates that TSHR260, TSHR260-AP and TSHR LRD C-CAP are more stable at room temperature compared to full length TSHR.
- Sequence analysis of the genes coding for K1-18 indicated that the HC V region genes were from the VH5-51*01 family, the D genes from the D3-16*02 (or D3-16* 01) family and the JH genes from the J3*02 family. In the case of the LC, V region genes were from the V3-20*01 family and J region genes from the JK-1*01 germline. The HC nucleotide and amino acid sequences are shown in
Figure 3 (SEQ ID No 1-18) and the LC nucleotide and amino acid sequences are shown inFigure 4 (SEQ ID No 19-36). There are somatic mutations in the HC gene sequence compared to the germline sequences; in particular 1 silent mutation and, 1 replacement mutation inCDR CDR CDR 3. The replacement/silent mutation (R/S) ratio for the CDRs is 2.7, however, in addition to the mutations there is an 8 base pair long insertion in theCDR 3. The HC CDR1 (SEQ ID No 6 and 16) is 5 amino acids long, CDR 2 (SEQ ID No 7 and 17) is 17 amino acids long and the CDR 3 (SEQ ID No 8 and 18) is 13 amino acids long (Figures 3b and3d , respectively). In the LC sequence there are: 2 replacement mutations in CDR1, 1 silent mutation in FWR2 and 3 replacement mutations inCDR 3 with the overall R/S mutation ratio of 5.0 (FWRs and CDRs). The LC CDR 1 (SEQ ID No 24 and 34) is made up of 12 amino acids, CDR 2 (SEQ ID No 25 and 35) of 7 amino acids and CDR 3 (SEQ ID No 26 and 36) of 9 amino acids (Figures 4b and4d , respectively). K1-70 HC V region is from the VH5-51*01 germline, D genes from the D1-7*01 family and JH genes from the J4*02 family. LC genes are from the LV1-51*01germline combined with JL genes from the LJ7*01. The HC nucleotide and amino acid sequences are shown inFigure 5 (SEQ ID No 37-54) the preferred LC nucleotide and amino acid sequences are shown inFigures 6c and6d (SEQ ID No 63-72). In the K1-70 HC sequence there are three replacement mutations in FWR1, 3 replacement mutations in CDR1, 1 replacement mutation in FWR2, 2 silent mutation inCDR CDR 3; a 5 base pair insertion in the junction between V and D genes and a 12 base pair insertion at the junction between D and J genes (Figure 5b and5d ;SEQ ID No 41 and 51)). The HC CDR 1 (SEQ ID No 42 and 52) is 5 amino acids long, CDR 2 (SEQ ID No 43 and 53) is 17 amino acids long and CDR 3 (SEQ ID No 44 and 54) is 10 amino acids long (Figures 5b and5d , respectively). K1-70 LC genes show 1 silent mutation in FWR1, 1 silent and 1 replacement mutations in FWR2 and 1 replacement mutation in FWR3. There are 1 silent and 2 replacement mutations in the CDR1 and 2 replacement mutations in the CDR3. Overall (FWRs and CDRs) R/S mutation ratio is 2.0. In addition there is a 2 base pair insertion between the LC V and J genes. The LC CDR 1 (SEQ ID No 70) is made up of 13 amino acids, CDR 2 (SEQ ID No 71) of 7 amino acids and CDR 3 (SEQ ID No 72) 11 amino acids (Figure 6d ). - The structure of Fab K1-70 has been determined at 2.22 Å resolution (
Figure 8 ). The Ramachandran plot parameters and the refinement statistics were within the range acceptable for correct structure refinement.The asymmetric unit contains two complete Fab K1-70 molecules, Fab A and Fab B. Fab A contains heavy chain A and light chain B, while Fab B contains heavy chain C and light chain D. The two Fab molecules are not related by non-crystallographic symmetry due to differences in the elbow angles (Fab A = 145.5°, Fab B = 163.1°). There are no breaks in main chain electron density in the structure, but some residues are missing at the termini. In Fab A heavy chain A and light chain B consist ofresidues 1 to 227 and 4 to 211, respectively, and in Fab B heavy chain C and light chain D consist ofresidues 1 to 227 and 2 to 212, respectively. The residues in Fab A and Fab B are numbered according to (Kabat's system (Kabat E et al 1991 supra). SeeFigures 8 and9a for details. Electron density could not be observed for the side chains ofresidues residues residues residues Figure 9a ); the canonical structures adopted by the six CDRs are 1,1 and 2 for LC CDR1, LC CDR2 and LC CDR3 respectively and 1 and 2A for HC CDR1 and HC CDR2 respectively. The HC CDR3 has not been assigned any canonical class due to greater variations in sequence and conformation. Disulphide bonds are present between cysteine residues LC23-LC88, LC134-LC194, HC22-HC92, HC142-HC208. In the crystal structure of K1-70 Fab LC CDR1 is 13 residues long, LC CDR2 is 7 residues long and LC CDR3 is 11 residues long. HC CDR1 is made up of 5 residues, HC CDR2 of 17 residues and HC CDR3 of 12 residues. For further analysis of the structure the side chains of LC CDR3 Arg94 and HC CDR2 Arg58 (for which the electron density was missing in the diffraction data set) were added. In the description of the structure below the values in brackets refer to the values obtained including these side chains. There are 158 hydrogen bonds within the LC and 177 within the HC. 52 (52) residues from the LC are involved in interface contact with 44 (45) residues from the HC. There are 7 hydrogen bonds and 2 salt bridges that keep the two chains in their relative position. The solvent accessible surface area (ASA) for the LC CDR1 is 525(485)Å2, LC CDR2 is 508(508)Å2, LC CDR3 is 257(442) Å2, HC CDR1 is 120 Å2, HC CDR2 is 759 (842) Å2 and HC CDR3 is 557(528) A2. The distribution of charged amino acids on the surface of the antigen binding site of K1-70 Fab has been analysed and is shown inFigure 9b . The surface of the combining site is dominated by negatively charged residues on one side and by positively charged residues on the other side. The acidic patches on the antigen binding surface are contributed from LC residues: Asp27B (CDR1), Asp50 (CDR2), Asp92 (CDR3) and from HC residues: Asp31 (CDR1), Asp54 and Asp56 (CDR2) and Asp96 (CDR3). The basic patches are contributed from the LC residues: Lys53 and Arg54 (CDR1) and Arg94 (CDR3) and from the HC residues: Arg58 (CDR2) and Arg 101 (CDR3). In addition,LC Lys 66 which is outside the CDR regions also contributes to a basic patch on the surface. Overall, the positively charged area on the antigen binding surface of K1-70 is made up predominantly by the LC residues while the negatively charged area by the HC residues. The antigen binding surface of K1-70 is also rich in aromatic residues with 5 tyrosines, one phenylalanine and three tryptophans from the HC and the LC CDRs (Figure 9c ). In addition, four tyrosines and one phenylalanine from the FRW regions contribute to the surface area. - The overall surface of the K1-70 antigen binding area is highly irregular with a cavity near to the centre. The cavity is surrounded mostly by aromatic residues and by LC Asp50 (
Figures 9b and9c ). Furthermore, the interior of the cavity is also populated by aromatic residues. This suggests that aromatic contacts may be important for the interaction between K1-70 and the TSHR with the prominent aromatic residue on the surface of the TSHR "fitting" into the cavity on the K1-70 surface. - Table 17a shows that recombinant K1-70 Fab in E. coli culture supernatant had the ability to inhibit 125I-TSH binding to the TSHR. The inhibiting effect was complete at lower dilutions of the culture supernatants (91.9% at 1:2 dilution) while increasing dilutions of the supernatant cause dose dependent inhibiting effect (27.9% inhibition at 1:256 dilution) (Table 17a). The effect of recombinant K1-70 Fab on TSH mediated stimulation of cyclic AMP production in CHO cells expressing the TSHR is shown in Table 17b. Different dilutions of culture supernatants showed dose dependent inhibition of cyclic AMP stimulation; from 89.3% inhibition at 1:5 dilution to 39.7% inhibition at 1:40 dilution (Table 17b). Control culture supernatants from non-induced E. coli cultures did not produced detectable inhibition of TSH binding or inhibition of TSH mediated cyclic AMP stimulation (Tables 17a &b).
- The experiments described above show that two monoclonal autoantibodies to the TSHR with very different biological activities (K1-18 stimulating and K1-70 blocking) can be isolated from a single preparation of a patient's lymphocytes. Consequently, the patient's immune system was producing both types of TSHR autoantibody ie stimulating type and blocking type at the same time. Once isolated (as described above) in the form of monoclonal autoantibodies, the properties of the two types of TSHR autoantibody can be investigated without interference from each other. The characteristics of the new human MAb with TSHR stimulating activity (K1-18) have been described and compared to the characteristics of some other known TSHR MAbs. Specifically of a stimulating human MAb (M22), a blocking human MAb (5C9), a blocking human Mab (K1-70), a blocking mouse MAb (9D33) and mouse stimulating MAbs (TSMAbs 1-7). Also the characteristics of the new human MAb with TSH antagonist activity (K1-70) have been described and compared to the characteristics of known MAbs. Specifically of a blocking human MAb (5C9), a blocking mouse MAb (9D33), a stimulating human MAb (M22), a stimulating human MAb (K1-18) and mouse stimulating MAbs (TSMAbs 1-7). It has been shown that the new human stimulating TSHR MAb K1-18 has properties similar to M22 in terms of:- inhibition of binding of labelled TSH to the TSHR, inhibition of binding of each other to the TSHR, inhibition of binding of blocking human MAbs (5C9 and K1-70) to the TSHR, inhibition of binding of mouse blocking and stimulating MAbs (9D33 and TSMAbs 1-7). Also the patient serum TRAbs inhibited binding of K1-18 to the TSHR. Furthermore, both M22 and K1-18 bind to the TSHR with a high affinity and are able to bind to a TSHR fragment consisting of amino acids 22-260 linked to alkaline phosphatase. Antibodies such as M22 and K1-18 have the ability to stimulate TSHR cyclic AMP activity although the potency of the two antibodies differs by about 1.5 fold. The studies show that the properties of TSHR stimulating autoantibodies are similar in different patients and they are representative of the properties of TSHR stimulating autoantibodies in all patients with Graves' disease studied so far. A summary of K1-18 characteristics is shown in Table 13a. Our experiments also showed that the new blocking type human MAb K1-70 (obtained from the same sample of lymphocytes as the stimulating MAb K1-18) has the ability to:- inhibit binding of labelled TSH to the TSHR, inhibit binding of human MAbs (M22, K1-18 and 5C9) to the TSHR, inhibit binding of mouse blocking and stimulating MAbs (9D33 and TSMAbs 1-7) to the TSHR. Furthermore binding of K1-70 to the TSHR was inhibited by patient serum TRAbs. K1-70 showed potent TSH antagonist activity and the ability to block stimulation of the TSHR by all patient serum TRAbs tested. K1-70 was shown to be a more effective inhibitor of TSH binding to the TSHR than 5C9. K1-70 binds to the TSHR with a high affinity and is able to bind to the TSHR fragment of amino acids 22-260 linked to the alkaline phosphatase. Consequently, K1-70 has the characteristics of patient sera with blocking TRAbs including the high binding affinity for the TSHR, the ability to inhibit TSH and M22 binding to the TSHR and the ability to block ligand induced TSHR stimulation at low concentrations of antibody. However, K1-70 has no effect on TSHR constitutive activity while 5C9 does. A summary of K1-70 characteristics is shown in Table 13b. K1-18 ability to stimulate cyclic AMP activity in CHO cells expressing TSHRs was lost when TSHR was mutated at Glu157Ala, Lys183Ala, Tyr185Ala, Asp232Ala or Arg255Asp. K1-70 ability to block TSH mediated cyclic AMP activity in CHO cells expressing TSHRs was reduced in the case of TSHR mutations Lys58Ala, Ile60Ala, Arg109Ala, Lys183Ala, Lys250Ala and slightly reduced by the TSHR mutation Tyr82Ala. Both K1-18 and K1-70 as well as M22 reacted well with the TSHR fragment of 22-260 in an ELISA based on TSHR 260-AP. Furthermore a panel of patient serum TSHR autoantibodies reacted well with TSHR amino acids 22-260 in the same assay. Patient sera with either type of TRAb activities (stimulating and blocking) bound to TSHR260 in the ELISA. In addition, ELISA plate wells coated with the TSHR fragment of amino acids 22-260 bound M22-peroxidase (from RSR Ltd) well and this M22-peroxidase binding was inhibited by a panel of patient serum TSHR autoantibodies. This inhibition of M22-peroxidase binding by the patient serum TSHR autoantibodies was similar to inhibition of M22-peroxidase binding to full length TSHR. Surprisingly therefore the TSHR fragment of amino acids 22-260 (or perhaps a smaller fragment) appears to be sufficient for routine assays of TSHR autoantibodies. Furthermore, M22 also bound well to a longer fragment of the TSHR (TSHR LRD C-CAP). In stability studies, the ability of M22 to bind TSHR260, TSHR260-AP and TSHR LRD C-CAP after they had been pre-incubated at room temperature was greater than the full length TSHR preparations which had been pre-incubated under the same conditions. This indicates that TSHR260, TSHR260-AP and TSHR LRD C-CAP are more stable at room temperature compared to full length TSHR. The TSHR mutation Arg255Asp had no effect on binding of K1-70 IgG while K1-18 IgG (at lower concentrations ie 0.1 µg/mL and below) bound less effectively to the mutated receptor. The experiments with different patient serum TRAbs indicate that sera with TSHR stimulating activities can be differentiated from sera with TSHR blocking activities on the basis of differences in binding to the TSHR containing R255D mutation. Binding of patient sera with stimulating activities is affected by the mutation while binding of patient sera with blocking activities is affected less or not at all. The experiments provide nucleotide and amino acid sequences of K1-18 and K1-70. Although heavy chain V genes of K1-18, K1-70 are derived from the same germline which belongs to the same family as the other stimulating human MAb M22 heavy chain V genes they are all combined with D and J genes from different families; furthermore K1-18 uses the kappa light chain, whereas M22 and K1-70 use lambda light chains. 5C9 (the other blocking type human MAb) germline genes are different from M22, K1-18 and K1-70 except that 5C9 and K1-70 use J4 heavy chain genes. Amino acid sequences of the CDRs of stimulating MAbs (M22 and K1-18) and blocking MAbs (5C9 and K1-70) are essentially different in particular within the heavy and the light chains CDR3s. These observations indicate that each of the 4 human autoantibodies is derived from distinct germlines. Also different CDR sequences may show similar biological activities towards the TSHR. The X-ray diffraction data provide molecular details of K1-70 Fab structure including the topography of the antigen binding site. A recombinant K1-70 Fab produced by cloning and expression of the K1-70 HC (SEQ ID No 46) and K1-70 LC (
SEQ ID No 63 with SEQ ID No 64) in E. coli showed the ability to inhibit 125I-labelled TSH binding to the TSHR and the ability to inhibit TSH mediated stimulation of TSHR cyclic AMP activity. Overall the results indicate that antibodies in accordance with the invention such as K1-18 and K1-70 show similar TSHR binding activity and similar biological effects on TSHR function as TSHR MAbs described previously (M22 and 5C9) and as TSHR autoantibodies found in different sera from patients with autoimmune thyroid disease.Table 1a Inhibition of 125I-TSH binding to TSHR coated tubes by K1-18 IgG and different TSHR monoclonal antibodies Test sample Inhibition of binding (%) Dilutions in assay buffer (mean ± SD) Inhibition of binding (%) Dilutions in HBD (mean ± SD) K1-18 IgG 100 µg/mL 91.4 ± 0.7 95.9 ± 0.2 30 µg/mL 89.5 ± 1.0 96.0 ± 0.3 10 µg/mL 91.1 ± 1.1 96.0 ± 0.5 3 µg/mL 89.1 ± 0.4 95.3 ± 0.5 1 µg/mL 89.3 ± 1.3 94.0 ± 0.7 0.3 µg/mL 89.7 ± 0.7 82.6 ± 1.0 0.1 µg/mL 78.5 ± 0.6 62.0 ± 1.6 0.03 µg/mL 45.2 ± 2.3 26.6 ± 1.2 0.01 µg/mL 21.1 ± 2.3 9.3 ± 2.1 0.003 µg/mL 0.5* 11.4 ± 3.0 0.001 µg/mL -4.6* 1.6 ± 3.2 M22 IgG 100 µg/mL 91.4 ± 1.8 96.5 ± 0.1 30 µg/mL 89.2 ± 0.5 96.1 ± 0.5 10 µg/mL 89.3 ± 0.6 96.1 ± 0.5 3 µg/mL 89.6 ± 0.4 96.0 ± 0.6 1 µg/mL 89.9 ± 1.7 95.5 ± 0.3 0.3 µg/mL 88.6 ± 1.2 89.9 ± 0.2 0.1 µg/mL 87.2 ± 1.2 76.1 ± 2.2 0.03 µg/mL 58.3 ± 1.5 41.6 ± 3.5 0.01 µg/mL 23.4 ± 3.4 18.0 ± 0.8 0.003 µg/mL 7.1* 11.1 ± 2.9 0.001 µg/mL 1.5* 10.6 ± 8.7 5C9 IgG 100 µg/mL 82.9 ± 1.0 35.3 ± 2.8 10 µg/mL 40.5 ± 0.3 40.9 ± 1.1 1 µg/mL 23.5 ± 2.9 19.7 ± 1.2 0.1 µg/mL 21.3* 16.2 ± 4.3 0.01 µg/mL 15.9* 4.1 ± 2.2 TSMAb 1 IgG 100 µg/mL 61.1 ± 4.1 54.1 ± 4.1 10 µg/mL 48.1 ± 1.7 43.4 ± 1.1 1 µg/mL 29.3 ± 1.5 26.5 ± 0.5 0.1 µg/mL 11.0 ± 1.7 6.8 ± 1.7 0.01 µg/mL 2.6 ± 2.1 2.4* TSMAb 2 IgG 100 µg/mL 77.6 ± 7.7 48.0 ± 4.4 10 µg/mL 37.7 ± 2.6 39.0 ± 0.5 1 µg/mL 29.1 ± 2.5 33.6* 0.1 µg/mL 23.4 ± 2.7 15.9 ± 0.8 0.01 µg/mL 1.6 ± 1.5 0.7 ± 1.7 TSMAb 3 IgG 100 µg/mL 81.1 ± 2.9 54.3 ± 3.3 10 µg/mL 58.1 ± 1.1 44.7 ± 2.8 1 µg/mL 35.2 ± 1.5 37.7 ± 0.7 0.1 µg/mL 30.7 ± 0.8 15.7 ± 4.9 0.01 µg/mL 9.0 ± 0.5 -2.5 ± 4.1 TSMAb 4 IgG 100 µg/mL 57.2 ± 4.7 63.5 ± 5.6 10 µg/ml 40.8 ± 1.3 56.5 ± 1.2 1 µg/mL 39.8 ± 0.8 53.9 ± 2.3 0.1 µg/mL 42.8 ±1.4 32.1 ± 3.3 0.01 µg/mL 33.3* 8.6 ± 7.2 TSMAb 5 IgG 100 µg/mL 87.8 ± 1.0 61.9 ± 2.8 10 µg/mL 64.6 ± 1.1 56.9 ± 1.9 1 µg/mL 43.9 ± 1.1 53.8 ± 2.6 0.1 µg/mL 39.7 ± 0.9 38.6 ± 2.4 0.01 µg/mL 15.9 ± 9.4 7.5 ± 0.6 TSMAb 6 IgG 100 µg/mL 68.6 ± 2.5 46.9 ± 2.6 10 µg/mL 32.8 ± 0.9 40.8 ± 2.3 1 µg/mL 28.9 ± 3.0 40.2 ± 0.9 0.1 µg/mL 24.6 ± 0.6 30.2 ± 1.3 0.01 µg/mL 9.5 ± 5.8 19.6 ± 0.6 TSMAb 7 IgG 100 µg/mL 69.4 ± 3.4 45.9 ± 1.1 10 µg/mL 43.9 ± 0.6 42.0 ± 0.7 1 µg/mL 28.5 ± 4.8 37.7 ± 1.6 0.1 µg/mL 19.8 ± 1.5 19.9 ± 1.5 0.01 µg/mL -3.1 ± 5.2 8.0 ± 2.1 9D33 IgG 100 µg/mL 75.6 ± 1.2 67.4 ± 4.6 10 µg/mL 58.7 ± 4.1 60.5 ± 2.6 1 µg/mL 50.9 ± 2.9 50.8 ± 2.2 0.1 µg/mL 48.3 ± 2.6 30.5 ± 2.7 0.01 µg/mL 15.8 ± 3.0 3.6 ± 3.3 5B3 IgG 100 µg/mL 22.4 ± 1.5 -3.9 ± 5.7 10 µg/mL -5.7 ± 2.1 -1.9 ± 1.5 1 µg/mL -1.7 ± 5.3 -4.9 ± 3.4 0.1 µg/mL -5.0 ± 3.7 4.4 ± 2.5 0.01 µg/mL -5.8* 2.6* Results shown are mean ± SD of triplicate determinations. "mean of duplicate determinations. HBD = pool of healthy blood donor sera. 5B3 is a human MAb to glutamic acid decarboxylase (negative control). 125I-TSH binding in the presence of assay buffer was 11%. 125I-TSH binding in the presence of HBD pool was 11.5%. Assay buffer is 50 mmol/L NaCl, 10 mmol/L Tris pH 7.8, 0.1 % Triton X-100. Table 1b Inhibition of 125I-TSH binding to TSHR coated tubes by K1-70 IgG and K1-70 Fab and by various TSHR monoclonal antibodies Test sample Inhibition of binding (%) Dilutions in assay buffer (mean ± SD) Inhibition of binding (%) Dilutions in HBD (mean ± SD) K1-70 IgG 100 µg/mL 94.6 ± 0.2 95.9 ± 0.8 30 µg/mL 93.3 ± 0.4 94.9 ± 0.4 10 µg/mL 92.7 ± 0.8 93.9 ± 1.4 3 µg/mL 91.8 ± 0.5 94.1 ± 0.4 1 µg/mL 92.3 ± 0.4 91.9 ± 0.9 0.3 µg/mL 91.3 ± 1.1 83.5 ± 1.3 0.1 µg/mL 86.9 ± 1.1 50.0 ± 1.6 0.03 µg/mL 50.5 ± 2.0 13.5 ± 2.3 0.01 µg/mL 8.3 ± 2.8 -7.0 ± 1.9 0.003 µg/mL -3.7 ± 1.6 0.8 ± 4.7 0.001 µg/mL -6.1 ± 5.5 -3.0 ± 2.2 K1-70 Fab 100 µg/mL 87.3 ± 0.9 93.3 ± 1.2 30 µg/mL 89.0 ± 0.1 92.5 ± 0.8 10 µg/mL 87.2 ± 0.9 91.2 ± 0.2 3 µg/ml 88.2 ± 0.4 91.6 ± 0.5 1 µg/mL 88.1 ± 0.7 91.8 ± 1.3 0.3 µg/mL 87.5 ± 0.3 88.1 ± 2.3 0.1 µg/mL 85.0 ± 0.4 71.6 ± 3.1 0.03 µg/mL 70.3 ± 0.6 40.7 ± 0.6 0.01 µg/mL 24.8 ± 1.3 18.9 ± 0.5 0.003 µg/mL 2.7 ± 2.8 *-1.7 0.001 µg/mL -2.6 ± 3.5 7.2 ± 2.8 M22 IgG 100 µg/mL 88.5 ± 0.9 96.2 ± 0.5 30 µg/mL 90.0 ± 2.4 94.3 ± 0.3 10 µg/mL 87.5 ± 1.4 93.4 ± 1.6 3 µg/ml 89.5 ± 2.5 94.6 ± 0.7 1 µg/mL 91.6 ± 0.8 92.6 ± 1.6 0.3 µg/ml 89.9 ± 0.6 82.2 ± 2.0 0.1 µg/mL 84.3 ± 0.9 62.1 ± 1.7 0.03 µg/mL 48.3 ± 0.9 31.4 ± 3.8 0.01 µg/mL 7.5 ± 1.1 -0.3 ± 5.5 0.003 µg/mL -1.5 ± 5.5 -1.8 ± 4.0 0.001 µg/mL -11.0 ± 0.7 1.2 ± 6.9 M22 Fab 100 µg/mL 91.3 ± 0.1 94.4 ± 0.8 30 µg/mL 89.9 ± 3.1 93.5 ± 0.7 10 µg/ml 90.1 ± 1.6 93.9 ± 0.7 3 µg/mL 87.5 ± 1.2 93.4 ± 0.5 1 µg/ml 89.2 ± 0.4 92.5 ± 0.5 0.3 µg/ml 87.3 ± 0.7 90.0 ± 0.2 0.1 µg/mL 86.7 ± 0.5 77.1 ± 2.9 0.03 µg/mL 71.4 ± 1.4 35.3 ± 3.3 0.01 µg/mL 27.1 ± 2.7 8.7 ± 4.9 0.003 µg/mL 1.1 ± 6.8 -7.9 ± 0.3 0.001 µg/mL -9.3 ± 2.1 -11.2 ± 1.9 5C9 IgG 100 µg/mL 92.5 ± 0.4 59.2 ± 5.3 10 µg/mL 76.7 ± 1.3 39.9 ± 5.6 1 µg/mL 38.7 ± 0.7 24.8 ± 0.8 0.1 µg/ml 24.4 ± 4.5 7.0 ± 2.4 0.01 µg/mL 8.3 ± 3.3 -5.5 ± 4.8 0.001 µg/mL -11.2 ± 2.9 -8.0 ± 1.1 See legend to Table 1a for details. 125I-TSH binding in the presence of assay buffer was 13.4%. 125I-TSH binding in the presence of HBD pool was 11.5%. Table 2a Inhibition of 125I-TSH binding to TSHR coated tubes by K1 donor serum and IgG and by K1-18 IgG and Fab Test sample Inhibition of binding (%) Dilutions in assay buffer (mean ± SD) Inhibition of binding (%) Dilutions in HBD (mean ± SD) K1 donor serum dilution 1/10 94.7 ± 0.9 81.1 ± 0.4 1/20 89.3 ± 0.7 62.4 ± 3.5 1/40 67.0 ± 1.0 39.0 ± 0.9 1/80 34.0 ± 3.8 19.8 ± 1.9 1/160 13.1 ± 3.1 9.1 ± 0.8 1/320 6.6 ± 0.9 2.17 ± 1.5 K1 donor serum IgG 1 mg/mL 89.6 ± 0.8 76.5 ± 1.5 0.5 mg/mL 79.4 ± 0.7 52.3 ± 0.7 0.25 mg/mL 52.1 ± 2.0 27.8 ± 0.4 0.125 mg/mL 29.5 ± 2.6 13.7 ± 1.3 K1-18 IgG 100 µg/mL 93.7 ± 0.6 95.7 ± 0.6 30 µg/mL 93.3 ± 0.5 95.3 ± 0.0 10 µg/mL 93.3 ± 1.1 95.3 ± 0.4 3 µg/mL 94.2 ± 1.4 94.3 ± 0.6 1 µg/mL 93.3 ± 1.0 92.0 ± 0.4 0.3 µg/mL 90.9 ± 1.3 80.9 ± 2.2 0.1 µg/mL 78.0 ± 0.4 54.0 ± 2.4 0.03 µg/mL 38.8 ± 2.2 25.5 ± 3.2 0.01 µg/mL 14.6 ± 5.2 11.8 ± 6.1 0.003 µg/mL 0.2 ± 0.2 2.4 ± 4.2 0.001 µg/mL 0.5 ± 0.9 0.9 ± 1.5 K1-18 Fab 100 µg/mL 88.9 ± 0.8 81.7 ± 1.6 30 µg/mL 85.6 ± 0.3 81.3 ± 1.4 10 µg/mL 82.9 ± 1.1 82.2 ± 0.9 3 µg/mL 79.3 ± 0.9 80.9 ± 2.1 1 µg/mL 77.0 ± 1.8 76.8 ± 1.6 0.3 µg/mL 72.4 ± 1.1 60.6 ± 1.3 0.1 µg/mL 56.2 ± 4.2 35.7 ± 3.3 0.03 µg/mL 25.6 ± 4.9 15.9 ± 4.6 0.01 µg/mL 7.4 ± 4.8 5.6 ± 7.3 0.003 µg/mL 2.4 ± 3.9 0.5 ± 0.86 0.001 µg/mL 0.0 ± 0.0 2.1 ± 2.2 See legend to Table 1a for details. 125I-TSH binding in the presence of assay buffer was 10.8% 125I-TSH binding in the presence of HBD pool was12.4%. Table 2b Inhibition of 125I-TSH binding to TSHR coated tubes by WHO reference preparation NIBSC 90/672 and bv K1-18 IgG and Fab preparations Test sample Samples diluted in serum Samples diluted in assay buffer Inhibition of binding (%) (mean ± SD) units/L units/ mg mean units/ mg Inhibition of binding (%) (mean ± SD) units/L units/ mg mean units/ mg NIBSC 90/672 0.125 units/L 0 0 0.25 units/L 0 0 0.5 units/L 5.6 ± 2.5 3.1 ± 1.6 1.0 units/L 8.1 ± 5.8 14.0 ± 2.6 2.0 units/L 18.2 ± 1.2 26.2 ± 4.2 4.0 units/L 34.8 ± 0.6 49.0 ± 4.3 8.0 units/L 65.3 ± 0.3 62.7 ± 0.2 40.0 units/L 90.9 ± 0.5 91.0 ± 0.6 M22 IgG 0.3 ng/mL 0 0 1 ng/mL 0 4.5 ± 1.6 3 ng/mL 0 10.9 ± 3.5 10 ng/mL 13.0 ± 1.51 1.5 150 26.4 ± 0.1 2.5 250 30 ng/mL 37.6 ± 1.7 4.3 143 131 64.1 ± 3.2 8.6 287 266 100 ng/mL 70.4 ± 1.1 9.9 99 87.6 ± 0.6 26 260 300 ng/mL 87.9 ± 0.1 87.6 ± 0.5 1000 ng/mL 92.5 ± 0.5 91.2 ± 0.3 K1-18 IgG 0.3 ng/mL 0 0.6 ± 1.9 1 ng/mL 0 4.5 ± 2.9 3 ng/mL 0 7.8 ± 2.1 10 ng/mL 6.4 ± 0.8 21.4 ± 1.8 1.52 152 30 ng/mL 24.7 ± 4.7 2.7 90 49.9 ± 4.2 5.3 177 181 100 ng/mL 60.2 ± 1.7 7 70 69 84.3 ± 0.9 21.5 215 300 ng/mL 79.9 ± 1.7 14.5 48 87.8 ± 1.1 1000 ng/mL 90.7 ± 0.8 90.1 ± 0.3 K1-18 Fab 0.3 ng/mL 0 2.0 ± 0.9 1 ng/mL 0 5.7 ± 3.0 3 ng/mL 0 7.8 ± 5.4 10 ng/mL 2.6 ± 3.2 16.6 ± 1.9 1.2 120 30 ng/mL 17.1 ± 1.0 1.9 63 34.5 ± 1.1 3.12 104 86 100 ng/mL 41.0 ± 2.4 4.6 46 46 58.7 ± 0.7 7.1 71 300 ng/mL 66.6 ± 0.9 8.4 28 70.8 ± 2.5 15 50 1000 ng/mL 74.4 ± 4.3 75.7 ± 0.8 4B4 IgG 0.3 ng/mL 0 5.0 ± 3.5 3 ng/mL 0 0.8 ± 1.9 30 ng/mL 0 1.9 ± 0.8 300 ng/mL 0 0.7 ± 2.0 4B4 Fab 0.3 ng/mL 0 10.7 ± 3.9 3 ng/mL 0 8.9 ± 2.5 30 ng/ml 0 0 300 ng/mL 0 0.5 ± 0.5 See legend for Table 1a for details. 125I-TSH binding in the presence of assay buffer was 17.7%. TSH binding in the presence of HBD pool was 16.0%. Table 2c Inhibition of 121I-TSH binding to TSHR coated tubes by lymphocyte donor serum IgG Test sample Samples diluted in serum Samples diluted in assay buffer Inhibition of binding (%) (mean ± SD) units/ L units/ mg (or U/mL in undil serum) mean units/ mg (or mean units/ mL) Inhibition of binding (%) (mean ± SD) units/ L units/ mg (or U/mL in undil serum) mean units/ mg (or mean units/ mL) NIBSC 90/672 0.125 units/L 2.4 ± 0.7 5.1 ± 4.2 0.25 units/L 3.5 ± 2.0 0.9 ± 1.4 0.5 units/L 9.3 ± 2.7 2.8 ± 2.2 1 unit/L 15.5 ± 1.7 14.1 ± 2.7 2 units/L 22.9 ± 6.4 27.2 ± 5.4 4 units/L 49.2 ± 1.2 53.3 ± 2.1 8 units/L 63.2 ± 1.1 62.2 ± 1.8 40 units/L 90.0 ± 0.1 90.9 ± 1.0 Donor serum diluted 160x 3.5 ± 1.9 5.3 ± 0.7 diluted 80x 10.4 ± 1.0 17.9 ± 2.9 1.25 (0.1) diluted 40x 23.3 ± 2.6 2 (0.08) (0.075) 39.5 ± 1.3 2.8 (0.112) (0.144) diluted 20x 39.7 ± 4.4 3.3 (0.07) 67.8 ± 1.6 11 (0.22) Donor serum IgG 0.01 mg/mL 0 5.1 ± 8.5 0.03 mg/mL 0.4 ± 2.7 4.4 ± 2.7 0.1 mg/mL 13.5 ± 1.6 0.8 0.008 19.8 ± 1.5 1.4 0.014 0.3 mg/mL 36.1 ± 3.0 3.0 0.010 0.011 60.6 ± 2.8 7 0.023 0.024 1 mg/mL 72.3 ± 1.2 13.5 0.014 87.2 ± 2.0 34 0.034 HBD diluted 160x 0 0 diluted 80x 0 0 diluted 40x 0 0 diluted 20x 0 0 HBD IgG 0.01 mg/mL 0 0 0.1 mg/mL 0 0 1 mg/mL 0 0 K1-18 IgG 0.3 ng/mL 0 0 1 ng/mL 0 1.7 ± 4.4 3 ng/mL 0 12.9 ± 7.0 10 ng/mL 6.0 ± 1.3 20.5 ± 6.4 1.4 140 30 ng/mL 24.4 ± 1.8 2.1 70.0 48.1 ± 5.5 3.5 116.7 150.4 100 ng/mL 53.6 ± 0.6 5.0 50.0 63.3 79.7 ± 2.8 22.5 225 300 ng/mL 79.7 ± 0.6 21 70.0 88.5 ± 2.6 36 120 1000 ng/mL 91.3 ± 0.7 ± 5.3 K1-70 IgG 0.3 ng/mL 0 0 1 ng/mL 0 0 3 ng/mL 1.0 ± 5.9 5.2 ± 4.0 0.56 186.7 10 ng/mL 14.9 ± 2.1 1.0 100 21.1 ± 2.1 1.45 145 166.1 30 ng/mL 36.4 ± 1.6 3.5 117 114 55.8 ± 0.6 5 166.7 100 ng/mL 71.9 ± 1.4 12.5 125 89.8 ± 0.7 300 ng/mL 89.4 ± 0.6 89.2 ± 0.6 1000 ng/mL 93.2 ± 0.7 90.7 ± 1.4 See legend to Table 1a for details. 125I-TSH binding in the presence of assay buffer was 12.6%. 125I-TSH binding in the presence of HBD pool was 12.9%. Table 3a Inhibition of TSH-biotin binding to TSHR coated ELISA plate wells by K1-18 IgG and different TSHR monoclonal antibodies Test sample Inhibition of binding (%) Dilutions in assay buffer (mean ± SD) Inhibition of binding (%) Dilutions in HBD (mean ± SD) K1-18 IgG 100 µg/mL 96.9 ± 0.2 98.6 ± 0.1 30 µg/mL 96.7 ± 0.2 98.4 ± 0.1 10 µg/mL 96.2 ± 0.2 98.3 ± 0.1 3 µg/mL 96.6 ± 0.2 98.2 ± 0.1 1 µg/mL 96.6 ± 0.3 96.2 ± 0.2 0.3 µg/mL 93.8 ± 0.4 90.7 ± 0.3 0.1 µg/mL 76.3 ± 1.8 55.0 ± 0.2 0.03 µg/mL 33.8 ± 1.2 31.9 ± 0.2 0.01 µg/mL 12.9 ± 2.8 10.0 ± 0.8 0.003 µg/mL 1.6 ± 0.5 1.4 ± 2.1 0.001 µg/mL -4.2 ± 0.9 -3.7 ± 1.1 M22 IgG 100 µg/mL 96.8 ± 0.2 98.8 ± 0.1 30 µg/mL 97.0 ± 0.1 98.8 ± 0.1 10 µg/mL 97.0 ± 0.1 98.7 ± 0.1 3 µg/mL 97.1 ± 0.1 98.6 ± 0.1 1 µg/mL 97.0 ± 0.1 98.3 ± 0.0 0.3 µg/mL 96.0 ± 0.2 95.5 ± 0.1 0.1 µg/mL 88.3 ± 1.1 78.2 ± 0.7 0.03 µg/mL 35.2 ± 2.4 33.3 ± 2.0 0.01 µg/mL 14.9 ± 2.0 17.5 ± 2.0 0.003 µg/mL 9.2 ± 3.4 12.1 ± 4.7 0.001 µg/mL 0.4* 7.8 ± 5.1 SC9 IgG 100 µg/mL 54.3 ± 1.3 37.1 ± 2.2 10 µg/mL 37.8 ± 2.1 37.4 ± 0.9 1 µg/mL 31.4 ± 1.9 28.5 ± 1.6 0.1 µg/mL 26.1 ± 3.2 10.4 ± 1.6 0.01 µg/mL 7.5 ± 0.9 -2.6 ± 2.3 TSMAb 1 IgG 100 µg/mL 84.3 ± 0.8 82.6 ± 2.2 10 µg/mL 73.4 ± 2.8 74.6 ± 1.3 1 µg/mL 44.3 ± 1.2 47.9* 0.1 µg/mL 3.8 ± 5.9 21.2 ± 1.5 0.01 µg/mL -6.3 ± 3.3 12.8 ± 2.9 TSMAb 2 IgG 100 µg/mL 85.2 ± 0.3 78.6 ± 1.4 10 µg/mL 77.0 ± 0.7 75.1 ± 0.6 1 µg/mL 67.3 ± 1.5 65.0 ± 1.0 0.1 µg/mL 39.6 ± 0.8 29.1 ± 0.7 0.01 µg/mL 8.8 ± 0.4 7.5 ± 0.1 TSMAb 3 IgG I 100 µg/mL 82.6 ± 0.1 78.6 ± 1.4 10 µg/mL 77.0 ± 0.7 75.1 ± 0.6 1 µg/mL 67.3 ± 1.5 65.0 ± 1.0 0.1 µg/mL 39.6 ± 0.8 29.1 ± 0.7 0.01 µg/mL 8.8 ± 0.4 7.5 ± 0.1 TSMAb 4 IgG 100 µg/mL 73.1 ± 1.8 81.0 ± 1.5 10 µg/mL 72.0 ± 0.5 79.6 ± 0.3 1 µg/mL 73.1 ± 1.3 73.3 ± 1.3 0.1 µg/mL 59.0 ± 1.7 50.1 ± 1.6 0.01 µg/mL 18.9 ± 0.7 14.8 ± 3.8 TSMAb 5 IgG 100 µg/mL 89.9 ± 0.3 85.2 ± 0.1 10 µg/mL 85.8 ± 0.7 82.8 ± 0.4 1 µg/mL 79.0 ± 2.2 79.2 ± 0.7 0.1 µg/mL 60.9 ± 4.0 55.2 ± 0.9 0.01 µg/mL 19.1 ± 3.1 19.3 ± 0.4 TSMAb 6 IgG 100 µg/mL 80.3 ± 1.0 77.8 ± 0.6 10 µg/mL 73.0 ± 0.6 75.6 ± 0.4 1 µg/mL 69.5 ± 2.5 73.6 ± 0.9 0.1 µg/mL 58:5 ± 3.1 54.7 ± 2.3 0.01 µg/mL 16.9 ± 3.1 19.2 ± 1.8 TSMAb 7 IgG 100 µg/mL 83.1 ± 0.7 77.6 ± 0.5 10 µg/mL 75.3 ± 0.2 73.4 ± 0.8 1 µg/mL 62.8 ± 2.3 67.4 ± 1.9 0.1 µg/mL 38.2 ± 7.1 36.8 ± 3.4 0.01 µg/mL 14.1 ± 3.8 20.5 ± 1.7 9D33 IgG 100 µg/mL 86.8 ± 0.3 84.0 ± 0.3 10 µg/mL 84.8 ± 0.2 83.2 ± 0.2 1 µg/mL 81.8 ± 0.1 76.0 ± 0.4 0.1 µg/mL 59.7 ± 0.5 39.0 ± 1.5 0.01 µg/mL 15.3 ± 0.9 10.1 ± 4.2 5B3 IgG 100 µg/mL 1.3 ± 1.9 -2.3 ± 2.2 10 µg/mL -8.4 ± 2.3 -1.6 ± 3.3 1 µg/mL -8.3 ± 3.8 -3.5 ± 0.5 0.1 µg/mL -7.8 ± 10.0 -1.2 ± 4.3 0.01 µg/mL -5.9 ± 4.4 -5.1 ± 3.3 Results shown are mean ± SD of triplicate determination. *mean of duplicate determinations HBD = pool of healthy blood donor sera. 5B3 is a human MAb to glutamic acid decarboxylase (negative control). Assay buffer is 50 mmol/L NaCl, 10 mmol/L Tris pH 7.8, 0.1% Triton X-100, 1 mg/mL BSA. Table 3b Inhibition of TSH-biotin binding to TSHR coated ELISA plate wells by K1-18 IgG and K1-18 Fab Test sample Inhibition of binding (%) Dilutions in assay buffer (mean ± SD) Inhibition of binding (%) Dilutions in HBD (mean ± SD) K1-18 IgG 100 µg/mL 97.0 ± 0.2 98.1 ± 0.0 30 µg/mL 97.0 ± 0.1 97.9 ± 0.2 10 µg/mL 96.9 ± 0.1 97.9 ± 0.1 3 µg/mL 96.8 ± 0.2 97.9 ± 0.0 1 µg/mL 96.3 ± 0.1 96.8 ± 0.0 0.3 µg/mL 94.2 ± 0.1 87.8 ± 0.1 0.1 µg/ml 78.1 ± 0.3 61.8 ± 1.2 0.03 µg/mL 34.9 ± 0.3 26.3 ± 1.1 0.01 µg/mL 13.7 ± 0.4 8.2 ± 1.2 0.003 µg/mL 8.5 ± 1.1 3.0 ± 2.9 0.001 µg/mL 0.8 ± 2.6 -1.9 ± 0.1 K1-18 Fab 100 µg/mL 93.8 ± 0.2 95.6 ± 0.1 30 µg/mL 93.6 ± 0.2 95.6 ± 0.1 10 µg/mL 93.3 ± 0.1 95.6 ± 0.3 3 µg/mL 92.9 ± 0.6 95.3 ± 0.2 1 µg/mL 91.2 ± 0.2 92.9 ± 0.4 0.3 µg/mL 85.1 ± 0.4 80.3 ± 0.2 0.1 µg/mL 61.7 ± 1.6 47.7 ± 0.7 0.03 µg/mL 28.9 ± 2.6 18.2 ± 1.6 0.01 µg/mL 10.5 ± 3.0 5.7* 0.003 µg/mL 5.1 ± 0.9 3.1 ± 4.7 0.001 µg/mL -0.1 ± 2.3 0.3 ± 2.2 M22 Fab 0.1 µg/mL 92.9 ± 0.3 89.7 ± 0.5 0.03 µg/mL 57.0 ± 1.5 49.9 ± 2.2 0.01 µg/mL 18.6 ± 3.0 16.3 ± 3.2 0.003 µg/mL 5.3 ± 1.8 5.4 ± 5.6 0.001 µg/mL -0.1 ± 0.5 -1.4 ± 7.0 See legend to Table 3a for details. Results of negative control MAb (5B3 IgG) are shown in Table 3a. Table 3c Inhibition of TSH-biotin binding to TSHR coated plate wells by K1-18 IgG (effect of different assay conditions) Test sample % Inhibition (mean ± SD) Dilutions in assay buffer % Inhibition (mean ± SD) Dilutions in HBD % Inhibition (mean ± SD) Dilutions in assay buffer + 100 µg/mL 5B3 IgG K1-18 IgG 100 µg/mL 96.9 ± 0.2 98.6 ± 0.1 96.7 ± 0.1 30 µg/mL 96.7 ± 0.2 98.4 ± 0.1 96.7 ± 0.2 10 µg/mL 96.2 ± 0.2 98.3 ± 0.1 96.6 ± 0.1 3 µg/mL 96.6 ± 0.2 98.2 ± 0.1 96.6 ± 0.1 1 µg/ml 96.6 ± 0.3 96.2 ± 0.2 96.4 ± 0.0 0.3 µg/mL 93.8 ± 0.4 90.7 ± 0.3 94.8 ± 0.1 0.1 µg/mL 76.3 ± 1.8 55.0 ± 0.2 82.8 ± 0.4 0.03 µg/mL 33.8 ± 1.2 31.9 ± 0.2 45.6 ± 1.1 0.01 µg/mL 12.9 ± 2.8 10.0 ± 0.8 17.6 ± 4.9 0.003 µg/mL 1.6 ± 0.5 1.4 ± 2.1 4.6 ± 1.3 0.001 µg/mL -4.2 ± 0.9 -3.7 ± 1.1 -4.0 ± 5.2 M22 IgG 100 µg/mL 96.8 ± 0.2 98.8 ± 0.1 97.2 ± 0.9 30 µg/mL 97.0 ± 0.1 98.8 ± 0.1 97.0 ± 0.1 10 µg/mL 97.0 ± 0.1 98.7 ± 0.1 97.0 ± 0.0 3 µg/mL 97.1 ± 0.1 98.6 ± 0.1 96.9 ± 0.0 1 µg/mL 97.0 ± 0.1 98.3 ± 0.0 96.8 ± 0.0 0.3 µg/mL 96.0 ± 0.2 95.5 ± 0.1 96.4 ± 0.0 0.1 µg/mL 88.3 ± 1.1 78.2 ± 0.7 91.2 ± 0.1 0.03 µg/mL 35.2 ± 2.4 33.3 ± 2.0 43.6 ± 3.4 0.01 µg/mL 14.9 ± 2.0 17.5 ± 2.0 12.9 ± 2.0 0.003 µg/mL 9.2 ± 3.4 12.1 ± 4.7 -0.5 ± 5.1 0.001 µg/mL 0.4* 7.8 ± 5.1 -7.7 ± 5.8 5C9 IgG 100 µg/mL 91.2 ± 0.8 48.6 ± 1.8 92.3 ± 0.3 10 µg/mL 58.2 ± 0.5 42.6 ± 4.6 63.9 ± 0.8 1 µg/mL 42.9 ± 1.6 35.7 ± 4.0 46.7 ± 1.7 0.1 µg/mL 34.9 ± 4.0 21.6 ± 4.7 36.3 ± 2.0 0.01 µg/mL 16.1 ± 2.9 7.5 ± 5.4 20.7 ± 2.9 5B3 IgG 100 µg/mL 8.3 ±2.4 10.9 ± 2.9 1.1 ± 3.6 10 µg/mL 0.9 ± 0.6 11.6 ± 3.3 -4.8 ± 1.8 1 µg/mL -1.0 ± 0.2 8.0 ± 1.7 -4.8 ± 3.2 0.1 µg/mL -2.0 ± 0.7 8.6 ± 1.9 -6.4 ± 2.6 See legend to Table 3a for details. Table 3d Inhibition of TSH-biotin bindina to TSHR coated plate wells bv K1-70 laG and K1-70 Fab Test sample Inhibition of binding (%) Dilutions in assay buffer (mean ±SD) Inhibition of binding (%) Dilutions in HBD (mean ± SD) K1-70 IgG 100 µg/mL 97.2 ± 0.2 98.2 ± 0.1 30 µg/mL 97.2 ± 0.1 98.2 ± 0.1 10 µg/mL 97.3 ± 0.1 97.9 ± 0 3 µg/mL 97.2 ± 0.2 97.8 ± 0.1 1 µg/mL 97.3 ± 0.1 97.4 ± 0.2 0.3 µg/mL 97.0 ± 0.1 93.8 ± 0.1 0.1 µg/mL 91.3 ± 0.8 74.1 ± 0.4 0.03 µg/mL 45.0 ± 3.1 35.0 ± 1.0 0.01 µg/mL 10.7 ± 0.7 13.6 ± 1.4 0.003 µg/mL -1.7 ± 2.6 12.1 ± 2.8 0.001 µg/mL -0.1 ± 3.9 3.5 ± 1.8 K1-70 Fab 100 µg/mL 96.5 ± 0.2 97.3 ± 0.1 30 µg/mL 96.4 ± 0 97.4 ± 0.2 10 µg/mL 96.3 ± 0.1 97.3 ± 0 3 µg/mL 97.3 ± 0.2 97.3 ± 0.1 1 µg/mL 96.2 ± 0.1 96.9 ± 0.1 0.3 µg/mL 95.8 ± 0.1 95.8 ± 0.7 0.1 µg/mL 94.2 ± 0.6 88.3 ± 0.3 0.03 µg/mL 57.6 ± 1.2 55.5 ± 1.5 0.01 µg/mL 23.4 ± 3.1 18.2 ± 0.6 0.003 µg/mL 18.3 ± 0.6 9.2 ± 5.6 0.001 µg/mL -3.2 ± 3.3 4.8 ± 4.7 See legend to Table 3a for details. Results of negative control MAb (5B3 IgG) are shown in Table 3a. Table 4a Inhibition of M22-peroxidase binding to TSHR coated ELISA plate wells by K1-18 IgG and different TSHR monoclonal antibodies Test sample Inhibition of binding (%) Dilutions in assay buffer (mean ± SD) Inhibition of binding (%) Dilutions in HBD (mean ± SD) K1-18 IgG 100 µg/mL 98.4 ± 0.1 98.0 ± 0.1 30 µg/mL 98.2 ± 0.1 97.8 ± 0.1 10 µg/mL 98.2 ± 0.1 97.6 ± 0.2 3 µg/mL 98.1 ± 0.1 97.2 ± 0.1 1 µg/mL 97.2 ± 0.3 94.5 ± 0.0 0.3 µg/mL 92.1 ± 0.7 81.6 ± 0.5 0.1 µg/mL 73.9 ± 7.1 49.8 ± 0.6 0.03 µg/mL 29.9 ± 5.3 21.0 ± 1.3 0.01 µg/mL 9.1 ± 3.7 1.2 ± 4.6 0.003 µg/mL -1.7 ± 4.0 0.4 ± 4.3 0.001 µg/mL -5.2 ± 4.7 -0.0 ± 2.0 M22 IgG 100 µg/mL 98.9 ± 0.1 98.6 ± 0.1 30 µg/mL 98.6 ± 0.1 98.4 ± 0.0 10 µg/mL 98.6 ± 0.1 98.4 ± 0.1 3 µg/mL 98.4 ± 0.1 98.0 ± 0.2 1 µg/mL 98.3 ± 0.0 97.4 ± 0.1 0.3 µg/mL 96.7 ± 0.3 93.2 ± 0.3 0.1 µg/mL 90.6 ± 0.9 79.4 ± 0.5 0.03 µg/mL 66.0 ± 2.1 51.0 ± 2.4 0.01 µg/mL 29.5 ± 0.9 22.7 ± 3.7 0.003 µg/mL 5.7 ± 1.4 8.8 ± 4.4 0.001 µg/mL 2.0 ± 4.1 2.6 ± 3.4 5C9 IgG 100 µg/mL 24.6 ± 1.3 19.6 ± 5.3 10 µg/mL 13.2 ± 2.6 13.0 ± 2.6 1 µg/mL 12.1 ± 2.1 7.8 ± 2.4 0.1 µg/mL 7.1 ± 0.9 6.3 ± 2.7 0.01 µg/mL 0.6 ± 3.6 0.9 ± 1.0 TSMAb 1 IgG 100 µg/mL 74.0 ± 0.6 71.0 ± 1.2 10 µg/mL 68.6 ± 0.4 63.5 ± 1.9 1 µg/mL 39.0 ± 1.8 30.6 ± 3.8 0.1 µg/mL 8.8 ± 1.8 2.4 ± 3.4 0.01 µg/mL 4.3 ± 1.7 -6.3 ± 1.1 TSMAb 2 IgG 100 µg/mL 63.1 ± 0.2 65.2 ± 3.9 10 µg/mL 58.3 ± 1.2 62.4 ± 1.2 1 µg/mL 52.8 ± 0.7 56.4 ± 3.9 0.1 µg/mL 29.5 ± 1.6 25.8 ± 2.8 0.01 µg/mL 5.6 ± 2.8 8.4 ± 3.8 TSMAb 3 IgG 100 µg/mL 34.5 ± 0.5 42.7 ± 2.9 10 µg/mL 38.4 ± 1.5 40.7 ± 3.1 1 µg/mL 34.3 ± 1.5 29.8 ± 2.5 0.1 µg/ml 19.4 ± 1.6 16.7 ± 7.1 0.01 pq/mL 8.2 ± 1.3 3.8 ± 3.1 TSMAb 4 IgG 100 µg/mL 56.6 ± 2.8 55.2 ± 3.1 10 µg/mL 56.0 ± 1.7 55.4 ± 1.8 1 µg/mL 55.6 ± 1.3 52.4 ± 1.3 0.1 µg/mL 40.2 ± 1.6 25.2 ± 0.7 0.01 µg/mL 13.7 ± 3.5 11.6 ± 5.0 TSMAb 5 IgG 100 µg/mL 67.2 ± 1.2 63.7 ± 1.7 10 µg/mL 65.4 ± 1.0 63.6 ± 2.3 1 µg/mL 63.4 ± 1.0 59.2 ± 1.1 0.1 µg/mL 54.3 ± 2.8 37.1 ± 1.9 0.01 µg/mL 22.6 ± 1.3 9.1 ± 2.9 TSMAb 6 IgG 100 µg/mL 62.9 ± 4.4 56.3 ± 2.0 10 µg/mL 55.8 ± 1.1 52.2 ± 1.5 1 µg/mL 54.7 ± 0.7 51.3 ± 1.1 0.1 µg/mL 40.7 ± 2.5 37.3 ± 5.7 0.01 µg/mL 11.6 ± 2.5 2.9 ± 1.6 TSMAb 7 IgG 100 µg/mL 51.2 ± 1.0 46.8 ± 0.2 10 µg/mL 54.1 ± 4.4 46.1 ± 1.2 1 µg/mL 46.9 ± 1.1 44.9 ± 2.2 0.1 µg/mL 28.9 ± 2.9 28.3 ± 8.5 0.01 µg/mL 3.9 ± 1.5 1.4 ± 1.4 9D33 IgG 100 µg/mL 64.1 ± 1.7 65.9 ± 0.3 10 µg/mL 64.2 ± 1.7 66.7 ± 1.4 1 µg/mL 60.1 ± 0.9 57.8 ± 1.2 0.1 µg/mL 35.1 ± 2.0 24.1 ± 1.9 0.01 µg/mL 14.8 ± 3.5 6.2 ± 4.9 5B3 IgG 100 µg/mL 8.1 ± 0.9 3.8 ± 2.5 10 µg/mL 2.4 ± 1.2 4.9 ±7.1 1 µg/mL 3.4 ± 1.7 9.7 ± 3.9 0.1 µg/mL 1.4 ± 1.9 3.0 ± 3.1 0.01 µg/mL 2.2 ± 6.1 4.3 ± 3.0 Results shown are mean ± SD of triplicate determinations. *mean of duplicate determinations HBD = pool of healthy blood donor sera. 5B3 is a human MAb to glutamic acid decarboxylase (negative control). Assay buffer is 50 mmol/L NaCl, 10 mmol/L Tris pH 7.8, 0.1% Triton X-100, 1 mg/mL BSA. Table 4b Inhibition of M22-peroxidase binding to TSHR coated ELISA plate wells by K1-18 IgG, K1-18 Fab and M22 Fab preparations Test sample Inhibition of binding (%) Dilutions in assay buffer (mean ± SD) Inhibition of binding (%) Dilutions in HBD (mean ± SD) K1-18 IgG 3 µg/mL 97.7 ± 0.1 96.7 ± 0.3 1 µg/mL 96.5 ± 0.4 93.2 ± 0.3 0.3 µg/mL 91.9 ± 0.8 82.2 ± 1.2 0.1 µg/mL 71.9 ± 0.6 45.3 ± 1.5 0.03 µg/mL 37.2 ± 2.6 24.4 ± 1.7 0.01 µg/mL 16.7 ± 0.9 4.7 ± 0.6 0.003 µg/mL 6.5* 2.6* K1-18 Fab 100 µg/mL 95.1 ± 0.8 93.4 ± 0.4 30 µg/mL 94.8 ± 0.1 92.6 ± 0.2 10 µg/mL 93.6 ± 0.4 92.0 ± 0.3 3 µg/mL 92.5 ± 0.1 91.7 ± 0.5 1 µg/mL 90.4 ± 0.1 87.5 ± 0.9 0.3 µg/mL 79.5 ± 0.1 70.4 ± 1.7 0.1 µg/mL 53.5 ± 0.3 47.3 ± 6.3 0.03 µg/mL 24.6 ± 3.4 14.5 ± 4.7 0.01 µg/mL 11.2 ± 1.9 11.7 ± 7 0.003 µg/mL 6.3 ± 1.1 4.9 ± 7.9 0.001 µg/mL 3.6* 2.4 ± 5.0 M22 Fab 3 µg/mL 97.5 ± 0.3 96.8 ± 0.3 1 µg/mL 97.2 ± 0.3 96.4 ± 0.2 0.3 µg/mL 96.9 ± 0.1 94.7 ± 0.3 0.1 µg/mL 93.9 ± 0.5 85.2 ± 0.3 0.03 µg/mL 80.0 ± 1.1 60.0 ± 4.9 0.01 µg/mL 44.7 ± 2.0 28.8 ± 1.1 0.003 µg/mL 17.4 ± 3.8 13.1 ± 3.1 0.001 µg/mL 5.0* 8.5* See legend to Table 4a for details. Results of negative control MAb (5B3 IgG) are shown in Table 4a. Table 4c Inhibition of M22-peroxidase binding to TSHR coated ELISA plate wells by K1-70 IgG and K1-70 Fab preparations Test sample Inhibition of binding (%) Dilutions in assay buffer (mean ± SD) Inhibition of binding (%) Dilutions in HBD (mean ± SD) K1-70 IgG 100 µg/mL 98.5 ± 0.3 98.3 ± 0.2 30 µg/mL 98.2 ± 0.1 97.9 ± 0.1 10 µg/mL 97.9 ± 0.2 97.8 ± 0.1 3 µg/mL 98.1 ± 0.2 97.6 ± 0.1 1 µg/mL 98.1 ± 0.1 96.4 ± 0.2 0.3 µg/mL 97.3 ± 0.3 91.1 ± 0.3 0.1 µg/mL 93.0 ± 0.3 69.7 ± 0.7 0.03 µg/mL 71.8 ± 4.2 34.5 ± 3.8 0.01 µg/mL 28.0 ± 2.8 92 ± 2.6 0.003 µg/mL 6.4 ± 3.1 9.6* 0.001 µg/mL -5.0 ± 2.7 0.8* K1-70 Fab 100 µg/mL 97.4 ± 0.1 97.4 ± 0.1 30 µg/mL 97.6 ± 0.05 97.5 ± 0.2 10 µg/mL 97.5 ± 0.1 97.1 ± 0.1 3 µg/mL 97.2 ± 0.2 96.5 ± 0.5 1 µg/mL 97.2 ± 0.1 96.1 ± 0.3 0.3 µg/mL 96.8 ± 0.2 94.4 ± 0.1 0.1 µg/mL 94.6 ± 0.2 86.0 ± 0.4 0.03 µg/mL 82.0 ± 0.7 58.8 ± 1.2 0.01 µg/mL 57.5 ± 3.7 27.9 ± 3.2 0.003 µg/mL 21.8 ± 3.9 8.2 ± 2.1 0.001 µg/mL 4.9 ± 0.4 -6.6 ± 1.9 K1-18 IgG 1 µg/mL 96.3 ± 0.2 94.6 ± 0.2 0.1 µg/mL 71.9 ± 0.9 56.3 ± 1.1 0.03 µg/mL 35.7 ± 4.2 13.6 ± 0.8 0.01 µg/mL 8.9 ± 3.2 -4.0 ± 4.9 0.003 µg/mL -1.9* -1.3 ± 2.9 See legend to Table 4a for details. Results of negative control MAb (5B3 IgG) are shown in Table 4a. Table 5a Inhibition of 125I-K1-18 IgG binding to TSHR coated tubes by K1-18 IgG, K1-18 Fab, K1-70 IgG and other MAbs Test sample Inhibition of binding (%) Dilutions in assay buffer (mean ± SD) Inhibition of binding (%) Dilutions In HBD (mean ± SD) K1-18 IgG 100 µg/mL 94.0 ±0.9 94.9 ± 0.2 30 µg/mL 93.2 ± 0.3 94.7 ± 0.2 10 µg/mL 92.4 ± 1.5 93.6 ± 0.9 3 µg/mL 93.0 ± 0.3 93.5 ± 0.8 1 µg/mL 92.6 ± 0.4 91.7 ± 0.8 0.3 µg/ml 91.0 ± 0.5 84.6 ± 0.5 0.1 µg/mL 82.9 ± 1.8 69.0 ± 0.5 0.03 µg/mL 52.7 ± 0.9 36.0 ± 1.8 0.01 µg/mL 19.4 ± 4.1 22.9 ± 2.4 0.003 µg/mL 9.2 ± 2.6 7.2 ± 3.5 0.001 µg/mL 1.9 ± 7.2 11.1 ± 4.4 M22 IgG 100 µg/ml 94.5 ± 1.2 95.5 ± 0.9 30 µg/ml 93.3 ± 0.9 94.3 ± 1.2 10 µg/mL 93.3 ± 0.8 94.9 ± 0.7 3 µg/mL 93.4 ± 0.6 94.6 ± 0.1 1 µg/mL 92.3 ± 0.4 94.1 ± 0.4 0.3 µg/mL 92.2 ± 0.3 92.4 ± 0.6 0.1 µg/mL 87.1 ± 0.5 80.9 ± 0.3 0.03 µg/mL 53.3 ± 3.4 56.5 ± 1.7 0.01 µg/mL 18.3 ± 5.3 36.9 ± 5.4 0.003 µg/ml 5.1 ± 3.1 14.3 ± 3.4 0.001 µg/mL -1.6 ± 3.8 11.0 ± 0.4 M22 Fab 100 µg/ml 95.0 ± 0.6 94.1 ± 0.9 10 µg/mL 91.8 ± 0.8 92.6 ± 1.2 1 µg/ml 91.6 ± 0.8 92.8 ± 0.2 0.1 µg/mL 90.2 ± 0.1 87.4 ± 0.5 0.01 µg/mL 39.1 ± 2.8 48.0 ± 1.0 0.001 µg/mL 2.9 ± 2.8 9.3* K1-70 IgG 100 µg/ml 94.6 ± 1.2 95.2 ± 2.0 30 µg/mL 94.6 ± 0.6 95.2 ± 0.1 10 µg/mL 93.6 ± 0.8 94.5 ± 0.3 3 µg/mL 93.1 ± 1.0 94.6 ± 0.5 1 µg/mL 93.6 ± 1.4 93.1 ± 0.1 0.3 µg/mL 92.7 ± 0.5 88.6 ± 0.3 0.1 µg/mL 89.0 ± 1.9 87.1 ± 1.3 0.03 µg/mL 55.7 ± 1.4 58.6 ± 2.0 0.01 µg/mL 18.5 ± 4.1 48.7 ± 1.3 0.003 µg/mL 1.5 ± 2.9 17.5 ± 3.9 0.001 µgmL 1.3 ± 4.1 10.7 ± 0.9 484 IgG 100 µg/mL 20.7 ± 2.7 -1.6 ± 2.3 10 µg/ml 5.1 ± 3.9 0.6 ± 3.0 1 µg/mL 4.5 ± 2.9 7.4 ± 5.4 0.1 µg/ml -2.3 ± 2.0 1.8 ± 4.3 0.01 µg/mL -3.5 ± 4.24 -0.8 ± 1.3 4B4 Fab 100 µg/mL -6.3 ± 0.8 -0.2 ± 1.0 10 µg/mL -4.9 ± 3.9 3.0 ± 1.5 5C9 IgG 100 µg/mL 91.3 ± 0.4 57.7 ± 2.4 10 µg/mL 65.9 ± 1.4 46.7 ± 0.6 1 µg/mL 48.0 ± 7.5 26.8* 0.1 µg/mL 33.4 ± 0.2 21.3 ± 6.4 0.01 µg/mL 11.7 ± 1.8 -1.8 ± 2.7 TSMAb 1 IgG 100 µg/mL 56.1 ± 2.0 62.5 ± 4.0 10 46.0 ± 2.2 57.8 ± 1.5 1 µg/mL 41.0 ± 0.4 36.3 ± 1.0 0.1 µg/mL 17.6 ± 4.5 3.8 ± 3.8 0.01 µg/mL 3.6 ± 9.5 -6.9 ± 3.4 TSMAb 2 IgG 100 µg/mL 72.8 ± 5.9 64.5 ± 7.3 10 µg/mL 48.2 ± 1.5 62.0 ± 2.6 1 µg/mL 43.2 ± 2.0 48.8 ± 2.8 0.1 µg/mL 37.1 ± 0.6 30.2 ± 3.2 0.01 µg/mL 7.6 ± 1.2 4.9 ± 2.0 TSMAb 3 IgG 100 µg/mL 62.7 ± 1.2 64.8 ± 7.4 10 µg/mL 54.2 ± 0.4 55.6 ± 0.4 1 µg/mL 54.3 ± 1.3 46.1 ± 1.3 0.1 µg/mL 45.7 ± 5.1 24.0 ± 8.5 0.01 µg/mL 23.4 ± 3.8 -1.5 ± 2.0 TSMAb 4 IgG 100 µg/mL 64.4 ± 2.0 81.6 ± 3.8 10 µg/mL 59.7 ± 0.4 75.7 ± 2.1 1 µg/mL 57.5 ±1.5 70.5 ± 4.6 0.1 µg/mL 48.5 ± 0.7 39.2 ± 0.3 0.01 µg/mL 12.3 ± 2.9 5.1 ± 0.9 TSMAb 5 IgG 100 µg/mL 71.9 ± 1.0 85.3 ± 3.4 10 µg/ml 67.7 ± 1.5 78.9 ± 1.6 1 µg/ml 60.5 ± 1.0 70.8 ± 1.1 0.1 µg/ml 52.7 ± 0.7 47.7 ± 1.8 0.01 µg/mL 14.4 ± 1.5 17.5 ± 9.9 TSMAb 6 IgG 100 µg/mL 72.0 ± 1.6 71.3 ± 1.6 10 µg/mL 49.3 ± 0.6 60.5 ± 1.1 1 µg/mL 46.9 ± 1.1 57.0 ± 0.6 0.1 µg/mL 40.4 ± 2.4 38.6 ± 3.8 0.01 µg/mL 19.1 ± 2.4 9.6 ± 2.4 TSMAb 7 IgG 100 µg/mL 68.7 ± 1.0 65.3 ± 4.1 10 µg/mL 53.4 ± 0.5 59.9 ± 1.3 1 µg/mL 41.0 ± 0.2 54.8 ± 2.3 0.1 µg/mL 29.4 ± 1.4 28.6 ± 1.0 0.01 µg/mL 4.3 ± 2.0 -1.0 ± 3.0 9D33 IgG 100 µg/mL 72.5 ± 0.8 68.7 ± 2.2 10 µg/mL 63.2 ± 0.8 68.1 ± 1.5 1 µg/mL 63.0 ± 0.9 62.1 ± 2.1 0.1 µg/mL 54.8 ± 1.4 33.8 ± 3.0 0.01 µg/mL 20.9 ± 0.7 5.3 ± 1.5 5B3 IgG 100 µg/mL 6.7 ± 2.1 29.4 ± 3.4 10 µg/mL -2.7 ± 1.1 -0.1* 1 µg/mL -3.8 ± 1.0 -6.2 ± 0.7 0.1 µg/ml -4.8 ± 1.8 -7.8 ± 0.6 0.01 µg/mL -4.2 ± 3.2 -8.1 ± 1.4 Results shown are mean ± SD of triplicate determinations. *mean of duplicate determinations HBD = pool of healthy blood donor sera. 4B4 is a human MAb to glutamic acid decarboxylase (negative control). 5B3 is a human MAb to glutamic acid decarboxylase (negative control). 125I-K1-18 IgG binding in the presence of assay buffer was 13.6%. 125I-K1-18 IgG binding in the presence of HBD pool was 13.8%. Assay buffer is 50 mmol/L NaCl, 10 mmol/L Tris pH 7.8, 0.1% Triton X-100. Table 5b Inhibition of 125I-K1-18 IgG binding to TSHR coated tubes by K1-18 IgG, K1-18 Fab, K1-70 IgG and K1-70 Fab preparations Test sample Inhibition of binding (%) Dilutions in assay buffer (mean ± SD) Inhibition of binding (%) Dilutions in HBD (mean ± SD) K1-18 IgG 100 µg/ml 94.5 ± 0.8 96.1 ± 0.0 30 µg/mL 93.8 ± 1.2 95.6 ± 0.8 10 µg/mL 92.5 ± 1.4 94.0 ± 1.2 3 µg/mL 93.0 ± 0.5 94.0 ± 0.3 1 µg/mL 92.8 ± 1.0 91.1 ± 0.5 0.3 µg/mL 90.9 ± 0.5 78.3 ± 3.4 0.1 µg/ml 78.9 ± 2.9 49.4 ± 2.3 0.03 µg/mL 39.3 ± 1.6 15.1 ± 2.9 0.01 µg/mL 14.9 ±2.1 5.8 ± 5.5 0.003 µg/ml 2.9 ± 5.4 -0.3 ± 2.5 0.001 µg/mL 6.9 ± 5.1 2.7 ± 1.8 K1-18 Fab 100 µg/ml 86.2 ± 2.2 84.8 ± 0.9 30 µg/mL 83.0 ± 0.8 85.0 ± 0.8 10 µg/mL 81.8 ± 0.7 83.0 ± 1.7 3 µg/mL 81.9 ± 1.3 83.4 ± 1.1 1 µg/mL 77.5 ± 1.6 80.2 ± 1.1 0.3 µg/mL 71.1 ± 0.8 65.5 ± 1.5 0.1 µg/mL 56.7 ± 0.8 39.0 ± 2.3 0.03 µg/mL 24.8 ± 0.2 10.3 ± 2.2 0.01 µg/mL 8.8 ± 2.6 1.8 ± 2.0 0.003 µg/mL 0.8 ± 4.5 1.0 ± 1.6 0.001 µg/mL -2.6 ± 5.2 -1.0 ± 3.4 K1-70 IgG 100 µg/ml 94.5 ± 0.6 95.3 ± 0.1 30 µg/ml 93.1 ± 1.0 93.9 ± 1.9 10 µg/mL 91.9 ± 0.4 95.1 ± 0.3 3 µg/mL 92.9 ± 0.9 94.1 ± 0.6 1 µg/mL 92.0 ± 0.7 92.9 ± 0.4 0.3 µg/mL 91.5 ± 0.2 82.2 ± 0.6 0.1 µg/mL 89.2 ± 1.5 55.6 ± 1.2 0.03 µg/mL 45.6 ± 2.8 17.8 ± 2.1 0.01 µg/mL 6.8 ± 1.0 6.1 ± 4.2 0.003 µg/mL 0.1 ± 2.2 2.1 ± 3.4 0.001 µg/mL -1.7 ± 2.2 -0.0 ± 2.3 K1-70 Fab 100 µg/ml 93.3 ± 0.6 92.5 ± 0.3 30 µg/mL 92.2 ± 1.5 91.8 ± 2.1 10 µg/mL 92.4 ± 1.2 92.6 ± 0.4 3 µg/mL 91.1 ± 0.8 92.8 ± 1.1 1 µg/mL 91.0 ± 0.5 92.1 ± 0.2 0.3 µg/mL 89.6 ± 0.1 88.1 ± 1.1 0.1 µg/mL 87.6 ± 1.5 75.2 ± 1.1 0.03 µg/ml 68.8 ± 2.3 35.0 ± 3.5 0.01 µg/mL 25.6 ± 4.3 16.2 ± 1.2 0.003 µg/mL 4.1 ± 4.8 3.7 ± 2.6 0.001 µg/mL -3.9 ± 0.8 -3.2 ± 4.0 M22 Fab 1 µg/mL 90.5 ± 0.7 91.8 ± 0.4 0.3 µg/mL 87.7 ± 4.0 87.8 ± 1.8 0.01 µg/ml 90.2 ± 0.6 77.4 ± 1.7 0.03 µg/mL 77.0 ± 1.1 39.5 ± 0.7 0.01 µg/mL 29.1 ± 6.0 10.5 ± 2.9 0.003 µg/mL 1.9 ± 3.1 1.0 ± 0.5 0.001 µg/mL -7.3 ± 3.5 3.8 ± 2.6 4B4 IgG 100 µg/mL 17.7 ± 1.8 -3.5 ± 2.2 10 µg/mL -0.5 ± 2.1 0.6 ± 5.3 1 µg/mL 2.1 ± 1.5 -1.2 ± 1.5 See legend to Table 5a for details. 125I-K1-18 IgG binding in the presence of assay buffer was 19.1 %. 125I-K1-18 IgG binding in the presence of HBD pool was 15.3%. Table 5c Inhibition of 125I-K1- 18 IgG binding to TSHR coated tubes by patient sera positive for TRAb (stimulating and blocking) and bv donor serum K1 Test sample % inhibition of 125I-K1-18 IgG binding % Inhibition of 125I-TSH binding G1 37.8 38.6 G2 43.1 31.5 G3 36.5 35.6 G4 44.1 47.1 G5 42.6 44.7 G6 54.5 52.1 G7 25.5 15.9 G8 48.2 41.8 G9 79.5 80.0 G10 63.1 68.7 G11 37.2 31.0 G12 37.2 29.7 G13 63.1 57.9 G14 56.4 49.3 G15 43.8 38.6 G16 44.0 42.9 G17 27.7 24.5 G18 44.5 39.1 G19 23.2 20.6 G20 54.4 38.4 HBD 1 1.9 -12.6 HBD 2 -1.2 -4.2 HBD 3 7.7 -5.4 HBD 4 5.7 -11.8 HBD 5 14.7 -4.7 HBD 6 11.8 1.8 HBD 7 0.0 -13.7 HBD 8 1.5 -12.8 HBD 9 0.2 -11.0 HBD 10 1.1 -10.6 K1 donor serum diluted 10x 59.3 67.2 diluted 20x 35.2 44.0 diluted 40x 14.2 24.8 diluted 80x 6.9 11.9 diluted 160x 5.1 2.7 diluted 320x 5.7 2.1 B1 diluted 5x 88.1 91.5 diluted 10x 77.6 83.9 diluted 20x 57.1 65.8 diluted 40x 35.5 39.6 diluted 80x 18.7 20.7 diluted 160x 11.6 7.5 diluted 320x 5.4 -2.5 B2 diluted 20x 90.3 93.5 diluted 40x 79.1 86.5 diluted 80x 58.7 68.7 diluted 160x 32.9 42.8 diluted 320x 32.6 20.4 diluted 640x 10.7 10.5 diluted 1280x 9.6 14.1 S1 diluted 5x 80.6 82.0 diluted 10x 66.9 66.5 diluted 20x 52.0 47.1 diluted 40x 32.4 32.5 diluted 80x 13.6 17.4 diluted 160x 15.8 5.2 diluted 320x 10.2 2.3 S2 diluted 5x 58.0 55.1 diluted 10x 41.5 33.7 diluted 20x 27.9 18.4 diluted 40x 19.5 9.5 diluted 80x 10.6 7.7 diluted 160x 6.7 -0.7 G1-G20 are sera from patients with Graves' disease positive for TRAbs. HBD 1-10 are individual sera from healthy blood donors. B1and B2 are sera from patients with blocking type TRAb. S1 and S2 are sera from patients with stimulating type TRAb. Table 5d Inhibition of 125I-K1-18 Fab binding to TSHR coated tubes by K1-18 IgG, K1-18 Fab and K1-70 IgG preparations Test sample Inhibition of binding (%) Dilutions In assay buffer (mean ± SD) Inhibition of binding (%) Dilutions in HBD (mean ± SD) K1-18 IgG 100 µg/ml 94.8 ± 0.8 96.0 ± 0.8 30 µg/mL 94.5 ± 0.8 95.7 ± 1.2 10 µg/mL 94.8 ± 2.6 94.5 ± 1.6 3 µg/mL 93.7 ± 0.5 94.0 ± 0.2 1 µg/mL 93.3 ± 0.7 91.9 ± 0.7 0.3 µg/mL 91.1 ± 0.9 83.5 ± 1.9 0.1 µg/ml 78.5 ± 2.5 57.0 ± 2.8 0.3 µg/mL 22.0 ± 1.4 23.5 ± 2.1 0.01 µg/mL 8.6 ± 1.4 11.0 ± 2.7 0.003 µg/mL 1.4 ± 1.7 9.0 ± 2.5 0.001 µg/mL -3.0 ± 6.1 9.4 ± 5.3 K1-18 Fab 100 µg/ml 86.2 ± 3.3 84.8 ± 1.0 30 µg/mL 84.2 ± 2.6 82.6 ± 0.9 10 µg/mL 83.5 ± 3.0 81.6 ± 1.8 3 µg/mL 81.1 ± 0.1 82.8 ± 1.0 1 µg/mL 81.5 ± 3.8 79.2 ± 1.4 0.1 µg/mL 62.5 ± 0.9 43.9 ± 1.3 M22 IgG 100 µg/ml 94.9 ± 0.3 95.9 ± 0.2 30 µg/ml 93.9 ± 2.0 95.2 ± 2.4 10 µg/mL 95.3±1.1 95.5 ±0.2 3 µg/mL 94.4 ± 0.7 95.1 ±0.4 1 µg/mL 93.4 ± 0.5 93.6 ± 1.0 0.3 µg/mL 92.5 ± 0.5 87.1 ± 0.6 0.1 µg/ml 69.8 ± 2.0 61.5 ± 1.4 0.03 µg/mL 14.7 ± 3.2 23.8 ± 1.9 0.01 µg/mL 8.0 ± 10.2 10.9 ± 2.5 0.003 µg/mL 9.0 ± 10.3 10.8 ± 5.8 0.001 µg/mL 2.9 ± 2.4 2.9 ± 3.7 M22 Fab 100 µg/ml 94.5 ± 0.4 94.5 ± 1.1 10 µg/mL 92.0 ± 2.1 92.8 ± 1.5 1 µg/mL 91.4 ± 0.5 92.8 ± 0.4 0.1 µg/mL 79.5 ± 1.2 84.5 ± 0.2 0.01 µg/ml 3.1 ± 3.3 20.4 ± 5.6 0.001 µg/mL -0.7 ± 6.4 4.7 ± 3.9 K1-70 IgG 100 µg/ml 94.8 ± 2.2 95.6 ± 1.8 30 µg/mL 95.1 ± 0.4 95.5 ± 0.6 10 µg/mL 94.6 ± 1.0 95.8 ± 0.4 3 µg/mL 94.5 ± 0.5 95.3 ± 0.3 1 µg/mL 94.0 ± 0.5 94.0 ± 0.2 0.3 µg/mL 93.4 ± 0.6 87.7 ± 0.9 0.1 µg/mL 73.8 ± 0.6 60.1 ± 2.8 0.03 µg/mL 24.1 ± 5.8 28.7 ± 1.5 0.01 µg/mL 4.8 ± 3.5 11.7 ± 4.6 0.003 µg/mL 2.2 ± 2.2 6.4 ± 2.2 0.001 µg/mL -3.9 ± 4.3 4.7 ± 3.5 4B4 IgG 100 µg/mL 17.9 ± 3.9 2.7 ± 5.2 10 µg/mL -1.35 ± 3.2 1.3 ± 0.7 1 µg/mL -2.16 ± .6 5.5 ± 3.6 0.1 µg/mL -4.5 ± 2.4 1.6 ± 1.7 0.01 µg/mL -8.9 ± 1.3 1.9 ± 1.1 4B4 Fab 100 µg/mL -7.8 ± 3.5 -0.8 ± 2.2 10 µg/mL -8.5 ± 1.4 1.6 ± 2.8 5C9 IgG 100 µg/mL 85.2 ± 1.0 61.3 ± 1.6 10 µg/mL 63.8 ± 2.1 49.8 ± 1.6 1 µg/mL 52.5 ± 1.3 23.2 ± 1.9 0.1 µg/mL 27.7 ± 1.5 6.3 ± 0.4 0.01 µg/mL 3.0 ± 2.7 5.7 ± 8.8 TSMAb 1 IgG 100 µg/mL 67.0 ± 2.0 76.8 ± 1.5 10 µg/mL 61.1 ± 3.1 67.7 ± 5.0 1 µg/mL 48.5 ± 0.8 43.4 ± 1.6 0.1 µg/mL 13.1 ± 2.0 12.8 ± 2.7 0.01 µg/mL -0.1 ± 2.6 6.3 ± 2.7 TSMAb 2 IgG 100 µg/mL 82.8 ± 1.8 83.9 ± 3.1 10 µg/mL 60.5 ± 2.5 77.1 ± 1.4 1 µg/mL 57.5 ± 0.9 63.1 ± 2.9 0.1 µg/mL 39.5 ± 1.4 32.1 ± 2.8 0.01 µg/mL 4.7 ± 4.2 6.5 ± 3.8 TSMAb 3 IgG 100 µg/mL 76.5 ± 2.4 78.5 ± 4.1 10 µg/mL 68.6 ± 1.3 72.4 ± 1.1 1 µg/mL 66.0 ± 1.9 59.4 ± 1.8 0.1 µg/mL 41.3 ± 1.2 19.7 ± 3.9 0.01 µg/mL 5.5 ± 0.4 1.4 ± 3.9 TSMAb 4 IgG 100 µg/mL 71.4 ± 1.5 82.7 ± 2.4 10 µg/mL 67.6 ± 0.6 80.5 ± 1.1 1 µg/mL 66.2 ± 0.2 70.3 ± 1.5 0.1 µg/mL 46.1 ± 0.6 31.1 ± 4.0 0.01 µg/mL 8.1 ± 2.1 2.5 ± 1.9 TSMAb 5 IgG 100 µg/mL 87.3 ± 0.9 86.4 ± 2.7 10 µg/mL 79.8 ± 1.3 81.1 ± 2.1 1 µg/mL 69.9 ± 0.9 75.9 ± 1.4 0.1 µg/mL 50.0 ± 3.0 44.1 ± 0.6 0.01 µg/mL 4.2 ± 2.5 3.3 ± 4.5 TSMAb 6 IgG 100 µg/mL 75.8 ± 2.5 77.5 ± 1.9 10 µg/mL 59.0 ± 0.7 75.4 ± 0.5 1 µg/mL 56.3 ± 4.0 70.0 ± 1.8 0.1 µg/mL 43.9 ± 0.8 40.2 ± 2.5 0.01 µg/mL *5.6 7.1 ± 3.4 TSMAb 7 IgG 100 µg/mL 78.0 ±0.4 77.4 ± 1.3 10 µg/mL 61.8 ± 2.2 72.5 ± 2.9 1 µg/mL 51.1 ± 1.5 62.8 ± 1.0 0.1 µg/mL 30.2 ± 1.2 31.3 ± 1.5 0.01 µg/mL 2.0 ± 7.0 5.6 ± 0.8 9D33 IgG 100 µg/mL 81.5 ± 2.0 77.3 ± 2.2 10 µg/mL 69.5 ± 3.9 73.9 ± 0.9 1 µg/mL 66.5 ± 0.9 64.8 ± 0.7 0.1 µg/mL 48.6 ± 2.7 32.2 ± 1.1 0.01 µg/mL 7.9 ± 1.8 2.3 ± 3.0 5B3 IgG 100 µg/mL 6.3 ± 4.5 -1.1 ± 4.8 10 µg/mL 0.6 ± 3.9 -0.1 ± 0.8 1 µg/mL -0.9 ± 1.7 -3.1 ± 3.5 0.1 µg/mL -3.6 ± 2.5 -8.3 ± 2.0 0.01 µg/mL -0.0 ± 2.3 -8.6 ± 1.3 See legend to Table 5a for details. 125I-K1-18 Fab binding in the presence of assay buffer was 10%. 125I-K1-18 Fab binding in the presence of HBD pool was 9.4%. Table 6a Comparison of stimulation of cyclic AMP production by K1-18 IgG, K1-18 Fab and M22 Fab in CHO cells expressing the TSHR Test sample Stimulation of cyclic AMP production in isotonic buffer (pmol/mL cyclic AMP mean ± SD) Stimulation of cyclic AMP production in hypotonic buffer (pmol/mL cyclic AMP mean ± SD) Cyclic AMP buffer 0.88 ± 0.12 1.48 ± 0.13 K1-18 IgG 1000 ng/mL 51.16 ± 5.29 67.90 ± 10.44 100 ng/mL 22.95 ± 2.90 64.95 ± 9.61 30 ng/mL 9.63 ± 0.76 50.72 ± 3.69 10 nq/mL 4.81 ± 0.22 31.66 ± 5.06 3 ng/mL 1.61 ± 0.77 12.55 ± 1.75 1 ng/mL 1.56 ± 0.40 4.08 ± 0.28 0.3 ng/mL 1.14 ± 0.10 2.32 ± 0.47 0.1 ng/mL 1.29 ± 0.31 1.56 ± 0.32 0.03 ng/mL 0.95 ± 0.04 1.26 ± 0.30 K1-18 Fab 1000 ng/mL 35.73 ± 2.25 66.94 ± 6.93 100 ng/mL 8.93 ± 0.18 * 53.22 30 ng/mL 2.97 ± 0.82 27.99 ± 6.25 10 ng/mL 1.65 ± 0.20 9.99 ± 3.52 3 ng/mL 1.14 ± 0.19 2.93 ± 0.17 1 ng/mL 0.79 ± 0.10 1.72 ± 0.82 0.3 ng/mL 0.71 ± 0.10 1.13 ± 0.24 0.1 ng/mL 0.84 ± 0.41 1.33 ± 0.53 0.03 ng/mL 0.50 ± 0.44 0.68 ± 0.18 M22 Fab 10 ng/mL 34.71 ± 1.43 57.41 ± 5.05 3 ng/mL 16.30 ± 1.49 55.34 ± 7.49 1 ng/mL 9.14 ± 0.82 29.80 ± 0.97 0.3 ng/mL 2.19 ±0.19 10.08 ± 0.95 0.1 ng/mL 1.38 ± 0.07 3.83 ± 0.30 Results shown are mean ± SD of triplicate determinations. *mean of duplicate determinations. Test samples were diluted in cyclic AMP buffer. Table 6b Stimulation of cyclic AMP production by K1-18 IgG, M22 IgG and pTSH in CHO cells expressing the TSHR Test sample Cyclic AMP production concentration (pmol/mL mean ± SD) AMP buffer 1.3 ± 0.2 K1-18 IgG 300 ng/mL 63.3 ± 3.7 100 ng/mL 62.6 ± 2.7 30 ng/mL 38.4 ± 3.1 10 ng/mL 25.0 ± 1.0 3 ng/mL 8.3 ± 0.5 1 ng/mL 3.0 ± 1.0 0.3 ng/mL 1.7 ± 0.3 0.1 ng/mL 0.9 ± 0.2 0.03 ng/mL 1.0 ± 0.2 0.01 ng/mL 1.0 ± 0.2 M22 IgG 100 ng/mL 64.6 ± 1.9 30 ng/mL 60.9 ± 3.5 10 ng/mL 50.3 ± 1.6 3 ng/mL 24.3 ± 2.3 1 ng/mL 8.1 ± 1.2 0.3 ng/mL 2.9 ± 0.9 pTSH 3 ng/mL 55.4 ± 7.3 1 ng/mL 51.7 ± 3.6 0.3 ng/mL 18.5 ± 1.5 0.1 ng/mL 7.2 ± 0.6 0.03 ng/mL 2.4 ± 0.7 0.01 ng/mL 1.4 ± 0.3 See legend to Table 6a for details. Table 6c Stimulation of cyclic AMP production by NIBSC reference preparation 90/672 and by K1-18 IgG and Fab preparations compared to M22 IgG Test sample Cyclic AMP concentration (pmol/mL mean ± SD) units/L units/mg mean units/mg Cyclic AMP buffer 1.36 ± 0.39 NIBSC 90/672 3 units/L 60.37 ± 3.73 1 unit/L 27.43 ± 3.52 0.3 units /L 12.47 ± 0.23 0.1 units/L 5.00 ± 0.69 K1-18 IgG 100 ng/ml 73.05 ± 3.43 30 ng/mL 63.68 ± 1.54 10 ng/mL 41.91 ± 3.97 1.85 185 3 ng/mL 16.87 ± 0.96 0.48 160 155 1 ng/mL 5.36 ± 0.68 0.12 120 0.3 ng/mL 1.91 ± 0.45 K1-18 Fab 100 ng/mL 51.38 ± 1.87 2.40 24 30 ng/mL 22.25 ± 0.81 0.70 23 22 10 ng/mL 8.34 ± 1.91 0.18 18 3 ng/mL 3.40 ± 0.52 1 ng/mL 1.91 ± 0.30 0.3 ng/mL 1.30 ± 0.32 M22 IgG 10 ng/mL 58.88 ± 8.96 2.9 290 3 ng/mL 24.57 ± 6.55 0.8 267 286 1 ng/mL 12.01 ± 2.52 0.3 300 0.3 ng/mL 2.36 ± 0.29 4B4 IgG 10 ng/ mL 1.00 ± 0.33 1 ng/ mL 1.09 ± 0.22 4B4 Fab 10 ng/mL 0.89 ± 0.11 1 ng/mL 0.68* See legend to Table 6a for details. 4B4 is a human MAb to glutamic acid decarboxylase (negative control). Test samples were diluted in hypotonic cyclic AMP buffer. Table 6d Comparison of stimulation of cyclic AMP production by porcine (p), native human (h) and recombinant human (rh) TSH in CHO cells expressing the TSHR Test sample Cyclic in isotonic buffer (pmol/mL mean ± SD) Cyclic AMP concentration in hypotonic buffer (pmol/mL mean ± SD) Cyclic AMP buffer 1.3 ± 0.5 2.0 ± 0.1 pTSH 20 ng/mL 73.9 ± 12.7 89.9 ± 10.1 3 ng/mL 46.6 ± 3.3 76.6 ± 0.0 2 ng/mL 49.5 ± 3.9 77.6 ± 9.2 1 ng/mL 37.8 ± 3.8 69.0 ± 1.4 0.3 ng/mL 14.3 ± 1.1 34.1 ± 2.8 0.1 ng/mL 4.0 ± 0.4 11.0 ± 0.6 0.03 ng/mL 2.0 ± 0.3 4.1 ± 0.3 0.01 ng/mL 1.4 ± 0.2 2.4 ± 0.2 Native hTSH 250 ng/mL 57.9 ± 7.2 79.3 ± 1.0 100 ng/mL 41.6 ± 3.0 74.4 ± 0.9 50 ng/mL 29.0 ± 0.8 69.4 ± 11.7 25 ng/mL 19.9 ± 1.2 55.2 ± 2.7 10 ng/mL 9.6 ± 1.7 37.8 ± 2.0 2.5 ng/mL 3.7 ± 0.4 11.6 ± 0.2 1 ng/mL 2.0 ± 1.2 6.1 ± 0.6 rhTSH 250 ng/mL 46.2 ± 10.2 67.4 ± 4.6 100 ng/mL 35.4 ± 2.5 63.0 ± 7.9 50 ng/mL 24.5 ± 1.3 44.7 ± 4.3 25 ng/mL 14.4 ± 0.6 30.6 ± 1.4 10 ng/mL 6.2 ± 1.1 14.3 ± 1.2 2.5 ng/mL 2.1 ± 0.4 6.0 ± 1.9 1 ng/mL 1.4 ± 0.3 3.0 ± 0.3 See legend to Table 6a for details. pTSH was from RSR Ltd, Cardiff, CF23 8HE, UK. Native hTSH was an NIBSC reference preparation 81/565. rhTSH was anNIBSC reference preparation 94/674.Table 6e Stimulation of cyclic AMP production in TSHR transfected CHO cells by pTSH, M22 IgG and K1-18 IgG mixed together in different combinations Test sample Cyclic AMP (pmol/mL; mean ±SD) cyclic AMP buffer 1.00 ± 0.72 10 ng/mL 5B3 IgG 1.58* 1 ng/mL 5B3 IgG 1.19* 0.1 ng/mL 5B3 IgG 1.53* 0.1 ng/mL pTSH 11.01 ±0.99 1 ng/mL M22 IgG 35.17 ±6.38 0.1 ng/mL pTSH + 1 ng/mL M22 IgG 47.22 ±3.89 0.05 ng/mL pTSH 5.83* 0.5 ng/mL M22 IgG 20.20* 0.05 ng/mL pTSH + 0.5 ng/mL M22 IgG 25.99 ±2.19 0.1 ng/mL pTSH 11.01 ±0.99 10 ng/mL K1-18 IqG 45.09 ±6.15 0.1 ng/mL pTSH + 10 ng/mL K1-18 IgG 52.84 ±6.76 0.05 ng/mL pTSH 5.83* 5 ng/mL K1-18 IqG 29.95* 0.05 ng/mL pTSH + 5 ng/mL K1-18 IqG 29.87 ±4.34 10 ng/mL K1-18 IgG 45.09 ±6.15 1 ng/mL M22 IgG 35.17 ±6.38 10 ng/mL K1-18 IgG + 1 ng/mL M22 IgG 52.84 ±6.76 5 ng/mL K1-18 IgG 29.95* 0.5 ng/mL M22 IqG 20.20* 5 ng/mL K1-18 IgG + 0.5 ng/mL M22 IgG 44.01 ±7.19 See legend to Table 6a for details. 5B3 is a human MAb to glutamic acid decarboxylase (negative control). Test samples were diluted in hypotonic cyclic AMP buffer. Table 6f Stimulation of cyclic AMP production in TSHR transfected CHO cells by NIBSC reference preparation 90/672 and bv K1-18 IgG, donor serum and donor serum IgG (experiment 1)Test sample Cyclic AMP concentration (pmol/mL mean ± SD) units/L units/mg mean units/mg Cyclic AMP buffer 1.5 ± 0.3 NIBSC 90/6723 units/L 37.6 ± 3.9 1 unit/L 19.0 ± 1.4 0.3 units /L 6.8 ± 0.5 0.1 units/L 2.7 ± 0.3 K1 donor IgG 30 µg/mL 7.7 ± 1.0 0.45 0.013 0.013 10 µg/mL 3.3 ± 0.2 3 µg/mL 1.8 ± 0.3 K1 donor serum diluted 10x 3.2 ± 0.4 diluted 30x 4.7 ± 0.1 0.29 diluted 100x 2.8 ± 0.0 diluted 300x 2.4 ± 0.3 HBD serum diluted 10x 1.8 ± 0.1 diluted 30x 1.7 ± 0.4 diluted 100x 1.4 ± 0.4 HBD serum IgG 30 µg/mL 1.2 ± 0.2 10 µg/mL 1.2 ± 0.2 3 µg/mL 2.1 ± 0.2 See legend to Table 6a for details. HBD = serum from a healthy blood donor (HBD IgG was isolated from the same serum). Test samples were diluted in hypotonic cyclic AMP buffer. Table 6g Stimulation of cyclic AMP production in TSHR transfected CHO cells by NIBSC reference preparation 90/672 and bv K1-18 IgG, donor serum and donor serum IgG experiment 2)Test sample Cyclic AMP concentration (pmol/mL mean ± SD) units/L units/ mg mean units/mg Cyclic AMP buffer 2.5* NIBSC 90/6723 units/L 64.6 ± 6.9 1 unit/L 36.4 ± 4.6 0.3 units/L 10.2 ± 1.0 0.1 units/L 4.3 ± 0.5 K1 donor serum IgG 30 µg/mL 15.6 ± 0.7 0.42 0.014 0.014 10 µg/mL * 5.7 3 µg/mL 2.2 ± 0.3 K1 donor serum Diluted 10x 6.9 ± 0.6 Diluted 30x 9.5 ± 0.7 0.28 Diluted 100x 6.6 ± 0.9 Diluted 300x 3.9 ± 2.4 HBD serum Diluted 10x 3.0 ± 0.7 Diluted 30x 1.5 ± 1.5 Diluted 100x 2.1 ± 0.3 HBD serum IgG 30 µg/mL 2.0 ± 0.2 10 µg/mL 2.1 ± 0.2 3 µg/mL 2.3 ± 0.9 See legend to Table 6a for details. HBD = serum from a healthy blood donor (HBD IgG was isolated from the same serum). Test samples were diluted in hypotonic cyclic AMP buffer. Table 6h Inhibition of K1-18 IgG TSHR stimulating activity by human MAbs K1-70 and 5C9 IgGs with TSH antagonist activity Test sample Cyclic AMP concentration (pmol/mL mean ± SD) % Inhibition Cyclic AMP buffer 1.6 ± 0.2 K1-70 IgG 100 µg/mL 1.1 ± 0.2 5B3 IgG 100 µg/mL 1.6 ± 0.5 5C9 IgG 100 µg/mL 1.0 ± 0.1 10 ng/mL K1-18 IgG 50.0 ± 3.3 10 ng/mL K1-18 IgG + 100 µg/ml 5B3 IgG 61.1 ± 5.9 0 10 ng/mL K1-18 IgG + 100 µg/ml K1-70 IgG 1.3 ± 1.7 97 10 ng/mL K1-18 IgG + 50 µg/ml K1-70 IgG 0.9 ± 1.5 98 10 ng/mL K1-18 IgG + 10 µg/ml K1-70 IgG 0.1 ± 0.0 100 10 ng/mL K1-18 IgG + 5 µg/ml K1-70 IgG 0.0 ± 0.0 100 10 ng/mL K1-18 IgG + 1 µg/ml K1-70 IgG 0.1 ± 0.0 100 10 ng/mL K1-18 IgG + 0.5 µg/ml K1-70 IgG 0.0 ± 0.0 100 10 ng/mL K1-18 IgG + 0.1 µg/ml K1-70 IgG 3.8 ± 1.0 92 10 ng/mL K1-18 IgG + 0.01 µg/ml K1-70 IgG 48.6 ± 1.7 3 10 ng/mL K1-18 IgG + 0.001 µg/ml K1-70 IgG 52.1 ± 11.4 0 10 ng/mL K1-18 IgG + 100 µg/ml 5C9 IgG 0.1 ± 0.0 100 10 ng/mL K1-18 IgG + 50 µg/ml 5C9 IgG 0.1* 100 10 ng/mL K1-18 IgG + 10 µg/ml 5C9 IgG 1.4 ± 1.5 97 10 ng/mL K1-18 IgG + 5 µg/ml 5C9 IgG 1.5 ± 2.4 97 10 ng/mL K1-18 IgG + 1 µg/ml 5C9 IgG 0.9 ± 1.4 98 10 ng/mL K1-18 IgG + 0.5 µg/ml 5C9 IgG 0.3* 99 10 ng/mL K1-18 IgG + 0.1 µg/ml 5C9 IgG 4.4 ± 1.5 91 10 ng/mL K1-18 IgG + 0.01 µg/ml 5C9 IgG 51.8 ± 4.9 0 10 ng/mL K1-18 IgG + 0.001 µg/ml 5C9 IgG 40.4 ± 7.0 19 See legend to Table 6a for details. 5B3 is a human MAb to glutamic acid decarboxylase (negative control). Test samples were diluted in hypotonic cyclic AMP buffer. Table 6i Inhibition of K1-18 IgG stimulation of cyclic AMP production in TSHR transfected CHO cells by K1-70 and 5C9 IgGs mixed together Test sample Cyclic AMP concentration (pmol/mL; mean ± SD) % Inhibition Cyclic AMP buffer 0.89 ± 0.15 10 ng/mL K1-18 IgG 50.3 ± 4.97 100 µg/mL 5B3 IgG 1.20 ± 0.24 100 µg/mL 5C9 IqG 0.55 ± 0.14 100 µg/mL K1-70 IgG 0.89 ± 0.13 100 µg/mL (K1-70 IgG + 5C9 IgG)a 0.86 ± 0.17 10 ng/mL K1-18 + 100 µg/mL 5B3 IgG 52.8 ± 0.21 0 10 ng/mL K1-18 + 10 µg/mL 5B3 IgG 48.5 ± 2.16 3.5 10 ng/mL K1-18 + 100 µg/mL 5C9 IgG 0.66 ± 0.25 98.7 10 ng/mL K1-18 + 10 µg/mL 5C9 IgG 0.21 ± 0.18 99.6 10 ng/mL K1-18 + 1 µg/mL 5C9 IgG 0.29 ± 0.25 99.4 10 ng/mL K1-18 + 0.1 µg/mL 5C9 IgG 0.50 ± 0.62 99.0 10 ng/mL K1-18 + 0.01 µg/mL 5C9 IgG 37.7 ± 1.75 25.0 10 ng/mL K1-18 + 0.001 µg/mL 5C9 IqG 51.2 ± 2.6 0 10 ng/mL K1-18 + 100 µg/mL K1-70 IgG 0.74 ± 0.12 98.5 10 ng/mL K1-18 +10 µg/mL K1-70 IgG 0.38 ± 0.19 99.2 10 ng/mL K1-18 + 1 µg/mL K1-70 IgG 0.37 ± 0.15 99.3 10 ng/mL K1-18 + 0.1 µg/mL K1-70 IgG 1.88 ± 0.06 96.3 10 ng/mL K1-18 + 0.01 µg/mL K1-70 IgG 40.4 ± 3.19 19.6 10 ng/mL K1-18 + 0.001 µg/mL K1-70 49.74 ± 1.73 1.0 10 ng/mL K1-18 + 100 µg/mL (K1-70 IgG + 5C9 IgG)a 0.57 ± 0.18 98.9 10 ng/mL K1-18 +10 µg/mL (K1-70 IgG + 5C9 IgG)a 0.59 ± 0.11 98.8 10 ng/mL K1-18 + 1 µg/mL (K1-70 IgG + 5C9 IgG)a 0.39 ± 0.09 99.2 10 ng/mL K1-18 + 0.1 µg/ML (K1-70 IgG + 5C9 IgG)a 1.37 ± 0.92 97.3 10 ng/mL K1-18 + 0.01 µg/mL (K1-70 IgG + 5C9 IgG)a 34.15 ± 0.62 32.0 18 10ng/mL + 0.001 µg/mL (K1-70 IgG + 5C9 IgG)a 37.4 ± 1.84 25.5 See legend to Table 6a for details. 5B3 is a human MAb to glutamic acid decarboxylase (negative control). aThe total final concentration of IgG mixture is shown; ie in the case of 100 µg/mL (K1-70 IgG + 5C9 IgG) the mixture contains 50 µg/mL K1-70 IgG and 50 µg/mL 5C9 IgG. Consequently, the combined effect of two IgGs at 100 µg/mL can be compared to the effect of the single IgG at the same concentration (100 µg/mL). Test samples were diluted in hypotonic cyclic AMP buffer. Table 6j Inhibition of M22 IgG stimulation of cyclic AMP production in TSHR transfected CHO cells bv K1-70 and 5C9 IgGs mixed together Test sample Cyclic AMP concentration (pmol/mL; mean ± SD) % Inhibition Cyclic AMP buffer 1.8 ± 0.2 3 ng/mL M22 IgG 44.4 ± 7.1 100 µg/mL 5B3 IgG 2.3 ± 0.2 100 µg/mL 5C9 IgG 1.7 ± 0.2 100 µg/mL K1-70 IgG 1.8 ± 0.2 100 µg/mL (K1-70 IgG + 5C9 IgG)a 1.9 ± 0.2 3 ng/mL M22 IgG + 100 µg/mL 5B3 IgG 51.3 ± 1.2 0 3 ng/mL M22 IgG + 10 µg/mL 5B3 IgG 44.7 ± 4.3 0 3 ng/mL M22 IgG + 100 µg/mL 5C9 IgG 1.3 ± 0.2 97.1 3 ng/mL M22 IgG + 10 µg/mL 5C9 IgG 2.5 ± 1.6 94.4 3 ng/mL M22 IgG + 1 µg/mL 5C9 IgG 1.3 ± 0.1 97.1 3 ng/mL M22 IgG + 0.1 µg/mL 5C9 IgG 3.2 ± 0.5 92.8 3 ng/mL M22 IgG + 0.01 µg/mL 5C9 IqG 33.2 ± 1.5 25.2 3 ng/mL M22 IgG + 0.001 µg/mL 5C9 IgG 41.0 ± 1.9 7.7 3 ng/mL M22 IgG + 100 µg/mL K1-70 IgG 1.4 ± 0.1 96.8 3 ng/mL M22 IgG + 10 µg/mL K1-70 IgG 1.2 ± 0.1 97.3 3 ng/mL M22 IgG + 1 µg/mL K1-70 IgG 1.5 ± 0.2 96.6 3 ng/mL M22 IgG + 0.1 µg/mL K1-70 IgG 10.9 ± 3.7 75.5 3 ng/mL M22 IgG + 0.01 µg/mL K1-70 IqG 38.4 ± 3.2 13.5 3 ng/mL M22 IgG + 0.001 µg/mL K1-70 IqG 40.5 ± 1.3 8.8 3 ng/mL M22 IgG + 100 µg/mL (K1-70 IgG + 5C9 IgG)a 1.7 ± 0.1 96.2 3 ng/mL M22 IgG +10 µg/mL (K1-70 IgG + 5C9 IgG)a 1.8 ± 0.2 95.9 3 ng/mL M22 IgG + 1 µg/mL (K1-70 IgG + 5C9 IgG)a 1.4 ± 0.1 96.8 3 ng/mL M22 IgG + 0.1 µg/mL (K1-70 IgG + 5C9 IgG)3 3.6 ± 0.4 91.9 3 ng/mL M22 IgG + 0.01 µg/mL (K1-70 IgG + 5C9 IgG)a 39.1 ± 7.9 11.9 3 ng/mL M22 IgG + 0.001 µg/mL (K1-70 IgG + 5C9 IgG)a 36.5 ± 2.8 17.8 See legend to Table 6i for details. Table 6k Inhibition of K1-18 IgG stimulation of cyclic AMP production in TSHR transfected CHO cells bv K1-70 and 9D33 IgGs mixed together Test sample Cyclic AMP concentration (pmol/mL; mean ± SD) % Inhibition Cyclic AMP buffer 1.5 ± 0.05 10 ng/mL K1-18 IgG 37.0 ± 0.9 100 µg/mL 5B3 IgG 1.3 ± 0.1 100 µg/ml 9D33 IgG 2.0 ± 0.6 100 µg/ml K1-70 IgG 1.3 ± 0.1 100 µg/mL (K1-70 IgG + 9D33 IgG)a 1.3 ± 0.2 10 nq/mL K1-18 IqG + 100 µg/mL 5B3 IgG 41.9 ± 4.3 -13 10 ng/mL K1-18 IgG + 10 µg/mL 5B3 IgG 35.4 ± 1.6 4 10 ng/mL K1-18 IqG + 100 µg/mL 9D33 IgG 2.2 ± 0.7 94 10 ng/mL K1-18 IgG + 10 µg/mL 9D33 IgG 1.9 ± 0.6 95 10 ng/mL K1-18 IgG + 1 µg/mL 9D33 IgG 1.9 ± 0.2 95 10 ng/mL K1-18 IgG + 0.1 µg/mL 9D33 IgG 5.3 ± 1.1 86 10 ng/mL K1-18 IgG +0.01 µg/mL 9D33 IgG 31.32 ± 3.3 15 10 ng/mL K1-18 IgG + 0.001 µg/mL 9D33 IgG 35.8 ± 2.3 3 10 nq/mL K1-18 IgG + 100 µg/mL KI-70 IgG 1.4 ± 0.4 96 10 ng/mL K1-18 IgG +10 µg/mL K1-70 IgG 0.9 ± 0.1 98 10 ng/mL K1-18 IgG + 1 µg/mL K1-70 IgG 1.1 ± 0.5 97 10 ng/mL K1-18 IgG + 0.1 µg/mL K1-70 IgG 1.7 ± 0.8 95 10 ng/mL K1-18 IgG + 0.01 µg/mL K1-70 IgG 27.7 ± 0.8 25 10 ng/mL K1-18 IgG + 0.001 µg/mL K1-70 IgG 37.4 ± 1.3 -1 10 ng/mL K1-18 IgG + 100 µg/mL (K1-70 IgG + 9D33 IgG)a 1.2 ± 0.1 97 10 ng/mL K1-18 IgG + 10 µg/mL (K1-70 IgG + 9D33 IgG)a 0.9 ± 0.2 98 10 ng/mL K1-18 IgG + 1 µg/mL (K1-70 IgG + 9D33 IgG)a 1.1 ± 0.1 97 10 ng/mL K1-18 IgG + 0.1 µg/mL (K1-70 IgG + 9D33 IgG)a 1.7 ± 0.05 95 10 ng/mL K1-18 IgG + 0.01 µg/mL (K1-70 IgG + 9D33 IgG)a 29.4 ± 0.6 20 10 ng/mL K1-18 IgG + 0.001 µg/mL (K1-70 IgG + 9D33 IgG)a 35.2 ± 1.7 5 See legend to Table 6i for details. aThe total final concentration of IgG mixture is shown; ie in the case of 100 µg/mL (K1-70 IgG + 9D33 IgG) the mixture contains 50 µg/mL K1-70 IgG and 50 ng/mL 9D33 IgG. Consequently, the combined effect of two IgGs at 100 µg/mL can be compared to the effect of the single IgG at the same concentration (100 µg/mL). Table 6l Inhibition of M22 IgG stimulation of cyclic AMP production in TSHR transfected CHO cells bv K1-70 and 9D33 IgGs mixed together Test sample Cyclic AMP concentration (pmol/mL; mean ± SD) % Inhibition Cyclic AMP buffer 0.52 ± 0.3 3 ng/mL M22 IgG 21.33 ± 1.3 100 µg/mL 5B3 IgG 1.10 ± 0.3 100 µg/mL 9D33 IgG 1.31 ± 0.4 100 µg/mL K1-70 IgG 0.47 ± 0.1 100 µg/mL (K1-70 IgG + 9D33 IgG)a 0.45 ± 0.02 3 nq/mL M22 IgG + 100 µg/mL 5B3 IgG 28.13 ± 3.9 0 3 ng/mL M22 IgG + 10 µg/mL 5B3 IgG 21.55 ± 1.2 0 3 ng/mL M22 IgG + 100 µg/mL 9D33 IgG 1.01 ± 0.18 95 3 ng/mL M22 IgG + 10 µg/mL 9D33 IgG 1.20 ± 0.1 94 3 ng/mL M22 IqG + 1 µg/mL 9D33 IgG 1.48 ± 0.1 93 3 ng/mL M22 IgG + 0.1 µg/mL 9D33 IgG 7.19 ± 1.6 66 3 ng/mL M22 IgG +0.01 µg/mL 9D33 IgG 21.00 ± 1.25 2 3 ng/mL M22 IgG + 0.001 µg/mL 9D33 IqG 19.36 ± 7.3 9 3 ng/mL M22 IgG + 100 µg/mL K1-70 IgG 0.77 ± 0.3 96 3 ng/mL M22 IgG +10 µg/mL K1-70 IgG 0.72 ± 0.3 97 3 ng/mL M22 IgG + 1 µg/mL K1-70 IgG 0.82 ± 0.1 96 3 ng/mL M22 IgG + 0.1 µg/mL K1-70 IgG 4.82 ± 0.7 77 3 ng/mL M22 IgG + 0.01 µg/mL K1-70 IgG 18.67 ± 1.9 12 3 ng/mL M22 IgG + 0.001 µg/mL K1-70 IgG 19.82 ± 0.3 7 3 ng/mL M22 IgG + 100 µg/mL (K1-70 IqG + 9D33 IgG)a 0.77 ± 0.1 96 3 ng/mL M22 IgG + 10 µg/mL (K1-70 IgG + 9D33 IgG)a 0.56 ± 0.4 97 3 ng/mL M22 IgG + 1 µg/mL (K1-70 IgG + 9D33 IgG)a 0.90 ± 0.4 96 3 ng/mL M22 IgG + 0.1 µg/mL (K1-70 IgG + 9D33 IgG)a 3.34 ± 2.4 84 3 ng/mL M22 IgG + 0.01 µg/mL (K1-70 IgG + 9D33 IgG)a 18.20 ± 2.0 15 3 ng/mL M22 IgG + 0.001 µg/mL (K1-70 IqG + 9D33 IgG)a 21.09 ± 0.6 1 See legend to Table 6i for details. aThe total final concentration of IgG mixture is shown; ie in the case of 100 µg/mL (K1-70 IgG + 9D33 IgG) the mixture contains 50 µg/mL K1-70 IgG and 50 µg/mL 9D33 IgG. Consequently, the combined effect of two IgGs at 100 µg/mL can be compared to the effect of the single IgG at the same concentration (100 µg/mL). Table 6m Inhibition of pTSH stimulation of cyclic AMP production in TSHR transfected CHO cells by K1-70 and 9D33 IgGs mixed together Test sample Cyclic AMP concentration (pmol/mL; mean ± SD) % Inhibition Cyclic AMP buffer 6.04 ± 1.78 3 ng/mL pTSH 70.82 ± 1.75 100 µg/mL 5B3 IgG 3.29 ± 0.18 100 µg/mL 9D33 IgG 1.58 ± 0.25 100 µg/mL K1-70 IgG 1.27 ± 0.17 100 µg/mL (K1-70 IgG + 9D33 IgG)a 0.41 ± 0.68 3 ng/mL pTSH + 100 µg/mL 5B3 IgG 65.74* 7 3 ng/mL pTSH + 10 µg/mL 5B3 IgG 65.97 ± 7.7 7 3 ng/mL pTSH + 100 µg/mL 9D33 IgG 3.26 ± 0.17 95 3 ng/mL pTSH + 10 µg/mL 9D33 IgG 9.17 ± 1.46 87 3 ng/mL pTSH + 1 µg/mL 9D33 IgG 23.60 ± 1.33 67 3 ng/mL pTSH + 0.1 µg/mL 9D33 IgG 50.73 ± 5.03 28 3 ng/mL pTSH +0.01 µg/mL 9D33 IgG 67.60 ± 7.15 5 3 ng/mL pTSH + 0.001 µg/mL 9D33 IgG 61.65 ± 6.60 13 3 ng/mL pTSH + 100 µg/mL K1-70 IqG 1.46 ± 0.11 98 3 ng/mL pTSH +10 µg/mL K1-70 IgG 1.52 ± 0.25 98 3 ng/mL pTSH + 1 µg/mL K1-70 IgG 1.70 ± 0.19 98 3 ng/mL pTSH + 0.1 µg/mL K1-70 IgG 27.50 ± 3.26 61 3 ng/mL pTSH + 0.01 µg/mL K1-70 IgG 74.70 ± 9.2 0 3 ng/mL pTSH + 0.001 µg/mL K1-70 IgG 86.95 ± 4.38 0 3 ng/mL pTSH + 100 µg/mL (K1-70 IgG + 9D33 IgG)a 1.69 ± 0.12 98 3 ng/ml pTSH + 10 µg/mL (K1-70 IgG + 9D33 IgG)o 1.39 ± 0.08 98 3 ng/mL pTSH + 1 µg/mL (K1-70 IgG + 9D33 IgG)a 1.90 ± 0.13 97 3 nq/mL pTSH + 0.1 µg/mL (K1-70 IgG + 9D33 IgG)a 16.30 ± 1.16 77 3 ng/mL pTSH + 0.01 µg/mL (K1-70 IgG + 9D33 IgG)8 61.50 ± 5.06 13 3 ng/mL pTSH + 0.001 µg/mL (K1-70 IqG + 9D33 IqG)' 72.11 ± 5.5 0 See legend to Table 6i for details. aThe total final concentration of IgG mixture is shown; le in the case of 100 µg/ml (K1-70 IgG + 9D33 IgG) the mixture contains 50 pg/mL K1-70 IgG and 50 µg/mL 9D33 IgG. Consequently, the combined effect of two IgGs at 100 µg/ml can be compared to the effect of the single IgG at the same concentration (100 µg/mL). Table 6n Effect of K1 donor serum and serum TRAbs with blocking activity on stimulating activity of TSH, M22 IgG and K1-18 IgG Test sample Cyclic AMP concentration (pmol/mL mean ± SD) % Inhibition Cyclic AMP buffer 0.9 ± 0.2 3 ng/mL pTSH 73.7 ± 6.0 3 ng/mL M22 IgG 42.0 ± 9.5 10 ng/mL K1-18 IgG 44.1 ± 3.3 HBD control 0.5 ± 0.4 HBD + 3 ng/mL pTSH 99.4 ± 4.3 0 HBD + 3 nq/mL M22 IgG 34.7_ ± 3.9 0 HBD + 10 ng/mL K1-18 IgG 22.0 ± 3.1 0 B1 2.0 ± 0.1 B1 + 3 nq/mL pTSH 32.0 ± 5.2 67.8 B1 + 3 ng/mL M22 IqG 4.5 ± 1.3 87.0 B1 + 10 ng/mL K1-18 IgG 3.8 ± 1.2 82.7 B2 1.0 ± 0.7 B2 + 3 ng/mL pTSH 1.7 ± 0.2 98.3 B2 + 3 ng/mL M22 IgG 0.9 ± 0.1 97.4 B2 + 10 nq/mL K1-18 IgG 0.6 ± 0.3 97.3 B3 0.4 ± 0.1 B3 + 3 ng/mL pTSH 9.3 ± 2.2 90.6 B3 + 3 ng/mL M22 IgG 4.9 ± 0.7 85.9 B3 + 10 nq/mL K1-18 IqG 6.1 ± 0.6 72.3 Donor K1 3.8 ± 1.5 K1 + 3 ng/mL pTSH 36.0 ± 3.7 63.8 K1 + 3 ng/mL M22 IgG 6.9 ± 0.8 80.1 K1 + 10 ng/mL K1-18 IgG 4.5 ± 0.2 79.5 See legend to Table 6a for details. pTSH = porcine TSH. B1-B3 are sera from patients with blocking type TRAb. HBD = healthy blood donor serum. Test samples were diluted in hypotonic cyclic AMP buffer. Table 7a Inhibition of porcine (p) TSH stimulation of cyclic AMP production in TSHR transfected CHO cells by K1-70 and 5C9 IgGs Test sample Cyclic AMP concentration (pmol/mL mean ± SD) % Inhibition Cyclic AMP buffer only 1.6 ± 0.3 3 ng/mL pTSH 62.6 ± 3.9 0 5B3 IgG 100 µg/mL + 3 ng/mL pTSH 66.7 ± 3.7 0 10 µg/mL + 3 ng/mL pTSH 67.8 ± 3.7 0 K1-70 IgG 3 µg/mL + 3 ng/mL pTSH 1.7 ± 0.6 97.3 1 ng/mL + 3 ng/mL pTSH 2.0 ± 0.2 96.8 0.3 µg/mL + 3 ng/mL pTSH 2.5 ± 0.9 96.0 0.1 µg/mL + 3 ng/mL pTSH 5.8 ± 2.8 90.7 0.075 µg/mL + 3 ng/mL pTSH 11.6 ± 2.0 81.5 0.05 µg/mL + 3 ng/mL pTSH 31.4 ± 1.9 49.8 0.025 µg/mL + 3 ng/mL pTSH 50.5 ± 7.3 19.3 0.01 µg/mL + 3 ng/mL pTSH 60.1 ± 1.6 4.0 0.003 µg/mL + 3 nq/mL pTSH 59.5 ± 5.1 5.0 3 µg/mL + no pTSH 0.8 ± 0.1 5C9 IgG 3 µg/mL + 3 ng/mL pTSH 4.5 ± 1.5 92.8 1 µg/mL + 3 ng/mL pTSH 4.8 ± 0.7 92.3 0.3 µg/mL + 3 ng/mL pTSH 7.8 ±2.1 87.5 0.1 µg/mL + 3 ng/mL pTSH 11.4 ± 1.1 81.8 0.0075 + 3 14.7 ± 0.6 76.5 0.05 µg/mL + 3 ng/mL pTSH 23.3 ± 2.9 62.8 0.025 µg/mL + 3 ng/mL pTSH 46.3 ± 4.6 26.0 0.01 µg/mL + 3 nq/mL pTSH 61.8 ± 4.8 1.0 0.003 µg/mL + 3 nq/mL pTSH 56.1 ± 7.5 10.4 3 µg/mL + no pTSH 0.9 ± 0.1 Results shown are mean ± SD of triplicate determinations. 5B3 is a human MAb to glutamic acid decarboxylase (negative control). Test samples were diluted in hypotonic cyclic AMP buffer. Table 7b Inhibition of porcine (p) TSH stimulation of cyclic AMP production in TSHR transfected CHO cells by K1-70 IqG and Fab preparations Test sample Cyclic AMP concentration in hypotonic medium (pmol/mL mean ± SD) Cyclic AMP concentration in isotonic medium (pmol/mL mean ± SD) Cyclic AMP buffer only 2.4 ± 0.4 0.7 ± 0.1 3 µg/mL 5B3 IgG 1.9 ± 0.3 0.5 ± 0.1 3 µg/mL K1-70 IqG 2.3 ± 0.9 0.5 ± 0.1 3 µg/ml K1-70 Fab 2.3 ± 0.8 0.8 ± 0.2 3 ng/mL pTSH 65.2 ± 11.2 42.4 ± 1.1 5B3 IgG 3µg/mL + 3 ng/mL pTSH 75.7 ± 11.4 42.5 ± 2.8 1µg/mL + 3 ng/mL pTSH 71.9 ± 14.3 39.5 ± 1.9 K1.70 IgG 3µg/mL + 3 ng/mL pTSH 3.0 ± 1.2 1.1 ± 0.2 1 µg/mL + 3 ng/mL pTSH 4.0 ± 0.7 2.2 ± 0.2 0.3 µg/mL + 3 ng/mL pTSH 4.5 ± 0.6 8.2 ± 0.4 0.1 µg/mL + 3 ng/mL pTSH 6.4 ± 0.9 27.0 ± 3.5 0.075 µg/mL + 3 ng/mL pTSH 16.3 ± 1.3 33.3 ± 0.7 0.05 µg/mL + 3 ng/mL pTSH 24.5 ± 5.2 36.5 ± 2.2 0.025 µg/mL + 3 ng/mL pTSH 71.0 ± 4.5 38.1 ± 3.8 0.01 µg/mL + 3 nq/mL pTSH 64.0 ± 9.9 45.0 ± 3.0 0.003 µg/mL + 3 ng/mL pTSH 72.5 ± 16.2 40.8 ± 3.5 K1-70 Fab 3 µg/mL + 3 ng/mL pTSH 3.7 ± 0.3 1.8 ± 0.5 1 µg/mL + 3 ng/mL pTSH 3.8 ± 0.2 2.1 ± 0.8 0.3 µg/mL + 3 ng/ml pTSH 5.2 ± 1.0 5.6 ± 1.3 0.1 µg/mL + 3 ng/mL pTSH 12.9 ± 1.4 18.5 ± 2.1 0.075 µg/mL + 3 ng/mL pTSH 14.1 ± 1.0 22.4 ± 0.4 0.05 µg/mL + 3 ng/mL pTSH 28.9 ± 1.5 28.9 ± 1.1 0.025 µg/mL + 3 ng/mL pTSH 59.9 ± 5.8 42.4 ± 1.1 0.01 µg/mL + 3 ng/mL pTSH 58.8 ± 1.5 43.2 ± 4.0 0.003 µg/mL + 3 ng/mL pTSH 56.3 ± 6.0 41.2 ± 1.0 See legend to Table 7a for details. Test samples were diluted in cyclic AMP buffer. Table 7c The effect of human and mouse TSHR blocking MAbs (K1-70, 5C9 and 9D33) on the constitutive activity (ie basal activity) of the TSHR Test sample Cyclic AMP concentration (pmol/mL mean ± SD) % Inhibition Cyclic AMP buffer only 18.7 ± 2.3 0 K1-70 IgG 100 µg/mL 17.6 ± 1.6 6 10 µg/mL 17.3 ± 0.3 7 3 µg/ml 18.1 ± 0.7 3 1 µg/mL 16.8 ± 0.5 10 0.3 µg/ml 18.9 ± 1.2 0 0.1 µg/mL 19.6 ± 0.8 0 0.01 µg/mL 19.1 ± 2.6 0 0.001 µg/mL 20.3 ± 3.1 0 5C9 IgG 100 µg/mL 9.0 ± 1.0 52 10 µg/mL 8.3 ± 0.9 56 3 µg/ml 6.9 ± 0.8 63 1 µg/ml 7.4 ± 1.3 61 0.3 µg/mL 9.3 ± 1.2 50 0.1 µg/mL 16.3 ± 0.9 13 0.01 µg/mL 18.6 ± 1.7 1 0.001 µg/mL 19.1 ± 0.8 0 9D33 IgG 100 µg/mL 38.0 ± 1.9 0 10 µg/mL 34.3 ± 1.4 0 3 µg/mL 32.3 ± 2.3 0 1 µg/mL 35.5 ± 4.3 0 0.3 µg/mL 26.4 ± 1.2 0 0.1 µg/mL 23.9 ± 2.7 0 0.01 µg/mL 20.3 ± 1.2 0 0.001 µg/mL 18.8 ± 2.1 0 See legend to Table 7a for details. The experiments were carried out using CHO cell line expressing wil type TSHR at approximately 5 x 10⁵ receptors per cell. Table 7d Effect of K1 donor serum on TSH mediated stimulation of cyclic AMP in CHO cells expressing TSHR Test sample Cyclic AMP concentration (pmol/mL mean ± SD) % Inhibition Cyclic AMP buffer 1.7 ± 1.0 1ng/mL pTSH 61.7 ± 4.3 3 µg/mL K1-70 IgG 1.7 ± 0.1 1 ng/mL + 3 K1-70 IgG 3.6 ± 0.6 94.2 1 ng/mL pTSH + 1 µg/mL K1-70 IgG 3.9 ± 0.1 93.7 1 ng/mL pTSH + 0.3 µg/mL K1-70 IgG 3.3 ± 0.4 94.7 1 ng/mL pTSH + 0.1 µg/mL K1-70 IgG 20.0 ± 1.2 67.6 1 ng/mL pTSH + 0.03 µg/mL K1-70 IgG 52.2 ± 11.2 18.2 1 ng/mL pTSH + 0.01 µg/mL K1-70 IgG 67.7 ± 3.7 0 1 ng/mL pTSH + 0.003 µg/mL K1-70 IgG 72.4 ± 5.5 0 1 nq/mL pTSH + 0.001 µg/mL K1-70 IgG 58.7 ± 2.2 4.9 1 ng/mL pTSH + 0.0003 µg/mL K1-70 IgG 66.2 ± 1.7 0 100 µg/ml 5B3 IgG 2.6 ± 0.2 1 ng/mL pTSH + 100 µg/mL 5B3 IgG 79.3 ± 8.9 0 1 ng/mL pTSH + 10 µg/mL 5B3 IgG 80.7 ± 1.1 0 1 ng/mL pTSH + K1 donor serum 10x diluted 14.9 ± 1.2 75.9 1 ng/mL pTSH+ K1 donor serum 20x diluted 51.6 ± 2.6 16.4 1 ng/mL pTSH+ K1 donor serum 40x diluted 1 ng/mL pTSH+ K1 donor serum 80x diluted 1 ng/mL pTSH+ K1 donor serum 160x diluted 63.0 ± 3.4 0 64.4 ± 3.5 0 63.9 ± 3.6 0 K1 donor serum 10x diluted 4.7 ± 0.3 1 ng/mL pTSH + HBD 10x diluted 1 ng/mL pTSH + HBD 20x diluted 101.3 ± 5.1 0 88.6 ± 6.4 0 HBD 10x diluted 2.2 ± 1.0 See legend to Table 7a for details. HBD = pool of healthy blood donor sera. pTSH = porcine TSH. Table 7e Effect of K1-70 IgG on stimulation of cyclic AMP production by porcine (p), human (h) and recombinant human (rh) TSH in CHO cells expressing the TSHR Test sample Cyclic AMP concentration in hypotonic medium (pmol/mL mean ± SD) Cyclic AMP concentration in isotonic medium (pmol/mL mean ± SD) Cyclic AMP buffer 2.5 ± 0.5 1.1 ± 0.4 100 µg/mL 5B3 IgG 2.2 ± 0.6 1.4 ± 0.5 100 µg/mL K1-70 IgG 2.5 ± 0.5 1.1 ± 0.2 3 ng/mL 48.1 ± 0.9 41.1 ± 2.2 pTSH 3 ng/mL + 100 µg/mL K1-70 IgG 0.1 ± 0.0 1.3 ± 0.3 pTSH 3 ng/mL + 10 µg/mL K1-70 IgG 0.2 ± 0.1 1.2 ± 0.3 pTSH 3 ng/mL + 1 µg/mL K1-70 IgG 0.1* 2.0 ± 0.4 pTSH 3 ng/mL + 0.1 µg/mL K1-70 IGG 3.3 ± 2.8 24.4 ± 1.2 pTSH 3 ng/mL + 0.01 µg/mL K1-70 IgG 53.8 ± 3.4 39.7 ± 3.0 pTSH 3 ng/mL + 0.001 µg/mL K1-70 IgG 44.9 ± 1.8 36.6 ± 5.8 100 hTSH 56.8 ± 0.1 42.3 ± 4.5 100 ng/mL hTSH + 100 µg/mL K1-70 IgG 0.1* 1.3 ± 0.3 100 ng/mL hTSH + 10 µg/mL K1-70 IgG 0.1 ± 0.0 1.0 ± 0.3 100 ng/mL hTSH +1 µg/mL K1-70 IgG 0.2 ± 0.1 1.9 ± 0.2 100 ng/mL hTSH + 0.1 µg/ml K1-70 IgG 0.1 ± 0.0 29.8 ± 1.5 100 ng/mL hTSH + 0.01 µg/mL K1-70 IqG 55.2* 37.9 ± 2.7 100 ng/mL hTSH + 0.001 µg/mL K1-70 IgG 55.0 ± 3.0 38.8 ± 2.8 100 ng/mL rhTSH 37.8 ± 4.9 29.9 ± 2.3 100 ng/mL rhTSH + 100 µg/mL K1-70 IgG 0.3 ± 0.1 0.9 ± 0.1 100 ng/mL rhTSH + 10 µg/mL K1-70 IgG 0.2 ± 0.1 0.7 ± 0.2 100 ng/mL rhTSH + 1 µg/mL K1-70 IgG 0.3* 1.3 ± 0.6 100 ng/mL rhTSH + 0.1 µg/mL K1-70 IgG 0.3 ± 0.1 10.2 ± 0.9 100 ng/mL rhTSH + 0.01 µg/mL K1-70 IgG 27.3 ± 5.5 21.4 ± 1.0 100 ng/mL rhTSH + 0.001 µg/mL K1-70 IgG 30.8 ± 1.4 23.0 ± 3.8 100 ng/mL rhTSH + 100 µg/mL K1-70 IgG 36.7 ± 3.4 28.1 ± 1.5 See legend to Table 7a for details. *mean of duplicate determinations. Test samples were diluted in cyclic AMP buffer. Table 7f Effect of K1-70 IgG on M22 IgG mediated stimulation of cyclic AMP production in CHO cells expressing the TSHR Test sample Cyclic AMP concentration (pmol/mL mean ± SD) % Inhibition Cyclic AMP buffer 1.4 ± 0.4 K1-70 IgG 100 µg/mL 1.1 ± 0.5 5B3 IgG 100 µg/mL 1.2 ± 0.5 5C9 IgG 100 µg/mL 0.5 ± 0.2 3 ng/mL M22 IgG 33.1 ± 1.8 0 3 ng/mL M22 IgG + 100 µg/ml 5B3 IgG 41.8 ± 5.3 0 3 ng/mL M22 IgG + 100 µg/ml K1-70 IgG 0.6 ± 0.3 98.2 3 ng/mL M22 IgG + 50 µg/ml K1-70 IgG 0.8 ± 0.4 97.6 3 ng/mL M22 IgG + 10 µg/ml K1-70 IgG 0.6 ± 0.4 98.2 3 ng/mL M22 IgG + 5 µg/ml K1-70 IgG 0.1 ± 0.2 99.7 3 ng/mL M22 IgG + 1 µg/ml K1-70 IgG 0.6 ± 0.2 98.2 3 ng/mL M22 IgG + 0.5 g/ml K1-70 IgG 0.5 ± 0.3 98.5 3 ng/mL M22 IgG + 0.1 µg/ml K1-70 IgG 4.3 ± 2.4 87.0 3 ng/mL M22 IgG + 0.01 µg/ml K1-70 IgG 33.0 ± 3.2 0 3 ng/mL M22 IgG + 0.001 µg/ml K1-70 IgG 35.9 ± 3.2 0 3 ng/mL M22 IgG + 100 µg/ml 5C9 IgG 0.4 ± 0.4 98.8 3 ng/mL M22 IgG + 50 µg/ml 5C9 IgG 0.3 ± 0.1 99.1 3 ng/mL M22 IgG + 10 µg/ml 5C9 IgG 0.3 ± 0.1 99.1 3 ng/mL M22 IgG + 5 µg/ml 5C9 IgG 0.2 ± 0.2 99.4 3 ng/mL M22 IgG + 1 µg/ml 5C9 IgG 0.8 ± 0.4 97.6 3 ng/mL M22 IgG + 0.5 µg/ml 5C9 IG 1.0 ± 0.1 97.0 3 ng/mL M22 IgG + 0.1 µg/ml 5C9 IgG 2.9 ± 0.6 91.2 3 ng/mL M22 IgG + 0.01 µg/ml 5C9 IgG 42.3 ± 7.1 0 3 ng/mL M22 IgG + 0.001 µg/ml 5C9 IgG 39.3 ± 3.6 0 See legend to Table 7a for details. HBD = pool of healthy blood donor sera. Table 7g Effect of K1-70 IgG on TSHR stimulating activity of TRAb positive patient sera (T1-T3) Test sample Cyclic AMP concentration (pmol/mL mean ± SD) % Inhibition Cyclic AMP buffer 2.0 ± 0.6 HBD 1.7 ± 0.2 HBD + 100 µg/mL 5B3 IgG 2.0 ± 0.1 HBD + 100 µg/mL K1-70 IgG 1.2 ± 0.1 HBD + 100 µg/mL 5C9 IgG 0.9 ± 0.3 HBD + 100 µg/mL 9D33 IgG 1.9 ± 0.1 T1 serum 99.8 ± 6.1 0 T1 serum + 100 µg/mL 5B3 IgG 94.9 ± 14.2 4.9 T1 serum + 100 µg/mL K1-70 IgG 1.4 ± 0.3 98.6 T1 serum + 100 µg/mL 5C9 IgG 1.3 ± 0.2 98.7 T1 serum + 100 µg/mL 9D33 IgG 4.6 ± 0.7 95.4 T2 serum 61.8 ± 6.3 0 T2 serum + 100 µg/ml 5B3 IgG 62.0 ± 14.6 0 T2 serum + 100 µg/mL K1-70 IgG 1.5 ± 0.1 97.6 T2 serum + 100 µg/mL 5C9 IgG 1.1 ± 0.3 98.2 T2 serum + 100 µg/mL 9D33 IqG 2.0 ± 0.2 96.8 T3 serum 63.3 ± 9.7 0 T3 serum + 100 µg/mL 5B3 IgG 54.2 ± 3.8 14.4 T3 serum + 100 µg/mL K1-70 IgG 1.2 ± 0.3 98.1 T3 serum + 100 µg/mL 5C9 IgG 1.4 ± 0.2 97.8 T3 serum + 100 µg/mL 9D33 IgG 3.7 ± 1.0 94.2 100 µg/mL 5B3 IgG 1.0 ± 0.4 100 µg/mL K1-70 IgG 0.8 ± 0.1 100 µg/mL 5C9 IgG 1.0 ± 0.5 100 µg/mL 9D33 IqG 2.1 ± 0.5 See legend to Table 7a for details. HBD = pool of healthy blood donor sera. Sera were diluted to a final concentration of 1:10 in hypotonic cyclic AMP assay buffer. Table 7h Effect of K1-70 IgG on TSHR stimulating activity of TRAb positive patient sera (T4-T6) Test sample Cyclic AMP concentration (pmol/mL mean ± SD) % Inhibition Cyclic AMP buffer 1.9 ± 0.4 HBD 2.4 ± 0.1 HBD + 100 µg/mL 5B3 IgG 3.0 ± 0.1 HBD + 100 µg/mL K1-70 IgG 2.1 ± 0.2 HBD + 100 µg/mL 5C9 IqG 1.8 ± 0.9 HBD + 100 µg/mL 9D33 3.9 ± 0.5 T4 serum 78.9 ± 8.2 0 T4 serum + 100 µg/mL 5B3 IgG 55.0 ± 14.0 30.3 T4 serum + 100 µg/mL K1-70 IgG 3.0 ± 0.4 96.2 T4 serum + 100 µg/mL 5C9 IgG 1.9 ± 0.3 97.6 T4 serum + 100 µg/mL 9D33 4.1 ± 1.1 94.8 T5 serum 66.6* 0 T5 serum + 100 µg/mL 5B3 IgG 66.7 ± 5.3 0 T5 serum + µg/mL K1-70 IgG 100 1.6 ± 0.4 97.6 T5 serum + 100 µg/mL 5C9 IgG 1.1 ± 0.2 98.3 T5 serum + 100 µg/mL 9D33 2.9 ± 0.2 95.6 T6 serum 83.0 ± 6.9 0 T6 serum + 100 µg/mL 5B3 IgG 81.5 ± 20.5 1.8 T6 serum + µg/mL K1-70 IgG 100 2.5 ± 0.1 97.0 T6 serum + 100 µg/mL 5C9 IqG 1.8 ± 0.4 97.8 T6 serum + 100 µg/mL 9D33 5.0 ± 1.0 94.0 100 µg/mL 5B3 IgG 2.6 ± 0.7 100 µg/mL K1-70 IgG 1.4 ± 0.5 100 µg/mL 5C9 IgG 1.2 ± 0.3 100 µg/mL 9D33 2.0 ± 0.6 See legend to Table 7g for details. *mean of duplicate determinations. HBD = pool of healthy blood donor sera. Table 7i Effect of K1-70 IgG on TSHR stimulating activity of TRAb positive patient sera (T7-T9) Test sample Cyclic AMP concentration (pmol/mL mean ± SD) % Inhibition Cyclic AMP buffer 2.9 ± 1.1 HBD 3.1 ± 0.4 HBD + 100 µg/mL 5B3 IgG 4.0 ± 0.4 HBD + 100 µg/mL K1-70 IgG 2.7 ± 0.1 HBD + 100 µg/mL 5C9 IgG 2.7 ± 1.4 HBD + 100 µg/mL 9D33 IgG 5.4 ± 0.3 T7 serum 90.6* T7 serum + 100 µg/mL 5B3 IgG 91.9 ± 29.6 0 T7 serum + 100 µg/mL K1-70 IgG 3.2 ± 0.4 96.5 T7 serum + 100 µg/mL 5C9 IgG 2.1 ± 0.5 97.7 T7 serum + 100 µg/ml 9D33 IgG 6.3 ± 1.2 93.0 T8 serum 85.6* 0 T8 serum + 100 µg/mL 5B3 IgG 76.3 ± 10.7 10.9 T8 serum + 100 µg/mL K1-70 IqG 3.2 ± 0.5 96.3 T8 serum + 100 µg/mL 5C9 IgG 1.8 ± 0.3 97.9 T8 serum + 100 µg/mL 9D33 IgG 4.3 ± 0.6 95.0 T9 serum 56.4 ± 0.0 0 T9 serum + 100 µg/mL 5B3 IgG 53.2* 0 T9 serum + 100 µg/mL K1-70 IgG 5.2 ± 0.5 90.8 T9 serum + 100 5C9 3.0 ± 0.4 94.7 T9 serum + 100 µg/mL 9D33 IgG 7.2 ± 1.1 87.2 100 µg/ml 5B3 IgG 2.7 ± 0.3 100 µg/mL K1-70 IgG 1.6 ± 0.4 100 µg/mL 5C9 IqG 1.0 ± 0.5 100 µg/mL 9D33 IgG 2.4 ± 0.4 See legend to Table 7g for details. *mean of duplicate determinations. HBD = pool of healthy blood donor sera. Table 7j Effect of K1-70 IgG on TSHR stimulating activity of TRAb positive patient sera (T10-T12) Test sample Cyclic AMP concentration (pmol/mL mean ± SD) % Inhibition Cyclic AMP buffer 1.8 ± 0.2 HBD 2.2 ± 0.2 HBD + 100 µg/mL 5B3 IgG 2.4 ± 0.4 HBD + 100 µg/mL K1-70 IgG 1.7 ± 0.0 HBD + 100 µg/ml 5C9 IgG 1.1 ± 0.3 HBD + 100 µg/mL 9D33 IgG 3.2 ± 0.6 T10 serum 56.3 ± 5.2 0 T10 serum + 100 µg/mL 5B3 IgG 59.3 ± 7.1 0 T10 serum + 100 µg/mL K1-70 IgG 1.8 ± 0.2 96.8 T10 serum + 100 µg/mL 5C9 IqG 0.9 ± 0.1 98.4 T10 serum + 100 µg/mL 9D33 IqG 2.6 ± 0.3 95.4 T11 serum 41.0 ± 4.5 0 T11 serum + 100 µg/mL 5B3 IgG 39.7 ± 1.8 3.2 T11 serum + 100 µg/mL K1-70 IqG 2.0 ± 0.2 95.1 T11 serum + 100 µg/mL 5C9 IqG 37.5 ± 3.9 8.5 T11 serum + 100 µg/mL 9D33 IgG 5.3 ± 1.6 87.1 T12 serum 43.2 ± 3.1 0 T12 serum + 100 µg/mL 5B3 IgG 43.3 ± 4.0 0 T12 serum + 100 µg/mL K1-70 IgG 1.8 ± 0.0 95.8 T12 serum + 100 µg/mL 5C9 IgG 1.6 ± 0.7 96.3 T12 serum + 100 µg/mL 9D33 IgG 3.6 ± 0.1 91.7 100 µg/mL 5B3 IgG 2.0 ± 0.4 100 µg/mL K1-70 IgG 1.1 ± 0.1 100 µg/mL 5C9 IgG 0.9 ± 0.1 100 µg/mL 9D33 IgG 1.9 ± 0.4 See legend to Table 7g for details. HBD = pool of healthy blood donor sera. Table 7k Effect of K1-70 IgG on TSHR stimulating activity of TRAb positive patient sera (T13-T15) Test sample Cyclic AMP concentration (pmol/mL mean ± SD) % Inhibition Cyclic AMP buffer 1.6 ± 0.2 HBD 2.2 ± 0.4 HBD + 100 µg/mL 5B3 IgG 5.1 ± 1.2 HBD + 100 µg/mL K1-70 IgG 2.1 ± 0.8 HBD + 100 µg/mL 5C9 IgG 1.0 ± 0.2 HBD + 100 µg/mL 9D33 IgG 3.3 ± 0.3 T13 serum 48.5 ± 3.8 0 T13 serum + 100 µg/mL 5B3 IgG 37.6 ± 3.4 22.5 T13 serum + 100 µg/mL K1-70 IgG 2.1 ± 0.3 95.7 T13 serum + 100µg/mL 5C9 IgG 1.2 ± 0.3 97.5 T13 serum + 100 µg/mL 9D33 IgG 3.8 ± 0.3 92.2 T14 serum 27.2 ± 3.6 0 T14 serum + 100 µg/mL 5B3 IgG 20.5 ± 2.3 24.6 T14 serum + 100 µgmL K1-70 IgG 1.9 ± 0.4 93.0 T14 serum + 100µg/mL 5C9 IgG 1.4 ± 0.5 94.9 T14 serum + 100 µg/mL 9D33 IgG 2.8 ± 0.3 89.7 T15 serum 51.3* 0 T15 serum + 100 µg/mL 5B3 IgG 41.9 ± 4.0 18.3 T15 serum + 100 µg/mL K1-70 IgG 2.7 ± 0.1 94.7 T15 serum + 100 µg/mL 5C9 IgG 1.6 ± 0.3 96.9 T15 serum + 100 µg/mL 9D33 IgG 3.9 ± 0.2 92.4 100 µg/mL 5B3 IgG 4.1 ± 0.9 100 µg/mL K1-70 IqG 2.6 ± 1.5 100 µg/mL 5C9 IqG 0.9 ± 0.2 100 µg/mL 9D33 IgG 2.3 ± 0.2 See legend to Table 7g for details. *mean of duplicate determinations. HBD = pool of healthy blood donor sera. Table 7l Effect on T5 serum stimulating activity of different concentrations of TSHR blocking monoclonal antibodies (K1-70, 5C9, 9D33) Test sample Cyclic AMP concentration (pmol/mL mean ± SD) % Inhibition Cyclic AMP buffer 1.4 ± 0.5 HBD diluted 10x 2.8 ± 0.7 Serum T5 diluted 10x 63.9 ± 5.9 5B3 IgG (negative control) 100 µg/mL 1.1 ± 0.5 100 µg/mL + T5 55.9 ± 5.5 12.5 10 µg/mL + T5 61.9 ± 2.6 3.1 1 µg/mL + T5 61.3 ± 5.5 4.1 0.1 µg/mL + T5 59.4* 7.0 K1-70 IgG 100 µg/mL 1.0 ± 0.3 100 µg/mL + T5 1.4 ± 0.6 97.8 10 µg/mL + T5 0.9 ± 0.1 98.6 1 µg/mL + T5 1.4 ± 0.1 97.8 0.1 µg/mL + T5 8.3 ± 1.1 87.0 0.01 µg/mL + T5 52.4 ± 4.8 18.0 5C9 IgG 100 µg/mL 1.1 ± 0.3 100 µg/mL + T5 0.7 ± 0.1 98.9 10 µg/mL + T5 0.7 ± 0.0 98.9 1 µg/mL + T5 1.4 ± 0.5 97.8 0.1 µg/mL + T5 5.6 ± 0.3 91.2 0.01 µg/mL + T5 52.9 ± 2.0 17.2 9D33 IgG 100 µg/mL 2.4 ± 0.2 100 µg/mL + T5 3.0 ± 0.2 95.3 10 µg/mL + T5 2.3 ± 0.2 96.4 1 µg/mL + T5 4.1 ± 0.3 93.6 0.1 µg/mL + T5 28.3 ± 0.8 55.7 0.01 µg/mL + T5 49.2 ± 3.5 23.0 See legend to Table 7a for details. T5 = TRAb positive serum with thyroid stimulating activity; T5 serum was diluted to a final concentration of 1:10 in hypotonic cyclic AMP buffer. HBD = pool of healthy blood donor sera. Table 7m Effect on T8 serum stimulating activity of different concentrations of TSHR blocking monoclonal antibodies (K1-70, 5C9, 9D33) Test sample Cyclic AMP concentration (pmol/mL mean ± SD) % Inhibition Cyclic AMP buffer 1.7 ± 0.2 HBD diluted 10x 2.5 ± 1.0 Serum T8 diluted 10x 52.3 ± 10.5 5B3 IgG 100 µg/mL 2.1 ± 0.5 100 µg/mL + T8 50.5 ± 3.1 3 10 µg/mL + T8 56.0 ± 14.7 0 1 µg/mL + T8 51.4 ± 2.7 2 0.1 µg/mL + T8 50.7 ± 10.2 3 K1-70 IgG 100 µg/mL 1.8 ± 0.2 100 µg/mL + T8 2.4 ± 0.3 95 10 µg/mL + T8 2.1 ± 0.7 96 1 µg/mL + T8 2.5 ± 0.2 95 0.1 µg/mL + T8 5.8 ± 0.3 89 0.01 µg/mL + T8 63.4 ± 8.0 0 5C9 IgG 100 µg/mL 1.2 ± 0.2 100 µg/mL + T8 1.7 ± 0.8 97 10 µg/mL + T8 1.7 ± 0.2 97 1 µg/mL + T8 2.2 ± 0.3 96 0.1 µg/mL + T8 4.6 ± 0.5 91 0.01 µg/mL + T8 53.7 ± 7.1 0 9D33 IgG 100 µg/mL 2.4 ± 0.5 100 µg/mL + T8 3.6 ± 0.8 93 10 µg/mL + T8 3.7 ± 0.5 93 1 µg/mL + T8 4.7 ± 0.2 91 0.1 µg/mL + T8 22.9 ± 0.4 56 0.01 µg/mL + T8 45.8 ± 4.9 12 See legend to Table 7a for details. T8 = TRAb positive serum with TSH receptor stimulating activity; T8 serum was diluted to a final oncentration of 1:10 in hypotonic cyclic AMP bufferHBD = pool of healthy blood donor sera. Table 7n Effect on T11 serumstimulating activity of different concentrations of TSHR blocking monoclonal antibodies (K1-70, 5C9, 9D33) Test sample Cyclic AMP concentration (pmol/mL mean ± SD) % Inhibition Cyclic AMP buffer 1.2 ±0.4 HBD diluted 10x 1.8 ± 0.4 Serum T11 diluted 10x 25.2 ± 4.4 5B3 IgG 100 µg/mL 1.0 ± 0.2 100 µg/mL + T11 18.4 ± 1.3 27.0 10 µg/mL + T11 18.8 ± 1.3 25.4 1 µg/mL + T11 19.8 ± 1.2 21.4 0.1 µg/mL + T11 17.7 ± 2.1 29.8 K1-70 IgG 100 µg/mL 0.9 ± 0.2 100 µg/mL + T11 1.0 ± 0.3 96.0 10 µg/mL + T11 1.1 ± 0.1 95.6 1 µg/mL + T11 1.1 ± 0.1 95.6 0.1 µg/mL + T11 2.4 ± 0.3 90.5 0.01 µg/mL + T11 22.1 ± 0.8 12.3 5C9 IgG 100 µg/mL 0.9 ± 0.1 100 µg/mL + T11 22.4 ± 1.9 11.1 10 µg/mL + T11 21.7 ± 0.5 13.9 1 µg/mL + T11 19.4 ± 2.2 23.0 0.1 µg/mL + T11 20.2 ± 0.4 19.8 0.01 µg/ml + T11 24.1 ± 0.5 4.3 9D33 IgG 100 µg/mL 1.3 ± 0.2 100 µg/mL + T11 2.1 ± 0.1 94.8 10 µg/mL + T11 2.5 ± 0.1 90.1 1 µg/mL + T11 3.1 ± 0.3 87.7 0.1 µg/mL + T11 12.5 ± 0.3 50.4 0.01 µg/mL + T11 20.9 ± 0.3 17.1 See legend to Table 7a for details. T11 = TRAb positive serum with TSH receptor stimulating activity; T11 serum was diluted to a final concentration of 1:10 in hypotonic cyclic AMP buffer. HBD = pool of healthy blood donor sera. Table 7o Inhibition of porcine (p) TSH stimulation of cyclic AMP production in TSHR transfected CHO cells by K1-70 and 5C9 mixed together Test Sample Cyclic AMP concentration (pmol/mL mean ± SD) % Inhibition Cyclic AMP buffer 0.6 ± 0.1 pTSH 3ng/mL 64.2 ± 3.5 100 µg/mL 5B3 0.9 ± 0.2 100 µg/mL 5C9 0.2 ± 0.0 100 µg/mL K1-70 0.6 ± 0.2 100 µg/mL (K1-70 + 5C9)a 0.7 ± 0.5 pTSH 3ng/mL + 100 µg/mL 5B3 63.9 ± 5.1 0.5 pTSH 3ng/mL + 10 µg/mL 5B3 66.9 ± 6.5 0 pTSH 3ng/mL + 100 µg/mL 5C9 0.5 ± 0.0 99.2 pTSH 3ng/mL + 10 µg/mL 5C9 1.3 ± 0.4 98.0 pTSH 3ng/mL + 1 µg/mL 5C9 4.2 ± 0.6 93.5 pTSH 3ng/mL + 0.1 µg/mL 5C9 13.7 ± 4.9 78.7 pTSH 3ng/mL + 0.01 µg/mL 5C9 64.6 ± 1.4 0 pTSH 3ng/mL + 0.001 µg/mL 5C9 64.1 ± 7.3 0.2 pTSH 3ng/mL + 100 µg/mL K1-70 0.7 ± 0.1 98.9 pTSH 3ng/mL +10 µg/mL K1-70 1.0 ± 0.6 98.4 pTSH 3ng/mL + 1 µg/mL K1-70 0.7 ± 0.4 98.9 pTSH 3ng/mL + 0.1 µg/mL K1-70 5.9 ± 2.8 90.8 pTSH 3ng/mL + 0.01 µg/ml K1-70 52.0 ± 3.0 19.0 pTSH 3ng/mL + 0.001 µg/ml K1-70 59.4 ± 3.7 7.5 pTSH 3ng/mL + 100 µg/mL (K1-70 + 5C9)a 1.1 ±0.4 98.3 pTSH 3ng/mL +10 µg/mL (K1-70 + 5C9)a 0.5 ± 0.1 99.2 pTSH 3ng/mL + 1 µg/mL (K1-70 + 5C9)a 2.5 ± 0.3 96.1 pTSH 3ng/mL + 0.1 µg/mL (K1-70 + 5C9)a 9.4 ± 4.0 85.4 pTSH 3ng/mL + 0.01 µg/mL (K1-70 + 5C9)a 49.4 ± 2.9 23.0 pTSH 3ng/mL + 0.001 µg/mL (K1-70 + 5C9)a 48.3 ± 4.8 24.8 See legend to Table 7a for details. K1-70, 5C9 and 5B3: purified IgG of the MAbs were used in all experiments. aIn some experiments the MAbs were mixed in equal proportions and the concentration shown for a mixture represents the total amount of IgG added i.e.: 100 µg/mL (K1-70 + 5C9) = 50 µg/mL of K1-70 + 50 µg/mL of 5C9 used in the experiment. Table 7p The effect of K1-70 and 5C9 IgGs mixed together on the constitutive activity (ie basal activity) of the TSHR Test Sample Cyclic AMP production (pmol/mL mean ± SD) % Inhibition cyclic AMP buffer only 58.04 ±8.52 0.1 µg/mL 5C9 IgG 68.21 ±2.81 0 0.2 µg/mL 5C9 IgG 58.75 ±3.92 0 1 µg/mL 5C9 IgG 31.40 ±0.89 45.9 2 µg/mL 5C9 IgG 31.75 ±2.73 45.3 0.01 µg/mL K1-70 IgG 92.24 ±3.92 0 0.1 µg/mL K1-70 IgG 62.77 ±2.18 0 0.2 µg/mL K1-70 IgG 58.75 ±3.92 0 1 µg/mL K1-70 IgG 61.52 ±5.04 0 2 µg/mL K1-70 IgG 52.12 ±1.84 10.2 0.01 µg/mL 5B3 IgG 58.16 ±9.42 0 0.1 µg/mL 5B3 IgG 58.75 ±3.92 0 0.2 µg/mL 5B3 IgG 53.30 ±3.36 8.2 1 µg/mL 5B3 IgG 54.39 ±2.62 6.3 2 µg/mL 5B3 IgG 50.57 ±2.39 12.9 0.01 µg/mL 5C9 IgG + K1-70 IgGa 83.80 ±5.12 0 0.1 µg/mL 5C9 IgG + K1-70 IgGa 76.28 ±1.72 0 0.2 µg/mL 5C9 IgG + K1-70 IgGa 71.85 ±5.96 0 1 µg/mL 5C9 IgG + K1-70 IgGa 67.70 ±12.58 0 2 µg/mL 5C9 IgG + K1-70 IgGa 55.28 ±6.17 4.8 0.01 µg/mL 5C9 IgG + 5B3 IgGa 73.53 ±4.31 0 0.1 µg/mL 5C9 IgG + 5B3 IgGa 82.26 ±12.07 0 0.2 µg/mL 5C9 IgG + 5B3 IgGa 62.03 ±1.22 0 1 µg/mL 5C9 IgG + 5B3 IgGa 36.49 ±1.10 37.1 2 µg/mL 5C9 IgG + 5B3 IgGa 27.78 ±2.96 52.1 See legend to Table 7a for details. The experiments were carried out using CHO cells expressing wild type TSHR at approximately 5 x 10⁵ receptors per cells. aThe total final concentration of IgG mixture is shown; ie in the case of 2 µg/mL K1-70 IgG + 5C9 IgG, the mixture contains 1 µg/mL K1-70 IgG and 1 µg/mL 5C9 IgG. Consequently, the combined effect of two IgGs at 2 µg/mL can be compared to the effect of the single IgG at the same concentration (2 µg/mL). Table 8a Cyclic AMP levels in CHO cells expressing wild type TSHR and TSHR with Lys58 mutated to Ala. Effect of different dilutions of human monoclonal antibody to the TSHR (K1-18) with TSH agonist activity Cyclic AMP produced (pmol/mLpmol/mL) mean ±SD (n = 3) Wild type TSHR Mutated TSHR Mutated/ Wild type (%) Cyclic AMP assay buffer 2.32 ±0.37 8.23 ±0.00 355 K1-18 0.3 ng/mL 4.69 ±0.95 12.02 ± 1.52 256 1 ng/mL 8.95 ± 0.18 19.35 ± 3.45 216 3 ng/mL 25.47 ± 4.30 43.07 ± 13.04 169 10 ng/mL 66.57 ± 3.17 69.61 ± 1.25 105 30 ng/mL 84.18 ± 11.86 79.39 ± 9.40 94 100 ng/mL 98.12 ± 5.31 102.88 ± 3.31 105 TSH 0.01 ng/mL 3.11 ± 1.09 7.16 ± 0.97 230 0.03 ng/mL 4.43 ± 0.67 10.00 ± 0.29 226 0.1 ng/mL 10.11 ± 1.27 17.24 ± 1.77 171 0.3 ng/mL 41.25 ± 5.41 45.94 ± 1.43 111 1 ng/mL 74.52 ± 3.07 75.22* 101 3 ng/mL 95.34 ± 6.60 83.71 ± 7.10 88 Results shown are mean ±SD of triplicate determinations. *duplicate determination. Samples diluted in hypotonic cyclic AMP buffer. Table 8b Cyclic AMP levels in CHO cells expressing wild type TSHR and TSHR with Arg80 mutated to Ala. Effect of different dilutions of human monoclonal antibody to the TSHR (K1-18) with TSH agonist activity Cyclic AMP produced (pmol/mLpmol/mL) mean ±SD (n = 3) Wild type TSHR Mutated TSHR Mutated/ Wild type (%) Cyclic AMP assay buffer 1.65 ±0.40 4.76 ±1.30 288 K1-18 0.3 ng/mL 2.46 ± 0.49 4.59 ± 0.41 187 1 ng/mL 5.11 ±0.77 7.22 ±0.69 141 3 ng/mL 10.65 ±1.17 13.81 ±2.53 130 10 ng/mL 31.34 ±5.31 31.72 ±1.53 101 30 ng/mL 50.15 ±6.02 45.47 ±3.59 91 100 ng/mL 66.30 ±6.93 64.50 ±0.51 97 TSH 0.01 ng/mL 2.00 ±0.81 4.06 ±0.36 203 0.03 ng/mL 3.68 ±0.28 6.19 ±0.95 168 0.1 ng/mL 9.10 ±1.19 13.31 ±1.94 146 0.3 ng/mL 22.19 ±1.46 27.66 ±2.20 125 1 ng/mL 57.48 ±4.57 54.55 ±10.40 95 3 ng/mL 58.48 ±8.87 56.95 ±3.97 97 See legend to Table 8a for details. Table 8c Cyclic AMP levels in CHO cells expressing wild type TSHR and TSHR with Tyr82 mutated to Ala. Effect of different dilutions of human monoclonal antibody to the TSHR (K1-18) with TSH agonist activity Cyclic AMP produced (pmol/mLpmol/mL) mean ±SD (n = 3) Wild type TSHR Mutated TSHR Mutated/ Wild type (%) Cyclic AMP assay buffer 0.52 ±0.09 1.88 ±0.25 362 K1-18 0.3 ng/mL 1.39 ±0.10 4.72 ±0.95 340 1 ng/mL 2.95 ±0.51 5.48 ±0.91 186 3 ng/mL 7.22 ±1.08 13.26 ±1.61 184 10 ng/mL 26.07 ±1.15 28.73 ±2.65 110 30 ng/mL 36.96 ±2.55 41.91 ±5.06 113 100 ng/mL 50.72 ±6.93 57.64 ±1.84 114 TSH 0.01 ng/mL 1.01 ±0.42 2.60 ±0.44 257 0.03 ng/mL 4.39 ±1.65 4.10 ±0.63 93 0.1 ng/mL 9.67 ±1.07 9.64 ±1.49 100 0.3 ng/mL 29.80 ±2.51 33.66 ±4.57 113 1 ng/mL 53.34 ±4.68 49.96 ±0.72 94 3 ng/mL 56.56 ±4.76 61.34 ±4.96 108 See legend to Table 8a for details. Table 8d Cyclic AMP levels in CHO cells expressing wild type TSHR and TSHR with Glu107 mutated to Ala. Effect of different dilutions of human monoclonal antibody to the TSHR (K1-18) with TSH agonist activity Cyclic AMP produced (pmol/mLpmol/mL) mean ±SD (n = 3) Wild type TSHR Mutated TSHR Mutated/ Wild type (%) Cyclic AMP assay buffer 0.91 ±0.15 7.16 ±0.17 787 K1-18 (ng/mL) 0.3 ng/mL 1.78 ±0.20 9.30 ±1.48 522 1 ng/mL 3.73 ±0.09 10.96 ±0.69 294 3 ng/mL 11.06 ±1.45 20.55 ±3.83 186 10 ng/mL 30.04 ±2.34 31.49 ±2.70 105 30 ng/mL 49.28 ±3.28 40.92 ±2.03 83 100 ng/mL 57.80 ±5.23 53.62 ±3.86 93 TSH (ng/mL) 0.01 ng/mL 1.41 ±0.10 8.20 ±1.87 582 0.03 ng/mL 1.99 ±0.09 8.92 ±2.93 448 0.1 ng/mL 5.54 ±0.60 8.24 ±0.60 149 0.3 ng/mL 16.27 ±4.48 15.72 ±0.81 97 1 ng/mL 44.20 ±3.64 30.22 ±2.62 68 3 ng/mL 53.86 ±7.00 43.91 ±2.61 82 See legend to Table 8a for details. Table 8e Cyclic AMP levels in CHO cells expressing wild type TSHR and TSHR with Arg109 mutated to Ala. Effect of different dilutions of human monoclonal antibody to the TSHR (K1-18) with TSH agonist activity Cyclic AMP produced (pmol/mLpmol/mL) mean ±SD (n = 3) Wild type TSHR Mutated TSHR Mutated/ Wild type (%) Cyclic AMP assay buffer 1.75 ±0.35 3.42 ±0.41 195 K1-18 (ng/mL) 0.3 ng/mL 2.66 ±0.13 5.31 ±0.11 200 1 ng/mL 5.81 ±0.13 9.39 ±0.88 162 3 ng/mL 12.86 ±0.77 17.99 ±3.94 140 10 ng/mL 40.46 ±1.76 40.55 ±3.48 100 30 ng/mL 58.91 ±9.28 50.84 ±1.01 86 100 ng/mL 66.01 ±4.85 59.9 ±1.25 91 TSH (ng/mL) 0.01 ng/mL 2.74 ±0.37 3.15 ±0.22 115 0.03ng/mL 4.24 ±0.24 4.92 ±0.54 116 0.1 ng/mL 9.39 ±1.16 8.39 ±0.46 89 0.3 ng/mL 39.63 ±2.57 39.17 ±1.70 99 1 nq/mL 61.19 ±8.50 43.82 ±1.69 72 3 nq/mL 70.6 ±10.03 55.16 ±2.59 78 See legend to Table 8a for details. Table 8f Cyclic AMP levels in CHO cells expressing wild type TSHR and TSHR with Lys129 mutated to Ala. Effect of different dilutions of human monoclonal antibody to the TSHR (K1-18) with TSH agonist activity Cyclic AMP produced (pmol/mLpmol/mL) mean ±SD (n = 3) Wild type TSHR Mutated TSHR Mutated/ Wild type (%) Cyclic AMP assay buffer 1.72 ±0.44 2.69 ±0.25 156 K1-18 0.3 ng/mL 2.49 ±0.34 3.24 ±0.03 130 1 ng/mL 4.78 ±0.88 5.53 ±1.04 116 3 ng/mL 12.22 ±0.32 10.58 ±0.61 87 10 nq/mL 30.88 ±3.70 23.53 ±1.04 76 30 ng/mL 44.61 ±4.59 33.46 ±2.66 75 100 ng/mL 52.57 ±1.30 52.88 ±2.31 101 TSH 0.01 ng/mL 2.01 ±0.40 2.69 ±0.44 134 0.03 ng/mL 3.32 ±0.26 5.34 ±0.05 161 0.1 ng/mL 9.69 ±0.91 12.69 ±1.06 131 0.3 ng/mL 26.14 ±2.72 29.0 ±1.07 111 1 ng/mL 46.33 ±2.29 40.78 ±5.20 88 3 ng/mL 48.07 ±2.77 48.50 ±5.38 101 See legend to Table 8a for details. Table 8g Cyclic AMP levels in CHO cells expressing wild type TSHR and TSHR with Phe130 mutated to Ala. Effect of different dilutions of human monoclonal antibody to the TSHR (K1-18) with TSH agonist activity Cyclic AMP produced (pmol/mLpmol/mL) mean ±SD) (n = 3) Wild type TSHR Mutated TSHR Mutated/ Wild type (%) Cyclic AMP assay buffer 1.96 ±0.22 3.38 ±0.47 172 K1-18 0.3 ng/mL 3.23 ±0.26 4.01 ±0.03 124 1 ng/mL 6.24 ±0.70 6.71 ±0.35 108 3 ng/mL 15.42 ±1.00 14.89 ±12.46 97 10 ng/mL 49.72 ±5.36 36.36 ±2.23 73 30 ng/mL 51.57 ±8.02 54.0 ±2.20 66 100 ng/mL 98.73 ±8.67 78.11 ±7.43 79 TSH 0.01 ng/mL 2.28 ±0.15 3.05 ±0.29 134 0.03 ng/mL 3.77 ±0.83 4.12 ±0.55 109 0.1 ng/mL 9.55 ±0.15 9.61 ±1.14 101 0.3 ng/mL 28.77 ±1.08 35.64 ±3.00 124 1 ng/mL 76.83 ±10.33 66.16 ±4.97 86 3 ng/mL 93.08 ±7.22 80.37 ±3.05 86 See legend to Table 8a for details. Table 8h Cyclic AMP levels in CHO cells expressing wild type TSHR and TSHR with Phe134 mutated to Ala. Effect of different dilutions of human monoclonal antibody to the TSHR (K1-18) with TSH agonist activity Cyclic AMP produced (pmol/mL) mean ±SD (n = 3) Wild type TSHR Mutated TSHR Mutated/ Wild type (%) Cyclic AMP assay buffer 1.85 ±0.37 4.62 ±0.89 250 K1-18 0.3 ng/mL 2.44 ±0.12 2.71 ±0.65 234 1 ng/mL 5.97 ±0.63 9.56 ±0.52 160 3 ng/mL 13.43 ±0.46 24.24 ±1.93 180 10 ng/mL 35.49 ±1.71 43.41 ±1.29 122 30 ng/mL 46.48 ±3.34 66.25 ±11.73 143 100 ng/mL 58.93 ±10.42 78.69 ±6.43 134 TSH 0.01 ng/mL 2.50 ±0.43 4.73 ±0.24 189 0.03 ng/mL 4.29 ±0.33 6.05 ±0.21 141 0.1 ng/mL 10.60 ±0.56 12.70 ±2.22 120 0.3 ng/mL 28.93 ±3.07 27.28 ±1.96 94 1 ng/mL 52.55 ±3.97 53.68 ±4.76 102 3 ng/mL 61.09 ±8.26 61.51 ±0.99 101 See legend to Table 8a for details. Table 8i Cyclic AMP levels in CHO cells expressing wild type TSHR and TSHR with Lys183 mutated to Ala. Effect of different dilutions of human monoclonal antibody to the TSHR (K1-18) with TSH agonist activity Cyclic AMP produced (pmol/mL) mean ±SD (n = 3) Wild type TSHR Mutated TSHR Mutated/ Wild type (%) Experiment 1Cyclic AMP assay buffer 1.49 ±0.31 4.54 ±0.23 305 K1-18 0.3 ng/mL 2.67 ±0.30 4.41 ±0.07 165 1 ng/mL 5.69 ±0.26 4.72 ±0.53 83 3 ng/mL 14.43 ±2.30 4.55 ±0.32 32 10 ng/mL 43.94 ±2.59 4.73 ±0.57 11 30 ng/mL 73.60 ±9.07 4.58 ±0.29 6 100 ng/mL 84.59 ±5.65 5.31 ±1.38 6 TSH 0.01 ng/mL 1.80 ±0.13 4.95 ±0.23 275 0.03 ng/mL 3.91 ±0.06 6.94 ±1.04 177 0.1 ng/mL 8.92 ±1.47 13.04 ±1.12 146 0.3 ng/mL 33.01 ±3.49 34.95 ±1.12 106 1 ng/mL 76.07 ±4.42 57.18 ±2.97 75 3 ng/mL 86.17 ±2.02 69.15 ±3.34 80 Experiment 2Cyclic AMP assay buffer 0.53 ±0.27 3.72 ±0.19 702 K1-18 0.3 ng/mL 1.93 ±0.92 3.25 ±0.23 168 1 ng/mL 3.59 ±0.47 2.77 ±1.32 77 3 ng/mL 6.56 ±2.29 3.24 ±0.63 49 10 ng/mL 27.79 ±1.77 0.58 ±0.89 2 30 ng/mL 46.16 ±5.72 1.97 ±0.11 4 100 ng/mL 61.78 ±3.78 0.92 ±1.17 1 TSH 0.01 ng/mL 1.30 ±0.20 3.73 ±0.10 287 0.03 ng/mL 3.00 ±0.12 5.37 ±0.31 179 0.1 ng/mL 6.69 ±0.41 10.08 ±0.82 151 0.3 ng/mL 26.22 ±6.92 27.84 ±2.8 106 1 ng/mL 68.12 ±15.71 55.78 ±2.52 82 3 ng/mL 69.75 ±13.30 72.17 ±8.74 103 See legend to Table 8a for details. Table 8j Cyclic AMP levels in CHO cells expressing wild type TSHR and TSHR with Asp203 mutated to Ala. Effect of different dilutions of human monoclonal antibody to the TSHR (K1-18) with TSH agonist activity Cyclic AMP produced (pmol/mL) mean ±SD (n = 3) Wild type TSHR Mutated TSHR Mutated/ Wild type (%) Cyclic AMP assay buffer 1.64 ±0.17 6.06 ±0.16 370 K1-18 0.3 ng/mL 2.68 ±0.21 8.14 ±0.24 304 1 ng/mL 5.60 ±0.27 12.54 ±0.46 224 3 ng/mL 11.54 ±2.20 26.08 ±2.19 226 10 ng/mL 38.16 ±0.90 49.54 ±2.38 130 30 ng/mL 60.04 ±6.18 67.45 ±4.04 112 100 ng/mL 76.63 ±4.54 78.94 ±3.75 103 TSH 0.01 ng/mL 2.29 ±0.18 5.30 ±0.53 231 0.03 ng/mL 3.56 ±0.21 7.13 ±0.29 200 0.1 ng/mL 8.45 ±0.07 13.02 ±2.00 154 0.3 ng/mL 26.33 ±1.63 33.77 ±1.37 128 1 ng/mL 65.72 ±5.74 58.56 ±3.02 89 3 ng/mL 77.11 ±4.86 69.26 ±0.68 90 See legend to Table 8a for details. Table 8k Cyclic AMP levels in CHO cells expressing wild type TSHR and TSHR with Arg255 mutated to Asp. Effect of different dilutions of human monoclonal antibody to the TSHR (K1-18) with TSH agonist activity Cyclic AMP produced (pmol/mL) mean ±SD = 3) Wild type TSHR Mutated TSHR Mutated/ Wild type (%) Experiment 1Cyclic AMP assay buffer 2.65 ±0.20 1.89 ±0.28 71 K1-18 0.3 ng/mL 4.40 ±0.67 1.93 ±0.23 44 1 ng/mL 8.93 ±2.17 2.19 ±0.25 25 3 ng/mL 16.31 ±1.29 4.14 ±0.95 25 10 ng/mL 42.50 ±3.42 7.87 ±0.53 19 30 ng/mL 49.10 ±9.27 15.59 ±1.15 32 100 ng/mL 55.17 ±10.84 31.58 ±6.83 57 TSH 0.01 ng/mL 4.36 ±1.05 2.59 ±0.31 59 0.03 ng/mL v9.19±1.74 6.47 ±0.10 70 0.1 ng/mL 26.86 ±2.67 19.18 ±2.69 71 0.3 ng/mL 42.03 ±6.15 51.67 ±3.38 123 1 ng/mL 60.08 ±4.20 68.59 ±7.07 114 3 ng/mL 61.27 ±2.99 57.72 ±9.50 94 Experiment 2Cyclic AMP assay buffer 1.80 ±0.14 2.35 ±0.45 131 K1-18 0.3 ng/mL 2.26 ±0.22 2.13 ±0.19 94 1 ng/mL 5.21 ±0.60 1.93 ±0.67 37 3 ng/mL 11.23 ±1.35 3.49 ±0.08 31 10 ng/mL 30.58 ±1.89 6.08 ±0.93 20 30 ng/mL 51.91 ±5.11 7.96 ±0.29 15 100 ng/mL 67.17 ±5.84 20.23 ±0.48 30 TSH 0.01 ng/mL 2.21 ±0.25 1.49 ±0.25 67 0.03 ng/mL 3.61 ±0.28 2.81 ±0.38 78 0.1 ng/mL 7.86 ±3.02 6.92 ±0.35 88 0.3 ng/mL 27.07 ±2.08 21.24* 78 1 ng/mL 54.24 ±5.41 41.06 ±1.0 76 3 ng/mL 58.14 ±3.02 52.35 ±3.20 90 Experiment 3Cyclic AMP assay buffer 4.02 ±0.14 5.88 ±0.27 146 K1-18 0.3 ng/mL 5.65 ±0.61 5.76 ±0.33 102 1 ng/mL 9.40 ±0.97 5.93 ±0 63 3 ng/mL 21.39 ±0.55 6.06 ±0.40 28 10 ng/mL 67.31 ±4.56 9.44 ±0.82 14 30 ng/mL 131.53 ±5.0 13.46 ±1.25 10 100 ng/mL 226.28 ±15.17 30.07 ±5.98 13 TSH 0.01 ng/mL 5.19 ±0.15 6.46 ±0.13 124 0.03 ng/mL 9.82 ±0.96 9.44 ±0.27 96 0.1 ng/mL 24.96* 22.74 ±2.24 91 0.3 ng/mL 91.70 ±3.45 68.89 ±3.12 75 1 ng/mL 191.94 ±11.08 154.26 ±4.66 80 3 ng/mL 226.42 ±16.78 201.17 ±16.22 89 See legend to Table 8a for details. Table 9a TSH induced cyclic AMP production in CHO cells expressing wild type TSHR and TSHR with Lys58 mutated to Ala. Effect of different dilutions of human monoclonal antibody to the TSHR (K1-70) with TSH antagonist activity Experiment 1 Cyclic AMP produced (pmol/mL; mean ±SD, n=3) Test samplea Wild type TSHR Mutated TSHR Mutated/ wild type (%) Cyclic AMP assay buffer only 1.86 ±0.41 5.03 ±0.29 270 TSHb 68.83 ±0.70 78.46 ±4.71 114 5B3 10µg/mL + TSHb 82.85 ±10.89 81.62 ±5.07 99 5B3 100µg/mL + TSHb 80.67 ±13.25 81.61 ±5.04 101 K1-70 0.001µg + TSHb 92.76 ±13.12 104.76 ±7.65 113 K1-70 0.01µg + TSHb 82.54 ±2.17 108.22 ±8.17 131 K1-70 0.1µg + TSHb 4.26 ±0.83 85.28 ±6.13 2002 K1-70 1.0µg + TSHb 1.56 ±0.20 61.47 ±2.61 3940 K1-70 10µg + TSHb 1.72 ±0.34 33.11 ±4.67 1925 K1-70 100µg + TSHb 1.58 ±0.05 18.75 ±4.91 1187 K1-70 100µq 1.04 ±0.61 4.06 ±0.66 390 TSH (2) 74.30 ±18.86 85.20 ±4.48 115 % inhibition of TSH stimulationc Antibody concentration Wild type TSHR Mutated TSHR 5B3 10µg/ mL 0 0 5B3 100µg/ mL 0 0 K1-70 0.001 µg 0 0 K1-70 0.01µg/ mL 0 0 K1-70 0.1µg/ mL 94 0 K1-70 1µg/ mL 98 22 K1-70 10µg/ mL 98 58 K1-70 100µg/ mL 98 76 TSH (2) 0 0 Experiment 2Cyclic Cyclic AMP produced (pmol/mL; mean ±SD, n=3) Test samplea Wild type TSHR Mutated TSHR Mutated/ wild type (%) Cyclic AMP assay buffer only 1.49 ±0.21 3.68 ±0.45 247 TSHb 97.87 ±4.55 96.77 ±9.54 99 5B3 10µg/ml + TSHb 105.71 ±16.43 92,91 ±1.17 88 5B3 100µg/ml + TSHb 90.43 ±5.84 95.85 ±6.56 106 K1-70 0.001µg+TSHb 101.80 ±13.32 105.33 ±11.55 103 K1-70 0.01µg + TSHb 115.21 ±7.84 107.32 ±11.90 93 K1-70 0.1µg + TSHb 8.94 ±2.47 83.06 ±10.21 929 K1-70 1.0µg + TSHb 1.71 ±0.40 60.95 ±3.72 3564 K1-70 10µg + TSHb 1.27 ±0.47 25.12 ±4.15 1978 K1-70 100µg + TSHb 1.31 ±0.33 17.34 ±1.35 1324 K1-70 100µg 1.38 ±1.81 2.56 ±0.20 186 TSH (2) 102.41 ±6.78 95.84 ±1.30 94 % inhibition of TSH stimulationc Antibody concentration Wild type TSHR Mutated TSHR 5B3 10µg/ mL 0 4 5B3 100µg/ mL 8 1 K1-70 0.001 µg 0 0 K1-70 0.01µg/ mL 0 0 K1-70 0.1µg/ mL 91 14 K1-70 1µg/ mL 98 37 K1-70 10µg/ mL 99 74 K1-70 100µg/ mL 99 82 TSH (2) 0 1 aTest samples in hypotonic cyclic AMP assay buffer.
bTSH final concentration = 3ng/mL
c % inhibition = 100 x [1 - (cyclic AMP in the presence of test samples and TSH/cyclic AMP in the presence of cyclic AMP buffer and TSH)]. 5B3 is a human monoclonal antibody to GAD (negative control for K1-70)Table 9b TSH induced cyclic AMP production in CHO cells expressing wild type TSHR and TSHR with Arg80 mutated to Ala. Effect of different dilutions of human monoclonal antibody to the TSHR (K1-70) with TSH antagonist activity Cyclic AMP produced (pmol/mL; mean ±SD, n=3) Test samplea Wild type TSHR Mutated TSHR Mutated/ wild type (%) Cyclic AMP assay buffer only 3.44 ±0.35 4.01 ±0.07 117 TSHb 85.04 ±5.88 105.33 ±10.10 124 5B3 10µg/mL + TSHb 103.34 ±14.25 104.97 ±12.48 102 5B3 100µg/mL + TSHb 94.76 ±19.53 101.43 ±4.34 107 K1-70 0.001µg + TSHb 79.24 ±9.29 90.78 ±8.65 115 K1-70 0.01µg + TSHb 83.30 ±7.42 99.26 ±7.04 119 K1-70 0.1µg + TSHb 40.75 ±8.82 38.83 ±8.04 95 K1-70 1.0µg + TSHb 5.0 ±0.72 6.71 ±1.42 134 K1-70 10µg + TSHb 3.17 ±0.18 5.14 ±1.43 162 K1-70 100µg + TSHb 4.67 ±0.32 4.83 ±0.25 103 K1-70 100µg 2.98 ±0.13 3.19 ±0.51 107 TSH (2) 93.53 ±17.83 88.18 ±2.24 94 % inhibition of TSH stimulationc Antibody concentration Wild type TSHR Mutated TSHR 5B3 10µg/ mL 0 0.3 5B3 100µg/ ml 0 4 K1-70 0.001 µg 7 14 K1-70 0.01µg/ mL 2 6 K1-70 0.1µg/ mL 52 63 K1-70 11µg/ mL 94 94 K1-70 10µg/ mL 96 95 K1-70 100µg/ mL 95 95 TSH (2) 0 16 See legend to Table 9a for details. Table 9c TSH induced cyclic AMP production in CHO cells expressing wild type TSHR and TSHR with Tyr82 mutated to Ala. Effect of different dilutions of human monoclonal antibody to the TSHR (K1-70) with TSH antagonist activity Experiment 1 Cyclic AMP produced (pmol/mL; mean ±SD, n=3) Test samplea Wild type TSHR Mutated TSHR Mutated/ wild type (%) Cyclic AMP assay buffer only 1.38 ±0.19 2.00 ±0.22 145 TSHb 153.65 ±17.41 165.92 ±11.45 108 5B3 10µg/mL + TSHb 163.14 ±13.71 139.01 ±5.40 85 5B3 100µg/mL + TSHb 146.23 ±19.81 139.28 ±11.07 95 K1-70 0.001µg + TSHb 172.63 ±16.69 103.81 ±9.73 60 K1-70 0.01µg + TSHb 146.19 ±29.10 99.95 ±12.23 68 K1-70 0.1µg + TSHb 21.73 ±3.85 69.85 ±16.62 321 K1-70 1.0µg + TSHb 1.88 ±0.24 31.82 ±3.29 1696 K1-70 10µg + TSHb 1.35 ±0.26 11.74 ±1.33 870 K1-70 100µg + TSHb 1.05 ±0.07 7.88 ±2.09 750 K1-70 100µg 0.84 ±0.12 1.81 ±0.13 215 TSH (2) 159.76 ±4.28 92.29 ±5.79 58 % inhibition of TSH stimulationc Antibody concentration Wild type TSHR Mutated TSHR 5B3 10µg/ mL 0 16 5B3 100µg/ mL 5 16 K1-70 0.001 µg 0 62 K1-70 0.01 µg/ mL 5 40 K1-70 0.1µg/ mL 86 60 K1-70 1µg/ mL 99 81 K1-70 10µg/ mL 99 93 K1-70 100µg/ mL 99 95 TSH (2) 0 44 Experiment 2Cyclic AMP produced (pmol/mL; mean ±SD, n=3) Test samplea Wild type TSHR Mutated TSHR Mutated/ wild type (%) Cyclic AMP assay buffer only 0.62 ±0.16 5.67 ±0.29 915 TSHb 59.91 ±5.85 74.61 ±6.62 125 5B3 10µg/mL + TSHb 73.66 ±23.18 71.92 ±5.39 96 5B3 100µg/mL + TSHb 68.87 ±10.44 68.46 ±3.41 99 K1-70 0.001µg + TSHb 97.15 ±2.87 89.47 ±9.17 92 K1-70 0.01µg + TSHb 81.95 ±4.74 95.68 ±7.62 117 K1-70 0.1µg + TSHb 5.79 ±0.68 50.57 ±19.35 873 K1-70 1.0µg + TSHb 1.01 ±0.36 14.55 ±0.65 1440 K1-70 10µg + TSHb 1.02 ±0.19 9.07 ±0.70 889 K1-70 100µg + TSHb 1.00 ±0.19 7.28 ±0.44 728 K1-70 100µg 0.84 ±0.14 5.32 ±0.74 633 TSH (2) 61.54 ±7.58 57.87 ±1.52 94 % inhibition of TSH stimulationc Antibody concentration Wild type TSHR Mutated TSHR 5B3 10µg/ mL 0 4 5B3 100µg/ mL 0 8 K1-70 0.001 µg 0 0 K1-70 0.01µg/ mL 0 0 K1-70 0.1µg/ mL 90 32 K1-70 1µg/ ml 98 80 K1-70 10µg/ mL 98 88 K1-70 100µg/ mL 98 90 TSH (2) 0 22 See legend to Table 9a for details. Table 9d TSH induced cyclic AMP production in CHO cells expressing wild type TSHR and TSHR with Glu107 mutated to Ala. Effect of different dilutions of human monoclonal antibody to the TSHR (K1-70) with TSH antagonist activity Cyclic AMP produced (pmol/mL; mean ±SD, n=3) Test samplea Wild type TSHR Mutated TSHR Mutated/wild type (%) Cyclic AMP assay buffer only 1.60 ±0.19 5.29 ±0.36 331 TSHb 76.22 ±4.52 83.70 ±3.92 110 5B3 10µg/mL + TSHb 85.30 ±5.68 70.93 ±5.64 83 5B3 100µg/mL + TSHb 81.64 ±5.48 66.84 ±7.24 82 K1-70 0.001µg + TSHb 103.6 ±5.93 94.45 ±8.21 91 K1-70 0.01µg + TSHb 89.43 ±19.6 82.88 ±4.50 93 K1-70 0.1µg + TSHb 12.10 ±2.22 4.97 ±0.59 41 K1-70 1.0µg + TSHb 1.71 ±0.32 2.71 ±0.05 158 K1-70 10µg + TSHb 1.49 ±0.16 2.45 ±0.13 164 K1-70 100µg + TSHb 1.86 ±0.23 2.75 ±0.17 148 K1-70 100µg 1.60 ±0.07 1.80 ±0.30 113 TSH (2) 93.75 ±9.25 73.24 ±5.57 78 % inhibition of TSH stimulationc Antibody concentration Wild type TSHR Mutated TSHR 5B3 10µg/ mL 0 15 5B3 100µg/ mL 0 17 K1-70 0.001 µg 0 0 K1-70 0.01µg/ mL 0 1 K1-70 0.1µg/ mL 84 94 K1-70 1µg/ mL 98 97 K1-70 10µg/ mL 98 97 K1-70 100µg/ mL 98 97 TSH (2) 0 12 See legend to Table 9a for details. Table 9e TSH induced cyclic AMP production in CHO cells expressing wild type TSHR and TSHR with Arg109 mutated to Ala. Effect of different dilutions of human monoclonal antibody to the TSHR (K1-70) with TSH antagonist activity Experiment 1 Cyclic AMP produced (pmol/mL; mean ±SD, n=3) Test samplea Wild type TSHR Mutated TSHR Mutated/ wild type (%) Cyclic AMP assay buffer only 1.94 ±0.35 4.42 ±0.55 228 TSHb 67.67 ±4.90 32.90 ±2.55 49 5B3 10µg/mL + TSHb 65.84 ±1.73 34.41 ±1.67 52 5B3 100µg/mL + TSHb 68.54 ±1.22 34.51 ±5.03 50 K1-70 0.001µg + TSHb 66.99 ±8.59 34.24 ±0.25 51 K1-70 0.01µg + TSHb 66.85 ±2.02 32.56 ±1.04 49 K1-70 0.1µg + TSHb 6.41 ±0.32 24.84 ±1.94 388 K1-70 1.0µg + TSHb 1.60 ±0.28 24.45 ±0.49 1528 K1-70 10µg + TSHb 1.51 ±0.08 18.92 ±2.16 1253 K1-70 100µg + TSHb 1.36 ±0.17 14.05 ±3.4 1033 K1-70 100µg 1.48 ±0.1 3.39 ±0.29 229 TSH (2) 67.54 ±2.56 33.30 ±2.27 49 % inhibition of TSH stimulationc Antibody concentration Wild type TSHR Mutated TSHR 5B3 10µg/ mL 3 0 5B3 100µg/ mL 0 0 K1-70 0.001 µg 1 0 K1-70 0.01µg/ mL 1 0 K1-70 0.1µg/ mL 91 24 K1-70 1µg/ mL 98 26 K1-70 10µg/ mL 98 42 K1-70 100µg/ mL 98 57 TSH (2) 0.1 0 Experiment 2Cyclic AMP produced (pmol/mL; mean ±SD, n=3) Test samplea Wild type TSHR Mutated TSHR Mutated/ wild type (%) Cyclic AMP assay buffer only 0.89 ±0.19 1.61 ±0.14 181 TSHb 60.73 ±7.97 53.41 ±3.69 88 5B3 10µg/mL + TSHb 68.59 ±2.26 60.65 ±0.63 88 5B3 100µg/mL + TSHb 66.50 ±2.55 56.57 ±3.26 85 K1-70 0.001µg + TSHb 55.89 ±6.77 61.82 ±17.17 111 K1-70 0.01µg + TSHb 61.90 ±1.57 46.01 ±0.91 74 K1-70 0.1µg + TSHb 5.54 ±1.21 30.32 ±3.35 547 K1-70 1.0µg + TSHb 1.32 ±0.21 25.25 ±1.54 1913 K1-70 10µg + TSHb 0.97* 14.80 ±0 1526 K1-70 100µg + TSHb 0.88 ±0.11 9.14 ±0.91 1039 K1-70 100µg 1.02 ±0.06 126 ±0.41 124 TSH (2) 67.80 ±3.83 50.39 ±2.52 74 *duplicate determination % inhibition of TSH stimulationc Antibody concentration Wild type TSHR Mutated TSHR 5B3 10µg/ mL 0 0 5B3 100µg/ mL 0 0 K1-70 0.001 µg 8 0 K1-70 0.01 µg/ mL 0 14 K1-70 0.1µg/ mL 91 43 K1-70 µg/ mL 98 53 K1-70 10µg/ mL 98 72 K1-70 100µg/ mL 99 83 TSH (2) 0 6 See legend to Table 9a for details. Table 9f TSH induced cyclic AMP production in CHO cells expressing wild type TSHR and TSHR with Lys129 mutated to Ala. Effect of different dilutions of human monoclonal antibody to the TSHR (K1-70) with TSH antagonist activity Cyclic AMP produced (pmol/mL; mean ±SD, n=3) Test samplea Wild type TSHR Mutated TSHR Mutated/ wild type (%) Cyclic AMP assay buffer only 3.10 ±2.74 3.37 ±0.85 109 TSHb 50.03 ±3.0 49.2 ±6.7 98 5B3 10µg/mL + TSHb 53.88 ±3.67 50.5 ±3.43 94 5B3 100µg/mL + TSHb 52.60 ±6.43 42.63 ±2.35 81 K1-70 0.001µg + TSHb 49.48 ±6.51 44.76 ±2.58 90 K1-70 0.01µg + TSHb 51.04 ±0.00 38.66 ±2.03 76 K1-70 0.1µg + TSHb 4.70 ±1.25 9.86 ±1.14 210 K1-70 1.0µg + TSHb 0.74 ±0.06 3.23 ±0.15 436 K1-70 10µg + TSHb 0.80 ±0.33 2.83 ±0.71 354 K1-70 100µg + TSHb 1.12 ±0.46 2.82 ±0.21 251 K1-70 100µg 0.88 ±0.21 3.06 ±1.11 348 TSH (2) 53.1 ±8.0 47.9 ±0.41 90 % inhibition of TSH stimulationc Antibody concentration Wild type TSHR Mutated TSHR 5B3 10µg/ mL 0 0 5B3 100µg/ mL 0 13 K1-70 0.001 µg 1 9 K1-70 0.01µg/ mL 0 21 K1-70 0.1µg/ mL 91 80 K1-70 1µg/ mL 99 93 K1-70 10µg/ mL 98 94 K1-70 100µg/ mL 98 94 TSH (2) 0 3 See legend for Table 9a for details. Table 9g TSH induced cyclic AMP production in CHO cells expressing wild type TSHR and TSHR with Phe130 mutated to Ala. Effect of different dilutions of human monoclonal antibody to the TSHR (K1-70) with TSH antagonist activity Cyclic AMP produced (pmol/mL; mean ±SD, n=3) Test samplea Wild type TSHR Mutated TSHR Mutated/ wild type (%) Cyclic AMP assay buffer only 1.39 ±0.29 3.53 ±0.49 254 TSHb 79.42 ±5.15 120.74 ±2.87 152 5B3 10µg/mL + TSHb 78.18 ±1.95 110.76 ±1.49 142 5B3 100µg/mL + TSHb 86.94 ±15.80 113.8 ±11.11 131 K1-70 0.001µg + TSHb 82.73 ±3.36 102.43 ±7.59 124 K1-70 0.01µg + TSHb 83.95 ±5.31 103.90 ±7.14 124 K1-70 0.1µg + TSHb 4.86 ±1.52 12.71 ±3.24 262 K1-70 1.0µg + TSHb 1.56 ±0.61 2.87 ±0.28 184 K1-70 10µg + TSHb 1.27 ±0.15 2.22 ±0.40 175 K1-70 100µg + TSHb 1.18 ±0.09 2.68 ±0.41 242 K1-70 100µg 1.23 ±0.08 2.37 ±0.26 193 TSH (2) 89.12 ±4.45 95.39 ±7.44 107 % inhibition of TSH stimulationc Antibody concentration Wild type TSHR Mutated TSHR 5B3 10µg/ mL 2 8 5B3 100µg/ mL 0 6 K1-70 0.001 µg 0 15 K1-70 0.01µg/ mL 0 14 K1-70 0.1µg/ mL 94 89 K1-70 1µg/ mL 98 98 K1-70 10µg/ mL 98 98 K1-70 100µg/ mL 99 98 TSH (2) 0 0 See legend to Table 9a for details Table 9h TSH induced cyclic AMP production in CHO cells expressing wild type TSHR and TSHR with Phe134 mutated to Ala. Effect of different dilutions of human monoclonal antibody to the TSHR (K1-70) with TSH antagonist activity Cyclic AMP produced (pmol/mL; mean ±SD, n=3) Test samplea Wild type TSHR Mutated TSHR Mutated/ wild type (%) Cyclic AMP assay buffer only 6.83 ±1.44 14.86 ±2.75 218 TSHb 108.08 ± 13.83 111.16 ± 2.0 103 5B3 10µg/mL + TSHb 131.38 ± 6.77 101.30 ± 8.44 77 5B3 100µg/mL + TSHb 112.49 ± 2.66 115.54 ± 9.72 103 K1-70 0.001µg + TSHb 137.02 ± 27.32 106.92 ± 15.54 78 K1-70 0.01µg + TSHb 120.16 ± 3.88 111.84 ± 6.01 93 K1-70 0.1µg + TSHb 8.09 ± 1.00 27.86 ± 3.72 344 K1-70 1.0µg + TSHb 2.02 ± 0.39 5.59 ± 1.40 277 K1-70 10µg + TSHb 1.88 ± 0.35 4.00 ± 1.77 213 K1-70 100µg + TSHb 1.48 ± 0.33 3.50 ±0.09 236 K1-70 100µg 1.34 ± 0.40 2.86 ±0.41 213 TSH (2) 142.29 ± 13.46 101.70 ± 1.33 71 % inhibition of TSH stimulationc Antibody concentration Wild type TSHR Mutated TSHR 5B3 10µg/ mL 0 9 5B3 100µg/ mL 0 0 K1-70 0.001 µg 0 4 K1-70 0.01µg/ mL 0 0 K1-70 0.1µg/ ml 93 75 K1-70 1µg/ mL 98 95 K1-70 10µg/ mL 98 96 K1-70 100µg/ mL 99 97 TSH (2) 0 9 See legend to Table 9a for details. Table 9i TSH induced cyclic AMP production in CHO cells expressing wild type TSHR and TSHR with Lys183 mutated to Ala. Effect of different dilutions of human monoclonal antibody to the TSHR (K1-70) with TSH antagonist activity Experiment 1 Cyclic AMP produced (pmol/L; mean ±SD, n=3) Test samplea Wild type TSHR Mutated TSHR Mutated/ wild type (%) Cyclic AMP assay buffer only 0.43 ± 0.69 3.20 ± 0.15 744 TSHb 61.1 ± 2.48 75.8 ±8.25 124 583 10µg/mL + TSHb 62.03 ± 12.77 57.82 ± 7.43 93 5B3 100µg/mL + TSHb 69.24 ± 6.19 63.12 ± 10.69 91 K1-70 0.001µg + TSHb 83.86 ± 6.22 64.26 ± 2.45 77 K1-70 0.01µg + TSHb 91.30 ± 15.24 61.76 ± 5.46 68 K1-70 0.1µg + TSHb 9.35 ± 4.52 35.73 ± 5.57 382 K1-70 1.0µg + TSHb 0.94 ± 0.34 4.02 ± 0.35 428 K1-70 10µg + TSHb 0.52 ± 0.44 2.13 ± 0.89 410 K1-70 100µg + TSHb 1.22 ± 0.32 1.88 ± 0.17 154 K1-70 100µg 0.02 ± 0.01 1.42 ± 0.18 7100 TSH (2) 83.6 ± 2.95 62.16 ± 4.39 74 % inhibition of TSH stimulationc Antibody concentration Wild type TSHR Mutated TSHR 5B3 10µg/ mL 0 24 5B3 100µg/ mL 0 17 K1-70 0.001 µg 0 15 K1-70 0.01µg/ mL 0 19 K1-70 0.1µg/ mL 85 53 K1-70 1µg/ mL 98 95 K1-70 10µg/ mL 99 97 K1-70 100µg/ mL 98 98 TSH (2) 0 18 Experiment 2Cyclic AMP produced (pmol/mL; mean ±SD, n=3) Test samplea Wild type TSHR Mutated TSHR Mutated/ wild type (%) Cyclic AMP assay buffer only 2.28 ± 0.08 4.86 ± 0.69 213 TSHb 78.45 ± 5.2 100.68 ± 6.89 128 5B3 10µg/mL + TSHb 87.4 ± 1.07 91.25 ± 1.14 104 5B3 100µg/mL + TSHb 82.72 ± 3.42 91.89 ±0.00 111 K1-70 0.001µg + TSHb 94.13 ± 3.00 98.03 ± 9.02 104 K1-70 0.01µg + TSHb 101.52 ± 6.79 103.40 ± 5.88 102 K1-70 0.1µg + TSHb 19.94 ± 4.38 69.63 ± 3.65 349 K1-70 1.0µg + TSHb 2.26 ± 0.17 13.36 ± 3.85 591 K1-70 10µg + TSHb 2.24 ± 0.33 4.32 ± 0.30 193 K1-70 100µg + TSHb 2.29 ± 0.42 4.01 ± 0.56 175 K1-70 100µg 2.32 ± 0.21 3.26 ± 0.08 141 TSH (2) 79.45 ± 4.3 77.34 ±3.86 97 % inhibition of TSH stimulationc Antibody concentration Wild type TSHR Mutated TSHR 5B3 10µg/ mL 0 9 5B3 100µg/ mL 0 9 K1-70 0.001 µg 0 3 K1-70 0.01µg/ mL 0 0 K1-70 0.1µg/ mL 75 31 K1-70 1µg/ mL 97 87 K1-70 10µg/ mL 97 96 K1-70 100µg/ mL 97 96 TSH (2) 0 23 See legend to Table 9a for details. Table 9j TSH induced cyclic AMP production in CHO cells expressing wild type TSHR and TSHR with Asp203 mutated to Ala. Effect of different dilutions of human monoclonal antibody to the TSHR (K1-70) with TSH antagonist activity Cyclic AMP produced (pmol/mL; mean ±SD), n=3) Test samplea Wild type TSHR Mutated TSHR Mutated/ wild type (%) Cyclic AMP assay buffer only 1.55 ± 0.40 5.22 ± 0.77 337 TSHb 71.0 ± 6.52 53.85 ± 2.96 76 5B3 10µg/mL + TSHb 72.22 ± 3.73 64.34 ± 5.43 89 5B3 100µg/mL + TSHb 72.78 ± 4.65 61.38 ± 1.95 84 K1-70 0.001µg + TSHb 79.43 ± 2.28 65.83 ± 4.66 83 K1-70 0.01µg + TSHb 80.84 ± 4.72 63.32 ± 8.41 78 K1-70 0.1µg + TSHb 7.51 ± 0.12 15.13 ± 3.92 201 K1-70 1.0µg + TSHb 1.33 ± 0.03 4.43 ± 0.96 333 K1-70 10µg + TSHb 0.39 ± 0.31 4.37 ± 0.56 1121 K1-70 100µg + TSHb 0.62 ± 0.45 4.55 ± 1.57 734 K1-70 100µg 0.53 ± 0.27 3.79 ± 0.59 715 TSH (2) 68.0 ± 3.15 59.29 ± 9.87 87 % inhibition of TSH stimulationc Antibody concentration Wild type TSHR Mutated TSHR 5B3 10µg/ mL 0 0 5B3 100µg/ mL 0 0 K1-70 0.001 µg 0 0 K1-70 0.01µg/ mL 0 0 K1-70 0.1µg/ mL 89 72 K1-70 1µg/ mL 98 92 K1-70 10µg/ mL 99 92 K1-70 100µg/ mL 99 92 TSH (2) 0 0 See legend to Table 9a for details. Table 9k TSH induced cyclic AMP production in CHO cells expressing wild type TSHR and TSHR with Arg255 mutated to Asp. Effect of different dilutions of human monoclonal antibody to the TSHR (K1-70) with TSH antagonist activity Cyclic AMP produced (pmol/mL; mean ±SD, n=3) Test samplea Wild type TSHR Mutated TSHR R255D Mutated/ wild type (%) Cyclic AMP assay buffer only 1.95 ± 0.25 2.17 ± 0.78 111 TSHb 66.48 ± 5.07 57.84 ± 4.45 87 5B3 10µg/mL + TSHb 69.15 ± 0.73 59.42 ± 3.05 86 5B3 100µg/mL + TSHb 83.38 ± 7.53 62.20 ± 10.14 75 K1-70 0.001µg + TSHb 74.70 ± 1.78 55.65 ± 3.99 74 K1-70 0.01µg + TSHb 77.09 ± 6.60 56.26 ± 3.14 73 K1-70 0.1µg + TSHb 24.06 ± 0.32 5.67 ± 1.26 24 K1-70 1.0µg + TSHb 3.22 ± 0.64 1.56 ± 0.34 48 K1-70 10µg + TSHb 2.38 ± 0.28 0.10 ± 0.08 4 K1-70 100µg + TSHb 1.99 ± 0.14 1.05 ± 0.56 53 K1-70 100µg 1.85 ± 0.44 0.60 ± 0.47 32 TSH (2) 64.84 ± 8.16 50.21 ± 5.27 77 % inhibitions of TSH stimulationc Antibody concentration Wild type TSHR Mutated TSHR 5B3 10µg/ mL 0 0 5B3 100µg/ mL 0 0 K1-70 0.001 µg 0 4 K1-70 0.01µg/ mL 0 3 K1-70 0.1µg/ mL 64 90 K1-70 1µg/ mL 95 97 K1-70 10µg/ mL 96 100 K1-70 100µg/ mL 97 98 TSH (2) 2 13 See legend to Table 9a for details. Table 10 Summary of effects of TSHR mutations (relative to wild type) on the ability of K1-18 IgG to stimulate the TSHR and K1-70 IgG to block TSH stimulation nf the TSHR TSHR mutation Stimulation of cyclic AMP production by K1-18 IgG Blocking by K1-70 of TSH stimulation of cyclic AMP production Wild type +++++ +++++ Lys58 Ala +++++ ++ Arq80 Ala +++++ +++++ Tyr82 Ala +++++ ++++ Glu107 Ala +++++ +++++ Arg109 Ala +++++ +++ Lys129 Ala +++++ +++++ Phe130 Ala +++++ +++++ Phe134 Ala +++++ +++++ Lys183 Ala 0 +++ Asp203 Ala +++++ +++++ Arq255 Asp 0 +++++ Effects of TSHR mutations were expressed as a percentage of activity observed with wild type as follows:- +++++ = 100% wild type activity; ++++ = <100-80% of wild type activity; +++ = <80-60% of wild type activity; ++ = <60-40% of wild type activity; + = <40-20% of wild type activity; 0 = <20% of wild type activity. Table 11a Inhibition of 125I-K1-70 IgG binding to TSHR coated tubes by human monoclonal TSHR autoantibodies Test sample Inhibition of binding (%) Dilutions in assay buffer (mean ± SD) Inhibition of binding (%) Dilutions in HBD (mean ± SD) M22 IgG 100 µg/mL 92.2 ± 0.2 94.0 ± 0.6 30 µg/mL 90.5 ± 0.4 94.4 ± 1.1 10 µg/mL 90.2 ± 0.7 92.5 ± 0.1 3 µg/mL 89.5 ± 1.0 91.6 ± 0.5 1 µg/mL 89.0 ± 0.1 90.4 ± 0.7 0.3 µg/mL 87.7 ± 0.4 84.6 ± 1.1 0.1 µg/mL 84.5 ± 0.4 65.5 ± 0.2 0.03 µg/mL 70.4 ± 1.1 33.8 ± 0.9 0.01 µg/mL 43.4 ± 1.9 17.1 ± 2.4 0.003 µg/mL 16.7 ± 3.7 6.2* 0.001 µg/mL 5.5 ± 0.7 3.0 ± 3.6 M22 Fab 100 µg/mL 93.2 ± 0.5 93.1 ± 0.2 30 µg/mL 92.2 ± 0.7 93.2 ± 0.3 10 µg/mL 89.4 ± 1.3 92.6 ± 0.4 3 µg/mL 89.1 ± 1.0 92.0 ± 0.3 1 µg/mL 88.8 ± 0.8 91.7 ± 0.7 0.3 µg/mL 88.0 ± 0.4 89.9 ± 0.1 0.1 µg/mL 86.5 ± 0.1 82.5 ± 0.4 0.03 µg/mL 79.7 ± 0.4 60.2 ± 1.8 0.01 µg/mL 63.5 ± 0.8 34.0 ± 2.1 0.003 µg/mL 31.0 ± 3.3 16.7 ± 6.0 0.001 µg/mL 15.9 ± 3.1 9.3 ± 1.3 K1-70 IgG 100 µg/mL 93.0 ± 0.3 94.6 ± 0.7 30 µg/mL 92.3 ± 0.2 93.7 ± 0.5 10 µg/mL 90.8 ± 1.0 92.6 ± 0.4 3 µg/mL 89.7 ± 0.4 92.0 ± 0.5 1 µg/mL 89.9 ± 0.7 91.8 ± 0.9 0.3 µg/mL 89.0 ± 0.5 84.4 ± 0.8 0.1 µg/mL 86.7 ± 0.5 67.4 ± 0.7 0.03 µg/mL 77.0 ± 0.6 36.5 ± 1.9 0.01 µg/mL 50.7 ± 1.5 19.9 ± 5.8 0.003 µg/mL 17.0 ± 0.8 10.2 ± 2.4 0.001 µg/mL 3.4 ± 0.7 4.8 ± 4.8 5C9 IgG 100 µg/mL 93.3 ± 0.2 68.5 ± 0.7 10 µg/mL 84.8 ± 0.8 22.7 ± 1.0 1 µg/mL 56.4 ± 0.9 15.4 ± 3.4 0.1 µg/mL 24.6 ± 0.4 4.4 ± 2.7 0.01 µg/mL 4.5 ± 2.4 2.8 ± 4.5 5B3 IgG 100 µg/mL 15.2 ± 2.5 1.1* 10 µg/mL -2.1 ± 1.3 -0.7 ± 2.2 1 µg/mL -2.6 ± 1.1 0.0* 0.1 µg/mL 1.0 ± 2.7 9.4 ± 4.2 0.01 µg/mL 3.2 ± 3.4 3.2 ± 3.4 0.001 µg/mL -1.5 ± 4.3 3.7 ± 2.1 Results shown are mean ± SD of triplicate determinations. *duplicate determination. HBD = pool of healthy blood donor sera. 5B3 is a human MAb to glutamic acid decarboxylase (negative control). 125I-K1-70 IgG in the presence of assay buffer gave 20.4% binding. 125I-K1-70 IgG in the presence of HBD pool gave 20.5% binding. Assay buffer is 50 mmol/L NaCl, 10 mmol/L Tris pH 7.8, 0.1% Triton X-100. Table 11b Inhibition of 125I-K1-70 IgG binding to TSHR coated tubes by human monoclonal TSHR autoantibodies Test sample Inhibition of binding (%) Dilutions in assay buffer (mean ± SD) Inhibition of binding (%) Dilutions in HBD (mean ± SD) K1-18 IgG 100 µg/mL 92.9 ± 0.2 93.5 ± 0.2 30 µg/mL 91.2 ± 0.7 92.2 ± 0.6 10 µg/mL 91.8 ± 0.3 92.5 ± 0.7 3 µg/mL 90.5 ± 1.0 91.0 ± 0.3 1 µg/mL 89.6 ± 1.2 85.8 ± 0.3 0.3 µg/mL 86.4 ± 0.8 73.9 ± 0.6 0.1 µg/mL 77.9 ± 0.2 48.6 ± 0.9 0.03 µg/mL 53.9 ± 1.9 20.0 ± 1.9 0.01 µg/mL 30.2 ± 2.1 3.1 ± 2.0 0.003 µg/mL 17.0 ± 3.1 -2.7 ± 7.9 0.001 µg/mL 7.2 ± 2.5 -3.0 ± 3.9 K1-18 Fab 100 µg/ml 86.0 ± 1.4 83.6 ± 0.3 30 µg/mL 83.3 ± 1.5 83.2 ± 1.4 10 µg/mL 81.9 ± 0.9 82.0 ± 0.2 3 µg/mL 79.4 ± 1.1 80.5 ± 0.6 1 µg/mL 78.5 ± 1.8 75.6 ± 1.0 0.3 µg/mL 71.4 ± 1.7 60.9 ± 1.1 0.1 µg/mL 62.8 ± 5.1 38.4 ± 1.2 0.03 µg/mL 31.3 ± 1.0 10.2 ± 2.1 0.01 µg/mL 23.7 ± 5.4 1.1 ± 2.6 0.003 µg/mL 15.2 ± 3.4 -3.5 ± 3.1 0.001 µg/mL 13.8 ± 5.9 0.5 ± 4.4 K1-70 IgG 100 µg/mL 93.8 ± 0.2 93.6 ± 0.4 30 µg/mL 93.1 ± 0.5 94.3 ± 0.2 10 µg/mL 92.3 ± 0.3 93.1 ± 0.6 3 µg/mL 90.7 ± 0.4 91.7 ± 0.4 1 µg/mL 90.8 ± 0.4 90.4 ± 0.3 0.3 µg/mL 89.2 ± 0.6 82.7 ± 0.6 0.1 µg/mL 87.1 ± 0.6 62.8 ± 1.1 0.03 µg/mL 74.2 ± 1.5 33.6 ± 1.8 0.01 µg/mL 50.9 ± 0.8 11.4 ± 3.6 0.003 µg/mL 24.0 ± 4.5 2.2 ± 6.2 0.001 µg/mL 15.3 ± 1.1 -7.6 ± 2.8 K1-70 Fab 100 µg/mL 91.5 ± 0.2 90.8 ± 0.6 30 µg/mL 90.7 ± 0.1 91.0 ± 0.7 10 µg/mL 89.8 ± 1.2 90.6 ± 0.1 3 µg/mL 89.4 ± 0.3 90.9 ± 0.4 1 µg/mL 88.3 ± 0.4 89.5 ± 0.3 0.3 µg/mL 88.0 ± 0.1 87.3 ± 0.6 0.1 µg/mL 87.5 ± 0.8 76.5 ± 0.4 0.03 µg/mL 81.7 ± 0.6 49.6 ± 0.4 0.01 µg/mL 64.8 ± 2.7 21.6 ± 3.8 0.003 µg/mL 32.7 ± 2.7 5.6 ± 6.0 0.001 µg/mL 12.2 ± 2.3 -3.6 ± 1.0 See legend to Table 11a for details. 125I-K1-70 IgG in the presence of assay buffer gave 20.4% binding. 125I-K1-70 IgG in the presence of HBD pool gave 20.5% binding. Effect of 5B3 IgG (human MAb to glutamic acid decarboxylase; negative control) is shown in Table 11a. Table 11c Inhibition of 125I-K1-70 IgG binding to TSHR coated tubes by mouse monoclonal TSHR antibodies Test sample Inhibition of binding (%) Dilutions in assay buffer (mean ± SD) Inhibition of binding (%) Dilutions in HBD (mean ± SD) TSMAb 1 IgG 100 µg/mL 47.4 ± 1.2 44.7 ± 0.5 10 µg/mL 23.0 ± 0.5 37.7 ± 1.2 1 µg/mL 14.8 ± 0.5 16.8 ± 2.3 0.1 µg/mL 2.3 ± 2.3 -2.2 ± 1.9 0.01 µg/mL -1.0 ± 4.4 -3.3 ± 2.9 TSMAb 2 IgG 100 µg/mL 53.7 ± 1.4 43.8 ± 0.9 10 µg/mL 14.5 ± 1.4 35.5 ± 1.3 1 µg/mL 9.3 ± 1.6 28.6 ± 0.6 0.1 µg/mL 6.5 ± 2.3 10.2 ± 0.8 0.01 µg/mL 0.3 ± 3.4 1.2 ± 3.6 TSMAb 3 IgG 100 µg/mL 54.8 ± 2.8 33.5 ± 3.7 10 µg/mL 25.4 ± 2.9 24.9 ± 2.8 1 µg/mL 14.6 ± 0.9 18.5 ± 0.8 0.1 µg/mL 13.1 ± 0.7 4.8 ± 1.7 0.01 µg/mL 5.3 ± 0.7 -1.3 ± 0.3 TSMAb 4 IgG 100 µg/mL 47.7 ± 2.6 54.2 ± 1.7 10 µg/mL 31.9 ± 0.7 52.8 ± 2.5 1 µg/mL 29.9 ± 1.0 42.8 ± 1.2 0.1 µg/mL 22.6 ± 1.6 18.6 ± 0.2 0.01 µg/mL 6.7 ± 0.6 2.3 ± 3.1 TSMAb 5 IgG 100 µg/mL 72.5 ± 1.3 59.6 ± 0.6 10 µg/mL 53.1 ± 1.6 53.8 ± 0.7 1 µg/mL 33.8 ± 3.9 46.3 ± 1.3 0.1 µg/mL 25.7 ± 0.7 30.6 ± 1.5 0.01 µg/mL 10.9 ± 3.1 7.2 ± 1.4 TSMAb 6 IgG 100 µg/mL 59.5 ± 3.2 48.1 ± 2.1 10 µg/mL 23.9 ± 3.0 47.4 ± 4.1 1 µg/mL 19.2 ± 2.3 37.0 ± 1.4 0.1 µg/mL 16.6 ± 1.1 22.0 ± 1.2 0.01 µg/mL 7.8 ± 0.5 3.6 ± 1.6 TSMAb 7 IgG 100 µg/mL 61.2 ± 0.8 44.7 ± 1.6 10 µg/mL 41.2 ± 2.3 41.8 ± 2.7 1 µg/mL 19.4 ± 3.7 33.1 ± 1.4 0.1 µg/mL 13.4 ± 1.5 13.0 ± 1.2 0.01 µg/mL 2.9 ± 1.2 -2.1 ± 0.4 9D33 IgG 100 µg/mL 61.4 ± 0.4 51.1 ± 1.7 10 µg/mL 41.7 ± 1.6 48.0 ± 2.2 1 µg/mL 37.2 ± 4.0 40.5 ± 3.6 0.1 µg/mL 24.8 ± 1.1 14.8 ± 0.2 0.01 µg/mL 9.4 ± 1.1 0.6 ± 0.4 5B3 IgG 100 µg/mL 1.3 ± 0.6 -0.9 ± 2.6 10 µg/mL 2.3 ± 2.3 -1.5 ± 1.5 1 µg/mL 4.2 ± 5.3 -1.5 ± 5.4 0.1 µg/mL -1.2 ± 1.3 -3.6 ± 3.3 0.01 µg/mL -3.6 ± 1.8 -5.8 ± 1.9 See legend to Table 11a for details. 125I-K1-70 IgG in the presence of assay buffer gave 20.3% binding. 125I-K1-70 IgG in the presence of HBD pool gave 19.5% binding. Table 11d Inhibition of 125I-K1-70 Fab binding to TSHR coated tubes by human and mouse monoclonal TSHR antibodies Test sample Inhibition of binding (%) Dilutions in assay buffer (mean ± SD) Inhibition of binding (%) Dilutions in HBD (mean ± SD) KI-18 IgG 100 µg/mL 95.3 ± 0.2 96.0 ± 0.0 30 µg/mL 94.5 ± 0.1 95.6 ± 0.4 10 µg/mL 94.0 ± 0.4 94.8 ± 0.3 3 µg/mL 93.3 ± 0.5 93.0 ± 0.5 1 µg/mL 93.1 ± 0.3 89.4 ± 0.7 0.3 µg/mL 92.6 ± 0.8 77.7 ± 1.5 0.1 µg/mL 83.6 ± 0.3 51.0 ± 3.2 0.03 µg/mL 63.1 ± 0.6 17.2 ± 2.6 0.01 µg/mL 30.3 ± 2.1 2.2 ± 7.8 0.003 µg/mL 11.4 ± 4.1 -9.4 ± 3.1 0.001 µg/mL 5.9 ± 5.6 -6.8 ± 5.4 K1.18 Fab 100 µg/mL 86.4 ± 0.5 85.7 ± 1.6 30 µg/mL 83.2 ± 0.1 85.4 ± 0.8 10 µg/mL 80.8 ± 0.9 83.2 ± 0.7 3 µg/mL 80.6 ± 1.9 82.6 ± 0.5 1 µg/mL 79.0 ± 1.5 78.7 ± 1.6 0.3 µg/mL 75.9 ± 0.2 63.9 ± 1.3 0.1 µg/mL 62.9 ± 0.7 36.9 ± 2.2 0.03 µg/ml 38.8 ± 0.4 7.9 ± 1.5 0.01 µg/mL 16.7 ± 0.4 -0.8 ± 4.7 0.003 µg/mL 5.0 ± 4.6 -9.6 ± 4.8 0.001 µg/mL 3.8 ± 5.8 -8.2 ± 5.6 M22 IgG 100 µg/mL 97.2 ± 0.3 96.5 ± 0.5 30 µg/mL 96.3 ± 0.5 95.8 ± 0.3 10 µg/mL 95.8 ± 0.5 95.4 ± 0.7 3 µg/mL 95.4 ± 0.4 95.1 ± 0.4 1 µg/mL 94.5 ± 0.9 93.1 ± 0.2 0.3 µg/mL 93.1 ± 0.3 86.6 ± 3.3 0.1 µg/mL 89.4 ± 0.4 68.2 ± 0.4 0.03 µg/mL 72.7 ±1.3 32.7 ± 1.3 0.01 µg/mL 41.0 ± 2.4 5.7 ± 2.0 0.003 µg/mL 19.3 ± 3.1 -5.8 ± 2.8 0.001 µg/ml 12.1 ± 4.8 -3.1 ± 5.5 M22 Fab 100 µg/mL 97.7 ± 0.1 94.9 ± 0.5 30 µg/mL 96.2 ± 0.3 95.3 ± 0.2 10 µg/mL 95.5 ± 0.1 94.8 ±0.5 3 µg/mL 94.2 ± 0.2 94.1 ± 0.4 1 µg/mL 93.6 ± 0.5 93.7 ± 0.7 0.3 µg/mL 92.7 ± 0.4 92.2 ± 0.7 0.1 µg/mL 91.8 ± 0.2 86.4 ± 1.8 0.03 µg/ml 83.9 ± 0.8 66.8 ± 0.8 0.01 µg/mL 61.6 ± 1.2 36.6 ± 1.0 0.003 µg/mL 29.7 ± 1.4 11.5 ± 1.9 0.001 µg/mL 10.9 ± 0.5 7.7 ± 7.3 K1-70 IgG 100 µg/mL 97.7 ± 0.2 97.7 ± 0.2 30 µg/mL 97.7 ± 0.2 97.4 ± 0.2 10 µg/mL 96.9 ± 0.3 96.6 ± 0.2 3 µg/mL 95.5 ± 0.5 96.2 ± 0.5 1 µg/mL 95.2 ± 0.3 94.1 ± 0.4 0.3 µg/mL 94.2 ± 0.2 97.0 ± 1.0 0.1 µg/mL 93.5 ± 0.7 66.5 ± 1.4 0.03 µg/mL 89.0 ± 0.5 37.8 ± 3.3 0.01 µg/mL 66.2 ± 2.1 10.6 ± 1.6 0.003 µg/mL 27.7 ± 3.8 -0.8 ± 2.6 0.001 µg/mL 5.5 ± 1.0 -8.8 ± 2.4 K1-70 Fab 100 µg/mL 96.7 ± 0.4 96.3 ± 0.1 30 µg/mL 95.1 ± 0.9 95.7 ± 0.4 10 µg/mL 93.6 ± 0.0 94.8 ± 0.5 3 µg/mL 93.5 ± 0.2 94.9 ± 0.3 1 µg/mL 93.5 ± 0.1 94.2 ± 0.3 0.3 µg/mL 92.7 ± 0.4 91.4 ± 0.8 0.1 µg/mL 92.2 ± 0.3 81.9 ± 0.5 0.03 µg/mL 89.0 ± 0.3 57.2 ± 2.6 0.01 µg/mL 75.6 ±1.3 25.3 ± 3.9 0.003 µg/mL 40.0 ± 3.9 2.5 ± 5.8 0.001 µg/mL 11.9 ± 2.6 -2.5 ± 3.2 5C9 IgG 100 µg/mL 93.3 ± 0.9 40.6 ± 3.8 10 µg/mL 80.4 ± 2.4 20.7 ± 1.1 1 µg/mL 41.5 ± 3.2 8.1 ± 5.5 0.1 µg/mL 21.9 ± 0.6 6.0 ± 8.6 0.01 µg/mL 10.9 ± 1.6 -4.4 ± 5.9 TSMAb 1 IgG 100 µg/mL 48.8 ± 1.9 46.3 ± 1.6 10 µg/mL 29.9 ± 0.4 41.4 ± 1.3 1 µg/mL 21.9 ± 1.5 25.0 ± 2.0 0.1 µg/mL 4.1 ± 3.0 8.4 ± 4.3 0.01 µg/mL -2.5 ± 2.5 3.5 ± 3.5 TSMAb 2 IgG 100 µg/mL 56.3 ± 2.1 38.3 ± 3.0 10 µg/mL 24.0 ± 3.8 34.7 ±1.2 1 µg/mL 16.8 ± 1.4 26.9 ±-2.9 0.1 µg/mL 13.0 ± 2.2 12.5 ± 1.7 0.01 µg/mL 4.0 ± 2.1 8.6 ± 8.6 TSMAb 3 IgG 100 µg/mL 58.9 ± 3.2 32.6 ± 2.6 10 µg/mL 30.3 ±1.8 29.0 ± 3.4 1 µg/mL 29.3 ± 3.2 18.2 ± 2.1 0.1 µg/mL 21.1 ± 1.9 3.6 ± 1.3 0.01 µg/mL 7.2 ± 1.7 2.4 ± 3.7 TSMAb 4 IgG 100 µg/mL 53.8 ± 3.4 57.8 ± 3.3 10 µg/mL 41.8 ± 2.1 53.5 ± 1.4 1 µg/mL 38.8 ± 2.2 41.2 ± 0.1 0.1 µg/mL 29.9 ± 1.3 12.8 ± 1.6 0.01 µg/mL 8.6 ± 1.2 -1.4 ± 1.7 TSMAb 5 IgG 100 µg/mL 81.8 ±1.5 57.5 ± 1.6 10 µg/mL 62.0 ± 5.7 57.0 ± 2.6 1 µg/mL 41.2 ± 0.9 52.3 ± 1.2 0.1 µg/mL 34.4 ± 1.4 28.8 ± 1.2 0.01 µg/mL 14.4 ± 1.9 6.8 ± 0.4 TSMAb 6 IgG 100 µg/mL 68.3 ± 2.9 43.9 ± 1.0 10 µg/mL 28.9 ± 3.7 39.2 ± 3.8 1 µg/µL 25.4 ± 2.4 36.9 ± 4.7 0.1 µg/mL 19.5 ± 2.0 19.2 ±1.6 0.01 µg/mL 4.9 ± 0.7 0.2 ± 0.9 TSMAb 7 IgG 100 µg/mL 59.8 ± 2.8 38.2 ± 2.1 10 µg/mL 40.6 ± 1.2 39.5 ± 5.5 1 µg/mL 21.7 ± 2.1 30.7 ± 2.8 0.1 µg/mL 13.5 ± 1.7 9.3 ± 2.7 0.01 µg/mL -1.7 ± 1.6 -2.9 ± 2.3 9D33 IgG 100 µg/mL 62.7 ± 2.5 55.7 ± 7.1 10 µg/mL 48.0 ± 2.6 47.7 ± 1.7 1 µg/mL 43.8 ± 1.8 38.8 ± 3.3 0.1 µg/mL 29.7 ± 3.4 12.7 ± 1.8 0.01 µg/mL 5.0 ± 0.4 -1.2 ± 2.7 5B3 IgG 100 µg/mL 1.4 ± 0.6 -8.6 ± 1.2 10 µg/mL -2.1 ± 2.6 -5.7 ± 4.4 1 µg/mL -1.7 ± 0.2 -7.8 ± 2.2 0.1 µg/mL 2.2 ± 0.8 -8.7 ± 0.8 0.01 µg/mL -1.7 ± 1.7 -5.3 ± 7.0 0.001 µg/mL -1.8 ± 3.1 -12.1 ± 2.8 See legend to Table 11a for details. 125I-K1-70 Fab in the presence of assay buffer gave 20.3% binding. 125I-K1-70 Fab in the presence of HBD pool gave 19.5% binding. Table 11e Inhibition of 125I-K1-70 Fab, 125I-K1-70 IgG and 125I-TSH binding to TSHR coated tubes by patient sera Test Sample % Inhibition of 125I-K1- 70 Fab binding % Inhibition of 125I-K1-70 IgG binding % Inhibition of 125I-TSH binding G1 43.7 47.6 38.6 G2 29.0 33.8 31.5 G3 33.3 44.7 35.6 G4 39.2 47.5 47.1 G5 40.9 41.1 44.7 G6 50.2 55.1 52.1 G7 15.9 19.2 15.9 G8 34.6 41.5 41.8 G9 72.8 77.6 80.0 G10 55.2 62.4 68.7 G11 32.7 38.3 31.0 G12 30.8 42.1 29.7 G13 47.3 51.8 57.9 G14 49.7 53.3 49.3 G15 41.1 48.4 38.6 G16 36.9 43.3 42.9 G17 17.5 23.3 24.5 G18 33.9 40.6 39.1 G19 22.2 33.4 20.6 G20 33.5 38.1 38.4 HBD 1 -4.7 -6.5 -12.6 HBD 2 -1.7 -3.5 -4.2 HBD 3 1.2 -2.8 -5.4 HBD 4 -3.4 0.8 -11.8 HBD 5 -0.5 5.6 -4.7 HBD 6 1.6 4.1 1.8 HBD 7 -9.0 -2.4 -13.7 HBD 8 -4.6 0.8 -12.8 HBD 9 -0.6 1.2 -11.0 HBD 10 -4.3 2.1 -10.6 K1 donor serum diluted 10x 72.9 73.7 67.2 diluted 20x 52.2 56.6 44.0 diluted 40x 29.5 39.5 24.8 diluted 80x 15.5 26.2 11.9 diluted 160x 7.8 15.3 2.7 diluted 320x 3.2 8.0 2.1 B1 diluted 5x 85.7 89.0 91.5 diluted 10x 76.5 81.7 83.9 diluted 20x 60.6 68.1 65.8 diluted 40x 38.4 51.3 39.6 diluted 80x 21.0 36.9 20.7 diluted 160x 8.6 20.4 7.5 diluted 320x 3.6 10.7 -2.5 B2 diluted 5x 90.4 89.9 93.5 diluted 10x 84.6 86.6 86.5 diluted 20x 71.9 78.1 68.7 diluted 40x 52.4 63.1 42.8 diluted 80x 34.9 45.1 20.4 diluted 160x 18.6 29.5 10.5 diluted 320x 10.7 16.6 14.1 S1 diluted 5x 73.6 72.1 82.0 diluted 10x 58.6 60.2 66.5 diluted 20x 45.1 45.7 47.1 diluted 40x 32.9 34.5 32.5 diluted 80x 19.7 21.6 17.4 diluted 160x 9.7 13.7 5.2 diluted 320x 2.2 4.7 2.3 S2 diluted 5x 50.0 54.7 55.1 diluted 10x 34.8 38.9 33.7 diluted 20x 24.2 22.9 18.4 diluted 40x 11.8 16.0 9.5 diluted 80x 5.6 9.4 7.7 diluted 160x 0.3 4.9 -0.7 See legend to Table 11 a for details. Dilutions were made in HBD pool serum. HBD 1-10 = healthy blood donor sera 1-10. B1, B2 = sera from two different patients with TSHR blocking autoantibodies. S1, S2 = sera from two different patients with TSHR stimulating autoantibodies. Table 12a Binding of human MAbs to TSHR260-AP in an ELISA Mean absorbance at 405nm Test sample Test sample diluted in HBD Test sample diluted in assay buffer Assay buffer -0.005 HBD serum -0.002 K1-18 IgG 250 µg/mL 0.722 1.197 100 µg/mL 0.706 0.993 10 µg/mL 0.660 0.800 1 µg/mL 0.578 0.715 0.5 µg/mL 0.511 0.673 0.1 µg/mL 0.292 0.545 0.05 µg/ml 0.191 0.396 0.01 µg/mL 0.053 0.255 0.005 µg/mL 0.013 0.136 K1-70 IgG 250 µg/mL 0.817 1.134 100 µg/mL 0.794 1.030 10 µg/mL 0.738 0.885 1 µg/mL 0.677 0.806 0.5 µg/mL 0.661 0.802 0.1 µg/mL 0.440 0.713 0.05 µg/mL 0.290 0.593 0.01 µg/mL 0.086 0.183 0.005 µg/mL 0.045 0.085 M22 IgG 250 µg/ml 0.833 1.007 100 µg/ml 0.851 0.967 10 µg/mL 0.796 0.872 1 µg/mL 0.726 0.821 0.5 µg/mL 0.657 0.776 0.1 µg/mL 0.365 0.653 0.05 µg/mL 0.204 0.484 0.01 µg/mL 0.030 0.101 0.005 µg/mL 0.045 0.075 5C9 IgG 250 µg/mL 0.058 1.124 100 µg/mL 0.027 0.669 10 µg/mL 0.004 0.099 1 µg/mL 0.045 0.011 0.5 µg/mL 0.016 -0.005 0.1 µg/mL -0.005 -0.013 0.05 µg/ml -0.003 -0.008 0.01 µg/ml 0.017 -0.001 0.005 µg/mL 0.020 -0.009 5B3 IgG 250 µg/mL 0.012 0.018 100 µg/ml 0.003 -0.011 10 µg/mL -0.006 -0.014 1 µg/mL 0.049 -0.004 0.5 µg/mL -0.001 -0.006 0.1 µg/mL -0.002 -0.013 0.05 µg/mL -0.006 -0.009 0.01 µg/mL 0.027 0.012 0.005 µg/mL -0.002 -0.012 TSHR260-AP is a fusion protein consisting of a fragment of human TSHR (amino acids 22-260) e with alkaline phosphatase. HBD = pool of healthy blood donor sera. Test samples were diluted in HBD serum or assay buffer. Assay buffer is 50 mmol/L NaCl. 10 mmol/L Tris pH 7.8, 0.1% Triton X-100, 1 mg/mL BSA.5B3 is a human MAb to glutamic acid decarboxylase (negative control). Mean absorbance = mean of duplicate determinations. Table 12b Binding of human TSHR MAbs (IgG and Fab preparations) in the TSHR260-AP based ELISA Test sample Mean absorbance at 405nm Dilutions in HBD Mean absorbance at 405nm Dilutions in assay buffer IgG Fab IgG Fab M22 IgG 250 µg/mL 0.833 0.031 1.007 0.077 100 µg/mL 0.851 - 0.967 - 10 µg/mL 0.796 0.010 0.872 0.034 1 µg/mL 0.726 - 0.821 - 0.5 µg/mL 0.657 - 0.776 - 0.1 µg/mL 0.365 -0.007 0.653 0.015 0.05 µg/mL 0.204 - 0.484 - 0.01 µg/mL 0.030 - 0.101 - 0.005 µg/mL 0.045 -0.013 0.075 -0.004 5C9 IgG 250 µg/mL 0.058 -0.008 1.124 0.204 100 µg/mL 0.027 - 0.669 - 10 µg/mL 0.004 -0.008 0.099 0.016 1 µg/mL 0.045 - 0.011 - 0.5 µg/mL 0.016 - -0.005 - 0.1 µg/mL -0.005 -0.009 -0.013 -0.009 0.05 µg/mL -0.003 - -0.008 - 0.01 µg/mL 0.017 - -0.001 - 0.005 µg/mL 0.020 -0.012 -0.009 0.000 K1-18 IgG 250 µg/mL 0.722 -0.007 1.197 0.049 100 µg/mL 0.706 - 0.993 - 10 µg/mL 0.660 -0.002 0.800 0.008 1 µg/mL 0.578 - 0.715 - 0.5 µg/ml 0.511 - 0.673 - 0.1 µg/mL 0.292 -0.011 0.545 0.002 0.05 µg/mL 0.191 - 0.396 - 0.01 µg/mL 0.053 - 0.255 - 0.005 µg/mL 0.013 -0.011 0.136 -0.004 K1-70 IgG 250 µg/mL 0.817 0.020 1.134 0.056 100 µg/mL 0.794 - 1.030 - 10 µg/mL 0.738 0.018 0.885 0.033 1 µg/mL 0.677 - 0.806 - 0.5 µg/mL 0.661 - 0.802 - 0.1 µg/mL 0.440 -0.010 0.713 0.007 0.05 µg/mL 0.290 - 0.593 - 0.01 µg/mL 0.086 - 0.183 - 0.005 µg/mL 0.045 -0.010 0.085 -0.004 5B3 IgG 250 µg/mL 0.012 - 0.018 - 100 µg/mL 0.003 - -0.011 - 10 µg/mL -0.006 - -0.014 - 1 µg/mL 0.049 - -0.004 - 0.5 µg/mL -0.001 - -0.006 - 0.1 µg/mL -0.002 - -0.013 - 0.05 µg/mL -0.006 - -0.009 - 0.01 µg/mL 0.027 - 0.012 - 0.005 µg/mL -0.002 - -0.012 - 4B4 IgG 250 µg/mL - -0.009 - -0.004 100 µg/mL - - - - 10 µg/mL - -0.009 - 0.012 1 µg/mL - - - - 0.5 µg/mL - - - - 0.1 µg/mL - -0.001 - -0.006 0.05 µg/mL - - - - 0.01 µg/mL - - - - 0.005 µg/mL - -0.014 - 0.000 See legend to Table 12a for details. 4B4 is a human MAb to glutamic acid decarboxylase (negative control). Table 12c Binding of mouse TSMAbs in the TSHR260-AP ELISA Test sample Mean absorbance at 405nm Dilutions in HBD HBD -0.010 TSMAb 1 10 µg/mL 0.166 0.5 µg/mL 0.036 0.05 µg/mL -0.002 0.005 µg/mL 0.006 TSMAb 2 10 µg/mL 0.410 0.5 µg/mL 0.191 0.05 µg/mL 0.033 0.005 µg/mL 0.003 TSMAb 3 10 µg/mL 0.103 0.5 µg/mL 0.029 0.05 µg/mL -0.001 0.005 µg/mL 0.003 TSMAb 4 10 µg/mL 0.428 0.5 µg/mL 0.253 0.05 µg/mL 0.048 0.005 µg/mL 0.013 TSMAb 5 10 µg/mL 0.561 0.5 µg/mL 0.319 0.05 µg/mL 0.054 0.005 µg/mL 0.011 TSMAb 6 10 µg/mL 0.486 0.5 µg/mL 0.310 0.05 µg/mL 0.090 0.005 µg/mL 0.002 TSMAb 7 10 µg/mL 0.357 0.5 µg/mL 0.184 0.05 µg/mL 0.027 0.005 µg/mL 0.004 K1-70 IgG 10 µg/mL 1.252 1 µg/mL 1.122 0.5 µg/mL 1.038 0.1 µg/mL 0.606 0.05 µg/ml 0.348 0.01 µg/mL 0.069 0.005 µg/mL 0.076 M22 IgG 10 µg/mL 1.272 1 µg/mL 1.094 0.5 µg/mL 1.018 0.1 µg/mL 0.548 0.05 µg/mL 0.292 0.01 µg/mL 0.043 0.005 µg/mL 0.011 See legend to Table 12a for details. Binding of 5B3 and 4B4 (human MAbs to glutamic acid decarboxylase; negative controls) is shown in Table 12b. Table 12d Bindina of mouse TSHR blocking MAb (9D33) in the TSHR260-AP ELISA Test sample Mean absorbance at 405nm Dilutions in HBD HBD 0.003 9D33 IgG 10 µg/mL 0.481 1 µg/mL 0.329 0.5 µg/ml 0.273 0.1 µg/mL 0.102 0.05 µg/mL 0.056 0.01 µg/mL 0.011 0.005 µg/mL 0.006 K1-70 IgG 10 µg/mL 1.324 1 µg/mL 1.164 0.5 µg/mL 1.083 0.1 µg/mL 0.639 0.05 µg/mL 0.388 0.01 µg/mL 0.094 0.005 µg/mL 0.059 M22 IgG 10 µg/mL 1.360 1 µg/mL 1.172 0.5 µg/mL 1.093 0.1 µg/mL 0.599 0.05 µg/mL 0.332 0.01 µg/mL 0.064 0.005 µg/mL 0.032 See legend to Table 12a for details. Binding of 5B3 and 4B4 (human MAbs to glutamic acid decarboxylase; negative controls) is shown in Table 12b. Table 12e Binding of patient sera with TSHR stimulating activity in the TSHR260-AP ELISA Test sample TSHR260-AP ELISA Inhibition of TSH binding ELISA Mean absorbance at 405nm TRAb conc1 (µg/mL) TRAb conc2 (U/L) TRAb conc2 (U/L) Stimulation of cyclic AMP production3 (pmol/mL) HBD 0.003 0 0 0 S1 diluted 1:5 0.924 0.31 38.0 >40 37.2 diluted 1:10 0.788 0.18 19.7 31.1 diluted 1:20 0.583 0.10 9.5 16.2 diluted 1:40 0.378 0.05 5.2 7.1 S2 diluted 1:5 0.740 0.17 17.9 36.0 47.6 diluted 1:10 0.595 0.10 9.8 23.6 diluted 1:20 0.407 0.06 5.7 13.6 diluted 1:40 0.235 0.03 2.9 6.6 S3 diluted 1:5 0.868 0.25 28.5 >40 35.9 diluted 1:10 0.651 0.12 11.8 34.0 diluted 1:20 0.453 0.06 6.5 23.5 diluted 1:40 0.290 0.04 3.8 12.2 S4 diluted 1:5 0.646 0.11 11.6 19.8 107.5 diluted 1:10 0.362 0.05 4.9 7.6 diluted 1:20 0.171 0.02 2.0 3.1 diluted 1:40 0.080 0.01 1.0 1.4 S5 diluted 1:5 0.407 0.06 5.7 9.4 40.6 diluted 1:10 0.221 0.03 2.7 4.4 diluted 1:20 0.109 0.01 1.3 2.1 diluted 1:40 0.059 0.01 0.9 1.1 S6 diluted 1:5 0.531 0.08 8.2 19.9 43.5 diluted 1:10 0.363 0.05 5.0 9.2 diluted 1:20 0.213 0.03 2.6 4.7 diluted 1:40 0.124 0.02 1.5 2.0 See legend to Table 12a for details Read off M22 IgG calibration curve (0.005, 0.001, 0.05, 0.1, 0.5, 1.0 and 10 µg/mL was run in each assay). 2Units are NIBSC 90/672. 3Stimulation of cyclic AMP production was tested (serum diluted 1:10 in hypotonic cyclic AMP buffer) using CHO cells expressing the full length TSHR. S1 = TSHR stimulatingpatient serum 1. S2 = TSHR stimulatingpatient serum 2. S3 = TSHR stimulatingpatient serum 3. S4 = TSHR stimulatingpatient serum 4. S5 = TSHR stimulatingpatient serum 5. S6 = TSHR stimulatingpatient serum 6. Serum dilutions for both ELISAs were made in HBD.Table 12f Binding of patient sera with TSHR blocking activity in the TSHR260-AP ELISA Test sample TSHR260-AP ELISA TRAb level measured in TSHR coated tube assay Diluted in HBD Diluted in assay buffer Mean absorbance at 405nm Mean absorbance at 405nm % inhibition of 125I- TSH binding U/L B1 undiluted 0.859 0.859 NT NT diluted 1:10 0.484 0.667 73 16.8 diluted 1:20 0.284 0.457 45 4.3 diluted 1:40 0.154 0.243 22 1.4 diluted 1:80 0.078 0.119 4 0.1 diluted 1:160 0.037 0.062 0 0 diluted 1:320 0.021 0.032 NT NT B2 undiluted 0.323 0.323 NT NT diluted 1:10 0.097 0.165 82 25.6 diluted 1:20 0.052 0.114 70 14.6 diluted 1:40 0.029 0.063 47 4.5 diluted 1:80 0.015 0.036 23 2 diluted 1:160 0.008 0.018 9 0.7 diluted 1:320 0.007 0.014 NT NT B3 diluted 1:10 0.896 1.061 85a NT diluted 1:20 0.588 0.768 73a NT diluted 1:40 0.320 0.443 51a NT diluted 1:80 0.168 0.218 34a NT diluted 1:160 0.091 0.104 22a NT diluted 1:320 0.041 0.054 13a NT B4 diluted 1:10 0.729 0.826 94a NT diluted 1:20 0.612 0.734 91a NT diluted 1:40 0.453 0.592 80a NT diluted 1:80 0.270 0.353 55a NT diluted 1:160 0.141 0.153 33a NT diluted 1:320 0.068 0.066 17a NT B5 diluted 1:10 0.772 0.910 98 >40 diluted 1:20 0.652 0.835 97 >40 diluted 1:40 0.470 0.735 95 >40 diluted 1:80 0.291 0.522 90 36.2 diluted 1:160 0.155 0.276 76 12.0 diluted 1:320 0.077 0.130 45 3.0 See legend to Table 12a for details. NT = not tested. B1 = TSHR blocking patient serum 1 (K1 lymphocyte donor serum). B2 = TSHR blocking patient serum 2. B3 = TSHR blockingpatient serum 3. B4 = TSHR blockingpatient serum 4. B5 = TSHR blockingpatient serum 5. Serum dilutions were made in HBD or assay buffer. athe inhibition of 125 I-TSH binding was carried out using the PEG precipitation assay (Southgate K, Creagh F, Teece M, Kingwood C, Rees Smith B. A receptor assay for the measurement of TSH receptor antibodies in unextracted serum. ).Table 12g Binding of patient sera in the TSHR260-AP ELISA Test sample Mean absorbance @ 405nm TRAb concentration read off M22 IgG calibration curve (µg/mL) TRAb concentration in TSHR260-AP ELISA (U/L) TRAb concentration in TSHR coated tube assay (U/L) Serum 1 0.06 0.007 0.7 1.0 Serum 2 0.072 0.008 0.9 1.0 Serum 3 0.067 0.008 0.8 1.1 Serum 4 -0.004 0.000 0 1.1 Serum 5 0.38 0.052 5.2 1.2 Serum 6 0.099 0.012 1.2 1.2 Serum 7 0.051 0.006 0.6 1.2 Serum 8 0.113 0.014 1.3 1.4 Serum 9 0.07 0.008 0.8 1.4 Serum 10 0.157 0.019 1.9 1.5 Serum 11 0.191 0.025 2.5 2.0 Serum 12 0.157 0.019 1.9 2.1 Serum 13 0.23 0.029 2.9 2.2 Serum 14 0.047 0.006 0.7 2.7 Serum 15 0.198 0.026 2.6 2.7 Serum 16 0.238 0.032 3.2 3.0 Serum 17 0.296 0.041 4.1 3.0 Serum 18 0.322 0.042 4.3 3.6 Serum 19 0.326 0.043 4.3 3.7 Serum 20 0.088 0.011 1.1 4.7 Serum 21 0.005 <0.005 <0.6 5.1 Serum 22 0.383 0.056 5.5 5.1 Serum 23 0.211 0.026 2.6 5.7 Serum 24 0.461 0.071 7 6.4 Serum 25 0.453 0.067 6.6 6.6 Serum 26 0.295 0.038 3.8 6.7 Serum 27 0.419 0.062 6.2 7.1 Serum 28 0.363 0.050 5 8.1 Serum 29 0.526 0.086 8.6 8.5 Serum 30 0.611 0.112 11.3 11.8 Serum 31 0.49 0.077 7.7 14.3 Serum 32 0.621 0.116 11.7 16.9 Serum 33 0.696 0.150 15.6 17.8 Serum 34 0.592 0.104 10.4 19.0 Serum 35 0.832 0.259 30.4 21.1 Serum 36 0.78 0.222 24.5 21.2 Serum 37 0.782 0.224 24.6 21.5 Serum 38 0.754 0.196 21.1 21.7 Serum 39 1.008 1.375 >61 26.2 Serum 40 -0.008 0 0 0 Serum 41 -0.005 0 0 0 Serum 42 -0.006 0 0 0 Serum 43 -0.004 0 0 0 Serum 44 -0.007 0 0 0 Serum 45 -0.007 0 0 0 Serum 46 -0.002 <0.005 <0.6 0 Serum 47 -0.001 0 0 0 Serum 48 0.0095 <0.005 <0.6 0 Serum 49 -0.002 0 0 0 Serum 50 0.003 0 0 0 Serum 51 0.005 <0.005 <0.6 0 Serum 52 0.008 <0.005 <0.6 0 Serum 53 -0.003 0 0 0 Serum 54 -0.005 0 0 0 Serum 55 -0.006 0 0 <1 Serum 56 0.0065 <0.005 <0.6 0 Serum 57 -0.004 0 0 0 Serum 58 0.001 0 0.0 <1 Serum 59 0.041 0.005 0.6 0 See legend to Table 12a for details. Sera 1-39 are from patients diagnosed with or suspected of having Graves' disease. Sera 1-39 were positive for TRAb in the coated tube assay (based on inhibition of 125I-binding to full length TSHR coated on the tubes). Sera 40-59 were from healthy blood donors and were negative for TRAb in the coated tube assay. Table 12h Measurement of serum TRAb by inhibition of M22-peroxidase binding to the TSHR260 in an ELISA Test sample TRAb ELISA (full length TSHR coated on plates) TRAb ELISA (TSHR260 coated on plates) Mean absorbance at 450nm % inhibition of TSH-biotin binding TRAb concentr. (U/L) Mean absorbance at 450nm % Inhibition of M22 Fab- peroxidase binding TRAb concentr. (U/L) Serum 600.224 90 30.7 0.196 92 >40 Serum 610.514 77 15.2 0.569 77 14.7 Serum 620.605 73 12.4 0.470 81 24.7 Serum 631.555 30 2.1 1.109 55 3.7 Serum 641.639 26 1.7 1.208 51 3.1 Serum 651.488 33 2.4 1.341 45 2.4 Serum 661.267 43 3.6 0.706 71 8.5 Serum 671.066 52 5.1 0.908 63 5.3 Serum 681.341 40 3.1 0.704 71 8.6 Serum 691.414 37 2.7 0.764 69 7.3 Serum 700.704 68 10.0 0.797 67 6.7 Serum 711.691 24 1.5 0.797 67 6.7 Serum 722.404 -8 0 2.791 -14 0 Serum 732.203 1 0.1 2.509 -3 0 Serum 742.228 0 0.1 2.737 -12 0 Serum 752.274 -2 0 2.758 -13 0 Serum 762.178 2 0.2 2.215 10 0.3 Serum 772.292 -3 0 2.152 12 0.3 Serum 782.425 -9 0 2.676 -9 0 Serum 792.397 -8 0 3.363 -37 0 Serum 802.410 -8 0 2.905 -19 0 Serum 812.148 4 0.2 2.523 -3 0 Sera 60-71 are from patients diagnosed with or suspected of Graves' disease. Sera 60-71 were positive for TRAb in the coated tube assay (based on inhibition of 125I-TSH binding to full length TSHR coated on the tubes). Sera 72-81 were from healthy blood donors that were negative for TRAb in the coated tube assay. Table 12i Ability of TSHR MAbs to bind to full length wild type TSHR and TSHR Arg255 Asp coated on ELISA plate wells. TSHR260-AP used to detect MAb binding Wild type TSHR Arg255 Asp TSHR Test sample Mean absorbance at 405nm Mean absorbance at 405nm HBD 0.003 0.005 K1-70 IgG 10 µg/mL 1.324 1.357 1 µg/mL 1.164 1.141 0.5 µg/mL 1.083 0.998 0.1 µg/mL 0.639 0.322 0.05 µg/mL 0.388 0.146 0.01 µg/mL 0.094 0.021 0.005 µg/mL 0.059 0.008 M22 IgG 10 µg/mL 1.360 0.551 1 µg/mL 1.172 0.340 0.5 µg/mL 1.093 0.262 0.1 µg/mL 0.599 0.050 0.05 µg/mL 0.332 0.017 0.01 µg/mL 0.064 -0.002 0.005 µg/mL 0.032 -0.007 K1-18 IgG 10 µg/mL 1.187 1.111 1 µg/mL 0.986 0.888 0.5 µg/mL 0.876 0.710 0.1 µg/mL 0.452 0.176 0.05 µg/mL 0.301 0.099 0.01 µg/mL 0.072 0.014 0.005 µg/mL 0.038 0.002 9D33 IgG 10 µg/mL 0.481 0.534 1 µg/mL 0.329 0.322 0.5 µg/mL 0.273 0.242 0.1 µg/mL 0.102 0.053 0.05 µg/mL 0.056 0.020 0.01 µg/mL 0.011 -0.004 0.005 µg/mL 0.006 0.001 See legend to Table 12a for details. Serum dilutions were made in HBD. Table 12j Ability of patient sera to bind to full length wild type TSHR and TSHR Arg255 Asp coated on ELISA plate wells. TSHR260-AP used to detect binding Test sample Wild type TSHR Arg255 Asp TSHR TRAb level in TSHR coated tube assay Mean absorbance at 405nm µg/mL (read off K1-70 IgG calibration) Mean absorbance at 405nm µg/mL (read off K1-70 IgG calibration) U/L Patient sera Serum 10.707 0.121 0.558 0.176 14.7 Serum 20.798 0.159 0.677 0.227 17.1 Serum 30.647 0.102 0.237 0.076 8.1 Serum 40.692 0.116 0.585 0.187 12.3 Serum 50.560 0.081 0.169 0.057 9.9 Serum 60.278 0.034 0.096 0.036 5.9 Serum 70.388 0.050 0.167 0.056 5.6 Serum 80.367 0.047 0.112 0.040 8.3 Serum 90.198 0.023 0.074 0.029 11.3 Serum 100.788 0.154 0.447 0.137 17 HBD 0.003 0 0.005 0 0 See legend to Table 12a for details. Serum 1-10 are from patients with detectable TRAb levels in the coated tube assay. A calibration curve using K1-70 IgG (0.005, 0.01, 0.05, 0.1, 0.5, 1.0 and 10 µg/mL) was run in each assay. Table 12k Ability of patient sera with TSHR blocking activity to bind to full length wild type TSHR and TSHR Arg255 Asp coated on ELISA plate wells. TSHR260-AP used to detect binding Test sample TSHR260-AP ELISA Wild type TSHR Arg255 Asp TSHR Mean absorbance at 405nm µg/mL IgGa read off M22 IgG calibration Mean absorbance at 405nm µg/mL IgGb read off K1-70 IgG calibration Serum 1 undiluted 0.859 0.30 0.879 0.47 1:10 0.484 0.09 0.202 0.08 1:20 0.284 0.05 NT NT 1:40 0.154 0.02 NT NT 1:50 NT NT 0.027 0.02 1:80 0.078 0.01 NT NT 1:100 NT NT 0.015 0.02 1:160 0.037 0.01 NT NT 1:320 0.021 0.00 NT NT Serum 2 undiluted 0.323 0.05 0.274 0.11 1:10 0.097 0.02 0.021 0.02 1:20 0.052 0.01 NT NT 1:40 0.029 0.00 NT NT 1:50 NT NT 0.005 0.00 1:80 0.015 0.00 NT NT 1:100 NT NT 0.009 0.00 1:160 0.008 0.00 NT NT 1:320 0.007 0.00 NT NT Serum 3 1:10 0.896 0.46 0.510 0.19 1:20 0.588 0.13 NT NT 1:40 0.320 0.06 NT NT 1:50 NT NT 0.056 0.04 1:80 0.168 0.03 NT NT 1:100 NT NT 0.020 0.02 1:160 0.091 0.02 NT NT 1:320 0.041 0.01 NT NT Serum 4 1:10 0.729 0.21 0.639 0.25 1:20 0.612 0.14 NT NT 1:40 0.453 0.08 NT NT 1:50 NT NT 0.107 0.05 1:80 0.270 0.05 NT NT 1:100 NT NT 0.040 0.03 1:160 0.141 0.02 NT NT 1:320 0.068 0.01 NT NT Serum 5 1:10 0.772 0.21 0.536 0.2 1:20 0.652 0.14 NT NT 1:40 0.470 0.08 NT NT 1:50 NT NT 0.114 0.06 1:80 0.291 0.05 NT NT 1:100 NT NT 0.035 0.03 1:160 0.155 0.03 NT NT 1:320 0.077 0.01 NT NT See legend to Table 12a for details. NT = not tested. Serum 1 = K1 lymphocyte donor serum.Serum 2 = patient serum with TSHR blocking autoantibodies.Serum 3 = patient serum with TSHR blocking autoantibodies.Serum 4 = patient serum with TSHR blocking autoantibodies.Serum 5 = patient serum with TSHR blocking autoantibodies. Serum dilutions were made in HBD. aA calibration curve using M22 IgG (0.005, 0.01, 0.05, 0.1, 0.5, 1.0 and 10 µg/mL) was run in each assay. bA calibration curve using K1-70 IgG (0.005, 0.01, 0.05, 0.1, 0.5, 1.0 and 10 µg/mL) was run in each assay.Table 12l Ability of patient sera with TSHR stimulating activity to bind to full length wild type TSHR and TSHR Arg255 Asp coated on ELISA plate wells. TSHR260-AP used to detect binding Test sample TSHR260-AP ELISA Wild type TSHR Arg255 Asp TSHR Mean absorbance at 405nm µg/mL IgGa read off M22 IgG calibration Mean absorbance at 405nm µg/mL IgGb read off K1-70 IgG calibration HBD 0.003 0 -0.01 0 S1 diluted 1:5 0.924 0.31 0.66 0.26 diluted 1:10 0.788 0.18 0.40 0.15 diluted 1:20 0.583 0.10 0.19 0.08 diluted 1:40 0.378 0.05 0.09 0.04 S2 diluted 1:5 0.740 0.17 0.50 0.19 diluted 1:10 0.595 0.10 0.26 0.10 diluted 1:20 0.407 0.06 0.12 0.05 diluted 1:40 0.235 0.03 0.05 0.03 S3 diluted 1:5 0.868 0.25 0.75 0.32 diluted 1:10 0.651 0.12 0.74 0.16 diluted 1:20 0.453 0.06 0.21 0.09 diluted 1:40 0.290 0.04 0.10 0.04 S4 diluted 1:5 0.646 0.11 0.19 0.08 diluted 1:10 0.362 0.05 0.07 0.04 diluted 1:20 0.171 0.02 0.02 0.02 diluted 1:40 0.080 0.01 0.00 0.01 S5 diluted 1:5 0.407 0.06 0.13 0.06 diluted 1:10 0.221 0.03 0.04 0.02 diluted 1:20 0.109 0.01 0.01 0.01 diluted 1:40 0.059 0.01 0.01 0.01 S6 diluted 1:5 0.531 0.08 0.34 0.13 diluted 1:10 0.363 0.05 0.16 0.07 diluted 1:20 0.213 0.03 0.06 0.03 diluted 1:40 0.124 0.02 0.03 0.02 See legend to Table 12a for details. Serum dilutions were made in HBD. Sera S1-S6 are the same sera shown in Table 12e. aA calibration curve using M22 IgG (0.005, 0.01, 0.05, 0.1, 0.5, 1.0 and 10 µg/ml) was run in each assay. bA calibration curve using K1-70 IgG (0.005, 0.01, 0.05, 0.1, 0.5, 1.0 and 10 µg/mL) was run in each assay. Table 13a Summary of stimulating MAb K1-18 (IgG1 kappa) properties TSHR binding affinity IgG 0.7 x 10¹⁰ L/mol Fab 0.13 x 10¹⁰ L/mol Inhibition of 125I-TSH binding to the TSHR IgG (1 µg/mL) 94% Table 1a 181 units/mg (NIBSC 90/672) Table 2b Fab (1 µg/mL) 77% Table 2a 86 units/mg (NIBSC 90/672) Table 2b Inhibition of TSH-biotin binding to the TSHR IgG (1 µg/mL) 96% Table 3a Fab (1 µg/mL) 93% Table 3b Inhibition of M22 Fab peroxidase binding to the TSHR IgG (1 µg/mL) 95% Table 4a Fab (1 µg/mL) 88% Table 4b Stimulation of cyclic AMP in CHO cells expressing TSHR IgG (100 ng/mL) 40x basal Table 6a 155 units/mg (NIBSC 90/672) Table 6c Fab (100 ng/mL) 35x basal Table 6a 22 units/mg (NIBSC 90/672) Table 6c Binding to TSHR 260-AP IgG (1 µg/mL) OD405 = 0.578 Table 12a V regions Heavy chain (IgG1) VH5-51*01 Figure 3a andFigure 3c D3-16*02 (D3-16*01) J3*02 Light chain (kappa) V3-20*01 Figure 4a andFigure 4c JK-1*01 Table 13b Summary of blocking MAb K1-70 (IgG1 lambda) properties TSHR binding affinity IgG 3.9 ± 0.8 x 10¹⁰ L/mol Inhibition of 125I-TSH binding to the TSHR IgG (1 µg/mL) 92% Table 1b and Table 2c 166 units/mg (NIBSC 90/672) Fab (1 µg/mL) 92% Table 1b Inhibition of TSH-biotin binding to the TSHR IgG (1 µg/mL) 97% Table 3d Table 3d Fab (1 µg/mL) 97% Table 3d Inhibition of M22 Fab peroxidase binding to the TSHR IgG (1 µg/mL) 96% Table 4c Fab (1 µg/mL) 96% Table 4c Blocking TSH mediated cyclic AMP stimulation in CHO cells expressing TSHR IgG (1 µg/mL) 94% Table 7b Fab (1 µg/mL) 94% Table 7b Binding to TSHR 260-AP IgG (1 µg/mL) OD405 = 0.677 Table 12a V regions Heavy chain (IgG1) VH5-51*01 Figure 5a andFigure 5c D1-7*01 J4*02 Light chain (lambda) LV1-51*01 Figure 6c LJ7*01 Table 14a Cyclic AMP production in CHO cells expressing wild type TSHR and TSHR with Asp43 mutated to Ala. Effect of different dilutions of human monoclonal antibody to the TSHR (K1-18) with TSH aaonist activity Cyclic AMP produced (pmol/mL) mean ±SD (n = 3) Wild type TSHR Mutated TSHR Mutated/Wild type (%) Cyclic AMP assay buffer 2.52 ±0.23 2.60 ±0.33 103 K1-18 0.3 ng/mL 3.84 ±0.42 3.35 ±0.20 87 1 ng/mL 7.35 ±0.07 5.53 ±0.15 75 3 ng/mL 17.04 ±0.62 11.59±0.42 68 10 ng/mL 37.74 ±0.67 26.69 ±1.57 71 30 nq/mL 51.46 ±2.52 40.80 ±0.74 79 100 ng/mL 57.08 ±4.79 48.50 ±4.25 85 TSH 0.01 ng/mL 2.85 ±0.08 2.84 ±0.14 100 0.03 ng/mL 3.81 ±0.06 4.30 ±0.10 113 0.1 ng/mL 8.70 ±0.49 10.35 ±2.47 119 0.3 nq/mL 22.78 ±1.49 19.69 ±1.60 86 1 ng/mL 46.09 ±0.00 39.56 ±0.31 86 3 ng/mL 54.16 ±3.56 47.87 ±0.09 88 Results shown are mean ±SD of triplicate determinations. Test samples diluted in hypotonic cyclic AMP assay buffer. Table 14b Cyclic AMP production in CHO cells expressing wild type TSHR and TSHR with Ile60 mutated to Ala. Effect of different dilutions of human monoclonal antibody to the TSHR (K1-18) with TSH agonist activity Cyclic AMP produced (pmol/mL) mean ±SD (n = 3) Wild type TSHR Mutated TSHR Mutated/Wild type (%) Cyclic AMP assay buffer 1.00 ±0.09 5.02 ±1.03 502 K1-18 0.3 ng/mL 2.58 ±0.33 7.76 ±0.36 301 1 ng/mL 5.33 ±0.59 10.94 ±0.61 205 3 ng/mL 12.64 ±2.43 23.29 ±1.42 184 10 ng/mL 51.08 ±11.46 44.53 ±4.03 87 30 ng/mL 69.95 ±3.59 57.58 ±2.07 82 100 ng/mL 87.39 ±6.54 67.02 ±4.87 77 TSH 0.01 ng/mL 1.51 ±0.49 5.40 ±0.84 358 0.03 ng/mL 3.34 ±1.14 5.93 ±0.56 178 0.1 ng/mL 5.58 ±2.31 11.24 ±1.18 201 0.3 ng/mL 29.97 ±6.61 28.85 ±1.39 96 1 ng/mL 64.61 ±4.81 49.65 ±5.10 77 3 ng/mL 73.22 ±4.70 60.45 ±7.70 83 See legend to Table 14a for details. Table 14c Cyclic AMP production in CHO cells expressing wild type TSHR and TSHR with Glu61 mutated to Ala. Effect of different dilutions of human monoclonal antibody to the TSHR (K1-18) with TSH agonist activity Cyclic AMP produced (pmol/mL) mean ±SD (n = 3) Wild type TSHR Mutated TSHR Mutated/Wild type (%) Cyclic AMP assay buffer 1.47 ±0.15 5.22 ±0.71 355 K1-18 0.3 ng/mL 1.79 ±0.19 6.02 ±0.33 336 1 ng/mL 3.68 ±0.26 8.45 ±0.76 230 3 ng/mL 9.15 ±0.43 15.04 ±1.69 164 10 ng/mL 32.03 ±0.84 34.30 ±1.21 107 30 ng/mL 63.25 ±0.99 55.51 ±6.57 88 100 ng/mL 73.14 ±1.81 81.13 ±7.20 111 TSH 0.01 ng/mL 1.09 ±0.28 5.12 ±0.48 470 0.03 ng/mL 1.75 ±0.06 6.46 ±0.67 369 0.1 ng/mL 2.91 ±0.16 7.88 ±0.56 271 0.3 ng/mL 7.29 ±0.10 13.74 ±0.45 188 1 ng/mL 26.58 ±1.60 34.30 ±1.21 129 3 ng/mL 57.99 ±3.45 63.63 ±5.01 110 See legend to Table 14a for details. Table 14d Cyclic AMP production in CHO cells expressing wild type TSHR and TSHR with Thr104 mutated to Ala. Effect of different dilutions of human monoclonal antibody to the TSHR (K1-18) with TSH agonist activity Cyclic AMP produced (pmol/mL) mean ±SD (n = 3) Experiment 1 Wild type TSHR Mutated TSHR Mutated/Wild type (%) Cyclic AMP assay buffer 1.34 ±0.29 3.56 ±0.24 266 K1-18 0.3 ng/mL 2.95 ±0.47 4.64 ±0.14 157 1 ng/mL 6.14 ±0.36 7.38 ±0.38 120 3 ng/mL 14.80 ±1.02 14.53 ±1.12 98 10 ng/mL 39.45 ±12.99 21.62 ±16.74 55 30 ng/mL 68.16 ±7.99 35.85 ±26.65 53 100 ng/mL 83.92 ±10.03 62.56 ±6.94 75 TSH 0.01 ng/mL 1.37 ±0.21 2.58 ±0.21 188 0.03 ng/mL 1.58 ±0.10 3.20 ±0.60 203 0.1 ng/mL 1.83 ±0.88 3.64 ±0.19 199 0.3 ng/mL 3.20** 5.38 ±0.07 168 1 ng/mL 15.90 ±0.95 15.80 ±0.41 99 3 ng/mL 47.64 ±6.10 34.47 ±1.54 72 Experiment 2 Cyclic AMP assay buffer 1.04 ±0.26 3.70 ±0.49 356 K1-18 0.3 ng/mL 4.94 ±0.29 6.65 ±0.23 135 1 ng/mL 9.47 ±0.98 10.37 ±1.18 110 3 ng/mL 26.53 ±2.22 21.47 ±3.41 81 10 ng/mL 54.89 ±1.67 38.87 ±3.69 71 30 ng/mL 79.51 ±5.35 50.95 ±3.65 64 100 ng/mL 78.3 ±6.52 64.82 ±5.61 83 TSH 0.01 ng/mL 2.10 ±0.39 4.28 ±0.18 204 0.03 ng/mL 4.48 ±0.53 5.71 ±0.77 127 0.1 ng/mL 10.27 ±1.87 9.80 ±0.53 95 0.3 ng/mL 35.72 ±5.54 35.74 ±1.21 100 1 ng/mL 71.99 ±7.40 57.09 ±2.53 79 3 ng/mL 79.18 ±6.82 58.46 ±0.86 74 See legend to Table 14a for details. **single determination. Table 14e Cyclic AMP production in CHO cells expressing wild type TSHR and TSHR with His105 mutated to Ala. Effect of different dilutions of human monoclonal antibody to the TSHR (K1-18) with TSH agonist activity Cyclic AMP produced (pmol/mL) mean ±SD (n = 3) Wild type TSHR Mutated TSHR Mutated/Wild type (%) Cyclic AMP assay buffer 2.02 ±0.26 3.51 ±0.31 173 K1-18 0.3 ng/mL 2.51 ±0.14 3.91 ±0.29 156 1 ng/mL 4.59 ±0.48 4.99 ±0.14 109 3 ng/mL 9.26 ±0.49 10.42 ±0.32 113 10 ng/mL 39.21 ±2.49 27.25 ±0.37 69 30 ng/mL 69.70 ±5.97 51.22 ±4.24 73 100 ng/mL 99.18 ±3.63 78.03 ±4.40 79 TSH 0.01 nq/mL 1.56 ±0.28 4.80 ±2.60 308 0.03 ng/mL 2.42 ±0.39 3.55 ±0.20 147 0.1 ng/mL 4.09 ±0.79 4.82±0.29 118 0.3 ng/mL 11.44 ±2.32 11.88 ±2.77 104 1 ng/ml 45.62 ±1.99 34.56 ±1.21 76 3 ng/mL 77.89 ±8.17 58.28 ±4.66 75 See legend to Table 14a for details. Table 14f Cyclic AMP production in CHO cells expressing wild type TSHR and TSHR with Asp151 mutated to Ala. Effect of different dilutions of human monoclonal antibody to the TSHR (K1-18) with TSH agonist activity Cyclic AMP produced (pmol/mL) mean ±SD (n = 3) Wild type TSHR Mutated TSHR Mutated/Wild type (%) Cyclic AMP assay buffer 1.90 ±0.61 5.93 ±0.60 312 K1.18 0.3 ng/mL 4.01 ±0.43 7.36 ±0.35 184 1 ng/mL 9.64 ±0.27 11.42 ±2.31 118 3 ng/mL 20.53 ±1.64 18.27 ±0.51 89 10 ng/mL 54.20 ±1.61 40.81 ±7.12 75 30 ng/mL 81.74 ±5.92 51.20 ±5.41 63 100 ng/mL 79.82 ±4.86 66.01 ±5.14 83 TSH 0.01 ng/mL 2.96 ±0.26 6.19±0.36 209 0.03 ng/mL 5.36 ±0.60 7.99 ±1.12 149 0.1 ng/mL 14.33 ±1.46 14.12 ±0.67 99 0.3 ng/mL 43.55 ±6.31 35.02 ±4.18 80 1 ng/mL 73.50 ±9.55 48.53 ±6.40 66 3 ng/mL 80.67 ±3.49 54.55 ±3.53 68 See legend to Table 14a for details. Table 14g Cyclic AMP production in CHO cells expressing wild type TSHR and TSHR with Glut 57 mutated to Ala. Effect of different dilutions of human monoclonal antibody to the TSHR (K1-18) with TSH agonist activityCyclic AMP produced (pmol/mL) mean ±SD (n = 3) Wild type TSHR Mutated TSHR Mutated/Wild type (%) Cyclic AMP assay buffer 1.89 ±0.08 9.18 ±0.08 485 K1-18 0.3 ng/mL 3.77 ±0.18 11.44 ±3.63 303 1 ng/mL 7.52 ±0.26 9.76 ±0.93 130 3 ng/mL 19.14 ±0.40 9.31 ±0.91 49 10 ng/mL 45.88 ±1.10 14.37 ±6.84 31 30 ng/mL 56.81 ±5.21 11.01 ±3.30 19 100 ng/mL 64.73 ±5.17 9.39 ±2.46 15 TSH 0.01 ng/mL 2.55 ±0.32 11.48 ±1.63 450 0.03 ng/mL 3.56 ±0.17 11.67 ±1.56 328 0.1ng/mL 8.19 ±0.96 13.43 ±1.26 164 0.3 ng/mL 21.83 ±0.73 25.78 ±4.64 118 1 ng/mL 46.44 ±3.10 40.14 ±1.60 86 3 ng/mL 52.73 ±2.18 60.81 ±5.71 115 See legend to Table 14a for details. Table 14h Cyclic AMP production in CHO cells expressing wild type TSHR and TSHR with Glu178 mutated to Ala. Effect of different dilutions of human monoclonal antibody to the TSHR (K1-18) with TSH agonist activity Cyclic AMP produced (pmol/mL) mean ±SD (n = 3) Wild type TSHR Mutated TSHR Mutated/Wild type (%) Cyclic AMP assay buffer 1.39 ±0.21 9.71 ±0.36 699 K1.18 0.3 ng/mL 3.10 ±0.45 10.89 ±0.67 351 1 ng/mL 7.67 ±0.57 13.37 ±0.56 174 3 ng/mL 19.48 ±2.03 20.66* 106 10 ng/mL 56.35 ±2.84 40.02* 71 30 ng/mL 72.19 ±2.66 46.23 ±1.87 64 100 ng/mL 77.30 ±4.83 61.85 ±3.91 80 TSH 0.01 ng/mL 1.99 ±0.11 9.29 ±1.00 467 0.03 ng/mL 4.84 ±0.30 11.60 ±0.21 240 0.1 ng/mL 12.93 ±0.64 14.83 ±2.25 115 0.3 ng/mL 47.70 ±4.82 33.72 ±3.43 71 1 ng/mL 79.36 ±7.46 43.12 ±1.05 54 3 ng/mL 74.89 ±8.91 54.84 ±4.58 73 See legend to Table 14a for details. *mean of duplicate. Table 14i Cyclic AMP production in CHO cells expressing wild type TSHR and TSHR with Lys183 mutated to Asp. Effect of different dilutions of human monoclonal antibody to the TSHR (K1-18) with TSH agonist activity Cyclic AMP produced (pmol/mL) mean ±SD (n = 3) Wild type TSHR Mutated TSHR Mutated/Wild type (%) Cyclic AMP assay buffer 2.23 ±0.06 2.51 ±0.63 113 K1-18 0.3 ng/mL 4.15 ±0.47 2.40 ±0.34 58 1 ng/mL 8.37 ±2.15 2.20 ±0.54 26 3 ng/mL 18.71 ±2.79 3.05 ±0.46 16 10 ng/mL 54.30 ±2.14 2.35 ±0.77 4 30 ng/mL 89.01 ±13.58 2.24 ±0.79 3 100 ng/mL 109.78 ±16.33 2.30 ±0.72 2 TSH 0.01 ng/mL 2.48 ±0.32 4.08 ±1.06 165 0.03 ng/mL 4.62 ±0.25 7.18 ±0.78 155 0.1 ng/mL 17.59 ±8.60 19.10 ±3.55 109 0.3 ng/mL 40.35 ±5.38 51.68 ±4.48 128 1 ng/mL 92.49 ±2.61 93.34 ±4.90 101 3 ng/mL 103.97 ±13.32 106.27 ±8.71 102 See legend to Table 14a for details. Table 14j Cyclic AMP production in CHO cells expressing wild type TSHR and TSHR with Tyr185 mutated to Ala. Effect of different dilutions of human monoclonal antibody to the TSHR (K1-18) with TSH. agonist activity Cyclic AMP produced (pmol/mL) mean ±SD (n = 3) Experiment 1 Wild type TSHR Mutated TSHR Mutated/Wild type (%) Cyclic AMP assay buffer 2.04 ±0.15 3.02 ±0.58 148 K1-18 (ng/mL) 0.3 ng/mL 3.69 ±0.22 2.68 ±0.19 73 1 ng/mL 7.76 ±1.36 2.95 ±0.51 38 3 ng/mL 22.97 ±1.30 2.31 ±0.50 10 10 ng/mL 55.05 ±5.19 3.21 ±0.80 6 30 ng/mL 97.56 ±6.65 4.58 ±0.63 5 100 ng/mL 120.10 ±15.75 5.57 ±1.20 5 TSH (ng/mL) 0.01 ng/mL 2.60 ±0.30 3.33 ±0.81 128 0.03 ng/ml 4.27 ±0.38 3.85 ±0.37 90 0.1 ng/ml 10.94 ±1.68 8.36 ±0.98 76 0.3 ng/mL 32.33 ±2.26 21.15 ±3.60 65 1 ng/mL 84.95 ±2.47 37.84 ±1.45 45 3 ng/mL 124.05 ±7.70 42.9 ±5.23 35 Experiment 2 Cyclic AMP assay buffer 2.15 ±0.04 4.23 ±0.89 197 K1-18 (ng/mL) 0.3 ng/mL 7.38±0.53 4.33 ±0.20 59 1 ng/mL 7.51 ±1.67 4.39 ±0.45 58 3 ng/mL 28.12 ±0.86 4.10 ±0.68 15 10 ng/mL 50.76 ±7.00 4.38 ±1.82 9 30 ng/mL 89.92 ±4.11 3.90 ±1.06 4 100 ng/mL 105.22 ±5.18 7.08 ±0.31 7 TSH (ng/mL) 0.01 ng/mL 3.89 ±0.51 3.82 ±0.64 98 0.03 ng/mL 5.52 ±0.31 5.60±1.20 101 0.1 ng/mL 13.28 ±0.63 12.32 ±0.57 93 0.3 ng/mL 35.35 ±2.72 30.54 ±3.00 86 1 ng/mL 82.08 ±4.80 50.65 ±1.32 62 3 ng/mL 91.67 ±10.28 56.30 ±6.87 61 See legend to Table 14a for details. Table 14k Cyclic AMP production in CHO cells expressing wild type TSHR and TSHR with Tyr206 mutated to Ala. Effect of different dilutions of human monoclonal antibody to the TSHR (K1-18) with TSH agonist activity Cyclic AMP produced (pmol/mL) mean ±SD (n=3) Experiment 1 Wild type TSHR Mutated TSHR Mutated/Wild type (%) Cyclic AMP assay buffer 1.50 ±0.27 2.47 ±0.13 165 K1.18 0.3 ng/mL 1.19 ±1.22 2.68 ±0.23 225 1 ng/mL 6.57 ±0.16 3.11 ±0.24 47 3 ng/mL 16.50 ±1.42 1.75 ±0.81 11 10 ng/mL 31.40 ±14.65 8.14 ±2.38 26 30 ng/mL 62.92 ±1.83 15.07 ±1.02 24 100 ng/mL 61.48 ±14.14 20.32 ±12.27 33 TSH 0.01 ng/mL 2.09 ±0.51 1.74 ±1.50 83 0.03 ng/mL 2.93 ±0.48 3.64 ±0.84 124 0.1 ng/mL 9.04 ±0.73 8.40 ±0.72 93 0.3 ng/mL 19.08 ±12.79 19.83 ±6.50 104 1 ng/mL 59.48 ±1.26 38.98 ±1.84 66 3 ng/mL 75.64 ±2.36 46.68 ±2.01 62 Experiment 2 Cyclic AMP assay buffer 1.96 ±0.19 4.35 ±0.24 222 K1-18 0.3 ng/mL 5.09 ±1.70 4.50 ±0.37 88 1 ng/mL 7.69 ±1.28 6.23 ±0.55 81 3 ng/mL 18.47 ±1.00 8.07 ±0.28 44 10 ng/mL 55.94 ±8.77 22.41 ±2.17 40 30 ng/mL 69.92 ±4.84 33.57 ±1.65 48 100 ng/mL 85.46 ±15.91 45.40 ±3.53 53 TSH 0.01 ng/ml 3.63 ±1.30 4.90 ±1.14 135 0.03 ng/ml 4.60 ±0.31 6.64 ±0.51 144 0.1 ng/mL 10.82 ±0.50 19.25 ±5.14 178 0.3 ng/mL 34.70 ±5.34 38.33 ±1.28 110 1 ng/mL 65.17 ±6.68 60.87 ±6.66 93 3 ng/mL 75.13 ±8.64 73.06 ±3.01 97 See legend to Table 14a for details. Table 14l Cyclic AMP production in CHO cells expressing wild type TSHR and TSHR with Lys209 mutated to Ala. Effect of different dilutions of human monoclonal antibody to the TSHR (K1-18) with TSH agonist activity Cyclic AMP produced (pmol/mL) mean ±SD (n = 3) Wild type TSHR Mutated TSHR Mutated/Wild type (%) Cyclic AMP assay buffer 1.97 ±0.24 4.79 ±0.77 243 K1-18 0.3 ng/mL 4.08 ±0.19 5.52 ±0.33 135 1 ng/mL 9.47 ±0.42 8.07 ±0.57 85 3 ng/mL 21.43 ±1.03 12.65 ±1.18 59 10 ng/mL 62.15 ±8.08 32.55 ±4.45 52 30 ng/mL 91.57 ±5.64 43.71 ±9.76 48 100 ng/mL 99.88 ±10.13 69.49 ±7.10 70 TSH 0.01 ng/mL 3.02 ±0.62 5.16 ±0.11 171 0.03 ng/mL 4.59 ±0.54 5.87 ±0.17 128 0.1 ng/mL 14.25 ±1.09 9.27 ±0.81 65 0.3 ng/mL 38.20 ±6.84 24.27 ±1.60 64 1 ng/mL 87.25 ±1.51 39.31 ±5.78 45 3 ng/mL 101.72 ±11.82 63.25 ±6.11 62 See legend to Table 14a for details. Table 14m Cyclic AMP production in CHO cells expressing wild type TSHR and TSHR with Asp232 mutated to Ala. Effect of different dilutions of human monoclonal antibody to the TSHR (K1-18) with TSH agonist activity Cyclic AMP produced (µmol/mL) mean ±SD (n = 3) Experiment 1 Wild type TSHR Mutated TSHR Mutated/Wild type (%) Cyclic AMP assay buffer 2.02 ±0.09 1.33 ±0.21 66 K1-18 0.3 ng/mL 2.54 ±0.06 0.99 ±0.10 39 1 ng/mL 6.16 ±0.44 1.31 ±0.05 21 3 ng/mL 14.61 ±0.83 1.80 ±0.36 12 10 ng/mL 38.90 ±1.79 3.61 ±0.02 9 30 ng/mL 60.13 ±3.16 8.21 ±0.04 14 100 ng/mL 65.85 ±1.99 16.17 ±0.08 25 TSH 0.01 ng/mL 1.69 ±0.21 1.40 ±0.08 83 0.03 ng/mL 2.46 ±0.20 2.16 ±0.13 88 0.1 ng/mL 6.18 ±0.69 5.39 ±0.28 87 0.3 ng/mL 18.94 ±0.29 15.11 ±0.50 80 1 ng/mL 45.19 ±3.19 31.85 ±1.24 70 3 ng/mL 61.65 ±5.29 40.95 ±2.42 66 Experiment 2 Cyclic AMP assay buffer 1.74 ±1.29 2.80 ±0.16 161 K1-18 0.3 ng/mL 4.93 ±0.61 2.86±0.15 58 1 ng/ml 8.65 ±0.84 3.53 ±0.52 41 3 ng/mL 21.61 ±0.47 4.78 ±0.27 22 10 ng/mL 54.40 ±0.93 1.76 ±0.18 3 30 ng/ml 86.44 ±6.25 3.79 ±0.17 4 100 ng/mL 99.65 ±10.16 6.49 ±0.05 7 TSH 0.01 ng/mL 4.16 ±1.96 2.58 ±0.09 62 0.03 ng/mL 4.92 ±0.92 4.10 ±0.23 83 0.1 ng/mL 11.24 ±1.01 9.44 ±0.60 84 0.3 ng/mL 31.44 ±1.09 23.47 ±1.51 75 1 ng/mL 74.30 ±2.40 44.35 ±1.57 60 3 ng/mL 96.39±4.85 62.02 ±8.15 64 See legend to Table 14a for details. Table 14n Cyclic AMP production in CHO cells expressing wild type TSHR and TSHR with Gln235 mutated to Ala. Effect of different dilutions of human monoclonal antibody to the TSHR (K1-18) with TSH agonist activity Cyclic AMP produced (pmol/mL) mean ±SD (n = 3) Experiment 1 Wild type TSHR Mutated TSHR Mutated/Wild type (%) Cyclic AMP assay buffer 0.70 ±0.09 1.98 ±0.62 283 K1-18 0.3 ng/mL 1.80 ±0.35 2.51 ±0.43 139 1 ng/mL 4.34 ±0.52 4.48 ±0.64 103 3 ng/mL 9.25 ±2.14 6.01 ±1.95 65 10 ng/mL 33.66 ±5.21 18.80 ±1.99 56 30 ng/mL 79.70 ±7.46 30.92 ±2.83 39 100 ng/mL 74.66 ±3.56 47.71 ±1.54 64 TSH 0.01 ng/mL 1.09 ±0.35 1.75 ±0.00 161 0.03 ng/mL 2.31 ±0.17 2.89 ±0.03 125 0.1 ng/mL 6.54 ±0.20 5.97 ±1.62 91 0.3 ng/mL 26.48 ±0.68 17.61 ±0.48 67 1 ng/mL 67.72 ±7.23 44.19 ±18.05 65 3 ng/mL 83.50* 46.59 ±8.21 56 Experiment 2 Cyclic AMP assay buffer 1.85 ±0.32 4.10 ±0.42 222 K1-18 0.3 ng/mL 2.58 ±0.21 4.27 ±1.53 166 1 ng/mL 5.15 ±0.85 7.30 ±0.74 142 3 ng/mL 14.11 ±0.27 12.33 ±3.43 87 10 ng/mL 32.68 ±5.49 24.02 ±3.07 74 30 ng/mL 58.74 ±1.82 32.71 ±2.05 56 100 ng/mL 66.70 ±2.49 43.93 ±0.41 66 TSH 0.01 ng/mL 1.9.3 ±0.13 3.42 ±0.30 177 0.03 ng/mL 2.75 ±0.41 4.55 ±0.24 165 0.1 ng/mL 7.25 ±1.02 7.77 ±1.16 107 0.3 ng/mL 25.26 ±0.96 17.14 ±0.56 68 1 ng/mL 50.96 ±2.69 31.70 ±1.10 62 3 ng/mL 69.68 ±2.04 37.14 ±1.16 53 See legend to Table 14a for details. *mean of duplicate. Table 14o Cyclic AMP production in CHO cells expressing wild type TSHR and TSHR with Lys250 mutated to Ala. Effect of different dilutions of human monoclonal antibody to the TSHR (K1-18) with TSH agonist activity Cyclic AMP produced (pmol/mL) mean ±SD (n = 3) Wild type TSHR Mutated TSHR Mutated/Wild type (%) Cyclic AMP assay buffer 1.41 ±0.87 6.48 ±0.22 460 K1-18 0.3 ng/mL 3.20 ±0.31 10.50 ±0.55 328 1 ng/mL 8.57 ±0.31 23.44 ±6.81 274 3 ng/mL 27.68 ±3.34 35.88 ±0.55 130 10 ng/mL 54.04 ±4.74 68.33 ±5.39 126 30 ng/mL 85.58 ±3.88 91.29 ±2.75 107 100 ng/mL 81.79 ±1.55 100.62 ±8.66 123 TSH 0.01 ng/mL 4.00 ±0.10 8.29 ±0.69 207 0.03 ng/mL 6.66 ±0.59 12.58 ±0.44 189 0.1 ng/mL 19.66 ±2.56 28.81 ±3.56 147 0.3 ng/mL 44.98 ±3.85 66.19 ±0.67 147 1 ng/mL 75.67 ±6.21 87.90 ±5.38 116 3 ng/mL 87.19 ±1.94 110.23 ±9.68 126 See legend to Table 14a for details. Table 14p Cyclic AMP production in CHO cells expressing wild type TSHR and TSHR with Glu251 mutated to Ala. Effect of different dilutions of human monoclonal antibody to the TSHR (K1-18) with TSH agonist activity Cyclic AMP produced (pmol/mL) mean ±SD (n = 3) Wild type TSHR Mutated TSHR Mutated/Wild type (%) Cyclic AMP assay buffer 1.22 ±0.42 6.69 ±2.73 548 K1-18 0.3 ng/mL 2.36 ±0.37 6.85 ±0.56 290 1 ng/mL 6.40 ±0.43 9.70 ±1.01 152 3 ng/mL 19.16 ±1.47 19.57 ±1.63 102 10 ng/mL 55.42 ±4.77 39.70 ±4.02 72 30 ng/mL 84.02* 66.74 ±3.34 79 100 ng/mL 111.09 ±6.17 78.15 ±0.89 70 TSH 0.01 ng/mL 1.64 ±0.28 3.99 ±0.94 243 0.03 ng/mL 2.67 ±0.32 5.99 ±2.43 224 0.1 ng/mL 9.75 ±1.97 11.18 ±1.33 115 0.3 ng/mL 33.26 ±9.03 22.15 ±3.42 67 1 ng/mL 77.73 ±4.07 53.68 ±1.90 69 3 ng/mL 109.36 ±2.78 71.71* 66 See legend to Table 14a for details. *mean of duplicate. Table 14q Cyclic AMP production in CHO cells expressing wild type TSHR and TSHR with Arg255 mutated to Ala. Effect of different dilutions of human monoclonal antibody to the TSHR (K1-18) with TSH agonist activity Cyclic AMP produced (pmol/mL) mean ±SD (n = 3) Wild type TSHR Mutated TSHR Mutated/Wild type (%) Cyclic AMP assay buffer 2.29 ±1.04 4.37 ±0.75 191 K1-18 0.3 ng/mL 4.64 ±0.55 5.46 ±0.19 118 1 ng/mL 8.87 ±0.31 8.37 ±0.20 94 3 ng/mL 18.48 ±0.81 13.80 ±1.77 75 10 ng/mL 55.33 ±0.69 42.85 ±1.72 77 30 ng/mL 73.94 ±4.06 59.25 ±2.70 80 100 ng/mL 79.57 ±6.78 77.80 ±4.90 98 TSH 0.01 ng/mL 2.94 ±0.54 4.72 ±0.33 161 0.03 ng/mL 4.82 ±0.70 6.78 ±0.49 141 0.1 ng/mL 9.25 ±0.11 11.66 ±0.75 126 0.3 ng/mL 36.20 ±3.81 36.72 ±3.56 101 1 ng/mL 69.17 ±5.01 61.95 ±3.97 90 3 ng/mL 88.05* 80.08 ±0.72 91 See legend to Table 14a for details. *mean of duplicate. Table 14r Cyclic AMP production in CHO cells expressing wild type TSHR and TSHR with Thr257 mutated to Ala. Effect of different dilutions of human monoclonal antibody to the TSHR (K1-18) with TSH agonist activity Cyclic AMP produced (pmol/mL) mean ±SD (n = 3) Wild type TSHR Mutated TSHR Mutated/Wild type (%) Cyclic AMP assay buffer 1.01 ±0.34 1.13 ±0.45 112 K1-18 0.3 ng/mL 1.50 ±0.68 1.54 ±0.29 103 1 ng/mL 3.60 ±0.36 2.69 ±1.11 75 3 ng/mL 8.09 ±0.45 7.13 ±0.88 88 10 ng/mL 27.52 ±3.28 20.22 ±1.90 73 30 ng/mL 64.52 ±1.71 39.26 ±3.48 61 100 ng/mL 100.30 ±2.04 81.11 ±5.12 81 TSH 0.01 ng/mL 1.67 ±0.27 1.50 ±0.29 90 0.03 ng/mL 3.13 ±0.68 2.92 ±0.45 93 0.1 ng/mL 8.30 ±0.37 7.65 ±1.51 92 0.3 ng/mL 24.05 ±2.75 25.30 ±0.41 105 1 ng/mL 64.57 ±3.16 60.69 ±3.98 94 3 ng/mL 102.12 ±9.89 88.24 ±12.78 86 See legend to Table 14a for detaits. Table 14s Cyclic AMP production in CHO cells expressing wild type TSHR and TSHR with Trp258 mutated to Ala. Effect of different dilutions of human monoclonal antibody to the TSHR (K1-18) with TSH agonist activity Cyclic AMP produced (pmol/mL) mean ±SD (n = 3) Experiment 1 Wild type Mutated TSHR Mutated/Wild type (%) Cyclic AMP assay buffer 0.90 ±0.08 2.05 ±0.38 228 K1-18 0.3ng/mL 2.29 ±0.25 2.93 ±0.39 128 1 ng/mL 5.47 ±0.90 4.39 ±0.24 80 3 ng/mL 15.27 ±1.02 11.47 ±0.72 75 10 ng/mL 45.65 ±2.67 25.35 ±2.59 56 30 ng/mL 70.22 ±8.09 40.36 ±0.00 57 100 ng/mL 77.74 ±5.05 52.44 ±4.72 67 TSH 0.01 ng/mL 1.22 ±0.34 1.93 ±0.24 158 0.03 ng/mL 1.85 ±0.62 2.88 ±0.09 156 0.1 ng/mL 4.89 ±0.35 7.51 ±1.57 154 0.3 ng/mL 17.37 ±0.87 22.29 ±3.45 128 1 ng/mL 52.88 ±6.38 45.69 ±7.63 86 3 ng/mL 70.63 ±3.87 53.97 ±3.81 76 Experiment 2 Cyclic AMP assay buffer 1.45 ±0.28 0.92 ±0.21 63 K1-18 0.3 ng/mL 1.68 ±0.21 1.53 ±0.31 91 1 ng/mL 5.21±0.29 3.29 ±0.75 63 3 ng/mL 15.99 ±1.07 6.25 ±0.22 39 10 ng/mL 41.40 ±4.90 15.64 ±0.90 38 30 ng/mL 77.09 ±1.32 38.59 ±1.52 50 100 ng/mL 106.57 ±3.64 57.31 ±2.41 54 TSH 0.01 ng/mL 2.02 ±0.51 1.56 ±0.18 77 0.03 ng/mL 1.96 ±0.06 2.76 ±0.71 141 0.1 ng/mL 4.49 ±0.81 7.04 ±0.83 156 0.3 ng/mL 13.47 ±1.96 17.26 ±4.12 128 1 ng/ml 43.24 ±1.20 49.17 ±5.52 114 3 ng/mL 84.76 ±9.98 84.70* 100 See legend to Table 14a for details. *mean of duplicate. Table 14t Cyclic AMP production in CHO cells expressing wild type TSHR and TSHR with Arg274 mutated to Ala. Effect of different dilutions of human monoclonal antibody to the TSHR (K1-18) with TSH agonist activity Cyclic AMP produced (pmol/mL) mean ±SD (n = 3) Experiment 1 Wild type TSHR Mutated TSHR Mutated/Wild type (%) Cyclic AMP assay buffer 1.58 ±0.21 1.71 ±0.07 108 K1-18 0.3 ng/mL 1.75 ±0.14 1.74 ±0.17 99 1 ng/mL 3.17 ±0.20 1.97 ±0.82 62 3 ng/mL 10.91 ±1.52 3.46 ±0.07 32 10 ng/mL 28.17 ±2.38 9.44±0.80 34 30 ng/mL 71.50 ±3.54 27.91 ±1.72 39 100 ng/mL 96.37 ±4.71 70.48 ±5.61 73 TSH 0.01 ng/mL 1.86 ±0.23 1.97 ±0.06 106 0.03 ng/mL 3.32 ±0.07 4.14 ±1.36 125 0.1 ng/mL 14.60 ±1.90 9.38 ±0.23 64 0.3 ng/mL 48.54 ±4.12 27.28 ±1.62 56 1 ng/mL 91.18 ±4.31 67.63 ±0.93 74 3 ng/mL 118.63 ±16.76 98.80 ±7.10 83 Experiment 2 Cyclic AMP assay buffer 2.08 ±0.14 1.65 ±0.12 79 K1-18 0.3 ng/mL 2.70 ±0.08 1.71 ±0.13 63 1 ng/mL 5.96 ±0.25 2.65 ±0.20 44 3 ng/mL 14.95 ±0 5.45 ±0.28 36 10 ng/mL 51.80 ±4.35 14.83 ±1.86 29 30 ng/mL 81.16 ±2.80 35.53 ±0.93 44 100 ng/mL 97.09 ±10.91 60.73 ±3.26 63 TSH 0.01 ng/mL 2.49 ±0.39 1.37 ±0.18 55 0.03 ng/mL 5.12 ±0.22 2.94 ±0.11 57 0.1 ng/mL 13.66 ±1.00 8.29 ±0.74 61 0.3 ng/mL 39.93 ±2.47 25.47 ±0.43 64 1 ng/mL 74.35 ±5.04 58.49 ±4.84 79 3 ng/mL 88.28 ±15.49 73.19 ±3.18 82 See legend to Table 14a for details. Table 14u Cyclic AMP production in CHO cells expressing wild type TSHR and TSHR with Asp276 mutated to Ala. Effect of different dilutions of human monoclonal antibody to the TSHR (K1-18) with TSH agonist activity Cyclic AMP produced (pmol/mL) mean ±SD (n = 3) Wild type TSHR Mutated TSHR Mutated/Wild type (%) Cyclic AMP assay buffer 1.05 ±0.23 13.94 ±2.05 1328 K1-18 0.3 ng/mL 2.27 ±0.23 17.17 ±0.64 756 1 ng/mL 6.16 ±0.90 23.79 ±1.67 386 3 ng/mL 17.36 ±0.80 32.67 ±3.05 188 10 ng/mL 52.57 ±0 56.94 ±0.50 108 30 ng/mL 81.08 ±11.47 65.05 ±4.25 80 100 ng/mL 87.81 ±14.82 86.02 ±6.77 98 TSH 0.01 ng/mL 2.45 ±0.68 14.29 ±1.97 583 0.03 ng/mL 4.78 ±0.57 17.64 ±0.44 369 0.1 ng/mL 16.19 ±0.95 21.70 ±4.65 134 0.3 ng/mL 44.34 ±6.02 45.58 ±1.03 103 1 ng/mL 77.19 ±4.48 68.31 ±7.05 88 3 ng/mL 95.50 ±7.45 76.02 ±5.12 80 See legend to Table 14a for details. Table 14v Cyclic AMP production in CHO cells expressing wild type TSHR and TSHR with Ser281 mutated to Ala. Effect of different dilutions of human monoclonal antibody to the TSHR (K1-18) with TSH agonist activity Cyclic AMP produced (pmol/mL) mean ±SD (n = 3) Wild type TSHR Mutated TSHR Mutated/Wild type (%) Cyclic AMP assay buffer 1.7210.28 2.04 ±0.29 119 K1-18 (ng/mL) 0.3 ng/mL 3.09 ±0.17 3.62 ±0.35 117 1 ng/mL 6.04 ±0.42 7.01 ±0.55 116 3 ng/mL 18.37 ±1.19 15.23 ±0.92 83 10 ng/mL 43.48 ±0.76 31.25 ±1.85 72 30 ng/mL 72.75 ±5.88 55.19 ±0.59 76 100 ng/mL 81.95 ±2.57 65.22 ±6.42 80 TSH (ng/mL) 0.01 ng/mL 2.03 ±0.30 2.84 ±0.06 140 0.03 ng/mL 3.65 ±0.64 4.69 ±0.05 128 0.1 ng/mL 9.65 ±1.53 11.33 ±0.62 117 0.3 ng/mL 31.40 ±0.93 27.48 ±2.15 88 1 ng/mL 61.04 ±3.63 51.63 ±0.54 85 3 ng/mL 82.58 ±2.92 67.98 ±2.73 82 See legend to Table 14a for details. Table 15a TSH induced cyclic AMP production in CHO cells expressing wild type TSHR and TSHR with Asp43 mutated to Ala. Effect of different dilutions of human monoclonal antibody to the TSHR (K1-70) with TSH antagonist artivity Cyclic AMP produced (pmol/mL; mean ±SD, n=3) Test samplea Wild type TSHR Mutated TSHR Mutated/wild type (%) Cyclic AMP assay buffer only 3.57 ±1.18 1.40 ±0.04 39 TSHb 93.92 ±3.88 ND ND 5B3 10µg/mL + TSHb 106.48 ±12.76 73.73 ±6.47 69 5B3 100µg/mL + TSHb 104.40 ±2.12 57.99 ±7.76 56 K1-70 0.001µg + TSHb 109.98 ±20.13 65.19 ±11.37 59 K1-70 0.01µg + TSHb 118.99 ±3.21 61.42 ±3.26 52 K1-70 0.1µg + TSHb 82.87 ±8.78 23.56 ±12.03 28 K1-70 1.0µg + TSHb 3.37 ±0.81 1.82 ±0.25 54 K1-70 10µg + TSHb 2.05 ±0.10 0.97 ±0.16 47 K1-70 100µg + TSH6 2.34 ±0.18 1.16 ± 0.25 50 K1-70 100µg 1.89 ±0.12 1.64 ±0.98 87 bTSH (2) 92.19 ±5.64 60.27 ±7.64 65 % inhibition of TSH stimulationc Antibody concentration Wild type TSHR Mutated TSHR 5B3 10µg/mL 0 0 5B3 100µg/mL 0 4 K1-70 0.001µg 0 0 K1-70 0.01µg/mL 0 0 K1-70 0.1µg/mL 12 61 K1-70 1µg/mL 96 97 K1-70 10µg/mL 98 98 K1-70 100µg/ml 98 98 bTSH (2) 2 0 aTest samples in hypotonic cyclic AMP assay buffer, bTSH final concentration = 3ng/mL. c% inhibition = 100 x [1 - (cydic AMP in the presence of test samples and TSH/cyclic AMP in the presence of cyclic AMP bufferand TSH)]. 5B3 is a human monoclonal antibody to GAD (negative control for K1-70). ND = not determined. TSH(2) = run at the end of assay. Table 15b TSH induced cyclic AMP production in CHO cells expressing wild type TSHR and TSHR with Ile60 mutated to Ala. Effect of different dilutions of human monoclonal antibody to the TSHR (K1-70) with TSH antagonist activity Experiment 1 Cyclic AMP produced (pmol/mL; mean ±SD, n=3) Test samplea Wild type TSHR Mutated TSHR Mutated/wild type(%) Cyclic AMP assay buffer only 1.78 ±0.12 4.07 ±0.08 229 TSHb 90.09 ±1.19 51.32 ±3.85 57 5B3 10µg/mL + TSHb 95.17 ±4.45 54.77 ±12.78 58 5B3 100µg/ml + TSHb 88.16 ±5.03 43.98 ±3.05 50 K1-70 0.001µg + TSHb 91.53 ±28.48 42.91 ±2.83 47 K1-70 0.01µg + TSHb 92.89 ±10.08 47.49 ±2.80 51 K1-70 0.1µg + TSHb 8.45 ±0.58 44.85 ±7.20 531 K1-70 1.0µg + TSHb 2.39 ±0.42 21.99 ±1.61 920 K1-70 10µq + TSHb 1.78 ±0.21 10.90 ±0.67 612 K1-70 100µg + TSHb 1.54 ±021 7.61 ±0.53 494 K1-70 100µg 1.12 ±0.51 3.84 ±0.56 343 bTSH (2) 82.90 ±1.87 45.09 ±0.90 54 % Inhibition of TSH stimulationc Antibody concentration Wild type TSHR Mutated TSHR 5B3 10µg/mL 0 0 5B3 100µg/mL 2 14 K1-70 0.001µg 0 16 K1-70 0.01µg/mL 0 7 K1-70 0.1µg/mL 91 13 K1-70 1µg/mL 97 57 K1-70 10µg/mL 98 79 K1-70 100/µg/ml 98 85 bTSH (2) 8 12 Experiment 2 Cyclic AMP produced (pmol/mL; mean ±SD, n=3) Test samplea Wild type TSHR Mutated TSHR Mutated/wild type (%) Cyclic AMP assay buffer only 1.16 ±0.21 5.06 ±0.31 436 TSHb 81.69 ±3.88 65.78 ±5.98 81 5B3 10µg/mL + TSHb 102.63 ±13.71 54.69 ±7.88 53 5B3 100µg/mL + TSHb 107.64 ±13.05 66.83 ±6.83 62 K1-70 0.001µg+ TSHb 93.21 ±9.01 57.98 ±6.22 62 K1-70 0.01µg +TSHb 92.99 ±6.39 58.40 ±1.47 63 K1-70 0.1 µg + TSHb 4.12 ±0.54 54.06 ±5.59 1312 K1-70 1.0µg + TSHb 1.16 ±0.09 14.82 ±1.13 1278 K1-7010µg + TSHb 1.85 ±0.28 11.15 ±2.09 603 K1-70 100µg + TSHb 1.71 ±0.56 7.87 ±0.63 460 K1-70 100µg 1.50 ±0.25 4.13 ±0.28 275 bTSH (2) 82.55 ±7.76 56.96 ±7.01 69 % Inhibition of TSH stimulationc Antibody concentration Wild type TSHR Mutated TSHR 5B3 10µg/mL 0 17 5B3 100µg/mL 0 0 K1-70 0.001µg 0 12 K1-70 0.01µg/ml 0 11 K1-70 0.1µg/mL 95 18 K1-70 1µg/mL 99 77 K1-70 10µg/mL 98 83 K1-70 100µg/mL 98 88 bTSH (2) 0 13 See legend to Table 15a for details. Table 15c TSH induced cyclic AMP production in CHO cells expressing wild type TSHR and TSHR with Glu61 mutated to Ala. Effect of different dilutions of human monoclonal antibody to the TSHR (K1-70) with TSH antagonist activity Cyclic AMP produced (pmol/mL; mean ±SD, n=3) Test samplea Wild type TSHR Mutated TSHR Mutated/wild type (%) Cyclic AMP assay buffer only 0.63 ±0.27 1.49 ±0.48 237 TSHb 115.33 ±1.56 77.74 ±6.57 67 5B3 10µg/mL + TSHb 114.68 ±8.12 77.87 ±8.10 68 5B3 100µg/mL + TSHb 127.08 ±6.55 70.47 ±2.85 55 K1-70 0.001µg+TSHb 102.62 ±6.91 72.39 ±4.36 71 K1-70 0.01µg + TSHb 109.66 ±14.99 71.93 ±9.10 66 K1-70 0.1µg + TSHb 43.68 ±13.73 54.35 ±9.85 124 K1-70 1.0µg + TSHb 1.35 ±0.08 1.18 ±0.23 87 K1-70 10µg + TSHb 1.25 ±0.35 0.76 ±0.23 60.8 K1-70 100µg + TSHb 0.61 ±0.46 0.91 ±0.36 149 K1-70 100µg 0.49 ±0.47 1.69 ±0.34 345 bTSH (2) 126.05 ±6.29 64.74 ±4.96 51 % inhibition of TSH simulationc Antibody concentration Wild type TSHR Mutated TSHR 5B3 10µg/ mL 1 0 5B3 100µg/ mL 0 9 K1-70 0.001 µg 11 7 K1-70 0.01µg/ mL 5 7 K1-70 0.1µg/ mL 62 30 K1-70 1µg/ mL 99 98 K1-70 10µg/ mL 99 99 K1-70 100µg/ mL 99 99 bTSH (2) 0 17 See legend to Table 15a for details. Table 15d TSH induced cyclic AMP production in CHO cells expressing wild type TSHR and TSHR with Thr104 mutated to Ala. Effect of different dilutions of human monoclonal antibody to the TSHR (K1-70) with TSH antagonist activity Cyclic AMP produced (pmol/mL; mean ±SD, n=3) Test samplea Wild type TSHR Mutated TSHR Mutated/wild type (%) Cyclic AMP assay buffer only 0.89 ±0.29 1.36 ±0.89 153 TSHb 83.78 ±6.86 63.69 ±1.38 76 5B3 10µg/mL + TSHb 83.61 ±3.29 59.13 ±0.82 71 5B3 100µg/mL + TSHb 88.04 ±5.58 60.01 ±3.04 .68 K1-70 0.001µg + TSHb 90.15 ±15.94 64.74 ±6.20 72 K1-70 0.01µg+TSHb 92.33 ±8.48 54.64 ±1.42 59 K1-70 0.1µg + TSHb 34.13 ±3.95 24.89 ±3.39 73 K1-70 1.0µg + TSHb 1.58±0.16 2.55 ±0.11 161 K1-70 10µg + TSHb 1.07 ±0.33 2.15 ±1.06 201 K1-70 100µg + TSHb 1.19 ±0.35 1.86 ±0.06 156 K1-70 100µg 0.74 ±0.30 1.48 ±0.13 200 bTSH (2) 83.61 ±3.30 57.01 ±1.62 68 % inhibition of TSH stimulationc Antibody concentration Wild type TSHR Mutated TSHR 5B3 10µg/ mL 0 7 5B3 100µg/ mL 0 6 K1-70 0.001 µg 0 0 K1-70 0.01µg/ mL 0 14 K1-70 0.1µg/ mL 59 61 K1-701µg/ mL 98 96 K1-70 10µg/ mL 99 97 K1-70 100µg/ mL 99 97 bTSH (2) 0.2 10 See legend to Table 15a for details. Table 15e TSH induced cyclic AMP production in CHO cells expressing wild type TSHR and TSHR with His105 mutated to Ala. Effect of different dilutions of human monoclonal antibody to the TSHR (K1-70) with TSH antagonist activity Cyclic AMP produced (pmol/mL; mean ±SD, n=3) Test samplea Wild type TSHR Mutated TSHR Mutated/wild type (%) Cyclic AMP assay buffer only 0.64 ±0.08 0.99 ±0.06 155 TSHb 93.59 ±6.12 65.93 ±4.03 70 5B3 10µg/ml + TSHb 91.63 ±10.00 75.20 ±5.73 82 5B3 100µg/mL + TSHb 133.84 ±27.40 66.67 ±1.51 50 K1-70 0.001µg + TSHb 135.86 ±3.01 89.32 ±7.04 66 K1-70 TSHb 119.40 ±22.33 82.69 ±6.53 69 K1-70 0.1µg + TSHb 24.43 ±4.03 10.46 ±2.84 43 K1-70 1.0µg + TSHb 1.34±0.26 1.47 ±0.40 110 K1-70 10µg + TSHb 1.96 ±2.03 0.70 ±0.16 36 K1-70 100µg + TSHb 0.70 ±0.24 0.80 ±0.24 114 K1-70 100µg 0.89 ±0.19 0.66 ±0.13 74 bTSH (2) 116.74 ±5.43 58.53 ±2.95 50 % inhibition of TSH stimulationc Antibody concentration Wild type TSHR Mutated TSHR 5B3 10µg/ mL 2 0 5B3 100µg/ mL 0 0 K1-70 0.001 µg 0 0 K1-70 0.01µg/ mL 0 0 K1-70 0.1µg/ mL 74 84 K1-70 1µg/ mL 99 98 K1-70 10µg/ mL 98 99 K1-70 100µg/ ml 99 99 bTSH (2) 0 11 See legend to Table 15a for details. Table 15f TSH induced cyclic AMP production in CHO cells expressing wild type TSHR and TSHR with Asp151 mutated to Ala. Effect of different dilutions of human monoclonal antibody to the TSHR (K1-70) with TSH antagonist activity Cyclic AMP produced (pmol/mL; mean ±SD, n=3) Test samplea Wild type TSHR Mutated TSHR Mutated/wild type (%) Cyclic AMP assay buffer only 1.06 ±0.22 2.03 ±0.48 192 TSHD 74.09 ±8.63 45.72 ±0.43 62 5B3 10µg/mL + TSHb 76.94 ±7.67 40.70 ±2.59 53 5B3 100µg/mL + TSHb 81.59 ±6.54 46.24 ±1.77 57 K1-70 0.001µg + TSHb 80.09 ±1.95 45.85 ±4.25 57 K1-70 0.01µg + TSHb 80.41 ±8.03 44.71 ±2.24 56 K1-70 0.1µg + TSHb 13.74 ±6.49 10.24 ±0.91 75 K1-70 1.0µg + TSHb 1.10 ± 0.24 2.04 ± 0.41 185 K1-70 10µg + TSHb 1.21 ±0.33 1.60 ±0.35 132 K1-70 100µg + TSHb 1.06 ±0.54 1.68 ±0.19 158 K1-70 100µg 1.20 ±0.13 1.72 ±0.68 143 bTSH (2) 95.46 ±17.64 41.53 ±1.51 44 % inhibition of TSH stimulationc Antibody concentration Wild type TSHR Mutated TSHR 5B3 10µgmL 0 11 5B3 100µg/ mL 0 0 K1-70 0.001 µg 0 0 K1-70 0.01µg/ mL 0 2 K1-70 0.1µg/ mL 81 78 K1-70 1µg/ mL 99 96 K1-70 10µg/ mL 98 97 K1-70 100µg/ mL 99 96 bTSH (2) 0 9 See legend to Table 15a for details. Table 15g TSH induced cyclic AMP production in CHO cells expressing wild type TSHR and TSHR with Asp160 mutated to Lys. Effect of different dilutions of human monoclonal antibody to the TSHR (K1-70) with TSH antagonist activity Cyclic AMP produced (pmol/mL; mean ±SD, n=3) Test samplea Wild type TSHR Mutated TSHR Mutated/wild type (%) Cyclic AMP assay buffer only 0.71 ±0.10 5.83 ±0.11 821 M22b 65.25 ±4.95 51.70 ±2.57 79 5B3 10µg/mL + M22b 75.97 ±4.49 52.50 ±4.25 69 5B3 100µg/mL + M22b 76.92 ±9.97 45.83 ±3.53 60 K1-70 0.001µg + M22b 88.89 ±11.87 51.99 ±6.36 58 K1-70 0.01µg + M22b 81.52 ±12.62 41.02 ±6.06 50 K1-70 0.1µg + M22b 10.95 ±1.07 9.26 ±2.35 85 K1-70 1.0µg + M22b 0.46 ± 0.06 0.25 ± 0.06 54 K1-70 10µg + M22b 0.63 ±0.33 0.07 ±0.08 11 K1-70 100µg + M22b 0.52 ±0.46 0.27 ±0.12 52 K1-70 100µg 1.00 ±0.68 0.09 ±0.06 9 bM22 (2) 71.04 ±1.30 45.81 ±5.56 64 % inhibition of TSH stimulationc Antibody concentration Wild type TSHR Mutated TSHR 5B3 10µg/ mL 0 0 5B3 100µg/ mL 0 11 K1-70 0.001 µg 0 0 K1-70 0.01µg/ mL 0 21 K1-70 0.1µg/ mL 83 82 K1-70 1µg/ mL 99 99 K1-70 10µg/ mL 99 100 K1-70 100µg/ mL 99 99 bM22 (2) 0 11 See legend to Table 15a for details. Table 15h TSH induced cyclic AMP production in CHO cells expressing wild type TSHR and TSHR with Glu178 mutated to Ala. Effect of different dilutions of human monoclonal antibody to the TSHR (K1-70) with TSH antagonist activity Experiment 1 Cyclic AMP produced (pmol/mL; mean ±SD, n=3) Test samplea Wild type TSHR Mutated TSHR Mutated/wild type(%) Cyclic AMP assay buffer only 0.35 ±0.47 9.18 ±0.59 2623 TSHb 52.9 ±3.27 56.61 ±6.05 107 563 10µg/mL + TSHb 65.73 ±1.11 57.61 ±2.52 88 5B3 + TSHb 65.49 ±4.50 57.04 ±7.63 87 K1-70 0.001µg + TSHb 63.14 ±5.08 45.91 ±1.28 73 K1-70 0.01µg + TSHb 60.67 ±7.43 47.28 ±2.68 78 K1-70 TSHb 6.32 ±2.70 37.53 ±7.25 594 K1-70 1.0µg + TSHb 0.78 ±0.64 6.96 ±0.61 892 K1-70 10µg + TSHb 0.66 ±0.34 5.65 ±0.22 856 + TSHb 0.42 ±0.22 6.80 ±0.16 1619 K1-70 100µg 0.01* 6.11 ±0.14 61100 bTSH (2) 77.16 ±8.61 50.08 ±5.73 65 % Inhibition of TSH stimulationc Antibody concentration Wild type TSHR Mutated TSHR 5B3 10µg/ mL 0 0 5B3 100µg/ mL 0 0 K1-70 0.001 µg 0 19 K1-70 0.01µg/ ml 0 16 K1-70 0.1µg/ mL 88 34 K1-70 1 µg/ mL 99 88 K1-70 10µg/ mL 99 90 K1-70 100µg/ mL 99 88 b TSH 0 12 Experiment 2Cyclic AMP produced (pmol/mL; mean ±SD, n=3) Test samplea Wild type TSHR Mutated TSHR Mutated/wild type(%) Cyclic AMP assay buffer only 1.83 ±0.13 6.13 ±0.45 335 TSHb 87.25 ±10.43 46.20 ±2.13 53 5B3 10µg/mL + TSHb 100.35 ±7.09 54.97 ±4.10 55 5B3 100µg/mL + TSHb 98.11 ±11.88 44.98 ±4.80 46 K1-70 0.001µg + TSHb 103.37 ±16.45 49.40 ±4.23 48 K1-70 0.01µg + TSHb 96.22 ±16.49 48.01 ±5.37 50 K1-70 0.1µg + TSHb 20.35 ±9.35 30.71 ±3.37 151 K1-70 1.0µg + TSHb 1.13 ±0.62 5.78 ±0.42 512 K1-70 10µg + TSHb 1.43 ± 0.34 4.88 ±0.15 341 K1-70 100µg + TSHb 1.54 ±0.24 4.84 ±0.32 314 K1-70 100µg 1.08 ±0.32 3.73 ±0.64 345 bTSH (2) 88.09 ±7.60 44.11 ±1.34 50 % inhibition of TSH stimulationc Antibody concentration Wild type TSHR Mutated TSHR 5B3 10µg/ mL 0 0 5B3 100µg/ mL 0 3 K1-70 0.001 µg 0 0 K1-70 0.01µg/ mL 0 0 K1-70 0.1µg/ mL 77 34 K1-70 1µg/ mL 99 87 K1-70 10µg/ mL 98 89 K1-70 100µg/ mL 98 90 bTSH (2) 0 5 See legend to Table 15a for details. Table 15i TSH induced cyclic AMP production in CHO cells expressing wild type TSHR and TSHR with Lys183 mutated to Asp. Effect of different dilutions of human monoclonal antibody to the TSHR (K1-70) with TSH antagonist activity Cyclic AMP produced (pmol/mL; mean ±SD, n=3) Test samplea Wild type TSHR Mutated TSHR Mutated/wild type (%) Cyclic AMP assay buffer only 0.83 ±0.70 1.26 ±0.02 152 TSHb 85.81 ±4.18 117.28 ±3.46 137 5B3 10µg/mL + TSHb 93.70 ± 8.12 104.75 ±8.56 112 5B3 100µg/mL + TSHb 108.83 ±3.13 127.83 ±6.64 117 K1-70 0.001µg + TSHb 90.69 ±2.74 101.41 ±11.08 112 K1-70 0.01µg + TSHb 97.27 ±2.97 101.74 ±14.23 105 K1-70 0.1µg + TSHb 69.05 ±10.81 33.97 ±2.51 49 K1-70 1.0µg + TSHb 2.33 ±0.54 3.04 ±1.07 130 K1-70 10µg + TSHb 1.74 ±0.11 0.85 ±0.38 49 K1-70 100µg + TSHb 1.61 ±0.27 0.98 ±0.23 61 K1-70 100µg 1.46 ±0.16 0.84 ±0.26 58 bTSH (2) 97.81 ±21.58 93.44 ±3.40 96 % inhibition of TSH stimulationc Antibody concentration Wild type TSHR Mutated TSHR 5B3 10µg/ mL 0 11 5B3 100µg/ mL 0 0 K1-70 0.001 µg 0 14 K1-70 0.01µg/ mL 0 13 K1-70 0.1µg/ mL 20 71 K1-70 1µg/ mL 97 97 K1-70 10µg/ mL 98 99 K1-70 100µg/ mL 98 99 bTSH (2) 0 20 See legend for Table 15a for details. Table 15j TSH induced cyclic AMP production in CHO cells expressing wild type TSHR and TSHR with Tyr185 mutated to Ala. Effect of different dilutions of human monoclonal antibody to the TSHR (K1-70) with TSH antagonist activity Cyclic AMP produced (pmol/mL; mean ±SD), n=3) Test samplea Wild type TSHR Mutated TSHR Mutated/wild type (%) Cyclic AMP assay buffer only 1.20 ±0.46 2.17 ±0.33 181 TSHb 100.81 ±7.98 52.49 ±3.51 52 5B3 10µg/mL + TSHb 125.53 ±9.18 47.02 ±2.22 37 5B3 100µg/mL + TSHb 97.32 ±11.29 56.13 ±6.76 58 K1-70 0.001µg + TSHb 118.92 ±0 51.39 ±4.61 43 K1-70 0.01µg + TSHb 120.80 ±7.93 46.06 ±1.89 38 K1-70 0.1µg + TSHb 15.05 ±4.72 10.84 ±2.53 72 K1-70 1.0µg + TSHb 1.30 ±0.32 2.10 ±0.52 162 K1-70 10µg + TSHb 1.61 ±0.80 1.64 ±0.49 102 K1-70 100µg + TSHb 1.38 ±0.09 2.07 ±0.62 150 K1-70 100ng 1.30 ±0.17 1.54 ±0.39 118 bTSH 131.33 ±9.02 41.01 ±1.66 31.2 % inhibition of TSH stimulationc Antibody concentration Wild type TSHR Mutated TSHR 5B3 10µg/ mL 0 10 5B3 100µg/ mL 3 0 K1-70 0.001 µg 0 2 K1-70 0.01µg/ mL 0 12 K1-70 0.1µg/ ml 85 79 K1-70 1µg/ mL 99 96 K1-70 10µg/ mL 98 97 K1-70 100µg/ mL 99 96 bTSH (2) 0 22 See legend to Table 15a for details. Table 15k TSH induced cyclic AMP production in CHO cells expressing wild type TSHR and TSHR with Tyr206 mutated to Ala. Effect of different dilutions of human monoclonal antibody to the TSHR (K1-70) with TSH antagonist activity Cyclic AMP produced (pmol/mL; mean ±SD, n=3) Test samplea Wild type TSHR Mutated TSHR Mutated/wild type (%) Cyclic AMP assay buffer only 1.45 ±0.33 2.33±0.17 161 TSHb 92.20 ±5.95 82.89±7.13 90 5B3 10µg/mL + TSHb 94.47 ±3.74 74.63 ±5.45 79 5B3 100µg/mL + TSHb 101.41 ±6.91 75.18 ±4.79 74 K1-70 0.001 µg + TSHb 102.14 ±23.36 68.25 ±5.23 67 K1-70 0.01 µg + TSHb 92.18 ± 10.18 73.26 ±6.48 79 K1-70 0.1µg + TSHb 9.63 ±0.78 7.55 ±0.73 78 K1-70 1.0µg + TSHb 2.01 ±1.50 2.46±0.55 122 K1-70 10µg + TSHb 1.45 ±0.19 2.18±0.16 150 K1-70 100µg + TSHb 1.62 ±0.44 2.31 ±0.08 143 K1-70 100µg 1.44 ±0.23 2.13 ±0.38 148 bTSH (2) 107.85 ±5.97 69.48 ±2.42 64 % inhibition of TSH stimulationc Antibody concentration Wild type TSHR Mutated TSHR 5B3 10µg/ mL 0 10 5B3100µg/ mL 0 9 K1-70 0.001 µg 0 18 K1-70 0.01µg/ mL 0 12 K1-70 0.1µg/ mL 90 91 K1-70 1µg/ mL 98 97 K1-70 10µg/ mL 98 97 K1-70 100µg/ mL 98 97 bTSH (2) 0 16 See legend to Table 15a for details. Table 15l TSH induced cyclic AMP production in CHO cells expressing wild type TSHR and TSHR with Lys209 mutated to Ala. Effect of different dilutions of human monoclonal antibody to the TSHR (K1-70) with TSH antagonist activity Cyclic AMP produced (pmol/mL; mean ±SD, n=3) Test samplea Wild type TSHR Mutated TSHR Mutated/wild type (%) Cyclic AMP assay buffer only 0.88 ±0.03 2.14 ±0.56 243 TSHb 78.97 ±8.73 57.94 ±4.39 73 5B3 10µg/mL + TSHb 76.61 ±6.55 56.52 ±4.26 74 5B3 100µg/mL + TSHb 87.72 ±5.48 55.93 ±3.69 64 K1-70 0.001µg + TSHb 97.83 ±2.41 52.17 ±7.95 53 K1-70 0.01µg + TSHb 99.22* 42.31 ±6.68 43 K1-70 0.1µg + TSHb 9.58 ±1.13 5.45 ±2.69 57 K1-70 1.0µg + TSHb 1.36 ±0.10 1.43 ±0.13 105 K1-70 10µg + TSHb 0.88 ±0 1.37 ±0.29 156 K1-70 100µg + TSHb 0.98 ±0.24 1.58 ±0.10 161 K1-70 100µg 0.81 ±0.09 1.84 ±0.32 227 bTSH (2) 91.50 ±6.84 47.73 ±3.41 52 % inhibition of TSH stimulationc Antibody concentration Wild type TSHR Mutated TSHR 5B3 10µg/ mL 3 2 5B3 100µg/ mL 0 3 K1-70 0.001 µg 0 10 K1-70 0.01µg/ mL 0 27 K1-70 0.1µg/ mL 88 91 K1-70 1µg/ ml 98 98 K1-70 10µg/ mL 99 98 K1-70 100µg/ mL 99 97 bTSH (2) 0 18 See legend to Table 15a for details. Table 15m TSH induced cyclic AMP production in CHO cells expressing wild type TSHR and TSHR with Asp232 mutated to Ala. Effect of different dilutions of human monoclonal antibody to the TSHR (K1-70) with TSH antagonist activity Cyclic AMP produced (pmol/mL; mean ±SD, n=3) Test samplea Wild type TSHR Mutated TSHR Mutated/wild types (%) Cyclic AMP assay buffer only 1.93 ±0.10 2.61 ±0.62 135 TSHb 82.02 ±7.26 57.02 ±6.10 70 5B3 10µg/mL + TSHb 86.80 ±8.83 51.42 ±3.83 59 5B3 100µg/mL + TSHb 92.84 ±3.94 53.61 ±5.00 58 K1-70 0.001µg + TSHb 96.66 ±2.53 56.21 ±2.78 58 K1-70 0.01µg + TSHb 93.85 ±4.23 32.28 ±7.68 34 K1-70 0.1µg + TSHb 4.46 ±1.38 2.98 ±0.19 67 K1-70 1.0µg + TSHb 1.66 ±0.13 2.03 ±0.10 122 K1-70 10µg + TSHb 1.71 ±0.25 2.35 ±0.21 137 K1-70 100µg + TSHb 1.81 ±0.34 2.62 ±0.17 145 K1-70 100µg 1.13 ±0.97 2.18 ±0.32 193 bTSH (2) 82.64 ±7.95 62.58 ±3.86 76 % inhibition of TSH stimulationc Antibody concentration Wild type TSHR Mutated TSHR 5B3 10µg/ mL 0 10 5B3 100µg/ mL 0 6 K1-70 0.001 µg 0 1 K1-70 0.01µg/ mL 0 43 K1-70 0.1µg/ mL 95 95 K1-70 1 µg/ mL 98 96 K1-70 10µg/ mL 98 96 K1-70 100µg/ mL 98 95 bTSH (2) 0 0 See legend to Table 15a for details. Table 15n TSH induced cyclic AMP production in CHO cells expressing wild type TSHR and TSHR with Gln235 mutated to Ala. Effect of different dilutions of human monoclonal antibody to the TSHR (K1-70) with TSH antagonist activity Experiment 1 Cyclic AMP produced (pmol/mL; mean ±SD, n=3) Test samplea Wild type TSHR Mutated TSHR Mutated/wild type (%) Cyclic AMP assay buffer only 1.55 ±0.63 3.85 ±0.62 248 TSHb 79.85 ±5.00 55.54 ±2.28 70 5B3 10µg/mL + TSHb 80.10 ±8.09 63.73 ±3.15 80 5B3 100µg/mL + TSHb 93.18 ±7.43 58.27 ±3.67 63 K1-70 0.001µg + TSHb 75.94 ±9.09 50.44 ±3.80 66 K1-70 0.01 µg + TSHb 83.71 ±2.23 51.03 ±3.63 61 K1-70 0.1µg + TSHb 7.69 ± 0.71 23.70 ± 3.03 308 K1-70 1.0µg + TSHb 1.05 ±0.12 5.05 ±0.37 481 K1-70 10µg + TSHb 1.81 ±0.58 3.76 ±0.11 208 K1-70 100µg + TSHb 1.43 ±0.56 4.93 ±0.84 345 K1-70 100µg 0.76 ±0.42 3.59 ±0.48 472 bTSH (2) 80.04 ±7.76 48.55 ±4.54 61 % inhibition of TSH stimulationc Antibody concentration Wild type TSHR Mutated TSHR 5B3 10µg/ mL 0 0 5B3 100µg/ mL 0 0 K1-70 0.001 µg 5 9 K1-70 0.01µg/ mL 0 8 K1-70 0.11µg/ mL 90 57 K1-70 1µg/ mL 99 91 K1-70 10µg/ mL 98 93 K1-70 100µg/ mL 98 91 bTSH (2) 0 13 Experiment 2Cyclic AMP produced (pmol/mL; mean ±SD, n=3) Test samplea Wild type TSHR Mutated TSHR Mutated/wild type(%) Cyclic AMP assay buffer only 0.88 ±0.09 2.06 ±0.39 234 TSHb 56.39 ±3.44 56.59 ±2.20 100 5B3 10µg/mL + TSHb 62.97 ±1.58 48.72 ±6.02 77 5B3 100µg/mL + TSHb 60.63 ±1.31 57.90 ±6.25 95 K1-70 0.001µg + TSHb 61.57 ±5.25 54.73 ±13.72 89 K1-70 0.01µg + TSHb 55.31 ±5.21 61.63 ±17.52 111 K1-70 0.1µg+TSHb 30.91 ±2.16 27.18 ±5.31 88 K1-70 1.0µg + TSHb 1.95±1.37 2.82 ±0.34 145 K1-70 10µg + TSHb 1.15±0.35 1.40 ±0.15 122 K1-70 100µg + TSHb 1.12 ±0.41 1.65 ±0.29 147 K1-70 100µg 0.63 ±0.11 1.20 ±0.07 190 bTSH (2) 77.33 ±18.51 55.10 ±2.99 71 % inhibition of TSH stimulationc Antibody concentration Wild type TSHR Mutated TSHR 5B3 10µg/ mL 0 14 5B3 100µg/ mL 0 0 K1-70 0.001 µg 0 3 K1-70 0.01µg/ mL 2 0 K1-70 0.1µg/ mL 45 52 K1-70 1µg/ mL 97 95 K1-70 10µg/ mL 98 98 K1-70 100µ/ mL 98 97 bTSH (2) 0 3 See legend to Table 15a for details. Table 15o TSH induced cyclic AMP production in CHO cells expressing wild type TSHR and TSHR with Lys250 mutated to Ala. Effect of different dilutions of human monoclonal antibody to the TSHR (K1-70) with TSH antagonist activity Experiment 1 Cyclic AMP produced (pmol/mL; mean ±SD), n=3) Test samplea Wild type TSHR Mutated TSHR Mutated/wild type (%) Cyclic AMP assay buffer only 1.37 ±0.11 5.15 ±0.63 376 TSH6 77.89 ±4.29 64.69 ±4.82 83 5B3 10µg/ml + TSHb 77.80 ±3.64 67.66 ±1.21 87 5B3 100µg/mL + TSHb 79.92 ±5.52 66.12 ±2.92 83 K1-70 0.001µg + TSHb 80.20 ±4.04 64.15 ±0 80 K1-70 0.01µg + TSHb 68.64 ±9.75 57.52 ±4.14 84 K1-70 0.1µg + TSHb 5.75 ±0.88 42.40 ±1.47 737 K1-70 1.0µg + TSHb 1.67 ±0.29 6.09 ±0.05 365 K1-70 10µg + TSHb 1.37 ±0.06 4.29 ±0.62 313 K1-70 100µg + TSHb 1.48 ±0.08 4.75 ±0.08 319 K1-70 100µg 1.66 ±0.33 3.17 ±0.19 191 bTSH (2) 84.45 ±1.63 58.26 ±3.24 69 % inhibition of TSH stimulationc Antibody concentration Wild type TSHR Mutated TSHR 5B3 10µg/mL 0.1 0 5B3 100µg/ mL 0 0 K1-70 0.001 µg 0 1 K1-70 0.01µg/ mL 12 11 K1-70 0.1µg/ mL 93 34 K1-70 1µg/ mL 98 91 K1-70 10µg/ mL 98 93 K1-70 100µg/ mL 98 93 bTSH (2) 0 10 Experiment 2Cyclic AMP produced (pmol/mL; mean ±SD, n=3) Test samplea Wild type TSHR Mutated TSHR Mutated/wild type (%) Cyclic AMP assay buffer only 0.36 ±0.14 0.90 ±0.36 250 TSHb 86.55 ±2.19 54.99 ±5.70 64 5B3 10µg/mL + TSHb 90.58 ±4.34 47.09 ±1.88 52 5B3 100µg/mL + TSHb 87.52 ±2.25 54.67 ±4.74 62 K1-70 0.001µg + TSHb 88.48 ±4.56 44.31 ±3.00 50 K1-70 0.01µg + TSHb 86.20 ±7.37 45.44 ±2.16 53 K1-70 0.1µg + TSHb 8.81 ±0.84 27.64 ±1.41 314 K1-70 1.0µg + TSHb 1.05 ±0.35 1.98 ±0.29 189 K1-70 10µg + TSHb 0.76 ±0.58 0.72 ±0.11 95 K1-70 100µg + TSHb 0.40 ±0.09 0.64 ±0.16 160 K1-70 100µg 0.61 ±0.20 0.90 ±0.15 148 bTSH (2) 75.91 ±7.48 51.08 ±3.64 67 % inhibition of TSH stimulationc Antibody concentration Wild type TSHR Mutated TSHR 5B3 10µg/ mL 0 14 5B3 100µg/ mL 0 1 K1-700.001 µg 0 19 K1-70 0.01µg/ mL 0 17 K1-70 0.1µg/ mL 90 50 K1-70 1µg/ mL 99 96 K1-70 10µg/ mL 99 99 K1-70 100µg/ mL 99 99 bTSH (2) 12 7 See legend to Table 15a for details. Table 15p TSH induced cyclic AMP production in CHO cells expressing wild type TSHR and TSHR with Glu251 mutated to Ala. Effect of different dilutions of human monoclonal antibody to the TSHR (K1-70) with TSH antagonist activity Cyclic AMP produced (pmol/mL; mean ±SD, n=3) Test samplea Wild type TSHR Mutated TSHR Mutated/wild type (%) Cyclic AMP assay buffer only 1.78 ±0.15 4.76 ±0.73 267 TSHb 97.46 ±6.92 76.06 ±10.78 78 5B3 10µg/mL + TSHb 92.91 ±4.18 68.71 ±3.38 74 5B3 100µg/mL + TSHb 86.30 ±10.26 76.69 ±7.01 89 K1-70 0.001µg + TSHb 90.50 ±10.61 76.43 ±13.91 84 K1-70 0.01µg + TSHb 88.13 ±2.76 60.62 ±2.31 69 K1-70 0.1µg + TSHb 4.06 ±0.74 6.28 ±2.22 155 K1-70 1.0µg + TSHb 1.73 ±0.11 2.17 ±0.04 125 K1-70 10µg + TSHb 1.58 ±0.15 3.18 ±1.36 201 K1-70 100µg + TSHb 1.66 ±0.03 2.72 ±0.52 164 K1-70 100µg 1.54 ±0.15 4.41 ±1.24 286 bTSH (2) 104.06 ±3.26 87.36 ±14.82 84 % inhibition of TSH stimulationc Antibody concentration Wild type TSHR Mutated TSHR 5B3 10µg/ mL 5 10 5B3 100µg/ mL 11 0 K1-70 0.001 µg 7 0 K1-70 0.01µg/ mL 10 20 K1-70 0.1µg/ mL 96 92 K1-70 1µg/ mL 98 97 K1-70 10µg/ mL 98 96 K1-70100µg/ mL 98 96 bTSH (2) 0 0 See legend to Table 15a for details. Table 15q TSH induced cyclic AMP production in CHO cells expressing wild type TSHR and TSHR with Arg255 mutated to Ala. Effect of different dilutions of human monoclonal antibody to the TSHR (K1-70) with TSH antagonist activity Cyclic AMP produced (pmol/mL; mean ±SD, n=3) Test samplea Wild type TSHR Mutated TSHR Mutated/wild type (%) Cyclic AMP assay buffer only 1.65 ±0.42 2.04 ±0.48 124 TSHb 62.43 ±4.24 63.86 ±4.18 102 5B3 10µg/mL + TSHb 75.59* 56.36 ±3.72 75 5B3 100µg/mL + TSHb 68.28 ±4.90 62.53 ±5.33 92 K1-70 0.001µg + TSHb 89.67 ±5.46 65.87 ±8.49 73 K1-70 0.01µg + TSHb 87.27 ±9.27 55.02 ±4.02 63 K1-70 0.1µg + TSHb 33.63 ±2.97 19.38 ±3.27 58 K1-70 1.0µg + TSHb 2.30 ±0.34 3.96 ±1.02 172 K1-70 10µg + TSHb 1.28 ±1.09 2.38 ±0.52 186 K1-70 100µg + TSHb 2.88 ±1.98 1.94 ±0.45 67 K1-70 100µg 1.16 ±0.45 1.34 ±0.50 116 bTSH (2) 68.39 ±1.88 59.58 ±1.64 87 % inhibition of TSH stimulationc Antibody concentration Wild type TSHR Mutated TSHR 5B3 10µg/ mL 0 12 5B3 100µg/ mL 0 2 K1-70 0.001 µg 0 0 K1-70 0.01µg/ mL 0 14 K1-70 0.1µg/ mL 46 70 K1-70 11µg/ mL 96 94 K1-70 10µg/ mL 98 96 K1-70 100µg/ mL 95 97 bTSH (2) 0 7 See legend to Table 15a for details. Table 15r TSH induced cyclic AMP production in CHO cells expressing wild type TSHR and TSHR with Thr257 mutated to Ala. Effect of different dilutions of human monoclonal antibody to the TSHR (K1-70) with TSH antagonist activity Cyclic AMP produced (pmol/mL; mean ±SD, n=3) Test samplea Wild type TSHR Mutated TSHR Mutated/wild type (%) Cyclic AMP assay buffer only 0.67 ±0.13 2.08 ±0.22 310 TSHb 66.07 ±7.95 93.16 ±6.69 141 5B3 10µg/mL + TSHb 85.93 ±3.35 94.23 ±2.23 110 5B3 100µg/mL + TSHb 83.73 ±9.86 86.78 ±13.03 104 K1-70 0.001µg + TSHb 88.71±17.01 87.21 ±14.51 98 K1-70 0.01µg + TSHb 84.72 ±18.03 97.91 ±10.18 116 K1-70 0.1µg + TSHb 55.12 ±14.21 80.13 ±9.78 145 K1-70 1.0µg + TSHb 1.66 ±0.44 3.97 ±0.06 239 K1-70 10µg + TSHb 0.91 ±0.37 2.00 ±0.28 220 K1-70 100µg + TSHb 0.87 ±0.31 2.25 ±0.24 259 K1-70 100µg 1.14 ±0.11 1.44 ±0.15 126 bTSH (2) 92.96 ±1.88 85.41 ±4.14 92 % inhibition of TSH stimulationc Antibody concentration Wild type TSHR Mutated TSHR 5B3 10µg/ mL 0 0 5B3 100µg/ mL 0 7 K1-70 0.001 µg 0 6 K1-70 0.01µg/ mL 0 0 K1-70 0.1µg/ mL 17 14 K1-70 1µg/ mL 97 96 K1-70 10µg/ mL 99 98 K1-70 100µg/ mL 99 98 bTSH (2) 0 8 See legend to Table 15a for details. Table 15s TSH induced cyclic AMP production in CHO cells expressing wild type TSHR and TSHR with Trp258 mutated to Ala. Effect of different dilutions of human monoclonal antibody to the TSHR (K1-70) with TSH antagonist activity Cyclic AMP produced (pmol/mL; mean ±SD, n=3) Test samplea Wild type TSHR Mutated TSHR Mutated/wild type (%) Cyclic AMP assay buffer only 1.09 ±0.13 1.93 ±0.27 177 TSHb 58.81 ±3.32 59.87 ±5.65 102 5B3 10µg/mL+TSHb 67.66 ±2.16 50.71 ±1.58 75 5B3 100µg/mL + TSHb 72.85 ±11.12 57.62 ±12.06 79 K1-70 0.001 µg + TSHb 64.08 ± 4.50 51.10 ±5.86 80 K1-70 0.01µg + TSHb 68.76 ±7.18 51.22 ±2.22 74 K1-70 0.1µg + TSHb 12.46 ±3.44 11.56 ±5.39 93 K1-70 1.0µg + TSHb 0.99 ±0.52 1.38 ±0.12 139 K1-70 10µg+TSHb 0.64 ±0.08 1.06 ±0.21 166 K1-70 100µg + TSHb 0.77 ±0.27 1.38 ±0.65 179 K1-70 100µg 0.52±0.23 1.34 ±0.29 258 bTSH (2) 69.57 ±4.31 47.82 ±3.23 69 % inhibition of TSH stimulationc Antibody concentration Wild type TSHR Mutated TSHR 5B3 10µg/mL 0 15 5B3 100µg/mL 0 4 K1-70 0.001µg 0 15 K1-70 0.01µg/mL 0 14 K1-70 0.1µg/mL 79 81 K1-70 1µg/mL 98 98 K1-70 10µg/ml 99 98 K1-70 100µg/mL 99 98 bTSH (2) 0 20 See legend to Table 15a for details. Table 15t TSH induced cyclic AMP production in CHO cells expressing wild type TSHR and TSHR with Arg274 mutated to Ala. Effect of different dilutions of human monoclonal antibody to the TSHR (K1-70) with TSH antagonist activity Cyclic AMP produced (pmol/mL; mean ±SD, n=3) Test samplea Wild type TSHR Mutated TSHR Mutated/wild type (%) Cyclic AMP assay buffer only 1.91 ±0.23 2.61 ±0.37 137 TSHb 97.06 ±3.16 99.22 ±9.24 102 5B3 10µg/mL + TSHb 115.56 ±7.73 106.00 ±9.5 92 5B3 100µg/mL + TSHb 120.83 ±30.02 95.33 ±4.48 79 K1-70 0.001µg + TSHb 146.34 ±0 117.54 ±6.34 80 K1-70 0.01µg + TSHb 133.74 ±11.45 105.88 ±9.33 79 K1-70 0.1µg + TSHb 9.83 ±1.02 4.09 ±0.09 42 K1-70 1.0µg + TSHb 1.99 ±0.45 1.70 ±0.34 85 K1-70 10µg + TSHb 1.49 ±0.15 1.90 ±0.14 128 K1-70 100µg + TSHb 1.54 ±0.16 1.62 ±0.21 105 K1-70 100µg 1.30 ±0.25 1.75 ±0.34 135 bTSH (2) 109.43 ±12.79 100.21 ±9.82 92 % inhibition of TSH stimulationc Antibody concentration Wild type TSHR Mutated TSHR 5B3 10µg/mL 0 0 5B3 100µg/mL 0 4 K1-70 0.001µg 0 0 K1-70 0.01µg/mL 0 0 K1-70 0.1µg/mL 90 96 K1-70 1µg/mL 98 98 K1-70 10µg/mL 98 98 K1-70 100µg/mL 98 98 bTSH (2) 0 0 See legend to Table 15a for details. Table 15u TSH induced cyclic AMP production in CHO cells expressing wild type TSHR and TSHR with Asp276 mutated to Ala. Effect of different dilutions of human monoclonal antibody to the TSHR (K1-70) with TSH antagonist activity Experiment 1 Cyclic AMP produced (pmol/mL; mean ±SD, n=3) Test samplea Wild type TSHR Mutated TSHR Mutated/wild type (%) Cyclic AMP assay buffer only 1.19 ±0.45 7.20 ±0.74 605 TSHb 78.01 ±7.81 71.24 ±4.72 91 5B3 10µg/mL + TSHb 79.58 ±5.41 66.78 ±3.68 84 5B3 100µg/ml + TSHb 72.68 ±2.09 68.46 ±7.03 94 K1-70 0.001µg + TSHb 76.64 ±4.38 68.87 ±4.91 90 K1-70 0.01µg + TSHb 71.64 ±8.57 63.50 ±3.61 89 K1-70 0.1µg TSHb 9.89 ±3.19 67.79 ±9.74 685 K1-70 1.0µg + TSHb 1.02 ±0.24 10.21 ±0.58 1001 K1-7010µg + TSHb 0.36 ±0.31 5.07 ±1.35 1408 K1-70 100µg + TSHb 0.70 ±0.26 5.14 ±3.18 734 K1-70 100µg 0.21 ±0.30 3.56 ±0.74 1695 bTSH (2) 74.30 ±8.20 67.04 ±6.95 90 % inhibition of TSH stimulationc Antibody concentration Wild type TSHR Mutated TSHR 5B3 10µg/mL 0 6 5B3 100µg/mL 7 4 K1-70 0.001µg 2 3 K1-70 0.01µg/mL 8 11 K1-70 0.1µg/mL 87 5 K1-70 1µg/mL 99 86 K1-70 10µg/mL 99 93 K1-70100µg/mL 99 93 bTSH (2) 5 6 Experiment 2 Cyclic AMP produced (pmol/mL; mean ±SD, n=3) Test samplea Wild type TSHR Mutated TSHR Mutated/wild type (%) Cyclic AMP assay buffer only 0.65 ±0.27 12.17 ±1.47 1872 TSHb 95.81 ±9.24 74.82 ±9.47 78 5B3 10µg/mL + TSHb 106.73 ±8.52 71.56 ±4.30 67 5B3 100µg/ml + TSHb 101.10 ±2.58 75.93 ±6.03 75 K1-70 0.001µg + TSHb 104.99 ±10.76 72.63 ±9.99 69 K1-70 0.01µg + TSHb 108.84 ±12.41 78.47 ±3.50 72 K-70 0.1µg + TSHb 18.40 ±12.30 66.36 ±5.38 361 K1-70 1.0µg + TSHb 1.49 ±0.67 9.63 ±1.53 646 K1-70 10µg + TSHb 0.85 ±0.28 6.66 ±0.81 784 K1-70 100µg + TSHb 1.58 ±0.41 6.53 ±1.33 413 K1-70 100µg 0.64 ±0.04 5.88 ±1.36 919 bTSH (2) 92.86 ±4.90 61.21 ±1.70 66 % Inhibition of TSH stimulationc Antibody concentration Wild type TSHR Mutated TSHR 5B3 10µg/mL 0 4 5B3 100µg/mL 0 0 K1-70 0.001µg 0 3 K1-70 0.01µg/mL 0 0 K1-70 0.1µg/mL 81 11 K1-70 1µg/mL 98 87 K1-70 10µg//mL 99 91 K1-70 100µg/mL 98 91 bTSH (2) 3 18 See legend to Table 15a for details. Table 15v TSH induced cyclic AMP production in CHO cells expressing wild type TSHR and TSHR with Ser281 mutated to Ala. Effect of different dilutions of human monoclonal antibody to the TSHR (K1-70) with TSH antagonist activity Experiment 1 Cyclic AMP produced (pmol/mL; mean ±SD, n=3) Test samplea Wild type TSHR Mutated TSHR Mutated/wild type (%) Cyclic AMP assay buffer only 1.27 ±0.10 1.47 ±0.26 116 TSHb 87.93 ±17.36 69.80 ±10.34 79 5B3 10µg/mL + TSHb 84.72 ±5.57 56.72 ±2.69 67 5B3 100µg/mL + TSHb 87.99 ±4.63 62.11 ±5.75 71 K1-70 0.001µg + TSHb 86.36* 56.42 ±8.88 65 K1-70 TSHb 79.79 ±8.53 50.66 ±7.96 63 K1-70 0.1µg + TSHb 25.52 ±8.47 40.25 ±1.49 158 K1-70 1.0µg + TSHb 1.47 ±0.12 2.19 ±0.52 150 K1-70 10µg + TSHb 1.51 ±0.11 2.08 ±0.95 138 K1-70 100µg + TSHb 1.18 ±0.32 1.52 ±0.19 129 K1-70 100µg 0.99 ±0.29 1.22 ±0.07 123 bTSH (2) 99.13 ±16.11 56.62 ±5.48 57 % inhibition of TSH stimulationc Antibody concentration Wild type TSHR Mutated TSHR 5B3 10µg/ mL 4 19 5B3 100µg/ mL 0 11 K1-70 0.001 µg 2 19 K1-70 0.01µg/ mL 9 27 K1-70 0.1µg/ mL 71 42 K1-70 1µg/ mL 98 97 K1-70 10µg/ mL 98 97 K1-70 100µg/ mL 99 98 bTSH(2) 0 19 Experiment 2Cyclic AMP produced (pmol/mL; mean ±SD, n=3) Test samplea Wild type TSHR Mutated TSHR Mutated/wild type (%) Cyclic AMP assay buffer only 0.51 ±0.27 2.70 ±0.22 529 TSHb 75.33 ±3.18 68.98 ±3.03 92 5B3 10µg/mL + TSHb 82.84 ±2.66 66.07 ±3.09 80 5B3 100µg/mL + TSHb 82.89 ±4.01 72.42 ±3.12 87 K1-70 0.001µg + TSHb 77.43 ±3.86 53.94 ±3.95 70 K1-70 0.01µg + TSHb 87.16 ±9.24 51.53 ±6.84 59 K1-70 0.1µg + TSHb 18.38 ±2.79 40.45 ±9.45 220 K1-70 1.0µg + TSHb 0.60 ±0.27 2.56 ±0.63 427 K1-70 10µg + TSHb 0.38 ±0.07 2.17 ±0.83 571 K1-70 100µg + TSHb 0.42 ±0.20 1.85 ±0.40 440 K1-70 100µg 0.22 ±0.07 2.08 ±1.29 945 bTSH (2) 83.91 ±6.87 65.94 ±6.27 79 % inhibition of TSH stimulationc Antibody concentration Wild type TSHR Mutated TSHR 5B3 10µg/ mL 0 4 5B3 100µg/ mL 0 0 K1-70 0.001 µg 0 22 K1-70 0.01µg/ mL 0 25 K1-70 0.1µg/ mL 76 41 K1-70 11µg/ mL 99 96 K1-70 10µg/ mL 99 97 K1-70 100µg/ mL 99 97 b TSH 0 4 See legend to Table 15a for details. Table 16 Summary of effects of TSHR mutations (relative to wild type) on the ability of K1-18 IgG to stimulate cyclic AMP and K1-70 IgG to block TSH stimulation of cyclic AMP production in TSHR transfected CHO cells TSHR mutation Stimulation (relative to wild type) of cyclic AMP production by TSH Stimulation (relative to wild type) of cyclic AMP production by K1-18 IgG Blocking (relative to wild type) of TSH stimulation of cyclic AMP production by K1-70 IgG Wild type +++++ +++++ +++++ Asp43 Ala +++++ +++++ +++++ IIe60 Ala +++++ +++++ ++ Glu61 Ala +++++ +++++ +++ Thr104 Ala +++++ +++++ +++++ His 105 Ala +++++ +++++ +++++ Asp151 Ala ++++ ++++ +++++ Glu157 Ala +++++ 0 NT Glu178 Ala +++ ++++ ++++ Tyr185 Ala ++++ 0 +++++ Tyr206 Ala +++++ ++ +++++ Lys209 Ala ++++ ++++ +++++ Asp232 Ala ++++ 0 +++++ Gln235 Ala ++++ ++++ +++++ Lys250 Ala +++++ +++++ +++ Glu251 Ala ++++ ++++ +++++ Arg255 Ala +++++ +++++ +++++ Thr257 Ala +++++ +++++ +++++ Trp258 Ala +++++ ++ +++++ Arq274 Ala +++++ ++ +++++ Asp276 Ala +++++ +++++ +++ Ser281 Ala +++++ +++++ ++++ Asp160 Lys 0 NT +++++ Lys163 Asp* +++++ 0 +++++ Relative effects of TSHR mutations were expressed as a percentage of activity observed with wild type as follows:- +++++ = 100% wild type activity; ++++ = <100-80% of wild type activity; +++ = <80-60% of wild type activity; ++ = <60-40% of wild type activity; + = <40-20% of wild type activity; 0 = <20% of wild type activity.
*Blocking of stimulation for this mutation was carried out using stimulation by M22 as the mutant did not respond to TSH stimulation. M22 Fab final concentration = 3ng/mL.Table 17a Inhibition of 125I-TSH binding to TSHR coated tubes by recombinant K1-70 Fab expressed in E coli HB2151 cells Test sample Dilution of culture supernatant (or concentration1 of K1- 70 Fab ng/mL) % of 125I-TSH binding % Inhibition2 Assay buffer only 12.4 0 K1-70 Fab transformed cells but non-induced 1:2 11.4 8.0 1:4 12.3 0.7 1:8 10.9 12.4 1:16 11.8 5.0 1:32 12.6 -1.4 1:64 11.9 3.9 1:128 11.5 7.6 1:256 10.8 13.5 1:512 10.4 16.3 1:1024 10.7 14.2 K1-70 Fab transformed cells and induced 1:2 (700) 1.0 91.9 1:4 (350) 1.3 89.4 1:8 (175) 1.5 87.8 1:16 (87.5) 1.3 89.6 1:32 (44.8) 1.5 88.0 1:64 (22.4) 3.4 72.9 1:128 (11.2) 6.1 51.3 1:256 (5.6) 9.0 27.9 1:512 (2.8) 10.8 13.1 1:1024 (1.4) 11.6 6.6 K1-70 Fab (from hybridoma produced IgG) (100) 1.6 87.5 (50) 1.7 86.1 (25) 2.2 81.9 (10) 6.6 47.0 (5) 9.9 20.0 (2.5) 11.0 11.5 (1) 12.4 0.4 Concentration of recombinant K1-70 Fab in culture supernatant measured using the Easy-Titer Human IgG (H=L) assay kit (Pierce Biotechnology) using different concentrations of hybridoma produced K1-70 Fab as a calibration curve
2inhibition of binding was calculated using the formula: % inhibition = 100 - [A/B x 100] where A = % of 125I-TSH binding in the presence of test sample; and B = % of 125I-TSH binding in the presence of assay buffer (50mM NaCl, 10mM Tris, pH 7.8, 1% Triton X-100 and 1mg/mL BSA).Table 17b Inhibition of TSH mediated stimulation of cyclic AMP production in CHO cells expressing the TSHR bv recombinant K1-70 Fab expressed in E coli HB2151 cells Test sample Dilution2 of culture supernatant (or concentration3 of K1-70 Fab ng/mL) Cyclic AMP (pmol/mL) mean ±SD (n = 3) % inhibition of TSH stimulation of cyclic AMP4 Assay buffer1 only 2.39 ±0.20 TSH 3ng/mL 61.87 ±2.74 0 K1-70 Fab transformed cells but non-induced 1:10 5.67 ±0.31 K1-70 Fab transformed cells but non-induced + 3ng/mL TSH 1:5 70.95 ±6.32 -14.7 1:10 76.24 ±6.55 -23.2 1:20 67.11 ±3.51 -8.5 1:40 61.05 ±8.44 1.3 1:80 64.94 ±5.20 -5.0 K1-70 Fab transformed and induced cells 1:10(140) 274 ±0.59 K1-70 Fab transformed and induced cells + 3ng/mL TSH 1:5 (280) 6.64 ±0.07 89.3 1:10 (140) 9.71 ±1.50 84.3 1:20 (70) 18.55 ±3.30 70.0 1:40 (35) 37.29 ±6.47 39.7 1:80 (17.5) 51.68 ±3.59 16.5 K1-70 Fab (from hybridoma produced IgG) (100,000) 1.71 ±0.36 K1-70 Fab (from hybridoma produced IgG) + 3ng/mL TSH (100,000) 1.66 ±0.08 97.3 (10,000) 2.20 ±0.17 96.4 (1,000) 3.11 ±0.09 95.0 (100) 6.52 ±0.07 89.5 (10) 55.13 ±5.26 10.9 1Assay buffer: Hanks' buffered salt solution (NaCl free) containing 1g/L glucose, 20mmol/L HEPES, 222mmol/L sucrose, 15g/L BSA and 0.5mmol/L 2-isobutyl-1-methylxanthine pH7.4
2Dilutions in assay buffer
3Concentration of recombinant K1-70 Fab in culture supernatant measured using the Easy-Titer Human IgG (H=L) assay kit (Pierce Biotechnology) using different concentrations of hybridoma produced K1-70 Fab as a calibration curve
4% inhibition of TSH stimulation of cyclic AMP: % inhibition = 100 - [A/B x 100] where A = stimulation of cyclic AMP by 3ng/mL TSH in the presence of test sample; and B = stimulation of cyclic AMP by 3ng/mL TSH. -
- <110> RSR Limited
- <120> Antibodies
- <130> P110921GB
- <160> 85
- <170> Patent In version 3.5
- <210> 1
<211> 687
<212> DNA
<213> Homo sapiens - <400> 1

- <210> 2
<211> 15
<212> DNA
<213> Homo sapiens - <400> 2
aactactgga tcggc 15 - <210> 3
<211> 51
<212> DNA
<213> Homo sapiens - <400> 3
atcatctatc cttatgactc tgataccaga tatagcccgt ccttcgaaggc 51 - <210> 4
<211> 39
<212> DNA
<213> Homo sapiens - <400> 4
ccccgcgatg ggagctatcc ttatgatgct tttgatatc 39 - <210> 5
<211> 229
<212> PRT
<213> Homo sapiens - <400> 5

- <210> 6
<211> 5
<212> PRT
<213> Homo sapiens - <400> 6

- <210> 7
<211> 17
<212> PRT
<213> Homo sapiens - <400> 7

- <210> 8
<211> 13
<212> PRT
<213> Homo sapiens - <400> 8

- <210> 9
<211> 57
<212> DNA
<213> Homo sapiens - <400> 9
atggggtcaa ccgccatcct cgccctcctc ctgggtgttc tccaaggagt ctgtggc 57 - <210> 10
<211> 672
<212> DNA
<213> Homo sapiens - <400> 10

- <210> 11
<211> 15
<212> DNA
<213> Homo sapiens - <400> 11
aactactgga tcggc 15 - <210> 12
<211> 51
<212> DNA
<213> Homo sapiens - <400> 12
atcatctatc cttatgactc tgataccaga tatagcccgt ccttcgaaggc 51 - <210> 13
<211> 39
<212> DNA
<213> Homo sapiens - <400> 13
ccccgcgatg ggagctatcc ttatgatgct tttgatatc 39 - <210> 14
<211> 19
<212> PRT
<213> Homo sapiens - <400> 14

- <210> 15
<211> 224
<212> PRT
<213> Homo sapiens - <400> 15

- <210> 16
<211> 5
<212> PRT
<213> Homo sapiens - <400> 16

- <210> 17
<211> 17
<212> PRT
<213> Homo sapiens - <400> 17

- <210> 18
<211> 13
<212> PRT
<213> Homo sapiens - <400> 18

- <210> 19
<211> 618
<212> DNA
<213> Homo sapiens - <400> 19

- <210> 20
<211> 36
<212> DNA
<213> Homo sapiens - <400> 20
agggccagtc agagtgttag caacaactac ttagcc 36 - <210> 21
<211> 21
<212> DNA
<213> Homo sapiens - <400> 21
ggtgcatcca gcagggccact 21 - <210> 22
<211> 27
<212> DNA
<213> Homo sapiens - <400> 22
cagcattgtg gtagctcact gagggcg 27 - <210> 23
<211> 206
<212> PRT
<213> Homo sapiens - <400> 23


- <210> 24
<211> 12
<212> PRT
<213> Homo sapiens - <400> 24

- <210> 25
<211> 7
<212> PRT
<213> Homo sapiens - <400> 25

- <210> 26
<211> 9
<212> PRT
<213> Homo sapiens - <400> 26

- <210> 27
<211> 60
<212> DNA
<213> Homo sapiens - <400> 27
atggaaaccc cagcgcagct tctcttcctc ctgctactct ggctcccaga taccaccgga 60 - <210> 28
<211> 621
<212> DNA
<213> Homo sapiens - <400> 28
gaaattgtgt tgacgcagtc tccaggcacc ctgtctttgt ctccagggga aagagccacc 60
- <210> 29
<211> 36
<212> DNA
<213> Homo sapiens - <400> 29
agggccagtc agagtgttag caacaactac ttagcc 36 - <210> 30
<211> 21
<212> DNA
<213> Homo sapiens - <400> 30
ggtgcatcca gcagggccact 21 - <210> 31
<211> 27
<212> DNA
<213> Homo sapiens - <400> 31
cagcattgtg gtagctcact gagggcg 27 - <210> 32
<211> 20
<212> PRT
<213> Homo sapiens - <400> 32

- <210> 33
<211> 207
<212> PRT
<213> Homo sapiens - <400> 33


- <210> 34
<211> 12
<212> PRT
<213> Homo sapiens - <400> 34

- <210> 35
<211> 7
<212> PRT
<213> Homo sapiens - <400> 35

- <210> 36
<211> 9
<212> PRT
<213> Homo sapiens - <400> 36

- <210> 37
<211> 679
<212> DNA
<213> Homo sapiens - <400> 37


- <210> 38
<211> 15
<212> DNA
<213> Homo sapiens - <400> 38
gacaactgga tcggc 15 - <210> 39
<211> 51
<212> DNA
<213> Homo sapiens - <400> 39
atcatctatc ctggtgactc tgacaccaga tacagtccgt ccttccaaggc 51 - <210> 40
<211> 30
<212> DNA
<213> Homo sapiens - <400> 40
ctcgattgga actacaaccc cctgcgatac 30 - <210> 41
<211> 226
<212> PRT
<213> Homo sapiens - <400> 41
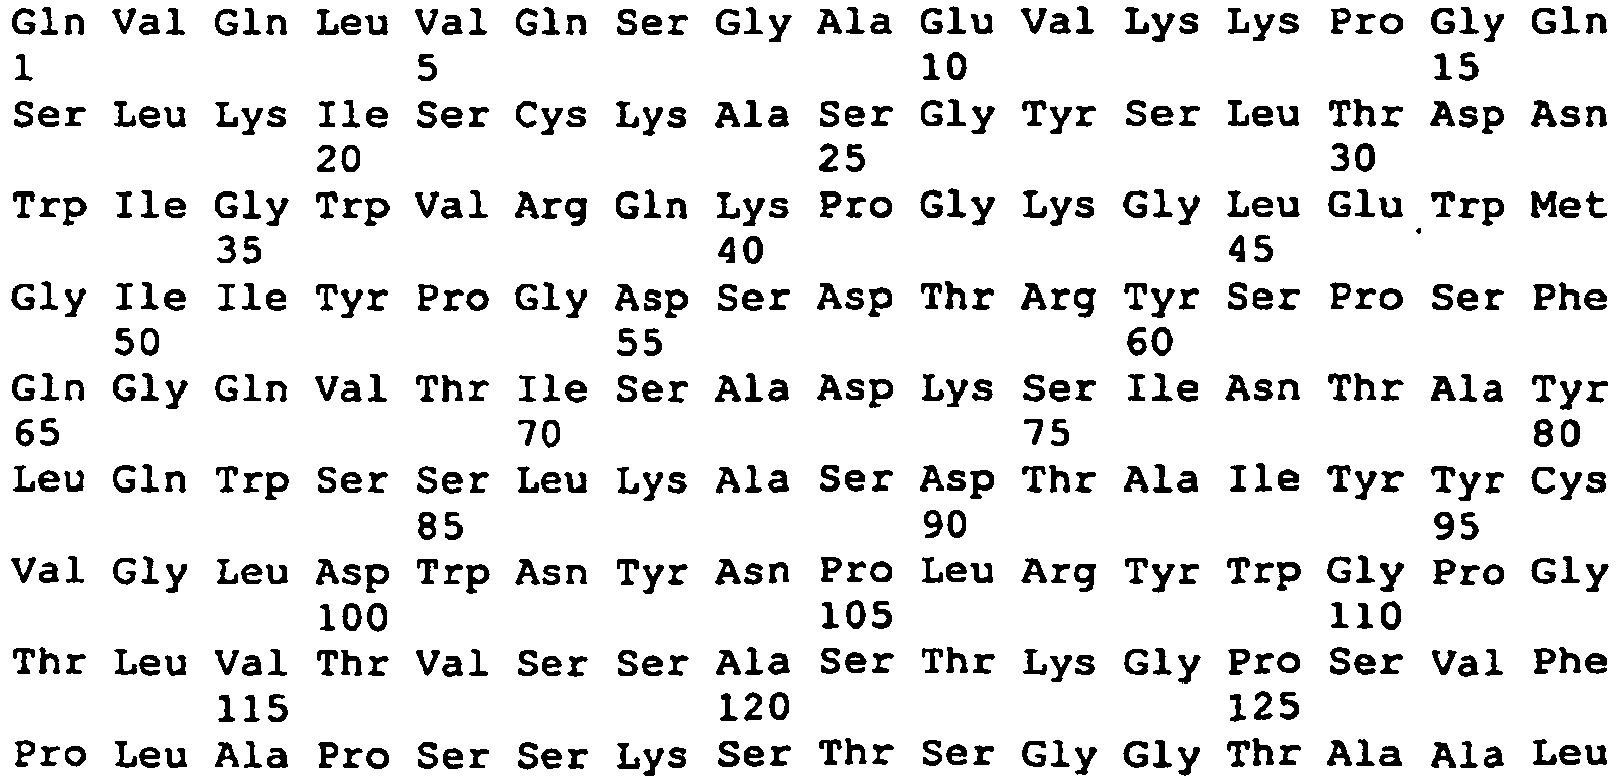

- <210> 42
<211> 5
<212> PRT
<213> Homo sapiens - <400> 42

- <210> 43
<211> 17
<212> PRT
<213> Homo sapiens - <400> 43

- <210> 44
<211> 10
<212> PRT
<213> Homo sapiens - <400> 44

- <210> 45
<211> 57
<212> DNA
<213> Homo sapiens - <400> 45
atggggtcaa ccgccatcct cgccctcctc ctggctgttc tccagggagt ctgtgcc 57 - <210> 46
<211> 663
<212> DNA
<213> Homo sapiens - <400> 46


- <210> 47
<211> 15
<212> DNA
<213> Homo sapiens - <400> 47
gacaactgga tcggc 15 - <210> 48
<211> 51
<212> DNA
<213> Homo sapiens - <400> 48
atcatctatc ctggtgactc tgacaccaga tacagtccgt ccttccaaggc 51 - <210> 49
<211> 30
<212> DNA
<213> Homo sapiens - <400> 49
ctcgattgga actacaaccc cctgcgatac 30 - <210> 50
<211> 19
<212> PRT
<213> Homo sapiens - <400> 50

- <210> 51
<211> 221
<212> PRT
<213> Homo sapiens - <400> 51


- <210> 52
<211> 5
<212> PRT
<213> Homo sapiens - <400> 52

- <210> 53
<211> 17
<212> PRT
<213> Homo sapiens - <400> 53

- <210> 54
<211> 10
<212> PRT
<213> Homo sapiens - <400> 54

- <210> 55
<211> 639
<212> DNA
<213> Homo sapiens - <400> 55


- <210> 56
<211> 33
<212> DNA
<213> Homo sapiens - <400> 56
tctggagata aattggggga taaatatgct tgc 33 - <210> 57
<211> 21
<212> DNA
<213> Homo sapiens - <400> 57
caagatagca agcggccctc a 21 - <210> 58
<211> 30
<212> DNA
<213> Homo sapiens - <400> 58
caggcgtggg acagcagcac tgccgtggta 30 - <210> 59
<211> 213
<212> PRT
<213> Homo sapiens - <400> 59


- <210> 60
<211> 11
<212> PRT
<213> Homo sapiens - <400> 60

- <210> 61
<211> 7
<212> PRT
<213> Homo sapiens - <400> 61

- <210> 62
<211> 10
<212> PRT
<213> Homo sapiens - <400> 62

- <210> 63
<211> 57
<212> DNA
<213> Homo sapiens - <400> 63
atggcctggt ctcctctcct cctcaccctt ctcattcact gcacagggtc ctgggcc 57 - <210> 64
<211> 648
<212> DNA
<213> Homo sapiens - <400> 64


- <210> 65
<211> 39
<212> DNA
<213> Homo sapiens - <400> 65
tccggaagca gctccgacat tgggagtaat tatgtatcc 39 - <210> 66
<211> 21
<212> DNA
<213> Homo sapiens - <400> 66
gacaataata agcgaccctc a 21 - <210> 67
<211> 33
<212> DNA
<213> Homo sapiens - <400> 67
ggaacatggg atagcagact gggtattgct gtg 33 - <210> 68
<211> 19
<212> PRT
<213> Homo sapiens - <400> 68

- <210> 69
<211> 216
<212> PRT
<213> Homo sapiens - <400> 69


- <210> 70
<211> 13
<212> PRT
<213> Homo sapiens - <400> 70

- <210> 71
<211> 7
<212> PRT
<213> Homo sapiens - <400> 71

- <210> 72
<211> 11
<212> PRT
<213> Homo sapiens - <400> 72

- <210> 73
<211> 20
<212> PRT
<213> Homo sapiens - <220>
<221> MISC_FEATURE
<223> K1-70 LC protein sequence of the 2-21 consecutive N-terminal amino acids obtained by Edman reaction - <400> 73

- <210> 74
<211> 764
<212> PRT
<213> Homo sapiens - <400> 74


- <210> 75
<211> 267
<212> PRT
<213> Homo sapiens - <400> 75
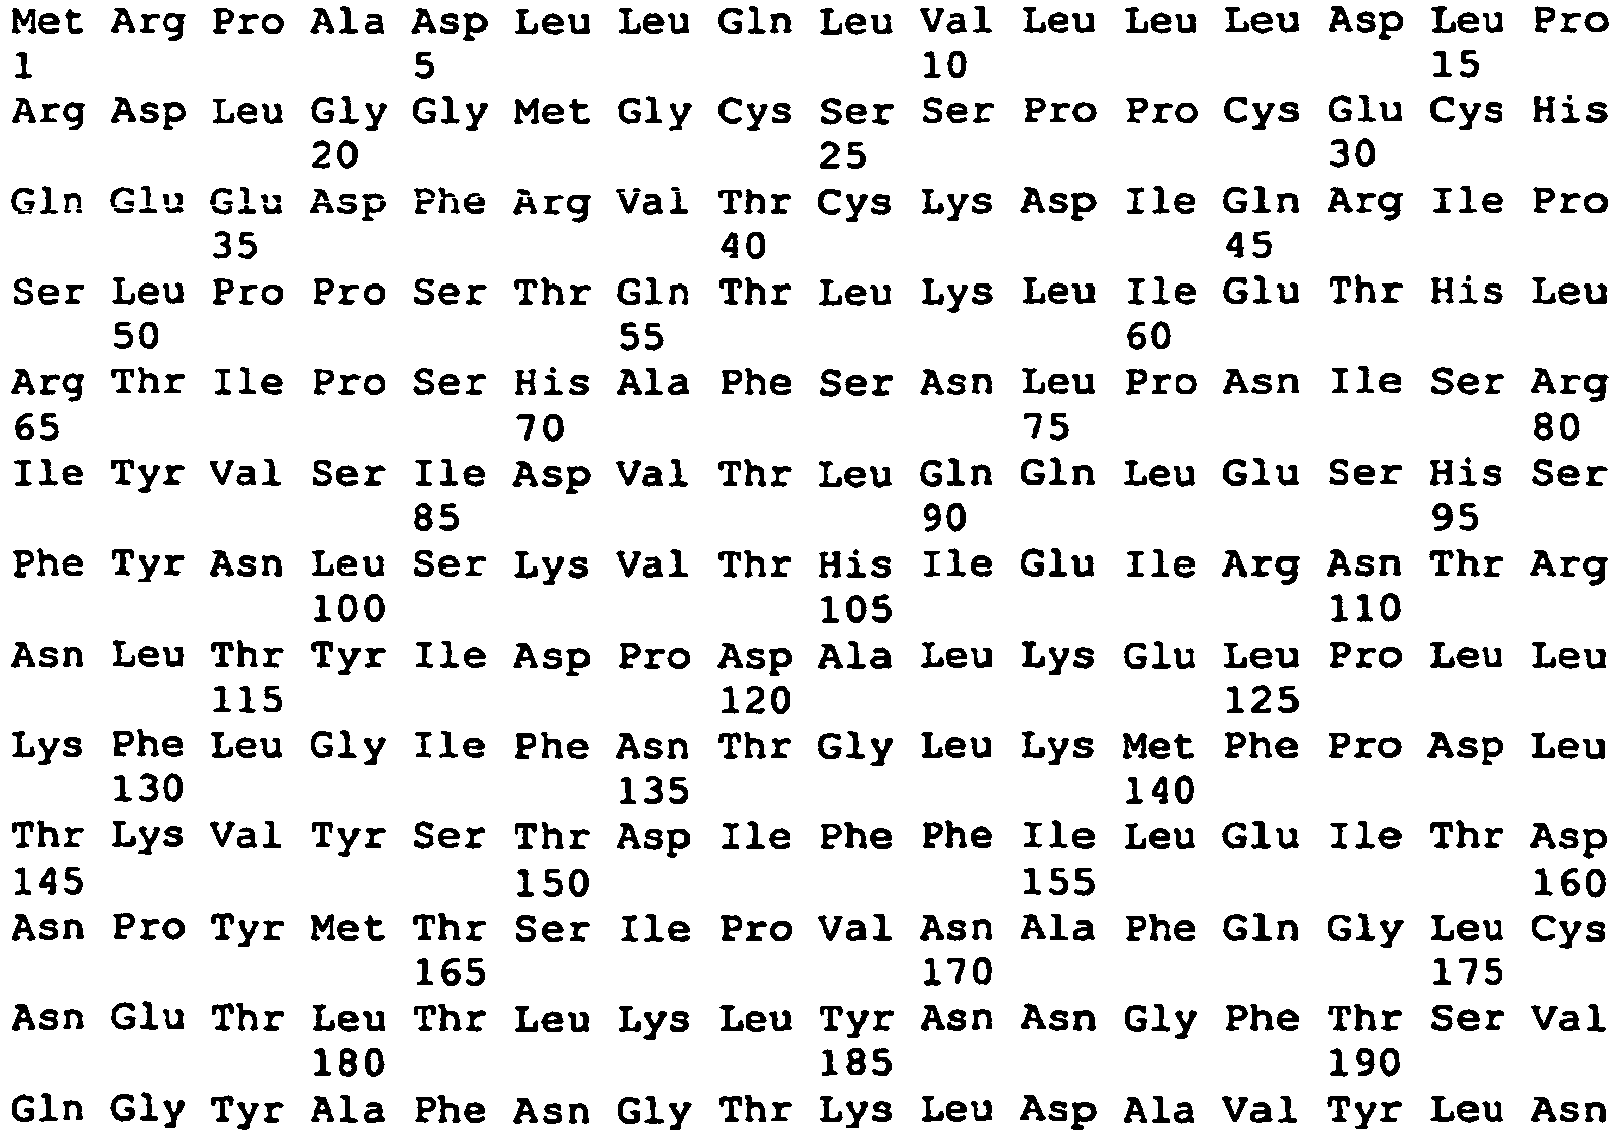

- <210> 76
<211> 336
<212> PRT
<213> Homo sapiens - <400> 76

- <210> 77
<211> 36
<212> DNA
Claims (16)
- An isolated human monoclonal or recombinant antibody molecule which binds to the TSHR and which reduces ligand-induced stimulation of the TSHR but has no effect on TSHR constitutive activity wherein the isolated human antibody molecule has the characteristic of patient serum TSHR autoantibodies of inhibiting TSH and M22 binding to the TSHR, and wherein the isolated human antibody molecule comprises SEQ ID No: 70 (CDR I), SEQ ID No: 71 (CDR II) and SEQ ID No: 72 (CDR III) and SEQ ID No: 42 or 52 (CDR I), SEQ ID No: 43 or 53 (CDR II) and SEQ ID No: 44 or 54 (CDR III).
- An isolated human antibody molecule according to claim 1, which has at least one further characteristic of patient serum TSHR autoantibodies selected from a binding affinity for the TSHR of at least 108 L/mol, preferably at least 109 L/mol, and the ability to block ligand-induced TSHR stimulation at an antibody concentration of less than 1µg/mL, preferably less than 0.1µg/mL.
- An isolated human antibody molecule according to claim 1 or 2 which is an antagonist of TSH, thyroid stimulating autoantibodies or human chorionic gonadotropin.
- An isolated antibody molecule according to any preceding claim which comprises a an antibody VH domain selected from the amino acid sequences of SEQ ID No: 41 and 51, preferably an isolated antibody molecule which comprises an antibody VH domain consisting of the amino acid sequence of SEQ ID No: 41 and 51.
- An isolated antibody molecule according to any preceding claim which comprises an isolated antibody molecule which comprises an antibody VL domain consisting of the amino acid sequence of SEQ ID No: 69.
- An isolated nucleotide encoding an isolated antibody molecule according to any one of claims 1-5.
- An isolated nucleotide according to claim 6 which comprises a nucleotide sequence of SEQ ID No: 37, SEQ ID No: 46 or SEQ ID No: 64.
- A vector including an isolated nucleotide according to claims 6 or 7.
- A host cell including a nucleotide according to claim 6 or 7, or a vector according to claim 8.
- A pharmaceutical composition comprising an isolated antibody molecule according to any one of claims 1-5.
- An isolated antibody molecule according to any one of claims 1-5 or a pharmaceutical composition according to claim 10 for use in therapy.
- An in vitro method of characterising the activity of TSHR antibodies, TSH or human chorionic gonadotropin, the method comprising a step including the use of an isolated antibody molecule according to any of claims 1-5.
- An in vitro diagnostic method for detecting analyte autoantibodies to the TSHR, the method comprising contacting a sample, which has been isolated from a subject believed to contain such analyte autoantibodies, and an antibody molecule according to any one of claims 1-5 with a TSHR or a fragment thereof.
- An in vitro diagnostic method for detecting analyte antibodies to the TSHR according to claim 13 in which the TSHR or fragment thereof is mutated at arginine 255 so that in said diagnostic method said mutated TSHR or fragment thereof interacts preferentially with analyte blocking-type TSHR antibodies compared to analyte stimulating-type TSHR antibodies.
- An in vitro diagnostic method according to claim 14 in which analyte TSHR antibody binding to TSHR260 or TSHR260 mutated at arginine 255 is detected by inhibition of binding of a directly or indirectly labelled TSHR antibody or fragment thereof to said TSHR260 or TSHR260 mutated at arginine 255
- An in vitro diagnostic method according to claim 15 in which said labelled TSHR antibody is a monoclonal, recombinant or synthetic antibody or fragment thereof
Priority Applications (4)
| Application Number | Priority Date | Filing Date | Title |
|---|---|---|---|
| EP13163959.3A EP2617735A3 (en) | 2008-12-24 | 2009-12-23 | Human anti tshr antibodies |
| EP13163955.1A EP2617734B1 (en) | 2008-12-24 | 2009-12-23 | Human anti tshr antibodies |
| PL13163955T PL2617734T3 (en) | 2008-12-24 | 2009-12-23 | Human anti tshr antibodies |
| PL09795799T PL2367850T3 (en) | 2008-12-24 | 2009-12-23 | Human anti tshr antibodies |
Applications Claiming Priority (3)
| Application Number | Priority Date | Filing Date | Title |
|---|---|---|---|
| GB0823562A GB0823562D0 (en) | 2008-12-24 | 2008-12-24 | Antibodies |
| GB0908945A GB0908945D0 (en) | 2009-05-22 | 2009-05-22 | Antibodies |
| PCT/GB2009/002946 WO2010073012A2 (en) | 2008-12-24 | 2009-12-23 | Antibodies |
Related Child Applications (3)
| Application Number | Title | Priority Date | Filing Date |
|---|---|---|---|
| EP13163955.1A Division-Into EP2617734B1 (en) | 2008-12-24 | 2009-12-23 | Human anti tshr antibodies |
| EP13163955.1A Division EP2617734B1 (en) | 2008-12-24 | 2009-12-23 | Human anti tshr antibodies |
| EP13163959.3A Division-Into EP2617735A3 (en) | 2008-12-24 | 2009-12-23 | Human anti tshr antibodies |
Publications (2)
| Publication Number | Publication Date |
|---|---|
| EP2367850A2 EP2367850A2 (en) | 2011-09-28 |
| EP2367850B1 true EP2367850B1 (en) | 2015-04-22 |
Family
ID=41683030
Family Applications (3)
| Application Number | Title | Priority Date | Filing Date |
|---|---|---|---|
| EP13163959.3A Withdrawn EP2617735A3 (en) | 2008-12-24 | 2009-12-23 | Human anti tshr antibodies |
| EP09795799.7A Active EP2367850B1 (en) | 2008-12-24 | 2009-12-23 | Human anti tshr antibodies |
| EP13163955.1A Active EP2617734B1 (en) | 2008-12-24 | 2009-12-23 | Human anti tshr antibodies |
Family Applications Before (1)
| Application Number | Title | Priority Date | Filing Date |
|---|---|---|---|
| EP13163959.3A Withdrawn EP2617735A3 (en) | 2008-12-24 | 2009-12-23 | Human anti tshr antibodies |
Family Applications After (1)
| Application Number | Title | Priority Date | Filing Date |
|---|---|---|---|
| EP13163955.1A Active EP2617734B1 (en) | 2008-12-24 | 2009-12-23 | Human anti tshr antibodies |
Country Status (7)
| Country | Link |
|---|---|
| US (2) | US9073992B2 (en) |
| EP (3) | EP2617735A3 (en) |
| JP (2) | JP5784504B2 (en) |
| CN (2) | CN102264764B (en) |
| ES (2) | ES2545759T3 (en) |
| PL (2) | PL2367850T3 (en) |
| WO (1) | WO2010073012A2 (en) |
Families Citing this family (14)
| Publication number | Priority date | Publication date | Assignee | Title |
|---|---|---|---|---|
| CN101799476B (en) * | 2001-08-23 | 2013-01-02 | Rsr有限公司 | Reagent box for sieving autoantibody for tsh receptor |
| PL2121758T3 (en) * | 2007-02-15 | 2015-02-27 | R S R Ltd | Human monoclonal antibodies to the thyrotropin receptor which act as antagonists |
| IN2014KN00742A (en) * | 2011-09-09 | 2015-10-02 | Quidel Corp | |
| GB2527286A (en) * | 2014-06-11 | 2015-12-23 | Rsr Ltd | Glycoprotein hormone receptor mutations |
| US10654934B2 (en) | 2016-04-01 | 2020-05-19 | Innovative Cellular Therapeutics CO., LTD. | Use of chimeric antigen receptor modified cells to treat cancer |
| WO2017167217A1 (en) | 2016-04-01 | 2017-10-05 | Innovative Cellular Therapeutics CO., LTD. | Use of chimeric antigen receptor modified cells to treat cancer |
| US20220227875A1 (en) * | 2019-05-31 | 2022-07-21 | University Of Florida Research Foundation, Incorporated | Vector-based therapy for thyroid disease |
| CN115298213A (en) | 2019-12-19 | 2022-11-04 | 奎多公司 | Monoclonal antibody fusion |
| CN111647624A (en) * | 2020-06-10 | 2020-09-11 | 成都和同易创生物科技有限公司 | TSAB human monoclonal antibody recombinant vector, recombinant antibody and preparation method thereof |
| WO2023069341A2 (en) * | 2021-10-20 | 2023-04-27 | Memorial Sloan Kettering Cancer Center | Anti-tshr multi-specific antibodies and uses thereof |
| CN114113637B (en) * | 2021-12-07 | 2024-03-12 | 郑州安图生物工程股份有限公司 | Thyroid stimulating hormone receptor antigen reagent and thyroid stimulating hormone receptor antibody quantitative detection kit |
| WO2024046384A1 (en) * | 2022-08-31 | 2024-03-07 | 长春金赛药业有限责任公司 | Antibody binding to thyroid-stimulating hormone receptor and use thereof |
| WO2025149667A1 (en) | 2024-01-12 | 2025-07-17 | Pheon Therapeutics Ltd | Antibody drug conjugates and uses thereof |
| CN118897090B (en) * | 2024-09-30 | 2025-06-06 | 美康生物科技股份有限公司 | Kit for detecting subtype of stimulating thyroid stimulating hormone receptor antibody, and preparation method and application thereof |
Family Cites Families (12)
| Publication number | Priority date | Publication date | Assignee | Title |
|---|---|---|---|---|
| JP4697820B2 (en) * | 1998-08-31 | 2011-06-08 | 宝ホールディングス株式会社 | Method for producing brewed sake |
| JP2000236882A (en) * | 1999-02-24 | 2000-09-05 | Shionogi & Co Ltd | Mouse nurse cell receptor gene |
| DE10130657A1 (en) | 2001-06-27 | 2003-01-16 | Axaron Bioscience Ag | New endothetially expressed protein and its use |
| CN101799476B (en) * | 2001-08-23 | 2013-01-02 | Rsr有限公司 | Reagent box for sieving autoantibody for tsh receptor |
| JP2003125780A (en) * | 2001-10-22 | 2003-05-07 | Mitsubishi Pharma Corp | Novel GPCRs, genes encoding them and their uses |
| CN1717418B (en) * | 2002-11-29 | 2011-03-30 | Rsr有限公司 | Antibody for the thyrotropin receptor and uses thereof |
| GB0418181D0 (en) | 2004-08-13 | 2004-09-15 | Rsr Ltd | Thyrotrophin receptor preparations,thyrotrophin receptor epitopes,antibody and hormone interactions therewith,and uses thereof |
| JP2009517015A (en) * | 2005-11-21 | 2009-04-30 | ドクトル フェニング ビオメッド ゲゼルシャフト ミット ベシュレンクテル ハフツング | Method for detecting and / or quantifying autoantibodies against recombinant polypeptides and TSH receptors |
| US8603466B2 (en) * | 2006-03-29 | 2013-12-10 | King's College London | Agonist antibodies against TSHR |
| US8097699B2 (en) | 2006-08-30 | 2012-01-17 | Rsr Limited | Crystal structure of thyroid stimulating hormone receptor |
| US8350012B2 (en) | 2007-01-25 | 2013-01-08 | Cedars-Sinai Medical Center | Inverse agonist monoclonal antibody that suppresses thyrotropin receptor constitutive activity |
| PL2121758T3 (en) * | 2007-02-15 | 2015-02-27 | R S R Ltd | Human monoclonal antibodies to the thyrotropin receptor which act as antagonists |
-
2009
- 2009-12-23 EP EP13163959.3A patent/EP2617735A3/en not_active Withdrawn
- 2009-12-23 CN CN200980152452.9A patent/CN102264764B/en active Active
- 2009-12-23 US US13/142,217 patent/US9073992B2/en active Active
- 2009-12-23 EP EP09795799.7A patent/EP2367850B1/en active Active
- 2009-12-23 EP EP13163955.1A patent/EP2617734B1/en active Active
- 2009-12-23 JP JP2011542893A patent/JP5784504B2/en active Active
- 2009-12-23 PL PL09795799T patent/PL2367850T3/en unknown
- 2009-12-23 CN CN201510226986.9A patent/CN104829721B/en active Active
- 2009-12-23 ES ES13163955.1T patent/ES2545759T3/en active Active
- 2009-12-23 WO PCT/GB2009/002946 patent/WO2010073012A2/en not_active Ceased
- 2009-12-23 ES ES09795799.7T patent/ES2540538T3/en active Active
- 2009-12-23 PL PL13163955T patent/PL2617734T3/en unknown
-
2015
- 2015-07-02 US US14/790,489 patent/US10428153B2/en active Active
- 2015-07-22 JP JP2015144729A patent/JP5978360B2/en active Active
Also Published As
| Publication number | Publication date |
|---|---|
| US9073992B2 (en) | 2015-07-07 |
| ES2545759T3 (en) | 2015-09-15 |
| EP2617734A1 (en) | 2013-07-24 |
| US10428153B2 (en) | 2019-10-01 |
| CN102264764A (en) | 2011-11-30 |
| JP5978360B2 (en) | 2016-08-24 |
| US20110300138A1 (en) | 2011-12-08 |
| ES2540538T3 (en) | 2015-07-10 |
| US20150344582A1 (en) | 2015-12-03 |
| CN104829721B (en) | 2018-06-19 |
| WO2010073012A3 (en) | 2010-08-19 |
| EP2367850A2 (en) | 2011-09-28 |
| EP2617735A3 (en) | 2013-10-16 |
| JP2012513747A (en) | 2012-06-21 |
| WO2010073012A2 (en) | 2010-07-01 |
| PL2617734T3 (en) | 2016-01-29 |
| JP5784504B2 (en) | 2015-09-24 |
| EP2617734B1 (en) | 2015-07-15 |
| EP2617735A2 (en) | 2013-07-24 |
| PL2367850T3 (en) | 2015-12-31 |
| CN104829721A (en) | 2015-08-12 |
| CN102264764B (en) | 2015-06-10 |
| JP2016034934A (en) | 2016-03-17 |
Similar Documents
| Publication | Publication Date | Title |
|---|---|---|
| EP2367850B1 (en) | Human anti tshr antibodies | |
| JP7332627B2 (en) | Optimized anti-TL1A antibody | |
| JP6472999B2 (en) | Methods for treating metabolic disorders | |
| KR101615935B1 (en) | Antibodies against human nkg2d and uses thereof | |
| WO2019184912A1 (en) | Anti-cd47 antibody and uses thereof | |
| DK2383296T3 (en) | Antibody of the thyrotropin receptor and its applications | |
| KR20140048230A (en) | Antibodies against epidermal growth factor receptor (egfr) and uses thereof | |
| EP3500293A1 (en) | Methods of treating crohn's disease with an anti-nkg2d antibody | |
| TWI811216B (en) | Method of treating pediatric disorders | |
| US8840891B2 (en) | Human monoclonal antibodies to the thyrotropin receptor which act as antagonists | |
| JP5345556B2 (en) | Human monoclonal antibody against thyrotropin receptor acting as an antagonist | |
| EP2726505A1 (en) | Therapeutic targeting of ficolin-3 | |
| WO2023283211A2 (en) | Cd21 antibodies and uses thereof | |
| CN118525034A (en) | Canine interleukin-31 receptor αI caninized antibody | |
| HUE034370T2 (en) | Antibody for the thyrotropin receptor and uses thereof |
Legal Events
| Date | Code | Title | Description |
|---|---|---|---|
| PUAI | Public reference made under article 153(3) epc to a published international application that has entered the european phase |
Free format text: ORIGINAL CODE: 0009012 |
|
| 17P | Request for examination filed |
Effective date: 20110328 |
|
| AK | Designated contracting states |
Kind code of ref document: A2 Designated state(s): AT BE BG CH CY CZ DE DK EE ES FI FR GB GR HR HU IE IS IT LI LT LU LV MC MK MT NL NO PL PT RO SE SI SK SM TR |
|
| DAX | Request for extension of the european patent (deleted) | ||
| 17Q | First examination report despatched |
Effective date: 20120502 |
|
| GRAP | Despatch of communication of intention to grant a patent |
Free format text: ORIGINAL CODE: EPIDOSNIGR1 |
|
| INTG | Intention to grant announced |
Effective date: 20140605 |
|
| GRAP | Despatch of communication of intention to grant a patent |
Free format text: ORIGINAL CODE: EPIDOSNIGR1 |
|
| INTG | Intention to grant announced |
Effective date: 20141110 |
|
| RIN1 | Information on inventor provided before grant (corrected) |
Inventor name: FURMANIAK, JADWIGA Inventor name: REES SMITH, BERNARD Inventor name: SANDERS, JANE |
|
| GRAS | Grant fee paid |
Free format text: ORIGINAL CODE: EPIDOSNIGR3 |
|
| GRAA | (expected) grant |
Free format text: ORIGINAL CODE: 0009210 |
|
| AK | Designated contracting states |
Kind code of ref document: B1 Designated state(s): AT BE BG CH CY CZ DE DK EE ES FI FR GB GR HR HU IE IS IT LI LT LU LV MC MK MT NL NO PL PT RO SE SI SK SM TR |
|
| REG | Reference to a national code |
Ref country code: GB Ref legal event code: FG4D |
|
| REG | Reference to a national code |
Ref country code: CH Ref legal event code: EP |
|
| REG | Reference to a national code |
Ref country code: AT Ref legal event code: REF Ref document number: 723188 Country of ref document: AT Kind code of ref document: T Effective date: 20150515 |
|
| REG | Reference to a national code |
Ref country code: IE Ref legal event code: FG4D |
|
| REG | Reference to a national code |
Ref country code: DE Ref legal event code: R096 Ref document number: 602009030842 Country of ref document: DE Effective date: 20150603 |
|
| REG | Reference to a national code |
Ref country code: CH Ref legal event code: NV Representative=s name: KELLER AND PARTNER PATENTANWAELTE AG, CH |
|
| REG | Reference to a national code |
Ref country code: ES Ref legal event code: FG2A Ref document number: 2540538 Country of ref document: ES Kind code of ref document: T3 Effective date: 20150710 |
|
| REG | Reference to a national code |
Ref country code: SE Ref legal event code: TRGR |
|
| REG | Reference to a national code |
Ref country code: NL Ref legal event code: T3 |
|
| REG | Reference to a national code |
Ref country code: LT Ref legal event code: MG4D |
|
| PG25 | Lapsed in a contracting state [announced via postgrant information from national office to epo] |
Ref country code: FI Free format text: LAPSE BECAUSE OF FAILURE TO SUBMIT A TRANSLATION OF THE DESCRIPTION OR TO PAY THE FEE WITHIN THE PRESCRIBED TIME-LIMIT Effective date: 20150422 Ref country code: NO Free format text: LAPSE BECAUSE OF FAILURE TO SUBMIT A TRANSLATION OF THE DESCRIPTION OR TO PAY THE FEE WITHIN THE PRESCRIBED TIME-LIMIT Effective date: 20150722 Ref country code: PT Free format text: LAPSE BECAUSE OF FAILURE TO SUBMIT A TRANSLATION OF THE DESCRIPTION OR TO PAY THE FEE WITHIN THE PRESCRIBED TIME-LIMIT Effective date: 20150824 Ref country code: LT Free format text: LAPSE BECAUSE OF FAILURE TO SUBMIT A TRANSLATION OF THE DESCRIPTION OR TO PAY THE FEE WITHIN THE PRESCRIBED TIME-LIMIT Effective date: 20150422 Ref country code: HR Free format text: LAPSE BECAUSE OF FAILURE TO SUBMIT A TRANSLATION OF THE DESCRIPTION OR TO PAY THE FEE WITHIN THE PRESCRIBED TIME-LIMIT Effective date: 20150422 |
|
| PG25 | Lapsed in a contracting state [announced via postgrant information from national office to epo] |
Ref country code: IS Free format text: LAPSE BECAUSE OF FAILURE TO SUBMIT A TRANSLATION OF THE DESCRIPTION OR TO PAY THE FEE WITHIN THE PRESCRIBED TIME-LIMIT Effective date: 20150822 Ref country code: GR Free format text: LAPSE BECAUSE OF FAILURE TO SUBMIT A TRANSLATION OF THE DESCRIPTION OR TO PAY THE FEE WITHIN THE PRESCRIBED TIME-LIMIT Effective date: 20150723 Ref country code: LV Free format text: LAPSE BECAUSE OF FAILURE TO SUBMIT A TRANSLATION OF THE DESCRIPTION OR TO PAY THE FEE WITHIN THE PRESCRIBED TIME-LIMIT Effective date: 20150422 |
|
| REG | Reference to a national code |
Ref country code: FR Ref legal event code: PLFP Year of fee payment: 7 |
|
| REG | Reference to a national code |
Ref country code: PL Ref legal event code: T3 |
|
| REG | Reference to a national code |
Ref country code: DE Ref legal event code: R097 Ref document number: 602009030842 Country of ref document: DE |
|
| PG25 | Lapsed in a contracting state [announced via postgrant information from national office to epo] |
Ref country code: DK Free format text: LAPSE BECAUSE OF FAILURE TO SUBMIT A TRANSLATION OF THE DESCRIPTION OR TO PAY THE FEE WITHIN THE PRESCRIBED TIME-LIMIT Effective date: 20150422 Ref country code: EE Free format text: LAPSE BECAUSE OF FAILURE TO SUBMIT A TRANSLATION OF THE DESCRIPTION OR TO PAY THE FEE WITHIN THE PRESCRIBED TIME-LIMIT Effective date: 20150422 |
|
| PLBE | No opposition filed within time limit |
Free format text: ORIGINAL CODE: 0009261 |
|
| STAA | Information on the status of an ep patent application or granted ep patent |
Free format text: STATUS: NO OPPOSITION FILED WITHIN TIME LIMIT |
|
| PG25 | Lapsed in a contracting state [announced via postgrant information from national office to epo] |
Ref country code: CZ Free format text: LAPSE BECAUSE OF FAILURE TO SUBMIT A TRANSLATION OF THE DESCRIPTION OR TO PAY THE FEE WITHIN THE PRESCRIBED TIME-LIMIT Effective date: 20150422 Ref country code: RO Free format text: LAPSE BECAUSE OF NON-PAYMENT OF DUE FEES Effective date: 20150422 Ref country code: SK Free format text: LAPSE BECAUSE OF FAILURE TO SUBMIT A TRANSLATION OF THE DESCRIPTION OR TO PAY THE FEE WITHIN THE PRESCRIBED TIME-LIMIT Effective date: 20150422 |
|
| 26N | No opposition filed |
Effective date: 20160125 |
|
| PG25 | Lapsed in a contracting state [announced via postgrant information from national office to epo] |
Ref country code: SI Free format text: LAPSE BECAUSE OF FAILURE TO SUBMIT A TRANSLATION OF THE DESCRIPTION OR TO PAY THE FEE WITHIN THE PRESCRIBED TIME-LIMIT Effective date: 20150422 |
|
| PG25 | Lapsed in a contracting state [announced via postgrant information from national office to epo] |
Ref country code: LU Free format text: LAPSE BECAUSE OF FAILURE TO SUBMIT A TRANSLATION OF THE DESCRIPTION OR TO PAY THE FEE WITHIN THE PRESCRIBED TIME-LIMIT Effective date: 20151223 Ref country code: MC Free format text: LAPSE BECAUSE OF FAILURE TO SUBMIT A TRANSLATION OF THE DESCRIPTION OR TO PAY THE FEE WITHIN THE PRESCRIBED TIME-LIMIT Effective date: 20150422 |
|
| REG | Reference to a national code |
Ref country code: FR Ref legal event code: PLFP Year of fee payment: 8 |
|
| PG25 | Lapsed in a contracting state [announced via postgrant information from national office to epo] |
Ref country code: SM Free format text: LAPSE BECAUSE OF FAILURE TO SUBMIT A TRANSLATION OF THE DESCRIPTION OR TO PAY THE FEE WITHIN THE PRESCRIBED TIME-LIMIT Effective date: 20150422 Ref country code: HU Free format text: LAPSE BECAUSE OF FAILURE TO SUBMIT A TRANSLATION OF THE DESCRIPTION OR TO PAY THE FEE WITHIN THE PRESCRIBED TIME-LIMIT; INVALID AB INITIO Effective date: 20091223 Ref country code: BG Free format text: LAPSE BECAUSE OF FAILURE TO SUBMIT A TRANSLATION OF THE DESCRIPTION OR TO PAY THE FEE WITHIN THE PRESCRIBED TIME-LIMIT Effective date: 20150422 |
|
| REG | Reference to a national code |
Ref country code: AT Ref legal event code: UEP Ref document number: 723188 Country of ref document: AT Kind code of ref document: T Effective date: 20150422 |
|
| PG25 | Lapsed in a contracting state [announced via postgrant information from national office to epo] |
Ref country code: CY Free format text: LAPSE BECAUSE OF FAILURE TO SUBMIT A TRANSLATION OF THE DESCRIPTION OR TO PAY THE FEE WITHIN THE PRESCRIBED TIME-LIMIT Effective date: 20150422 |
|
| PG25 | Lapsed in a contracting state [announced via postgrant information from national office to epo] |
Ref country code: MT Free format text: LAPSE BECAUSE OF FAILURE TO SUBMIT A TRANSLATION OF THE DESCRIPTION OR TO PAY THE FEE WITHIN THE PRESCRIBED TIME-LIMIT Effective date: 20150422 |
|
| REG | Reference to a national code |
Ref country code: FR Ref legal event code: PLFP Year of fee payment: 9 |
|
| PG25 | Lapsed in a contracting state [announced via postgrant information from national office to epo] |
Ref country code: MK Free format text: LAPSE BECAUSE OF FAILURE TO SUBMIT A TRANSLATION OF THE DESCRIPTION OR TO PAY THE FEE WITHIN THE PRESCRIBED TIME-LIMIT Effective date: 20150422 |
|
| REG | Reference to a national code |
Ref country code: CH Ref legal event code: PFA Owner name: RSR LIMITED, GB Free format text: FORMER OWNER: RSR LIMITED, GB |
|
| P01 | Opt-out of the competence of the unified patent court (upc) registered |
Effective date: 20230517 |
|
| PGFP | Annual fee paid to national office [announced via postgrant information from national office to epo] |
Ref country code: DE Payment date: 20241230 Year of fee payment: 16 |
|
| PGFP | Annual fee paid to national office [announced via postgrant information from national office to epo] |
Ref country code: ES Payment date: 20250131 Year of fee payment: 16 |
|
| PGFP | Annual fee paid to national office [announced via postgrant information from national office to epo] |
Ref country code: CH Payment date: 20250101 Year of fee payment: 16 |
|
| REG | Reference to a national code |
Ref country code: CH Ref legal event code: U11 Free format text: ST27 STATUS EVENT CODE: U-0-0-U10-U11 (AS PROVIDED BY THE NATIONAL OFFICE) Effective date: 20260101 |
|
| PGFP | Annual fee paid to national office [announced via postgrant information from national office to epo] |
Ref country code: GB Payment date: 20251216 Year of fee payment: 17 |
|
| PGFP | Annual fee paid to national office [announced via postgrant information from national office to epo] |
Ref country code: AT Payment date: 20251222 Year of fee payment: 17 |
|
| PGFP | Annual fee paid to national office [announced via postgrant information from national office to epo] |
Ref country code: IT Payment date: 20251219 Year of fee payment: 17 |
|
| PGFP | Annual fee paid to national office [announced via postgrant information from national office to epo] |
Ref country code: NL Payment date: 20251219 Year of fee payment: 17 Ref country code: FR Payment date: 20251222 Year of fee payment: 17 |
|
| REG | Reference to a national code |
Ref country code: DE Ref legal event code: R082 Ref document number: 602009030842 Country of ref document: DE Representative=s name: HOFFMANN EITLE PATENT- UND RECHTSANWAELTE PART, DE |
|
| PGFP | Annual fee paid to national office [announced via postgrant information from national office to epo] |
Ref country code: BE Payment date: 20251219 Year of fee payment: 17 Ref country code: TR Payment date: 20251217 Year of fee payment: 17 |
|
| PGFP | Annual fee paid to national office [announced via postgrant information from national office to epo] |
Ref country code: SE Payment date: 20251219 Year of fee payment: 17 |
|
| PGFP | Annual fee paid to national office [announced via postgrant information from national office to epo] |
Ref country code: IE Payment date: 20251219 Year of fee payment: 17 |
|
| PGFP | Annual fee paid to national office [announced via postgrant information from national office to epo] |
Ref country code: PL Payment date: 20251212 Year of fee payment: 17 |