EP1655893B1 - Simulated annealing for traffic matrix estimation - Google Patents
Simulated annealing for traffic matrix estimation Download PDFInfo
- Publication number
- EP1655893B1 EP1655893B1 EP05300816A EP05300816A EP1655893B1 EP 1655893 B1 EP1655893 B1 EP 1655893B1 EP 05300816 A EP05300816 A EP 05300816A EP 05300816 A EP05300816 A EP 05300816A EP 1655893 B1 EP1655893 B1 EP 1655893B1
- Authority
- EP
- European Patent Office
- Prior art keywords
- traffic
- traffic matrix
- matrix
- link
- fitness function
- Prior art date
- Legal status (The legal status is an assumption and is not a legal conclusion. Google has not performed a legal analysis and makes no representation as to the accuracy of the status listed.)
- Expired - Lifetime
Links
Images


Classifications
-
- H—ELECTRICITY
- H04—ELECTRIC COMMUNICATION TECHNIQUE
- H04L—TRANSMISSION OF DIGITAL INFORMATION, e.g. TELEGRAPHIC COMMUNICATION
- H04L41/00—Arrangements for maintenance, administration or management of data switching networks, e.g. of packet switching networks
- H04L41/14—Network analysis or design
- H04L41/145—Network analysis or design involving simulating, designing, planning or modelling of a network
-
- G—PHYSICS
- G06—COMPUTING OR CALCULATING; COUNTING
- G06Q—INFORMATION AND COMMUNICATION TECHNOLOGY [ICT] SPECIALLY ADAPTED FOR ADMINISTRATIVE, COMMERCIAL, FINANCIAL, MANAGERIAL OR SUPERVISORY PURPOSES; SYSTEMS OR METHODS SPECIALLY ADAPTED FOR ADMINISTRATIVE, COMMERCIAL, FINANCIAL, MANAGERIAL OR SUPERVISORY PURPOSES, NOT OTHERWISE PROVIDED FOR
- G06Q10/00—Administration; Management
- G06Q10/04—Forecasting or optimisation specially adapted for administrative or management purposes, e.g. linear programming or "cutting stock problem"
-
- H—ELECTRICITY
- H04—ELECTRIC COMMUNICATION TECHNIQUE
- H04L—TRANSMISSION OF DIGITAL INFORMATION, e.g. TELEGRAPHIC COMMUNICATION
- H04L41/00—Arrangements for maintenance, administration or management of data switching networks, e.g. of packet switching networks
- H04L41/14—Network analysis or design
- H04L41/147—Network analysis or design for predicting network behaviour
Definitions
- the invention is directed to the estimating performance of communication networks and in particular to a simulated annealing method and system for traffic matrix estimation (SATME).
- SATME traffic matrix estimation
- a network provider may optimize network performance based on the knowledge of how much traffic has to be moved if a link fails, what happens if traffic between two points is moved from a link to another, is most traffic originating in a sub-network (autonomous system, country, or company) staying in that sub-network or not, etc. This knowledge is used generally for routing path calculations, load balancing, etc.
- Network engineering tools were designed for handling these issues created by the increases in traffic demands or changes in the existing demands and determining the necessary expansion or modification to the network to support the projected traffic. These tools generally aid in revising network designs and routing schemes to avoid traffic bottlenecks, enable differential pricing of services, etc. However, all these tools require knowledge of traffic statistics, and more specifically of the real time source-destination traffic demands.
- a way of keeping these statistics for a packet based network is to look at each packet and record its source and destination.
- this method requires huge tables for recording this information.
- the ingress into the subset and the egress from the subset will not be available without looking at the source and destination addresses and then determining the path the packet would take as indicated by the routing information. This would be infeasible for large networks and large numbers of packets.
- a traffic matrix is typically expressed as the total bytes of data or the total number of packets or connections between all of the source-destination pairs of nodes. While the current routers are able to measure the counts for the incoming and outgoing traffic at each interface (incoming and outgoing links), it is generally impossible to derive the traffic matrix from the link counts with mathematical certainty. The best that can be done is to make a probabilistic inference concerning the traffic matrix from the observed link traffic.
- AT&T proposed to infer traffic matrices from the available measurements of link loads, by combining two known models, namely the gravity model with the tomographic model.
- the gravity model assumes that the traffic between the sites is proportional to the traffic at each site on per peer basis (as opposed to per router basis) for the outbound traffic, and that there is no systematic difference between the traffic in different locations.
- the tomographic model applies link constraints based on models. The combination of these models reduces the problem size for large networks and provides more accurate results that the gravity and tomographic models separately.
- the tomo-gravity method does not allow for easy specification of arbitrary constraints, such as knowing that if a link is twice the speed of another, it probably has roughly twice the traffic. Also, this method is based on assuming that the traffic follows the 'gravity' model, which can not be assumed in practice.
- Simulated annealing is an optimization technique developed for metallurgical processes, whereby a control parameter is used to model the temperature of an oven during annealing.
- the control parameter hence called temperature (T)
- T is set to an initial value and is lowered over time, according to a predetermined schedule.
- a change to an initial configuration is made by moving a component or interchanging locations of two components; the placement is changed randomly to get a new placement.
- the control parameter T indicates the probability of accepting moves (shuffles) that result in increased cost. After the shuffle, the cost of the new placement is evaluated and if there is a decrease in cost, the configuration is accepted. Otherwise, the new configuration is accepted with a probability that depends on T. T is then lowered using, for example, an exponential function, and the process is stopped when T reduces to a very low value which requires that only moves that reduce costs are to be accepted.
- the algorithm starts with a very high value for T that gradually decreases so that shuffles that increase cost have a progressively lower probability of being accepted. In this way, the algorithm converges to an optimal, or near optimal configuration.
- the main idea of the present invention is to adapt the simulated annealing algorithm to communication networks with a view to generate a traffic matrix estimation represented as a probability distribution. Advantages of the solution are that it requires no assumptions about the traffic (i.e. it allows the user to specify prior information about the network and traffic flows in a simple manner) and the estimation matrices enable assessment of variations over all possibilities as well as correlations between elements.
- the SATME (simulated annealing for traffic matrix estimation) method according to the invention is used in a different way than the simulated annealing.
- the simulated annealing algorithm determines a (close to) optimal solution of an objective function, whiled what is needed for traffic matrix estimation is a uniform distribution over the set of all possible tables that satisfy a set of given constraints.
- the reason for requiring a uniform distribution over the possibilities is so as to not bias the potential answers. Since there are many possible traffic matrices that will satisfy the given link counts, a single answer as provided by directly applying the SA algorithm is inaccurate. Ideally, the method should provide the most likely traffic matrix, as well as some measure of its variability. These are both possible to calculate from the information provided by the invention.
- constraints Another adaptation added to the SA algorithm as known is the use of constraints.
- information that the user knows about the network traffic is explicitly encoded as constraints.
- the constraints are encoded as components of an objective function (or energy), that is then minimized using simulated annealing.
- arbitrary constraints of any form can be included, and the case where there are no feasible solutions can be diagnosed by the objective function not converging to zero.
- Figure 1 shows a simple example of a network 100 used to illustrate the invention.
- This network has five nodes N1-N5, which are connected over links 10, 12, 14, 16, 18 and 20 as shown. More particularly, since the traffic is bidirectional, indices are associated with the reference numeral identifying a certain link to reflect also the direction. Thus, for the link between nodes N1 and N2, 10 12 is used for the direction from node N1 to N2, and 10 21 is used for the direction from node N2 to N1.
- the term 'connection' is used here for the end-to-end (source-to-destination) traffic and is referred to here using letter C followed by the numbers of the connected node. For example, a connection between nodes N1 and N5 is denoted with C15.
- a connection may be routed along a plurality of paths.
- network 100 may route the traffic originating at node N1 and destined to node N4 (i.e. connection C14) along a path consisting of links 10 21 , 12 23 and 14 34 , or along a path consisting of link 16 14 alone.
- Selection of the path (also referred to as an end-to-end route) for a connection is made by the routing algorithm used by the network. As most networks use a shortest path algorithm, in the above example the N1-N4 traffic will be routed along link 16 14 .
- Figure 2 is a connections table, also referred to as a Source-Destination (SD) table (or matrix), showing an example of all connections currently established between nodes N1 to N5 over network 100 of Figure 1 .
- the connections are bidirectional; for example the number of connections from node N1 to node N5 (C15) is 4 , and the number of connections from node N5 to node N1 (C51) is 5.
- the total for the connections leaving a respective node (outgoing connections) is provided in the last column and the total number of connections received by a respective node (incoming connections) is provided in the last row of the connections table.
- node N1 sources 19 connections and terminates 20 connections.
- Figure 3a is a link traffic table showing how network 100 may route the connections (along which particular links), assuming that the network uses a shortest path routing algorithm.
- link 10 12 carries 13 connections, namely 5 C12 connections (between N1 and N2), 4 C13 connections (between N1 and N3) and 5 C15 connections (between N1 and N5).
- link 20 35 carries 23 connections, namely 4 C15 connections (between N1 and N5), 7 C25 connections (between N2 and N5), 5 C35 connections (between N3 and N5) and 7 C45 connections (between N4 and N5).
- the last column of link traffic table provides the total number of connections along a link in one direction, including the by-pass connections and the connections sourced by the node for the respective direction.
- the last row provides the total number of connections entering a node, including the connections for the other direction by that node and those forwarded to other nodes. These numbers are referred here as the 'link counts'.
- connection C51 is served by a path from node N5 to node N3 (along link 20 53 ), from node N3 to node N2 (along link 12 32 ) and from node N2 to node N1 (along link 12 21 ).
- the link counts information is available in modern networks; however, the source-to-destination information is not.
- the link counts are used according to the invention to establish the source-to-destination traffic matrix, by adapting the SA method to the link traffic matrix problem.
- the method according to the invention exploits the SA's ability to explore a region of the constraint space.
- the invention uses a plurality of constraints as penalties, and then seeks a solution that minimizes the sum of the penalties. Again, there are many solutions that satisfy the constraints, but what is searched for is in essence a uniform distribution over all these possibilities.
- Figure 4 shows a SD matrix for the 5-node network of Figure 1 , where the number of connections is to be determined; they are denoted with 'm' followed by an index for the respective source-destination node pairs.
- m 54 represent the number of connections between nodes N5 and N4. The idea is to determine the elements of the SD matrix (the original SD matrix) using SA algorithm in a specific way and also using constraints that represent various components of the problem.
- the constraints are classified into two categories, namely absolute and soft constraints.
- the hard constraints are the most important constraints that account for the actual traffic (number of packets and bytes) seen art each ingress or egress point, in other words the link counts which are observed values of the link traffic.
- Other hard constraints represent routing rules, such as the shortest path routing or any pre-specified path.
- Soft constraints may for example represent an a priori knowledge about the network, such as specific links typical service twice the traffic of another.
- the example network of Figure 1 is again used, in combination with the link traffic table of Figure 3a .
- the first absolute constraint for any network is that no connection may originate and terminate on the same node.
- weights are assigned to violations of these constraints.
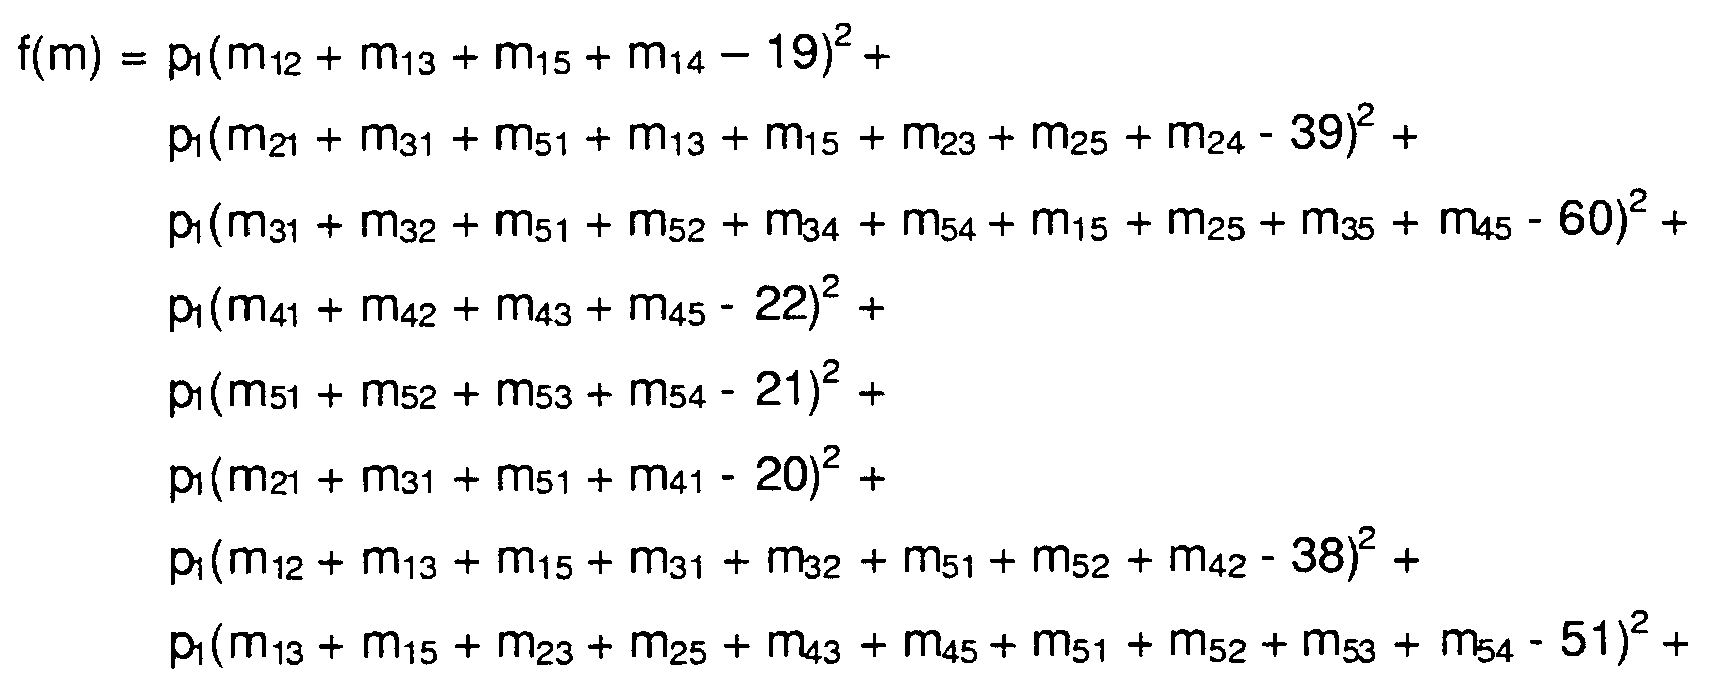
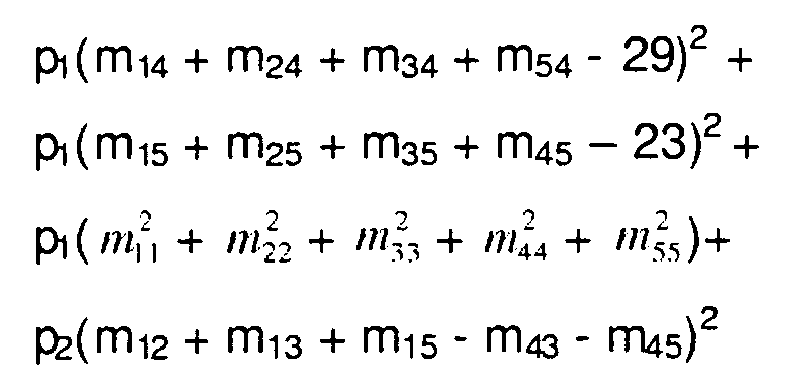
- the constraints are used to create a fitness function f(m) that is then minimized using SA algorithm.
- the invention proposes an objective function constructed as a sum of weighted squared terms.
- the absolute constraints are introduced as the difference between the known link total (from the link traffic table) for the respective direction and the current estimated link total (the sum of respective elements m of the estimated matrix).
- the soft constraints are also accounted for, in accordance to their assigned weight.
- a starting SD traffic matrix is chosen, denoted with x 0 .
- the fitness function for this proposed matrix is then calculated, denoted here with f(x0).
- an element of this matrix is picked uniformly, i.e. each element is selected with equal probability, using a standard random number generator. This element is then increased or decreased randomly. For example, if when flipping a coin, the coin comes up heads, a ⁇ 1' is added to the selected element, otherwise a ⁇ 1' is subtracted.
- the intermediate matrices that are obtained each successive iteration are referred to as temporary SDF traffic matrices.
- the temporary matrix x n corresponding to the steady state is accepted as a potential SD traffic matrix that satisfies all the constraints.
- h(n) is defined as a sequence function, which depends of the number n of iterations.
- a geometrically decaying function of the form below is preferably used, but other functions are equally recommendable (i.e. a logarithmic function).
- FIG. 5 illustrates the SATME system of the invention used for generating a set of potential SD matrices 55.
- the SATME system includes a SD matrix generator 50, a random number generator 51, a fitness function calculation unit 52, a SA algorithm processor 53, and a sequence generator 54.
- SD matrix generator 50 generates the starting matrix x 0 with the elements chosen uniformly on minimum, based on the known link counts and the known network configuration (number of nodes and the links between the nodes).
- the fitness function calculation unit 52 calculates the fitness function for the matrices that are presented to it. In this case, in this case it calculates the starting fitness function f(x0) for the starting matrix; as indicated above, f(m) is calculated using the weighted absolute and soft constraints, and is presented to processor 53 for minimization.
- the random number generator 51 selects randomly one of the elements of the starting matrix and increases/decreases this element, again randomly.
- the new value for the selected element replaces the old value, in the starting matrix, resulting in a randomly modified SD matrix, y.
- the fitness function generator 52 calculates now a new, current fitness function y for the randomly modified SD traffic matrix, and again provides it to processor 53.
- SA algorithm processor 53 compares the starting and the current fitness functions and begins minimizing the value of the current function using iterations and, the random number r, according to the sequence provided by the sequence generator 54.
- Sequence generator 54 uses a selected type of function for the SA algorithm. As above, a geometrically decaying function is preferably selected for generator 54, and the parameters of the function are user-configurable. Also, the number of iterations n is user configurable. When the fitness function is close to 0, the system has arrived to a steady state, and the respective matrix elements m are used for a potential SD matrix x n . These operations are repeated a large number of times, each time recording the resulting matrix as a potential answer.
- Figures 6a and 6b show how correlation between two elements of the SD traffic matrix may be obtained after 100 iterations. These figures aim to find the correlation between m 12 and m 34 .
- the range of m 12 is 0 to 17, since in the analysis, the largest value seen for m 12 was 17, as can be seen from the histogram.
- the invention adapts the know annealing algorithm by first selecting a plurality of initial solutions uniformly over a larger space of tables. Each element of an initial solution is selected uniformly on [0, m] where m is the minimum of the row and column sums corresponding to the element. Note that the resulting table will (unless we are very lucky) not satisfy any of the constraints (other than non-negativity).
- the second adaptation is that we encode all the constraints as components of an objective function, formed as the weighted sum of the squares of the differences between the observed values in the current solution, and the target values (constraints).
- the weights can be chosen so as to reflect prior beliefs as to the importance of the constraint - thus the row and column sums would have very large weights, and other constraints might have lesser weights.
Landscapes
- Engineering & Computer Science (AREA)
- Business, Economics & Management (AREA)
- Human Resources & Organizations (AREA)
- Economics (AREA)
- Strategic Management (AREA)
- Computer Networks & Wireless Communication (AREA)
- Signal Processing (AREA)
- Marketing (AREA)
- Physics & Mathematics (AREA)
- Entrepreneurship & Innovation (AREA)
- Development Economics (AREA)
- Operations Research (AREA)
- Quality & Reliability (AREA)
- Tourism & Hospitality (AREA)
- Game Theory and Decision Science (AREA)
- General Business, Economics & Management (AREA)
- General Physics & Mathematics (AREA)
- Theoretical Computer Science (AREA)
- Data Exchanges In Wide-Area Networks (AREA)
- Management, Administration, Business Operations System, And Electronic Commerce (AREA)
- Measurement Of The Respiration, Hearing Ability, Form, And Blood Characteristics Of Living Organisms (AREA)
- Telephonic Communication Services (AREA)
Abstract
Description
- The invention is directed to the estimating performance of communication networks and in particular to a simulated annealing method and system for traffic matrix estimation (SATME).
- Spurred by technological advances, the telecommunications industry has experienced tremendous growth over the last decade. The advances in processing power of desktop computers and the decrease in applications response times fostered corresponding improvements in the network infrastructure. The new bandwidth consuming applications supported the network traffic growth and the rapid change in equipment utilization confront the network providers with the issue of whether the network has adequate capacity to support the current and the future traffic requirements.
- In any traffic and/or network engineering task, more knowledge about the network can only be beneficial. Specific applications require for example knowledge of how much traffic goes from a site A to a site B, how much traffic does a particular customer sends from site A to B, where is the hot spot in the network, or how much capacity needs to be added and where. Information about network behaviour under specific conditions is also useful. For example, a network provider may optimize network performance based on the knowledge of how much traffic has to be moved if a link fails, what happens if traffic between two points is moved from a link to another, is most traffic originating in a sub-network (autonomous system, country, or company) staying in that sub-network or not, etc. This knowledge is used generally for routing path calculations, load balancing, etc.
- Network engineering tools were designed for handling these issues created by the increases in traffic demands or changes in the existing demands and determining the necessary expansion or modification to the network to support the projected traffic. These tools generally aid in revising network designs and routing schemes to avoid traffic bottlenecks, enable differential pricing of services, etc. However, all these tools require knowledge of traffic statistics, and more specifically of the real time source-destination traffic demands.
- A way of keeping these statistics for a packet based network is to look at each packet and record its source and destination. However, this method requires huge tables for recording this information. Furthermore, if what is desired is a source to destination traffic matrix for a subset of the network, then the ingress into the subset and the egress from the subset will not be available without looking at the source and destination addresses and then determining the path the packet would take as indicated by the routing information. This would be infeasible for large networks and large numbers of packets.
- It is also known to organize the traffic statistics into a "traffic matrix". A traffic matrix is typically expressed as the total bytes of data or the total number of packets or connections between all of the source-destination pairs of nodes. While the current routers are able to measure the counts for the incoming and outgoing traffic at each interface (incoming and outgoing links), it is generally impossible to derive the traffic matrix from the link counts with mathematical certainty. The best that can be done is to make a probabilistic inference concerning the traffic matrix from the observed link traffic.
- AT&T proposed to infer traffic matrices from the available measurements of link loads, by combining two known models, namely the gravity model with the tomographic model. The gravity model assumes that the traffic between the sites is proportional to the traffic at each site on per peer basis (as opposed to per router basis) for the outbound traffic, and that there is no systematic difference between the traffic in different locations. The tomographic model applies link constraints based on models. The combination of these models reduces the problem size for large networks and provides more accurate results that the gravity and tomographic models separately.
- However, the tomo-gravity method does not allow for easy specification of arbitrary constraints, such as knowing that if a link is twice the speed of another, it probably has roughly twice the traffic. Also, this method is based on assuming that the traffic follows the 'gravity' model, which can not be assumed in practice.
- The prior art techniques described above, such as monitoring all packets and gravity, tomographic approach and tomo-gravity, are not satisfactory for large traffic volumes and rely on unrealistic assumptions, respectively. On the other hand, it is essential to provide tools and techniques for traffic engineering in modern communication networks, particularly for estimating traffic patterns (characteristics), e.g. traffic volumes, hotspots, effects of failures, etc.
- Reclina et al., "Traffic Matrix Estimation : Existing Techniques and new directions" discloses techniques for traffic matrix estimation.
- It is an object of the invention to provide tools and techniques for traffic engineering that alleviate totally or in part the drawbacks of the prior art tools and techniques.
- The subject matter of the invention is solely defined in the appended independent claims.
- The foregoing and other objects, features and advantages of the invention will be apparent from the following more particular description of the preferred embodiments, as illustrated in the appended drawings, where:
-
Figure 1 is a simple example of a network used to illustrate the invention; -
Figure 2 is a source-to-destination (SD) matrix showing an example of the connections currently established across the network ofFigure 1 ; -
Figure 3a is a link traffic table for a network configuration as inFigure 1 with source-destination connections as inFigure 2 ; -
Figure 3b shows explicitly the path followed by each connection on each link of the network ofFigure 1 for the SD matrix ofFigure 2 ; -
Figure 3c illustrates a link connection table for the network ofFigure 1 , for the SD matrix ofFigure 2 ; -
Figure 4 shows a SD matrix for the network ofFigure 1 , where the number of connections is to be determined; -
Figure 5 illustrates a block diagram of the simulated annealing for traffic matrix estimation (SATME) system according to the invention; -
Figure 6a shows an example of distribution obtained experimentally for the SD matrix ofFigure 4 using the method of the invention; and -
Figure 6b is an example of the joint distribution between two elements of the matrix ofFigure 4 . - Simulated annealing is an optimization technique developed for metallurgical processes, whereby a control parameter is used to model the temperature of an oven during annealing. The control parameter, hence called temperature (T), is set to an initial value and is lowered over time, according to a predetermined schedule.
- Basic simulated annealing is successfully used for example in VLSI physical design, which is explained here in general term for a better understanding of the algorithm. A change to an initial configuration is made by moving a component or interchanging locations of two components; the placement is changed randomly to get a new placement. The control parameter T indicates the probability of accepting moves (shuffles) that result in increased cost. After the shuffle, the cost of the new placement is evaluated and if there is a decrease in cost, the configuration is accepted. Otherwise, the new configuration is accepted with a probability that depends on T. T is then lowered using, for example, an exponential function, and the process is stopped when T reduces to a very low value which requires that only moves that reduce costs are to be accepted. The algorithm starts with a very high value for T that gradually decreases so that shuffles that increase cost have a progressively lower probability of being accepted. In this way, the algorithm converges to an optimal, or near optimal configuration.
- This technique is also applied to the frequency assignment in cellular networks. However, it not a straight-forward task to apply this mechanism to communication networks. A serious problem with the inhomogenous networks is that the simulated annealing algorithm becomes trapped by an overwhelming number of local minima in the search. Once the algorithm is trapped in a poor minimum of the search space, the chance of randomly escaping the minimum is low.
- The main idea of the present invention is to adapt the simulated annealing algorithm to communication networks with a view to generate a traffic matrix estimation represented as a probability distribution. Advantages of the solution are that it requires no assumptions about the traffic (i.e. it allows the user to specify prior information about the network and traffic flows in a simple manner) and the estimation matrices enable assessment of variations over all possibilities as well as correlations between elements.
- The SATME (simulated annealing for traffic matrix estimation) method according to the invention is used in a different way than the simulated annealing.
- The main difference is that the simulated annealing algorithm determines a (close to) optimal solution of an objective function, whiled what is needed for traffic matrix estimation is a uniform distribution over the set of all possible tables that satisfy a set of given constraints. The reason for requiring a uniform distribution over the possibilities is so as to not bias the potential answers. Since there are many possible traffic matrices that will satisfy the given link counts, a single answer as provided by directly applying the SA algorithm is inaccurate. Ideally, the method should provide the most likely traffic matrix, as well as some measure of its variability. These are both possible to calculate from the information provided by the invention.
- Another adaptation added to the SA algorithm as known is the use of constraints. According to the invention, information that the user knows about the network traffic is explicitly encoded as constraints. The constraints are encoded as components of an objective function (or energy), that is then minimized using simulated annealing. With the method according to the invention, arbitrary constraints of any form can be included, and the case where there are no feasible solutions can be diagnosed by the objective function not converging to zero.
-
Figure 1 shows a simple example of anetwork 100 used to illustrate the invention. This network has five nodes N1-N5, which are connected overlinks - A connection may be routed along a plurality of paths. For example,
network 100 may route the traffic originating at node N1 and destined to node N4 (i.e. connection C14) along a path consisting oflinks link 1614 alone. Selection of the path (also referred to as an end-to-end route) for a connection is made by the routing algorithm used by the network. As most networks use a shortest path algorithm, in the above example the N1-N4 traffic will be routed alonglink 1614 . -
Figure 2 is a connections table, also referred to as a Source-Destination (SD) table (or matrix), showing an example of all connections currently established between nodes N1 to N5 overnetwork 100 ofFigure 1 . As seen, the connections are bidirectional; for example the number of connections from node N1 to node N5 (C15) is 4, and the number of connections from node N5 to node N1 (C51) is 5. The total for the connections leaving a respective node (outgoing connections) is provided in the last column and the total number of connections received by a respective node (incoming connections) is provided in the last row of the connections table. In this example,node N1 sources 19 connections and terminates 20 connections. -
Figure 3a is a link traffic table showing hownetwork 100 may route the connections (along which particular links), assuming that the network uses a shortest path routing algorithm. For the example provided inFigure 2 , link 1012 carries 13 connections, namely 5 C12 connections (between N1 and N2), 4 C13 connections (between N1 and N3) and 5 C15 connections (between N1 and N5). As another example, link 2035 carries 23 connections, namely 4 C15 connections (between N1 and N5), 7 C25 connections (between N2 and N5), 5 C35 connections (between N3 and N5) and 7 C45 connections (between N4 and N5). - The last column of link traffic table provides the total number of connections along a link in one direction, including the by-pass connections and the connections sourced by the node for the respective direction. The last row provides the total number of connections entering a node, including the connections for the other direction by that node and those forwarded to other nodes. These numbers are referred here as the 'link counts'.
- The topology of network 100 (see
Figure 1 ) and the shortest path routing imply that the traffic follows the paths as shown inFigure 3b . For example, connection C51 is served by a path from node N5 to node N3 (along link 20 53), from node N3 to node N2 (along link 1232 ) and from node N2 to node N1 (along link 1221 ). - 'Inverting' this information, provides what traffic is following over each link, which is shown in
Figure 3c . This table also provides in fact the source-destination pair (connection) that uses the respective link. - As discussed above, the link counts information is available in modern networks; however, the source-to-destination information is not. The link counts are used according to the invention to establish the source-to-destination traffic matrix, by adapting the SA method to the link traffic matrix problem. In other words, the method according to the invention exploits the SA's ability to explore a region of the constraint space.
- Since there are many possible source-to-destination traffic matrices that could generate the link counts shown in
Figure 3a , some characterization of the distribution of the possibilities may be used to restrict the number of solutions. Specifically, the invention uses a plurality of constraints as penalties, and then seeks a solution that minimizes the sum of the penalties. Again, there are many solutions that satisfy the constraints, but what is searched for is in essence a uniform distribution over all these possibilities. -
Figure 4 shows a SD matrix for the 5-node network ofFigure 1 , where the number of connections is to be determined; they are denoted with 'm' followed by an index for the respective source-destination node pairs. For example, m54 represent the number of connections between nodes N5 and N4. The idea is to determine the elements of the SD matrix (the original SD matrix) using SA algorithm in a specific way and also using constraints that represent various components of the problem. - The constraints are classified into two categories, namely absolute and soft constraints. The hard constraints are the most important constraints that account for the actual traffic (number of packets and bytes) seen art each ingress or egress point, in other words the link counts which are observed values of the link traffic. Other hard constraints represent routing rules, such as the shortest path routing or any pre-specified path. Soft constraints may for example represent an a priori knowledge about the network, such as specific links typical service twice the traffic of another.
- In order to clarify how the application of SA works according to the invention, the example network of
Figure 1 is again used, in combination with the link traffic table ofFigure 3a . The first absolute constraint for any network is that no connection may originate and terminate on the same node. For this particular example (5 nodes), this absolute constraint is expressed as shown below:
- The following absolute constraints resulted from the total number of connections per link, provided with the example of
Figure 3a . - The total amount of traffic leaving node N1 is 19.
- The total amount of traffic leaving node N2 is 39.
- The total amount of traffic leaving node N3 is 60.
- The total amount of traffic leaving node N4 is 22.
- The total amount of traffic leaving node N5 is 21.
- The total amount of traffic arriving at node N1 is 20.
- The total amount of traffic arriving at node N2 is 38.
- The total amount of traffic arriving at node N3 is 51.
- The total amount of traffic arriving at node N4 is 29.
- The total amount of traffic arriving at node N5 is 23.
- The above absolute constraints must be met, and therefore a very costly penalty is associated with violating them. To this list, much 'softer' constraints may be added, i.e. constraints that have a smaller penalty. Let's say for example that the traffic on
link 1012 should be the same as the traffic onlink 1443 .
- Combined with the absolute constraints, this gives the following equations that may be used to determine the elements of the SD matrix.
- A. The absolute constraints:


- B. And, the soft constraint for the above example is:

- Next, weights (or penalties) are assigned to violations of these constraints. A large penalty is assigned to the absolute constraints listed above under A, say p1 = 100; and a smaller penalty is assigned to the soft constraint at B, say p2 = 25.
- The constraints are used to create a fitness function f(m) that is then minimized using SA algorithm. The invention proposes an objective function constructed as a sum of weighted squared terms. The absolute constraints are introduced as the difference between the known link total (from the link traffic table) for the respective direction and the current estimated link total (the sum of respective elements m of the estimated matrix). The soft constraints are also accounted for, in accordance to their assigned weight. Thus, the fitness function becomes:
- Next, a starting SD traffic matrix is chosen, denoted with x0. The elements (xij) of this initial matrix are chosen uniformly on minimum:

- The fitness function for this proposed matrix is then calculated, denoted here with f(x0). Now, an element of this matrix is picked uniformly, i.e. each element is selected with equal probability, using a standard random number generator. This element is then increased or decreased randomly. For example, if when flipping a coin, the coin comes up heads, a `1' is added to the selected element, otherwise a `1' is subtracted.
- This change results in a randomly modified SD trafficmatrix y, for which the fitness function f(y) is again computed.
- If f(y) < f(x0), then set x1 : y
- If f(y) > f(x0), then generate a uniform random number 'r' between 0 and 1.

- This procedure is iterated a large number of times and when the fitness function is close to 0, this means that the system has arrived to a steady state. The intermediate matrices that are obtained each successive iteration are referred to as temporary SDF traffic matrices. The temporary matrix xn corresponding to the steady state is accepted as a potential SD traffic matrix that satisfies all the constraints.
- These operations are repeated a large number of times, each time recording the resulting matrix as a potential answer. The collection of these potential matrices is an approximate uni form sample of the set of all possible matrices satisfying the constraints, for the respective associated penalties.
- Function h(n) is defined as a sequence function, which depends of the number n of iterations. A geometrically decaying function of the form below is preferably used, but other functions are equally recommendable (i.e. a logarithmic function). When a geometrically decaying function is used:
h(n)=β alphan
alpha = 0.9995 - The choice of constants alpha and β affects the performance of the SATME (fitness function versus the number of iterations) but a choice as above is often used in practice.
-
Figure 5 illustrates the SATME system of the invention used for generating a set ofpotential SD matrices 55. The SATME system includes aSD matrix generator 50, arandom number generator 51, a fitnessfunction calculation unit 52, aSA algorithm processor 53, and asequence generator 54.SD matrix generator 50 generates the starting matrix x0 with the elements chosen uniformly on minimum, based on the known link counts and the known network configuration (number of nodes and the links between the nodes). The fitnessfunction calculation unit 52 calculates the fitness function for the matrices that are presented to it. In this case, in this case it calculates the starting fitness function f(x0) for the starting matrix; as indicated above, f(m) is calculated using the weighted absolute and soft constraints, and is presented toprocessor 53 for minimization. - The
random number generator 51 selects randomly one of the elements of the starting matrix and increases/decreases this element, again randomly.
The new value for the selected element replaces the old value, in the starting matrix, resulting in a randomly modified SD matrix, y. Thefitness function generator 52 calculates now a new, current fitness function y for the randomly modified SD traffic matrix, and again provides it toprocessor 53. -
SA algorithm processor 53 compares the starting and the current fitness functions and begins minimizing the value of the current function using iterations and, the random number r, according to the sequence provided by thesequence generator 54.Sequence generator 54 uses a selected type of function for the SA algorithm. As above, a geometrically decaying function is preferably selected forgenerator 54, and the parameters of the function are user-configurable. Also, the number of iterations n is user configurable. When the fitness function is close to 0, the system has arrived to a steady state, and the respective matrix elements m are used for a potential SD matrix xn. These operations are repeated a large number of times, each time recording the resulting matrix as a potential answer. - Returning now to the
network 100 in the example used before, let us assume a starting matrix x0 as below.36 64 18 74 50 21 99 54 65 45 97 24 68 31 15 71 73 85 51 33 90 96 76 2 0 - After 50,000 iterations, the fitness function became close to 0 and the system arrived at a steady state.
Figures 6a and6b show how correlation between two elements of the SD traffic matrix may be obtained after 100 iterations. These figures aim to find the correlation between m12 and m34. For example, in these graphs, the range of m12 is 0 to 17, since in the analysis, the largest value seen for m12 was 17, as can be seen from the histogram. Thus, m12 is first clamped at 0 and the conditional distribution of m34 for this value of m12 is determined. Then, m12 is changed to 1, and so on, until m12 = 17. - Since the correlation is a linear measure, it may be advantageous to look at the joint distribution between the two elements m12 and m34, which is shown in
Figure 6b .m34/ m12 0 1 2 3 4 5 6 7 8 9 10 11 12 13 14 15 16 17 0 3 1 0 1 3 1 1 3 1 0 3 0 0 1 0 0 1 0 1 1 2 3 3 0 2 3 2 5 2 0 0 1 3 1 0 2 1 2 5 3 2 5 0 5 4 2 1 1 6 1 4 0 2 1 1 1 3 4 2 5 8 7 2 5 4 4 2 4 1 3 4 1 1 0 0 4 7 6 9 3 3 6 5 1 5 2 5 3 3 3 0 4 1 1 5 5 4 5 4 4 5 7 4 4 0 4 4 2 4 6 3 3 3 6 4 3 5 9 5 4 4 8 6 6 3 3 4 1 2 7 5 3 7 10 8 7 4 4 4 9 7 7 6 3 7 4 5 4 1 4 2 8 4 5 8 8 4 8 8 12 7 7 4 5 1 7 1 6 3 4 9 9 8 5 4 12 6 6 7 5 5 3 2 2 5 6 4 3 8 10 8 11 7 8 3 3 13 3 3 7 10 6 5 9 4 3 5 6 11 6 7 8 7 7 7 6 6 9 10 4 5 10 7 6 9 7 9 12 3 6 5 5 11 9 5 4 5 3 6 14 10 10 6 9 9 4 13 5 12 11 5 7 9 2 8 9 7 8 12 4 6 12 7 6 10 14 6 6 4 8 3 10 4 5 2 8 6 6 6 5 8 7 8 3 15 5 5 9 7 8 3 5 4 5 6 5 3 9 11 10 6 2 10 16 5 3 0 4 5 4 4 4 5 2 7 4 8 3 11 11 8 7 17 4 1 3 2 7 5 3 3 8 7 5 6 9 2 7 6 7 8 18 3 4 1 2 4 4 2 4 3 3 5 6 4 4 5 3 10 5 19 2 1 1 0 2 2 3 5 4 8 4 3 2 4 3 6 5 9 20 0 1 2 1 1 0 1 1 2 4 1 5 3 2 3 3 4 2 21 1 1 0 2 0 1 0 2 0 2 3 2 5 1 1 1 5 1 22 0 0 0 0 0 0 0 1 0 2 1 1 1 3 1 2 0 2 - To summarize, the invention adapts the know annealing algorithm by first selecting a plurality of initial solutions uniformly over a larger space of tables. Each element of an initial solution is selected uniformly on [0, m] where m is the minimum of the row and column sums corresponding to the element. Note that the resulting table will (unless we are very lucky) not satisfy any of the constraints (other than non-negativity).
- The second adaptation is that we encode all the constraints as components of an objective function, formed as the weighted sum of the squares of the differences between the observed values in the current solution, and the target values (constraints). The weights can be chosen so as to reflect prior beliefs as to the importance of the constraint - thus the row and column sums would have very large weights, and other constraints might have lesser weights. With this methodology, arbitrary constraints of any form can be included, and the case where there are no feasible solutions can be diagnosed by the objective function not converging to zero.
- The code for the algorithm implementing the SATME method is as follows:


Claims (9)
- A method for estimating a traffic matrix for a communication network based on given link counts, comprising the steps of:a) establishing a fitness function for the respective network;a1) identifying absolute constraints for the fitness function expressing the actual network configuration and link-counts and assigning a hard penalty to each absolute constraint, wherein the absolute constraints include, for each link of the network, the link count for the respective link;a2) establishing soft constraints for the fitness function based on traffic pattern and assigning a soft penalty to each soft constraint;a3) translating each constraint for a respective link as an element of the fitness function; anda4) calculating the fitness function as a sum of weighted elements, each weight representing a soft or a hard constraint;b) generating a starting source to destination (SD) traffic matrix and calculating a starting value of the fitness function for the starting SD traffic matrix;c) modifying the starting matrix to obtain a randomly modified SD traffic matrix and calculating a current value of the fitness function for the randomly modified SD traffic matrix;d) selecting the SD traffic matrix corresponding to the less of the starting value and the current value as a temporary SD traffic matrix;e) changing the temporary SD traffic matrix using a simulated annealing algorithm, until the fitness function of the temporary SD traffic matrix reaches a minimum; andf) selecting the temporary SD traffic matrix estimated in step e) as a potential SD traffic matrix and repeating steps b) to e) for a pre-selected number of timeswherein each element of the fitness function is calculated using a distance function, as a squared difference between one or more observed values accounting for all routes that use the respective link according to the routing protocol used in the network and the respective link count.
- The method of claim 1, wherein the soft penalties are smaller than the hard penalties.
- The method of claim 1, wherein the soft constraint includes specified traffic patterns.
- The method of claim 1, wherein the elements of the starting SD traffic matrix in step b) are chosen uniformly on minimum:

- The method of claim 4, wherein step c) comprises:uniformly choosing an element of the starting traffic matrix;randomly increasing or decreasing the value of the element with a pre-selected integer.
- The method of claim 5, wherein the pre-selected integer is 1.
- The method of claim 1, wherein step e) comprises:generating a uniform random number 'r' between 0 and 1;determining the elements of the temporary SD traffic matrix as:where h(n)is a sequence function defining the number n of iterations for minimizing the fitness function.

- The method of claim 6, wherein h(n) is a geometrically decaying function h(n) = β alphan.
- A system for estimating a traffic matrix for a communication network comprising means for applying the method according to any one of claims 1 to 8.
Applications Claiming Priority (1)
| Application Number | Priority Date | Filing Date | Title |
|---|---|---|---|
| US10/962,488 US7554970B2 (en) | 2004-10-13 | 2004-10-13 | Simulated annealing for traffic matrix estimation |
Publications (2)
| Publication Number | Publication Date |
|---|---|
| EP1655893A1 EP1655893A1 (en) | 2006-05-10 |
| EP1655893B1 true EP1655893B1 (en) | 2008-12-31 |
Family
ID=35414959
Family Applications (1)
| Application Number | Title | Priority Date | Filing Date |
|---|---|---|---|
| EP05300816A Expired - Lifetime EP1655893B1 (en) | 2004-10-13 | 2005-10-13 | Simulated annealing for traffic matrix estimation |
Country Status (5)
| Country | Link |
|---|---|
| US (1) | US7554970B2 (en) |
| EP (1) | EP1655893B1 (en) |
| CN (1) | CN1819507A (en) |
| AT (1) | ATE419693T1 (en) |
| DE (1) | DE602005012041D1 (en) |
Families Citing this family (12)
| Publication number | Priority date | Publication date | Assignee | Title |
|---|---|---|---|---|
| US7525929B2 (en) | 2005-12-19 | 2009-04-28 | Alcatel Lucent | Fast simulated annealing for traffic matrix estimation |
| US8095645B2 (en) * | 2006-06-02 | 2012-01-10 | Opnet Technologies, Inc. | Traffic flow inference based on link loads and gravity measures |
| US8891379B2 (en) | 2006-06-02 | 2014-11-18 | Riverbed Technology, Inc. | Traffic flow inference based on link loads and gravity measures |
| CN100431298C (en) * | 2006-09-04 | 2008-11-05 | 南京理工大学 | A Dynamic Distributed Multicast Routing Method Based on Simulated Annealing |
| US10142013B2 (en) * | 2006-12-20 | 2018-11-27 | The Boeing Company | Method of optimizing an interplanetary communications network |
| US20110004455A1 (en) * | 2007-09-28 | 2011-01-06 | Diego Caviglia | Designing a Network |
| US8488490B2 (en) * | 2009-10-14 | 2013-07-16 | At&T Intellectual Property I, L.P. | Methods and apparatus to determine a capacity for a network layer topology |
| US10540605B2 (en) * | 2013-02-05 | 2020-01-21 | Cisco Technology, Inc. | Traffic-based inference of influence domains in a network by using learning machines |
| JP6540174B2 (en) * | 2014-04-10 | 2019-07-10 | 富士通株式会社 | Memory efficient matrix based light path calculation |
| CN106713013B (en) * | 2016-11-30 | 2020-03-27 | 广西大学 | Energy collection network data sending method and system |
| CN116015455B (en) * | 2022-12-26 | 2024-06-28 | 西安电子科技大学 | Traffic grooming method for optical networks based on path integral Monte Carlo quantum annealing |
| CN116896436B (en) * | 2023-09-11 | 2024-02-09 | 之江实验室 | Flexible Ethernet time slot allocation method and device based on improved differential evolution algorithm |
Family Cites Families (7)
| Publication number | Priority date | Publication date | Assignee | Title |
|---|---|---|---|---|
| SE507118C2 (en) * | 1996-08-26 | 1998-03-30 | Ericsson Telefon Ab L M | Procedure for optimizing a mainly optical ATM network |
| US6031984A (en) * | 1998-03-09 | 2000-02-29 | I2 Technologies, Inc. | Method and apparatus for optimizing constraint models |
| US20040010577A1 (en) * | 2002-07-09 | 2004-01-15 | Ferit Yegenoglu | System and method for optimizing network design in a communications network based on determined network capacity and network utilization |
| US7376472B2 (en) * | 2002-09-11 | 2008-05-20 | Fisher-Rosemount Systems, Inc. | Integrated model predictive control and optimization within a process control system |
| US7561876B2 (en) * | 2003-02-21 | 2009-07-14 | Groundhog Technologies Inc. | System with user interface for network planning and mobility management optimization in a mobile communication network and method thereof |
| US7139986B2 (en) * | 2004-03-11 | 2006-11-21 | Hewlett-Packard Development Company, L.P. | Systems and methods for determining costs associated with a selected objective |
| US7525929B2 (en) * | 2005-12-19 | 2009-04-28 | Alcatel Lucent | Fast simulated annealing for traffic matrix estimation |
-
2004
- 2004-10-13 US US10/962,488 patent/US7554970B2/en active Active
-
2005
- 2005-10-13 AT AT05300816T patent/ATE419693T1/en not_active IP Right Cessation
- 2005-10-13 CN CNA2005101291804A patent/CN1819507A/en active Pending
- 2005-10-13 DE DE602005012041T patent/DE602005012041D1/en not_active Expired - Lifetime
- 2005-10-13 EP EP05300816A patent/EP1655893B1/en not_active Expired - Lifetime
Also Published As
| Publication number | Publication date |
|---|---|
| US20060077907A1 (en) | 2006-04-13 |
| ATE419693T1 (en) | 2009-01-15 |
| US7554970B2 (en) | 2009-06-30 |
| EP1655893A1 (en) | 2006-05-10 |
| CN1819507A (en) | 2006-08-16 |
| DE602005012041D1 (en) | 2009-02-12 |
Similar Documents
| Publication | Publication Date | Title |
|---|---|---|
| Medina et al. | Traffic matrix estimation: Existing techniques and new directions | |
| US8159963B2 (en) | QoS routing method and QoS routing apparatus for determining measurement accuracy of communication quality | |
| Wu et al. | A dynamic call admission policy with precision QoS guarantee using stochastic control for mobile wireless networks | |
| EP1655893B1 (en) | Simulated annealing for traffic matrix estimation | |
| US7313629B1 (en) | Method for altering link weights in a communication network within network parameters to provide traffic information for improved forecasting | |
| CN109639575B (en) | Routing planning method based on link congestion coefficient | |
| EP1481510B1 (en) | Method and system for constraint-based traffic flow optimisation | |
| WO2001095641A3 (en) | Multi-path dynamic routing algorithm | |
| US7644180B1 (en) | Method for altering link weights in a communication network to provide traffic information for improved forecasting | |
| CN107634872A (en) | A kind of method and apparatus of quick accurate measurement network link quality | |
| US7313095B1 (en) | Method for estimating telecommunication network traffic using link weight changes | |
| CN109889446B (en) | A method for determining the minimum delay path of heterogeneous converged network based on SDN | |
| Chydzinski et al. | The Single‐Server Queue with the Dropping Function and Infinite Buffer | |
| US7525929B2 (en) | Fast simulated annealing for traffic matrix estimation | |
| CN111404595A (en) | A method for evaluating the health of space-based network communication satellites | |
| CN107454630A (en) | Load balancing method and load balancing router | |
| WO1998051045A8 (en) | Method and tool for producing a telecommunication network | |
| Castro et al. | Maximum likelihood identification of network topology from end-to-end measurements | |
| Ye et al. | Minimizing packet loss by optimizing OSPF weights using online simulation | |
| KR100271525B1 (en) | End-to-end traffic estimation device for telephone network and the method thereof | |
| Giladi et al. | Placement of network resources in communication networks | |
| Pinheiro et al. | A fuzzy queue-aware routing approach for wireless mesh networks | |
| Sait et al. | Engineering evolutionary algorithm to solve multi-objective ospf weight setting problem | |
| KR100236820B1 (en) | End-to-end traffic estimation method and system | |
| Mahor et al. | Taguchi's loss function based measurement of mobile ad-hoc network parameters under AODV routing protocol |
Legal Events
| Date | Code | Title | Description |
|---|---|---|---|
| PUAI | Public reference made under article 153(3) epc to a published international application that has entered the european phase |
Free format text: ORIGINAL CODE: 0009012 |
|
| AK | Designated contracting states |
Kind code of ref document: A1 Designated state(s): AT BE BG CH CY CZ DE DK EE ES FI FR GB GR HU IE IS IT LI LT LU LV MC NL PL PT RO SE SI SK TR |
|
| AX | Request for extension of the european patent |
Extension state: AL BA HR MK YU |
|
| 17P | Request for examination filed |
Effective date: 20061110 |
|
| AKX | Designation fees paid |
Designated state(s): AT BE BG CH CY CZ DE DK EE ES FI FR GB GR HU IE IS IT LI LT LU LV MC NL PL PT RO SE SI SK TR |
|
| 17Q | First examination report despatched |
Effective date: 20061219 |
|
| RAP1 | Party data changed (applicant data changed or rights of an application transferred) |
Owner name: ALCATEL LUCENT |
|
| GRAP | Despatch of communication of intention to grant a patent |
Free format text: ORIGINAL CODE: EPIDOSNIGR1 |
|
| GRAS | Grant fee paid |
Free format text: ORIGINAL CODE: EPIDOSNIGR3 |
|
| GRAA | (expected) grant |
Free format text: ORIGINAL CODE: 0009210 |
|
| AK | Designated contracting states |
Kind code of ref document: B1 Designated state(s): AT BE BG CH CY CZ DE DK EE ES FI FR GB GR HU IE IS IT LI LT LU LV MC NL PL PT RO SE SI SK TR |
|
| REG | Reference to a national code |
Ref country code: CH Ref legal event code: EP Ref country code: GB Ref legal event code: FG4D |
|
| REF | Corresponds to: |
Ref document number: 602005012041 Country of ref document: DE Date of ref document: 20090212 Kind code of ref document: P |
|
| REG | Reference to a national code |
Ref country code: IE Ref legal event code: FG4D |
|
| PG25 | Lapsed in a contracting state [announced via postgrant information from national office to epo] |
Ref country code: FI Free format text: LAPSE BECAUSE OF FAILURE TO SUBMIT A TRANSLATION OF THE DESCRIPTION OR TO PAY THE FEE WITHIN THE PRESCRIBED TIME-LIMIT Effective date: 20081231 Ref country code: SI Free format text: LAPSE BECAUSE OF FAILURE TO SUBMIT A TRANSLATION OF THE DESCRIPTION OR TO PAY THE FEE WITHIN THE PRESCRIBED TIME-LIMIT Effective date: 20081231 Ref country code: PL Free format text: LAPSE BECAUSE OF FAILURE TO SUBMIT A TRANSLATION OF THE DESCRIPTION OR TO PAY THE FEE WITHIN THE PRESCRIBED TIME-LIMIT Effective date: 20081231 Ref country code: LV Free format text: LAPSE BECAUSE OF FAILURE TO SUBMIT A TRANSLATION OF THE DESCRIPTION OR TO PAY THE FEE WITHIN THE PRESCRIBED TIME-LIMIT Effective date: 20081231 Ref country code: NL Free format text: LAPSE BECAUSE OF FAILURE TO SUBMIT A TRANSLATION OF THE DESCRIPTION OR TO PAY THE FEE WITHIN THE PRESCRIBED TIME-LIMIT Effective date: 20081231 |
|
| NLV1 | Nl: lapsed or annulled due to failure to fulfill the requirements of art. 29p and 29m of the patents act | ||
| PG25 | Lapsed in a contracting state [announced via postgrant information from national office to epo] |
Ref country code: EE Free format text: LAPSE BECAUSE OF FAILURE TO SUBMIT A TRANSLATION OF THE DESCRIPTION OR TO PAY THE FEE WITHIN THE PRESCRIBED TIME-LIMIT Effective date: 20081231 Ref country code: RO Free format text: LAPSE BECAUSE OF FAILURE TO SUBMIT A TRANSLATION OF THE DESCRIPTION OR TO PAY THE FEE WITHIN THE PRESCRIBED TIME-LIMIT Effective date: 20081231 Ref country code: LT Free format text: LAPSE BECAUSE OF FAILURE TO SUBMIT A TRANSLATION OF THE DESCRIPTION OR TO PAY THE FEE WITHIN THE PRESCRIBED TIME-LIMIT Effective date: 20081231 Ref country code: BE Free format text: LAPSE BECAUSE OF FAILURE TO SUBMIT A TRANSLATION OF THE DESCRIPTION OR TO PAY THE FEE WITHIN THE PRESCRIBED TIME-LIMIT Effective date: 20081231 Ref country code: ES Free format text: LAPSE BECAUSE OF FAILURE TO SUBMIT A TRANSLATION OF THE DESCRIPTION OR TO PAY THE FEE WITHIN THE PRESCRIBED TIME-LIMIT Effective date: 20090411 |
|
| PG25 | Lapsed in a contracting state [announced via postgrant information from national office to epo] |
Ref country code: PT Free format text: LAPSE BECAUSE OF FAILURE TO SUBMIT A TRANSLATION OF THE DESCRIPTION OR TO PAY THE FEE WITHIN THE PRESCRIBED TIME-LIMIT Effective date: 20090601 Ref country code: AT Free format text: LAPSE BECAUSE OF FAILURE TO SUBMIT A TRANSLATION OF THE DESCRIPTION OR TO PAY THE FEE WITHIN THE PRESCRIBED TIME-LIMIT Effective date: 20081231 Ref country code: IS Free format text: LAPSE BECAUSE OF FAILURE TO SUBMIT A TRANSLATION OF THE DESCRIPTION OR TO PAY THE FEE WITHIN THE PRESCRIBED TIME-LIMIT Effective date: 20090430 Ref country code: SE Free format text: LAPSE BECAUSE OF FAILURE TO SUBMIT A TRANSLATION OF THE DESCRIPTION OR TO PAY THE FEE WITHIN THE PRESCRIBED TIME-LIMIT Effective date: 20090331 Ref country code: CZ Free format text: LAPSE BECAUSE OF FAILURE TO SUBMIT A TRANSLATION OF THE DESCRIPTION OR TO PAY THE FEE WITHIN THE PRESCRIBED TIME-LIMIT Effective date: 20081231 |
|
| PG25 | Lapsed in a contracting state [announced via postgrant information from national office to epo] |
Ref country code: SK Free format text: LAPSE BECAUSE OF FAILURE TO SUBMIT A TRANSLATION OF THE DESCRIPTION OR TO PAY THE FEE WITHIN THE PRESCRIBED TIME-LIMIT Effective date: 20081231 |
|
| PG25 | Lapsed in a contracting state [announced via postgrant information from national office to epo] |
Ref country code: DK Free format text: LAPSE BECAUSE OF FAILURE TO SUBMIT A TRANSLATION OF THE DESCRIPTION OR TO PAY THE FEE WITHIN THE PRESCRIBED TIME-LIMIT Effective date: 20081231 |
|
| PLBE | No opposition filed within time limit |
Free format text: ORIGINAL CODE: 0009261 |
|
| STAA | Information on the status of an ep patent application or granted ep patent |
Free format text: STATUS: NO OPPOSITION FILED WITHIN TIME LIMIT |
|
| 26N | No opposition filed |
Effective date: 20091001 |
|
| PG25 | Lapsed in a contracting state [announced via postgrant information from national office to epo] |
Ref country code: BG Free format text: LAPSE BECAUSE OF FAILURE TO SUBMIT A TRANSLATION OF THE DESCRIPTION OR TO PAY THE FEE WITHIN THE PRESCRIBED TIME-LIMIT Effective date: 20090331 |
|
| PG25 | Lapsed in a contracting state [announced via postgrant information from national office to epo] |
Ref country code: MC Free format text: LAPSE BECAUSE OF NON-PAYMENT OF DUE FEES Effective date: 20091031 |
|
| REG | Reference to a national code |
Ref country code: CH Ref legal event code: PL |
|
| PG25 | Lapsed in a contracting state [announced via postgrant information from national office to epo] |
Ref country code: LI Free format text: LAPSE BECAUSE OF NON-PAYMENT OF DUE FEES Effective date: 20091031 Ref country code: GR Free format text: LAPSE BECAUSE OF FAILURE TO SUBMIT A TRANSLATION OF THE DESCRIPTION OR TO PAY THE FEE WITHIN THE PRESCRIBED TIME-LIMIT Effective date: 20090401 Ref country code: IE Free format text: LAPSE BECAUSE OF NON-PAYMENT OF DUE FEES Effective date: 20091013 Ref country code: CH Free format text: LAPSE BECAUSE OF NON-PAYMENT OF DUE FEES Effective date: 20091031 |
|
| PG25 | Lapsed in a contracting state [announced via postgrant information from national office to epo] |
Ref country code: IT Free format text: LAPSE BECAUSE OF FAILURE TO SUBMIT A TRANSLATION OF THE DESCRIPTION OR TO PAY THE FEE WITHIN THE PRESCRIBED TIME-LIMIT Effective date: 20081231 |
|
| PG25 | Lapsed in a contracting state [announced via postgrant information from national office to epo] |
Ref country code: LU Free format text: LAPSE BECAUSE OF NON-PAYMENT OF DUE FEES Effective date: 20091013 |
|
| PG25 | Lapsed in a contracting state [announced via postgrant information from national office to epo] |
Ref country code: HU Free format text: LAPSE BECAUSE OF FAILURE TO SUBMIT A TRANSLATION OF THE DESCRIPTION OR TO PAY THE FEE WITHIN THE PRESCRIBED TIME-LIMIT Effective date: 20090701 |
|
| PG25 | Lapsed in a contracting state [announced via postgrant information from national office to epo] |
Ref country code: TR Free format text: LAPSE BECAUSE OF FAILURE TO SUBMIT A TRANSLATION OF THE DESCRIPTION OR TO PAY THE FEE WITHIN THE PRESCRIBED TIME-LIMIT Effective date: 20081231 |
|
| PG25 | Lapsed in a contracting state [announced via postgrant information from national office to epo] |
Ref country code: CY Free format text: LAPSE BECAUSE OF FAILURE TO SUBMIT A TRANSLATION OF THE DESCRIPTION OR TO PAY THE FEE WITHIN THE PRESCRIBED TIME-LIMIT Effective date: 20081231 |
|
| REG | Reference to a national code |
Ref country code: FR Ref legal event code: GC Effective date: 20131018 |
|
| REG | Reference to a national code |
Ref country code: FR Ref legal event code: RG Effective date: 20141016 |
|
| REG | Reference to a national code |
Ref country code: FR Ref legal event code: CA Effective date: 20150521 |
|
| REG | Reference to a national code |
Ref country code: FR Ref legal event code: CA Effective date: 20150521 |
|
| REG | Reference to a national code |
Ref country code: FR Ref legal event code: PLFP Year of fee payment: 11 |
|
| REG | Reference to a national code |
Ref country code: FR Ref legal event code: PLFP Year of fee payment: 12 |
|
| REG | Reference to a national code |
Ref country code: FR Ref legal event code: PLFP Year of fee payment: 13 |
|
| PGFP | Annual fee paid to national office [announced via postgrant information from national office to epo] |
Ref country code: FR Payment date: 20171024 Year of fee payment: 13 |
|
| REG | Reference to a national code |
Ref country code: GB Ref legal event code: 732E Free format text: REGISTERED BETWEEN 20190429 AND 20190502 |
|
| REG | Reference to a national code |
Ref country code: DE Ref legal event code: R082 Ref document number: 602005012041 Country of ref document: DE Representative=s name: MENZIETTI WETZEL, DE Ref country code: DE Ref legal event code: R081 Ref document number: 602005012041 Country of ref document: DE Owner name: PROVENANCE ASSET GROUP LLC, PITTSFORD, US Free format text: FORMER OWNER: ALCATEL LUCENT, PARIS, FR |
|
| PG25 | Lapsed in a contracting state [announced via postgrant information from national office to epo] |
Ref country code: FR Free format text: LAPSE BECAUSE OF NON-PAYMENT OF DUE FEES Effective date: 20181031 |
|
| PGFP | Annual fee paid to national office [announced via postgrant information from national office to epo] |
Ref country code: DE Payment date: 20201027 Year of fee payment: 16 Ref country code: GB Payment date: 20201029 Year of fee payment: 16 |
|
| REG | Reference to a national code |
Ref country code: DE Ref legal event code: R079 Ref document number: 602005012041 Country of ref document: DE Free format text: PREVIOUS MAIN CLASS: H04L0012240000 Ipc: H04L0041000000 |
|
| REG | Reference to a national code |
Ref country code: DE Ref legal event code: R119 Ref document number: 602005012041 Country of ref document: DE |
|
| GBPC | Gb: european patent ceased through non-payment of renewal fee |
Effective date: 20211013 |
|
| PG25 | Lapsed in a contracting state [announced via postgrant information from national office to epo] |
Ref country code: GB Free format text: LAPSE BECAUSE OF NON-PAYMENT OF DUE FEES Effective date: 20211013 Ref country code: DE Free format text: LAPSE BECAUSE OF NON-PAYMENT OF DUE FEES Effective date: 20220503 |