CN116258467A - Electric power construction management and control system - Google Patents
Electric power construction management and control system Download PDFInfo
- Publication number
- CN116258467A CN116258467A CN202310544425.8A CN202310544425A CN116258467A CN 116258467 A CN116258467 A CN 116258467A CN 202310544425 A CN202310544425 A CN 202310544425A CN 116258467 A CN116258467 A CN 116258467A
- Authority
- CN
- China
- Prior art keywords
- work
- power construction
- data
- time
- construction
- Prior art date
- Legal status (The legal status is an assumption and is not a legal conclusion. Google has not performed a legal analysis and makes no representation as to the accuracy of the status listed.)
- Granted
Links
Images

Classifications
-
- G—PHYSICS
- G06—COMPUTING OR CALCULATING; COUNTING
- G06Q—INFORMATION AND COMMUNICATION TECHNOLOGY [ICT] SPECIALLY ADAPTED FOR ADMINISTRATIVE, COMMERCIAL, FINANCIAL, MANAGERIAL OR SUPERVISORY PURPOSES; SYSTEMS OR METHODS SPECIALLY ADAPTED FOR ADMINISTRATIVE, COMMERCIAL, FINANCIAL, MANAGERIAL OR SUPERVISORY PURPOSES, NOT OTHERWISE PROVIDED FOR
- G06Q10/00—Administration; Management
- G06Q10/10—Office automation; Time management
- G06Q10/103—Workflow collaboration or project management
-
- G—PHYSICS
- G06—COMPUTING OR CALCULATING; COUNTING
- G06Q—INFORMATION AND COMMUNICATION TECHNOLOGY [ICT] SPECIALLY ADAPTED FOR ADMINISTRATIVE, COMMERCIAL, FINANCIAL, MANAGERIAL OR SUPERVISORY PURPOSES; SYSTEMS OR METHODS SPECIALLY ADAPTED FOR ADMINISTRATIVE, COMMERCIAL, FINANCIAL, MANAGERIAL OR SUPERVISORY PURPOSES, NOT OTHERWISE PROVIDED FOR
- G06Q10/00—Administration; Management
- G06Q10/06—Resources, workflows, human or project management; Enterprise or organisation planning; Enterprise or organisation modelling
- G06Q10/063—Operations research, analysis or management
- G06Q10/0631—Resource planning, allocation, distributing or scheduling for enterprises or organisations
- G06Q10/06312—Adjustment or analysis of established resource schedule, e.g. resource or task levelling, or dynamic rescheduling
-
- G—PHYSICS
- G06—COMPUTING OR CALCULATING; COUNTING
- G06Q—INFORMATION AND COMMUNICATION TECHNOLOGY [ICT] SPECIALLY ADAPTED FOR ADMINISTRATIVE, COMMERCIAL, FINANCIAL, MANAGERIAL OR SUPERVISORY PURPOSES; SYSTEMS OR METHODS SPECIALLY ADAPTED FOR ADMINISTRATIVE, COMMERCIAL, FINANCIAL, MANAGERIAL OR SUPERVISORY PURPOSES, NOT OTHERWISE PROVIDED FOR
- G06Q10/00—Administration; Management
- G06Q10/06—Resources, workflows, human or project management; Enterprise or organisation planning; Enterprise or organisation modelling
- G06Q10/063—Operations research, analysis or management
- G06Q10/0631—Resource planning, allocation, distributing or scheduling for enterprises or organisations
- G06Q10/06313—Resource planning in a project environment
-
- G—PHYSICS
- G06—COMPUTING OR CALCULATING; COUNTING
- G06Q—INFORMATION AND COMMUNICATION TECHNOLOGY [ICT] SPECIALLY ADAPTED FOR ADMINISTRATIVE, COMMERCIAL, FINANCIAL, MANAGERIAL OR SUPERVISORY PURPOSES; SYSTEMS OR METHODS SPECIALLY ADAPTED FOR ADMINISTRATIVE, COMMERCIAL, FINANCIAL, MANAGERIAL OR SUPERVISORY PURPOSES, NOT OTHERWISE PROVIDED FOR
- G06Q10/00—Administration; Management
- G06Q10/06—Resources, workflows, human or project management; Enterprise or organisation planning; Enterprise or organisation modelling
- G06Q10/063—Operations research, analysis or management
- G06Q10/0639—Performance analysis of employees; Performance analysis of enterprise or organisation operations
- G06Q10/06395—Quality analysis or management
-
- G—PHYSICS
- G06—COMPUTING OR CALCULATING; COUNTING
- G06Q—INFORMATION AND COMMUNICATION TECHNOLOGY [ICT] SPECIALLY ADAPTED FOR ADMINISTRATIVE, COMMERCIAL, FINANCIAL, MANAGERIAL OR SUPERVISORY PURPOSES; SYSTEMS OR METHODS SPECIALLY ADAPTED FOR ADMINISTRATIVE, COMMERCIAL, FINANCIAL, MANAGERIAL OR SUPERVISORY PURPOSES, NOT OTHERWISE PROVIDED FOR
- G06Q50/00—Information and communication technology [ICT] specially adapted for implementation of business processes of specific business sectors, e.g. utilities or tourism
- G06Q50/06—Energy or water supply
-
- Y—GENERAL TAGGING OF NEW TECHNOLOGICAL DEVELOPMENTS; GENERAL TAGGING OF CROSS-SECTIONAL TECHNOLOGIES SPANNING OVER SEVERAL SECTIONS OF THE IPC; TECHNICAL SUBJECTS COVERED BY FORMER USPC CROSS-REFERENCE ART COLLECTIONS [XRACs] AND DIGESTS
- Y04—INFORMATION OR COMMUNICATION TECHNOLOGIES HAVING AN IMPACT ON OTHER TECHNOLOGY AREAS
- Y04S—SYSTEMS INTEGRATING TECHNOLOGIES RELATED TO POWER NETWORK OPERATION, COMMUNICATION OR INFORMATION TECHNOLOGIES FOR IMPROVING THE ELECTRICAL POWER GENERATION, TRANSMISSION, DISTRIBUTION, MANAGEMENT OR USAGE, i.e. SMART GRIDS
- Y04S10/00—Systems supporting electrical power generation, transmission or distribution
- Y04S10/50—Systems or methods supporting the power network operation or management, involving a certain degree of interaction with the load-side end user applications
Landscapes
- Business, Economics & Management (AREA)
- Human Resources & Organizations (AREA)
- Engineering & Computer Science (AREA)
- Strategic Management (AREA)
- Economics (AREA)
- Entrepreneurship & Innovation (AREA)
- General Business, Economics & Management (AREA)
- Tourism & Hospitality (AREA)
- Physics & Mathematics (AREA)
- Marketing (AREA)
- General Physics & Mathematics (AREA)
- Theoretical Computer Science (AREA)
- Operations Research (AREA)
- Quality & Reliability (AREA)
- Development Economics (AREA)
- Educational Administration (AREA)
- Game Theory and Decision Science (AREA)
- Health & Medical Sciences (AREA)
- Data Mining & Analysis (AREA)
- Biodiversity & Conservation Biology (AREA)
- Life Sciences & Earth Sciences (AREA)
- Public Health (AREA)
- Water Supply & Treatment (AREA)
- General Health & Medical Sciences (AREA)
- Primary Health Care (AREA)
- Remote Monitoring And Control Of Power-Distribution Networks (AREA)
- Supply And Distribution Of Alternating Current (AREA)
Abstract
The invention discloses a power construction management and control system, which relates to the technical field of power construction management and control. The data acquisition unit can acquire various equipment parameters and real-time environment data in the power construction process, including temperature, humidity, air quality, wind speed and the like. The power construction scheduling unit may calculate a work intensity index, a construction quality index, and a work completion time for each work based on the environmental data, thereby performing power construction scheduling. The equipment monitoring unit judges whether the equipment is abnormal or not through data fusion, and positions the problem equipment through multi-direction data expansion mapping. The invention improves the efficiency and the quality of the power construction, and can discover the abnormality of the equipment and locate the abnormality in time, thereby reducing the maintenance time and the maintenance cost of the equipment.
Description
Technical Field
The invention relates to the technical field of power construction management and control, in particular to a power construction management and control system.
Background
Power construction management is a very important task, the purpose of which is to ensure that an optimal balance of quality, safety and efficiency is achieved during the construction of power engineering. However, the conventional power construction control method has some problems such as slow information feedback, untimely management, low working efficiency and the like.
The existing power construction management and control system mainly comprises a plurality of modules, such as construction plan management, field operation monitoring, equipment state monitoring, personnel positioning, safety protection and the like. For example, the construction plan management module can provide an accurate construction plan for constructors and update the construction progress in real time, so that engineering management personnel can be helped to effectively control and manage the construction process; the on-site operation monitoring module can monitor the operation state of the construction site in real time, and timely discover and prevent potential safety hazards; the equipment state monitoring module can monitor the running state of construction equipment in real time, discover the faults of the equipment in advance, and ensure the smooth construction; the personnel positioning and safety protection module can know the position and the safety condition of the constructors in real time, and provides effective guarantee for construction safety.
However, although the existing power construction management and control system improves the efficiency and safety of power construction to some extent, there are still some problems and disadvantages.
First, existing power construction management and control systems have limited capabilities in data acquisition, processing, and analysis. In modules such as field operation monitoring and equipment status monitoring, the system often needs to process large amounts of data, including video, audio, images, sensor data, and the like. However, the collection and processing of these data by existing systems is often not timely and accurate enough, resulting in the accuracy and real-time of the analysis results being affected.
Secondly, the existing power construction management and control system is still to be improved in the degree of intelligence. Although some systems have implemented partially automated functions, such as automated construction progress updates and equipment failure pre-warning, the capabilities of existing systems remain limited in terms of higher level decision support and intelligent optimization.
Finally, existing power construction management and control systems have some problems in terms of system integration and data interaction. On the one hand, the design and implementation of each module are often independent, so that the difficulty of system integration is high, and the problem of unsmooth data interaction can occur. On the other hand, the existing system cannot perform effective data interaction with other systems (such as a design system, a purchasing system and the like), so that the utilization efficiency of the data is low, and the construction efficiency and quality can be affected.
In summary, the existing power construction management and control system has some problems and disadvantages in aspects of data processing, intelligence, flexibility and stability, system integration, data interaction and the like. Therefore, a new power construction management and control system needs to be developed to solve the above problems and meet the requirements of modern power construction.
Disclosure of Invention
The invention aims to provide an electric power construction management and control system which can realize intelligent scheduling and management of an electric power construction process, improve construction efficiency and quality and reduce construction risk and cost.
In order to solve the technical problems, the invention provides an electric power construction management and control system, which comprises: the data acquisition unit is configured to acquire parameters of various equipment in the power construction process and acquire environmental data of a power construction site in real time; the environmental data includes at least: temperature data, humidity data, air quality data, and air velocity data; the power construction scheduling unit is configured to calculate the working strength index, the construction quality index and the working completion time of each work in the power construction process based on the collected environmental data, and perform power construction scheduling based on the calculated working strength index, the construction quality index and the working completion time; the equipment monitoring unit is configured to perform data fusion based on parameters and environment data of each equipment in the power construction process, judge whether the equipment is abnormal according to the data fusion result, perform multi-direction data expansion mapping on the data fusion result if the equipment is abnormal, and analyze the data expansion mapping result in each direction to locate the equipment with problems.
Further, the data acquisition unit includes: a sensor network and an equipment monitoring device; the equipment monitoring device is configured to acquire parameters of various equipment in the power construction process; the sensor network is composed of a plurality of sensors of different types; the types of the sensors in the sensor network at least comprise: air sensor, temperature sensor, humidity sensor and wind speed sensor.
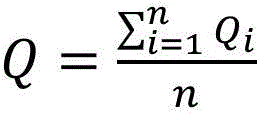
Further, the power construction scheduling unit calculates a total work intensity index of the power construction site by the following formula:
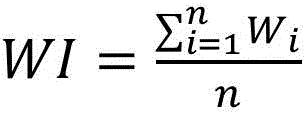
wherein , which represents an index of the overall working strength,
 represent the first
 The working strength index of the work item,
 representing the total number of work items; the power construction unit calculates a work intensity index of each work item by the following formula:
 。
。
wherein the weight of the air quality factor is set as The weight of the temperature factor is
 The weight of the humidity factor is
 The wind speed factor is weighted as
 The method comprises the steps of carrying out a first treatment on the surface of the The following conditions are satisfied:

wherein , 、
、 、
、 and
and the range of the values of the (C) is 1-10.
Further, the weight of the air quality factor Calculated according to the following formula:


wherein , the unit of concentration is
 。
。
Further, the weight of the temperature factor Calculated according to the following formula:


wherein , temperature is expressed in degrees celsius.
Further, the power construction scheduling unit uses the following formula to calculate the working strength index of each work Calculating the completion time of each work
 :
:
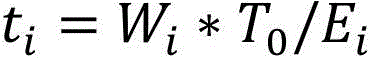
wherein , the standard completion time is indicated as such,
 the work efficiency of each work is represented, and the unit is man-hour/unit workload; completion time of each job
 Sequencing from small to large to obtain a time sequence of work completion
 The method comprises the steps of carrying out a first treatment on the surface of the According to time series of work completion
 Dividing the power construction process into a plurality of time periods
 , wherein
  The point in time at which the construction is started is indicated,
 indicating the point in time when all work is completed; according to the completion time of each job
 And working strength index
 Working out the working grade of each work
 :
:

wherein , indicating the point in time at which the last job was completed,
 representing a work intensity level for each work; work level of each work
 Sequencing from big to small to obtain a working strength grade sequence:
 the method comprises the steps of carrying out a first treatment on the surface of the According to the working strength grade sequence
 Dividing the power construction process into a plurality of working class time periods
 , wherein
  The time point at which the work with the highest work intensity starts to be constructed is indicated,
 indicating the point in time when all work is completed; according to the completion time of each job
 And working intensity level
 Determining a construction time period of each job
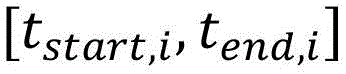 :
:

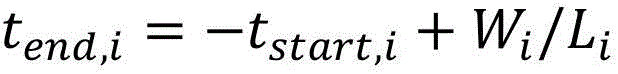
wherein , represent the first
 The point in time at which the work starts to be performed,
 represent the first
 The point in time when the project work is completed.
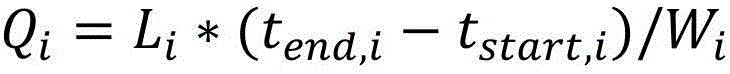
Further, the power construction scheduling unit performs the power construction according to the construction time period of each work And working intensity level
 Calculating the construction quality index of each work by using the following formula
 :
:

wherein , representing the construction quality index for each job.
Quality of construction index for each job Sequencing from small to large to obtain a working construction quality index sequence
 The method comprises the steps of carrying out a first treatment on the surface of the According to the working construction quality index sequence
 Dividing the power construction process into a plurality of quality class times
 , wherein
  Indicating the point in time when the work of the highest construction quality begins to be constructed,
 indicating the point in time when all work is completed; according to the workerAs a construction quality index sequence
 Calculating the total quality index of the electric power construction process
 :
:
wherein , representing a total quality index of the power construction process; according to the total mass index
 And standard quality index
 The quality evaluation is carried out on the electric power construction process by using the following method:
if it is The method comprises the steps of carrying out a first treatment on the surface of the The quality of the electric power construction process is evaluated to be good;
if it is The method comprises the steps of carrying out a first treatment on the surface of the Then evaluating the poor quality of the power construction process;
wherein , the standard quality index is indicated as such,
 indicating the total number of work items.
Further, the parameters of each device in the electric power construction process acquired by the data acquisition unit at least include: voltage, current and power.
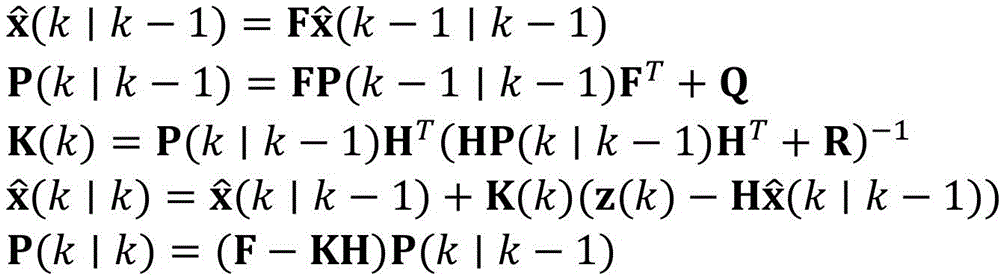
Further, the device monitoring unit includes: an abnormality judgment unit and an abnormality positioning unit; the abnormality judging unit is configured to perform data fusion based on parameters and environment data of each device in the power construction process by using a Kalman filtering algorithm, and judge whether abnormality occurs to the device according to the result of the data fusion; the abnormality locating unit is configured to, when it is determined that an abnormality occurs in the device, perform multi-directional data expansion mapping based on a markov chain on the result of data fusion, and analyze the data expansion mapping result in each direction to locate the device with a problem.
Further, the specific process of the multidirectional data expansion mapping based on the Markov chain comprises the following steps: discretizing the multidimensional state vector, and dividing the state space in each dimension into a plurality of intervals; mapping each state in the multidimensional state space into a low-dimensional space; modeling a low-dimensional state space using a Markov chain; expanding along different dimensions for each state in the low-dimensional state space to obtain a plurality of new states; for states in other dimensions, corresponding expansion is also carried out, and a plurality of new state vectors are finally obtained; the state vectors after expansion are used to update the Markov chain state transition matrix to reflect the state distribution in the state space.
The power construction management and control system has the following beneficial effects: firstly, the invention provides an electric power construction management and control system based on an artificial intelligence technology. In the traditional electric power construction process, a large amount of manual scheduling and management are generally required, so that the efficiency is low, errors are easy to occur, and the construction quality is reduced. The power construction management and control system can automatically conduct intelligent scheduling and management on the power construction process, avoids the influence of manual intervention, and improves the construction efficiency and quality. In addition, the system has good self-adaptability and robustness, and can cope with the influence of complex construction environments and uncertain factors.
Secondly, the invention provides a novel intelligent scheduling algorithm for the power construction process. The algorithm realizes the optimal scheduling of the power construction process by introducing a plurality of factors such as working intensity index, working efficiency and the like. In practical application, the algorithm can effectively reduce the cost and period of power construction and improve the construction efficiency and quality. Meanwhile, the algorithm can dynamically adjust the construction progress and adapt to complex construction environments, so that the stability and reliability of the construction progress are ensured.
In addition, the invention provides a power construction process quality assessment method based on the working grade and the construction quality index. The conventional quality evaluation method generally only considers factors such as time and cost of completion of work, and cannot accurately evaluate the quality of construction. The assessment method can comprehensively and accurately assess the quality of the power construction process, and has important significance for improving the power construction quality. In addition, the method can also provide effective support for quality management of the power construction process, so that construction risks and cost are reduced.
In general, the patent provides a high-efficiency, intelligent and accurate power construction management and control system, a related algorithm and a related method, which can effectively improve the power construction efficiency and quality, reduce the construction risk and cost, and have wide application prospect and practical value. These beneficial effects not only can promote the development of the power industry, but also can positively influence the improvement of productivity and economic benefits of the whole society.
Drawings
In order to more clearly illustrate the embodiments of the present invention or the technical solutions in the prior art, the drawings that are required to be used in the embodiments or the description of the prior art will be briefly described below, and it is obvious that the drawings in the following description are only embodiments of the present invention, and that other drawings can be obtained according to the provided drawings without inventive effort for a person skilled in the art.
Fig. 1 is a schematic system structure diagram of an electric power construction management and control system according to an embodiment of the present invention.
Detailed Description
The invention provides a power construction management and control system, which monitors and analyzes parameters of various equipment in a power construction process in real time by utilizing a data fusion and multidirectional data expansion mapping technology, so that the comprehensive management, control and scheduling of the construction process are realized. Specifically, the system realizes intelligent scheduling and optimization of the construction process by calculating indexes such as construction quality indexes, work completion time points, work intensity indexes and the like. Meanwhile, the system also utilizes a multidirectional data expansion mapping technology, and based on a Markov chain model and a DTW algorithm, the positioning and analysis of the abnormal equipment state are realized, so that the efficiency and the safety of the electric power construction process are improved. The technology can be widely applied to the field of power construction, and has important significance for improving the efficiency and quality of power construction.
For the purpose of making the objects, technical solutions and advantages of the embodiments of the present invention more apparent, the technical solutions of the embodiments of the present invention will be clearly and completely described below with reference to the accompanying drawings in the embodiments of the present invention, and it is apparent that the described embodiments are some embodiments of the present invention, but not all embodiments of the present invention. All other embodiments, which can be made by those skilled in the art based on the embodiments of the invention without making any inventive effort, are intended to be within the scope of the invention.
An electrical power construction management and control system, the system comprising: the data acquisition unit is configured to acquire parameters of various equipment in the power construction process and acquire environmental data of a power construction site in real time; the environmental data includes at least: temperature data, humidity data, air quality data, and air velocity data; the power construction scheduling unit is configured to calculate the working strength index, the construction quality index and the working completion time of each work in the power construction process based on the collected environmental data, and perform power construction scheduling based on the calculated working strength index, the construction quality index and the working completion time; the equipment monitoring unit is configured to perform data fusion based on parameters and environment data of each equipment in the power construction process, judge whether the equipment is abnormal according to the data fusion result, perform multi-direction data expansion mapping on the data fusion result if the equipment is abnormal, and analyze the data expansion mapping result in each direction to locate the equipment with problems.
Specifically, the data acquisition unit includes: a sensor network and an equipment monitoring device; the equipment monitoring device is configured to acquire parameters of various equipment in the power construction process; the sensor network is composed of a plurality of sensors of different types; the types of the sensors in the sensor network at least comprise: air sensor, temperature sensor, humidity sensor and wind speed sensor.
Specifically, the power construction scheduling unit calculates the total work intensity index of the power construction site by the following formula:

wherein , which represents an index of the overall working strength,
 represent the first
 The working strength index of the work item,
 representing the total number of work items; the power construction unit calculates a work intensity index of each work item by the following formula:
 。
。
wherein the weight of the air quality factor is set as The weight of the temperature factor is
 The weight of the humidity factor is
 The wind speed factor is weighted as
 The method comprises the steps of carrying out a first treatment on the surface of the The following conditions are satisfied:

wherein , 、
、 、
、 and
and the range of the values of the (C) is 1-10.
Specifically, the weight of the air quality factor Calculated according to the following formula:


wherein , the unit of concentration is
 。
。
Specifically, the weight of the temperature factor Calculated according to the following formula:


wherein , temperature is expressed in degrees celsius.
The weight of the humidity factor may be calculated in a number of ways. The following are two general calculation methods:
determining weights by expert evaluation: the expert in the electric power construction field can be invited to evaluate the importance degree of each construction factor according to the experience and expertise of the expert, and the weight of each factor is determined. For example, expert evaluation and weight calculation may be performed using an AHP (analytic hierarchy process) or FAHP (fuzzy analytic hierarchy process) method or the like.
The weights are determined by statistical analysis: statistical analysis and data mining can be performed through historical data and field monitoring data, the influence degree of each construction factor on construction quality is calculated, and the weight of each factor is determined according to the influence degree. For example, the data analysis and weight calculation may be performed using multiple regression analysis or artificial neural network, or the like.
When the weight of the humidity factor is calculated, a proper calculation method and a weight distribution scheme can be selected according to actual conditions and requirements. At the same time, care should be taken that the assignment of weights should be as objective and scientific as possible to ensure the accuracy and reliability of the algorithm.
The weight calculation method for the wind speed factor specifically comprises the following steps:
according to the actual condition of the electric power construction site, different wind speed grades are set, for example: no wind, breeze, 3-level wind, 5-level wind, etc.
Based on actual construction experience and expert opinion, the influence degree under different wind speed grades is subjected to weight evaluation, and weight calculation can be performed by adopting AHP, FAHP and other methods to obtain weight distribution schemes of different wind speed grades.
According to the actual monitoring data and the historical record, the influence degree under different wind speed grades is subjected to data analysis and statistical analysis, and the weight distribution scheme under different wind speed grades can be calculated by using multiple regression analysis, an artificial neural network and other methods.
According to actual requirements and data conditions, calculation results of different methods are comprehensively considered, and a final wind speed factor weight distribution scheme is determined so as to realize intelligent scheduling and management of the power construction process.
In short, the weight calculation of the wind speed factor needs to consider the actual situation and the requirement, and the comprehensive calculation is performed by combining a plurality of methods so as to obtain an accurate and reliable weight distribution scheme.
The following is an illustration of the weights for humidity and wind speed factors:
weights for wind speed factors: first, different wind speed levels are set according to actual conditions, for example: no wind, breeze, 3-level wind, 5-level wind, etc. Then, based on actual construction experience and expert opinion, the influence degree under different wind speed grades is subjected to weight evaluation, and weight calculation can be performed by adopting AHP, FAHP and other methods to obtain weight distribution schemes of different wind speed grades.
Taking an AHP method as an example, the weight distribution process for calculating wind speed factors is as follows:
step 1: constructing a judgment matrix, and recording importance degrees under different wind speed grades in a pairwise comparison mode, wherein the importance degrees are shown in a table 1:
table 1 compares the importance of different wind speed classes in pairs
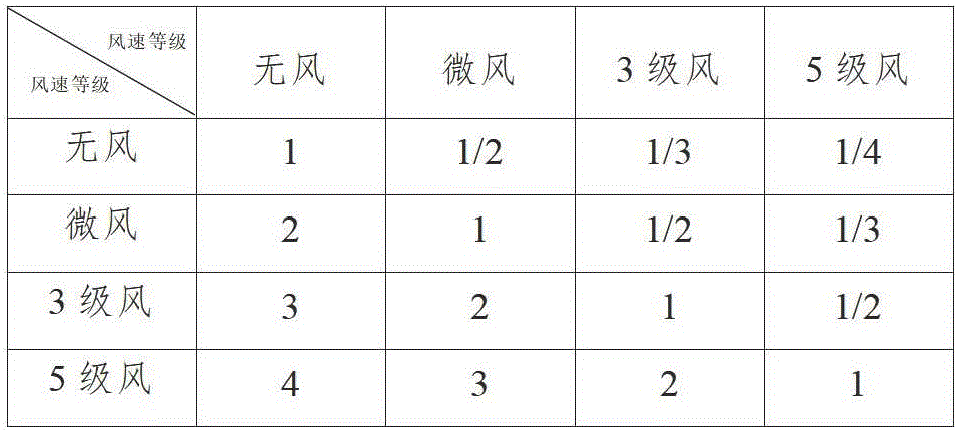
Step 2: calculating the weight vector to obtain weights of different wind speed grades, for example: [0.073, 0.165, 0.291, 0.471].
Step 3: and (5) carrying out consistency test, and checking and judging whether the consistency of the matrix meets the requirement. If consistency passes, the weight allocation scheme is considered feasible.
In summary, the weight of the wind speed factor is calculated by the AHP method and the like, so that a reasonable and scientific weight distribution scheme can be obtained according to the importance degrees under different wind speed grades, and the intelligent scheduling and management of the electric power construction process can be realized.
The humidity factor is another important factor affecting the power construction quality, and the weight calculation method is as follows:
first, different humidity levels are set according to actual conditions, for example: dry, wet, extremely wet, etc. Then, the weights under different humidity levels are calculated by expert evaluation or statistical analysis and other methods.
Taking a statistical analysis method as an example, the weight distribution process for calculating the humidity factor is as follows:
step 1: historical data and field monitoring data are collected, including construction quality indicators at different humidity levels, such as job completion time, construction quality level, job strength index, etc.
Step 2: and carrying out data analysis, and calculating the construction quality index, the working completion time, the average value of the working strength index and the like, the variance and other statistical indexes under different humidity levels.
Step 3: and calculating the standardized scores of the indexes to eliminate the dimension and unit differences among the indexes.
Step 4: based on actual requirements and data conditions, a weighted average method, an entropy weight method and other methods are adopted to calculate weight distribution schemes under different humidity levels.
Taking an entropy weight method as an example, the weight distribution process for calculating the humidity factor is as follows:
step 1: and calculating entropy values of various indexes to obtain entropy vectors under different humidity levels, for example: [0.6, 0.4, 0.8];
step 2: and calculating weight vectors of various indexes to obtain weight distribution schemes under different humidity levels, for example: [0.3, 0.2, 0.5].
In summary, the weight of the humidity factor is calculated by methods such as statistical analysis, weighted average method, entropy weight method, etc., so that a reasonable and scientific weight distribution scheme can be obtained according to actual data and requirements under different humidity levels, and intelligent scheduling and management of the electric power construction process can be realized.
In a word, the weight calculation method of wind speed factor and humidity factor can select proper calculation method and weight distribution scheme according to actual situation and demand. In the weight calculation process, the importance degree and the influence degree of different factors need to be comprehensively considered so as to realize intelligent scheduling and management of the power construction process.
Specifically, the power construction scheduling unit uses the following formula according to the work intensity index of each work Calculating the completion time of each work
 :
:

wherein , the standard completion time is indicated as such,
 the work efficiency of each work is represented, and the unit is man-hour/unit workload; completion time of each job
 According to the steps from small to largeTo obtain a time sequence of work completion
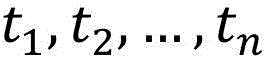 The method comprises the steps of carrying out a first treatment on the surface of the According to time series of work completion
 Dividing the power construction process into a plurality of time periods
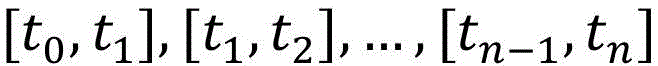 , wherein
  The point in time at which the construction is started is indicated,
 indicating the point in time when all work is completed; according to the completion time of each job
 And working strength index
 Working out the working grade of each work
 :
:

wherein , indicating the point in time at which the last job was completed,
 representing a work intensity level for each work; work level of each work
 Sequencing from big to small to obtain a working strength grade sequence:
 the method comprises the steps of carrying out a first treatment on the surface of the According to the working strength grade sequence
 Dividing the power construction process into a plurality of working class time periods
 , wherein
  The time point at which the work with the highest work intensity starts to be constructed is indicated,
 indicating the point in time when all work is completed; according to the completion time of each job
 And working intensity level
 Determining a construction time period of each job
 :
:


wherein , represent the first
 The point in time at which the work starts to be performed,
 represent the first
 Specifically, the power construction scheduling unit is configured to schedule the completion of the work according to the construction time period of each work
 And working intensity level
 Calculating the construction quality index of each work by using the following formula
 :
:
wherein , representing the construction quality index for each job.
Quality of construction index for each job Sequencing from small to large to obtain a working construction quality index sequence
 The method comprises the steps of carrying out a first treatment on the surface of the According to the working construction quality index sequence
 Dividing the power construction process into a plurality of quality class times
 , wherein
  Indicating the point in time when the work of the highest construction quality begins to be constructed,
 indicating the point in time when all work is completed; according to the working construction quality index sequence
 Calculating the total quality index of the electric power construction process
 :
:

wherein , representing a total quality index of the power construction process; according to the total mass index
 And standard quality index
 The quality evaluation is carried out on the electric power construction process by using the following method:
if it is The method comprises the steps of carrying out a first treatment on the surface of the The quality of the electric power construction process is evaluated to be good;
if it is The method comprises the steps of carrying out a first treatment on the surface of the Then evaluating the poor quality of the power construction process;
wherein , the standard quality index is indicated as such,
 indicating the total number of work items.
Specifically, the parameters of each device in the electric power construction process acquired by the data acquisition unit at least include: voltage, current and power.
Specifically, the device monitoring unit includes: an abnormality judgment unit and an abnormality positioning unit; the abnormality judging unit is configured to perform data fusion based on parameters and environment data of each device in the power construction process by using a Kalman filtering algorithm, and judge whether abnormality occurs to the device according to the result of the data fusion; the abnormality locating unit is configured to, when it is determined that an abnormality occurs in the device, perform multi-directional data expansion mapping based on a markov chain on the result of data fusion, and analyze the data expansion mapping result in each direction to locate the device with a problem.
The equipment monitoring unit is an important component of the intelligent power system, and intelligent monitoring and abnormality diagnosis of equipment states are realized through monitoring and data fusion of various equipment parameters in the power construction process. The core functions of the device monitoring unit are data fusion and anomaly diagnosis.
In the aspect of data fusion, the device monitoring unit can perform real-time data acquisition and processing by configuring parameters of various devices, such as current, voltage, temperature, power and the like. By adopting various data fusion algorithms, such as Kalman filtering, particle filtering and the like, the data of different parameters are fused, so that more accurate and reliable equipment state information is obtained.
In the aspect of abnormality diagnosis, the device monitoring unit can detect whether an abnormal condition exists by analyzing and comparing the data fusion result. For example, for a power parameter of a device, if the data fusion result exceeds a certain range or deviates from the distribution of the historical data, it is determined that an abnormal situation occurs in the device. Meanwhile, in order to further determine the specific position and the reason of the abnormality, the equipment monitoring unit can also perform multidirectional data expansion mapping, and analyze and process the abnormal data so as to locate equipment with problems.
Specifically, the multidirectional data expansion mapping is a multi-parameter and multi-dimensional data analysis method, and the original data is subjected to multidirectional mapping to obtain more comprehensive and fine data distribution conditions. In the equipment monitoring, the multi-directional data expansion mapping can be used for processing and analyzing abnormal data of equipment, such as expansion mapping of multiple parameters of voltage, current, power, temperature and the like of certain equipment, so as to obtain the data distribution condition of the equipment in multiple dimensions, and further determine the abnormal position and cause more accurately.
In summary, the device monitoring unit, as an important component of the present patent, may realize intelligent monitoring and abnormality diagnosis of the device state through real-time monitoring and data fusion of the device parameters. The method has the core functions of data fusion and abnormality diagnosis, wherein the multidirectional data expansion mapping is an effective abnormality diagnosis method, can further locate and analyze equipment abnormality conditions, and provides powerful support for safety and stability of the power construction process.
Specifically, the specific process of multi-directional data expansion mapping based on Markov chains includes: discretizing the multidimensional state vector, and dividing the state space in each dimension into a plurality of intervals; mapping each state in the multidimensional state space into a low-dimensional space; modeling a low-dimensional state space using a Markov chain; expanding along different dimensions for each state in the low-dimensional state space to obtain a plurality of new states; for states in other dimensions, corresponding expansion is also carried out, and a plurality of new state vectors are finally obtained; the state vectors after expansion are used to update the Markov chain state transition matrix to reflect the state distribution in the state space.
The abnormality detection algorithm in the equipment monitoring unit mainly comprises two parts of data fusion and multi-directional data expansion mapping.
The data fusion is mainly to comprehensively analyze a plurality of equipment parameters so as to obtain more comprehensive and accurate equipment state information. In the equipment monitoring unit, a Kalman filtering algorithm is adopted to carry out data fusion on equipment parameters. The Kalman filtering algorithm is an optimal filtering algorithm based on a state space model and is mainly used for estimating the state and output of a system. In the device monitoring unit, a state vector of the device parameter is expressed as:

wherein , the time step is indicated as such,
 represent the first
 Individual device parameters at time steps
 State of (2);
 is a state vector of device parameters.
Is provided with As an observation vector for the device parameters,
 in the form of a state transition matrix,
 in order to observe the matrix,
 in order to process the noise covariance matrix,
 to observe the noise covariance matrix, the Kalman filtering algorithm may be expressed as follows:
wherein , is shown in
 Estimation of the state vector of the device parameters at time of day,
 is shown in
 The state of the moment estimates the error covariance matrix.
After data fusion, we will get state information of multiple device parameters, and anomaly detection is needed to determine if the device is abnormal. To effectively detect abnormal states of the device, we employ a multi-directional data expansion mapping algorithm based on a Markov chain.
First, a multidimensional state vector is to be used Discretizing, dividing the state space in each dimension into
 Intervals. Set the first
 The state space of each dimension is
 Then multidimensional state space
 Can be expressed as:

next, the multidimensional state space is used Is mapped into a low dimensional space for more convenient anomaly detection. Let the mapped low-dimensional space be
 , wherein
  Then the multi-directional data expansion map mayExpressed as the following formula:

wherein , as a nonlinear mapping function, a polynomial, radial basis function, etc. may be used for definition. In practical implementation, a polynomial function is used to map the original state vector
 Mapping to a low-dimensional state vector
 The calculation of the first term and the second term in the low-dimensional state vector is exemplified as follows:

wherein , is a polynomial coefficient.
Next, the low-dimensional state space is mapped using Markov chains Modeling is performed to achieve anomaly detection of device states. Let the low-dimensional state vector
 The markov chain state transition probability can be expressed as the following equation:

wherein , representing slave states
 Transition to State
 Is used for the number of samples of (a),
 represent the first
 The size of the dimensional state space.
To better enable anomaly detection, we employ a multi-directional data expansion approach to expand the state space. For a low-dimensional state space We expand it along different dimensions to get multiple new states that can be used to more accurately represent different aspects of the original state. Is provided with
 Is the first
 In the individual dimensions
 The states we follow them along the first
 Expanding in each dimension to obtain
 The new states:

similarly, for states in other dimensions, corresponding expansions are performed. Finally, we have derived a number of new state vectors that can be used to more fully represent different aspects of the original state.
Next, we use these expanded state vectors to update the markov chain state transition matrix to more accurately reflect the state distribution in the state space. Is provided with Is in a slave state
 State vector transition after expansion to state
 Probability of the expanded state vector
 Can be expressed as the following formula:
wherein , representing slave states
 State vector transition after expansion to state
 The number of samples of the state vector after expansion,
 represent the first
 The dimension state space expands in size.
By expanding the state space over multiple dimensions, we get more state vectors and update the Markov chain state transition matrix to more accurately reflect the state distribution. Next, we can use this markov chain to determine if the device state is abnormal and locate the device that is in problem.
When using a Markov chain to determine whether the device state is abnormal, we predict the future state of the device through multi-step state transitions, taking the current device's state vector as a starting point. We compare this predicted state sequence with the actual observed state sequence and determine that the device state is abnormal if the distance between them exceeds a certain threshold.
In particular, we use a dynamic time warping algorithm (DTW) to calculate the distance between the predicted state sequence and the observed state sequence. The DTW algorithm may process a comparison between two sequences of different lengths and may map each element in a sequence to one or more elements in another sequence.
In locating problematic devices, we first determine which dimensions have state anomalies and then perform multi-directional data expansion along the other dimensions to get more state vectors. Next, we update the markov chain state transition matrix with these expanded state vectors and use the DTW algorithm to calculate the distance between each device's state sequence and the expected state sequence. The smaller the distance, the closer the state of the device is to the normal state, and otherwise, the abnormality of the device is indicated.
Finally, the equipment in the abnormal state can be positioned and correspondingly maintained or replaced, so that the smooth proceeding of the power construction process is ensured.
The localization of the device anomaly is based on a multi-dimensional data map in a multi-directional data expansion map. The specific positioning process is as follows:
acquiring a state vector of an abnormal device: when the state of the device is judged to be abnormal, a state vector of the device can be obtained through data fusion. For example, when the output voltage of a certain transformer is abnormal, the temperature is abnormal, and the like, when the state of the transformer is judged to be abnormal in the monitoring of the power transformer, we can obtain the state vector of the transformer.
Multidirectional data expansion is carried out on the state vector of the abnormal equipment: for the state vector of the abnormal device, we can expand it along different dimensions to get multiple new state vectors. For example, when monitoring a power transformer, we can expand the state vector of an abnormal transformer along the output voltage dimension to obtain a plurality of new state vectors, each describing the state of the transformer under different output voltages.
Multidimensional data mapping: for each state vector after expansion, we calculate the distance between the state vector and all the device state vectors in the history data by using a Markov chain model and a DTW algorithm to obtain the nearest neighbor state vector of the state vector in the history data. For example, when monitoring a power transformer, we can use historical data to calculate the nearest neighbor state vector of an abnormal transformer at different output voltages to determine the state of the transformer at different output voltages.
Device state analysis and positioning: and analyzing the nearest neighbor state vector obtained by multi-dimensional data mapping, so that the cause and the specific position of the equipment abnormality can be obtained. For example, when monitoring a power transformer, when an abnormal transformer has a temperature abnormal state under the condition of low output voltage, we can judge that the heat dissipation system of the transformer has a fault, so as to determine the position of the heat dissipation system and perform corresponding maintenance or replacement.
Through the positioning process, the position of the abnormal equipment can be rapidly and accurately positioned, and corresponding maintenance or replacement is performed, so that the smooth performance of the power construction process is ensured.
In the description, each embodiment is described in a progressive manner, and each embodiment is mainly described by the differences from other embodiments, so that the same similar parts among the embodiments are mutually referred. For the device disclosed in the embodiment, since it corresponds to the method disclosed in the embodiment, the description is relatively simple, and the relevant points refer to the description of the method section.
Those of skill would further appreciate that the various illustrative elements and algorithm steps described in connection with the embodiments disclosed herein may be implemented as electronic hardware, computer software, or combinations of both, and that the various illustrative elements and steps are described above generally in terms of functionality in order to clearly illustrate the interchangeability of hardware and software. Whether such functionality is implemented as hardware or software depends upon the particular application and design constraints imposed on the solution. Skilled artisans may implement the described functionality in varying ways for each particular application, but such implementation decisions should not be interpreted as causing a departure from the scope of the present invention.
The steps of a method or algorithm described in connection with the embodiments disclosed herein may be embodied directly in hardware, in a software module executed by a processor, or in a combination of the two. The software modules may be disposed in Random Access Memory (RAM), memory, read Only Memory (ROM), electrically programmable ROM, electrically erasable programmable ROM, registers, hard disk, a removable disk, a CD-ROM, or any other form of storage medium known in the art.
The present invention has been described in detail above. The principles and embodiments of the present invention have been described herein with reference to specific examples, the description of which is intended only to facilitate an understanding of the method of the present invention and its core ideas. It should be noted that it will be apparent to those skilled in the art that various modifications and adaptations of the invention can be made without departing from the principles of the invention and these modifications and adaptations are intended to be within the scope of the invention as defined in the following claims.
Claims (10)
1. An electrical power construction management and control system, the system comprising: the data acquisition unit is configured to acquire parameters of various equipment in the power construction process and acquire environmental data of a power construction site in real time; the environmental data includes at least: temperature data, humidity data, air quality data, and air velocity data; the power construction scheduling unit is configured to calculate the working strength index, the construction quality index and the working completion time of each work in the power construction process based on the collected environmental data, and perform power construction scheduling based on the calculated working strength index, the construction quality index and the working completion time; the equipment monitoring unit is configured to perform data fusion based on parameters and environment data of each equipment in the power construction process, judge whether the equipment is abnormal according to the data fusion result, perform multi-direction data expansion mapping on the data fusion result if the equipment is abnormal, and analyze the data expansion mapping result in each direction to locate the equipment with problems.
2. The system of claim 1, wherein the data acquisition unit comprises: a sensor network and an equipment monitoring device; the equipment monitoring device is configured to acquire parameters of various equipment in the power construction process; the sensor network is composed of a plurality of sensors of different types; the types of the sensors in the sensor network at least comprise: air sensor, temperature sensor, humidity sensor and wind speed sensor.
3. The system of claim 2, wherein the power construction scheduling unit calculates the total work intensity index for the power construction site by the formula:

wherein , indicating the total working intensity index->
 Indicate->
 Working intensity index of item work, +.>
 Representing the total number of work items; the power construction unit calculates a work intensity index of each work item by the following formula:
 ;
;
wherein the weight of the air quality factor is set as The weight of the temperature factor is +.>
 The weight of the humidity factor is
 The weight of wind speed factor is +.>
 The method comprises the steps of carrying out a first treatment on the surface of the The following conditions are satisfied:

wherein , 、
、 、
、 and
and The range of the values of the (C) is 1-10.
4. A system according to claim 3, wherein the air quality factor is weighted Calculated according to the following formula:


wherein , the unit of concentration is->
 。
。
5. The system of claim 3, wherein the temperature factor is weighted Calculated according to the following formula:


wherein , temperature is expressed in degrees celsius.
6. A system according to claim 3, wherein the power construction scheduling unit uses the following formula according to the working strength index of each work Calculating the completion time of each job>
 :
:

wherein , representing standard completion time,/->
 The work efficiency of each work is represented, and the unit is man-hour/unit workload; the completion time of each job is +.>
 Sequencing from small to large to obtain a time sequence of work completion +.>
 The method comprises the steps of carrying out a first treatment on the surface of the According to the time sequence of work completion->
 Dividing the power construction process into a plurality of time periods
 , wherein
 Indicating the point in time at which construction is to begin,/-)>
 Indicating the point in time when all work is completed; according to the completion time of each job->
 And working strength index->
 Calculating the work level of each work>
 :
:
wherein , indicating the point in time at which the last job was completed, < >>
 Representing a work intensity level for each work; the work level of each work is +>
 Sequencing from big to small to obtain a working strength grade sequence:
 The method comprises the steps of carrying out a first treatment on the surface of the According to the working intensity level sequence->
 Dividing the power construction process into a plurality of working class time periods
 , wherein
 A time point of starting construction of the work with highest work intensity is indicated by +.>
 Indicating the point in time when all work is completed; according to the completion time of each job->
 And working intensity class->
 Determining the construction period of each job>
 :
:

wherein , indicate->
 Time point of construction of work start +.>
 Indicate->
 The point in time when the project work is completed.
7. The system according to claim 6, wherein the power construction scheduling unit is configured to perform the power construction according to a construction period of each job And working intensity class->
 The construction quality index +/for each job was calculated using the following formula>
 :
:

wherein , representing the construction quality index of each job;
quality of construction index for each job Sequencing from small to large to obtain a working construction quality index sequence
 The method comprises the steps of carrying out a first treatment on the surface of the According to the working construction quality index sequence->
 Dividing the power construction process into a plurality of quality class time +.>
 , wherein
 A time point of starting construction indicating the work with the highest construction quality, < > for>
 Indicating the point in time when all work is completed; according to the working construction quality index sequence
 Calculating the total mass index of the electric power construction process>
 :/>
:/>

wherein , representing a total quality index of the power construction process; according to the total mass index->
 And Standard quality index>
 The quality evaluation is carried out on the electric power construction process by using the following method:
if it is The method comprises the steps of carrying out a first treatment on the surface of the The quality of the electric power construction process is evaluated to be good;
if it is The method comprises the steps of carrying out a first treatment on the surface of the Then evaluating the poor quality of the power construction process;
wherein , representing standard quality index>
 Representing a total ofCommon work item count.
8. The system according to claim 1, wherein the parameters of each device in the power construction process acquired by the data acquisition unit include at least: voltage, current and power.
9. The system of claim 8, wherein the device monitoring unit comprises: an abnormality judgment unit and an abnormality positioning unit; the abnormality judging unit is configured to perform data fusion based on parameters and environment data of each device in the power construction process by using a Kalman filtering algorithm, and judge whether abnormality occurs to the device according to the result of the data fusion; the abnormality locating unit is configured to, when it is determined that an abnormality occurs in the device, perform multi-directional data expansion mapping based on a markov chain on the result of data fusion, and analyze the data expansion mapping result in each direction to locate the device with a problem.
10. The system of claim 9, wherein the multi-directional data expansion mapping based on a markov chain comprises: discretizing the multidimensional state vector, and dividing the state space in each dimension into a plurality of intervals; mapping each state in the multidimensional state space into a low-dimensional space; modeling a low-dimensional state space using a Markov chain; expanding along different dimensions for each state in the low-dimensional state space to obtain a plurality of new states; for states in other dimensions, corresponding expansion is also carried out, and a plurality of new state vectors are finally obtained; the state vectors after expansion are used to update the Markov chain state transition matrix to reflect the state distribution in the state space.
Priority Applications (1)
| Application Number | Priority Date | Filing Date | Title |
|---|---|---|---|
| CN202310544425.8A CN116258467B (en) | 2023-05-16 | 2023-05-16 | Electric power construction management and control system |
Applications Claiming Priority (1)
| Application Number | Priority Date | Filing Date | Title |
|---|---|---|---|
| CN202310544425.8A CN116258467B (en) | 2023-05-16 | 2023-05-16 | Electric power construction management and control system |
Publications (2)
| Publication Number | Publication Date |
|---|---|
| CN116258467A true CN116258467A (en) | 2023-06-13 |
| CN116258467B CN116258467B (en) | 2023-08-18 |
Family
ID=86688381
Family Applications (1)
| Application Number | Title | Priority Date | Filing Date |
|---|---|---|---|
| CN202310544425.8A Active CN116258467B (en) | 2023-05-16 | 2023-05-16 | Electric power construction management and control system |
Country Status (1)
| Country | Link |
|---|---|
| CN (1) | CN116258467B (en) |
Cited By (3)
| Publication number | Priority date | Publication date | Assignee | Title |
|---|---|---|---|---|
| CN118195509A (en) * | 2024-02-29 | 2024-06-14 | 湖南水总水电建设集团有限公司 | Water conservancy and hydropower engineering construction monitoring data management method and system |
| CN118886708A (en) * | 2024-07-08 | 2024-11-01 | 湖北既济电力集团有限公司汉口分公司 | A power construction management and control system |
| CN119990763A (en) * | 2025-01-20 | 2025-05-13 | 十堰巨能电力设计有限公司 | A power engineering construction management method and system based on three-dimensional design |
Citations (8)
| Publication number | Priority date | Publication date | Assignee | Title |
|---|---|---|---|---|
| US20120290347A1 (en) * | 2010-08-10 | 2012-11-15 | King Fahd University Of Petroleum And Minerals | Progress monitoring method |
| CN109784681A (en) * | 2018-12-26 | 2019-05-21 | 中国大唐集团科学技术研究院有限公司 | Power engineering project investment management system |
| CN112104083A (en) * | 2020-09-17 | 2020-12-18 | 贵州电网有限责任公司 | Power grid production command system based on situation awareness |
| CN112184134A (en) * | 2019-07-02 | 2021-01-05 | 广联达科技股份有限公司 | Network plan rationality evaluation dimension design method, evaluation method, system and device |
| CN112837184A (en) * | 2021-02-22 | 2021-05-25 | 辽宁科技学院 | A project management system suitable for construction engineering |
| CN114676984A (en) * | 2022-03-09 | 2022-06-28 | 上海有间建筑科技有限公司 | System for construction is built to wisdom |
| CN115048699A (en) * | 2022-06-17 | 2022-09-13 | 王宏忻 | Construction management method based on BIM |
| CN115730801A (en) * | 2022-11-25 | 2023-03-03 | 国网河南省电力公司宁陵县供电公司 | Multidimensional management method for distribution network construction project construction |
-
2023
- 2023-05-16 CN CN202310544425.8A patent/CN116258467B/en active Active
Patent Citations (8)
| Publication number | Priority date | Publication date | Assignee | Title |
|---|---|---|---|---|
| US20120290347A1 (en) * | 2010-08-10 | 2012-11-15 | King Fahd University Of Petroleum And Minerals | Progress monitoring method |
| CN109784681A (en) * | 2018-12-26 | 2019-05-21 | 中国大唐集团科学技术研究院有限公司 | Power engineering project investment management system |
| CN112184134A (en) * | 2019-07-02 | 2021-01-05 | 广联达科技股份有限公司 | Network plan rationality evaluation dimension design method, evaluation method, system and device |
| CN112104083A (en) * | 2020-09-17 | 2020-12-18 | 贵州电网有限责任公司 | Power grid production command system based on situation awareness |
| CN112837184A (en) * | 2021-02-22 | 2021-05-25 | 辽宁科技学院 | A project management system suitable for construction engineering |
| CN114676984A (en) * | 2022-03-09 | 2022-06-28 | 上海有间建筑科技有限公司 | System for construction is built to wisdom |
| CN115048699A (en) * | 2022-06-17 | 2022-09-13 | 王宏忻 | Construction management method based on BIM |
| CN115730801A (en) * | 2022-11-25 | 2023-03-03 | 国网河南省电力公司宁陵县供电公司 | Multidimensional management method for distribution network construction project construction |
Non-Patent Citations (1)
| Title |
|---|
| SAMIRA NADAFI等: "Predicting the project time and costs using EVM based on gray numbers", 《ENGINEERING, CONSTRUCTION AND ARCHITECTURAL MANAGEMENT》, vol. 26, no. 9, pages 2107 - 2119 * |
Cited By (3)
| Publication number | Priority date | Publication date | Assignee | Title |
|---|---|---|---|---|
| CN118195509A (en) * | 2024-02-29 | 2024-06-14 | 湖南水总水电建设集团有限公司 | Water conservancy and hydropower engineering construction monitoring data management method and system |
| CN118886708A (en) * | 2024-07-08 | 2024-11-01 | 湖北既济电力集团有限公司汉口分公司 | A power construction management and control system |
| CN119990763A (en) * | 2025-01-20 | 2025-05-13 | 十堰巨能电力设计有限公司 | A power engineering construction management method and system based on three-dimensional design |
Also Published As
| Publication number | Publication date |
|---|---|
| CN116258467B (en) | 2023-08-18 |
Similar Documents
| Publication | Publication Date | Title |
|---|---|---|
| CN118094438B (en) | Distribution cable operation analysis method and system based on big data | |
| CN117408162B (en) | Power grid fault control method based on digital twin | |
| CN116258467B (en) | Electric power construction management and control system | |
| Alaswad et al. | A review on condition-based maintenance optimization models for stochastically deteriorating system | |
| CN118365307A (en) | Power plant equipment state overhaul decision support method and system | |
| CN117590159A (en) | A deep learning-based tunnel cable power supply status monitoring method and system | |
| CN118035814A (en) | Equipment status fault early warning method and system based on digital twin field data analysis | |
| CN119644765B (en) | Parameter optimization method and device for coupling type transformer | |
| CN118690306B (en) | Digital twin-based heat accumulating type thermal incinerator system fault prediction method and system | |
| CN118585755A (en) | Charging pile safety monitoring and fault diagnosis method and system based on artificial intelligence | |
| WO2025241630A1 (en) | Cable health state assessment method and system | |
| CN118300066A (en) | Energy management method and system based on digital twin technology | |
| CN118826009A (en) | A distribution network fault monitoring system and method based on digital twin | |
| KR102573254B1 (en) | System for predicting and analyzing trouble of mechanical equipment using federated learning | |
| US11339763B2 (en) | Method for windmill farm monitoring | |
| CN117272844B (en) | Method and system for predicting working life of switchboard | |
| CN118246695B (en) | A photovoltaic new energy operation and maintenance dispatching system | |
| CN119716404A (en) | A method for intelligent identification of distribution network topology anomalies | |
| CN120069836A (en) | Power equipment inspection method and system based on fault prediction | |
| CN119378982A (en) | A digital intelligent management method and system for line loss in a transformer area | |
| CN118128775A (en) | Performance tracking and monitoring method and system for optimized fan | |
| CN118611103A (en) | Control method and system of containerized energy storage system | |
| CN111382946B (en) | Autonomous evaluation method and system for health state of equipment and industrial internet equipment | |
| CN117875946B (en) | A human-machine collaborative autonomous infrared inspection method for substation equipment operation and maintenance | |
| CN112580940A (en) | Wind turbine generator running state online evaluation method |
Legal Events
| Date | Code | Title | Description |
|---|---|---|---|
| PB01 | Publication | ||
| PB01 | Publication | ||
| SE01 | Entry into force of request for substantive examination | ||
| SE01 | Entry into force of request for substantive examination | ||
| GR01 | Patent grant | ||
| GR01 | Patent grant |