CN116097095A - Methods for detecting and treating prostate cancer - Google Patents
Methods for detecting and treating prostate cancer Download PDFInfo
- Publication number
- CN116097095A CN116097095A CN202180053255.2A CN202180053255A CN116097095A CN 116097095 A CN116097095 A CN 116097095A CN 202180053255 A CN202180053255 A CN 202180053255A CN 116097095 A CN116097095 A CN 116097095A
- Authority
- CN
- China
- Prior art keywords
- prostate cancer
- subject
- laccer
- risk
- progression
- Prior art date
- Legal status (The legal status is an assumption and is not a legal conclusion. Google has not performed a legal analysis and makes no representation as to the accuracy of the status listed.)
- Pending
Links
Images


Classifications
-
- G01N33/57555—
-
- A—HUMAN NECESSITIES
- A61—MEDICAL OR VETERINARY SCIENCE; HYGIENE
- A61P—SPECIFIC THERAPEUTIC ACTIVITY OF CHEMICAL COMPOUNDS OR MEDICINAL PREPARATIONS
- A61P35/00—Antineoplastic agents
-
- G—PHYSICS
- G01—MEASURING; TESTING
- G01N—INVESTIGATING OR ANALYSING MATERIALS BY DETERMINING THEIR CHEMICAL OR PHYSICAL PROPERTIES
- G01N33/00—Investigating or analysing materials by specific methods not covered by groups G01N1/00 - G01N31/00
- G01N33/48—Biological material, e.g. blood, urine; Haemocytometers
- G01N33/50—Chemical analysis of biological material, e.g. blood, urine; Testing involving biospecific ligand binding methods; Immunological testing
- G01N33/92—Chemical analysis of biological material, e.g. blood, urine; Testing involving biospecific ligand binding methods; Immunological testing involving lipids, e.g. cholesterol, lipoproteins, or their receptors
-
- G—PHYSICS
- G01—MEASURING; TESTING
- G01N—INVESTIGATING OR ANALYSING MATERIALS BY DETERMINING THEIR CHEMICAL OR PHYSICAL PROPERTIES
- G01N2405/00—Assays, e.g. immunoassays or enzyme assays, involving lipids
- G01N2405/08—Sphingolipids
-
- G—PHYSICS
- G01—MEASURING; TESTING
- G01N—INVESTIGATING OR ANALYSING MATERIALS BY DETERMINING THEIR CHEMICAL OR PHYSICAL PROPERTIES
- G01N2405/00—Assays, e.g. immunoassays or enzyme assays, involving lipids
- G01N2405/08—Sphingolipids
- G01N2405/10—Glycosphingolipids, e.g. cerebrosides, gangliosides
-
- G—PHYSICS
- G01—MEASURING; TESTING
- G01N—INVESTIGATING OR ANALYSING MATERIALS BY DETERMINING THEIR CHEMICAL OR PHYSICAL PROPERTIES
- G01N2800/00—Detection or diagnosis of diseases
- G01N2800/50—Determining the risk of developing a disease
-
- G—PHYSICS
- G01—MEASURING; TESTING
- G01N—INVESTIGATING OR ANALYSING MATERIALS BY DETERMINING THEIR CHEMICAL OR PHYSICAL PROPERTIES
- G01N2800/00—Detection or diagnosis of diseases
- G01N2800/52—Predicting or monitoring the response to treatment, e.g. for selection of therapy based on assay results in personalised medicine; Prognosis
-
- G—PHYSICS
- G01—MEASURING; TESTING
- G01N—INVESTIGATING OR ANALYSING MATERIALS BY DETERMINING THEIR CHEMICAL OR PHYSICAL PROPERTIES
- G01N2800/00—Detection or diagnosis of diseases
- G01N2800/56—Staging of a disease; Further complications associated with the disease
Landscapes
- Health & Medical Sciences (AREA)
- Life Sciences & Earth Sciences (AREA)
- Engineering & Computer Science (AREA)
- Molecular Biology (AREA)
- Chemical & Material Sciences (AREA)
- Immunology (AREA)
- Urology & Nephrology (AREA)
- Biomedical Technology (AREA)
- Hematology (AREA)
- General Health & Medical Sciences (AREA)
- Medicinal Chemistry (AREA)
- Biochemistry (AREA)
- General Physics & Mathematics (AREA)
- Cell Biology (AREA)
- Food Science & Technology (AREA)
- Biotechnology (AREA)
- Physics & Mathematics (AREA)
- Analytical Chemistry (AREA)
- Microbiology (AREA)
- Pathology (AREA)
- Nuclear Medicine, Radiotherapy & Molecular Imaging (AREA)
- Veterinary Medicine (AREA)
- Chemical Kinetics & Catalysis (AREA)
- General Chemical & Material Sciences (AREA)
- Endocrinology (AREA)
- Organic Chemistry (AREA)
- Pharmacology & Pharmacy (AREA)
- Animal Behavior & Ethology (AREA)
- Public Health (AREA)
- Biophysics (AREA)
- Investigating Or Analysing Biological Materials (AREA)
- Medicines That Contain Protein Lipid Enzymes And Other Medicines (AREA)
- Medicines Containing Antibodies Or Antigens For Use As Internal Diagnostic Agents (AREA)
- Pharmaceuticals Containing Other Organic And Inorganic Compounds (AREA)
- Hospice & Palliative Care (AREA)
- Oncology (AREA)
- Measuring Or Testing Involving Enzymes Or Micro-Organisms (AREA)
Abstract
提供了用于检测早期前列腺癌和确定处于前列腺癌进展风险中的风险的方法和相关试剂盒。
Methods and related kits for detecting early-stage prostate cancer and determining risk for prostate cancer progression are provided.
Description
Cross Reference to Related Applications
The present application claims the benefit of U.S. provisional patent application No. 63/049,521, filed on 7/8/2020, and U.S. provisional patent application No. 63/067,601, filed on 8/2020, the disclosures of which are incorporated herein by reference in their entireties.
The patent or application file contains at least one drawing executed in color. Copies of this patent or patent application publication with color drawing(s) will be provided by the office upon request and payment of the necessary fee.
Statement regarding federally sponsored research
The present invention was completed with government support under grant No. CA223527 from the national institutes of health. The government has certain rights in this invention.
Background
Elevated serum Cav-1 levels are associated with high risk of prostate cancer, castration resistance, and biochemical recurrence following prostatectomy. It has been previously demonstrated that elevated plasma Cav-1 is associated with early disease reclassification in prostate cancer individuals who initially manifest as clinically localized disease. Cav-1 is a homonymous protein component of the following litter: the bulb-shaped 50-100nm plasma membrane rich in glycosphingolipids and cholesterol is invaginated. Cav-1 also plays a role in tissue membrane micro-domain composition and in regulating transmembrane signaling. There is growing evidence that Cav-1 acts as an essential lipid partner, promoting cellular lipid transport and homeostasis, endocytosis and exocytosis, and mechanical protection of cell membranes. Cav-1 is known to transport molecules including insulin, chemokines, albumin, and low and high density lipoproteins (LDL and HDL). Recently, it was found that extracellular vesicles containing Cav-1 in white adipose tissue guide the intracellular exchange of proteins and lipids between endothelial cells and adipocytes in response to the metabolic state of the system.
In cancer, the effects of Cav-1 are dynamic and environmental dependent. Cav-1 has been shown to regulate and promote the activity of receptor tyrosine kinases, G-protein coupled receptors, integrins and cadherins. Cav-1 expression is closely related to invasive phenotypes in various tumor types and has been linked to epithelial-mesenchymal plasticity, tumor invasion and metastatic potential, and radiation and multi-drug resistance.
Although Cav-1 is associated with metabolic changes in prostate cancer, the mechanism by which Cav-1 affects metabolic recombination has not been previously established. Interrogation of Cav-1 function in the context of prostate tumor metabolism revealed an integrated metabolic program of enhanced lipid clearance and active differential ceramide metabolism in prostate tumors that exhibited Gleason-staged progression upon initial inclusion in active monitoring. Importantly, this metabolic phenotype produces a biomarker for disease progression and identifies a point of treatment susceptibility. Key features of this tumor-supporting metabolic program include Cav-1 mediated lipid uptake, increased tumor catabolism of extracellular Sphingomyelin (SM), increased ceramide metabolism coupled with glycosphingolipid synthesis, and circulating Cav-1-sphingolipid particle efflux, which particles contain cargo indicative of crossing with mitochondrial remodeling. Based on these mechanistic findings, potential operational metabolic vulnerability to targeting Cav-1 mediated lipid clearance and metabolism in invasive prostate cancer mouse models has been tested.
Baseline plasma metabonomics profile analysis from a longitudinal prospective cohort of prostate cancer active monitoring (AS) participants identified changes in plasma sphingolipids AS a significant feature of AS progression subjects. These metabolite profiles can combine to produce a signature predictive of early prostate cancer disease progression. Previous work has shown that baseline plasma caveolin-1 (Cav-1) is an independent predictor of disease classification in similar AS queues. The study is based on the recognized role of tissue-localized and secreted Cav-1 in invasive and potentially resistant prostate cancer. Plasma Cav-1 may additionally be integrated with plasma sphingolipid characteristics into a combined predictive signature. Mechanical studies have been conducted to elucidate the major biological processes involved in tumor-supporting tumor metabolism, which is a potential cause of the observed characteristic signature of plasma. Using an syngeneic RM-9 mouse model of prostate cancer and established human prostate cancer cell lines, evidence has been obtained that Cav-1 promotes lipid metabolism recombination towards exogenous lipid clearance and vesicle biogenesis (crossing sphingolipid metabolism) procedures; activation of this procedure was demonstrated in plasma signatures; and the procedure presents metabolic vulnerability that can be a target for anti-tumor therapy.
Disclosure of Invention
Methods and kits for assessing the status of prostate cancer are provided. These methods and kits use multiplex assays for biomarkers contained within biological samples obtained from subjects. Analysis of one or more of the following biomarkers provides highly accurate risk assessment and prognosis of prostate cancer progression: CAV-1, SM (40:2), SM (44:2), lactosylceramide (32:0) ("LacCer 32:0"), lactosylceramide (36:0) ("LacCer 36:0), trihexosylceramide (34:1) (" TriHexCer ") and hexosylceramide (40:0) (" HexCer 40:0 ").
Based on the levels of one or more of the biomarkers CAV-1, SM (40:2), SM (44:2), lacCer 32:0, lacCer 36:0, triHexCer 34:1, and HexCer 40:0 found in biological samples from subjects, regression models were identified that can predict the risk of prostate cancer progression in subjects.
Accordingly, provided herein are methods of determining and/or quantifying the risk of pancreatic cancer progression in a subject, the methods comprising measuring the level of one or more of the biomarkers CAV-1, SM (40:2), SM (44:2), lacCer 32:0, lacCer 36:0, triHexCer 34:1, and HexCer 40:0 in a sample from the subject.
Also provided are methods of treating or preventing prostate cancer progression in a subject, wherein the level of one or more of the biomarkers CAV-1, SM (40:2), SM (44:2), lacCer 32:0, lacCer 36:0, triHexCer 34:1, and HexCer 40:0 classifies the subject as being at risk of prostate cancer progression.
Corresponding kits for the following are also provided: determining the presence of an indicator of prostate cancer progression in a sample from a subject, determining a risk of progression in a prostate cancer subject, and determining and/or quantifying the risk of prostate cancer progression in a subject, the kits comprising materials for measuring one or more of the biomarkers CAV-1, SM (40:2), SM (44:2), lacCer 32:0, lacCer 36:0, triHexCer 34:1, and HexCer 40:0 in the sample.
In some embodiments, the biomarker is measured in a blood sample drawn from the subject. In some embodiments, the presence or absence of a biomarker, or alternatively the amount of a biomarker, in a biological sample may be determined. In some embodiments, the level of a biomarker in a biological sample can be quantified.
In some embodiments, a surface is provided for analysis of a biological sample. In some embodiments, the biomarker of interest is non-specifically adsorbed to the surface. In some embodiments, a receptor specific for the biomarker of interest is incorporated onto the surface. In some embodiments, the surface is associated with a particle (e.g., a bead).
In some embodiments, the biomarker binds to a particular receptor molecule, and the presence or absence of the biomarker-receptor complex, or alternatively the amount of biomarker-receptor complex, may be determined. In some embodiments, the amount of biomarker-receptor complex may be quantified. In some embodiments, the receptor molecules are linked to enzymes to facilitate detection and quantification.
In some embodiments, the biomarker is bound to a specific relay molecule, and the biomarker-relay molecule complex is in turn bound to a receptor molecule. In some embodiments, the presence or absence of a biomarker-relay-receptor complex, or alternatively the amount of biomarker-relay-receptor complex, may be determined. In some embodiments, the amount of biomarker-relay-receptor complex may be quantified. In some embodiments, the receptor molecules are linked to enzymes to facilitate detection and quantification.
In some embodiments, the various biomarkers in the biological sample are analyzed sequentially. In some embodiments, the biological sample is divided into a plurality of separate portions to allow simultaneous analysis of multiple biomarkers. In some embodiments, multiple biomarkers of a biological sample are analyzed in a single process.
In some embodiments, the presence or absence of a biomarker can be determined by visual inspection. In some embodiments, the amount of biomarker may be determined using spectroscopic techniques. In some embodiments, the spectroscopic technique is mass spectrometry. In some embodiments, the spectroscopic technique is UV/Vis spectroscopy. In some embodiments, the spectroscopic technique is an excitation/emission technique, such as fluorescence spectroscopy. In some embodiments, the spectroscopic technique is mass spectrometry. In some embodiments, spectroscopic techniques are combined with chromatographic techniques. In some embodiments, the chromatographic technique is liquid chromatography. In some embodiments, the chromatographic technique is high performance liquid chromatography ("HPLC"). In some embodiments, the chromatographic technique is gas chromatography ("GC").
In some embodiments, analysis of biomarkers CAV-1, SM (40:2), SM (44:2), lacCer 32:0, lacCer 36:0, triHexCer 34:1, and HexCer 40:0 can be combined with analysis of additional biomarkers. In some embodiments, the additional biomarker may be a protein biomarker. In some embodiments, the additional biomarker may be a non-protein biomarker.
In some embodiments, kits for analyzing biological samples are provided. In some embodiments, the kit may contain chemicals and reagents necessary to perform the analysis. In some embodiments, the kit comprises means for manipulating the biological sample so as to minimize the required operator intervention. In some embodiments, the kit may digitally record the results of the analysis. In some embodiments, the kit may perform any desired mathematical processing on the data generated by the analysis.
In another aspect, the present disclosure provides a method of determining the risk of prostate cancer progression in a subject using a biomarker stack and a protein marker stack, wherein the biomarker stack comprises one or more of the biomarkers CAV-1, SM (40:2), SM (44:2), lacCer 32:0, lacCer 36:0, triHexCer 34:1, and HexCer 40:0; wherein the method comprises performing the following steps on a biological sample obtained from the subject; measuring the levels of the biomarkers and the protein biomarkers in the biological sample; wherein the amounts of the biomarkers and the protein biomarkers determine the risk of prostate cancer progression in the subject.
In another aspect, the present disclosure provides a kit for use in a method as described herein, the kit comprising a first reagent solution comprising a first solute for detecting CAV-1, a second reagent solution comprising a second solute for detecting SM (40:2), a third reagent solution comprising a third solute for detecting SM (44:2), a fourth reagent solution comprising a fourth solute for detecting LacCer 32:0, a fifth reagent solution comprising a fifth solute for detecting LacCer 36:0, a sixth reagent solution comprising a sixth solute for detecting TriHexCer 34:1, and a seventh reagent solution comprising a seventh solute for detecting HexCer 40:0.
In one embodiment, such a kit comprises a device for contacting a reagent solution with a biological sample. In another embodiment, such a kit comprises at least one surface having means for binding at least one biomarker. In another embodiment, the at least one biomarker is selected from the group consisting of CAV-1, SM (40:2), SM (44:2), lacCer 32:0, lacCer 36:0, triHexCer 34:1, and HexCer 40:0.
In another aspect, the present disclosure provides a method of treating a subject suspected of being at risk of prostate cancer progression, the method comprising: the method described herein is used to analyze the risk of prostate cancer progression in a subject and to administer a therapeutically effective amount of a prostate cancer treatment. In one embodiment, the treatment is surgery, chemotherapy, radiation therapy, targeted therapy, or a combination thereof. In another embodiment, the method comprises at least one receptor molecule that selectively binds one or more of the biomarkers selected from the group consisting of CAV-1, SM (40:2), SM (44:2), lacCer 32:0, lacCer 36:0, triHexCer 34:1, and HexCer 40:0. In another embodiment, detecting the amount of CAV-1, SM (40:2), SM (44:2), lacCer 32:0, lacCer 36:0, triHexCer 34:1, and HexCer 40:0 includes using solid particles. In another embodiment, the solid particles are beads. In another embodiment, at least one reporter is linked to the enzyme. In another embodiment, at least one protein or metabolite marker produces a detectable signal. In another embodiment, the detectable signal is detectable by spectroscopy. In another embodiment, the spectrometry is mass spectrometry. In another embodiment, the method includes incorporating patient history information into the allocation of risk of progression of prostate cancer or risk of non-progression of cancer. In another embodiment, the method comprises administering at least one surrogate diagnostic test to a patient assigned to be at risk of prostate cancer progression.
In another aspect, the disclosure provides a method of treating or preventing prostate cancer progression in a subject, wherein the level of one or more of the biomarkers CAV-1, SM (40:2), SM (44:2), lacCer 32:0, lacCer 36:0, triHexCer 34:1, and HexCer 40:0 identifies a risk of prostate cancer progression in the subject, the method comprising one or more of: administering a chemotherapeutic drug to a subject having prostate cancer; administering therapeutic radiation to the subject having prostate cancer; and surgery to partially or completely surgically resect cancerous tissue in the subject having prostate cancer. In one embodiment, the levels of CAV-1, SM (40:2), SM (44:2), lacCer 32:0, lacCer 36:0, triHexCer 34:1, and HexCer 40:0 are elevated. In another embodiment, the level of CAV-1, SM (40:2), SM (44:2), lacCer 32:0, lacCer 36:0, triHexCer 34:1, and HexCer 40:0 is elevated compared to the level of CAV-1, SM (40:2), SM (44:2), lacCer 32:0, lacCer 36:0, triHexCer 34:1, and HexCer 40:0 in a reference subject or group that is not at risk of prostate cancer progression. In another embodiment, the reference subject or group is healthy. In another embodiment, the reference subject or group has painless prostate cancer. In another embodiment, the levels of TriHexCer 34:1 and SM 40:2 are increased in the subject relative to a healthy subject. In another embodiment, the levels of TriHexCer 34:1 and SM 40:2 are elevated compared to the levels in a reference subject or group not suffering from invasive prostate cancer. In another embodiment, the levels of TriHexCer 34:1 and SM 40:2 are elevated compared to the levels in a reference subject or group having painless prostate cancer.
In another aspect, the disclosure provides a method of treating or preventing prostate cancer progression in a subject, wherein the level of CAV-1, SM (40:2), SM (44:2), lacCer 32:0, lacCer 36:0, triHexCer 34:1, and HexCer 40:0 identifies the subject as having or at risk of prostate cancer progression, the method comprising one or more of: administering a chemotherapeutic drug to a subject having prostate cancer; administering therapeutic radiation to the subject having prostate cancer; and surgery to partially or completely surgically resect cancerous tissue in the subject having prostate cancer. In one embodiment, the levels of CAV-1, SM (40:2), SM (44:2), lacCer 32:0, lacCer 36:0, triHexCer 34:1, and HexCer 40:0 are elevated. In another embodiment, the level of CAV-1, SM (40:2), SM (44:2), lacCer 32:0, lacCer 36:0, triHexCer 34:1, and HexCer 40:0 is elevated compared to the level of CAV-1, SM (40:2), SM (44:2), lacCer 32:0, lacCer 36:0, triHexCer 34:1, and HexCer 40:0 in a reference subject or group that is not at risk of prostate cancer progression. In another embodiment, the reference subject or group is healthy. In another embodiment, the reference subject or group has painless prostate cancer. In another embodiment, the level of CAV-1, SM (40:2), SM (44:2), lacCer 32:0, lacCer 36:0, triHexCer 34:1, and HexCer 40:0 is elevated compared to the level of CAV-1, SM (40:2), SM (44:2), lacCer 32:0, lacCer 36:0, triHexCer 34:1, and HexCer 40:0 in a reference subject or group having adenocarcinoma. In another embodiment, the level of CAV-1, SM (40:2), SM (44:2), lacCer 32:0, lacCer 36:0, triHexCer 34:1, and HexCer 40:0 is elevated compared to the level of CAV-1, SM (40:2), SM (44:2), lacCer 32:0, lacCer 36:0, triHexCer 34:1, and HexCer 40:0 in a reference subject or group having squamous cell carcinoma. In another embodiment, the subject is at high risk of prostate cancer progression.
In another aspect, the present disclosure provides a method of treating a subject suspected of having a risk of prostate cancer progression, the method comprising analyzing the risk of prostate cancer progression in the subject with the methods disclosed herein; a therapeutically effective amount of a prostate cancer treatment is administered. In one embodiment, the treatment is surgery, chemotherapy, radiation therapy, targeted therapy, or a combination thereof.
Also provided is a method of classifying a subject having prostate cancer as being at risk of developing invasive prostate cancer or not being at risk of developing invasive prostate cancer, predicting susceptibility to invasive prostate cancer in a subject, diagnosing invasive prostate cancer in a subject having prostate cancer, determining the risk of a subject having invasive prostate cancer, predicting likelihood of progression of prostate cancer in a subject having prostate cancer, providing a prognosis for a subject having prostate cancer, or selecting a subject having prostate cancer for treatment with an anti-cancer therapy, the method comprising: (a) Measuring the level of one or more of the biomarkers caveolin-1 (CAV-1), sphingomyelin 40:2 (SM 40:2), sphingomyelin 44:2 (SM 44:2), lactosylceramide 32:0 (LacCer 32:0), lactosylceramide 36:0 (LacCer 36:0), trioxaceramide 34:1 (TriHexCer 34:1) and hexosylceramide 40:0 (HexCer 40:0) in a biological sample from the subject using an in vitro assay, and (b) comparing the level of one or more of the biomarkers CAV-1, SM 40:2, SM 44:2, lacCer 32:0, lacCer 36:0, triHexCer 34:1 and HexCer 40:0 in the sample with a reference, wherein the level of one or more of the biomarkers CAV-1, SM 40:2, SM 44:2, lacCer 32:0, lacCer 36:0 and HexCer 34:0 provides an indication of the amount of change in the biological markers CAV-1, SM 40:2, SM 44:2, lacCer 32:0, lacCer 36:1 and HexCer 40:0: an indication that the subject is at risk of developing invasive prostate cancer or is not at risk of developing invasive prostate cancer, an indication that the subject is susceptible to invasive prostate cancer, an indication of likelihood of progression of the prostate cancer in the subject, an indication of progression-free survival of the subject, an indication of likely outcome of treatment of the prostate cancer, and an indication that the subject is a candidate for treatment with an anti-cancer therapy.
Also provided is a method of classifying a subject having prostate cancer as being at risk of developing invasive prostate cancer or not being at risk of developing invasive prostate cancer, predicting susceptibility to invasive prostate cancer in a subject, diagnosing invasive prostate cancer in a subject having prostate cancer, determining the risk of a subject having invasive prostate cancer, predicting likelihood of progression of prostate cancer in a subject having prostate cancer, providing a prognosis for a subject having prostate cancer, or selecting a subject having prostate cancer for treatment with an anti-cancer therapy, the method comprising: (a) Measuring the level of sphingomyelin 40:2 (SM 40:2), sphingomyelin 44:2 (SM 44:2), lactosylceramide 32:0 (LacCer 32:0), lactosylceramide 36:0 (LacCer 36:0) and trihexosylceramide 34:1 (TriHexCer 34:1) in a biological sample from the subject using an in vitro assay, and (b) comparing the level of SM 40:2, SM 44:2, lacCer 32:0, lacCer 36:0 and TriHexCer 34:1 in the sample with a reference, wherein the amount of change in SM 40:2, SM 44:2, lacCer 32:0, lacCer 36:0 and TriHexCer 34:1 relative to the reference provides an indication selected from the group consisting of: an indication that the subject is at risk of developing invasive prostate cancer or is not at risk of developing invasive prostate cancer, an indication that the subject is susceptible to invasive prostate cancer, an indication of likelihood of progression of the prostate cancer in the subject, an indication of progression-free survival of the subject, an indication of likely outcome of treatment of the prostate cancer, and an indication that the subject is a candidate for treatment with an anti-cancer therapy.
Also provided is a method of classifying a subject having prostate cancer as being at risk of developing invasive prostate cancer or not being at risk of developing invasive prostate cancer, predicting susceptibility to invasive prostate cancer in a subject, diagnosing invasive prostate cancer in a subject having prostate cancer, determining the risk of a subject having invasive prostate cancer, predicting likelihood of progression of prostate cancer in a subject having prostate cancer, providing a prognosis for a subject having prostate cancer, or selecting a subject having prostate cancer for treatment with an anti-cancer therapy, the method comprising: (a) Measuring the levels of sphingomyelin 40:2 (SM 40:2), lactosylceramide 36:0 (LacCer 36:0) and trihexyphosphamide 34:1 (TriHexCer 34:1) in a biological sample from the subject using an in vitro assay, and (b) comparing the levels of SM 40:2, lacCer 36:0 and TriHexCer 34:1 in the sample to a reference, wherein the amount of change in SM 40:2, lacCer 36:0 and TriHexCer 34:1 relative to the reference provides an indication selected from the group consisting of: an indication that the subject is at risk of developing invasive prostate cancer or is not at risk of developing invasive prostate cancer, an indication that the subject is susceptible to invasive prostate cancer, an indication of likelihood of progression of the prostate cancer in the subject, an indication of progression-free survival of the subject, an indication of likely outcome of treatment of the prostate cancer, and an indication that the subject is a candidate for treatment with an anti-cancer therapy.
Also provided is a method of classifying a subject having prostate cancer as being at risk of developing invasive prostate cancer or not being at risk of developing invasive prostate cancer, predicting a susceptibility to invasive prostate cancer in a subject, diagnosing invasive prostate cancer in a subject having prostate cancer, determining a risk of a subject having invasive prostate cancer, predicting a likelihood of progression of prostate cancer in a subject having prostate cancer, providing a prognosis to a subject having prostate cancer, or selecting a subject having prostate cancer for treatment with an anti-cancer therapy, the method comprising (a) measuring the level of trihexlyceceramide 34:1 (TriHexCer 34:1) in a biological sample from the subject using an in vitro assay, and (b) comparing the level of TriHexCer 34:1 in the sample to a reference, wherein the amount of change in TriHexCer 34:1 from the reference provides an indication selected from the group consisting of: an indication that the subject is at risk of developing invasive prostate cancer or is not at risk of developing invasive prostate cancer, an indication that the subject is susceptible to invasive prostate cancer, an indication of likelihood of progression of the prostate cancer in the subject, an indication of progression-free survival of the subject, an indication of likely outcome of treatment of the prostate cancer, and an indication that the subject is a candidate for treatment with an anti-cancer therapy.
Also provided is a method of classifying a subject having prostate cancer as being at risk of developing invasive prostate cancer or not being at risk of developing invasive prostate cancer, predicting susceptibility to invasive prostate cancer in a subject, diagnosing invasive prostate cancer in a subject having prostate cancer, determining the risk of a subject having invasive prostate cancer, predicting the likelihood of progression of prostate cancer in a subject having prostate cancer, providing a prognosis to a subject having prostate cancer, or selecting a subject having prostate cancer for treatment with an anti-cancer therapy, the method comprising (a) measuring the level of sphingomyelin 40:2 (SM 40:2) in a biological sample from the subject using an in vitro assay, and (b) comparing the level of SM 40:2 in the sample to a reference, wherein the amount of change in SM 40:2 relative to the reference provides an indication selected from the group consisting of: an indication that the subject is at risk of developing invasive prostate cancer or is not at risk of developing invasive prostate cancer, an indication that the subject is susceptible to invasive prostate cancer, an indication of likelihood of progression of the prostate cancer in the subject, an indication of progression-free survival of the subject, an indication of likely outcome of treatment of the prostate cancer, and an indication that the subject is a candidate for treatment with an anti-cancer therapy.
Also provided is a method of classifying a subject having prostate cancer as being at risk of developing invasive prostate cancer or not being at risk of developing invasive prostate cancer, predicting susceptibility to invasive prostate cancer in a subject, diagnosing invasive prostate cancer in a subject having prostate cancer, determining the risk of a subject having invasive prostate cancer, predicting the likelihood of progression of prostate cancer in a subject having prostate cancer, providing a prognosis to a subject having prostate cancer, or selecting a subject having prostate cancer for treatment with an anti-cancer therapy, the method comprising (a) measuring the level of: sphingomyelin 40:2 (SM 40:2), lactosylceramide 36:0 (LacCer 36:0) and trihexosylceramide 34:1; and/or trioxaceramide 34:1; and/or sphingomyelin 40:2 (SM 40:2), and (b) comparing the level of SM 40:2 in the sample to a reference, wherein the amount of change in SM 40:2 from the reference provides an indication selected from the group consisting of: an indication that the subject is at risk of developing invasive prostate cancer or is not at risk of developing invasive prostate cancer, an indication that the subject is susceptible to invasive prostate cancer, an indication of likelihood of progression of the prostate cancer in the subject, an indication of progression-free survival of the subject, an indication of likely outcome of treatment of the prostate cancer, and an indication that the subject is a candidate for treatment with an anti-cancer therapy.
Also provided is a method of treating or preventing prostate cancer progression in a subject, wherein the levels of sphingomyelin 40:2 (SM 40:2), lactosylceramide 36:0 (LacCer 36:0) and trihexosylceramide 34:1 are elevated relative to a reference not suffering from prostate cancer, the method comprising one or more of: administering an anti-cancer drug to the subject suffering from prostate cancer; administering therapeutic radiation to the subject having prostate cancer; and surgery to partially or completely surgically resect cancerous tissue in the subject having prostate cancer.
Also provided is a method of treating or preventing prostate cancer progression in a subject, wherein the level of trihexosylceramide 34:1 is increased relative to a reference not suffering from prostate cancer, the method comprising one or more of: administering an anti-cancer drug to the subject suffering from prostate cancer; administering therapeutic radiation to the subject having prostate cancer; and surgery to partially or completely surgically resect cancerous tissue in the subject having prostate cancer.
Also provided is a method of treating or preventing prostate cancer progression in a subject, wherein sphingomyelin 40:2 (SM 40:2) levels are elevated relative to a reference that is not afflicted with prostate cancer, the method comprising one or more of: administering an anti-cancer drug to the subject suffering from prostate cancer; administering therapeutic radiation to the subject having prostate cancer; and surgery to partially or completely surgically resect cancerous tissue in the subject having prostate cancer.
Also provided is a method of treating or preventing prostate cancer progression in a subject having elevated levels of: (a) Sphingomyelin 40:2 (SM 40:2), lactosylceramide 36:0 (LacCer 36:0) and trihexosylceramide 34:1; and/or (b) a trioxaceramide 34:1; and/or (c) sphingomyelin 40:2 (SM 40:2), the method comprising one or more of: administering an anti-cancer drug to the subject suffering from prostate cancer; administering therapeutic radiation to the subject having prostate cancer; and surgery to partially or completely surgically resect cancerous tissue in the subject having prostate cancer.
Also provided is a diagnostic kit for invasive prostate cancer comprising caveolin-1 (CAV-1), sphingomyelin 40:2 (SM 40:2), sphingomyelin 44:2 (SM 44:2), lactoceramide 32:0 (LacCer 32:0), lactoceramide 36:0 (LacCer 36:0), trioxaceramide 34:1 (TriHexCer 34:1) and hexosylceramide 40:0 (HexCer 40:0).
Also provided is a diagnostic kit for invasive prostate cancer comprising sphingomyelin 40:2 (SM 40:2), sphingomyelin 44:2 (SM 44:2), lactosylceramide 32:0 (LacCer 32:0), lactosylceramide 36:0 (LacCer 36:0) and trihexyphosphamide 34:1 (TriHexCer 34:1).
Also provided is a diagnostic kit for invasive prostate cancer comprising sphingomyelin 40:2 (SM 40:2), lactosylceramide 36:0 (LacCer 36:0) and trihexosylceramide 34:1 (TriHexCer 34:1).
Also provided is a diagnostic kit for invasive prostate cancer comprising trioxaceramide 34:1 (TriHexCer 34:1).
Also provided is a diagnostic kit for invasive prostate cancer comprising sphingomyelin 40:2 (SM 40:2).
Also provided is a diagnostic kit for invasive prostate cancer comprising: sphingomyelin 40:2 (SM 40:2), lactosylceramide 36:0 (LacCer 36:0), and trihexosylceramide 34:1; and/or trioxaceramide 34:1; and/or sphingomyelin 40:2 (SM 40:2).
Also provided is a method of treating or preventing prostate cancer progression in a subject, wherein the levels of caveolin-1 (CAV-1), sphingomyelin 40:2 (SM 40:2), sphingomyelin 44:2 (SM 44:2), lactoceramide 32:0 (LacCer 32:0), lactoceramide 36:0 (LacCer 36:0), trioxaco-ceramide 34:1, and hexose-ceramide 40:0 are elevated relative to a reference not suffering from prostate cancer, the method comprising one or more of: administering an anti-cancer drug to the subject suffering from prostate cancer; administering therapeutic radiation to the subject having prostate cancer; and surgery to partially or completely surgically resect cancerous tissue in the subject having prostate cancer.
Also provided is a method of treating or preventing prostate cancer progression in a subject, wherein the levels of sphingomyelin 40:2 (SM 40:2), sphingomyelin 44:2 (SM 44:2), lactosylceramide 32:0 (LacCer 32:0), lactosylceramide 36:0 (LacCer 36:0) and trihexosylceramide 34:1 are elevated relative to a reference not suffering from prostate cancer, the method comprising one or more of: administering an anti-cancer drug to the subject suffering from prostate cancer; administering therapeutic radiation to the subject having prostate cancer; and surgery to partially or completely surgically resect cancerous tissue in the subject having prostate cancer.
Also provided is a method of treating or preventing prostate cancer progression in a subject, wherein the levels of sphingomyelin 40:2 (SM 40:2), lactosylceramide 36:0 (LacCer 36:0) and trihexosylceramide 34:1 are elevated relative to a reference not suffering from prostate cancer, the method comprising one or more of: administering an anti-cancer drug to the subject suffering from prostate cancer; administering therapeutic radiation to the subject having prostate cancer; and surgery to partially or completely surgically resect cancerous tissue in the subject having prostate cancer.
Also provided is a method of treating or preventing prostate cancer progression in a subject, wherein the level of trihexosylceramide 34:1 is increased relative to a reference not suffering from prostate cancer, the method comprising one or more of: administering an anti-cancer drug to the subject suffering from prostate cancer; administering therapeutic radiation to the subject having prostate cancer; and surgery to partially or completely surgically resect cancerous tissue in the subject having prostate cancer.
Also provided is a method of treating or preventing prostate cancer progression in a subject, wherein sphingomyelin 40:2 (SM 40:2) levels are elevated relative to a reference that is not afflicted with prostate cancer, the method comprising one or more of: administering an anti-cancer drug to the subject suffering from prostate cancer; administering therapeutic radiation to the subject having prostate cancer; and surgery to partially or completely surgically resect cancerous tissue in the subject having prostate cancer.
Also provided is a method of treating or preventing prostate cancer progression in a subject having elevated levels of: sphingomyelin 40:2 (SM 40:2), lactosylceramide 36:0 (LacCer 36:0) and trihexosylceramide 34:1; and/or trioxaceramide 34:1; and/or sphingomyelin 40:2 (SM 40:2), the method comprising one or more of: administering an anti-cancer drug to the subject suffering from prostate cancer; administering therapeutic radiation to the subject having prostate cancer; and surgery to partially or completely surgically resect cancerous tissue in the subject having prostate cancer.
Drawings
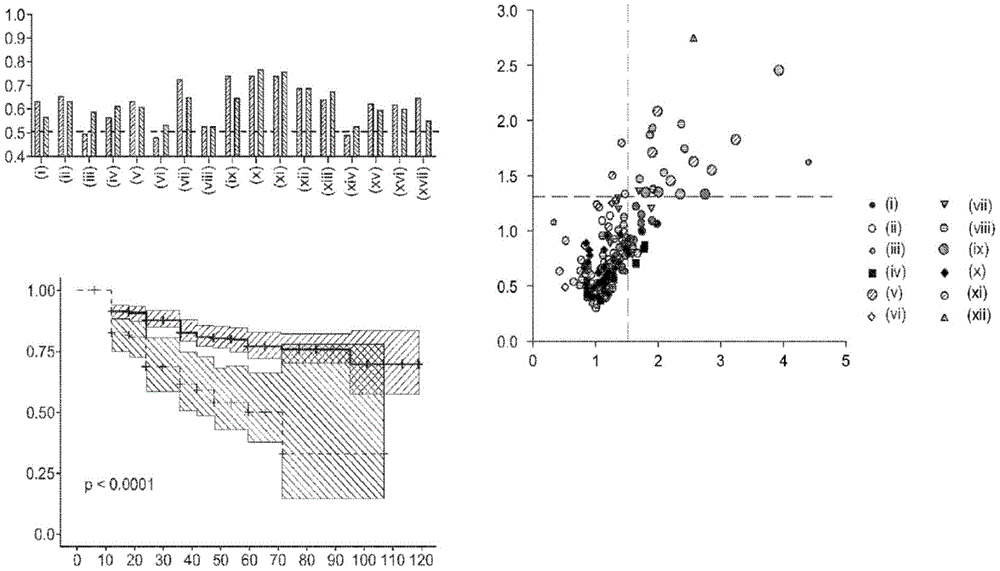
Figure 1 depicts (a) the respective ROC AUCs of sphingomyelin and glycosphingolipids in early stage prostate cancer patients experiencing disease progression (light grey = baseline; dark grey = 12 months). (i) SM (32:1) (ii) SM (32:2) (ii) SM (34:1) (iv) SM (34:2) (v) SM (36:1) (vi) SM (36:2) (vii) SM (40:2) (viii) SM (42:1) (ix) SM (42:3) (x) glucose ceramide (39:2) (xi) lactose ceramide (32:0) (xii) lactose ceramide (32:1) (xiii) lactose ceramide (34:1) (xiv) trioxase ceramide (d18:1/16:0) (xv) dihexyl ceramide (34:1) (xvi) dihexyl ceramide (36:1) (xvii) trihexose ceramide (34:1). (b) Volcanic plot showing the risk ratio (horizontal axis) of individual plasma lipid species stratified by lipid domain when predicting disease progression using baseline plasma samples from a larger prospective cohort (n=459); vertical axis = -log (p value). (c) Kaplan-Meier survival curves show progression free survival (vertical axis) of participants with plasma sphingolipid signals (plasma Cav-1 plus 6 sphingolipids) over time (month; horizontal axis); plasma sphingolipid characteristic marker levels are less than or equal to 4.33 or >4.33.
Figure 2 depicts in-patient comparisons of sphingolipids identified in the discovery cohort. (i) invasive_baseline; (ii) invasiveness_12m; (a) glucosylceramide (38:2) (b) lactosylceramide (32:0) (c) lactosylceramide (32:1) (d) lactosylceramide (34:1) (e) NeuAc2-3Gal1-4Glc? -Cer (d18:1/16:0) (f) NeuAc2-3Gal? -Cer (34:1) (g) NeuAc2-3Gal? -Cer (36:1) (h) TriHexCer 34:1 (i) SM (32:1) (j) SM (32:2) (k) SM (34:1) (l) SM (34:2) (m) SM (36:1) (n) SM (36:2) (o) SM (40:2) (p) SM (42:1) (q) SM (40:3).
FIG. 3 depicts immunoblots of Cav-1 in PC-3M cells after (a) treatment with SFM or lipid-containing SFM for 72 hours. SSALP with a defined lipid composition was produced and incorporated into the medium. sfl: synthesizing 'LDL-like' particles; sHDL: synthesizing HDL-like particles; PC-phosphatidylcholine; TO-trioleate; CE cholesterol oleate; FC, free cholesterol. (i) SFM (carrier) (ii) sHDL (PC/TO) Low and low )(iii)sHDL(PC/CE/TO High height )(iv)sHDL(PC/FC/CE/TO High height )(v)sHDL(PC/TO High height )(vi)sHDL(PC/SM/CE/TO High height )(vii)sHDL(PC/SM/FC/CE/TO High height )(viii)sHDL(PC/CE/TO High height )(ix)sHDL(PC/SM/TO Low and low )(x)sHDL(PC/SM/FC/TO High height ) (xi) SFM (control) (xii) sHDL (PC/SM/FC/CE/TO) Low and low )(xiii)sHDL(PC/SM/CE/TO Low and low ) (xiv) SFM (Carrier). (b) relative lipid composition of SSALP. (i) LDL (PC/TO) High height )(ii)LDL(PC/CE/TO High height )(iii)LDL(PC/SM/TO High height )(iv)LDL(PC/SM/CE/TO High height )(v)LDL(PC/SM/FC/TO High height )(vi)LDL(PC/SM/FC/CE/TO High height )(vii)HDL(PC/SM/TO Low and low )(viii)HDL(PC/SM/CE/TO Low and low )(ix)HDL(PC/SM/FC/TO Low and low )(x)HDL(PC/SM/FC/TO Low and low ) (c) Cav-1 representative immunoblots after overexpression or knockout of Cav-1 in LNCaP (left) and PC-3M (right) prostate cancer cells, respectively. (d) Baseline assessment of Dil-SSALP uptake by LNCaP, PC-3M and RM-9 prostate cancer cells pretreated with Dil-SSALP.
FIG. 4 depicts (a) fold-change in lipid domains (vertical axis, median relative to cell line specific controls) after overexpression or transient knockdown of CAV-1 in LNCaP and PC-3M, respectively. (i) acyl carnitine (ii) cardiolipin (iii) ceramide (iv) cholesterol ester (v) diacylglycerol (vi) glycosphingolipids (vii) lysophospholipids (viii) phospholipid (ix) sphingomyelin (x) triacylglycerol. For lipid domains, the aggregation strength of each annotated lipid species corresponding to the respective lipid domain is used. Statistical significance was determined by a two-sided student t test. (b) Relative abundance of lactosylceramide (area units.+ -. StDev) after overexpression of CAV-1 in LNCaP or after transient knockdown of CAV-1 in PC-3M. (i) Lactose ceramide (30:1) (i) lactose ceramide (18:1/20:4) (iii) lactose ceramide (18:1/16:0). Statistical significance was determined by a two-sided student t test. Lipid abundance was normalized based on total cell number.
FIG. 5 shows a biochemical network showing gene expression of ceramide metabolic central enzymes in prostate cancer cell lines (a) and prostate cancer (b) stratified by high or low CAV-1 expression. For CCLE data (a), prostate cancer cell lines stratified as high (log 2 mRNA range: 11.01-13.61) or low (log 2 mRNA range 4.16-6.88) CAV1 expression with average CAV1 mRNA expression. For TCGA data (b), prostate cancer was stratified into the highest or lowest CAV-1 expression quartiles. The node size reflects the magnitude of the change. The edges and arrows show the direction of the biochemical reaction. Thickening black node boundaries indicates a statistically significant difference.
Figure 6 provides an overview of the ceramide biosynthetic pathway.
FIG. 7 depicts (a) shows sphingomyelin (18:1/18:1) -d 9 Schematic representation of the potential biochemical route; (b) In the presence of sphingomyelin (18:1/18:1) -d 9 After 48 hours of SSALP treatment, (i) sphingomyelin (18:1/18:1), (ii) ceramide (18:1/18:1), (iii) glucosylceramide (18:1/18:1) and deuteration (d) of LNCaP, PC-3M and RM-9 9 ) The relative abundance (area units) of isotopes (iv, v, and vi, respectively). The values presented above the histogram indicate ceramide (18:1/18:1) -d 9 And sphingomyelin (18:1/18:1) -d 9 The ratio between.
FIG. 8 shows the relationship between CAV-1 and mitochondrial morphology. (a) Representative images of mitochondria and lysosomes in PC-3M (upper) and LNCaP (lower) cells transfected with CellLight lysosome-GFP (lysosome associated membrane protein 1) and CellLight mitochondrial-RFP (leader sequence of e1α pyruvate dehydrogenase). (b) C11 TopF-SM uptake after CAV1 knockdown in PC-3M cells. (c) Violin plots showing the intensity of TopF-SM after CAV1 knockdown in PC-3M cells. Vertical axis = rfu±sem. Statistical significance was determined using one-way ANOVA; pairwise comparisons were made using Tukey HSD multiplex comparison test and adjusted p-values were reported. (i) a siCtrl (ii) a mimetic (iii) siCAV-1 (iv) siCAV-2.
FIG. 9 shows representative images of (i) lysosomes (Celllight lysosome-GFP (lysosomal associated membrane protein 1)) and (ii) mitochondria (Celllight mitochondrial-RFP (E1. Alpha. Pyruvate dehydrogenase) leader sequences, and (iii) pooled images after CAV1 knockout in PC-3M cells.
FIG. 10 shows representative images of staining of (a) mitochondrial mass (MitoTracker Green) after knockdown of CAV1 in PC-3M cells. The scale bar indicates 20 μm. An intensity scale is provided alongside each graphic. Violin plots are also shown, which show the intensity of MitoTracker Green (b) and MitoTracker CMXRos (c) after CAV1 knockout in PC-3M cells. Vertical axis = rfu±sem. Statistical significance was determined using one-way ANOVA; pairwise comparisons were made using Tukey HSD multiplex comparison test and adjusted p-values were reported.
FIG. 11 shows representative images from (a) co-staining of (ii) CAV1 (FITC) and (iii) mitochondrial potential/reactive oxygen species (MitoTracker Red CMXRos) after knocking out CAV1 in PC-3M cells, and (i) pooling images. (b) Intracellular levels of reactive oxygen species assessed by CellROX Deep red after CAV1 knockdown in PC-3M cells. (i) SiCtrl (ii) ciCAV1-1.
FIG. 12 shows secretion of extracellular vesicles (rich in sphingomyelin and lactosylceramide) containing CAV-1 at elevated expression of CAV 1. Schematic of the multiple classification method (a). (b) Cav-1 levels (ng/mL) in extracellular vesicles derived from conditioned medium of LNCaP and PC-3M, respectively, after overexpression of Cav-1 or transient knockout of CAV1, in the presence or absence of BSA or human lipoproteins. (i) Medium+serum lipoprotein+LDL (ii) Medium+serum lipoprotein+BSA (iii) Medium+serum lipoprotein. Vertical axis = ng CAV1/mL. (c) Particle counts per milliliter (vertical axis) of conditioned medium from (i) LNCaP and (ii) PC-3M, respectively, after overexpression of Cav-1 or knockdown of CAV 1. Horizontal axis = size/nm. Statistical significance was determined by a two-sided student T-test comparing the area under the curve after overexpression or knockout of Cav-1 relative to the corresponding disorder control.
FIG. 13 shows the levels of (a) sphingomyelin and (b) lactosylceramide in conditioned medium of LNCaP and PC-3M, respectively, after overexpression of Cav-1 or transient knockout of CAV-1, in the presence or absence of BSA or human lipoproteins. (i) basal medium (ii) CAV (NC 1) (iii) CAV (si 8) (iv) CAV- (v) CAV+ (vi) basal medium+BSA (vii) CAV (NC 1)/BSA (viii) CAV (si 8)/BSA (ix) CAV-/BSA (x) CAV+/BSA (xi) basal medium+LDL (xii) CAV (NC 1)/LDL (xiii) CAV (si 8)/LDL (xiv) CAV-/LDL (xv) CAV+/LDL. (c) Lipid composition of Ev isolated from conditioned medium of LNCaP (left) and PC-3M (right) prostate cancer cells. (i) acyl carnitine (ii) oxyresinol (iii) lysophospholipid (iv) phospholipid (v) sphingomyelin (vi) ceramide (vii) glycosphingolipid (viii) cardiolipin (ix) monoacylglycerol (x) diacylglycerol (xi) triacylglycerol (xii) cholesterol ester. (d) The evidence database score was annotated as localized to proteins in the mitochondrial-localized PC-3M-derived EV based on partition localization (COMPARTMENTS localization). (i) peroxisomes (ii) golgi (iii) endosomes (iv) lysosomes (v) endoplasmic reticulum (vi) mitochondria (vii) cytoskeleton (viii) extracellular region (ix) plasma membrane (x) nuclear (xi) cytosol.
FIG. 14 shows a heat map showing subcellular localization of protein features identified in EVs isolated from (a) PC-3M or (b) conditioned medium of LNCaP prostate cancer cells. Subcellular localization was based on a partitioned localization evidence database score. (i) peroxisomes (ii) golgi (iii) endosomes (iv) lysosomes (v) endoplasmic reticulum (vi) mitochondria (vii) cytoskeleton (viii) extracellular region (ix) plasma membrane (x) nuclear (xi) cytosol.
FIG. 15 shows viability curves of RM-9 and PC-3M cells (left) after 48 hours of treatment with (a) control, (i) PPMP, (ii) PDMP, or (iii) irinotecan (Eliglustat). Horizontal axis = log (μΜ); vertical axis =% viability relative to control. Also shown are the relative abundance of (b) ceramide and (c) glycosphingolipids after 6 hours of treatment of (left) RM-9 and (right) PC-3M with vehicle (ethanol) or inhibitor. (i) carrier (ii) 128 μΜ irinotecan (iii) 64 μΜ PDMP (iv) 64 μΜ PPMP. Statistical significance was determined by a two-sided student t-test comparing the aggregation intensity of individual lipid species corresponding to the respective lipid domains.
FIG. 16 shows (a) induction of autophagy/mitochondrial autophagy by exposing PC-3M prostate cancer cells to irinotecan. (i) cytotoxicity (ii) 4-hour apoptosis (iii) 24-hour apoptosis. N=3 biologically independent replicates for each experimental condition. Values represent log (relative fluorescence units) ±stdev. Volcanic plots showing differences in annotated lipid species stratified by lipid domain in (b) PC-3M and (c) RM-9 prostate cancer cells after 6 hours of challenge with 128 μM of irinotecan are also shown. (i) acyl carnitine (ii) cardiolipin (iii) diacylglycerol (iv) ether lysophospholipid (v) ether phospholipid (vi) lysophospholipid (vii) phospholipid (viii) cholesterol ester (ix) triacylglycerol (x) sphingomyelin. N=3 biologically independent replicates for each experimental condition. Statistical significance was determined by a two-sided student t test.
FIG. 17 shows representative confocal microscopy images of PC-3M cells after pre-transfection with (i) Celllight mitochondrial-RFP (E1. Alpha. Pyruvate dehydrogenase) or (ii) Celllight lysosomal-GFP (lysosomal associated 1052 membrane protein 1) for 24 hours, followed by acute (6 hours) treatment with (a) vehicle or (c) irinotecan (128. Mu.M). (b) And (d) corresponds to the amplification of features from (a) and (c), respectively. (iii) merging the images.
FIG. 18 shows (a) the viability of PC-3M cells treated with 128. Mu.M irinotecan after knockdown of CAV1 (left) or after pretreatment with Cav-1 monoclonal blocking antibody (right) (MTS assay): (i) siCtrl (ii) sicarl 1-1 (iii) sicarl 1-2 (iv) igg=carrier (v) igg+irinotecan (vi) abcarv1+carrier (vii) abcarv1+irinotecan. (b) Viability of LNCaP cells treated with 64. Mu.M irinotecan after overexpression of Cav-1 (MTS assay).
Figure 19 shows the efficacy of irinotecan in an in vivo mouse model. (a) Relative fluorescence units ± SEM of RM-9 tumors after daily intraperitoneal injections of (i) normal saline (n=23) or (ii) irinotecan (60 mg/kg) (n=9). (b) Tumor volume ± SEM after treatment with physiological saline (n=15) or irinotecan (60 mg/kg) (n=8). Statistical significance was determined by a two-sided Wilcoxon rank sum test. (c) representative IVIS images after treatment. (d) Relative abundance of glycosphingolipids (area units.+ -. StDev) in RM-9 tumors after treatment. Statistical significance was determined by a two-sided Wilcoxon rank sum test, comparing the aggregation intensity of individual lipid species corresponding to the respective lipid domains.
Figure 20 shows quantitative analysis of immunohistochemical staining of (a) Cav-1, (B) BrdU-TUNEL, (c) PCNA, (d) HMGB1 and (e) LC3B in RM-9 tumors after treatment with normal saline (n=6-8 mice) or irinotecan (n=7 mice). The vertical axis is (a) Cav-1 staining score, (B) apoptotic body/fd, (c) percent PCNA labeling, (d) percent cytoplasmic HMGB1, and (e) LC-3B positive cells/fd. Statistical significance was determined by a two-sided Wilcoxon rank sum test. Also shown is a volcanic plot of (f) showing fold-changes in individual annotated lipid species stratified by lipid domain in plasma of RM-9 bearing C57BL/6N mice or control mice. (i) acyl carnitine (ii) ceramide (iii) cholesterol ester (iv) diacylglycerol (v) free fatty acid (vi) glycosphingolipids (vii) lysophospholipids (viii) oxylipids (ix) phospholipid (x) sphingomyelin (x) triacylglycerol.
Figure 21 depicts the per unit increased odds ratio (95% ci) of trihexosylceramide (34:1), lactosylceramide (36:0), lactosylceramide (32:0), SM (44:2), SM (40:2), plasma sphingolipid signature (SphingoSignature) and simplified sphingolipid signature (simplified signature) for assessing risk of disease progression in men actively monitoring prostate cancer in independent validation cohorts consisting of 248 participants (35 progressors, 213 non-progressors). * Statistical significance was indicated, single sided p <0.05.
Detailed Description
In one aspect, the present disclosure provides a method of determining the risk of prostate cancer progression in a subject, the method comprising performing the following steps on a biological sample obtained from the subject: measuring the level of CAV-1 in the biological sample, measuring the level of SM (40:2) in the biological sample, measuring the level of SM (44:2) in the biological sample, measuring the level of LacCer 32:0 in the biological sample, measuring the level of LacCer 36:0 in the biological sample, measuring the level of TriHexCer 34:1 in the biological sample, and measuring the level of HexCer 40:0 in the biological sample; wherein the amounts of CAV-1, SM (40:2), SM (44:2), lacCer 32:0, lacCer 36:0, triHexCer 34:1 and HexCer 40:0 determine the risk of prostate cancer progression in the subject.
In another aspect, the present disclosure provides a method of determining the risk of prostate cancer progression in a subject, the method comprising performing the following steps on a biological sample obtained from the subject: contacting the sample with a first reporter that binds CAV-1, a second reporter that binds SM (40:2), a third reporter that binds SM (44:2), a fourth reporter that binds LacCer 32:0, a fifth reporter that binds LacCer 36:0, a sixth reporter that binds TriHexCer 34:1, and a seventh reporter that binds HexCer 40:0; wherein the amounts of the first reporter, the second reporter, the third reporter, the fourth reporter, the fifth reporter, the sixth reporter and the seventh reporter determine the risk of prostate cancer progression in the subject.
In another aspect, the present disclosure provides a method of determining the risk of prostate cancer progression in a subject, the method comprising performing the following steps on a biological sample obtained from the subject: CAV-1, SM (40:2), SM (44:2), lacCer 32:0, lacCer 36:0, triHexCer 34:1, and HexCer 40:0, wherein these spectral analyses determine the risk of prostate cancer progression in the subject. In some aspects, the spectroscopic analysis is quantitative analysis. In some aspects, the spectroscopic analysis is mass spectrometry. In some aspects, the spectroscopic analysis is performed in parallel. In some aspects, the spectroscopic analysis is performed sequentially. In some aspects, the method further comprises a chromatography step. In some aspects, the method further comprises a liquid chromatography step. In some aspects, the method further comprises a high performance liquid chromatography ("HPLC") step. In some aspects, the method further comprises a gas chromatography ("GC") step. In some aspects, the chromatographic step is directly coupled with the spectroscopic step. In some aspects, the chromatographic step separates at least one analyte from at least one other analyte.
In another aspect, the present disclosure provides a method of determining the risk of prostate cancer progression in a subject, the method comprising performing the following steps on a biological sample obtained from the subject: providing a surface that binds CAV-1, SM (40:2), SM (44:2), lacCer 32:0, lacCer 36:0, triHexCer 34:1, and HexCer 40:0; incubating the surface with the biological sample; contacting the surface with a first reporter that binds CAV-1, contacting the surface with a second reporter that binds SM (40:2), contacting the surface with a third reporter that binds SM (44:2), contacting the surface with a fourth reporter that binds LacCer 32:0, contacting the surface with a fifth reporter that binds LacCer 36:0, contacting the surface with a sixth reporter that binds TriHexCer 34:1, and contacting the surface with a seventh reporter that binds HexCer 40:0; measuring the amount of a first reporter associated with the surface; measuring the amount of a second reporter associated with the surface; measuring the amount of a third reporter associated with the surface; measuring the amount of a fourth reporter associated with the surface; measuring the amount of a fifth reporter associated with the surface; measuring the amount of a sixth reporter associated with the surface; measuring the amount of a seventh reporter associated with the surface; wherein the amounts of the first reporter, the second reporter, the third reporter, the fourth reporter, the fifth reporter, the sixth reporter and the seventh reporter determine the risk of prostate cancer progression in the subject.
In another aspect, the present disclosure provides a method of determining the risk of prostate cancer progression in a subject, the method comprising performing the following steps on a biological sample obtained from the subject: providing a first surface having means for binding CAV-1, providing a second surface having means for binding SM (40:2), providing a third surface having means for binding SM (44:2), providing a fourth surface having means for binding LacCer 32:0, providing a fifth surface having means for binding LacCer 36:0, providing a sixth surface having means for binding TriHexCer 34:1, and providing a seventh surface having means for binding HexCer 40:0; incubating the first surface with the biological sample; incubating the second surface with the biological sample; incubating the third surface with the biological sample; incubating the fourth surface with the biological sample; incubating the fifth surface with the biological sample; incubating the sixth surface with the biological sample; incubating the seventh surface with the biological sample; contacting the first surface with a first reporter that binds CAV-1, contacting the second surface with a first reporter that binds SM (40:2), contacting the third surface with a first reporter that binds SM (44:2), contacting the fourth surface with a first reporter that binds LacCer 32:0, contacting the fifth surface with a first reporter that binds LacCer 36:0, contacting the sixth surface with a first reporter that binds TriHexCer 34:1, and contacting the seventh surface with a first reporter that binds HexCer 40:0; measuring the amount of a first reporter associated with the first surface; measuring the amount of a second reporter associated with the second surface; measuring the amount of a third reporter associated with the third surface; measuring the amount of a fourth reporter associated with the fourth surface; measuring the amount of a fifth reporter associated with the fifth surface; measuring the amount of a sixth reporter associated with the sixth surface; measuring the amount of a seventh reporter associated with the seventh surface; wherein the amounts of the first reporter, the second reporter, the third reporter, the fourth reporter, the fifth reporter, the sixth reporter and the seventh reporter determine the risk of prostate cancer progression in the subject.
In another aspect, the present disclosure provides a method of determining the risk of prostate cancer progression in a subject, the method comprising performing the following steps on a biological sample obtained from the subject: providing a surface having means for binding CAV-1, SM (40:2), SM (44:2), lacCer 32:0, lacCer 36:0, triHexCer 34:1 and HexCer 40:0; incubating the surface with the biological sample; contacting the surface with a first relay molecule that binds CAV-1, contacting the surface with a second relay molecule that binds SM (40:2), and contacting the surface with a third relay molecule that binds SM (44:2); contacting the surface with a fourth relay molecule that binds LacCer 32:0; contacting the surface with a fifth relay molecule that binds LacCer 36:0; contacting the surface with a sixth relay molecule that binds TriHexCer 34:1; contacting the surface with a seventh relay molecule that binds to HexCer 40:0; contacting the surface with a first reporter molecule that binds to the first relay molecule; contacting the surface with a second reporter that binds to the second relay molecule; contacting the surface with a third reporter that binds to the third relay molecule; contacting the surface with a fourth reporter that binds to the fourth relay molecule; contacting the surface with a fifth reporter that binds to the fifth relay molecule; contacting the surface with a sixth reporter that binds to the sixth relay molecule; contacting the surface with a seventh reporter that binds to the seventh relay molecule; measuring the amount of a first reporter associated with the first relay molecule and CAV-1; measuring the amount of a second reporter associated with the second relay molecule and SM (40:2); measuring the amount of a third reporter associated with the third relay molecule and SM (44:2); measuring the amount of a fourth reporter associated with the fourth relay molecule and LacCer 32:0; measuring the amount of a fifth reporter associated with the fifth relay molecule and LacCer 36:0; measuring the amount of a sixth reporter associated with the sixth relay molecule and TriHexCer 34:1; and measuring the amount of a seventh reporter associated with the seventh relay molecule and HexCer 40:0; wherein the amounts of the first reporter, the second reporter, the third reporter, the fourth reporter, the fifth reporter, the sixth reporter and the seventh reporter determine the risk of prostate cancer progression in the subject.
In one embodiment, the amount of CAV-1, SM (40:2), SM (44:2), lacCer 32:0, lacCer 36:0, triHexCer 34:1, and HexCer 40:0, or a reporter bound thereto, is increased in the subject relative to a healthy subject. In one embodiment, the amount of CAV-1, SM (40:2), SM (44:2), lacCer 32:0, lacCer 36:0, triHexCer 34:1, and HexCer 40:0, or a reporter bound thereto, is increased in the subject relative to a subject not suffering from prostate cancer. In one embodiment, the amount of CAV-1, SM (40:2), SM (44:2), lacCer 32:0, lacCer 36:0, triHexCer 34:1, and HexCer 40:0, or a reporter bound thereto, is increased in the subject relative to the subject with indolent prostate cancer.
In another embodiment, at least one of the reporter molecules provides a detectable signal. In another embodiment, the detectable signal may be detected by a method selected from the group consisting of UV-visible spectrum, mass spectrum, nuclear Magnetic Resonance (NMR) spectrum, proton NMR spectrum, nuclear Magnetic Resonance (NMR) spectrum, gas chromatography-mass spectrum (GC-MS), liquid chromatography-mass spectrum (LC-MS), correlation spectrum (COSY), nuclear European Hawthorn effect spectrum (NOESY), nuclear European Hawthorn effect spectrum (ROESY) in a rotating coordinate system, LC-TOF-MS, LC-MS/MS, and capillary electrophoresis-mass spectrum. In another embodiment, the spectrometry is mass spectrometry. In another embodiment, the kit comprises a biomarker that has been identified by a method selected from the group consisting of: UV-visible spectrum, mass spectrum, nuclear Magnetic Resonance (NMR) spectrum, proton NMR spectrum, nuclear Magnetic Resonance (NMR) spectrum, gas chromatography-mass spectrum (GC-MS), liquid chromatography-mass spectrum (LC-MS), correlation spectrum (COSy), nuclear Ohexaus Effect Spectrum (NOESY), rotating coordinate system nuclear ohexaus effect spectrum (ROESY), LC-TOF-MS, LC-MS/MS, and capillary electrophoresis-mass spectrum. In another embodiment, the set includes biomarkers that have been identified by UV-visible spectrum or proton NMR spectrum.
In another embodiment, the first reporter molecule selectively binds to CAV-1. In another embodiment, the second reporter selectively binds to SM (40:2). In another embodiment, the third reporter selectively binds to SM (44:2). In another embodiment, the fourth reporter selectively binds LacCer 32:0. In another embodiment, the fifth reporter selectively binds to LacCer 36:0. In another embodiment, the sixth reporter selectively binds to TriHexCer 34:1. In another embodiment, the seventh reporter selectively binds to HexCer 40:0.
In another embodiment, the determination of CAV-1, SM (40:2), SM (44:2), lacCer 32:0, lacCer 36:0, triHexCer 34:1, and HexCer 40:0 levels is performed substantially simultaneously. In another embodiment, the determination of CAV-1, SM (40:2), SM (44:2), lacCer 32:0, lacCer 36:0, triHexCer 34:1, and HexCer 40:0 levels is performed in a stepwise manner. In another embodiment, the method includes incorporating subject history information into the determination of the risk of prostate cancer progression. In another embodiment, such a method comprises administering at least one surrogate diagnostic test to a subject assigned to be at risk of prostate cancer progression.
In another aspect, the present disclosure provides a method of treating a subject suspected of being at risk of prostate cancer progression, the method comprising analyzing the risk of prostate cancer progression in the subject with the methods disclosed herein, and administering a therapeutically effective amount of a cancer treatment. In one embodiment, the treatment is surgery, chemotherapy, immunotherapy, radiation therapy, targeted therapy, or a combination thereof.
In another aspect, the present disclosure provides a method of determining the risk of prostate cancer progression in a subject, the method comprising performing the following steps on a biological sample obtained from the subject:
measuring the level of CAV-1 in the biological sample; measuring the level of SM (40:2) in the biological sample; measuring the level of SM (44:2) in the biological sample; determining the level of LacCer 32:0 in the biological sample; determining the level of LacCer 36:0 in the biological sample; measuring the level of TriHexCer 34:1 in the biological sample; determining the level of pro-SFTPB in the biological sample; determining a CAV-1 level relative to a first standard value, wherein the ratio predicts a risk of prostate cancer progression; determining a SM (40:2) level relative to a second standard value, wherein the ratio predicts a risk of prostate cancer progression; determining a SM (44:2) level relative to a third standard value, wherein the ratio predicts risk of prostate cancer progression; determining a LacCer 32:0 level relative to a fourth standard value, wherein the ratio predicts risk of prostate cancer progression; determining a level of LacCer 36:0 relative to a fifth standard value, wherein the ratio predicts risk of prostate cancer progression; determining a TriHexCer 34:1 level relative to a sixth standard value, wherein the ratio predicts risk of prostate cancer progression; determining a HexCer 40:0 level relative to a seventh standard value, wherein the ratio predicts risk of prostate cancer progression; and assigning as or not at risk of prostate cancer progression by statistical analysis of ratios of CAV-1, SM (40:2), SM (44:2), lacCer 32:0, lacCer 36:0, triHexCer 34:1, and HexCer 40:0 levels.
In another aspect, the present disclosure provides a method of predicting the risk of prostate cancer progression in a subject, the method comprising performing the following steps on a biological sample obtained from the subject: measuring the level of CAV-1, SM (40:2), SM (44:2), lacCer 32:0, lacCer 36:0, triHexCer 34:1 and HexCer 40:0 biomarkers in the biological sample; and calculating the predictors as determined by statistical analysis of CAV-1, SM (40:2), SM (44:2), lacCer 32:0, lacCer 36:0, triHexCer 34:1, and HexCer 40:0 levels.
In another aspect, the present disclosure provides a method of determining the risk of prostate cancer progression in a subject, the method comprising performing the following steps on a biological sample obtained from the subject: measuring the level of CAV-1, SM (40:2), SM (44:2), lacCer 32:0, lacCer 36:0, triHexCer 34:1 and HexCer 40:0 biomarkers in the biological sample; the subject's condition is assigned as being at risk of, or not being at risk of, prostate cancer progression, as determined by statistical analysis of the levels of CAV-1, SM (40:2), SM (44:2), lacCer 32:0, lacCer 36:0, triHexCer 34:1, and HexCer 40:0 in the biological sample, and the risk of prostate cancer progression is determined by analysis of the levels of CAV-1, SM (40:2), SM (44:2), lacCer 32:0, lacCer 36:0, triHexCer 34:1, and HexCer 40:0.
In another embodiment, the first reporter molecule selectively binds to CAV-1. In another embodiment, the second reporter selectively binds to SM (40:2). In another embodiment, the third reporter selectively binds to SM (44:2). In another embodiment, the fourth reporter selectively binds LacCer 32:0. In another embodiment, the fifth reporter selectively binds to LacCer 36:0. In another embodiment, the sixth reporter selectively binds to TriHexCer 34:1. In another embodiment, the seventh reporter selectively binds to HexCer 40:0. In another embodiment, the determination of CAV-1, SM (40:2), SM (44:2), lacCer 32:0, lacCer 36:0, triHexCer 34:1, and HexCer 40:0 levels is performed substantially simultaneously. In another embodiment, the determination of CAV-1, SM (40:2), SM (44:2), lacCer 32:0, lacCer 36:0, triHexCer 34:1, and HexCer 40:0 levels is performed in a stepwise manner. In another embodiment, the method further comprises incorporating subject history information into the allocation that is at risk of, or is not at risk of, prostate cancer progression. In another embodiment, such a method comprises administering at least one surrogate diagnostic test to a subject assigned to be at risk of prostate cancer progression.
In another aspect, the present disclosure provides a method of treating a subject suspected of being at risk of prostate cancer progression, the method comprising analyzing the risk of prostate cancer progression in the subject with the method described herein; and administering a therapeutically effective amount of a cancer treatment. In another embodiment, the treatment is surgery, chemotherapy, immunotherapy, radiation therapy, targeted therapy, or a combination thereof. In another embodiment, the classification of subjects at risk of prostate cancer progression has a sensitivity of 0.76 and 0.42 at a specificity of 78% and 94%, respectively.
In another embodiment, the level of CAV-1, SM (40:2), SM (44:2), lacCer 32:0, lacCer 36:0, triHexCer 34:1, and HexCer 40:0 is elevated compared to the level of CAV-1, SM (40:2), SM (44:2), lacCer 32:0, lacCer 36:0, triHexCer 34:1, and HexCer 40:0 in a reference subject or group having adenocarcinoma.
In another embodiment, the level of CAV-1, SM (40:2), SM (44:2), lacCer 32:0, lacCer 36:0, triHexCer 34:1, and HexCer 40:0 is elevated compared to the level of CAV-1, SM (40:2), SM (44:2), lacCer 32:0, lacCer 36:0, triHexCer 34:1, and HexCer 40:0 in a reference subject or group having squamous cell carcinoma.
In another aspect, the present disclosure provides a kit for use in the method, the kit comprising a reagent solution comprising: a first solute for detecting CAV-1; a second solute for detecting SM (40:2); a third solute for detecting SM (44:2); a fourth solute for detecting LacCer 32:0; a fifth solute for detecting LacCer 36:0; a sixth solute for detecting TriHexCer 34:1; and a seventh solute for detecting HexCer 40:0.
In another embodiment, the method further comprises a device for contacting the reagent solution with the biological sample. In another embodiment, the method comprises having at least one surface with a device for binding at least one biomarker. In another embodiment, the at least one biomarker is selected from the group consisting of CAV-1, SM (40:2), SM (44:2), lacCer 32:0, lacCer 36:0, triHexCer 34:1, and HexCer 40:0.
In another aspect, the present disclosure provides a method of determining the risk of prostate cancer progression in a subject, the method comprising a biomarker stack and a protein marker stack: wherein the biomarker stack comprises CAV-1, SM (40:2), SM (44:2), lacCer 32:0, lacCer 36:0, triHexCer 34:1, and HexCer 40:0; wherein the method comprises the following steps: performing the following steps when obtaining a biological sample from the subject; measuring the levels of the biomarkers and the protein biomarkers in the biological sample; wherein the amounts of the biomarkers and the protein biomarkers determine the risk of prostate cancer progression in the subject.
In another aspect, the present disclosure provides a method of determining the risk of prostate cancer progression in a subject, the method comprising performing the following steps when a biological sample is obtained from the subject; measuring the levels of CAV-1, SM (40:2), SM (44:2), lacCer 32:0, lacCer 36:0, triHexCer 34:1 and HexCer 40:0 in the biological sample; and determining the risk of prostate cancer progression in the subject by statistical analysis of the levels of CAV-1, SM (40:2), SM (44:2), lacCer 32:0, lacCer 36:0, triHexCer 34:1, and HexCer 40:0 in the biological sample. In one embodiment, the level of CAV-1, SM (40:2), SM (44:2), lacCer 32:0, lacCer 36:0, triHexCer 34:1, and HexCer 40:0, or a reporter bound thereto, is increased in the subject relative to a healthy subject. In another embodiment, the level of CAV-1, SM (40:2), SM (44:2), lacCer 32:0, lacCer 36:0, triHexCer 34:1, and HexCer 40:0 is elevated compared to the level of CAV-1, SM (40:2), SM (44:2), lacCer 32:0, lacCer 36:0, triHexCer 34:1, and HexCer 40:0 in a reference subject or group not suffering from prostate cancer. In another embodiment, the reference subject or group is healthy. In another embodiment, the method comprises at least one receptor molecule that selectively binds to a biomarker selected from the group consisting of CAV-1, SM (40:2), SM (44:2), lacCer 32:0, lacCer 36:0, triHexCer 34:1, and HexCer 40:0. In another embodiment, the sample comprises a biological sample selected from the group consisting of blood, plasma, and serum. In another embodiment, the biological sample is serum. In another embodiment, the amounts of CAV-1, SM (40:2), SM (44:2), lacCer 32:0, lacCer 36:0, triHexCer 34:1, and HexCer 40:0 are quantified. In another embodiment, detecting the amount of CAV-1, SM (40:2), SM (44:2), lacCer 32:0, lacCer 36:0, triHexCer 34:1, and HexCer 40:0 includes using solid particles. In another embodiment, the solid particles are beads. In another embodiment, at least one reporter is linked to the enzyme. In another embodiment, at least one of the reporter molecules provides a detectable signal. In another embodiment, the detectable signal may be detected by a method selected from the group consisting of UV-visible spectrum, mass spectrum, nuclear Magnetic Resonance (NMR) spectrum, proton NMR spectrum, nuclear Magnetic Resonance (NMR) spectrum, gas chromatography-mass spectrum (GC-MS), liquid chromatography-mass spectrum (LC-MS), correlation spectrum (COSY), nuclear European Hawthorn effect spectrum (NOESY), nuclear European Hawthorn effect spectrum (ROESY) in a rotating coordinate system, LC-TOF-MS, LC-MS/MS, and capillary electrophoresis-mass spectrum. In another embodiment, the concentrations of CAV-1, SM (40:2), SM (44:2), lacCer 32:0, lacCer 36:0, triHexCer 34:1, and HexCer 40:0 are measured. In another embodiment, the subject is determined to be at risk of prostate cancer progression based on the measured concentration of the biomarker. In another embodiment, these measured concentrations are used to calculate biomarker scores based on sensitivity and specificity values at a given cutoff value. In another embodiment, the method further comprises the steps of: the measured concentration of each biomarker in the biological sample is compared to the predictions of the statistical model. In another embodiment, the set of sets is selected from the group consisting of: a. a stack consisting of CAV-1, SM (40:2), SM (44:2), lacCer 32:0, lacCer 36:0, triHexCer 34:1 and HexCer 40:0; or b.a stack consisting of CAV-1, SM (40:2), SM (44:2), lacCer 32:0, lacCer 36:0, triHexCer 34:1 and HexCer 40:0. In another embodiment, the kit comprises a biomarker that has been identified by a method selected from the group consisting of: UV-visible spectrum, mass spectrum, nuclear Magnetic Resonance (NMR) spectrum, proton NMR spectrum, nuclear Magnetic Resonance (NMR) spectrum, gas chromatography-mass spectrum (GC-MS), liquid chromatography-mass spectrum (LC-MS), correlation spectrum (COSy), nuclear Ohexaus Effect Spectrum (NOESY), rotating coordinate system nuclear ohexaus effect spectrum (ROESY), LC-TOF-MS, LC-MS/MS, and capillary electrophoresis-mass spectrum. In another embodiment, the set includes biomarkers that have been identified by UV-visible spectrum or proton NMR spectrum.
In another embodiment, the first reporter molecule selectively binds to CAV-1. In another embodiment, the second reporter selectively binds to SM (40:2). In another embodiment, the third reporter selectively binds to SM (44:2). In another embodiment, the fourth reporter selectively binds LacCer 32:0. In another embodiment, the fifth reporter selectively binds to LacCer 36:0. In another embodiment, the sixth reporter selectively binds to TriHexCer 34:1. In another embodiment, the seventh reporter selectively binds to HexCer 40:0.
In another embodiment, the determination of CAV-1, SM (40:2), SM (44:2), lacCer 32:0, lacCer 36:0, triHexCer 34:1, and HexCer 40:0 levels is performed substantially simultaneously. In another embodiment, the determination of CAV-1, SM (40:2), SM (44:2), lacCer 32:0, lacCer 36:0, triHexCer 34:1, and HexCer 40:0 levels is performed in a stepwise manner. In another embodiment, the method further comprises incorporating subject history information into the allocation that is at risk of, or is not at risk of, prostate cancer progression. In another embodiment, such a method comprises administering at least one surrogate diagnostic test to a subject assigned to be at risk of prostate cancer progression.
In another embodiment, the present disclosure provides a kit for use in a method as described herein, the kit comprising: a reagent solution comprising: a first solute for detecting CAV-1; a second solute for detecting SM (40:2); a third solute for detecting SM (44:2); a fourth solute for detecting LacCer 32:0; a fifth solute for detecting LacCer 36:0; a sixth solute for detecting TriHexCer 34:1; seventh solute for detecting HexCer 40:0
In another aspect, the present disclosure provides a kit for use in a method as described herein, the kit comprising a first reagent solution comprising a first solute for detecting CAV-1, a second reagent solution comprising a second solute for detecting SM (40:2), a third reagent solution comprising a third solute for detecting SM (44:2), a fourth reagent solution comprising a fourth solute for detecting LacCer 32:0, a fifth reagent solution comprising a fifth solute for detecting LacCer 36:0, a sixth reagent solution comprising a sixth solute for detecting TriHexCer 34:1, and a seventh reagent solution comprising a seventh solute for detecting HexCer 40:0.
In another embodiment, such a kit further comprises: a reagent solution comprising: a first solute for detecting CAV-1; a second solute for detecting SM (40:2); a third solute for detecting SM (44:2); a fourth solute for detecting LacCer 32:0; a fifth solute for detecting LacCer 36:0; a sixth solute for detecting TriHexCer 34:1; and a seventh solute for detecting HexCer 40:0.
In another aspect, the disclosure provides a method of treating or preventing prostate cancer progression in a subject, wherein the level of CAV-1, SM (40:2), SM (44:2), lacCer 32:0, lacCer36:0, triHexCer 34:1, and HexCer 40:0 classifies the subject as having or at risk of prostate cancer progression, the method comprising one or more of: administering a chemotherapeutic drug to a subject having prostate cancer; administering therapeutic radiation to the subject having prostate cancer; and surgery to partially or completely surgically resect cancerous tissue in the subject having prostate cancer.
In another aspect, the disclosure provides a method of treating or preventing prostate cancer progression in a subject, wherein the level of CAV-1, SM (40:2), SM (44:2), lacCer 32:0, lacCer36:0, triHexCer 34:1, and HexCer 40:0 classifies the subject as having or at risk of prostate cancer progression, the method comprising one or more of: administering a chemotherapeutic drug to a subject having prostate cancer; administering therapeutic radiation to the subject having prostate cancer; and surgery to partially or completely surgically resect cancerous tissue in the subject having prostate cancer.
In another aspect, the present disclosure provides a method for treating prostate cancer in a subject, the method comprising: detecting CAV-1, SM (40:2), SM (44:2), lacCer 32:0, lacCer 36:0, triHexCer 34:1 and HexCer 40:0 in a biological sample obtained from a subject; quantifying the amount of CAV-1, SM (40:2), SM (44:2), lacCer 32:0, lacCer 36:0, triHexCer 34:1 and HexCer 40:0 in the collected sample; determining a risk score from the amounts of CAV-1, SM (40:2), SM (44:2), lacCer 32:0, lacCer 36:0, triHexCer 34:1 and HexCer 40:0; comparing the risk score to a cutoff value to determine whether the person is at risk of prostate cancer progression; wherein if the levels are above the cutoff value, the human is at risk of prostate cancer progression and prostate cancer treatment is administered to the human at risk of prostate cancer progression.
In another aspect, the present disclosure provides a method of determining the risk of prostate cancer progression in a subject, the method comprising: measuring the concentration of CAV-1, SM (40:2), SM (44:2), lacCer 32:0, lacCer 36:0, triHexCer 34:1 and HexCer 40:0 in a biological sample from a subject in need of analysis; and comparing the concentration of the biomarker in the sample of the subject in need of diagnosis to the concentration in a normal or non-diseased subject, wherein the subject in need of diagnosis is diagnosed with prostate cancer.
In another aspect, the present disclosure provides a method of determining evidence of prostate cancer progression risk in a biological sample, the method comprising measuring the concentration of a biomarker panel comprising CAV-1, SM (40:2), SM (44:2), lacCer 32:0, lacCer 36:0, triHexCer 34:1, and HexCer 40:0 in the biological sample, and determining a risk score from the amounts of CAV-1, SM (40:2), SM (44:2), lacCer 32:0, lacCer 36:0, triHexCer 34:1, and HexCer 40:0. In another embodiment, the level of CAV-1, SM (40:2), SM (44:2), lacCer 32:0, lacCer 36:0, triHexCer 34:1, and HexCer 40:0, or a reporter bound thereto, is increased in the subject relative to a healthy subject. In another embodiment, the level of CAV-1, SM (40:2), SM (44:2), lacCer 32:0, lacCer 36:0, triHexCer 34:1, and HexCer 40:0 is elevated compared to the level of CAV-1, SM (40:2), SM (44:2), lacCer 32:0, lacCer 36:0, triHexCer 34:1, and HexCer 40:0 in a reference subject or group not suffering from prostate cancer. In another embodiment, the level of CAV-1, SM (40:2), SM (44:2), lacCer 32:0, lacCer 36:0, triHexCer 34:1, and HexCer 40:0 is elevated compared to the level of CAV-1, SM (40:2), SM (44:2), lacCer 32:0, lacCer 36:0, triHexCer 34:1, and HexCer 40:0 in a reference subject or group having painless prostate cancer. In another embodiment, the reference subject or group is healthy. In another embodiment, the at least one surface further comprises at least one receptor molecule that selectively binds to a biomarker selected from CAV-1, SM (40:2), SM (44:2), lacCer 32:0, lacCer 36:0, triHexCer 34:1, and HexCer 40:0. In another embodiment, at least one surface is a surface of a solid particle. In another embodiment, the solid particles comprise beads. In another embodiment, the method comprises: measuring the level of the biomarker in the biological sample; wherein the amount of these biomarkers classifies the patient as being at risk of prostate cancer progression or not. In another embodiment, the sample comprises a biological sample selected from the group consisting of blood, plasma, and serum. In another embodiment, the biological sample is serum. In another embodiment, the amounts of CAV-1, SM (40:2), SM (44:2), lacCer 32:0, lacCer 36:0, triHexCer 34:1, and HexCer 40:0 are quantified. In another embodiment, detecting the amount of CAV-1, SM (40:2), SM (44:2), lacCer 32:0, lacCer 36:0, triHexCer 34:1, and HexCer 40:0 includes using solid particles. In another embodiment, the solid particles are beads. In another embodiment, at least one reporter is linked to the enzyme. In another embodiment, at least one of the reporter molecules provides a detectable signal. In another embodiment, the detectable signal may be detected by a method selected from the group consisting of UV-visible spectrum, mass spectrum, nuclear Magnetic Resonance (NMR) spectrum, proton NMR spectrum, nuclear Magnetic Resonance (NMR) spectrum, gas chromatography-mass spectrum (GC-MS), liquid chromatography-mass spectrum (LC-MS), correlation spectrum (COSY), nuclear European Hawthorn effect spectrum (NOESY), nuclear European Hawthorn effect spectrum (ROESY) in a rotating coordinate system, LC-TOF-MS, LC-MS/MS, and capillary electrophoresis-mass spectrum. In another embodiment, the concentrations of CAV-1, SM (40:2), SM (44:2), lacCer 32:0, lacCer 36:0, triHexCer 34:1, and HexCer 40:0 are measured. In another embodiment, the subject is determined to be at risk of prostate cancer progression based on the measured concentration of the biomarker. In another embodiment, these measured concentrations are used to calculate biomarker scores based on sensitivity and specificity values at a given cutoff value. In another embodiment, the method further comprises the steps of: the measured concentration of each biomarker in the biological sample is compared to the predictions of the statistical model. In another embodiment, the set of sets is selected from the group consisting of: a. a stack consisting of CAV-1, SM (40:2), SM (44:2), lacCer 32:0, lacCer 36:0, triHexCer 34:1 and HexCer 40:0; or b.a stack consisting of CAV-1, SM (40:2), SM (44:2), lacCer 32:0, lacCer 36:0, triHexCer 34:1 and HexCer 40:0. In another embodiment, the kit comprises a biomarker that has been identified by a method selected from the group consisting of: UV-visible spectrum, mass spectrum, nuclear Magnetic Resonance (NMR) spectrum, proton NMR spectrum, nuclear Magnetic Resonance (NMR) spectrum, gas chromatography-mass spectrum (GC-MS), liquid chromatography-mass spectrum (LC-MS), correlation spectrum (COSy), nuclear Ohexaus Effect Spectrum (NOESY), rotating coordinate system nuclear ohexaus effect spectrum (ROESY), LC-TOF-MS, LC-MS/MS, and capillary electrophoresis-mass spectrum. In another embodiment, the set includes biomarkers that have been identified by UV-visible spectrum or proton NMR spectrum.
In another embodiment, the first reporter molecule selectively binds to CAV-1. In another embodiment, the second reporter selectively binds to SM (40:2). In another embodiment, the third reporter selectively binds to SM (44:2). In another embodiment, the fourth reporter selectively binds LacCer 32:0. In another embodiment, the fifth reporter selectively binds to LacCer 36:0. In another embodiment, the sixth reporter selectively binds to TriHexCer 34:1. In another embodiment, the seventh reporter selectively binds to HexCer 40:0.
In another embodiment, the determination of CAV-1, SM (40:2), SM (44:2), lacCer 32:0, lacCer 36:0, triHexCer 34:1, and HexCer 40:0 levels is performed substantially simultaneously. In another embodiment, the determination of CAV-1, SM (40:2), SM (44:2), lacCer 32:0, lacCer 36:0, triHexCer 34:1, and HexCer 40:0 levels is performed in a stepwise manner. In another embodiment, the method comprises incorporating subject history information into a distribution that is at risk of, or not at risk of, prostate cancer progression. In another embodiment, such a method comprises administering at least one surrogate diagnostic test to a subject assigned to be at risk of prostate cancer progression.
In another embodiment, a method of treating a subject suspected of being at risk of prostate cancer progression, the method comprising analyzing the risk of prostate cancer progression in the subject with a method as described herein; and administering a therapeutically effective amount of a cancer treatment. In another embodiment, the treatment is surgery, chemotherapy, immunotherapy, radiation therapy, targeted therapy, or a combination thereof. In another embodiment, the level of CAV-1, SM (40:2), SM (44:2), lacCer 32:0, lacCer 36:0, triHexCer 34:1, and HexCer 40:0 is elevated compared to the level of CAV-1, SM (40:2), SM (44:2), lacCer 32:0, lacCer 36:0, triHexCer 34:1, and HexCer 40:0 in a reference subject or group having adenocarcinoma. In another embodiment, the level of CAV-1, SM (40:2), SM (44:2), lacCer 32:0, lacCer 36:0, triHexCer 34:1, and HexCer 40:0 is elevated compared to the level of CAV-1, SM (40:2), SM (44:2), lacCer 32:0, lacCer 36:0, triHexCer 34:1, and HexCer 40:0 in a reference subject or group having squamous cell carcinoma. In another embodiment, the prostate cancer is diagnosed at or before the critical resectable stage. In another embodiment, the prostate cancer is diagnosed at the resectable stage.
In another embodiment, the method further comprises: providing a surface that binds CAV-1, SM (40:2), SM (44:2), lacCer 32:0, lacCer 36:0, triHexCer 34:1, and HexCer 40:0; incubating the surface with the biological sample;
measuring the amount of a first reporter associated with the surface; measuring the amount of a second reporter associated with the surface; measuring the amount of a third reporter associated with the surface; measuring the amount of a fourth reporter associated with the surface; measuring the amount of a fifth reporter associated with the surface; measuring the amount of a sixth reporter associated with the surface; measuring the amount of a seventh reporter associated with the surface; wherein the amounts of the first reporter, the second reporter, the third reporter, the fourth reporter, the fifth reporter, the sixth reporter, and the seventh reporter classify the subject as being at risk of prostate cancer progression or not at risk of prostate cancer progression.
In another embodiment, such a kit comprises a device for contacting a reagent solution with a biological sample. In another embodiment, such a kit comprises at least one surface having means for binding at least one biomarker. In another embodiment, the at least one biomarker is selected from the group consisting of CAV-1, SM (40:2), SM (44:2), lacCer 32:0, lacCer 36:0, triHexCer 34:1, and HexCer 40:0.
In another aspect, the present disclosure provides a method comprising a) performing the following steps when obtaining a sample from a subject without symptoms of prostate cancer; b) Measuring a set of markers in the sample, wherein the markers comprise CAV-1, SM (40:2), SM (44:2), lacCer 32:0, lacCer 36:0, triHexCer 34:1, and HexCer 40:0; c) Determining a biomarker score for each marker; d) Summing the biomarker scores for each marker to obtain a composite score for each subject, quantifying the risk of prostate cancer progression risk in the subject as a risk score, wherein the composite score matches a grouped risk category for a stratified subject population, wherein each risk category comprises a multiplier that indicates an increased likelihood of having prostate cancer as compared to using a single threshold value, associated with a composite score range, wherein the multiplier is determined by a positive predictive score for a retrospective sample; and e) performing a Computed Tomography (CT) scan or other imaging modality on the subject at risk of quantification of risk of prostate cancer progression. In another embodiment, the markers consist of CAV-1, SM (40:2), SM (44:2), lacCer 32:0, lacCer 36:0, triHexCer 34:1, and HexCer 40:0. In another embodiment, the sample is blood, serum, plasma, or some portion thereof. In another embodiment, a grouping of stratified subject populations, a multiplier indicating an increased likelihood of having the cancer, and a range of composite scores are determined from retrospective clinical samples of the populations. In another embodiment, the risk category further includes a risk identifier. In another embodiment, the risk identifier is selected from the group consisting of low risk, medium high risk, and highest risk. In another embodiment, calculating a multiplier for each risk category indicating an increased likelihood of having the cancer includes stratifying the subject cohort based on the retrospective biomarker scores, and weighting the known prevalence of cancer in the cohort with the positive predictive score for each stratified population. In another embodiment, the grouping of the stratified subject population comprises at least three risk categories, wherein the multiplier indicative of an increased likelihood of having the cancer is about 2 or greater. In another embodiment, the grouping of the stratified subject population comprises at least two risk categories, wherein the multiplier indicative of an increased likelihood of having the cancer is about 5 or greater. In another embodiment, the subject is 50 years of age or older and has a history of smoking. In another embodiment, the method further comprises generating a risk category table, wherein the marker stack is measured, the biomarker score for each marker is determined, and the composite score is obtained by summing the biomarker scores; a threshold for classifying the composite score into risk groups is determined and a multiplier is assigned to each group that indicates a likelihood that an asymptomatic subject has a quantified risk of cancer progression. In another embodiment, the groups are in a table selected from the group consisting of spreadsheet forms, software applications, computer programs, and excel spreadsheets. In another embodiment, the marker stack comprises a protein, polypeptide or metabolite measured in the binding assay. In another embodiment, the marker stack comprises a protein or polypeptide measured using a flow cytometer.
Methods for identifying a risk of prostate cancer progression in a subject are provided, the methods generally comprising: (a) Application of blood samples obtained from subjects was used to analyze four biomarkers: CAV-1, SM (40:2), SM (44:2), lacCer 32:0, lacCer 36:0, triHexCer 34:1 and HexCer 40:0; (b) Quantifying the amount of the four biomarkers present in the blood sample; and (c) applying a statistical analysis based on the amount of biomarker present to determine a biomarker score for the corresponding prostate cancer, thereby classifying the subject as either positive for prostate cancer progression risk or negative for prostate cancer progression risk. Alternatively, a method for identifying a risk of prostate cancer progression in a subject is provided, the method generally comprising: (a) Application of blood samples obtained from subjects was used to analyze four biomarkers: CAV-1, SM (40:2), SM (44:2), lacCer 32:0, lacCer 36:0, triHexCer 34:1 and HexCer 40:0; (b) Quantifying the amount of the four biomarkers present in the blood sample; and (c) applying a statistical analysis based on the amount of biomarker present to determine a biomarker score for the corresponding prostate cancer, thereby providing a means for assessing the relative risk of prostate cancer progression (e.g., in a non-binary manner) in the subject.
The methods presented herein are capable of screening Cha Gaowei subjects, such as subjects with a family history of prostate cancer, or subjects with other risk factors such as obesity, heavy smoking, and possibly diabetes. The logistic regression model disclosed herein may incorporate these factors into its classification method.
As used herein, "prostate cancer status" refers to classifying an individual, subject, or patient as being at risk of, or not at risk of, prostate cancer progression. In some embodiments, an individual at risk of prostate cancer progression may be referred to as "prostate cancer positive. In other embodiments, an individual that is not at risk of prostate cancer progression may be referred to as "prostate cancer negative. For subjects classified as positive for prostate cancer, further methods may be provided to elucidate the prostate cancer status. Prostate cancer may be classified as positive following methods including, but not limited to, computed Tomography (CT).
The disclosure is not limited to the specific biomolecules reported herein for detecting biomarkers. Other molecules may be selected for other embodiments including, but not limited to, biomolecules based on proteins, antibodies, nucleic acids, aptamers, and synthetic organic compounds. Other molecules may exhibit advantages in terms of sensitivity, efficiency, assay speed, cost, safety, or ease of manufacture or storage.
In some embodiments, the levels of CAV-1, SM (40:2), SM (44:2), lacCer 32:0, lacCer 36:0, triHexCer 34:1, and HexCer 40:0 in the biological sample are measured. In some embodiments, CAV-1, SM (40:2), SM (44:2), lacCer 32:0, lacCer 36:0, triHexCer 34:1, and HexCer 40:0 are contacted with the reporter and the level of the corresponding reporter is measured. In some embodiments, four reporter molecules are provided that specifically bind CAV-1, SM (40:2), SM (44:2), lacCer 32:0, lacCer 36:0, triHexCer 34:1, and HexCer 40:0, respectively. The use of a reporter may provide convenience and sensitivity gains for the assay.
In some embodiments, CAV-1, SM (40:2), SM (44:2), lacCer 32:0, lacCer 36:0, triHexCer 34:1, and HexCer 40:0 are adsorbed onto a surface provided in the kit. In some embodiments, the reporter binds to surface adsorbed CAV-1, SM (40:2), SM (44:2), lacCer 32:0, lacCer 36:0, triHexCer 34:1, and HexCer 40:0. The adsorption of the biomarker may be non-selective or selective. In some embodiments, the surface comprises a receptor function for increasing selectivity for adsorption of one or more biomarkers.
In some embodiments, CAV-1, SM (40:2), SM (44:2), lacCer 32:0, lacCer 36:0, triHexCer 34:1, and HexCer 40:0 are adsorbed onto four surfaces selective for one or more of these biomarkers. One or more reporter molecules may then bind to the surface-adsorbed biomarker, and the level of one or more reporter molecules associated with a particular surface may allow for easy quantification of the particular biomarker present on that surface.
In some embodiments, CAV-1, SM (40:2), SM (44:2), lacCer 32:0, lacCer 36:0, triHexCer 34:1, and HexCer 40:0 are adsorbed onto a surface provided in the kit; a relay molecule specific for one or more of these biomarkers binds to the surface-adsorbed biomarker; and a receptor molecule specific for one or more relay molecules binds to the relay molecule. Relay molecules may provide specificity for certain biomarkers and receptor molecules may enable detection.
In some embodiments, four relay molecules are provided that specifically bind CAV-1, SM (40:2), SM (44:2), lacCer 32:0, lacCer 36:0, triHexCer 34:1, and HexCer 40:0, respectively. The relay molecules may be deliberately designed for specificity for the biomarker, or may be selected from a candidate pool according to their binding properties.
In some embodiments, CAV-1, SM (40:2), SM (44:2), lacCer 32:0, lacCer 36:0, triHexCer 34:1, and HexCer 40:0 are adsorbed onto four discrete surfaces provided in the kit; a relay molecule specific for one or more of these biomarkers binds to the surface-adsorbed biomarker; and the receptor molecule binds to the relay molecule. Analysis of the surface may be done in a stepwise or parallel manner.
In some embodiments, linking the reporter to the enzyme facilitates quantification of the reporter. In some embodiments, quantification may be achieved by catalytically producing a substance having the desired spectral properties.
In some embodiments, the amount of biomarker is determined using spectroscopy. In some embodiments, the spectrum utilized is the UV-visible spectrum. In some embodiments, the spectrum utilized is a mass spectrum. In other embodiments, the spectra utilized are Nuclear Magnetic Resonance (NMR) spectra, such as including, but not limited to, proton NMR spectra, nuclear Magnetic Resonance (NMR) spectra, gas chromatography-mass spectrometry (GC-MS), liquid chromatography-mass spectrometry (LC-MS), correlation spectra (COSy), nuclear Ohvorax Effect Spectra (NOESY), rotational coordinate system nuclear ohvorax effect spectra (roosy), LC-TOF-MS, LC-MS/MS, and capillary electrophoresis-mass spectrometry.
The amount of one or more biomarkers found in a particular assay may be reported directly to the operator, or alternatively may be stored digitally and readily made available for mathematical processing. A system for performing mathematical analysis may be provided and a classification of prostate cancer positive or prostate cancer negative may be further reported to an operator.
In some embodiments, other assays known to one of ordinary skill in the art may function with the disclosure herein. Other assays include, but are not limited to, assays utilizing mass spectrometry, immunoaffinity LC-MS/MS, surface plasmon resonance, chromatography, electrochemistry, sonic, immunohistochemistry, and array techniques.
Various system components discussed herein may include one or more of the following: a computer including one or more processors for processing digital data; a short-term or long-term digital memory; an input analog-to-digital converter for providing digitized data; an application program operable to direct the processor to process digital data; an input device for collecting information from a subject or operator, and an output device for displaying information to the subject or operator.
Also provided herein are methods of treatment for subjects classified as positive for prostate cancer. Treatment of a prostate cancer positive patient may include, but is not limited to, surgery, chemotherapy, radiation therapy, targeted therapy, or a combination thereof.
With respect to the detection of biomarkers detailed herein, the disclosure is not limited to the specific biomolecules reported herein. In some embodiments, other biomolecules may be selected to detect and analyze the disclosed biomarkers, including but not limited to biomolecules based on proteins, antibodies, nucleic acids, aptamers, and synthetic organic compounds. Other molecules may exhibit advantages in terms of sensitivity, efficiency, assay speed, cost, safety, or ease of manufacture or storage. In this regard, one of ordinary skill in the art will appreciate that the predictive and diagnostic capabilities of the biomarkers disclosed herein can be extended to analysis of not only the proteinaceous forms of these biomarkers, but also other manifestations of the biomarkers (e.g., nucleic acids). Furthermore, one of ordinary skill in the art will appreciate that the predictive and diagnostic capabilities of the biomarkers disclosed herein may also be used in combination with analysis of other biomarkers associated with prostate cancer. In some embodiments, the other biomarker associated with prostate cancer may be a protein-based biomarker.
The foregoing has outlined rather broadly the features and technical advantages of the present disclosure in order that the detailed description that follows may be better understood. It should be appreciated by those skilled in the art that the specific embodiments disclosed may be readily utilized as a basis for modifying or designing other structures or processes for carrying out the same purposes of the present disclosure. It is to be understood that the disclosure is not to be limited to the specific embodiments described, as modifications may be made to the specific embodiments and still fall within the scope of the appended claims.
Definition of the definition
As used herein, the term "prostate cancer" refers to a malignant neoplasm of the prostate characterized by abnormal proliferation of cells that grow beyond and uncoordinated with the growth of surrounding normal tissue.
As used herein, the term "prostate cancer positive" refers to classifying a subject as being at risk of prostate cancer progression.
As used herein, the term "prostate cancer negative" refers to classifying a subject as not being at risk of prostate cancer progression.
As used herein, the term "subject" or "patient" refers to a mammal, preferably a human, in need of classification as positive or negative for prostate cancer and may be provided with further treatment.
As used herein, "reference patient," "reference subject," or "reference group" refers to a group of patients or subjects to whom a test sample from a patient or subject suspected of having or at risk of developing prostate cancer may be compared. In some embodiments, such a comparison can be used to determine whether the test subject has prostate cancer. The reference patient or group may serve as a control for testing or diagnostic purposes. As described herein, a reference patient or group may be a sample obtained from a single patient, or may represent a sample group, such as a pooled sample group.
As used herein, "healthy" refers to an individual in which no evidence of prostate cancer is found, i.e., the individual does not have prostate cancer. Such individuals may be classified as "prostate cancer negative," or as having healthy prostate or normal intact prostate function. Healthy patients or subjects have no symptoms of prostate cancer or other prostate diseases. In some embodiments, a healthy patient or subject may be used as a reference patient for comparison to a diseased or suspected diseased sample to determine prostate cancer in the patient or group of patients.
As used herein, the term "treatment" or "treatment" refers to the administration of a drug or the performance of a medical procedure to a subject for preventing (prophlaxis/prevention) or curing, or reducing the degree or likelihood of occurrence or recurrence of a disease or disorder or condition or event in the event that the subject or patient is afflicted. In connection with the present disclosure, the term may also refer to administration of a pharmacological substance or formulation, or performance of non-pharmacological methods including, but not limited to, radiation therapy and surgery. Pharmacological substances used herein may include, but are not limited to, chemotherapeutic drugs identified in the art, such as abiraterone acetate (Zytiga), apaluramine (Erleada), bicalutamide (Casodex), cabazitaxel (jevtna), dariutamide (Nubeqa), degarelix (ficmagon), docetaxel (Taxotere), eligard (leuprolide acetate), enzalutamide (xtadi), flutamide, goserelin acetate (Zoladex), leuprolide acetate (Lupron or Lupron Depot), olapamide (lynparaza), mitoxantrone hydrochloride, nilutamide (niladron), sipuleucel-T (Provenge), radium dichloride 223 (xoligo) and rukappanacampsulfonate (rucaparib camsylate) (rubra).
Pharmacological substances may include substances for immunotherapy, such as checkpoint inhibitors. Treatment may include a variety of pharmacological substances or a variety of therapeutic methods including, but not limited to, surgery and chemotherapy.
As used herein, the term "ELISA" refers to an enzyme-linked immunosorbent assay. The assay typically involves contacting a sample of fluorescently labeled proteins with antibodies having specific affinity for these proteins. Detection of these proteins can be accomplished by a variety of methods including, but not limited to, laser fluorescence assays.
As used herein, the term "regression" refers to a statistical method that may assign a predictive value to a potential feature of a sample based on the observable trait (or observable trait set) of the sample. In some embodiments, this characteristic is not directly observable. For example, the regression method used herein may relate the qualitative or quantitative result of a particular biomarker test or biomarker test set for a particular subject to the probability that the subject is positive for prostate cancer.
As used herein, the term "logistic regression" refers to a regression method in which the assignment of predictions from the model may have one of several allowed discrete values. For example, a logistic regression model as used herein may assign a prediction of prostate cancer positivity or prostate cancer negativity to a subject.
As used herein, the term "biomarker score" refers to a numerical score of a particular subject calculated by inputting the level of the particular biomarker for the subject into a statistical method.
As used herein, the term "composite score" refers to the sum of the normalized values of a predetermined marker measured in a sample from a subject. In one embodiment, the normalized values are reported as biomarker scores, which are then summed to provide a composite score for each test subject. When used in the context of a risk category table and associated with a hierarchical grouping based on a range of composite scores in the risk category table, the "composite score" is used to determine a "risk score" for each test subject, wherein a multiplier indicating an increased likelihood that the hierarchical grouping has cancer becomes the "risk score".
As used herein, the term "risk score" refers to a single value indicative of the risk of progression of cancer in an asymptomatic human subject, as compared to the known prevalence of progression of cancer in a disease cohort. In certain embodiments, a composite score is calculated for the human subject and associated with a multiplier that indicates a risk of prostate cancer progression, wherein the composite score is associated based on a composite score range for each hierarchical group in the risk category table. In this way, the composite score is converted to a risk score that best matches the composite score based on a multiplier that indicates an increased likelihood of the packet having cancer.
As used herein, the term "cut-off value" or "cut-off point" refers to a mathematical value associated with a particular statistical method that may be used to assign a classification of prostate cancer positive or prostate cancer negative to a subject based on the biomarker score of the subject.
As used herein, when a value above or below the cutoff value is "characteristic of prostate cancer," it means that the subject whose analysis of the sample produced the value has or is at risk of developing prostate cancer.
As used herein, a subject at "risk of prostate cancer progression" is a subject who may not have demonstrated obvious symptoms of prostate cancer or whose prostate cancer is currently painless, but is producing biomarker levels that indicate that the subject has prostate cancer or may develop prostate cancer in the near future. A subject suffering from or suspected of carrying prostate cancer may be treated for the cancer or suspected cancer.
As used herein, the term "classifying" refers to assigning a subject as being at risk of, or not being at risk of, prostate cancer progression based on the results of biomarker scores obtained for the subject.
As used herein, the term "Wilcoxon rank sum test", also known as the Mann-Whitney U test, the Mann-Whitney-Wilcoxon test, or the Wilcoxon-Mann-Whitney test, refers to a specific statistical method for comparing two populations. For example, the assay may be used herein to relate an observable trait (particularly biomarker levels) to the absence or risk of prostate cancer progression in a particular population of subjects.
As used herein, the term "true positive rate" refers to the probability that a given subject classified as positive by some method is truly positive.
As used herein, the term "false positive rate" refers to the probability that a given subject classified as positive by some method is truly negative.
As used herein, the term "sensitivity" in the context of various biochemical assays refers to the ability of an assay to correctly identify a person with a disease (i.e., true positive rate). By comparison, as used herein, the term "specificity" in the context of various biochemical assays refers to the ability of an assay to correctly identify disease-free persons (i.e., true negative rate). Sensitivity and specificity are statistical measures of performance of binary classification tests (i.e., classification functions). Sensitivity quantifies the evasion of false negatives, while specificity has the same effect on false positives.
As used herein, "sample" refers to a test substance to be tested for the presence of a biomarker as described herein, and its level or concentration. The sample may be any suitable substance according to the present disclosure, including but not limited to blood, serum, plasma, or any portion thereof.
As used herein, "metabolite" refers to a small molecule that is an intermediate and/or product of cellular metabolism. Metabolites may perform a variety of functions in cells, for example, structural effects on enzymes, signaling effects, stimulatory effects and/or inhibitory effects. In some embodiments, the metabolite may be a non-protein plasma derived metabolite marker such as including, but not limited to, acetylspermidine, diacetyl spermine, lysophosphatidylcholine (18:0), lysophosphatidylcholine (20:3), and indole derivatives.
As used herein, the term "ROC" refers to a recipient operating characteristic, which is a graphical plot used herein to measure the performance of a particular diagnostic method at various cut-off points. ROC plots can be constructed from scores of true and false positives at different cut-off points.
As used herein, the term "AUC" refers to the area under the ROC plot. AUC can be used to estimate the predictive power of a certain diagnostic test. In general, a larger AUC corresponds to increased predictive power, with lower prediction error frequencies. The range of possible values for AUC is from 0.5 to 1.0, the latter value being characteristic of error-free prediction methods.
As used herein, the term "p-value" or "p" refers to the probability that the biomarker score distribution is the same for prostate cancer positive and prostate cancer negative subjects in the context of Wilcoxon rank sum test. In general, a p-value near zero indicates that a particular statistical method has a higher predictive power when classifying a subject.
As used herein, the term "CI" refers to a confidence interval, i.e., an interval in which a certain value can be predicted depending on a certain confidence level. As used herein, the term "95% ci" refers to an interval in which a certain value can be predicted depending on the 95% confidence level.
As used herein, the term "disease progression" or "early disease progression" is defined as the increase in Gleason score and/or tumor volume at the time of monitoring a biopsy within 18 months after the onset of active monitoring.
As used herein, the term "painless disease" or "painless" prostate cancer is defined as the absence of progression five years or more after the initiation of active monitoring.
Abbreviations (abbreviations)
AKT = RAC serine/threonine protein kinase; AS = active monitoring; AUC = area under the curve; cav-1 = pit protein-1; CCLE = brood institute cancer cell line encyclopedia (Broad Institute Cancer Cell Line Encyclopedia); CE = cholesterol ester; CM = conditioned medium; diI = 1,1 '-dioctadecyl-3, 3' -tetramethylindole carbocyanine; DP = disease progression; FC = free cholesterol; gs=gleason score; hexCer = hexose ceramide; hexCer 40:0=hexosylceramide (40:0); hr=hazard ratio; lacCer = lactose ceramide; lacCer 32:0=lactose ceramide (32:0); lacCer 36:0=lactose ceramide (36:0); mapk=map-kinase=mitogen-activated protein kinase; pc=phosphatidylcholine; PDMP = 1-phenyl-2-decanoylamino-3-morpholino-1-propanol; PPMP = D-threo-1-phenyl-2-hexadecanoylamino-3-morpholino-1-propanol; pi3k=phosphoinositide 3-kinase=phosphatidylinositol-3-kinase; RFU = relative fluorescence unit; ROC = recipient operating characteristics; SEM = standard error of mean: SFM = serum-free medium; HDL = synthetic HDL-like particles; sfl = synthetic LDL-like particles; sm=sphingomyelin; SSALP = synthetic self-assembled lipid particle; TCGA = cancer genomic profile (The Cancer Genome Atlas); TO = trioleate; triHexCer = trihexose ceramide; triHexCer 34:1=trihexosylceramide (34:1).
Examples
The following examples are included to illustrate embodiments of the disclosure. The following examples are presented by way of illustration only and to assist one of ordinary skill in using the present disclosure. These examples are not intended to limit the scope of the present disclosure in any way. Those of skill in the art should, in light of the present disclosure, appreciate that many changes can be made in the specific embodiments which are disclosed and still obtain a like or similar result without departing from the spirit and scope of the invention.
Example 1: separation of extracellular vesicles by density gradient flotation
Extracellular vesicles were isolated as described previously. Briefly, microvesicles were depleted from biological samples by centrifugation at 2000×g for 20min followed by centrifugation at 16,500×g for 30 min; the resulting supernatant was filtered through a prewetted 0.22 μm vacuum filter. The microvesicle depleted biological samples were densified to 1.16-1.30g mL by mixing with OptiPrep iodixanol solution (Sigma D1556) -1 And loaded into the bottom of a polycarbonate ultracentrifuge tube and covered with 1.20-1.01g mL -1 Aliquots of 0.5-2mL iodixanol/PBS solution in the range of (35-0% wt: vol) are developed from highest to lowest density as needed to form single or multi-step density fractionation gradients. Ultracentrifugation at 100,000Xg for 4 hours at 8 ℃. The vesicles were collected from the top of the tube and continued to the lower part to recover a volume corresponding to 90% of the volume of the covering gradient. The density of the harvested fractions was assessed according to a standard curve using a NanoDrop microvolume spectrophotometer (sammer feishi technologies (ThermoFisher Scientific), wilmington, telawamori) based on the absorbance of the sample at 250 nm. The vesicle harvest was stored at-80 ℃.
Example 2: proteomic profiling of extracellular vesicles
Proteomic profile analysis of extracellular vesicles was performed according to the following standardized working procedure. Briefly, ECV-derived protein digestion and identification was performed by LC-MS/MS using established protocols. The pooled digested protein fractions were separated using a NanoAcquity UPLC system coupled in-line with a WATERS SYNAPT G2-Si mass spectrometer. The system was equipped with Waters Symmetry C nanoAcquisy trapping column (180 μm. Times.20 mm,5 μm) and Waters HSS-T3C 18 nanoAcquisy analytical column (75 μm. Times.150 mm,1.8 μm). The column oven temperature was set at 50 ℃ and the temperature of the tray chamber in the autosampler was set at 6 ℃. LC-HDMSE data were collected with synpt G2-Si in resolution mode using Waters Masslynx (version 4.1, scn 851). The capillary voltage was set at 2.80kV, the sampling cone voltage was 30V, the source offset was 30V and the source temperature was 100deg.C. Mobility high purity N2 was used as drift gas in IMS TriWave cells. Helium pool,The pressure in the trap, IMS Triwave and transfer tanks was 4.50 mbar, 2.47X 10 respectively -2 Millibars, 2.90 millibars and 2.53×10 millibars -3 And millibars. IMS wave velocity 600m s -1 Helium bath DC 50V, trap bath DC bias 45V,IMS TriWave DC bias V, IMS wave delay 1000 μs. The mass spectrometer is operated in V mode with a typical resolving power of at least 20,000. All analyses were performed using a NanoLockSpray source using positive mode ESI. The lock quality channel is sampled every 60 seconds. Use of [ Glu1 ] delivered by a nanoLockSpray source reference nebulizer ]Fibrinopeptides solution (300 fmol. Mu.L) -1 ) The mass spectrometer is calibrated. Accurate mass LC-HDMSE data is collected in alternating low energy (MS) and high energy (MSE) acquisition modes, mass scan range from m z -1 50 to 1800. The spectrum acquisition time in each mode was 1.0s with an inter-scan delay of 0.1-s. In the low energy HDMS mode, data were collected in the catch basin and transfer basin with a constant collision energy of 2 eV. In the high-energy HDMSE mode, the collision energy is ramped up from 25eV to 55eV only in the transfer cell. Adjusting the RF applied to the quadrupole mass analyzer such that m z -1 300 to 2000 ions are efficiently transported, ensuring what is observed in LC-HDMSE data<m z -1 300 results from dissociation in the transfer collision cell. The collected LC-HDMSE data were processed through ProteinLynx Global Server (PLGS, waters Company) and searched in the protein knowledge database (Uniprot) with FDR of 4%.
Example 3: metabonomics analysis
After sample extraction transfection, the cell lysate was washed 2 times with pre-chilled 0.9% NaCl followed by the addition of 2.5mL of pre-chilled 3:1 isopropanol in ultrapure water. Cells were scraped in extraction solvent using a 25cm cell spatula (Sarstedt) and transferred to a 15mL conical tube (Eppendorf). The sample was briefly vortexed and subsequently centrifuged at 2,000Xg for 10min at 4 ℃. Thereafter, 1.2mL of the metabolite extract was transferred to a 1.5mL Eppendorf tube and stored at-20℃until metabonomic analysis was performed.
Primary metabolites and biogenic amines were pre-aliquoted from 96 well microplates (Eppendorf) with 30. Mu.L LCMS grade methanol (Siemens Feisher Co.)Plasma metabolites were extracted from EDTA plasma (10. Mu.L). The plates were heat sealed, vortexed at 750rpm for 5min, and centrifuged at 2000 Xg for 10 min at room temperature. The supernatant (10 μl) was carefully transferred to a 96-well plate, leaving the precipitated protein behind. The supernatant was further diluted with 10. Mu.L of 100mM ammonium formate (pH 3). For hydrophilic interaction liquid chromatography (HILIC) analysis, samples were diluted with 60. Mu.L of LCMS grade acetonitrile (Siemens Feeder), while for C18 analysis, samples were diluted with 60. Mu.L of water (GenPure ultra pure water System, siemens Feeder). Each sample solution was transferred to 384 well microwell plates (Eppendorf) for LCMS analysis. For conditioned media, frozen samples were thawed on ice and 30 μl was transferred to 96 well microwell plates (Eppendorf). An aliquot was diluted with another 30 μl of 100mM ammonium formate. The microplate was heat sealed, vortexed at 1500rpm for 5min, and centrifuged at 2000 Xg for 10 min at room temperature. For hydrophilic interaction liquid chromatography (HILIC) analysis, 25. Mu.L of the sample was transferred to a new 96-well microplate containing 75. Mu.L of acetonitrile, while for C18 analysis, the sample was transferred to a new 96-well microplate containing 75. Mu.L of water (GenPure ultra pure water System, siemens Fielder). Each sample solution was transferred to 384 well microwell plates (Eppendorf) for LCMS analysis. Cell lysate supernatant 100 μl (3:1 isopropanol: ultrapure water) was aliquoted into two 96-well plates (Eppendorf) and evaporated to dryness under vacuum. The samples were then reconstituted as follows: for the HILIC assay, the dried sample was dissolved in 65. Mu.L ACN (Siemens Feier): 100mM ammonium formate pH 3 (9:1), whereas for the C18 reverse phase assay, the dried sample was dissolved in 65. Mu. L H 2 O100 mM ammonium formate pH 3 (9:1). The samples were spun down to remove any insoluble material and then transferred to 384 well plates for high throughput mass analysis using LCMS.
Complex lipids A pre-aliquot of EDTA plasma sample (10. Mu.L) was extracted with 30. Mu.L LCMS grade 2-propanol (Celaster Feisher) in a 96 well microplate (Eppendorf). The plates were heat sealed, vortexed at 750rpm for 5min, and centrifuged at 2000 Xg for 10 min at room temperature. The supernatant (10 μl) was carefully transferred to a 96-well plate, leaving the precipitated protein behind. The supernatant was further diluted with 90. Mu.L of 1:3:2 100mM ammonium formate pH 3 (Siemens Feeil.) acetonitrile: 2-propanol and transferred to 384 well microplates (Eppendorf) for lipid analysis using LCMS. For cell lysates, 10. Mu.L (3:1 isopropanol: ultrapure water) of cell lysate supernatant was diluted with 90. Mu.L 1:3:2 100mM ammonium formate pH 3:acetonitrile: 2-propanol (Sieimer's femoris) in 96-well plates and transferred to 384-well microwell plates (Eppendorf) for analysis by LC-MS.
Non-targeted analysis of primary metabolites and biogenic amines Waters acquisition coupled with Xex G2-XS quadrupole time of flight (qTOF) mass spectrometer TM Non-targeted metabonomics analysis was performed on a UPLC system with a 2D column regeneration configuration (class I and class H). Using HILIC (acquisition) TM The presence of the UPLC BEH amide, 1.7 μm 2.1X100 mm, wolts company (Waters Corporation), milford, USA) and C18 (Acquity TM UPLC HSS T3,
 1.8 μm, 2.1X100 mm, watts corporation, milford, USA) column was subjected to chromatography at 45 ℃. The quaternary solvent system mobile phase was (a) 0.1% formic acid in water, (B) 0.1% formic acid in acetonitrile, and (D) 100mM ammonium formate (pH 3). Samples were isolated using the following gradient profile: for HILIC separation, the initial gradient of 95% B and 5% D was 0.4mL min -1 The flow rate was linearly increased to 70% A,25% B and 5% D over 5min, followed by 0.4mL min -1 An isocratic gradient of 1min at 100% A at flow rate. For C18 separation, the chromatographic gradient is as follows: the starting conditions were 100% a, linearly increasing to the
 final conditions 5% a,95% b, followed by a 1min isocratic gradient at 95% b,5% d. Column regeneration and equilibration were performed using a binary pump. The solvent system mobile phase was (A1) 100mM ammonium formate (pH 3), (A2) 0.1% formic acid in 2-propanol, and (B1) 0.1% formic acid in acetonitrile. The HILIC column was stripped using 90% A2 for 5min, followed by 0.3mL min using 100% B1 -1 The flow rates were equilibrated for 2min. The regeneration of the 2min reverse phase C18 column was carried out using 95% A1,5% B1, followed by 5min column equilibration using 5% A1,95% B1.
Non-targeted analysis of complex lipids for lipidomic assaysDetermination of Waters acquisition coupled to Xex G2-XS quadrupole time of flight (qTOF) mass spectrometer TM Non-targeted metabonomics analysis was performed on the UPLC system. Using C18 (Acquity TM UPLC HSS T3, 1.8 μm, 2.1X100 mm, watts corporation, milford, USA) column was subjected to chromatography at 55 ℃. The mobile phase was (A) water, (B) acetonitrile, (C) 2-propanol, and (D) 500mM ammonium formate (pH 3). The initial elution gradient of 20% a,30% b,49% c and 1% d was linearly increased to 10% b,89% c and 1% d for 5.5min, followed by isocratic elution at 10% b,89% c and 1% d for 1.5min and equilibrated with the initial conditions column for 1min.
Example 4: mass spectrometry
And (5) data acquisition. Mass spectral data were acquired using sensitivity mode in positive and negative electrospray ionization modes in the range of 50-1200Da for primary metabolites and 100-2000Da for complex lipids. For electrospray collection, the capillary voltage was set to 1.5kV (positive) and 3.0kV (negative), the sampling cone voltage was 30V, the source temperature was 120℃and the cone airflow was 50L h -1 And desolvation gas flow rate of 800L h -1 The scan time was 0.5 seconds, in continuous mode. Leucine enkephalin; 556.2771Da (positive) and 554.2615Da (negative) were used for lockspray correction and scanned at 0.5 min. Unless otherwise indicated, the injection volume for each sample was 3 μl. The acquisition is performed by means of an instrument automatic gain control to optimize the sensitivity of the instrument during the sample acquisition time.
Data processing LC-MS and LC-MSe data were processed using Progenesis QI (non-linear, wates) and values reported in area units. Annotations are determined by matching exact mass and retention time using custom libraries created from authentic standards and/or by matching experimental tandem mass spectrometry data with NIST MSMS or HMDB v3 theoretical fragments.
Data normalization was performed to correct for injection order drift, and each feature was normalized using data collected from repeated injections of quality control samples for each 10 injections throughout the run sequence. The measured data is smoothed by local weighted scatter plot smoothing (LOESS) signal correction (QC-RLSC) as described previously. The eigenvalues between the quality control samples were interpolated by cubic splines. The metabolite values were readjusted by controlling the overall median of peak areas using the historical quality of all samples. Only detection features exhibiting a Relative Standard Deviation (RSD) of less than 30 in historical or pooled quality control samples are considered for further statistical analysis. To reduce the complexity of the data matrix, annotation features with multiple citations or collection pattern repetitions are folded into representative unique features. Features are selected based on repetition accuracy (RSD < 30), highest intensity and best isotope similarity match to theoretical isotope distribution. The values are reported relative to the ratio of historical quality control reference samples (plasma/conditioned medium) or adjusted area units (lysate) included in each analytical run.
Statistical analysis in order to find a cut-off point of covariates giving the greatest difference between individuals in two defined groups, the method described above was used. Using log rank statistics based on the group defined by the cutoff results in the following:

where D is the total number of different events (disease progression (DP)), D i Is at each event time (t i ) Is used to determine the total number of DPs, is the total number of DPs when the Cav-1-sphingolipid signature value is greater than the cut-off point. r is (r) i And->
 Are also defined as the total number at risk for all Cav-1-sphingolipid signature values and Cav-1-sphingolipid signature values above the cut-off point, respectively. S was calculated for all possible cut-off points in the Cav-1-sphingolipid signature column k The estimated intercept point is the maximum S produced k Is a value of (2). At the position ofIn the analysis, S k The maximum of (2) is located at the first 16.4% of the Cav-1-sphingolipid signature value. In other words, the first 16.4% of Cav-1-sphingolipid signature values are in the high risk group, the other 83.6% are in the low risk group.
To calculate the p-value for this test, a value of 0.009 is provided using the following formula. This suggests that Cav-1-sphingolipid signature levels are highly correlated with progression free survival.
p-value ≡ 2exp (-2Q) 2 )
Wherein:

and is also provided with
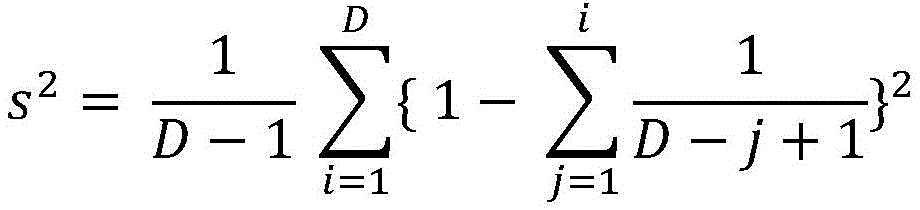
Example 5: prediction of AS Gleason progression by plasma lipid profile
Non-targeted metabonomic analysis was performed on clinically matched baseline plasma samples (n=16 per group) collected prospectively from patients suffering from clinically low risk early stage prostate cancer who were experiencing AS, who exhibited early stage DP or no pain disease (table 1). A total of 269 unique annotated metabolite features were identified in baseline plasma from the discovery cohort; the 14 features showed statistical significance (Wilcoxon rank sum test, unadjusted p value < 0.05) ROC AUC value >0.7.
Table 1: MDACCs discover patient characteristics of the cohort.


7 of the 14 features are complex lipids; in particular sphingomyelin and glycosphingolipids (Table 2).
Table 2: characterization of metabolites identified in discovery cohorts


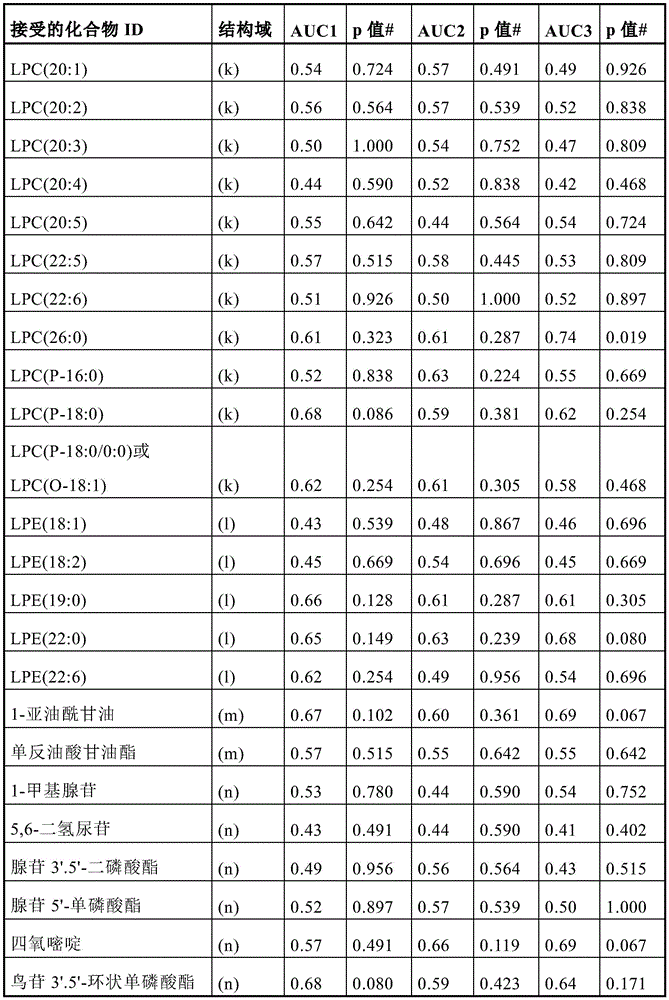


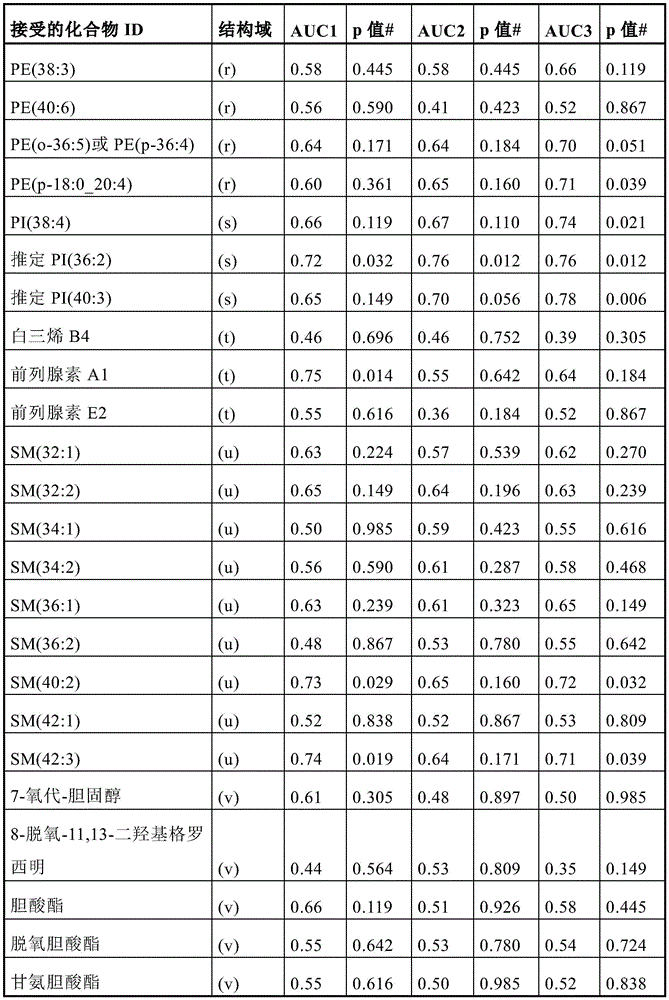


(a) Amino acid or amide (m) monoacylglycerols
(b) Carbohydrate (n) purine/pyrimidine
(c) Carnitine (o) organic acids
(d) Ceramide (p) other
(e) Dipeptide (q) phosphatidylcholine
(f) Exogenous (r) phosphatidylethanolamine
(g) Fatty acid(s) phosphatidylinositol
(h) Glycosphingolipids (t) prostanoids
(i) Hormone (u) sphingomyelin
(j) Lipid (v) sterols
(k) Lysophosphatidylcholine (w) triacylglycerols
(l) Lysophosphatidylethanolamine (x) vitamins
Although none of the 14 features remained individual significant after adjustment for the multiple hypothesis test, the significantly elevated lipids were biochemically linked to ceramide metabolism, suggesting a coordinated signal. Furthermore, sphingomyelin and glycosphingolipids were generally elevated in baseline plasma samples of the progressors case (early DP) compared to the control (no disease progression for at least 5 years after AS onset) (fig. 1 (a)). Importantly, SM and glycosphingolipids detected in DP cases were still elevated compared to the control with matched follow-up time. There was no statistical significance in the SM and glycosphingolipids cases observed at baseline and 12 months post baseline (figure 2). In view of the known lipid transport function of Cav-1 (Cheng 2016), the observed elevation of plasma sphingolipid signatures suggests a biological link to the previous elevation of plasma Cav-1 in the context of disease progression. To explore this, analysis was extended to include non-targeted metabolomic profiling of 459 baseline plasma samples collected prospectively from patients suffering from early stage prostate cancer who were experiencing AS (table 3).
Table 3: patient characterization of MDACC validation queue


Double-sided Wilcoxon rank sum test
Double-sided Fisher exact test
Consistent with findings in the initial discovery queue, a number of SMs and glycosphingolipids are positively correlated with GS-based DP (hazard ratio > 1.5); (FIG. 1 (b); table 4).
Table 4: the mdaccc verifies the hazard ratio of various metabolites in the queue for progression free survival


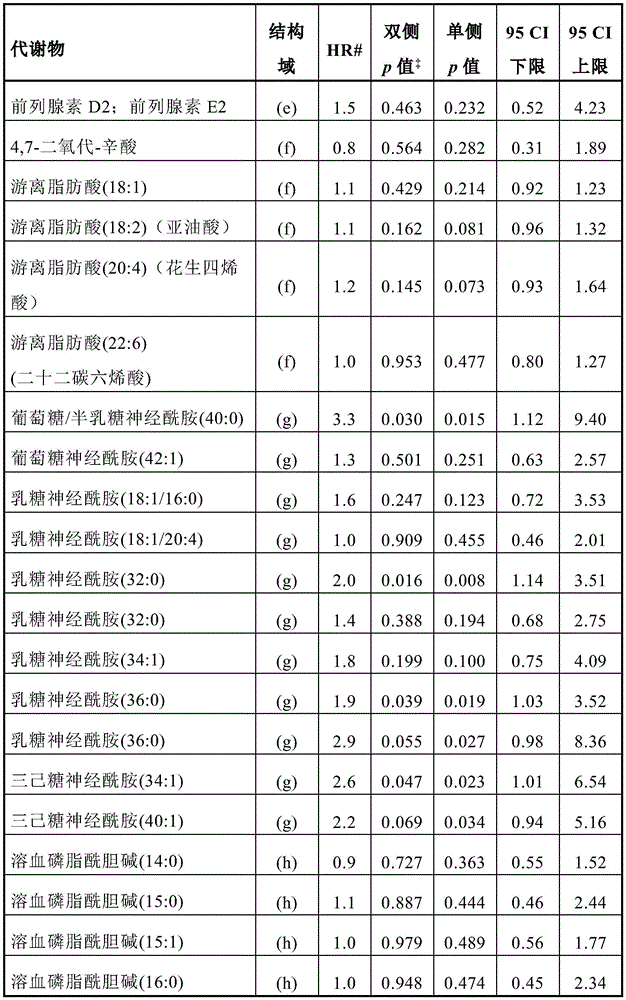


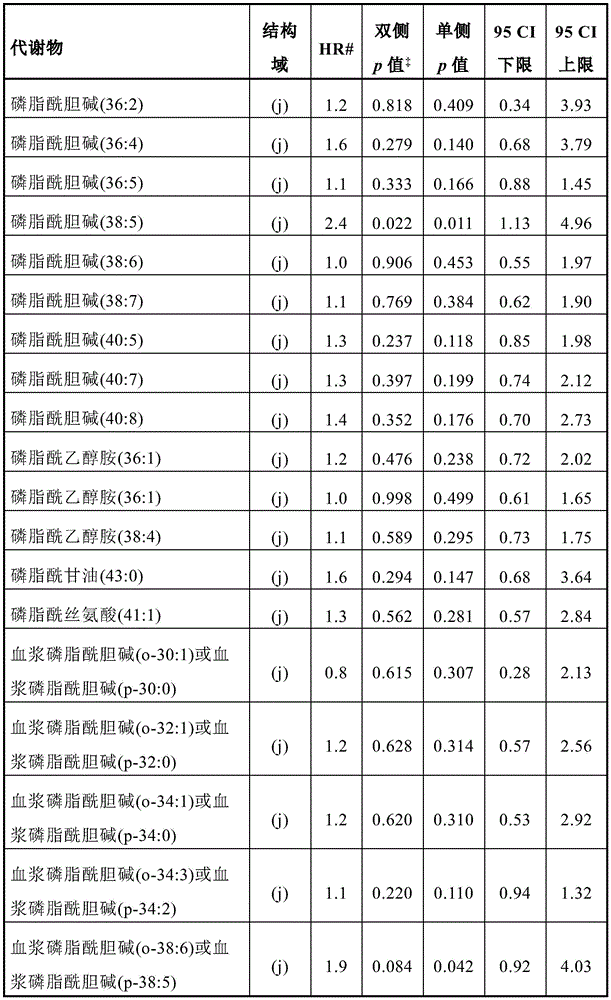


# treated as continuous variable

(a) Acyl carnitine (g) glycosphingolipids
(b) Ceramide (h) lysophospholipid
(c) Cholesterol ester (i) monoacylglycerols
(d) Diacylglycerol (j) phospholipid
(e) Eicosanoid (k) sphingolipids
(f) Free fatty acid (l) triacylglycerols
Next, using a logistic regression model, a signature panel was developed from the set of sphingolipids that exhibited statistically significant (p < 0.05) HR, which included plasma Cav-1 and six sphingolipids that exhibited positive β -estimates in the logistic regression model: SM (40:2), SM (44:2), lactose ceramide (32:0), lactose ceramide (36:0), trihexosylceramide (34:1), and hexosylceramide (40:0). Using log rank test statistics of the Cox model, an optimal cut-off point for plasma Cav-1-sphingolipid signature was calculated that would yield the greatest difference between subjects exhibiting disease progression (defined AS GS promotion and/or tumor volume increase) and subjects not exhibiting disease progression in AS. This gives a cut-off value of 4.33. Assessment of the correlation of this signature with progression free survival was achieved using a Cox proportional hazards model (Cox-proportional hazard model). AS subjects with a plasma Cav-1-sphingolipid signature score >4.33 showed statistically significantly worse DP-free survival rates (HR: 2.70,95% CI:1.75-4.16, p-values: < 0.001) than subjects with a plasma Cav-1-sphingolipid signature score +.4.33 in multivariate analysis adjusted for age, 5-alpha reductase treatment, and baseline tumor volume (Table 5). Notably, the non-proportional hazards model test resulted in insignificant p-values. It was relevant that BMI was not associated with increased risk of DP in this analysis (HR: 1.02,95% CI:0.40-2.64, p-value: 0.965), indicating that such lipid signatures are unlikely to deviate from obesity.
Table 5: cav-1-sphingolipid signature and risk model for disease progression-free survival

Table 6 and FIG. 1 (c) provide Kaplan-Meier survival curves depicting progression free survival of participants with plasma Cav-1-sphingolipid signature scores below the cutoff value (< 4.33) or equal to the cutoff value or above the cutoff value (. Gtoreq.4.33).
TABLE 6 progression free survival

A multivariate Cox proportional risk model for Cav-1-sphingolipid signature and its correlation with disease progression-free survival. A Cox proportional hazards model with a plasma Cav-1-sphingolipid signature cutoff of 4.33 was used. As previously described, the optimal cut-off value for the plasma Cav-1-sphingolipid signature was obtained using a method based on log rank statistics. Age, 5-alpha reductase treatment and baseline tumor volumes (risk group 1:1 positive core needle biopsies, <3.0mm for tumor lesions in Gleason 3+3=6 patients, or <2.0mm in Gleason 3+4=7 patients; risk group 2: >1 core needle or baseline tumor length greater than risk group 1) were included as covariates based on a step-back selection (likelihood ratio).


To better define the relationship between lipid metabolism and Cav-1 in the context of Cav-1-sphingolipid signatures, the gene expression profiles reflecting lipid manager (lipid managing apparati) and Cav1mRNA expression in 333 prostate tumors were first compared using cancer genomic maps (The Cancer Genome Atlas, TCGA). High CAV1mRNA expression was found to be positively correlated with genes annotated as being in the body associated with lipid clearance and metabolism, glucose ceramide metabolic processes, and ceramide pathways. The correlation of elevated CAV1 and related lipid managers with the previously defined primary prostate cancer molecular subtype (iClusters) is discussed next. The results indicate that high CAV1mRNA expression is mainly associated with iCluster 3, which is characterized by elevated PI3K/AKT, MAP-kinase and receptor tyrosine kinase activities.
Example 6: correlation of Cav-1 with high lipid clearance phenotype
The response of Cav-1 to extracellular lipid availability was next assessed. Lipid deprivation reduced Cav-1 protein expression in RM-9 and PC-3M prostate cancer cell lines when compared to serum-free medium with and without lipid (FIG. 3 (a) and FIG. 3 (b)). Notably, the presence of apolipoproteins, cholesterol or cholesterol esters was essential for maintaining elevated Cav-1 protein levels, suggesting that Cav-1 has a specific response to the phospholipid component of the extracellular lipid complex (fig. 3 (a) and fig. 3 (b)).
The involvement of Cav-1 in lipid uptake was next explored. To this end, low Cav-1 (FIG. 3 (b)) LNCaP was next evaluated for its ability to clear extracellular fluorescent DiI conjugated SSALP with Cav-1 positive (FIG. 3 (a)) PC-3M and RM-9 prostate cancer cell lines. PC-3M and RM-9 prostate cancer cells showed significantly higher fluorescence accumulation compared to LNCaP (FIG. 3 (d)).
Example 7: modulation of glycosphingolipid biosynthesis by Cav-1
A comparison of baseline lipid profiles of LNCaP and PC-3M cells was then performed, as well as lipid profiles after corresponding overexpression of Cav-1 or transient knockout of CAV 1. FIG. 3 (b) provides an immunoblot comparing levels of whole cell lysates Cav-1 in LNCaP and PC-3M cells after overexpression of Cav-1 or transient knockout of CAV1, respectively. Baseline PC-3M cells showed elevated levels of triacylglycerols, cholesterol esters, and lysophospholipids, and decreased sphingolipids relative to baseline LNCaP. Overexpression of Cav-1 resulted in a significant increase in the overall level of major lipid classification, whereas knockout of Cav-1 resulted in a significant decrease in phospholipids, diacylglycerols, sphingomyelin and glycosphingolipids (in particular lactose ceramide) (fig. 4 (a) and fig. 4 (b)). The relationship between Cav-1 and ceramide metabolic center enzymes was then evaluated using CCLE and TCGA gene expression datasets. For CCLE data, prostate cancer cell lines were stratified into cell lines that highly expressed CAV1 (log 2 >11 (range 11-01-13.61), HPrEC, DU145, PC-3) or that lowly expressed CAV1 (log 2 <7 (range 4.16-6.88), NCIH660, MDAPCA2B, LNCaP, VCaP, CWR Rv 1) based on average CAV1 gene expression. TCGA data for prostate adenocarcinoma are stratified into the highest or lowest CAV1 expression quartiles to assess the correlation between CAV1 mRNA expression and mRNA expression of genes involved in sphingolipid metabolism in the most diverse populations. Table 7 provides consecutive values for mRNA expression using CAV1 and genes involved in sphingolipid metabolism based on a Spearman correlation analysis of the entire TCGA prostate cancer dataset. Prostate cancer cell lines and prostate tumors that exhibit high CAV1 mRNA levels also tend to exhibit reduced mRNA expression levels of genes involved in ceramide biogenesis, including dihydroceramide Desaturase (DEGS), ceramide synthase (CERS), and Sphingomyelinase (SPMD), compared to those with low CAV1 mRNA levels (fig. 5 (a)) and fig. 5 (b)). In contrast, mRNA expression of enzymes involved in glycosphingolipid biosynthesis, including glucosylceramide synthase (UCGC), lactosylceramide synthase B4GALT5 and B4GALT6, was elevated in high CAV1 prostate cancer cell lines and prostate tumors.
Table 7: spearman correlation analysis

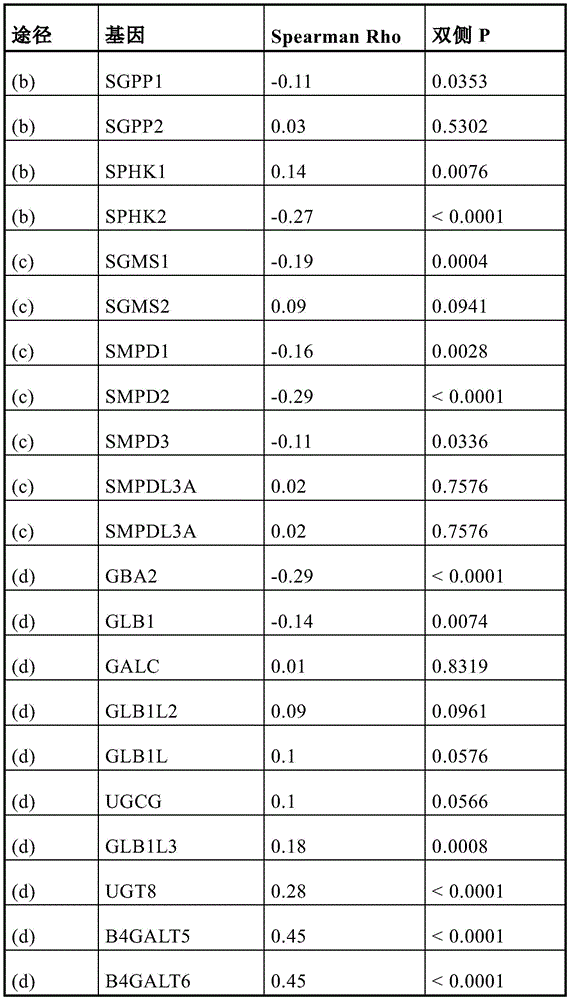
(a) De novo pathway (c) sphingomyelinase pathway
(b) Sphingosine recycle (d) glycosphingolipid metabolism
Example 8: sphingomyelin serves as a source of ceramide and glycosphingolipids.
Uptake of extracellular sphingomyelin was studied as a potential source of ceramide and its glycosphingolipid derivatives (by glycosylation). Ceramide is derived primarily by three metabolic pathways: de novo, recycle or salvage pathways (figure 6). Ceramide biosynthesis by the salvage pathway is mediated by the hydrolysis of sphingomyelin by sphingomyelinase.
With sphingomyelin (d18:1/18:1) -deuterium (d) 9 SSALP-treated PC-3M, RM-9 and LNCaP prostate cancer cells for 48 hours. The biochemical progression of the compound was followed using liquid chromatography mass spectrometry (fig. 7 (a)). Ceramide (18:1/18:1) -d was detected in all three cell lines 9 Isotopes, and glucosylceramide (18:1/18:1) -d 9 Isotopes were detected only in PC-3M and RM-9 prostate cancer cell lines. Notably, ceramide (18:1/18:1) -d, based on peak area 9 With sphingomyelin (18:1/18:1) -d 9 Is significantly higher in PC-3M (ratio: 0.14) and RM-9 (ratio: 0.23) than LNCaP (ratio: 0.02), demonstrating an overall higher metabolic flux into ceramide biosynthesis via sphingomyelin remediation (FIG. 7 (b)). Neither oleate-d was observed 9 Nor ceramide (18:1/18:1-d 9 ) -1-phosphate, indicating that sphingomyelin-derived ceramides preferentially shunt to the glycosphingolipid pathway, rather than being hydrolysed or phosphorylated by ceramidase. These findings provide direct biochemical evidence that sphingomyelin is indeed the source of ceramide and its glycosylated derivatives (fig. 4 (b)).
Example 9: promotion of mitochondrial component by Cav-1.
The above findings indicate that the Cav-1 related mechanism framework introduces a pool of ceramides into glycosphingolipids, which is consistent with the observation that glycosphingolipids (especially lactosylceramides) are a key feature of plasma glycosphingolipid signature (fig. 1 (b)). Ceramide is a bioactive sphingolipid that is actively involved in mediating cell death, including induction of apoptosis by mitochondrial release of cytochrome c, and targeting mitochondria to autophagosomes to trigger lethal mitochondrial autophagy. The correlation between Cav-1 and mitochondrial morphology was next investigated in PC-3M (Cav-1 high) and LNCaP (Cav-1 low) cell lines. PC-3M cells exhibited more branched fusion-like mitochondrial structures with diffuse lysosomal staining, whereas the morphology of mitochondria and lysosomes in LNCaP cells was more punctiform (fig. 8 (a)). Differential transport of sphingomyelin in PC-3M cells after CAV1 knockdown was assessed using a fluorescently labeled SSALP containing C11TopF luor-SM. Knocking out CAV1 resulted in statistically significant (double sided Tukey multiple comparison test, adjusted p < 0.001) decreased uptake of SSALP containing C11TopFluor-SM (fig. 8 (b) and fig. 8 (d)). Notably, the knockout of CAV1 in PC-3M also resulted in accumulation of punctate mitochondria (fig. 9; fig. 10 (a) and 10 (b)) and a decrease in lysosomal presence rate (fig. 9); these changes were accompanied by an increase in reactive oxygen species (double sided Tukey multiple comparison test, adjusted p < 0.001), as assessed by MitoTracker Red CMXRos (pout 1996) and CellROX Deep red (fig. 11, fig. 10 (c)).
Example 10: rich and richEV release with Cav-1-sphingomyelin/lactosylceramide.
Prostate cancer cells have previously been shown to secrete membrane-associated Cav-1. Consistent with this previous report, evaluation of CM demonstrated detectable levels of Cav-1 in CM from PC-3M and RM-9 prostate cancer cell lines, but LNCaP was not. After overexpression of Cav-1 or knockout of Cav1, respectively, extracellular lipid vesicles (EV) were isolated from CM of LNCaP and PC-3M, confirming that Cav-1 was present on EV (fig. 8 (d) and fig. 12 (a) and fig. 12 (b)). Notably, when the medium was supplemented with exogenous low density lipoprotein, the amount of EV containing Cav-1 was significantly higher (fig. 12 (b)), consistent with early observations that lysate Cav-1 protein expression was responsive to extracellular lipid availability (fig. 3 (a)). Accordingly, after overexpression of Cav-1 in LNCaP, the concentration of EV particles in CM was statistically significantly higher (comparison of area under the curve, double-sided student t-test, p: 0.02) compared to the corresponding control, whereas the number of EV in CM from PC-3M after CAV1 knockout was statistically significantly reduced (comparison of area under, double-sided student t-test, p<0.001 (fig. 12 (c) and 12 (d)). Furthermore, the EV highest concentration containing Cav-1 was 1.06-1.15g mL as determined by using density gradient fractionation -1 Fractions of plasma high density lipoproteins within the buoyant density range indicate that secreted Cav-1 is present in the HDL-like lipoprotein particles. Analysis of CM lipidsets of LNCaP and PC-3M after over-expression of Cav-1 or knockdown of Cav1, respectively, also indicated an increase in the relative abundance of sphingomyelin and lactoceramide, which was dependent on Cav-1 and extracellular lipid bioavailability (fig. 13 (a)) and fig. 13 (b)).
To determine the lipid composition and protein cargo of EVs, lipidomic and proteomic analysis was performed on EVs derived from LNCaP and PC-3M using mass spectrometry, respectively. Consistent with the findings of others, analysis of the EV-lipidome identified a particular enrichment of sphingolipids as well as phosphatidylcholine. Interestingly, cardiolipin (an important lipid component of the mitochondrial inner membrane) was found to be present in prostate cancer cell line derived EVs. Evaluation of the EV-proteome identified 237 and 341 (5 spectral abundance. Gtoreq.) high confidence proteins in LNCaP and PC-3M derived EVs, respectively. To study functional aspects of protein features, subcellular localization analysis was performed based on a partitioned localization evidence database score [ doi.org/10.1093/database/bau012], screening genes assigned confidence to at least one of the following 11 subcellular localization (confidence score > 2): the nucleus, cytosol, cytoskeleton, peroxisomes, lysosomes, endoplasmic reticulum, golgi apparatus, plasma membrane, endosomes, extracellular space and mitochondria (fig. 14). Subcellular localization analysis of EV-derived protein features provides evidence for the manifestation of proteins annotated as localized to mitochondria (FIG. 13 (c); FIG. 14). IPA analysis of 341 protein features detected in PC-3M-derived EVs revealed pit-mediated endocytosis and phagosome maturation (as upper network), and decreased apoptosis and necrosis as well as increased cell motility, degranulation and cell proliferation as upper-layer activating disease function (tables 8 and 9).
Table 8: disease function
| Disease function | Adjusted P value | Predicting activation status | # molecule |
| Cell movement | 2.09E-30 | Increase in | 125 |
| Apoptosis of cells | 2.8E-22 | Reduction of | 119 |
| Necrosis of | 1.06E-27 | Reduction of | 134 |
| Cell degranulation | 2.51E-31 | Increase in | 69 |
| Cell proliferation of tumor cell lines | 8.87E-20 | Increase in | 112 |
Table 9: original canonical pathway
| Original canonical pathway | Log (p value) | Ratio of | # molecule |
| Virus entry by endocytic pathway | 27.6 | 0.28 | 30/107 |
| Nest-mediated endocytic signaling | 21.1 | 0.301 | 22/73 |
| Phagosome maturation | 20.2 | 0.193 | 27/140 |
| Remodeling of epithelial adhesive connections | 19.3 | 0.303 | 20/66 |
| Germ cell-supporting cell connection signaling | 18.2 | 0.163 | 27/166 |
| 14-3-3 mediated Signal transduction | 17.9 | 0.190 | 24/126 |
| Ephrin receptor signaling | 17.4 | 0.152 | 27/178 |
| Axon-directed signaling | 17.2 | 0.0878 | 41/467 |
| Epithelial adhesive attachment signaling | 17.1 | 0.167 | 25/150 |
| Clathrin mediated endocytic signaling | 16.5 | 0.141 | 27/192 |
Taken together, these findings indicate that prostate cancer cells robustly secrete sheath lipid rich EVs containing Cav-1 that are rich in different protein profiles, including mitochondria-related proteins and lipids. Based on these findings, cav-1 mediated sphingomyelin uptake (fig. 8 (b)) and fig. 8 (c)), conversion of sphingomyelin to ceramide and its subsequent glycosphingolipid derivative (fig. 7 (b)), and incorporation of mitochondrial proteins in EV cargo (fig. 12 (c)), fig. 12 (d)) and fig. 14) are clearly associated with clearance of mitochondrial components.
Example 11: targeting of ceramide to glycosphingolipids
These findings of adaptive Cav-1 mediated glycosphingolipids mechanisms suggest that targeting of ceramide to glycosphingolipids conversion may be indicative of operative metabolic vulnerability in prostate cancer. To test this hypothesis, three different inhibitors of PDMP, PPMP and irinotecan, namely glucosylceramide synthase (also known as UGCG; UDP-glucose: ceramide glucosyltransferase, the rate-limiting enzyme in glycosphingolipid metabolism), were then evaluated for efficacy in reducing viability of RM-9 and PC-3M prostate cancer cells in vitro. Treatment of RM-9 and PC-3M prostate cancer cells with PDMP, PPMP and irinotecan resulted in dose-dependent cytotoxicity (FIG. 15). Next, changes in the lipidosome after UGCG pharmacological inhibition in RM-9 and PC-3M prostate cancer cells were evaluated. RM-9 and PC-3M cells were challenged with PDMP, PPMP, irinotecan, or vehicles and evaluated after 6 hours of treatment to capture early metabolic changes (in particular sphingolipid metabolism) and mitigate the effects of secondary events that may lead to elevated ceramide pool and reduced GLS expression, which may occur due to reduced cell viability. Short-term (6 hours) challenge of RM-9 and PC-3M prostate cells with PDMP, PPMP, or irinotecan resulted in accumulation of intracellular ceramide, acylcarnitine, lysophospholipid, and diacylglycerol and reduction of glycosphingolipids, phospholipids, and triacylglycerols (FIGS. 15, 16). Notably, the acute cytotoxic effects of irinotecan are mediated by non-apoptotic mechanisms (fig. 16 (a)). The decrease in phospholipids and triacylglycerols coupled with an increase in their downstream catabolites indicates mitochondrial autophagy. In agreement, treatment of PC-3M cells with irinotecan increased protein expression of the mitochondrial autophagy-related marker LC3B-II (FIG. 14). Evaluation of mitochondrial morphology in PC-3M cells after acute (6 hours) treatment with irinotecan indicated loss of branched fusion-like mitochondrial structure and accumulation of punctate mitochondria co-located with lysosomes (fig. 17); these changes encountered an increase in the expression of Parkin and PINK1 proteins, further indicating an increase in mitochondrial autophagy. Previous reports indicate that ceramides target autophagosomes to mitochondria, inducing lethal mitochondrial autophagy. Notably, either the knockout of CAV1 or pretreatment with CAV-1 specific monoclonal antibodies (CAV-1 mAb) further sensitized PC-3M cells to elli-gracilirst, whereas overexpression of CAV-1 in LNCaP reduced the anti-cancer effect of elli-gracilirst (fig. 18).
Example 12: inhibition of RM-9 tumor growth by irinotecan
Next, the inhibition of tumor growth by irinotecan was examined. RM-9 cells contain driving oncogenic RAS and MYC genes that mimic RAS-MAPK pathway activation and MYC-driven transcriptional activity associated with invasive primary prostate cancer. RM-9-luciferase cells were subcutaneously implanted into C57BL/6N mice. RM-9 tumor growth was inhibited by irinotecan (FIG. 19 (a)), FIG. 19 (b) and FIG. 19 (c)). Metabonomics analysis of tumor tissue from all treatment groups showed that irinotecan was associated with a decrease in glycosphingolipids in mice bearing RM-9 tumors (fig. 19 (d)). Immunohistochemical analysis of tumor tissue indicated that treatment with irinotecan statistically significantly reduced Cav-1 and PCNA staining (double-sided Wilcoxon rank sum test, p:0.008 and 0.001, respectively), while BrdU-TUNEL and mitochondrial autophagy-related markers (LC 3B and HMGB 1) staining was statistically significantly increased (double-sided Wilcoxon rank sum test, p:0.008 (for all three markers)) (fig. 20). Notably, these results indicate that RM-9 tumors are associated with plasma lipid signatures, similar to those observed in prostate cancer patients, including several elevations of sphingomyelin and glycosphingolipids (fig. 20). Furthermore, plasma Cav-1 levels tended to be elevated in mice bearing RM-9 tumors compared to control mice. Interestingly, plasma levels of Cav-1 and the identified lipid species as part of the Cav-1 sphingolipid signature increased after treatment with irinotecan in mice bearing RM-9 tumors. Treatment with irinotecan also resulted in a statistically significant increase in RM-9 tumor bearing mice (double-sided Wilcoxon rank sum test, p: 0.004), suggesting that elevated plasma Cav-1 and sphingolipids may be the result of cell death (fig. 19 (a), fig. 19 (b) and fig. 19 (c)).
Example 13: calculation of biomarker scores
The measured concentrations of the plasma Cav-1-sphingolipid signature features were used to calculate biomarker scores based on a logistic regression model. In this model of prostate cancer progression, the values of the plasma analyte signature features are combined into a model suitable for predicting the risk of disease progression.
The following table shows the ratio between actual risk and baseline risk, as well as risk at different cut-off points of biomarker stack scores. Here, risk is defined as the risk of an event (i.e. disease progression) as a function of time, wherein a risk rate >1 means that the time of disease progression is shorter.
The table shows two things as a function of model scores. The first is the risk of progression of the calculated "baseline risk" relative to a given signature, and the second considers the use of the signature score as a classifier intercept; the last column gives the relative risk of disease progression between the high scoring group and the low scoring group, i.e. "risk ratio".
The first column of the table shows the biomarker stack scores in the active monitoring cohort, the second column depicts the change in actual risk from baseline risk, and the third column shows the risk ratio and corresponding 95% confidence interval, based on the bisection of the population using different cut-off points for the biomarker stack scores.
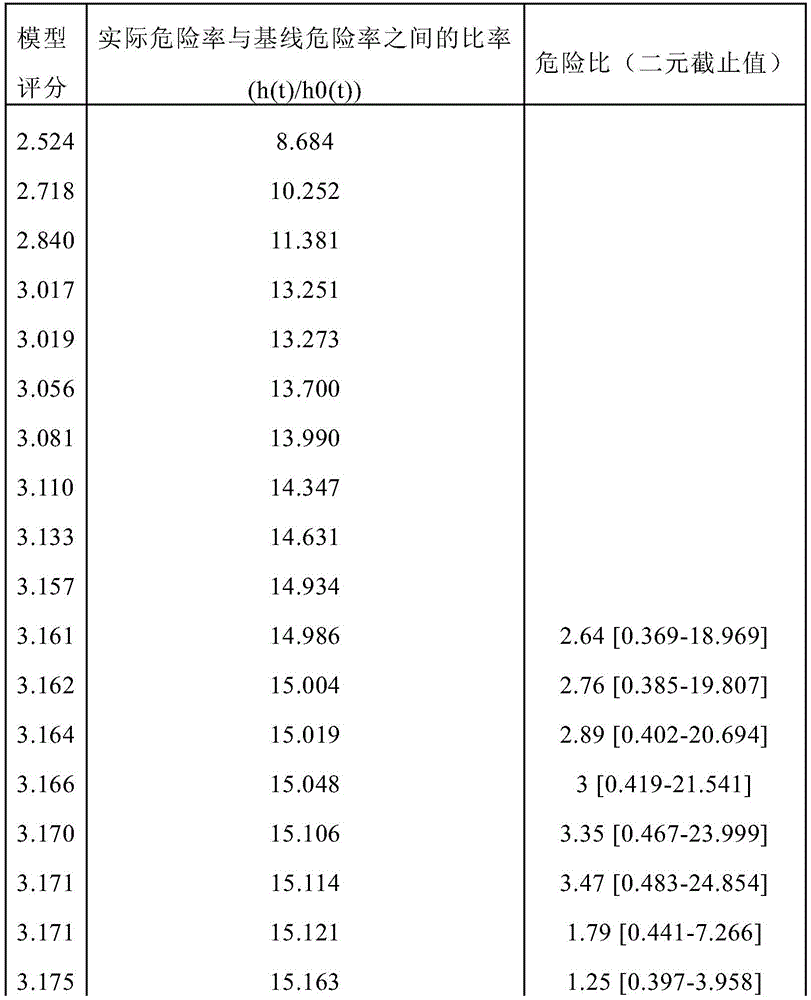


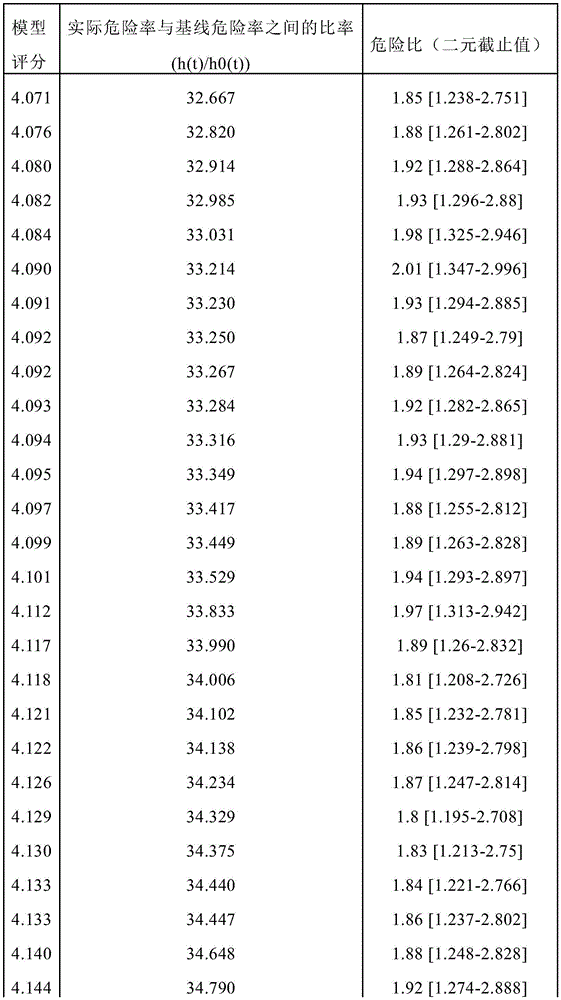


Example 14: verification study
To assess the risk of prostate cancer disease progression in men actively monitoring prostate cancer, an independent validation study was performed using a cohort of 248 participants (35 progressors, 213 non-progressors). Plasma sphingolipid signatures (SphingoSignature) (trioxaceramide (34:1), lactosylceramide (36:0), lactosylceramide (32:0), SM (44:2), SM (40:2)) and the levels of simplified sphingolipid signatures [ simplified signature, consisting of trioxaceramide (34:1), lactosylceramide (36:0) and SM (40:2) ] were tested in each participant. Cav-1 was not included in this analysis. The model is derived using the fixed coefficients of the logistic regression described previously.
Trihexosylceramide (34:1) and SM (40:2) were found in the cohort samples along with the simplified sphingolipid signature to have statistically significant odds ratios per unit increase, whereas trihexosylceramide (40:0) was unquantifiable (see figure 21).
Other embodiments
The detailed description set forth above is provided to assist those skilled in the art in practicing the present disclosure. However, the disclosure described and claimed herein is not to be limited in scope by the specific embodiments herein disclosed, as these embodiments are intended as illustrations of several aspects of the disclosure. Any equivalent embodiments are intended to be within the scope of this disclosure. Indeed, various modifications of the disclosure, in addition to those shown and described herein, will become apparent to those skilled in the art from the foregoing description without departing from the spirit or scope of the invention. Such modifications are also intended to fall within the scope of the appended claims.
Claims (49)
1. A method of:
classifying a subject suffering from prostate cancer as being at risk of developing invasive prostate cancer or not at risk of developing invasive prostate cancer,
predicting a susceptibility to invasive prostate cancer in a subject,
diagnosing invasive prostate cancer in a subject suffering from prostate cancer,
determining the risk of a subject suffering from invasive prostate cancer,
predicting the likelihood of progression of prostate cancer in a subject suffering from prostate cancer,
providing a prognosis for a subject suffering from prostate cancer, or
Selecting a subject suffering from prostate cancer for treatment with an anti-cancer therapy,
the method comprises the following steps:
(a) Measuring the level of caveolin-1 (CAV-1), sphingomyelin 40:2 (SM 40:2), sphingomyelin 44:2 (SM 44:2), lactoceramide 32:0 (LacCer 32:0), lactoceramide 36:0 (LacCer 36:0), trioxaceramide 34:1 (TriHexCer 34:1) and hexosylceramide 40:0 (HexCer 40:0) in a biological sample from the subject using an in vitro assay, and
(b) Comparing the levels of CAV-1, SM 40:2, SM 44:2, lacCer 32:0, lacCer36:0, triHexCer 34:1 and HexCer 40:0 in the sample with a reference,
Wherein the amount of change of CAV-1, SM 40:2, SM 44:2, lacCer 32:0, lacCer 36:0, triHexCer 34:1 and HexCer 40:0 relative to the reference provides an indication selected from the group consisting of:
an indication that the subject is at risk of developing invasive prostate cancer or is not at risk of developing invasive prostate cancer,
an indication of the subject's susceptibility to invasive prostate cancer,
an indication of the likelihood of progression of the prostate cancer in the subject,
an indication of progression-free survival of the subject,
-an indication of the possible outcome of the treatment of the prostate cancer, and
-the subject is an indication of a candidate for treatment with an anti-cancer therapy.
2. A method of:
classifying a subject suffering from prostate cancer as being at risk of developing invasive prostate cancer or not at risk of developing invasive prostate cancer,
predicting a susceptibility to invasive prostate cancer in a subject,
diagnosing invasive prostate cancer in a subject suffering from prostate cancer,
determining the risk of a subject suffering from invasive prostate cancer,
predicting the likelihood of progression of prostate cancer in a subject suffering from prostate cancer,
Providing a prognosis for a subject suffering from prostate cancer, or
Selecting a subject suffering from prostate cancer for treatment with an anti-cancer therapy,
the method comprises the following steps:
(a) Measuring the level of sphingomyelin 40:2 (SM 40:2), sphingomyelin 44:2 (SM 44:2), lactosylceramide 32:0 (LacCer 32:0), lactosylceramide 36:0 (LacCer 36:0) and trihexosylceramide 34:1 (TriHexCer 34:1) in a biological sample from the subject using an in vitro assay, and
(b) Comparing the levels of SM 40:2, SM 44:2, lacCer 32:0, lacCer 36:0 and TriHexCer34:1 in the sample to a reference,
wherein the amount of change of SM 40:2, SM 44:2, lacCer 32:0, lacCer 36:0 and TriHexCer34:1 relative to the reference provides an indication selected from the group consisting of:
an indication that the subject is at risk of developing invasive prostate cancer or is not at risk of developing invasive prostate cancer,
an indication of the subject's susceptibility to invasive prostate cancer,
an indication of the likelihood of progression of the prostate cancer in the subject,
an indication of progression-free survival of the subject,
-an indication of the possible outcome of the treatment of the prostate cancer, and
-the subject is an indication of a candidate for treatment with an anti-cancer therapy.
3. A method of:
classifying a subject suffering from prostate cancer as being at risk of developing invasive prostate cancer or not at risk of developing invasive prostate cancer,
predicting a susceptibility to invasive prostate cancer in a subject,
diagnosing invasive prostate cancer in a subject suffering from prostate cancer,
determining the risk of a subject suffering from invasive prostate cancer,
predicting the likelihood of progression of prostate cancer in a subject suffering from prostate cancer,
providing a prognosis for a subject suffering from prostate cancer, or
Selecting a subject suffering from prostate cancer for treatment with an anti-cancer therapy,
the method comprises the following steps:
(a) Measuring the levels of sphingomyelin 40:2 (SM 40:2), lactosylceramide 36:0 (LacCer 36:0) and trihexosylceramide 34:1 (TriHexCer 34:1) in a biological sample from the subject using an in vitro assay, and
(b) Comparing the levels of SM 40:2, lacCer 36:0 and TriHexCer 34:1 in the sample with a reference,
wherein the amount of change of SM 40:2, lacCer 36:0 and TriHexCer 34:1 relative to the reference provides an indication selected from the group consisting of:
an indication that the subject is at risk of developing invasive prostate cancer or is not at risk of developing invasive prostate cancer,
An indication of the subject's susceptibility to invasive prostate cancer,
an indication of the likelihood of progression of the prostate cancer in the subject,
an indication of progression-free survival of the subject,
-an indication of the possible outcome of the treatment of the prostate cancer, and
-the subject is an indication of a candidate for treatment with an anti-cancer therapy.
4. A method of:
classifying a subject suffering from prostate cancer as being at risk of developing invasive prostate cancer or not at risk of developing invasive prostate cancer,
predicting a susceptibility to invasive prostate cancer in a subject,
diagnosing invasive prostate cancer in a subject suffering from prostate cancer,
determining the risk of a subject suffering from invasive prostate cancer,
predicting the likelihood of progression of prostate cancer in a subject suffering from prostate cancer,
providing a prognosis for a subject suffering from prostate cancer, or
Selecting a subject suffering from prostate cancer for treatment with an anti-cancer therapy,
the method comprises the following steps:
(a) Measuring the level of trihexosylceramide 34:1 (TriHexCer 34:1) in a biological sample from the subject using an in vitro assay, and
(b) Comparing the level of TriHexCer 34:1 in the sample to a reference,
Wherein the amount of change of TriHexCer 34:1 relative to the reference provides an indication selected from the group consisting of:
an indication that the subject is at risk of developing invasive prostate cancer or is not at risk of developing invasive prostate cancer,
an indication of the subject's susceptibility to invasive prostate cancer,
an indication of the likelihood of progression of the prostate cancer in the subject,
an indication of progression-free survival of the subject,
-an indication of the possible outcome of the treatment of the prostate cancer, and
-the subject is an indication of a candidate for treatment with an anti-cancer therapy.
5. A method of:
classifying a subject suffering from prostate cancer as being at risk of developing invasive prostate cancer or not at risk of developing invasive prostate cancer,
predicting a susceptibility to invasive prostate cancer in a subject,
diagnosing invasive prostate cancer in a subject suffering from prostate cancer,
determining the risk of a subject suffering from invasive prostate cancer,
predicting the likelihood of progression of prostate cancer in a subject suffering from prostate cancer,
providing a prognosis for a subject suffering from prostate cancer, or
Selecting a subject suffering from prostate cancer for treatment with an anti-cancer therapy,
The method comprises the following steps:
(a) Measuring the level of sphingomyelin 40:2 (SM 40:2) in a biological sample from the subject using an in vitro assay, and
(b) Comparing the level of SM 40:2 in the sample to a reference,
wherein the amount of change of SM 40:2 relative to the reference provides an indication selected from the group consisting of:
an indication that the subject is at risk of developing invasive prostate cancer or is not at risk of developing invasive prostate cancer,
an indication of the subject's susceptibility to invasive prostate cancer,
an indication of the likelihood of progression of the prostate cancer in the subject,
an indication of progression-free survival of the subject,
-an indication of the possible outcome of the treatment of the prostate cancer, and
-the subject is an indication of a candidate for treatment with an anti-cancer therapy.
6. A method of:
classifying a subject suffering from prostate cancer as being at risk of developing invasive prostate cancer or not at risk of developing invasive prostate cancer,
predicting a susceptibility to invasive prostate cancer in a subject,
diagnosing invasive prostate cancer in a subject suffering from prostate cancer,
determining the risk of a subject suffering from invasive prostate cancer,
Predicting the likelihood of progression of prostate cancer in a subject suffering from prostate cancer,
providing a prognosis for a subject suffering from prostate cancer, or
Selecting a subject suffering from prostate cancer for treatment with an anti-cancer therapy,
the method comprises the following steps:
(a) Measuring the level of the following in a biological sample from the subject using an in vitro assay:
sphingomyelin 40:2 (SM 40:2), lactosylceramide 36:0 (LacCer 36:0), and trihexosylceramide 34:1; and/or
-triohexosylceramide 34:1; and/or
Sphingomyelin 40:2 (SM 40:2), and
(b) Comparing the level of SM 40:2 in the sample to a reference,
wherein the amount of change of SM 40:2 relative to the reference provides an indication selected from the group consisting of:
an indication that the subject is at risk of developing invasive prostate cancer or is not at risk of developing invasive prostate cancer,
an indication of the subject's susceptibility to invasive prostate cancer,
an indication of the likelihood of progression of the prostate cancer in the subject,
an indication of progression-free survival of the subject,
-an indication of the possible outcome of the treatment of the prostate cancer, and
the subject is an indication of a candidate for treatment with an anti-cancer therapy.
7. The method of any one of claims 1-6, wherein the subject has prostate cancer.
8. The method of any one of claims 1-6, wherein the subject's Prostate Cancer Antigen (PCA) level test is positive, indicating that he has prostate cancer.
9. The method of any one of claims 1-6, wherein the subject is undergoing active monitoring (AS) of disease progression.
10. The method of any one of claims 1-6, wherein the subject has been classified as having clinically low risk early stage prostate cancer, is undergoing active monitoring, and exhibits early Disease Progression (DP) or painless disease.
11. The method of any one of claims 1-6, wherein the subject is not receiving treatment for the prostate cancer.
12. The method of any one of claims 1-11, wherein the level of CAV-1, SM 40:2, SM 44:2, lacCer 32:0, lacCer 36:0, triHexCer 34:1, and/or HexCer 40:0 is increased in the subject relative to a healthy subject.
13. The method of any one of claims 1-11, wherein the level of CAV-1, SM 40:2, SM 44:2, lacCer 32:0, lacCer 36:0, triHexCer 34:1, and/or HexCer 40:0 is elevated compared to the level in a reference subject or group not suffering from invasive prostate cancer.
14. The method of any one of claims 1-11, wherein the level of CAV-1, SM 40:2, SM44:2, lacCer 32:0, lacCer 36:0, triHexCer 34:1, and/or HexCer 40:0 is elevated compared to the level in a reference subject or group having indolent prostate cancer.
15. The method of any one of claims 1-14, wherein the CAV-1, SM 40:2, SM44:2, lacCer 32:0, lacCer 36:0, triHexCer 34:1 and/or HexCer 40:0 measurements are performed by UV-visible spectrum, mass spectrum, nuclear Magnetic Resonance (NMR) spectrum, proton NMR spectrum, nuclear Magnetic Resonance (NMR) spectrum, gas chromatography-mass spectrum (GC-MS), liquid chromatography-mass spectrum (LC-MS), high Performance Liquid Chromatography (HPLC), ultra-high performance liquid chromatography (UPLC), liquid chromatography-mass spectrum (LC-MS), correlation spectrum (COSy), nuclear-ohhaos effect spectrum (NOESY), rotating coordinate system nuclear ohhaos effect spectrum (ROESY), LC-TOF-MS, LC-MS/MS and capillary electrophoresis-mass spectrum.
16. The method of claim 15, wherein the measurement of CAV-1, SM 40:2, SM44:2, lacCer 32:0, lacCer 36:0, triHexCer 34:1, and/or HexCer 40:0 is performed by High Performance Liquid Chromatography (HPLC), ultra-high performance liquid chromatography (UPLC), or liquid chromatography-mass spectrometry (LC-MS).
17. The method of any one of claims 1-16, wherein the biological sample is selected from serum and plasma.
18. The method of claim 17, wherein the biological sample comprises a fraction of the sample enriched for Extracellular Vesicles (EVs).
19. The method of any one of claims 1-18, wherein the measurements of CAV-1, SM 40:2, SM 44:2, lacCer 32:0, lacCer 36:0, triHexCer34:1, and/or HexCer 40:0 are performed substantially simultaneously.
20. The method of any one of claims 1-19, wherein the measurement of CAV-1, SM 40:2, SM 44:2, lacCer 32:0, lacCer 36:0, triHexCer34:1, and/or HexCer 40:0 is performed in a stepwise manner.
21. The method of any one of claims 1-20, wherein
a) If the level of CAV-1, SM 40:2, SM 44:2, lacCer 32:0, lacCer 36:0, triHexCer34:1 and/or HexCer 40:0 is equal to or higher than a cutoff value of 4.33 as calculated by a multivariate Cox proportional risk model, for example, in a multivariate analysis, then the subject:
classified or should be classified as being at risk of developing invasive prostate cancer,
has a susceptibility to invasive prostate cancer,
will undergo progression of the prostate cancer,
Does not experience a progression free lifetime,
may not respond to the treatment of the prostate cancer, or
-is a candidate for treatment with an anti-cancer therapy; or (b)
b) If the level of CAV-1, SM 40:2, SM 44:2, lacCer 32:0, lacCer 36:0, triHexCer34:1 and/or HexCer 40:0 is below a cutoff value of 4.33 as calculated by the multivariate Cox proportional risk model, then the subject:
not classified or should not be classified as being at risk of developing invasive prostate cancer,
no susceptibility to invasive prostate cancer,
does not undergo progression of the prostate cancer,
will experience a progression-free lifetime,
possibly responsive to the treatment of the prostate cancer, or
Are not candidates for treatment with anti-cancer therapies.
22. The method of any one of claims 1-20, wherein if the level of CAV-1, SM 40:2, SM 44:2, lacCer 32:0, lacCer 36:0, triHexCer34:1, and/or HexCer 40:0 is equal to or higher than a cutoff value of 4.33 as calculated by a multivariate Cox proportional hazards model, the subject:
classified or should be classified as being at risk of developing invasive prostate cancer,
has a susceptibility to invasive prostate cancer,
Will undergo progression of the prostate cancer,
does not experience a progression free lifetime,
may not respond to the treatment of the prostate cancer, or
Are candidates for treatment with anti-cancer therapies.
23. The method of any one of claims 1-20, wherein if the level of CAV-1, SM 40:2, SM 44:2, lacCer 32:0, lacCer 36:0, triHexCer 34:1, and/or HexCer 40:0 is below a cutoff value of 4.33 as calculated by a multivariate Cox proportional hazards model, the subject:
not classified or should not be classified as being at risk of developing invasive prostate cancer,
no susceptibility to invasive prostate cancer,
does not undergo progression of the prostate cancer,
will experience a progression-free lifetime,
possibly responsive to the treatment of the prostate cancer, or
Are not candidates for treatment with anti-cancer therapies.
24. The method of any one of claims 21-23, wherein the multivariate analysis is adjusted for age, 5-alpha reductase treatment, and baseline tumor volume.
25. The method of claim 24, wherein the backwards step selection (likelihood ratio) is adjusted for age, 5-alpha reductase treatment, and baseline tumor volume.
26. The method of any one of claims 1-25, wherein the method is a method of classifying a subject having prostate cancer as being at risk of developing invasive prostate cancer or not being at risk of developing invasive prostate cancer.
27. The method of any one of claims 1-25, wherein the method is a method of predicting susceptibility to invasive prostate cancer in a subject.
28. The method of any one of claims 1-25, wherein the method is a method of diagnosing invasive prostate cancer in a subject with prostate cancer.
29. The method of any one of claims 1-25, wherein the method is a method of predicting the likelihood of progression of prostate cancer in a subject having prostate cancer.
30. The method of any one of claims 1-25, wherein the method is a method of providing a prognosis for a subject having prostate cancer.
31. The method of any one of claims 1-30, wherein the method is a method of selecting a subject with prostate cancer for treatment with an anti-cancer therapy.
32. A diagnostic kit for invasive prostate cancer comprising caveolin-1 (CAV-1), sphingomyelin 40:2 (SM 40:2), sphingomyelin 44:2 (SM 44:2), lactoceramide 32:0 (LacCer 32:0), lactoceramide 36:0 (LacCer 36:0), trioxaceramide 34:1 (TriHexCer 34:1) and hexosylceramide 40:0 (HexCer 40:0).
33. A diagnostic kit for invasive prostate cancer comprising sphingomyelin 40:2 (SM 40:2), sphingomyelin 44:2 (SM 44:2), lactosylceramide 32:0 (LacCer 32:0), lactosylceramide 36:0 (LacCer 36:0) and trihexyphosphamide 34:1 (TriHexCer 34:1).
34. A diagnostic kit for invasive prostate cancer comprising sphingomyelin 40:2 (SM 40:2), lactosylceramide 36:0 (LacCer 36:0) and trihexosylceramide 34:1 (TriHexCer 34:1).
35. A diagnostic kit for invasive prostate cancer comprising trioxalycemic ceramide 34:1 (TriHexCer 34:1).
36. A diagnostic kit for invasive prostate cancer comprising sphingomyelin 40:2 (SM 40:2).
37. A diagnostic kit for invasive prostate cancer comprising:
sphingomyelin 40:2 (SM 40:2), lactosylceramide 36:0 (LacCer 36:0), and trihexosylceramide 34:1; and/or
Trihexosylceramide 34:1; and/or
Sphingomyelin 40:2 (SM 40:2).
38. A method of treating or preventing prostate cancer progression in a subject, wherein the cellular protein
-elevated levels of 1 (CAV-1), sphingomyelin 40:2 (SM 40:2), sphingomyelin 44:2 (SM 44:2), lactoceramide 32:0 (LacCer 32:0), lactoceramide 36:0 (LacCer 36:0), trioxaceramide 34:1 and hexosylceramide 40:0 relative to a reference not suffering from prostate cancer, the method comprising one or more of:
-administering an anti-cancer drug to the subject suffering from prostate cancer;
-administering therapeutic radiation to the subject suffering from prostate cancer; and
-surgery to partially or completely surgically resect cancerous tissue in the subject with prostate cancer.
39. A method of treating or preventing prostate cancer progression in a subject, wherein the levels of sphingomyelin 40:2 (SM 40:2), sphingomyelin 44:2 (SM 44:2), lactosylceramide 32:0 (LacCer 32:0), lactosylceramide 36:0 (LacCer 36:0) and trihexosylceramide 34:1 are elevated relative to a reference not suffering from prostate cancer, the method comprising one or more of:
-administering an anti-cancer drug to the subject suffering from prostate cancer;
-administering therapeutic radiation to the subject suffering from prostate cancer; and
-surgery to partially or completely surgically resect cancerous tissue in the subject with prostate cancer.
40. A method of treating or preventing prostate cancer progression in a subject, wherein the levels of sphingomyelin 40:2 (SM 40:2), lactosylceramide 36:0 (LacCer 36:0) and trihexosylceramide 34:1 are elevated relative to a reference not suffering from prostate cancer, the method comprising one or more of:
-administering an anti-cancer drug to the subject suffering from prostate cancer;
-administering therapeutic radiation to the subject suffering from prostate cancer; and
-surgery to partially or completely surgically resect cancerous tissue in the subject with prostate cancer.
41. A method of treating or preventing prostate cancer progression in a subject, wherein the level of trihexosylceramide 34:1 is increased relative to a reference not suffering from prostate cancer, the method comprising one or more of:
-administering an anti-cancer drug to the subject suffering from prostate cancer;
-administering therapeutic radiation to the subject suffering from prostate cancer; and
-surgery to partially or completely surgically resect cancerous tissue in the subject with prostate cancer.
42. A method of treating or preventing prostate cancer progression in a subject, wherein sphingomyelin 40:2 (SM 40:2) levels are elevated relative to a reference that is not afflicted with prostate cancer, the method comprising one or more of:
-administering an anti-cancer drug to the subject suffering from prostate cancer;
-administering therapeutic radiation to the subject suffering from prostate cancer; and
-surgery to partially or completely surgically resect cancerous tissue in the subject with prostate cancer.
43. A method of treating or preventing prostate cancer progression in a subject, wherein:
(a) Sphingomyelin 40:2 (SM 40:2), lactosylceramide 36:0 (LacCer 36:0), and trihexosylceramide 34:1; and/or
(b) Trihexosylceramide 34:1; and/or
(c) Sphingomyelin 40:2 (SM 40:2) is elevated relative to a reference not suffering from prostate cancer, the method comprising one or more of:
-administering an anti-cancer drug to the subject suffering from prostate cancer;
-administering therapeutic radiation to the subject suffering from prostate cancer; and
-surgery to partially or completely surgically resect cancerous tissue in the subject with prostate cancer.
44. The method of any one of claims 38-43, wherein there is an elevation in nidogen-1 (CAV-1), sphingomyelin 40:2 (SM 40:2), sphingomyelin 44:2 (SM 44:2), lactoceramide 32:0 (LacCer 32:0), lactoceramide 36:0 (LacCer 36:0), trioxaco-ceramide 34:1, and hexose-ceramide 40:0 relative to a reference that does not have prostate cancer.
45. The method of any one of claims 38-43, comprising administering at least one anti-cancer drug to the subject having prostate cancer.
46. The method of any one of claims 38-43, wherein the one or more anti-cancer drugs are selected from a glucosylceramide synthase inhibitor, a Cav-1 inhibitor, or a combination of both.
47. The method of claim 46, wherein the Cav-1 inhibitor is an anti-Cav-1 monoclonal antibody.
48. The method of claim 46, wherein the glucosylceramide synthase inhibitor is irinotecan.
49. The method according to any one of claims 38 to 43, comprising, as a preceding step, using the method according to any one of claims 1 to 26 or the diagnostic kit according to claim 27,
classifying a subject suffering from prostate cancer as being at risk of developing invasive prostate cancer or not at risk of developing invasive prostate cancer,
predicting a susceptibility to invasive prostate cancer in a subject,
diagnosing invasive prostate cancer in a subject suffering from prostate cancer,
determining the risk of a subject suffering from invasive prostate cancer,
predicting the likelihood of progression of prostate cancer in a subject suffering from prostate cancer,
providing a prognosis for a subject suffering from prostate cancer, or
-selecting a subject suffering from prostate cancer for treatment with an anti-cancer therapy.
Applications Claiming Priority (5)
| Application Number | Priority Date | Filing Date | Title |
|---|---|---|---|
| US202063049521P | 2020-07-08 | 2020-07-08 | |
| US63/049,521 | 2020-07-08 | ||
| US202063067601P | 2020-08-19 | 2020-08-19 | |
| US63/067,601 | 2020-08-19 | ||
| PCT/US2021/040812 WO2022011093A1 (en) | 2020-07-08 | 2021-07-08 | Methods for the detection and treatment of prostate cancer |
Publications (1)
| Publication Number | Publication Date |
|---|---|
| CN116097095A true CN116097095A (en) | 2023-05-09 |
Family
ID=79552184
Family Applications (1)
| Application Number | Title | Priority Date | Filing Date |
|---|---|---|---|
| CN202180053255.2A Pending CN116097095A (en) | 2020-07-08 | 2021-07-08 | Methods for detecting and treating prostate cancer |
Country Status (5)
| Country | Link |
|---|---|
| US (1) | US20230358751A1 (en) |
| EP (1) | EP4388312A4 (en) |
| JP (1) | JP2023533959A (en) |
| CN (1) | CN116097095A (en) |
| WO (1) | WO2022011093A1 (en) |
Families Citing this family (2)
| Publication number | Priority date | Publication date | Assignee | Title |
|---|---|---|---|---|
| DE102023125866A1 (en) * | 2023-09-25 | 2025-04-10 | Numares Ag | Use of a marker set to determine the aggressiveness of a prostate tumor |
| WO2025151351A1 (en) * | 2024-01-10 | 2025-07-17 | Board Of Regents, The University Of Texas System | A prognostic blood-based sphingolipid panel for men with localized prostate cancer followed on active surveillance |
Family Cites Families (5)
| Publication number | Priority date | Publication date | Assignee | Title |
|---|---|---|---|---|
| BR9912501A (en) * | 1998-06-29 | 2001-05-02 | Los Angeles Childrens Hospital | Treatment of hyperproliferative disorders |
| WO2008067065A2 (en) * | 2006-10-19 | 2008-06-05 | Shiv Srivastava | Methods, kits, and systems for diagnosing and prognosing prostate cancer using secreted biomarkers |
| EP2804001B1 (en) * | 2009-06-04 | 2017-08-09 | Metanomics Health GmbH | Methods for diagnosing prostate carcinomas |
| WO2014026157A2 (en) * | 2012-08-10 | 2014-02-13 | Cedars-Sinai Medical Center | Methionine metabolites predict aggressive cancer progression |
| WO2014045087A1 (en) * | 2012-09-20 | 2014-03-27 | Oslo Universitetssykehus Hf | Prostate cancer markers and uses thereof |
-
2021
- 2021-07-08 CN CN202180053255.2A patent/CN116097095A/en active Pending
- 2021-07-08 WO PCT/US2021/040812 patent/WO2022011093A1/en not_active Ceased
- 2021-07-08 JP JP2023500986A patent/JP2023533959A/en active Pending
- 2021-07-08 EP EP21836896.7A patent/EP4388312A4/en active Pending
-
2022
- 2022-12-22 US US18/145,602 patent/US20230358751A1/en active Pending
Also Published As
| Publication number | Publication date |
|---|---|
| JP2023533959A (en) | 2023-08-07 |
| EP4388312A1 (en) | 2024-06-26 |
| WO2022011093A1 (en) | 2022-01-13 |
| EP4388312A4 (en) | 2025-11-05 |
| US20230358751A1 (en) | 2023-11-09 |
Similar Documents
| Publication | Publication Date | Title |
|---|---|---|
| US11493516B2 (en) | Biomarkers for assessing breast cancer | |
| AU2017201020B2 (en) | Means and methods for diagnosing pancreatic cancer in a subject | |
| JP2017129592A (en) | Lipidome biomarkers to identify high-risk patients with coronary artery disease | |
| JP2013527449A (en) | Lipidome biomarkers for atherosclerosis and cardiovascular disease | |
| JP2025118850A (en) | Methods for the detection and treatment of pancreatic ductal adenocarcinoma | |
| JP2017504011A (en) | Means and methods for diagnosing pancreatic cancer in a subject based on a metabolite panel | |
| Liu et al. | Discovery of lipid profiles in plasma‐derived extracellular vesicles as biomarkers for breast cancer diagnosis | |
| US20230358751A1 (en) | Methods for the detection and treatment of prostate cancer | |
| CN108473529B (en) | Methods for detecting and treating pulmonary hypertension | |
| Sun et al. | Characterization of the liver tissue interstitial fluid (TIF) proteome indicates potential for application in liver disease biomarker discovery | |
| Banerjee et al. | Recent contributions of mass spectrometry-based “omics” in the studies of breast cancer | |
| Yanlan et al. | A multi-omics approach based on 1H-NMR metabonomics combined with target protein analysis to reveal the mechanism of RIAISs on cervical carcinoma patients | |
| WO2025177228A2 (en) | Prostate cancer biomarkers, uses and methods thereof | |
| JPWO2017069135A1 (en) | Diagnostic markers for coronary artery disease | |
| JP2025515256A (en) | Mass spectrometry for cancer diagnosis | |
| CN119147658A (en) | A set of markers for breast cancer diagnosis | |
| WO2021245413A1 (en) | Methods of determining cancer | |
| EP3649472A1 (en) | Methods for detecting ovarian cancer | |
| Liu | A multi-omics approach based on 1H-NMR metabonomics combined with target protein analysis to reveal the mechanism of RIAISs on cervical carcinoma patients | |
| US20100291690A1 (en) | Methods for detecting or monitoring cancer using lpc as a marker |
Legal Events
| Date | Code | Title | Description |
|---|---|---|---|
| PB01 | Publication | ||
| PB01 | Publication | ||
| SE01 | Entry into force of request for substantive examination | ||
| SE01 | Entry into force of request for substantive examination |