CN115202163B - Method, apparatus and computer readable storage medium for selecting a photoresist model - Google Patents
Method, apparatus and computer readable storage medium for selecting a photoresist model Download PDFInfo
- Publication number
- CN115202163B CN115202163B CN202211118599.XA CN202211118599A CN115202163B CN 115202163 B CN115202163 B CN 115202163B CN 202211118599 A CN202211118599 A CN 202211118599A CN 115202163 B CN115202163 B CN 115202163B
- Authority
- CN
- China
- Prior art keywords
- signal
- type
- effect
- value
- signals
- Prior art date
- Legal status (The legal status is an assumption and is not a legal conclusion. Google has not performed a legal analysis and makes no representation as to the accuracy of the status listed.)
- Active
Links
Images


Classifications
-
- G—PHYSICS
- G03—PHOTOGRAPHY; CINEMATOGRAPHY; ANALOGOUS TECHNIQUES USING WAVES OTHER THAN OPTICAL WAVES; ELECTROGRAPHY; HOLOGRAPHY
- G03F—PHOTOMECHANICAL PRODUCTION OF TEXTURED OR PATTERNED SURFACES, e.g. FOR PRINTING, FOR PROCESSING OF SEMICONDUCTOR DEVICES; MATERIALS THEREFOR; ORIGINALS THEREFOR; APPARATUS SPECIALLY ADAPTED THEREFOR
- G03F7/00—Photomechanical, e.g. photolithographic, production of textured or patterned surfaces, e.g. printing surfaces; Materials therefor, e.g. comprising photoresists; Apparatus specially adapted therefor
- G03F7/70—Microphotolithographic exposure; Apparatus therefor
- G03F7/70425—Imaging strategies, e.g. for increasing throughput or resolution, printing product fields larger than the image field or compensating lithography- or non-lithography errors, e.g. proximity correction, mix-and-match, stitching or double patterning
- G03F7/70433—Layout for increasing efficiency or for compensating imaging errors, e.g. layout of exposure fields for reducing focus errors; Use of mask features for increasing efficiency or for compensating imaging errors
- G03F7/70441—Optical proximity correction [OPC]
-
- G—PHYSICS
- G03—PHOTOGRAPHY; CINEMATOGRAPHY; ANALOGOUS TECHNIQUES USING WAVES OTHER THAN OPTICAL WAVES; ELECTROGRAPHY; HOLOGRAPHY
- G03F—PHOTOMECHANICAL PRODUCTION OF TEXTURED OR PATTERNED SURFACES, e.g. FOR PRINTING, FOR PROCESSING OF SEMICONDUCTOR DEVICES; MATERIALS THEREFOR; ORIGINALS THEREFOR; APPARATUS SPECIALLY ADAPTED THEREFOR
- G03F7/00—Photomechanical, e.g. photolithographic, production of textured or patterned surfaces, e.g. printing surfaces; Materials therefor, e.g. comprising photoresists; Apparatus specially adapted therefor
- G03F7/70—Microphotolithographic exposure; Apparatus therefor
- G03F7/70425—Imaging strategies, e.g. for increasing throughput or resolution, printing product fields larger than the image field or compensating lithography- or non-lithography errors, e.g. proximity correction, mix-and-match, stitching or double patterning
- G03F7/70433—Layout for increasing efficiency or for compensating imaging errors, e.g. layout of exposure fields for reducing focus errors; Use of mask features for increasing efficiency or for compensating imaging errors
-
- G—PHYSICS
- G06—COMPUTING OR CALCULATING; COUNTING
- G06F—ELECTRIC DIGITAL DATA PROCESSING
- G06F30/00—Computer-aided design [CAD]
- G06F30/30—Circuit design
- G06F30/39—Circuit design at the physical level
- G06F30/398—Design verification or optimisation, e.g. using design rule check [DRC], layout versus schematics [LVS] or finite element methods [FEM]
Landscapes
- Engineering & Computer Science (AREA)
- Physics & Mathematics (AREA)
- General Physics & Mathematics (AREA)
- Computer Hardware Design (AREA)
- Theoretical Computer Science (AREA)
- Evolutionary Computation (AREA)
- Geometry (AREA)
- General Engineering & Computer Science (AREA)
- Exposure And Positioning Against Photoresist Photosensitive Materials (AREA)
Abstract
本发明涉及半导体制造技术领域,并且更具体地,涉及选择光阻模型的方法、设备和计算机可读存储介质。该方法包括:收集光阻模型在掩模版图上的采样位置;获得采样位置上多种类型信号的信号量;针对每一类型的信号,根据信号量和采样位置的坐标获得效应信号;基于所获得的效应信号,计算该类型的信号的总信号值;基于每一类型的信号的总信号值,计算该类型的信号的效应贡献占比;根据效应贡献占比选择光阻模型。本发明的实施例能够有效地分析各类信号的效应贡献占比利于用户分析当前模型的行为,迭代获得更优的模型。

The present invention relates to the technical field of semiconductor manufacturing, and more particularly, to a method, device and computer-readable storage medium for selecting a photoresist model. The method includes: collecting the sampling position of the photoresist model on the mask layout; obtaining signal quantities of multiple types of signals at the sampling positions; for each type of signal, obtaining effect signals according to the signal quantities and the coordinates of the sampling positions; Calculate the total signal value of this type of signal based on the obtained effect signal; calculate the effect contribution ratio of this type of signal based on the total signal value of each type of signal; select the photoresist model according to the effect contribution ratio. The embodiments of the present invention can effectively analyze the effect contribution proportions of various signals, which is beneficial for the user to analyze the behavior of the current model, and iteratively obtain a better model.
Description
技术领域technical field
本发明的实施例主要涉及半导体制造技术领域,并且更具体地,涉及选择光阻模型的方法、设备和计算机可读存储介质。Embodiments of the present invention mainly relate to the technical field of semiconductor manufacturing, and more particularly, to a method, device and computer-readable storage medium for selecting a photoresist model.
背景技术Background technique
OPC(光学邻近校正)是一种光刻增强技术,OPC主要在半导体芯片的生产过程中使用,目的是为了保证曝光后硅片上得到的实际图形与设计图形一致。若不做OPC光学邻近修正实际曝光后得到的图形将与设计图形有显著差异,如实际线宽度比设计的窄或宽,这些都可以通过改变掩模版来补偿成像;其他的失真,如圆角、光强度,受光学工具分辨率的制约,更加难以弥补。这些失真如果不纠正,可能大大改变生产出来的电路的电气性能。OPC光学邻近修正通过移动掩模版上图形的边缘或添加额外的多边形来补偿这些失真。OPC (Optical Proximity Correction) is a lithography enhancement technology. OPC is mainly used in the production process of semiconductor chips. The purpose is to ensure that the actual graphics obtained on the silicon wafer after exposure are consistent with the design graphics. If OPC optical proximity correction is not performed, the actual exposure graphics will be significantly different from the design graphics, such as the actual line width is narrower or wider than the design, these can be compensated for imaging by changing the mask; other distortions, such as rounded corners , Light intensity, restricted by the resolution of optical tools, it is even more difficult to compensate. These distortions, if not corrected, can significantly alter the electrical performance of the produced circuit. OPC optical proximity correction compensates for these distortions by moving the edges of the pattern on the reticle or adding additional polygons.
OPC光阻模型,会模拟光刻机中发生的一系列光学效应和光阻效应。其中,光阻效应还分为物理/化学等多个不同的效应,分别存在对应的效应信号。在这些效应的共同作用下,OPC光阻模型得以尽可能仿真光刻机中,从光源到掩模,过棱镜,进光阻的整个过程的实际行为。然而,在现有技术中,各个效应在总效应中的占比分成并不能直观地展示给用户。对用户来说,各个效应在总效应中的占比完全是未知的,这非常不利于用户分析当前模型的行为,迭代获得更优模型,掌握积累各个效应的相关经验。The OPC photoresist model simulates a series of optical effects and photoresist effects that occur in the lithography machine. Among them, the photoresistance effect is also divided into multiple different effects such as physics/chemistry, and there are corresponding effect signals respectively. Under the combined effect of these effects, the OPC photoresist model can simulate the actual behavior of the entire process from the light source to the mask, through the prism, and into the photoresist in the lithography machine as much as possible. However, in the prior art, the proportion of each effect in the total effect cannot be displayed intuitively to the user. For users, the proportion of each effect in the total effect is completely unknown, which is very unfavorable for users to analyze the behavior of the current model, iteratively obtain a better model, and master and accumulate relevant experience of each effect.
发明内容Contents of the invention
根据本发明的示例性实施例,提供了一种用于选择光阻模型的方案。According to an exemplary embodiment of the present invention, a scheme for selecting a photoresist model is provided.
在本发明的第一方面中,提供了一种选择光阻模型的方法,该方法包括:收集光阻模型在掩模版图上的采样位置;获得采样位置上多种类型信号的信号量;针对每一类型的信号,根据信号量和采样位置的坐标获得效应信号;基于所获得的效应信号,计算该类型的信号的总信号值;基于每一类型的信号的总信号值,计算该类型的信号的效应贡献占比;根据效应贡献占比选择光阻模型。In the first aspect of the present invention, a method for selecting a photoresist model is provided, the method includes: collecting the sampling positions of the photoresist model on the mask layout; obtaining signal quantities of various types of signals at the sampling positions; For each type of signal, the effect signal is obtained according to the signal quantity and the coordinates of the sampling position; based on the obtained effect signal, the total signal value of this type of signal is calculated; based on the total signal value of each type of signal, the The effect contribution ratio of the signal; select the photoresist model according to the effect contribution ratio.
在本发明的第二方面中,提供了一种电子设备,包括:处理器;以及与处理器耦合的存储器,存储器具有存储于其中的指令,该指令在被处理器执行时使设备执行动作。这些动作包括:收集光阻模型在掩模版图上的采样位置;获得采样位置上的多种类型信号的信号量;针对每一类型的信号,根据信号量和采样位置的坐标获得效应信号;基于所获得的效应信号,计算该类型的信号的总信号值;基于每一类型的信号的总信号值,计算该类型的信号的效应贡献占比;根据效应贡献占比选择光阻模型。In a second aspect of the invention there is provided an electronic device comprising: a processor; and a memory coupled to the processor, the memory having instructions stored therein which when executed by the processor cause the device to perform actions. These actions include: collecting the sampling position of the photoresist model on the mask layout; obtaining the semaphore of multiple types of signals at the sampling position; for each type of signal, obtaining the effect signal according to the semaphore and the coordinates of the sampling position; based on Calculate the total signal value of this type of signal based on the obtained effect signal; calculate the effect contribution ratio of this type of signal based on the total signal value of each type of signal; select a photoresist model according to the effect contribution ratio.
在本发明的第三方面中,提供了一种计算机可读存储介质,其上存储有计算机程序,该计算机程序在被处理器执行时实现根据本发明的第一方面的方法。In a third aspect of the present invention there is provided a computer readable storage medium having stored thereon a computer program which, when executed by a processor, implements the method according to the first aspect of the present invention.
在一些实施例中,根据效应贡献占比选择光阻模型包括:确定多种类型信号中的目标信号;基于该目标信号的效应贡献占比,选择光阻模型。In some embodiments, selecting the photoresist model according to the effect contribution ratio includes: determining a target signal among multiple types of signals; and selecting the photoresist model based on the effect contribution ratio of the target signal.
在一些实施例中,基于目标信号的效应贡献占比,选择光阻模型,包括:在目标信号的效应贡献占比大于或等于第一预设阈值时,选择光阻模型。In some embodiments, selecting the photoresist model based on the effect contribution ratio of the target signal includes: selecting the photoresist model when the effect contribution ratio of the target signal is greater than or equal to a first preset threshold.
在另一些可替换的实施例中,基于目标信号的效应贡献占比,选择光阻模型,包括:In other alternative embodiments, the photoresist model is selected based on the effect contribution ratio of the target signal, including:
基于以下公式:Based on the following formula:

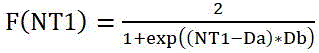
以目标信号的效应贡献占比为输入值,计算预设函数的函数值;在该函数值小于或等于第二预设阈值时,选择光阻模型,其中,Rmse为均方根误差,是光阻模型在每一采样位置的关键尺寸仿真值与历史真值的偏差的平方和与采样次数的比值的平方根;Rmse_weight为均方根误差权重;NT1为目标信号的效应贡献占比,Da和Db为预设的常数,F(NT1)为指数函数,F(NT1)_weight为指数函数的权重。Taking the effect contribution ratio of the target signal as the input value, calculate the function value of the preset function; when the function value is less than or equal to the second preset threshold, select the photoresist model, where Rmse is the root mean square error, which is the light The square root of the ratio of the square sum of the deviation between the simulation value of the key dimension of the resistance model at each sampling position and the historical true value and the sampling number; Rmse_weight is the root mean square error weight; NT1 is the effect contribution ratio of the target signal, Da and Db is a preset constant, F(NT1) is an exponential function, and F(NT1)_weight is the weight of the exponential function.
在一些实施例中,针对每一类型的信号,根据信号量和采样位置获得效应信号包括:确定采样位置的两端的关键尺寸(CD)位置的位置坐标;基于所确定的位置坐标和每一类型的信号的信号量,形成与该类型的信号对应的三维信号量矩阵;基于每一三维信号量矩阵,获得该类型的信号对应采样位置的效应信号。In some embodiments, for each type of signal, obtaining the effect signal according to the semaphore and the sampling position includes: determining position coordinates of critical dimension (CD) positions at both ends of the sampling position; based on the determined position coordinates and each type A three-dimensional semaphore matrix corresponding to the signal of the type is formed; based on each three-dimensional semaphore matrix, the effect signal corresponding to the sampling position of the signal of the type is obtained.
在一些实施例中,基于所确定的位置坐标和每一类型的信号的信号量,形成与该类型的信号对应的三维信号量矩阵,包括:获得采样位置的关键尺寸(CD)的中心位置;基于中心位置形成矩形的矩阵范围;等间距划分所述矩阵范围,形成多个参考点坐标;基于每一类型的信号,获取与多个参考点坐标对应的信号量;基于所获取的信号量和矩阵范围形成该类型的信号的三维信号量矩阵。In some embodiments, based on the determined position coordinates and the semaphore of each type of signal, forming a three-dimensional semaphore matrix corresponding to the type of signal includes: obtaining a central position of a critical dimension (CD) of the sampling location; Forming a rectangular matrix range based on the central position; dividing the matrix range at equal intervals to form a plurality of reference point coordinates; based on each type of signal, obtaining semaphore corresponding to the plurality of reference point coordinates; based on the acquired semaphore and The matrix range forms a three-dimensional semaphore matrix for signals of that type.
在一个优先的实施例中,基于每一三维信号量矩阵,获得该类型的信号对应采样位置的效应信号,包括:对于每一采样位置,通过插值算法基于参考点坐标进行插值拟合,以获得采样位置的两端分别对应的信号量;以该两端分别对应的信号量的平均值作为该采样位置的效应信号。In a preferred embodiment, based on each three-dimensional semaphore matrix, obtaining the effect signal corresponding to the sampling position of this type of signal includes: for each sampling position, an interpolation algorithm is used to perform interpolation fitting based on the reference point coordinates to obtain The semaphores corresponding to the two ends of the sampling position; the average value of the semaphores corresponding to the two ends is used as the effect signal of the sampling position.
在一些实施例中,基于所获得的效应信号,计算该类型的信号的总信号值包括:针对每一类型的信号,获得所有采样位置的效应信号的总和;将效应信号的总和作为该类型的信号的总信号值。In some embodiments, calculating the total signal value of the type of signal based on the obtained effect signal includes: for each type of signal, obtaining the sum of the effect signals of all sampling positions; taking the sum of the effect signals as the type The total signal value of the signal.
在一些实施例中,基于每一类型的信号的总信号值,计算该类型的信号的效应贡献占比包括:基于总信号值,计算每一类型的信号的贡献值;基于每一类型的信号的贡献值,计算所有信号的总贡献值;将每一类型的信号的贡献值与总贡献值的比值作为该类型的信号的效应贡献占比。In some embodiments, calculating the effect contribution ratio of each type of signal based on the total signal value of each type of signal includes: calculating the contribution value of each type of signal based on the total signal value; The contribution value of all signals is calculated as the total contribution value of all signals; the ratio of the contribution value of each type of signal to the total contribution value is taken as the effect contribution ratio of this type of signal.
在一些实施例中,基于总信号值,计算每一类型的信号的贡献值,包括:基于光阻模型,确定每一类信号的效应系数;计算每一类型的信号的效应系数与总信号值的乘积,以该乘积作为该类型的信号的贡献值。In some embodiments, calculating the contribution value of each type of signal based on the total signal value includes: determining the effect coefficient of each type of signal based on the light resistance model; calculating the effect coefficient of each type of signal and the total signal value The product of is used as the contribution value of this type of signal.
在一些实施例中,目标信号为光学类信号。In some embodiments, the target signal is an optical type signal.
在一些实施例中,获得目标信号的目标信号量包括:至少根据光源类型,掩模衍射和透镜传递函数基于傅里叶运算获得目标信号量。In some embodiments, obtaining the target signal amount of the target signal includes: obtaining the target signal amount based on Fourier operations at least according to the light source type, mask diffraction and lens transfer function.
提供发明的内容部分是为了简化的形式来介绍对概念的选择,它们在下文的具体实施方式中将被进一步描述。本发明内容部分无意标识本发明内容的关键特征或主要特征,也无意限制本发明内容的范围。应当理解,发明内容部分中所描述的内容并非旨在限定本发明的实施例的关键或重要特征,亦非用于限制本发明的范围。本发明的其它特征将通过以下的描述变得容易理解。This Summary is provided to introduce a selection of concepts in a simplified form that are further described below in the Detailed Description. This Summary is not intended to identify key features or essential features of this Summary, nor is it intended to limit the scope of this Summary. It should be understood that the content described in the Summary of the Invention is not intended to limit the key or important features of the embodiments of the present invention, nor is it intended to limit the scope of the present invention. Other features of the present invention will become readily understood through the following description.
附图说明Description of drawings
通过参考附图阅读下文的详细描述,本发明的实施例的上述以及其他目的、特征和优点将变得易于理解。在附图中,以示例而非限制性的方式示出了本发明的实施例,其中:The above and other objects, features and advantages of embodiments of the present invention will become readily understood by reading the following detailed description with reference to the accompanying drawings. In the drawings, embodiments of the invention are shown by way of example and not limitation, in which:
图1示出了根据发明的实施例能够在其中实现的示例性环境的示意图;Figure 1 shows a schematic diagram of an exemplary environment in which embodiments according to the invention can be implemented;
图2示出了根据发明的一些实施例的基于信号贡献占比选择光阻模型的方法的流程图;FIG. 2 shows a flow chart of a method for selecting a photoresist model based on a signal contribution ratio according to some embodiments of the invention;
图3示出了根据本发明的一些实施例的掩模版图的其中一个区域的俯视图;FIG. 3 shows a top view of one region of a mask layout according to some embodiments of the present invention;
图4示出了根据本发明的一些实施例光阻模型A的各类型信号的效应贡献占比分布图;Fig. 4 shows the effect contribution ratio distribution diagram of various types of signals of photoresist model A according to some embodiments of the present invention;
图5示出了根据本发明的一些实施例光阻模型A的信号曲线图;Fig. 5 shows a signal graph of photoresist model A according to some embodiments of the present invention;
图6示出了根据本发明的一些实施例光阻模型B的各类型信号的效应贡献占比分布图;Fig. 6 shows the effect contribution ratio distribution diagram of various types of signals of photoresist model B according to some embodiments of the present invention;
图7示出了根据本发明的一些实施例光阻模型B的信号曲线图;Fig. 7 shows a signal graph of photoresist model B according to some embodiments of the present invention;
图8示出了用来实施本发明的实施例的示例设备700的示意性框图。Fig. 8 shows a schematic block diagram of an
具体实施方式detailed description
下面将参照附图更详细地描述本发明的实施例。虽然附图中显示了本发明的某些实施例,然而应当理解的是,本发明可以通过各种形式来实现,而且不应该被解释为限于这里阐述的实施例,相反提供这些实施例是为了更加透彻和完整地理解本发明。应当理解的是,本发明的附图及实施例仅用于示例性作用,并非用于限制本发明的保护范围。Embodiments of the present invention will be described in more detail below with reference to the accompanying drawings. Although certain embodiments of the invention are shown in the drawings, it should be understood that the invention may be embodied in various forms and should not be construed as limited to the embodiments set forth herein; A more thorough and complete understanding of the present invention. It should be understood that the drawings and embodiments of the present invention are for exemplary purposes only, and are not intended to limit the protection scope of the present invention.
在本文中使用的术语“包括”及其变形表示开放性包括,即“包括但不限于”。除非特别申明,术语“或”表示“和/或”。术语“基于”表示“至少分量地基于”。术语“一个示例实施例”和“一个实施例”表示“至少一个示例实施例”。术语“另一实施例”表示“至少一个另外的实施例”。术语“第一”、“第二”等等可以指代不同的或相同的对象。下文还可能包括其他明确的和隐含的定义。As used herein, the term "comprise" and its variants mean open inclusion, ie "including but not limited to". The term "or" means "and/or" unless otherwise stated. The term "based on" means "based at least in part on". The terms "one example embodiment" and "one embodiment" mean "at least one example embodiment." The term "another embodiment" means "at least one further embodiment". The terms "first", "second", etc. may refer to different or the same object. Other definitions, both express and implied, may also be included below.
如上文所简要提及的,OPC光学邻近修正主要在半导体芯片的生产过程中使用,目的是为了保证曝光后硅片上得到的实际图形与设计图形一致。若不做OPC光学邻近修正实际曝光后得到的图形将与设计图形有显著差异,如实际线宽度比设计的窄或宽,这些都可以通过改变掩模版来补偿成像;其他的失真,如圆角、光强度,受光学工具分辨率的制约,更加难以弥补。这些失真如果不纠正,可能大大改变生产出来的电路的电气性能。OPC光学邻近修正通过移动掩模版上图形的边缘或添加额外的多边形来补偿这些失真。为此,需要在OPC光阻模型中模拟光刻机中发生的一系列光学效应和光阻效应,将各类型的效应信号的效应贡献占比直观地呈现给用户,这非常利于用户分析当前模型的行为,迭代获得更优模型,或者在多个不同的模型之间进行选择更优的模型,掌握积累各个效应的相关经验。As briefly mentioned above, OPC optical proximity correction is mainly used in the production process of semiconductor chips to ensure that the actual graphics obtained on the silicon wafer after exposure are consistent with the design graphics. If OPC optical proximity correction is not performed, the actual exposure graphics will be significantly different from the design graphics, such as the actual line width is narrower or wider than the design, these can be compensated for imaging by changing the mask; other distortions, such as rounded corners , Light intensity, restricted by the resolution of optical tools, it is even more difficult to compensate. These distortions, if not corrected, can significantly alter the electrical performance of the produced circuit. OPC optical proximity correction compensates for these distortions by moving the edges of the pattern on the reticle or adding additional polygons. For this reason, it is necessary to simulate a series of optical effects and photoresist effects in the lithography machine in the OPC photoresist model, and present the effect contribution ratio of each type of effect signal to the user intuitively, which is very helpful for the user to analyze the current model. Behavior, obtain a better model iteratively, or choose a better model among multiple different models, and master and accumulate relevant experience of each effect.
根据本发明的实施例,提供了一种用于基于效应贡献占比选择光阻模型的方法,该方法包括:收集光阻模型在掩模版图上的采样位置;获得采样位置上多种类型信号的信号量;针对每一类型的信号,根据信号量和采样位置的坐标获得效应信号;基于所获得的效应信号,计算该类型的信号的总信号值;基于每一类型的信号的总信号值,计算该类型的信号的效应贡献占比;根据效应贡献占比选择光阻模型。According to an embodiment of the present invention, there is provided a method for selecting a photoresist model based on the effect contribution ratio, the method comprising: collecting sampling positions of the photoresist model on the mask layout; obtaining various types of signals at the sampling positions semaphore; for each type of signal, obtain the effect signal according to the semaphore and the coordinates of the sampling position; based on the obtained effect signal, calculate the total signal value of this type of signal; based on the total signal value of each type of signal , calculate the effect contribution ratio of this type of signal; select the photoresist model according to the effect contribution ratio.
在掩模版图的采样位置的信号通常包括作为光学类信号ai和非光学类信号的多种类型的信号,通过分析光学类信号和非光学类信号在整个效应信号中的占比,能够将各类信号的效应贡献占比情况可视化地直接呈现给用户,从而使得有用户能够基于对占比情况分析的结果选择适合生产工艺的光阻模型。The signals at the sampling positions of the mask layout usually include multiple types of signals as optical signals ai and non-optical signals, and by analyzing the proportions of optical signals and non-optical signals in the entire effect signal, each The proportion of effect contribution of similar signals is visually and directly presented to the user, so that some users can select a photoresist model suitable for the production process based on the analysis results of the proportion.
以下将参照附图来具体描述本发明的实施例。参考图1,其示出了本发明的多个实施例能够在其中实现的示例性环境100的示意图。如图1所示,该示例性环境100包括计算装置110和客户端120。Embodiments of the present invention will be specifically described below with reference to the accompanying drawings. Referring to FIG. 1 , a schematic diagram of an
在一些实施例中,计算装置110可以接收来自客户端120的输入消息,并向客户端120输出反馈消息。在一些实施例中,通过客户端120输入光阻模型。计算装置110可以针对输入的光阻模型进行模拟计算,以确定采样位置处的各类信号的效应贡献占比,并将分析结果输出个客户端120。In some embodiments,
在一些实施例中,计算装置110可以包括但不限于个人计算机、服务器计算机、手持或膝上型设备、移动设备(诸如移动电话、个人数字助理PDA、媒体播放器等)、消费电子产品、小型计算机、大型计算机、云计算资源等。In some embodiments,
应当理解,仅出于示例性的目的描述的示例性环境100的结构和功能并不旨在限制本文所描述的主题的范围。本文所描述主题可以在不同的结构和/或功能中实施。It should be understood that the structure and functionality of the
上文描述的技术方案仅用于示例,并非限制本发明。应当理解,示例性环境100还可以具有其他多种实施方式。为了更清晰地解释本发明方案的原理,下文将参考图2来更详细描述本发明的具体技术方案。The technical solutions described above are only for example, not limiting the present invention. It should be understood that the
图2示出了根据本发明的一些实施例的用于选择光阻模型的方法的流程图。例如,该方法200可以由如图1所示的计算装置110来实施。应当理解,方法200可以包括未示出的附加框和/或可以省略所示出的某些框。本发明的范围在此不受限制。FIG. 2 shows a flowchart of a method for selecting a photoresist model according to some embodiments of the present invention. For example, the
在步骤202处,收集光阻模型在掩模版图上的采样位置。在一个具体的示例性实施例中,以IMP层(植入层implant layer)作为实例,其通常具有超过1000个采样位置,这些采样位置分布在掩模版图的各处,每个采样位置处的模型具体行为都是不确定的。在本发明如下实施例中,以IMP层的1865个采样位置为例,具体使用中,可以用在其他层中,也可以选择其他数量的采样位置,不对本发明实际采样位置进行具体限定。在本发明的实施例中,收集掩模版图上的所有采样位置。在此应该注意的是,采样位置的数量并不是固定的,采样位置的数量以及层的选择可根据实际情况进行选择,本实施例只是示例性的,其不应对本发明构成限制。At
下面结合图3对掩模版图中的采样位置进行描述。图3示出了掩模版图其中一个区域的俯视图,该区域仅为示例性的。本领域技术人员可以预见,该掩模版图还包括其他未示出的其他区域,其中掩模版图中的掩模元素的排列方式,位置等也并不局限于图3所示出的模式。在本实施例中,为清晰起见,仅以Gauge_0标注了其中一个采样位置,该采样位置的选择仅出于对采样位置的关键尺寸(CD)位置两端进行说明的目的。在该位置处的采样位置由一条实线标注出,从图中可见,该实线在该采样位置具有两个端部位置,这两个端部位置之间的距离代表了关键尺寸。The sampling positions in the mask layout will be described below with reference to FIG. 3 . FIG. 3 shows a top view of one region of the mask layout, which is only exemplary. Those skilled in the art can foresee that the mask layout also includes other regions not shown, and the arrangement and position of the mask elements in the mask layout are not limited to the pattern shown in FIG. 3 . In this embodiment, for the sake of clarity, only one of the sampling positions is marked with Gauge_0, and the sampling position is only selected for the purpose of illustrating the two ends of the critical dimension (CD) position of the sampling position. The sampling position at this position is marked by a solid line, which, as can be seen from the figure, has two end positions at the sampling position, the distance between which represents the critical dimension.
下面回到图2。在步骤204处,获得采样位置上的多种类型的信号的信号量。如前所述的那样,采样位置处的信号通常包括光学类信号ai和非光学类信号等多种类型的信号,例如在本实施例中信号主要分为光学类信号ai和多个非光学类信号,即,胶体物理连续A信号,胶体物理连续B信号,胶体物理连续C信号,胶体物理边缘A信号和胶体物理B信号,胶体化学酸碱car信号。以上非光学类信号的列举在本实施例中仅出于说明的目的,除上述信号外还可包括其他类型的非光学类信号。Return to Figure 2 below. At
在一些实施例中,将这些类型的信号中的光学类信号ai作为目标信号,其中,计算目标信号的目标信号量包括:至少根据光源类型,掩模衍射和透镜传递函数基于傅里叶运算计算出目标信号量。在一个具体的实施例中可以通过以下公式(1)计算目标信号的目标信号量I(x, y)。In some embodiments, the optical signal ai among these types of signals is used as the target signal, wherein calculating the target signal amount of the target signal includes: at least according to the light source type, mask diffraction and lens transfer function are calculated based on Fourier operations Output the target semaphore. In a specific embodiment, the target semaphore I(x, y) of the target signal can be calculated by the following formula (1).
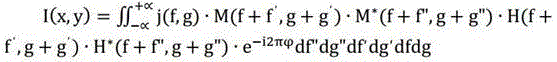
其中,x,y为采样位置在掩模中的坐标,j(f,g)为光源类型,f,g分别为光源的横坐标和纵坐标,M为掩模衍射,H为透镜传递函数,M*和H*为掩模衍射M和透镜传递函数H的复共轭,f',g'分别为光源的横坐标f的第一偏移量和纵坐标g的第一偏移量,f'',g''分别为光源的横坐标f的第二偏移量和纵坐标g的第二偏移量,i是傅里叶转换公式中的虚数单位;Among them, x, y are the coordinates of the sampling position in the mask, j (f, g) is the type of light source, f, g are the abscissa and ordinate of the light source respectively, M is the mask diffraction, H is the lens transfer function, M* and H* are the complex conjugates of the mask diffraction M and the lens transfer function H, f', g' are the first offset of the abscissa f of the light source and the first offset of the ordinate g of the light source, f '', g'' are the second offset of the abscissa f of the light source and the second offset of the ordinate g of the light source, and i is the imaginary unit in the Fourier transformation formula;
其中

然后在一个实施例中,步骤206中还包括:针对每一类型的信号,根据信号量和采样位置的坐标获得效应信号。具体地,针对作为目标信号的光学类信号,根据以上计算出的信号量和采样位置的坐标获得所述效应信号包括:确定采样位置的两端的关键尺寸(CD)位置的位置坐标;基于所确定的位置坐标和每一类型的信号的信号量,形成与该类型的信号对应的三维信号量矩阵;基于每一三维信号量矩阵,获得该类型的信号对应采样位置的效应信号。该三维信号量矩阵描述了各个类型的信号的采样位置的坐标与其信号量的关系。Then, in one embodiment, step 206 further includes: for each type of signal, obtaining an effect signal according to the signal quantity and the coordinates of the sampling position. Specifically, for the optical signal as the target signal, obtaining the effect signal according to the signal amount calculated above and the coordinates of the sampling position includes: determining the position coordinates of the critical dimension (CD) positions at both ends of the sampling position; based on the determined The location coordinates of each type of signal and the semaphore of each type of signal form a three-dimensional semaphore matrix corresponding to the type of signal; based on each three-dimensional semaphore matrix, the effect signal corresponding to the sampling position of the type of signal is obtained. The three-dimensional semaphore matrix describes the relationship between the coordinates of the sampling positions of various types of signals and their semaphore.
为了形成三维信号量矩阵,首先需要获得采样位置的关键尺寸的中心位置。然后以该中心位置为中心,在彼此正交的上下和左右方向上延伸出预定的距离。需要说明的是,采样位置通过gauge_0所处的位置来确认,那么gauge_0两端CD也分别对应坐标位置,因此,根据两端的坐标位置可以获得中心位置的坐标。在一个示例性的示例中,从中心位置延伸出50nm的距离,从而获得一个边长为100nm的正方形的矩阵范围。接下来以5nm的间距对各个边长进行划分,从而在矩阵范围内获得400个参考点,这些参考点在掩模版图中的参考点坐标是确定的,因此参考点在掩模版图的坐标与三维信号量矩阵中的坐标是呈一一对应的关系,当其坐标位置(x,y)知道以后,这些参考点坐标所对应的目标信号(光学类信号ai)的信号量可通过以上公式计算出来,因此,在对采样位置进行测量后,就可以通过该目标信号的采样位置的位置坐标在其三维信号量矩阵中查找对应的参考点坐标,从而获得该采样位置两端的信号量。在此需要注意的是,以上数值的选择仅为示例性的,并不用于构成对本发明的限制,在实际过程中可以选择其他合适的数值来限定三维信号量矩阵的范围。In order to form a three-dimensional semaphore matrix, it is first necessary to obtain the center position of the key dimension of the sampling position. Then, with this center position as a center, a predetermined distance is extended in the up-down and left-right directions orthogonal to each other. It should be noted that the sampling position is confirmed by the position of gauge_0, then the CDs at both ends of gauge_0 also correspond to the coordinate positions, therefore, the coordinates of the center position can be obtained according to the coordinate positions at both ends. In an exemplary example, a distance of 50 nm is extended from the central position, thereby obtaining a square matrix area with a side length of 100 nm. Next, each side length is divided with a pitch of 5nm, so as to obtain 400 reference points within the range of the matrix. The reference point coordinates of these reference points in the mask layout are determined, so the coordinates of the reference points in the mask layout and The coordinates in the three-dimensional semaphore matrix are in a one-to-one correspondence. When the coordinate position (x, y) is known, the semaphore of the target signal (optical signal ai) corresponding to these reference point coordinates can be calculated by the above formula Therefore, after measuring the sampling position, the coordinates of the corresponding reference point can be found in the three-dimensional semaphore matrix through the position coordinates of the sampling position of the target signal, so as to obtain the semaphores at both ends of the sampling position. It should be noted here that the selection of the above numerical values is only exemplary and not intended to limit the present invention, and other appropriate numerical values may be selected to limit the range of the three-dimensional semaphore matrix in an actual process.
为了获得对应于这些类的信号的各自对应的三维信号量矩阵,需要以先前确定的用于目标信号的三维信号矩阵的参考点坐标为基础。以胶体化学酸碱car信号为例,为了计算该类型的信号的信号量需要根据以下方式计算出三维信号矩阵的各个参考点处的信号量,从而基于光学类信号的三维信号矩阵的坐标和通过以下方式计算出的各个信号量形成car信号的三维信号量矩阵。但是应该理解的是,此处示出的计算该信号量的方法仅用于说明的目的,其他类型的信号的信号量可以通过合适的方法进行计算,在此不再赘述。In order to obtain the respective corresponding three-dimensional semaphore matrices for signals of these classes, it is necessary to base the previously determined reference point coordinates of the three-dimensional signal matrix for the target signal. Taking colloidal chemical acid-base car signal as an example, in order to calculate the signal amount of this type of signal, it is necessary to calculate the signal amount at each reference point of the three-dimensional signal matrix according to the following method, so that the coordinates of the three-dimensional signal matrix based on optical signals and through Each semaphore calculated in the following manner forms a three-dimensional semaphore matrix of the car signal. However, it should be understood that the method for calculating the semaphore shown here is only for the purpose of illustration, and the semaphore of other types of signals may be calculated by a suitable method, which will not be repeated here.
在胶体化学酸碱car信号中,曝光产生酸,但是不会直接影响溶出度。酸催化在PEB期间的反应(称为放大),这会改变溶解度。In colloidal chemical acid-base car signaling, exposure produces acid, but does not directly affect dissolution. The acid catalyzes a reaction during PEB (called amplification), which changes the solubility.
在曝光阶段,通过光致产酸剂PAG实现的直接的光子吸收在第一阶反应中释放出酸,其由以下公式(3)计算:During the exposure stage, direct photon absorption by the photoacid generator PAG releases acid in a first-order reaction, which is calculated by the following equation (3):


其中,G为PAG浓度;G0为初始PAG浓度;Q为酸浓度;I为目标信号量值(通过目标信号量I(x, y)公式计算获得);C为曝光率常数;t为曝光时间。Among them, G is the PAG concentration; G 0 is the initial PAG concentration; Q is the acid concentration; I is the target signal value (calculated by the target signal value I(x, y) formula); C is the exposure rate constant; t is the exposure time.
在放大阶段,酸催化一个反应,该反应消耗一个反应位(保护/锁止位),以产生一个被反应位(去保护/去锁止位),其由以下公式(4)计算得出:In the amplification stage, the acid catalyzes a reaction that consumes a reactive site (protected/locked site) to produce a reacted site (deprotected/unlocked site), which is calculated by the following equation (4):

其中,由于经过烘烤工艺稳定后酸浓度Q就是局部恒定的数值,则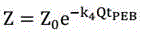
其中,Z是锁止位浓度;Z0是初始锁止位浓度;k4是放大率常数;tPEB是烘烤时间。Among them, Z is the concentration of locking bits; Z 0 is the initial concentration of locking bits; k 4 is the amplification constant; t PEB is the baking time.
然后,浓度可以被归一化至初始值,其由以下公式(5)得出:Then, the concentration can be normalized to the initial value, which is given by the following equation (5):


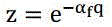
其中,I为目标信号量值;C为曝光率常数;t为曝光时间,q为酸浓度剩余比例,Kamp=G0K4为归一化速率常数,

其中,Aγ为阿仑尼乌斯系数,Ea为活化能,R为通用其他常数。Among them, A γ is the Arrhenius coefficient, E a is the activation energy, and R is other common constants.
由以上公式即可计算出z值,该z值即为该car信号的信号量。The z value can be calculated from the above formula, and the z value is the semaphore of the car signal.
现在参考图3来进一步进行描述。如前所述,在图3仅示出了掩模版图的部分区域,其中以Gauge_0标注了其中一个采样位置,该采样位置位于附图的正中央(仅出于说明的目的,并不局限于正中央,也可以选择其他位置进行说明,具体应用中可以根据工艺上量测的需要选择采样位置)。进一步地在该采样位置处还示出了一实线,该实线代表该采样位置的两端的关键尺寸(CD)的位置。在对该位置进行测量之后,获得该采样位置两端的位置坐标,然后在三维信号量矩阵中查找该位置坐标所对应的信号量,并将这两个信号值的平均值作为该采样位置的效应信号,一类信号在一个采样位置的效应信号以Rij来表示,其中i为信号的类型,j为采样位置,例如信号的类型为10个,则i的取值为1-10。Reference is now made to FIG. 3 for further description. As mentioned above, only a partial area of the mask layout is shown in Figure 3, and one of the sampling positions is marked with Gauge_0, which is located in the center of the drawing (for illustrative purposes only, not limited to In the middle, other locations can also be selected for illustration. In specific applications, the sampling location can be selected according to the needs of process measurement). Further, a solid line is also shown at the sampling position, and the solid line represents the position of the critical dimension (CD) at both ends of the sampling position. After the position is measured, the position coordinates at both ends of the sampling position are obtained, and then the semaphore corresponding to the position coordinates is searched in the three-dimensional semaphore matrix, and the average value of the two signal values is used as the effect of the sampling position Signal, the effect signal of a type of signal at a sampling position is represented by Rij, where i is the type of signal and j is the sampling position. For example, if there are 10 types of signals, the value of i is 1-10.
然而,在实际的采样过程中,采样位置两端的关键尺寸位置的位置坐标不一定会与三维信号量矩阵中的参考坐标精确对应,关键尺寸位置有可能落入到信号量矩阵的参考点之间。因此,在一个优选的实施例中进一步提出,基于每一采样位置通过插值算法基于参考点坐标进行插值拟合,以获得采样位置的两端分别对应的信号量。However, in the actual sampling process, the position coordinates of the key size positions at both ends of the sampling position may not exactly correspond to the reference coordinates in the three-dimensional semaphore matrix, and the key size positions may fall between the reference points of the semaphore matrix . Therefore, it is further proposed in a preferred embodiment that an interpolation algorithm is used to perform interpolation fitting based on the reference point coordinates based on each sampling position, so as to obtain the signal amounts corresponding to the two ends of the sampling position respectively.
本实施例中采用了双三次插值(BiCubic)算法进行插值拟合。在一个具体的示例中,首先找到采样位置的端部位置在三维信号量矩阵中的对应的位置,然后再在三维信号量矩阵中找到距离该端部位置最近的16个参考点,将这16个参考点作为计算端部位置的信号值的参数,利用BiCubic基函数求出这16个参考点的权重,端部位置的信号值就等于这16个参考点的加权叠加。双三次插值算法是二维空间中最常用的插值方法,其插值精度高,图像损失质量低。但是,本发明并不限于双三次插值算法,也可以采样其他插值算法,例如双线性插值,最近邻插值算法等等。In this embodiment, a bicubic interpolation (BiCubic) algorithm is used for interpolation fitting. In a specific example, the corresponding position of the end position of the sampling position in the three-dimensional semaphore matrix is firstly found, and then the 16 reference points closest to the end position are found in the three-dimensional semaphore matrix, and these 16 The reference points are used as parameters for calculating the signal value of the end position, and the weights of these 16 reference points are obtained by using the BiCubic basis function, and the signal value of the end position is equal to the weighted superposition of these 16 reference points. Bicubic interpolation algorithm is the most commonly used interpolation method in two-dimensional space, which has high interpolation accuracy and low image loss quality. However, the present invention is not limited to the bicubic interpolation algorithm, and other interpolation algorithms may also be sampled, such as bilinear interpolation, nearest neighbor interpolation algorithms, and the like.
在图3中可见,采用如上方法在从三维信号量矩阵中获得采样位置Gauge_0两端的信号量之后,取这两个信号量的平均值Rij,作为该采样位置的效应信号,从而能够获得所有采样位置的效应信号。因此,针对一个采样位置需要在Gauge_0两端分别采用两次插值算法,获得该采样位置的效应信号。It can be seen in Figure 3 that after the semaphores at both ends of the sampling position Gauge_0 are obtained from the three-dimensional semaphore matrix by the above method, the average value Rij of these two semaphores is taken as the effect signal of the sampling position, so that all samples can be obtained Position effect signal. Therefore, for a sampling position, it is necessary to use two interpolation algorithms at both ends of Gauge_0 to obtain the effect signal of the sampling position.
再次回到图2,在步骤208处,基于所获得的效应信号,计算该类信号的总信号值。具体地,针对每一类型的信号,获得所有采用位置的效应信号的总和,并将效应信号的总和作为该效应信号的总信号值。首先要获得每一类型的信号在所有采样位置的效应信号的平均值。然后根据公式(7)基于该效应信号的平均值获得每一类型的信号在所有采样位置的总信号值Si。Returning to Fig. 2 again, at

在步骤210处,基于每一类型的信号的总信号值Si,计算该类型的信号的效应贡献占比。At
具体地首先基于每一类型的信号的总信号值Si,根据公式(8)计算每一类型的信号的贡献值Ti。Specifically, based on the total signal value Si of each type of signal, the contribution value Ti of each type of signal is calculated according to formula (8).

其中,Ci为效应系数,其为根据光阻模型预设的一个固定的效应系数,也就是说当光阻模型确定以后,与该光阻模型分别对应的各个信号的效应系数也就唯一确定的,这是由光阻模型的性质所决定的。Among them, Ci is the effect coefficient, which is a fixed effect coefficient preset according to the photoresist model, that is to say, after the photoresist model is determined, the effect coefficient of each signal corresponding to the photoresist model is uniquely determined , which is determined by the nature of the photoresist model.
然后根据公式(9),基于每一类型的信号的贡献值Ti,计算所有信号的总贡献值T。Then according to formula (9), based on the contribution value Ti of each type of signal, the total contribution value T of all signals is calculated.

最后,根据公式(10),将每一类型信号的贡献值Ti与总贡献值T的比值作为该类型的信号的效应贡献占比NTi。Finally, according to formula (10), the ratio of the contribution value Ti of each type of signal to the total contribution value T is taken as the effect contribution ratio NTi of this type of signal.

基于以上结果,在步骤212处,根据计算出的该类信号的效应贡献占比NTi选择光阻模型。各类信号的计算后的效应贡献占比示例性地在图4和图6中示出。Based on the above results, at
在本发明的一个优选的实施例中,确定多种类型信号中的目标信号,即光学类信号ai,基于该目标信号的效应贡献占比选择光阻模型。具体地,在目标信号的效应贡献占比大于或等于第一预设阈值时,选择光阻模型。该阈值为根据经验和掩模版图所要实现的效果预设的值。在本实施例中,该阈值可以选择为70%,优选为75%;进一步优选为80%。在本实施例中,该阈值被预设为80%。In a preferred embodiment of the present invention, a target signal among multiple types of signals is determined, that is, the optical signal ai, and a photoresistive model is selected based on the effect contribution ratio of the target signal. Specifically, when the effect contribution ratio of the target signal is greater than or equal to a first preset threshold, a photoresist model is selected. The threshold is a preset value based on experience and the desired effect of the mask layout. In this embodiment, the threshold may be selected as 70%, preferably 75%; more preferably 80%. In this embodiment, the threshold is preset as 80%.
在另一个可替代的实施例中,在步骤212处,基于所述目标信号的效应贡献占比,选择光阻模型,包括:基于公式(11)和(12),以目标信号的效应贡献占比为输入值,计算预设函数的函数值;在函数值小于或等于第二预设阈值时,选择光阻模型。In another alternative embodiment, at


其中,Rmse为均方根误差,是光阻模型在每一采样位置的关键尺寸仿真值与历史真值的偏差的平方和与采样次数的比值的平方根;Rmse_weight为均方根误差权重;NT1为目标信号的效应贡献占比;Da和Db为预设的常数;F(NT1)为指数函数,F(NT1)_weight为指数函数的权重。在本实施例中,引用了均方根误差,其能够良好地反映出测量的精度。Among them, Rmse is the root mean square error, which is the square root of the ratio of the square sum of the deviation between the simulation value of the key dimension of the photoresist model at each sampling position and the historical true value and the sampling number; Rmse_weight is the root mean square error weight; NT1 is The effect contribution ratio of the target signal; Da and Db are preset constants; F(NT1) is an exponential function, and F(NT1)_weight is the weight of the exponential function. In this embodiment, the root mean square error is quoted, which can well reflect the accuracy of the measurement.
需要说明的是,针对一光阻模型其具有在给定掩膜版和采样位置上具有仿真的能力,获得是在每一个采样位置上的关键尺寸CD值,也就是该CD的仿真值。在采样次数为n的情况下,则需要获得光阻模型的n个CD仿真值,还有n个历史真值(历史真值是通过该模型进行历史仿真获得的值),从而获得n个仿真值与历史真值的差值,也就是偏差,对这n个偏差分别取平方,再获得n个平方的和,对n个平方的和与n进行比值后开根号,从而获得该光阻模型的均方根误差。It should be noted that, for a photoresist model, it has the capability of simulation at a given mask and sampling position, and the CD value at each sampling position is obtained, that is, the simulation value of the CD. In the case of n sampling times, it is necessary to obtain n CD simulation values of the photoresist model, as well as n historical true values (historical true values are values obtained through historical simulation of the model), so as to obtain n simulation values The difference between the value and the historical true value, that is, the deviation, the n deviations are squared, and then the sum of n squares is obtained, and the square sum of n is compared with n, and then the square root is obtained, so as to obtain the photoresist The root mean square error of the model.
在具体的实例中,如果某一光阻模型的均方根误差Rmse计算为1.4,其权重Rmse_weight为1(固定预设值),目标信号的指数函数F(NT1)为1,指数函数的权重F(NT1)_weight为1,则计算得出Cost值为1.2。如果第二预设阈值为1.4,则该光阻模型的Cost值小于第二预设阈值,那么就选择该光阻模型。In a specific example, if the root mean square error Rmse of a photoresist model is calculated as 1.4, its weight Rmse_weight is 1 (fixed preset value), the exponential function F(NT1) of the target signal is 1, and the weight of the exponential function If F(NT1)_weight is 1, the calculated Cost value is 1.2. If the second preset threshold is 1.4, then the Cost value of the photoresist model is smaller than the second preset threshold, then the photoresist model is selected.
由以上公式(11)和(12)可见,当目标信号的效应贡献占比NT1超过某一预定阈值时,随着NT1增大时,目标信号的指数函数F(NT1)会随之快速减小,从而使Cost值快速减小,从而使当前的光阻模型成为更有选择。反之,当标信号的效应贡献占比NT1低于该预定阈值时,目标信号的指数函数F(NT1)基本保持不变,从而对Cost值基本没有影响。From the above formulas (11) and (12), it can be seen that when the effect contribution ratio NT1 of the target signal exceeds a predetermined threshold, as NT1 increases, the exponential function F(NT1) of the target signal will decrease rapidly , so that the Cost value decreases rapidly, making the current photoresist model more selective. Conversely, when the effect contribution ratio NT1 of the target signal is lower than the predetermined threshold, the exponential function F(NT1) of the target signal remains basically unchanged, thus basically having no impact on the Cost value.
应当理解的是,本实施例所述的各种阈值均为根据经验和掩模版图所要实现的效果预设的值。本发明并不局限于以上示例性列出的阈值。It should be understood that the various thresholds described in this embodiment are preset values based on experience and the effect to be achieved by the mask layout. The present invention is not limited to the above exemplary listed thresholds.
在本发明的一些实施例中,傅里叶运算、阿仑尼乌斯方程以及插值算法被应用。然而,上述方式仅仅是示意性的,本发明的实施例并不限于上述方式。本领域技术人员基于本申请发明内容的教导,将理解还可以通过其他适当的数学运算来确定效应贡献占比。In some embodiments of the invention, Fourier operations, Arrhenius equations and interpolation algorithms are applied. However, the foregoing manners are merely exemplary, and embodiments of the present invention are not limited to the foregoing manners. Based on the teaching of the content of the present invention, those skilled in the art will understand that the proportion of effect contribution can also be determined by other appropriate mathematical operations.
以下参考图4-图7对各个信号占比情况进行描述。The ratio of each signal is described below with reference to FIGS. 4-7 .
在图4中示出了模型A的情况中各个类型的效应贡献占比情况。该模型以IMP层为示例,其具有1865个采样位置。图4示出了模型A各个类型的效应贡献占比情况。从图中可见,信号主要分为光学类信号ai和多个非光学类信号,即,胶体物理连续A信号,胶体物理连续B信号,胶体物理连续C信号,胶体物理边缘A信号和胶体物理B信号,car信号。从图4中可见,光学类信号ai的信号的效应贡献占比为61.3286%,而非光学类信号的效应贡献占比之和为38.6714%。Figure 4 shows the proportion of each type of effect contribution in the case of model A. The model is exemplified by the IMP layer, which has 1865 sampling locations. Figure 4 shows the proportion of each type of effect contribution in model A. It can be seen from the figure that the signals are mainly divided into optical signal ai and multiple non-optical signals, namely, colloid physics continuous A signal, colloid physics continuous B signal, colloid physics continuous C signal, colloid physics edge A signal and colloid physics B Signal, car signal. It can be seen from Figure 4 that the effect contribution of the optical signal ai is 61.3286%, while the sum of the effect contribution of non-optical signals is 38.6714%.
在本实施例中,预设的阈值被选择为80%,光学的信号的效应贡献占比显著低于该阈值,因此该模型A应该被放弃。In this embodiment, the preset threshold is selected as 80%, and the effect contribution ratio of the optical signal is significantly lower than this threshold, so the model A should be discarded.
图5示出了该模型A的采样位置Gauge_0的信号截面图。图中的线a为量测关键尺寸(CD)的信号阈值,线b为仿真后的信号。从图中可见,仿真信号非常接近阈值(在本实施例中选择为80%),并在阈值上方发生纠缠。在这种情况下,如果仿真的观察窗口进行偏移,使得线b上移,而线a保持不动,就会量测不出关键尺寸,或者使得线b下移,而线a保持不动,这时能够量测出关键尺寸。在所示的附图中,由于仿真信号在阈值上方纠缠,因此仅仅获得了一个采样位置的关键尺寸CD为262.28nm,但是如果线b上移,则该关键尺寸会增加,该增加会导致超出关键尺寸的预设范围,从而无法输出关键尺寸。这种情况是不允许发生的,因此需要放弃该模型。FIG. 5 shows a signal cross-sectional view of the sampling position Gauge_0 of the model A. Line a in the figure is the signal threshold for measuring the critical dimension (CD), and line b is the simulated signal. It can be seen from the figure that the simulated signal is very close to the threshold (80% is chosen in this embodiment), and entanglement occurs above the threshold. In this case, if the observation window of the simulation is shifted so that line b moves up while line a remains stationary, the critical dimension cannot be measured, or line b moves downward while line a remains stationary , then the critical dimensions can be measured. In the figure shown, a critical dimension CD of 262.28nm is obtained for only one sampling location due to the simulated signal entanglement above the threshold, but if the line b is moved up, this critical dimension increases, which leads to exceeding The preset range of key dimensions, so that key dimensions cannot be output. This situation is not allowed to happen, so the model needs to be abandoned.
图6示出了模型B的情况中的效应贡献占比情况。该模型同样以14nm(具体应用中,也可以用在7nm,28nm,40nm,65nm以及其他工艺节点中)的IMP层(本发明的实施例可以用在其他工艺节点的其他层中,例如金属层metal layer、CT接触层contact layer等等)为示例,其同样具有1865个采样位置。从图中可见,信号主要分为光学类信号ai和多个非光学类信号,即,胶体物理连续A信号,胶体物理连续B信号,胶体物理连续C信号,胶体物理边缘A信号和胶体物理B信号,car信号。但是与图4所示的模型A不同的是,模型B的光学类信号ai的效应贡献占比为81.9965%,而其他非光学类信号的效应贡献占比之和为18.0035%。与模型A相比,模型B的光学类信号的效应贡献占比高出模型A约20%。模型B的光学类信号的效应贡献占比高于阈值80%,因此该模型可以被选择。Figure 6 shows the proportion of effect contribution in the case of model B. This model is also based on the IMP layer of 14nm (in specific applications, it can also be used in 7nm, 28nm, 40nm, 65nm and other process nodes) (the embodiment of the present invention can be used in other layers of other process nodes, such as metal layers metal layer, CT contact layer, etc.) are examples, which also have 1865 sampling positions. It can be seen from the figure that the signals are mainly divided into optical signal ai and multiple non-optical signals, namely, colloid physics continuous A signal, colloid physics continuous B signal, colloid physics continuous C signal, colloid physics edge A signal and colloid physics B Signal, car signal. However, unlike model A shown in Figure 4, the effect contribution of model B's optical signal ai is 81.9965%, while the sum of effect contributions of other non-optical signals is 18.0035%. Compared with model A, the effect contribution of optical signals of model B is about 20% higher than that of model A. The effect contribution of the optical class signal of model B is above the threshold of 80%, so this model can be selected.
参见图7,示出了该模型B的情况下的同样的采样位置Gauge_0的信号截面图。从图中可见,信号在阈值附近不做停留(没有纠缠),安全地分布在阈值的两侧。实际上,在图7中共获得了5个采样位置的关键尺寸CD,其从左至右分别为CD=72.6329,CD=19.3748,CD=78.9942,CD=20.1299,CD=72.0586。在线b上移或下移一定程度的情况下,都能量测出关键尺寸,这使得信号更加稳定可靠,因此应该选择模型B。Referring to FIG. 7 , it shows a signal cross-sectional view of the same sampling position Gauge_0 in the case of model B. It can be seen from the figure that the signal does not stay near the threshold (no entanglement), and is safely distributed on both sides of the threshold. Actually, in Fig. 7, the key dimensions CD of 5 sampling positions are obtained, which are respectively CD=72.6329, CD=19.3748, CD=78.9942, CD=20.1299, CD=72.0586 from left to right. When the line b moves up or down to a certain extent, the critical dimension can be measured, which makes the signal more stable and reliable, so model B should be selected.
通过挑选光学效应贡献占比高的模型,可以显著降低挑选到不稳定模型的比例,提高找到更稳定模型的比例。这极大地节省人力成本和资源消耗,为用户挑选模型提供了有效的帮助。By selecting models with a high proportion of optical effects, the proportion of unstable models can be significantly reduced and the proportion of more stable models can be increased. This greatly saves labor costs and resource consumption, and provides effective help for users to select models.
图8示出了可以用来实施本发明的实施例的示例设备700的示意性框图。例如,本发明的电子设备可以由设备700来实施。如图所示,设备700包括中央处理单元(CPU)701,其可以根据存储在只读存储器(ROM)702中的计算机程序指令或者从存储单元708加载到随机访问存储器(RAM)703中的计算机程序指令,来执行各种适当的动作和处理。在RAM 703中,还可存储设备700操作所需的各种程序和数据。CPU 701、ROM 702以及RAM 703通过总线704彼此相连。输入/输出(I/O)接口705也连接至总线704。Fig. 8 shows a schematic block diagram of an
设备700中的多个部件连接至I/O接口705,包括:输入单元706,例如键盘、鼠标等;输出单元707,例如各种类型的显示器、扬声器等;存储单元708,例如磁盘、光盘等;以及通信单元709,例如网卡、调制解调器、无线通信收发机等。通信单元709允许设备700通过诸如因特网的计算机网络和/或各种电信网络与其他设备交换信息/数据。Multiple components in the
处理单元701执行上文所描述的各个方法和处理,例如方法200。例如,在一些实施例中,方法200可被实现为计算机软件程序,其被有形地包含于机器可读介质,例如存储单元708。在一些实施例中,计算机程序的部分或者全部可以经由ROM 702和/或通信单元709而被载入和/或安装到设备700上。当计算机程序加载到RAM 703并由CPU 701执行时,可以执行上文描述的方法200中的一个或多个步骤。备选地,在其他实施例中,CPU 701可以通过其他任何适当的方式(例如,借助于固件)而被配置为执行方法200。The
本文中以上描述的功能可以至少部分地由一个或多个硬件逻辑部件来执行。例如,非限制性地,可以使用的示范类型的硬件逻辑部件包括:场可编程门阵列(FPGA)、专用集成电路(ASIC)、专用标准产品(ASSP)、芯片上系统的系统(SOC)、负载可编程逻辑设备(CPLD)等等。The functions described herein above may be performed at least in part by one or more hardware logic components. For example, without limitation, exemplary types of hardware logic components that may be used include: field programmable gate array (FPGA), application specific integrated circuit (ASIC), application specific standard product (ASSP), system on a chip (SOC), load programmable logic device (CPLD), etc.
用于实施本发明的方法的程序代码可以采用一个或多个编程语言的任何组合来编写。这些程序代码可以提供给通用计算机、专用计算机或其他可编程数据处理装置的处理器或控制器,使得程序代码当由处理器或控制器执行时使流程图和/或框图中所规定的功能/操作被实施。程序代码可以完全在机器上执行、分量地在机器上执行,作为独立软件包分量地在机器上执行且分量地在远程机器上执行或完全在远程机器或服务器上执行。Program codes for implementing the methods of the present invention may be written in any combination of one or more programming languages. These program codes may be provided to a processor or controller of a general-purpose computer, a special purpose computer, or other programmable data processing devices, so that the program codes, when executed by the processor or controller, make the functions/functions specified in the flow diagrams and/or block diagrams Action is implemented. The program code may execute entirely on the machine, partially on the machine, as a stand-alone software package and partially on a remote machine or entirely on the remote machine or server.
在本发明的上下文中,机器可读介质可以是有形的介质,其可以包含或存储以供指令执行系统、装置或设备使用或与指令执行系统、装置或设备结合地使用的程序。机器可读介质可以是机器可读信号介质或机器可读储存介质。机器可读介质可以包括但不限于电子的、磁性的、光学的、电磁的、红外的、或半导体系统、装置或设备,或者上述内容的任何合适组合。机器可读存储介质的更具体示例会包括基于一个或多个线的电气连接、便携式计算机盘、硬盘、随机存取存储器(RAM)、只读存储器(ROM)、可擦除可编程只读存储器(EPROM或快闪存储器)、光纤、便捷式紧凑盘只读存储器(CD-ROM)、光学储存设备、磁储存设备、或上述内容的任何合适组合。In the context of the present invention, a machine-readable medium may be a tangible medium that may contain or store a program for use by or in conjunction with an instruction execution system, apparatus, or device. A machine-readable medium may be a machine-readable signal medium or a machine-readable storage medium. A machine-readable medium may include, but is not limited to, electronic, magnetic, optical, electromagnetic, infrared, or semiconductor systems, apparatus, or devices, or any suitable combination of the foregoing. More specific examples of machine-readable storage media would include one or more wire-based electrical connections, portable computer disks, hard disks, Random Access Memory (RAM), Read Only Memory (ROM), Erasable Programmable Read Only Memory (EPROM or flash memory), optical fiber, compact disk read only memory (CD-ROM), optical storage, magnetic storage, or any suitable combination of the foregoing.
此外,虽然采用特定次序描绘了各操作,但是这应当理解为要求这样操作以所示出的特定次序或以顺序次序执行,或者要求所有图示的操作应被执行以取得期望的结果。在一定环境下,多任务和并行处理可能是有利的。同样地,虽然在上面论述中包含了若干具体实现细节,但是这些不应当被解释为对本发明的范围的限制。在单独的实施例的上下文中描述的某些特征还可以组合地实现在单个实现中。相反地,在单个实现的上下文中描述的各种特征也可以单独地或以任何合适的子组合的方式实现在多个实现中。In addition, while operations are depicted in a particular order, this should be understood to require that such operations be performed in the particular order shown, or in sequential order, or that all illustrated operations should be performed to achieve desirable results. Under certain circumstances, multitasking and parallel processing may be advantageous. Likewise, while the above discussion contains several specific implementation details, these should not be construed as limitations on the scope of the invention. Certain features that are described in the context of separate embodiments can also be implemented in combination in a single implementation. Conversely, various features that are described in the context of a single implementation can also be implemented in multiple implementations separately or in any suitable subcombination.
尽管已经采用特定于结构特征和/或方法逻辑动作的语言描述了本主题,但是应当理解所附权利要求书中所限定的主题未必局限于上面描述的特定特征或动作。相反,上面所描述的特定特征和动作仅仅是实现权利要求书的示例形式。Although the subject matter has been described in language specific to structural features and/or methodological acts, it is to be understood that the subject matter defined in the appended claims is not necessarily limited to the specific features or acts described above. Rather, the specific features and acts described above are merely example forms of implementing the claims.
Claims (13)


Priority Applications (1)
| Application Number | Priority Date | Filing Date | Title |
|---|---|---|---|
| CN202211118599.XA CN115202163B (en) | 2022-09-15 | 2022-09-15 | Method, apparatus and computer readable storage medium for selecting a photoresist model |
Applications Claiming Priority (1)
| Application Number | Priority Date | Filing Date | Title |
|---|---|---|---|
| CN202211118599.XA CN115202163B (en) | 2022-09-15 | 2022-09-15 | Method, apparatus and computer readable storage medium for selecting a photoresist model |
Publications (2)
| Publication Number | Publication Date |
|---|---|
| CN115202163A CN115202163A (en) | 2022-10-18 |
| CN115202163B true CN115202163B (en) | 2022-12-30 |
Family
ID=83572794
Family Applications (1)
| Application Number | Title | Priority Date | Filing Date |
|---|---|---|---|
| CN202211118599.XA Active CN115202163B (en) | 2022-09-15 | 2022-09-15 | Method, apparatus and computer readable storage medium for selecting a photoresist model |
Country Status (1)
| Country | Link |
|---|---|
| CN (1) | CN115202163B (en) |
Citations (2)
| Publication number | Priority date | Publication date | Assignee | Title |
|---|---|---|---|---|
| CN101464896A (en) * | 2009-01-23 | 2009-06-24 | 安徽科大讯飞信息科技股份有限公司 | Voice fuzzy retrieval method and apparatus |
| CN111010207A (en) * | 2019-12-05 | 2020-04-14 | 北京邮电大学 | A frequency hopping method and device based on quantization correlation |
Family Cites Families (9)
| Publication number | Priority date | Publication date | Assignee | Title |
|---|---|---|---|---|
| US7342646B2 (en) * | 2004-01-30 | 2008-03-11 | Asml Masktools B.V. | Method of manufacturing reliability checking and verification for lithography process using a calibrated eigen decomposition model |
| US7788630B2 (en) * | 2007-03-21 | 2010-08-31 | Synopsys, Inc. | Method and apparatus for determining an optical model that models the effect of optical proximity correction |
| GB2454208A (en) * | 2007-10-31 | 2009-05-06 | Cambridge Silicon Radio Ltd | Compression using a perceptual model and a signal-to-mask ratio (SMR) parameter tuned based on target bitrate and previously encoded data |
| US8413083B2 (en) * | 2009-05-13 | 2013-04-02 | Globalfoundries Singapore Pte. Ltd. | Mask system employing substantially circular optical proximity correction target and method of manufacture thereof |
| US8799832B1 (en) * | 2013-02-08 | 2014-08-05 | Mentor Graphics Corporation | Optical proximity correction for topographically non-uniform substrates |
| EP3318927A1 (en) * | 2016-11-04 | 2018-05-09 | ASML Netherlands B.V. | Method and apparatus for measuring a parameter of a lithographic process, computer program products for implementing such methods & apparatus |
| DE112018000013T5 (en) * | 2017-08-16 | 2019-04-25 | Sda Co., Ltd | METHOD FOR CONTROLLING AN OUTPUT OF AN EXPOSURE PICTURE FOR A DIGITAL MICROSPHERE DEVICE CONTROL TO HIGH-SPEED EXPOSURE OF A FINE ROW WIDTH |
| JP6727478B1 (en) * | 2019-03-28 | 2020-07-22 | 三菱電機株式会社 | Learning device, learning method and program |
| CN111159969B (en) * | 2019-12-30 | 2023-09-22 | 全芯智造技术有限公司 | Method and device for generating multiple patterned photomask layout and computer-readable medium |
-
2022
- 2022-09-15 CN CN202211118599.XA patent/CN115202163B/en active Active
Patent Citations (2)
| Publication number | Priority date | Publication date | Assignee | Title |
|---|---|---|---|---|
| CN101464896A (en) * | 2009-01-23 | 2009-06-24 | 安徽科大讯飞信息科技股份有限公司 | Voice fuzzy retrieval method and apparatus |
| CN111010207A (en) * | 2019-12-05 | 2020-04-14 | 北京邮电大学 | A frequency hopping method and device based on quantization correlation |
Also Published As
| Publication number | Publication date |
|---|---|
| CN115202163A (en) | 2022-10-18 |
Similar Documents
| Publication | Publication Date | Title |
|---|---|---|
| CN109491216B (en) | A method for optimizing photolithography process parameters | |
| CN114326289B (en) | Method, apparatus and storage medium for performing optical proximity correction | |
| US8473271B2 (en) | Fast photolithography process simulation to predict remaining resist thickness | |
| US11415897B2 (en) | Calibrating stochastic signals in compact modeling | |
| US8667430B1 (en) | Methods for directed self-assembly process/proximity correction | |
| US11061373B1 (en) | Method and system for calculating probability of success or failure for a lithographic process due to stochastic variations of the lithographic process | |
| CN113779779A (en) | Method, apparatus and computer-readable storage medium for optimizing a mask | |
| JP2002333700A (en) | Rule-based OPC evaluation method and simulation-based OPC model evaluation method | |
| CN118732419B (en) | Method, device, equipment and medium for compensating wafer surface topography for photolithography deviation | |
| CN117669473B (en) | Method for model calibration, electronic device and storage medium | |
| JPWO2008032646A1 (en) | Numerical simulation system for time-dependent Schrodinger equation | |
| CN118332990B (en) | Calibration method, electronic device and storage medium for OPC model | |
| CN119358486A (en) | Method, electronic device and computer readable storage medium for OPC model | |
| JP2000101063A (en) | Simulating method, simulator, recording medium having recorded simulation program, and manufacture of semiconductor device | |
| US20180196349A1 (en) | Lithography Model Calibration Via Genetic Algorithms with Adaptive Deterministic Crowding and Dynamic Niching | |
| CN117710270A (en) | Method for free-scale optical proximity correction, electronic device and storage medium | |
| CN117055304A (en) | Methods, apparatus and media for generating overlay mark patterns | |
| CN115202163B (en) | Method, apparatus and computer readable storage medium for selecting a photoresist model | |
| US10365557B2 (en) | Compact OPC model generation using virtual data | |
| TWI512389B (en) | Methods for directed self-assembly process/proximity correction | |
| US11270054B1 (en) | Method and system for calculating printed area metric indicative of stochastic variations of the lithographic process | |
| CN119623401B (en) | Method for establishing OPC model, electronic device, storage medium and program product | |
| CN120722645B (en) | Calibration methods, electronic devices, and storage media for optical proximity correction models | |
| CN119624956B (en) | Methods, devices, media, program products and terminals for determining the similarity of curve mask layouts. | |
| CN117008428B (en) | Lithographic simulation method, apparatus and medium |
Legal Events
| Date | Code | Title | Description |
|---|---|---|---|
| PB01 | Publication | ||
| PB01 | Publication | ||
| SE01 | Entry into force of request for substantive examination | ||
| SE01 | Entry into force of request for substantive examination | ||
| GR01 | Patent grant | ||
| GR01 | Patent grant | ||
| CP03 | Change of name, title or address |
Address after: 230088 13 / F, building J2C, phase II, innovation industrial park, 2800 innovation Avenue, hi tech Zone, Hefei City, Anhui Province Patentee after: Quanci Intelligent Manufacturing Technology Co.,Ltd. Country or region after: China Address before: 230088 13 / F, building J2C, phase II, innovation industrial park, 2800 innovation Avenue, hi tech Zone, Hefei City, Anhui Province Patentee before: All core Intelligent Manufacturing Technology Co.,Ltd. Country or region before: China |