CN114965348A - Spectrum analysis method and system based on sewage detection - Google Patents
Spectrum analysis method and system based on sewage detection Download PDFInfo
- Publication number
- CN114965348A CN114965348A CN202210889099.XA CN202210889099A CN114965348A CN 114965348 A CN114965348 A CN 114965348A CN 202210889099 A CN202210889099 A CN 202210889099A CN 114965348 A CN114965348 A CN 114965348A
- Authority
- CN
- China
- Prior art keywords
- spectrum
- absorption spectrum
- water quality
- gaussian
- quality index
- Prior art date
- Legal status (The legal status is an assumption and is not a legal conclusion. Google has not performed a legal analysis and makes no representation as to the accuracy of the status listed.)
- Granted
Links
Images


Classifications
-
- G—PHYSICS
- G01—MEASURING; TESTING
- G01N—INVESTIGATING OR ANALYSING MATERIALS BY DETERMINING THEIR CHEMICAL OR PHYSICAL PROPERTIES
- G01N21/00—Investigating or analysing materials by the use of optical means, i.e. using sub-millimetre waves, infrared, visible or ultraviolet light
- G01N21/17—Systems in which incident light is modified in accordance with the properties of the material investigated
- G01N21/25—Colour; Spectral properties, i.e. comparison of effect of material on the light at two or more different wavelengths or wavelength bands
- G01N21/31—Investigating relative effect of material at wavelengths characteristic of specific elements or molecules, e.g. atomic absorption spectrometry
- G01N21/35—Investigating relative effect of material at wavelengths characteristic of specific elements or molecules, e.g. atomic absorption spectrometry using infrared light
- G01N21/3577—Investigating relative effect of material at wavelengths characteristic of specific elements or molecules, e.g. atomic absorption spectrometry using infrared light for analysing liquids, e.g. polluted water
-
- G—PHYSICS
- G01—MEASURING; TESTING
- G01N—INVESTIGATING OR ANALYSING MATERIALS BY DETERMINING THEIR CHEMICAL OR PHYSICAL PROPERTIES
- G01N21/00—Investigating or analysing materials by the use of optical means, i.e. using sub-millimetre waves, infrared, visible or ultraviolet light
- G01N21/17—Systems in which incident light is modified in accordance with the properties of the material investigated
- G01N21/25—Colour; Spectral properties, i.e. comparison of effect of material on the light at two or more different wavelengths or wavelength bands
- G01N21/31—Investigating relative effect of material at wavelengths characteristic of specific elements or molecules, e.g. atomic absorption spectrometry
- G01N21/35—Investigating relative effect of material at wavelengths characteristic of specific elements or molecules, e.g. atomic absorption spectrometry using infrared light
- G01N21/359—Investigating relative effect of material at wavelengths characteristic of specific elements or molecules, e.g. atomic absorption spectrometry using infrared light using near infrared light
-
- G—PHYSICS
- G06—COMPUTING OR CALCULATING; COUNTING
- G06F—ELECTRIC DIGITAL DATA PROCESSING
- G06F17/00—Digital computing or data processing equipment or methods, specially adapted for specific functions
- G06F17/10—Complex mathematical operations
-
- Y—GENERAL TAGGING OF NEW TECHNOLOGICAL DEVELOPMENTS; GENERAL TAGGING OF CROSS-SECTIONAL TECHNOLOGIES SPANNING OVER SEVERAL SECTIONS OF THE IPC; TECHNICAL SUBJECTS COVERED BY FORMER USPC CROSS-REFERENCE ART COLLECTIONS [XRACs] AND DIGESTS
- Y02—TECHNOLOGIES OR APPLICATIONS FOR MITIGATION OR ADAPTATION AGAINST CLIMATE CHANGE
- Y02A—TECHNOLOGIES FOR ADAPTATION TO CLIMATE CHANGE
- Y02A20/00—Water conservation; Efficient water supply; Efficient water use
- Y02A20/152—Water filtration
Landscapes
- Physics & Mathematics (AREA)
- General Physics & Mathematics (AREA)
- Engineering & Computer Science (AREA)
- Spectroscopy & Molecular Physics (AREA)
- Immunology (AREA)
- Data Mining & Analysis (AREA)
- Health & Medical Sciences (AREA)
- General Health & Medical Sciences (AREA)
- Mathematical Physics (AREA)
- Biochemistry (AREA)
- Analytical Chemistry (AREA)
- Chemical & Material Sciences (AREA)
- Life Sciences & Earth Sciences (AREA)
- Theoretical Computer Science (AREA)
- Pathology (AREA)
- Mathematical Analysis (AREA)
- General Engineering & Computer Science (AREA)
- Software Systems (AREA)
- Databases & Information Systems (AREA)
- Pure & Applied Mathematics (AREA)
- Mathematical Optimization (AREA)
- Computational Mathematics (AREA)
- Algebra (AREA)
- Investigating Or Analysing Materials By Optical Means (AREA)
Abstract
The invention relates to a spectrum analysis technology, and discloses a spectrum analysis method and a system based on sewage detection, wherein the method comprises the steps of preparing data; reducing the absorption spectrum, namely splitting the absorption spectrum into a plurality of Gaussian functions through Gaussian decomposition, and superposing and reducing the absorption spectrum on the split Gaussian functions; sorting, classifying and analyzing the split Gaussian function by using the reduced absorption spectrum to obtain components and component corresponding concentrations in the predicted water sample; calculating the predicted value of the corresponding water quality index according to the components in the water sample and the predicted values of the corresponding concentrations of the components; and comparing errors of the water quality index true value data and the water quality index predicted value, feeding back and optimizing high-grade parameters of Gaussian decomposition to the reduction of the absorption spectrum when the errors are larger than a set first error threshold, and otherwise, outputting the predicted value of the water quality index. The invention carries out spectral analysis by a Gaussian decomposition algorithm, can carry out real-time sewage component analysis, is convenient for automatically controlling component change and water quality detection, and has low cost and strong universality.
Description
Technical Field
The invention relates to a spectrum analysis technology, in particular to a spectrum analysis method and system based on sewage detection.
Background
The sewage treatment technology refers to a technology for separating pollutants contained in sewage or converting the pollutants into harmless substances by various methods to purify the sewage.
The sewage treatment is an important environmental protection project and the water quality detection is not required. Accurate and real water quality detection results can provide basis for timely regulation and control of subsequent sewage treatment processes, so that the stability of sewage treatment efficiency is improved, and the operation cost is reduced.
For the detection of the quality of the sewage, the process of sewage detection mainly depends on manual assay and on-line detection equipment. The manual detection period is long, and a real-time water quality detection result cannot be obtained. Compared with manual detection, the online detection equipment can quickly obtain various water quality detection results. Due to the diversity of water quality detection indexes, a plurality of online detection devices are generally required to be equipped for detecting a plurality of main indexes such as TN, TP and ammonia nitrogen.
Although the online detection equipment is more convenient than manual detection, some problems also exist: the cost of a plurality of online detection devices is high, and the occupied area is large; the on-line detection equipment needs daily maintenance, such as corresponding medicament supplement, and has certain operation cost; the online detection equipment has different detection time for each index, wherein TN is about 30 minutes to obtain one datum, TP is about 30 minutes to obtain one datum, and ammonia nitrogen is about 20 minutes to obtain one datum; the online detection data has errors, and is usually within 10%.
Under the policies of environmental protection and carbon emission reduction, in recent years, sewage detection plants gradually change to intellectualization. Accurate water quality data need to be mastered in time by a sewage detection plant, and parameters of each process section are regulated and controlled in real time, so that energy conservation and emission reduction can be realized.
Compared with the existing water quality on-line detection equipment, the near infrared spectrum technology has certain advantages. The near infrared spectrum region is consistent with the frequency combination of the vibration of the hydrogen-containing group (O-H, N-H, C-H) in the organic molecule and the absorption region of each level of frequency multiplication, the characteristic information of the hydrogen-containing group in the organic molecule can be obtained by scanning the near infrared spectrum of the water sample, and the analysis of the water sample by utilizing the near infrared spectrum technology has the advantages of convenience, rapidness, high efficiency, accuracy, lower cost, no damage to the sample, no consumption of chemical reagents, no environmental pollution and the like.
The near infrared spectrum detection technology has many advantages, but is in the sewage detection industry. The water quality in the sewage detection industry has the characteristics of complex components, large concentration difference, large water quality fluctuation and the like, more and more complex information is contained in the near-infrared spectrum of the sewage water sample, the near-infrared absorption peak of the water has large interference on the absorption peaks of other components, and the difficulty of the spectrum analysis process is large.
Disclosure of Invention
The invention provides a spectrum analysis method and system based on sewage detection, aiming at the problems that in the prior art, sewage detection is carried out through a near-infrared spectrometer, the spectrum analysis difficulty is high, the detection speed is low, and the detection cost is high.
In order to solve the technical problem, the invention is solved by the following technical scheme:
the spectral analysis method based on sewage detection comprises the following steps:
step 1: preparing data, wherein the data comprises water quality index true value data and spectrum data acquired by a near-infrared spectrometer;
step 2: reducing the absorption spectrum, namely splitting the absorption spectrum into a plurality of Gaussian functions through Gaussian decomposition, and superposing and reducing the absorption spectrum on the split Gaussian functions;
and step 3: calculating components in the water sample and predicted values of corresponding concentrations of the components; sorting, classifying and analyzing the Gaussian function split in the step 2 by using the reduced absorption spectrum in the step 2 to obtain components and component corresponding concentrations in the predicted water sample;
and 4, step 4: calculating the predicted value of the corresponding water quality index according to the components in the water sample in the step 3 and the predicted values of the corresponding concentrations of the components;
and 5: and (3) comparing the error between the water quality index true value data in the step (1) and the water quality index predicted value in the step (4), feeding back high-level parameters for optimizing Gaussian decomposition to the step (2) when the error is greater than a set first error threshold, and otherwise, outputting the predicted value of the water quality index.
Preferably, the reduction of the absorption spectrum comprises:
step 2.1: generating a single Gaussian function which is the Gaussian function with disassembly parameters, wherein the disassembly parameters of the Gaussian function comprise the width of the Gaussian function, the height of the Gaussian function and the median of the Gaussian function; the disassembly parameters of the Gaussian function are obtained by random initialization or estimation in a statistical mode;
step 2.2: superposing the Gaussian functions in the step 2.1 to form a fitting spectrum, and comparing the fitting spectrum with the absorption spectrum in the step 1 to obtain an error;
step 2.3: optimizing the disassembling parameters of the Gaussian function in the step 2.1 by using the error in the step 2.2 as feedback through a random gradient descent method, and outputting the Gaussian function corresponding to the optimized disassembling parameters of the Gaussian function;
step 2.4: forming a fitting spectrum after multiple iterations, enabling the fitting spectrum to gradually converge to the absorption spectrum in the step 1, and obtaining a reduction absorption spectrum when the error is lower than a set second error threshold; otherwise, step 2.2 and step 2.3 are repeated.
Preferably, step 3: obtaining components and component corresponding concentrations in the predicted water sample; it comprises the following steps:
step 3.1: clustering the Gaussian functions in the step 2, and superposing the clustered Gaussian functions to form a local absorption peak;
step 3.2: obtaining the probability of the existence of a substance, wherein the local absorption peak formed in the step 3.1 is cross-compared with the absorption spectrum of each substance in the absorption spectrum in the step 1, and when the repetition of the local absorption peak and the absorption spectrum of each substance in the absorption spectrum is more, the probability of the existence of the substance is higher, otherwise, the probability of the existence of the substance is low, and the substance with high probability is output;
step 3.3: obtaining the unit absorption concentration of the substance, obtaining the area under the bottom of a local absorption peak by using a numerical integration method, and calculating the area as the unit absorption concentration of the substance according to the beer law;
step 3.4: and (3) outputting the components and the component concentrations of the water sample, performing point product on the unit absorption concentration of the local absorption peak in the step 3.3 and the probability of absorption of each substance corresponding to the step 3.2 to obtain the absorption concentration of each substance, and outputting the components and the component concentrations of the water sample.
Preferably, step 4: and calculating the predicted value of the corresponding water quality index, and obtaining the predicted value of the component by using a chemometric method through the component concentration and the chemical formula.
Preferably, the water quality index includes a TOC value, a TN value, an NH3 value, and a TP value.
In order to solve the technical problem, the application also provides a spectrum analysis system based on sewage detection, which comprises a spectrum analysis module;
the system comprises a spectrum data preparation module, a data acquisition module and a data acquisition module, wherein the data preparation module is used for preparing data, and the data comprises water quality index true value data and spectrum data acquired by a near-infrared spectrometer;
the absorption spectrum reduction module divides the absorption spectrum into a plurality of Gaussian functions through Gaussian decomposition and superposes and reduces the absorption spectrum on the divided Gaussian functions;
the calculation module is used for calculating components in the water sample and the predicted values of the corresponding concentrations of the components; sorting, classifying and analyzing the split Gaussian function in the reduction module of the absorption spectrum by using the reduced absorption spectrum in the reduction module of the absorption spectrum to obtain components and component corresponding concentrations in the predicted water sample;
a corresponding water quality index prediction value calculation module: calculating the predicted value of the corresponding water quality index according to the components in the water sample and the component corresponding concentration predicted values in the calculation module of the component corresponding concentration predicted values in the water sample;
the output module of the predicted value of the water quality index: and comparing the water quality index true value data of the preparation module of the spectrum data with the water quality index predicted value error in the corresponding water quality index predicted value calculation module, feeding back high-level parameters for optimizing Gaussian decomposition to the reduction module of the absorption spectrum when the error is greater than a set first error threshold, and otherwise, outputting the predicted value of the water quality index.
In order to solve the technical problem, the invention further provides a storage medium which comprises a storage medium for realizing the spectral analysis method based on sewage detection.
In order to solve the technical problem, the invention further provides an electronic device which comprises the electronic device for realizing the spectral analysis method based on the sewage detection.
Due to the adoption of the technical scheme, the invention has the remarkable technical effects that:
the method is used for infrared spectrum analysis of water quality, and can obtain the components and concentration information of TOC, TN, TP and NH3 of the water sample through comprehensive analysis of the near-infrared spectrum of the water sample by a Gaussian decomposition algorithm.
The water quality detection of the invention completes analysis within a few seconds, greatly shortens the detection time and has low error rate of detection data.
The invention provides more and better data for the intelligent operation of the sewage detection process, and is beneficial to improving the intelligent degree of sewage detection.
The invention carries out spectral analysis by a Gaussian decomposition algorithm, can carry out real-time sewage component analysis, thereby being convenient for automatically controlling component change and water quality detection, and has low cost and strong universality.
Drawings
FIG. 1 is a flow chart of the present invention.
FIG. 2 is a flow chart of Gaussian decomposition model training of the present invention.
FIG. 3 is a flow chart of the Gaussian decomposition algorithm of the present invention.
FIG. 4-1 is a chart comparing TOC truth and predicted values in accordance with the present invention;
FIG. 4-2 is a comparison graph of TN truth value and predicted value of the present invention;
FIGS. 4-3 are graphs comparing true and predicted values of NH3 according to the present invention;
FIGS. 4-4 are graphs comparing TP truth and predicted values according to the present invention;
FIG. 5-1 is a waveform diagram of the fitted spectrum and the original absorption spectrum of 0 output of Gaussian decomposition iteration of the present invention;
FIG. 5-2 is a waveform of the fitted spectrum and the original absorption spectrum produced by 1 iteration of Gaussian decomposition in accordance with the present invention;
FIGS. 5-3 are graphs of the fitted and original absorption spectra produced by 10 iterations of Gaussian decomposition in accordance with the present invention;
FIGS. 5-4 are graphs of the fitted spectrum and the original absorption spectrum waveform resulting from 200 iterations of Gaussian decomposition in accordance with the present invention;
FIGS. 5-5 are graphs of the fitted spectrum and the original absorption spectrum waveform resulting from 1100 iterations of Gaussian decomposition in accordance with the present invention;
FIGS. 5-6 are graphs of fitted spectra and original absorption spectrum waveforms resulting from 2400 iterations of Gaussian decomposition in accordance with the present invention;
FIG. 6 is a fitted spectral error convergence plot of the present invention.
Detailed Description
The present invention will be described in further detail with reference to the accompanying drawings and examples.
Example 1
The spectral analysis method based on sewage detection comprises the following steps:
step 1: preparing data, wherein the data comprises water quality index true value data and spectrum data acquired by a near-infrared spectrometer; acquiring true value data of the water quality index through online detection equipment;
step 2: reducing the absorption spectrum, namely splitting the absorption spectrum into a plurality of Gaussian functions through Gaussian decomposition, and superposing and reducing the absorption spectrum on the split Gaussian functions;
and 3, step 3: calculating components in the water sample and predicted values of corresponding concentrations of the components; sorting, classifying and analyzing the Gaussian function split in the step 2 by using the reduced absorption spectrum in the step 2 to obtain components and component corresponding concentrations in the predicted water sample;
and 4, step 4: calculating the predicted value of the corresponding water quality index according to the components in the water sample in the step 3 and the predicted values of the corresponding concentrations of the components;
and 5: and (3) comparing the error between the water quality index true value data in the step (1) and the water quality index predicted value in the step (4), feeding back high-level parameters for optimizing Gaussian decomposition to the step (2) when the error is greater than a set first error threshold, and otherwise, outputting the predicted value of the water quality index. Here the first error threshold is set to 5%; the smaller its error threshold, the higher the accuracy of the return.
The reduction of the absorption spectrum comprises:
step 2.1: generating a single Gaussian function which is the Gaussian function with disassembly parameters, wherein the disassembly parameters of the Gaussian function comprise the width of the Gaussian function, the height of the Gaussian function and the median of the Gaussian function; the disassembly parameters of the Gaussian function are obtained by random initialization or estimation in a statistical mode;
step 2.2: superposing the Gaussian functions in the step 2.1 to form a fitting spectrum, and comparing the fitting spectrum with the absorption spectrum in the step 1 to obtain an error;
step 2.3: optimizing the disassembling parameters of the Gaussian function in the step 2.1 by using the error in the step 2.2 as feedback through a random gradient descent method, and outputting the Gaussian function corresponding to the optimized disassembling parameters of the Gaussian function;
step 2.4: forming a fitting spectrum after multiple iterations, so that the fitting spectrum gradually converges to the absorption spectrum in the step 1, and when the error is lower than a set second error threshold, the set second error threshold is 1%; setting a specific error threshold according to actual precision; obtaining a reduction absorption spectrum; otherwise, step 2.2 and step 2.3 are repeated.
The absorption spectrum of the organic matter includes a single band (monomodal) absorption spectrum or a multiband (multimodal) absorption spectrum. Different substances often absorb in similar spectral regions; the difficulty in analyzing the components of wastewater during detection is to accurately attribute these absorption spectra to the absorption of a substance. The Gaussian function generated in the step 2 is beneficial to improving the resolution, and the Gaussian function can represent the absorption of similar but different substances.
Taking conditional probability as an analysis principle, assuming that an expected absorption spectrum band of a certain substance is cross-compared with an actual current absorption spectrum band, more cross-overlapped parts of the compared spectrum bands indicate higher existence probability of the substance.
And step 3: obtaining components and component corresponding concentrations in the predicted water sample; it includes:
step 3.1: clustering the Gaussian functions in the step 2, and superposing the clustered Gaussian functions to form a local absorption peak;
step 3.2: obtaining the probability of the existence of the substance, wherein the local absorption peak formed in the step 3.1 is in cross contrast with the absorption spectrum of each substance in the absorption spectrum in the step 1, and the more cross coincidence parts of the local absorption peak and the absorption spectrum of each substance in the absorption spectrum are, the higher the probability of the existence of the substance is; otherwise, the probability of the existence of the substance is low, and the substance with high probability is output;
step 3.3: obtaining the unit absorption concentration of the substance, obtaining the area under the bottom of a local absorption peak by using a numerical integration method, and calculating the area as the unit absorption concentration of the substance according to the beer law;
step 3.4: and (3) outputting the components and the component concentrations of the water sample, performing point product on the unit absorption concentration of the local absorption peak in the step 3.3 and the absorption conditional probability of each substance corresponding to the step 3.2 to obtain the absorption concentration of each substance, and outputting the components and the component concentrations of the water sample.
And 4, step 4: and calculating the predicted value of the corresponding water quality index, and obtaining the predicted value of the component by using a chemometric method through the component concentration and the chemical formula.
The water quality index comprises a TOC value, a TN value, an NH3 value and a TP value. For FIG. 4-1, FIG. 4-2, FIG. 4-3 and FIG. 4-4, the chart is divided into a true value and a predicted value comparison chart of the TOC value, a true value and a predicted value comparison chart of the TN value, a true value and a predicted value comparison chart of the NH3 value and a true value and a predicted value comparison chart of the TP value; as can be seen from the graph, the error value of the comparison graph of the true value and the predicted value of the TOC value is 3.73%, which is less than 5% of the first error threshold; the error value of the comparison graph of the true value and the predicted value of the TN value is 4.75 percent and is less than 5 percent of the first error threshold value; the error value of the comparison graph of the true value and the predicted value of the NH3 value is 3.75 percent and is less than 5 percent of the first error threshold value; the error value of the comparison graph of the true value and the predicted value of the TP value is 0.8 percent and is less than 5 percent of the first error threshold value.
Example 2
On the basis of the embodiment 1, the embodiment is a spectral analysis system based on sewage detection, which comprises;
the system comprises a spectrum data preparation module, a data acquisition module and a data acquisition module, wherein the data preparation module is used for preparing data, and the data comprises water quality index true value data and spectrum data acquired by a near-infrared spectrometer;
the absorption spectrum reduction module divides the absorption spectrum into a plurality of Gaussian functions through Gaussian decomposition and superposes and reduces the absorption spectrum on the divided Gaussian functions;
the calculation module is used for calculating components in the water sample and the predicted values of the corresponding concentrations of the components; sorting, classifying and analyzing the split Gaussian function in the reduction module of the absorption spectrum by using the reduced absorption spectrum in the reduction module of the absorption spectrum to obtain components and component corresponding concentrations in the predicted water sample;
a corresponding water quality index prediction value calculation module: calculating the predicted value of the corresponding water quality index according to the components in the water sample and the component corresponding concentration predicted values in the calculation module of the component corresponding concentration predicted values in the water sample;
the output module of the predicted value of the water quality index: and comparing the water quality index true value data of the preparation module of the spectrum data with the water quality index predicted value error in the corresponding water quality index predicted value calculation module, feeding back high-level parameters for optimizing Gaussian decomposition to the reduction module of the absorption spectrum when the error is greater than a set first error threshold, and otherwise, outputting the predicted value of the water quality index.
Example 3
On the basis of the above embodiment, spectral data of 100 rows X228 columns are prepared for the present embodiment through fig. 2 and 3, each row corresponding to the acquired spectrum of a single sample, each column corresponding to a certain spectral band, and the spectral band ranges from 900nm to 1700 nm. Preparing 100 rows of X4 columns of truth value data, wherein each row corresponds to a truth value index detection value (TOC, TP, TN and NH 3) acquired by a single sample; each detection spectral data is obtained by outputting an absorption spectrum of the sample through a near infrared spectrometer. The absorption spectrum ψ (λ) is noise-reduced, thereby improving the S/N signal-to-noise ratio. Here, the noise reduction process is performed using the Savitsky-Golayfilter filtering algorithm.
Gaussian function g n In a Gaussian function g n In the acquiring process, the deviation of the Gaussian function is one of the widths of the Gaussian functions;
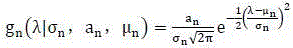
wherein, g n (λ|σ n, a n, μ n ) Is a gaussian function component spectrum; g n Is σ n, a n, μ n The value of time λ; sigma n Is a Gaussian function g n Of (2)Difference, a n Is a Gaussian function g n The height of (d); mu.s n Is a Gaussian function g n A median value of;
first generation Gaussian function g 1 (λ|σ 1, a 1, μ 1 ) The calculation of (a) is performed,
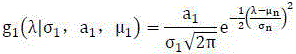
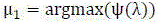
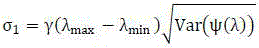
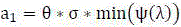
wherein λ max is the maximum wavelength of the sample absorption spectrum, λ min is the minimum wavelength of the sample absorption spectrum, argmax is the input when the function outputs the maximum value, and γ is the gaussian function deviation convergence rate; theta is the high rate of convergence of the Gaussian function, sigma is the deviation of the Gaussian function, a 1 Is the height of the Gaussian function;
calculation of the fitting spectrum f by means of a first generation Gaussian function g 1 Calculating a fitting spectrum f;

where λ is the wavelength, f (λ | σ |) 1, a 1, μ 1 ) For fitting a spectrum sigma 1, a 1, μ 1 The value of time λ;
calculating a variance ϵ, comparing the absorption spectrum psi (lambda) with the fitting spectrum f, and calculating a variance ϵ of the fitting spectrum and the actual absorption spectrum;

second generation gaussian function g 2 The ϵ variance is used as feedback through a gradient descent method, and the width, the height and the median of a Gaussian function are optimized by a set learning rate alpha; computing a second generation Gaussian function g 2 ,

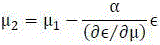
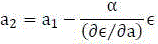
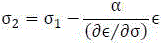
Wherein σ 2 Is a Gaussian function g 2 Deviation a 2 Is a Gaussian function g 2 Height, mu 2 Is a Gaussian function g 2 Median, ∂ ϵ/∂ μ is the slope of the variance and median, ∂ ϵ/∂ a is the slope of the variance and height, ∂ ϵ/∂ σ is the slope of the variance and deviation;
fitting spectrum f n By computing a Gaussian function g i Making n iterations to obtain a fitted spectrum f n ;
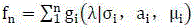
Wherein n is a positive integer, g i (λ|σ i ,a i ,μ i ) Is σ i, a i, μ i The value of time λ;
fitting spectrum f n To the fitted spectrum f n Gradually converge to the absorption spectrum psi (lambda) when the error is smallConvergence threshold ϵ below the fitting variance threshold Stopping iteration;
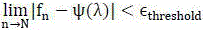
wherein, ϵ threshold Fitting variance convergence threshold, N is the maximum number of fitting spectrum iterations;
first order component spectral sequence G 1 The calculation of (a) is performed,
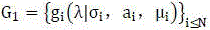
wherein σ i Is a Gaussian function g i Deviation a i Is a Gaussian function g i Height, mu i Is a Gaussian function g i A median value;
second order component spectral sequence G 2 The calculation of (2) is to superpose all the component spectrum sets with median values in the Gaussian sequence at the same or close to each other to form a second-order component spectrum sequence G 2 ;


Wherein k is the kth component spectrum, i and j are component spectrum serial numbers, f k (lambda) is a function of the fitting spectrum value of the kth iteration on the wavelength lambda, and I is the integral area of the fitting spectrum f;
the total absorption spectrum of each band was calculated. The former first-order component spectrum just calculates the contribution formed by the absorption effect from other nearby wave bands for each wave band, and the second-order component spectrum superposes the absorption contributions of the local first-order component spectrums, namely, the first-order component spectrums with the wave bands close enough are gathered and then superposed.
Calculating the probability of the most similar chemical substances and the most similar chemical substances, and comparing the similarity through a plurality of component combinations in the second-order component spectrum sequence and an absorption spectrum database to obtain the most similar chemical substances;
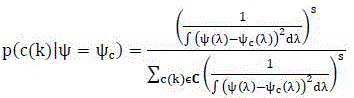
wherein C is a chemical component sequence or set, C (k) is a chemical substance corresponding to the kth component spectrum in the chemical component set, psi c (lambda) is an absorption spectrum database; p (c) (k) | ψ = ψ c ) The probability that the sample absorption spectrum is a chemical substance absorption spectrum is given; s is the extreme of probability distribution;
calculating mass spectrum by multiplying absorption peaks possibly formed by the chemical substances by the corresponding probability of the absorption peaks to obtain mass spectrum f of the chemical substances c And mass spectral area I of chemical species c ;

Wherein f is k (lambda) is a k-th fitted spectrum function, and C (k) is a chemical substance corresponding to the k-th component spectrum in the chemical component set; p is a radical of formula k (k) The probability that the sample absorption spectrum is a chemical substance absorption spectrum is given;
obtaining the unit molar concentration of the chemical substance, and measuring the mass spectrum f c And mass spectrum I c Is dot multiplied to obtain the unit molar concentration of the chemical substance, conc c ;

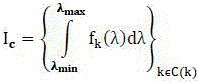
Obtaining a predicted value of a water quality index, wherein the water quality index comprises predicted values of TOC, TN, NH3 and TP, and the predicted values of TOC, TN, NH3 and TP are obtained by a chemometric method through the component molecular quantity and a chemical formula;
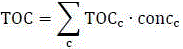
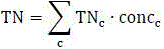

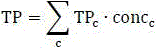
wherein, TOC is the true value of total organic carbon concentration index, TP is the true value of total phosphorus concentration index, TN is the true value of total nitrogen concentration index, NH3 is the true value of ammonia nitrogen concentration index, conc c Is the unit molar concentration of a chemical substance, TOC c TN of a chemical contributing to TOC c Contribution of chemical to TN, NH3 c TP being the contribution of the chemical substance to NH3 c Contribution of chemical to TP.
An evolutionary algorithm (evolutionary stratgies) is a common standard Optimization method for applying a Multi-dimensional Optimization Problem (Multi-dimensional Optimization protocol) in mathematics, is a search algorithm based on biological evolution mechanisms such as natural selection and natural heredity, and is widely used in the fields of engineering design and simulation modeling. The evolutionary computation is also an iterative algorithm, like a common search method, except that the evolutionary computation is generally improved from one group of solutions of the original problem to another group of better solutions in the optimal solution search process, and then is further improved from the improved solutions. In the evolutionary problem, the solution of the original problem must be encoded after the optimization model of the original problem is established. The evolutionary computation utilizes structured and random information in the search process to enable the decision most meeting the target to obtain the maximum survival possibility, and is a probabilistic algorithm.
The method is characterized in that the high-level parameters of two Gaussian decomposition algorithms of gamma and theta are subjected to parameter initialization, gamma and theta are used in model training, gamma and theta are used in the following pseudo codes, gamma and theta are complex numbers of gamma and theta and represent a high-level parameter sequence formed by a plurality of gamma or theta, and an initialization parameter family (also a gamma and theta high-level parameter sequence) can be generated in a random normal distribution mode. The generated parameter family is m _ offset, and is the first generation parameter family generated by the evolutionary algorithm.
Next an iterative loop iteration of the evolutionary algorithm is entered. In each iteration, the component concentration conc _ c and the index prediction Y are calculated by adopting Gaussian decomposition, then the truth value-prediction comparison is carried out on the index prediction Y and the truth value Y _ actual to calculate the absolute error, the parameter number best _ i capable of generating the minimum error is selected from the parameter family, the corresponding optimal parameters gamma and theta are found out through the parameter number, finally the optimal parameters are taken as seeds (superior or inferior), and the seeds are subjected to copy variation (survivors copy variation) by utilizing random normal distribution to form a second-generation parameter family. And then, repeatedly iterating to form a third generation and a fourth generation, and completing all iteration iterations in sequence, or finishing the convergence condition error < error _ threshold of the evolutionary algorithm by triggering.
Generally the gaussian decomposition of the function is non-unique, there are infinite strategies to disassemble the original spectra (strategies with adjustable high-level parameters), so there are infinite component-concentration possibilities, but only one component-concentration possibility is that the actual TOC, TN, NH3, TP values can be fitted. Therefore, the actual errors of the TOC, TN, NH3, TP values and the predicted values are used for feedback optimization, the optimization algorithm adopts an evolutionary algorithm, and finally the original spectrum disassembly strategy is gradually constrained, so that the high-level parameters of the strategy are converged to the optimal state. At this moment, after the training of the Gaussian decomposition model of the single spectrum-true value data is finished, the single strategy high-grade parameter values { gamma, theta } are trained row ;
Repeating the Gaussian decomposition algorithm on the remaining 99 spectrum-true value data to form a strategy high-level parameter sequence { gamma, theta }; averaging the strategy high-level parameter sequences { gamma, theta } to obtain an average optimal disassembly strategy high-level parameter sequence { mean (gamma), mean (theta) }; and storing the high-level parameter sequence { mean (gamma), mean (theta) } of the average optimal disassembly strategy for future use of the model.
5-1, 5-2, 5-3, 5-4, 5-5 and 5-6, wherein, the more the iteration times are, the closer the wave form of the fitting spectrum is to the wave form of the original absorption spectrum, and the closer the predicted value of the water quality index is to the true value of the water quality index.
As can be seen from fig. 6, the larger the number of iterations, the smaller the error of the fitting spectrum.
Example 4
On the basis of embodiment 1, the present embodiment provides a storage medium including a storage medium implementing a spectral analysis method based on sewage detection.
Example 5
On the basis of embodiment 1, the present embodiment provides an electronic device including an electronic device that implements a spectral analysis method based on sewage detection.
Claims (8)
1. The spectral analysis method based on sewage detection is characterized by comprising the following steps:
step 1: preparing data, wherein the data comprises water quality index true value data and spectrum data acquired by a near-infrared spectrometer;
step 2: reducing the absorption spectrum, namely splitting the absorption spectrum into a plurality of Gaussian functions through Gaussian decomposition, and superposing and reducing the absorption spectrum on the split Gaussian functions;
and step 3: calculating components in the water sample and predicted values of corresponding concentrations of the components; sorting, classifying and analyzing the Gaussian function split in the step 2 by using the reduced absorption spectrum in the step 2 to obtain components and component corresponding concentrations in the predicted water sample;
and 4, step 4: calculating the predicted value of the corresponding water quality index according to the components in the water sample in the step 3 and the predicted values of the corresponding concentrations of the components;
and 5: and (3) comparing the water quality index true value data in the step (1) with the water quality index predicted value error in the step (4), feeding back high-level parameters for optimizing Gaussian decomposition to the step (2) when the error is greater than a set first error threshold, and otherwise, outputting the predicted value of the water quality index.
2. The method for spectral resolution based on sewage detection according to claim 1, wherein the reduction of the absorption spectrum comprises:
step 2.1: generating a single Gaussian function which is the Gaussian function with disassembly parameters, wherein the disassembly parameters of the Gaussian function comprise the width of the Gaussian function, the height of the Gaussian function and the median of the Gaussian function; the disassembly parameters of the Gaussian function are obtained by random initialization or estimation in a statistical mode;
step 2.2: superposing the Gaussian functions in the step 2.1 to form a fitting spectrum, and comparing the fitting spectrum with the absorption spectrum in the step 1 to obtain an error;
step 2.3: optimizing the disassembling parameters of the Gaussian function in the step 2.1 by using the error in the step 2.2 as feedback through a random gradient descent method, and outputting the Gaussian function corresponding to the optimized disassembling parameters of the Gaussian function;
step 2.4: forming a fitting spectrum after multiple iterations, enabling the fitting spectrum to gradually converge to the absorption spectrum in the step 1, and obtaining a reduction absorption spectrum when the error is lower than a set second error threshold; otherwise, step 2.2 and step 2.3 are repeated.
3. The method for spectral analysis based on sewage detection according to claim 1, wherein step 3: obtaining components and component corresponding concentrations in the predicted water sample; it includes:
step 3.1: clustering the Gaussian functions in the step 2, and superposing the clustered Gaussian functions to form a local absorption peak;
step 3.2: obtaining the probability of the existence of a substance, wherein the local absorption peak formed in the step 3.1 is cross-compared with the absorption spectrum of each substance in the absorption spectrum in the step 1, and when the repetition of the local absorption peak and the absorption spectrum of each substance in the absorption spectrum is more, the probability of the existence of the substance is higher, otherwise, the probability of the existence of the substance is low, and the substance with high probability is output;
step 3.3: obtaining the unit absorption concentration of the substance, obtaining the area under the bottom of a local absorption peak by using a numerical integration method, and calculating the area as the unit absorption concentration of the substance according to the beer law;
step 3.4: and (3) outputting the components and the component concentrations of the water sample, performing point product on the unit absorption concentration of the local absorption peak in the step 3.3 and the probability of absorption of each substance corresponding to the step 3.2 to obtain the absorption concentration of each substance, and outputting the components and the component concentrations of the water sample.
4. The method for spectral analysis based on sewage detection according to claim 1, wherein the step 4: and calculating the predicted value of the corresponding water quality index, and obtaining the predicted value of the component by using a chemometric method through the component concentration and the chemical formula.
5. The method for spectral analysis based on sewage detection according to claim 1, wherein the water quality index comprises a TOC index, a TN index, an NH3 index and a TP index.
6. The spectrum analysis system based on sewage detection is characterized by comprising a spectrum analysis module;
the system comprises a spectrum data preparation module, a data acquisition module and a data acquisition module, wherein the data preparation module is used for preparing data, and the data comprises water quality index true value data and spectrum data acquired by a near-infrared spectrometer;
the absorption spectrum reduction module divides the absorption spectrum into a plurality of Gaussian functions through Gaussian decomposition and superposes and reduces the absorption spectrum on the divided Gaussian functions;
the calculation module is used for calculating components in the water sample and the predicted values of the corresponding concentrations of the components; sorting, classifying and analyzing the split Gaussian function in the reduction module of the absorption spectrum by using the reduced absorption spectrum in the reduction module of the absorption spectrum to obtain components and component corresponding concentrations in the predicted water sample;
a corresponding water quality index prediction value calculation module: calculating the predicted value of the corresponding water quality index according to the components in the water sample and the component corresponding concentration predicted values in the calculation module of the component corresponding concentration predicted values in the water sample;
the output module of the predicted value of the water quality index: and comparing the water quality index true value data of the preparation module of the spectrum data with the water quality index predicted value error in the corresponding water quality index predicted value calculation module, feeding back high-level parameters for optimizing Gaussian decomposition to the reduction module of the absorption spectrum when the error is greater than a set first error threshold, and otherwise, outputting the predicted value of the water quality index.
7. A storage medium comprising a storage medium for implementing the spectral analysis method based on wastewater detection according to any one of claims 1 to 5.
8. An electronic device comprising an electronic device implementing the spectral analysis method based on wastewater detection according to any one of claims 1 to 5.
Priority Applications (1)
| Application Number | Priority Date | Filing Date | Title |
|---|---|---|---|
| CN202210889099.XA CN114965348B (en) | 2022-07-27 | 2022-07-27 | Spectral analysis method and system based on sewage detection |
Applications Claiming Priority (1)
| Application Number | Priority Date | Filing Date | Title |
|---|---|---|---|
| CN202210889099.XA CN114965348B (en) | 2022-07-27 | 2022-07-27 | Spectral analysis method and system based on sewage detection |
Publications (2)
| Publication Number | Publication Date |
|---|---|
| CN114965348A true CN114965348A (en) | 2022-08-30 |
| CN114965348B CN114965348B (en) | 2022-11-15 |
Family
ID=82969683
Family Applications (1)
| Application Number | Title | Priority Date | Filing Date |
|---|---|---|---|
| CN202210889099.XA Active CN114965348B (en) | 2022-07-27 | 2022-07-27 | Spectral analysis method and system based on sewage detection |
Country Status (1)
| Country | Link |
|---|---|
| CN (1) | CN114965348B (en) |
Cited By (1)
| Publication number | Priority date | Publication date | Assignee | Title |
|---|---|---|---|---|
| CN118794923A (en) * | 2024-09-10 | 2024-10-18 | 北京百灵天地环保科技股份有限公司 | A method for detecting sewage treatment effect based on spectral analysis |
Citations (23)
| Publication number | Priority date | Publication date | Assignee | Title |
|---|---|---|---|---|
| US6518573B1 (en) * | 1998-08-28 | 2003-02-11 | Wellesley International C.V. | Suppression of undesired components in the measured spectra of spectrometers |
| US20060253267A1 (en) * | 2005-05-04 | 2006-11-09 | Giovanni Bonvicini | Method of information analysis |
| US20070211248A1 (en) * | 2006-01-17 | 2007-09-13 | Innovative American Technology, Inc. | Advanced pattern recognition systems for spectral analysis |
| CN101819168A (en) * | 2010-01-06 | 2010-09-01 | 北京矿冶研究总院 | Spectral analysis method |
| US20140117229A1 (en) * | 2012-10-26 | 2014-05-01 | Fei Company | Mineral identification using sequential decomposition into elements from mineral definitions |
| US20150066387A1 (en) * | 2013-08-30 | 2015-03-05 | Shimadzu Corporation | Substance identification method and mass spectrometer using the same |
| US20150247813A1 (en) * | 2014-02-28 | 2015-09-03 | Bruker Biospin Gmbh | Method for determining the concentration of a substance in a sample |
| CN105184099A (en) * | 2015-10-09 | 2015-12-23 | 中国环境科学研究院 | Method for estimating contribution of algae to water quality CODMn |
| CN105203565A (en) * | 2014-06-11 | 2015-12-30 | 成都理工大学 | Energy spectrum overlapping peak analysis method |
| CN106706548A (en) * | 2017-02-15 | 2017-05-24 | 江阴市纤维检验所 | Polyester fiber qualitative identification method based on infrared spectral curve fitting peak splitting technique |
| CN107247888A (en) * | 2017-08-14 | 2017-10-13 | 吉林大学 | Sewage disposal water outlet total phosphorus TP flexible measurement methods based on reserve pool network |
| CN107462535A (en) * | 2017-08-17 | 2017-12-12 | 中国科学院烟台海岸带研究所 | A kind of spectrum resolution algorithm based on Gaussian rough surface |
| CN109470667A (en) * | 2018-11-14 | 2019-03-15 | 华东理工大学 | A method for traceability of pollutants by combining water quality parameters and three-dimensional fluorescence spectra |
| CN110836878A (en) * | 2019-11-01 | 2020-02-25 | 同济大学 | Convolution interpolation coupling Gaussian mixture model rapid three-dimensional fluorescence peak searching method |
| CN112362635A (en) * | 2020-11-02 | 2021-02-12 | 公安部第三研究所 | Remote material detection device based on ultraviolet Raman spectrum analysis |
| CN112557332A (en) * | 2020-12-03 | 2021-03-26 | 华东理工大学 | Spectrum segmentation and spectrum comparison method based on spectrum peak-splitting fitting |
| CN112666084A (en) * | 2021-01-04 | 2021-04-16 | 国网山西省电力公司电力科学研究院 | SF based on Raman spectrum6Noise reduction method for decomposition characteristic component detection |
| CN112834448A (en) * | 2020-12-31 | 2021-05-25 | 杭州罗盘星科技有限公司 | Spectral decomposition method for water pollutant analysis |
| WO2021234622A1 (en) * | 2020-05-21 | 2021-11-25 | 3M Innovative Properties Company | Air quality assessment based upon optical absorbance |
| CN113984708A (en) * | 2021-10-22 | 2022-01-28 | 浙江中烟工业有限责任公司 | Maintenance method and device of chemical index detection model |
| US20220146417A1 (en) * | 2018-12-29 | 2022-05-12 | Sichuan Belam Technology Co., Ltd. | Method for constructing water quality index prediction models and method for monitoring water quality indexes |
| CN114624142A (en) * | 2022-03-07 | 2022-06-14 | 浙江中烟工业有限责任公司 | Tobacco leaf total sugar and reducing sugar quantitative analysis method based on pyrolysis kinetic parameters |
| US20220198303A1 (en) * | 2019-04-15 | 2022-06-23 | Riken | Device, method and program for environmental factor estimation, learned model and recording medium |
-
2022
- 2022-07-27 CN CN202210889099.XA patent/CN114965348B/en active Active
Patent Citations (23)
| Publication number | Priority date | Publication date | Assignee | Title |
|---|---|---|---|---|
| US6518573B1 (en) * | 1998-08-28 | 2003-02-11 | Wellesley International C.V. | Suppression of undesired components in the measured spectra of spectrometers |
| US20060253267A1 (en) * | 2005-05-04 | 2006-11-09 | Giovanni Bonvicini | Method of information analysis |
| US20070211248A1 (en) * | 2006-01-17 | 2007-09-13 | Innovative American Technology, Inc. | Advanced pattern recognition systems for spectral analysis |
| CN101819168A (en) * | 2010-01-06 | 2010-09-01 | 北京矿冶研究总院 | Spectral analysis method |
| US20140117229A1 (en) * | 2012-10-26 | 2014-05-01 | Fei Company | Mineral identification using sequential decomposition into elements from mineral definitions |
| US20150066387A1 (en) * | 2013-08-30 | 2015-03-05 | Shimadzu Corporation | Substance identification method and mass spectrometer using the same |
| US20150247813A1 (en) * | 2014-02-28 | 2015-09-03 | Bruker Biospin Gmbh | Method for determining the concentration of a substance in a sample |
| CN105203565A (en) * | 2014-06-11 | 2015-12-30 | 成都理工大学 | Energy spectrum overlapping peak analysis method |
| CN105184099A (en) * | 2015-10-09 | 2015-12-23 | 中国环境科学研究院 | Method for estimating contribution of algae to water quality CODMn |
| CN106706548A (en) * | 2017-02-15 | 2017-05-24 | 江阴市纤维检验所 | Polyester fiber qualitative identification method based on infrared spectral curve fitting peak splitting technique |
| CN107247888A (en) * | 2017-08-14 | 2017-10-13 | 吉林大学 | Sewage disposal water outlet total phosphorus TP flexible measurement methods based on reserve pool network |
| CN107462535A (en) * | 2017-08-17 | 2017-12-12 | 中国科学院烟台海岸带研究所 | A kind of spectrum resolution algorithm based on Gaussian rough surface |
| CN109470667A (en) * | 2018-11-14 | 2019-03-15 | 华东理工大学 | A method for traceability of pollutants by combining water quality parameters and three-dimensional fluorescence spectra |
| US20220146417A1 (en) * | 2018-12-29 | 2022-05-12 | Sichuan Belam Technology Co., Ltd. | Method for constructing water quality index prediction models and method for monitoring water quality indexes |
| US20220198303A1 (en) * | 2019-04-15 | 2022-06-23 | Riken | Device, method and program for environmental factor estimation, learned model and recording medium |
| CN110836878A (en) * | 2019-11-01 | 2020-02-25 | 同济大学 | Convolution interpolation coupling Gaussian mixture model rapid three-dimensional fluorescence peak searching method |
| WO2021234622A1 (en) * | 2020-05-21 | 2021-11-25 | 3M Innovative Properties Company | Air quality assessment based upon optical absorbance |
| CN112362635A (en) * | 2020-11-02 | 2021-02-12 | 公安部第三研究所 | Remote material detection device based on ultraviolet Raman spectrum analysis |
| CN112557332A (en) * | 2020-12-03 | 2021-03-26 | 华东理工大学 | Spectrum segmentation and spectrum comparison method based on spectrum peak-splitting fitting |
| CN112834448A (en) * | 2020-12-31 | 2021-05-25 | 杭州罗盘星科技有限公司 | Spectral decomposition method for water pollutant analysis |
| CN112666084A (en) * | 2021-01-04 | 2021-04-16 | 国网山西省电力公司电力科学研究院 | SF based on Raman spectrum6Noise reduction method for decomposition characteristic component detection |
| CN113984708A (en) * | 2021-10-22 | 2022-01-28 | 浙江中烟工业有限责任公司 | Maintenance method and device of chemical index detection model |
| CN114624142A (en) * | 2022-03-07 | 2022-06-14 | 浙江中烟工业有限责任公司 | Tobacco leaf total sugar and reducing sugar quantitative analysis method based on pyrolysis kinetic parameters |
Non-Patent Citations (5)
| Title |
|---|
| MICHAEL L.WHITING ET AL.: "Predicting water content using Gaussian model on soil spectra", 《REMOTE SENSING ENVIRONMENT》 * |
| V.A.SOLE ET AL.: "A multiplatform code for the analysis of energy-dispersive X-ray fluorescence spectra", 《SPECTROCHIMICA 》 * |
| 宋琛超等: "不同产地鱼腥草药材挥发油成分的研究", 《分析测试学报》 * |
| 王倩茹等: "单个油包裹体和微区沥青显微红外光谱分峰拟合技术及应用", 《地球科学》 * |
| 褚小立等: "用于近红外光谱分析的化学计量学方法研究与应用进展", 《分析化学》 * |
Cited By (2)
| Publication number | Priority date | Publication date | Assignee | Title |
|---|---|---|---|---|
| CN118794923A (en) * | 2024-09-10 | 2024-10-18 | 北京百灵天地环保科技股份有限公司 | A method for detecting sewage treatment effect based on spectral analysis |
| CN118794923B (en) * | 2024-09-10 | 2024-11-29 | 北京百灵天地环保科技股份有限公司 | A method for detecting sewage treatment effect based on spectral analysis |
Also Published As
| Publication number | Publication date |
|---|---|
| CN114965348B (en) | 2022-11-15 |
Similar Documents
| Publication | Publication Date | Title |
|---|---|---|
| Mehrani et al. | Application of a hybrid mechanistic/machine learning model for prediction of nitrous oxide (N2O) production in a nitrifying sequencing batch reactor | |
| CN110379463B (en) | Marine algae cause analysis and concentration prediction method and system based on machine learning | |
| Chechik et al. | Information bottleneck for Gaussian variables | |
| US10570024B2 (en) | Method for effluent total nitrogen-based on a recurrent self-organizing RBF neural network | |
| US20220051074A1 (en) | Quantitative spectral data analysis and processing method based on deep learning | |
| CN109187392B (en) | Zinc liquid trace metal ion concentration prediction method based on partition modeling | |
| CN109344971B (en) | Effluent ammonia nitrogen concentration prediction method based on adaptive recursive fuzzy neural network | |
| CN113435707B (en) | Soil testing formula fertilization method based on deep learning and weighted multi-factor evaluation | |
| CN112989704B (en) | IRFM-CMNN effluent BOD concentration prediction method based on DE algorithm | |
| CN114965348B (en) | Spectral analysis method and system based on sewage detection | |
| Ju et al. | Rapid Identification of Atmospheric Gaseous Pollutants Using Fourier‐Transform Infrared Spectroscopy Combined with Independent Component Analysis | |
| CN105067550B (en) | A kind of infrared spectrum Wavelength selecting method based on the optimization of piecemeal sparse Bayesian | |
| CN108509692B (en) | A Modeling Method for High Sulfur Natural Gas Desulfurization Process Based on MiUKFNN Algorithm | |
| CN112631255B (en) | Variational self-encoder model-based sewage treatment process fault monitoring method | |
| CN120490000A (en) | Deep learning-based gaseous pollutant Fourier transform infrared spectrum analysis method | |
| CN119715492A (en) | A Raman spectroscopy detection method for mixed fishery drugs | |
| CN118585788A (en) | A feature extraction method for detecting pollutants with overlapping absorption spectra | |
| CN113686810B (en) | A near-infrared spectroscopy wavelength selection method based on convolutional neural network | |
| Efitorov et al. | Use of adaptive methods to solve the inverse problem of determination of composition of multi-component solutions | |
| CN114943176B (en) | A spectrum sample generation method for water COD detection | |
| Gueye et al. | RTCNet: A robust hybrid deep learning model for soil property prediction under noisy conditions | |
| Gao et al. | Combining orthogonal signal correction and wavelet packet transform with partial least squares to analyze overlapping spectra of three kinds of metal ions | |
| CN115774964B (en) | Method for optimizing SVM model prediction and optimizing total nitrogen of condensate treatment system effluent based on annealing algorithm | |
| Zhang et al. | Research on water quality prediction based on PE-CNN-GRU hybrid model | |
| CN118619442B (en) | Ozone Dosing Control Method Based on Real-time Ultraviolet Spectroscopy Monitoring |
Legal Events
| Date | Code | Title | Description |
|---|---|---|---|
| PB01 | Publication | ||
| PB01 | Publication | ||
| SE01 | Entry into force of request for substantive examination | ||
| SE01 | Entry into force of request for substantive examination | ||
| GR01 | Patent grant | ||
| GR01 | Patent grant |