CN114269916A - Device and method for sample analysis - Google Patents
Device and method for sample analysis Download PDFInfo
- Publication number
- CN114269916A CN114269916A CN202080050994.1A CN202080050994A CN114269916A CN 114269916 A CN114269916 A CN 114269916A CN 202080050994 A CN202080050994 A CN 202080050994A CN 114269916 A CN114269916 A CN 114269916A
- Authority
- CN
- China
- Prior art keywords
- sample
- fixed sequence
- sequence oligonucleotides
- region
- locus
- Prior art date
- Legal status (The legal status is an assumption and is not a legal conclusion. Google has not performed a legal analysis and makes no representation as to the accuracy of the status listed.)
- Pending
Links
Images


Classifications
-
- C—CHEMISTRY; METALLURGY
- C12—BIOCHEMISTRY; BEER; SPIRITS; WINE; VINEGAR; MICROBIOLOGY; ENZYMOLOGY; MUTATION OR GENETIC ENGINEERING
- C12N—MICROORGANISMS OR ENZYMES; COMPOSITIONS THEREOF; PROPAGATING, PRESERVING, OR MAINTAINING MICROORGANISMS; MUTATION OR GENETIC ENGINEERING; CULTURE MEDIA
- C12N15/00—Mutation or genetic engineering; DNA or RNA concerning genetic engineering, vectors, e.g. plasmids, or their isolation, preparation or purification; Use of hosts therefor
- C12N15/09—Recombinant DNA-technology
- C12N15/10—Processes for the isolation, preparation or purification of DNA or RNA
- C12N15/1003—Extracting or separating nucleic acids from biological samples, e.g. pure separation or isolation methods; Conditions, buffers or apparatuses therefor
- C12N15/1006—Extracting or separating nucleic acids from biological samples, e.g. pure separation or isolation methods; Conditions, buffers or apparatuses therefor by means of a solid support carrier, e.g. particles, polymers
- C12N15/101—Extracting or separating nucleic acids from biological samples, e.g. pure separation or isolation methods; Conditions, buffers or apparatuses therefor by means of a solid support carrier, e.g. particles, polymers by chromatography, e.g. electrophoresis, ion-exchange, reverse phase
-
- C—CHEMISTRY; METALLURGY
- C12—BIOCHEMISTRY; BEER; SPIRITS; WINE; VINEGAR; MICROBIOLOGY; ENZYMOLOGY; MUTATION OR GENETIC ENGINEERING
- C12Q—MEASURING OR TESTING PROCESSES INVOLVING ENZYMES, NUCLEIC ACIDS OR MICROORGANISMS; COMPOSITIONS OR TEST PAPERS THEREFOR; PROCESSES OF PREPARING SUCH COMPOSITIONS; CONDITION-RESPONSIVE CONTROL IN MICROBIOLOGICAL OR ENZYMOLOGICAL PROCESSES
- C12Q1/00—Measuring or testing processes involving enzymes, nucleic acids or microorganisms; Compositions therefor; Processes of preparing such compositions
- C12Q1/68—Measuring or testing processes involving enzymes, nucleic acids or microorganisms; Compositions therefor; Processes of preparing such compositions involving nucleic acids
- C12Q1/6806—Preparing nucleic acids for analysis, e.g. for polymerase chain reaction [PCR] assay
-
- C—CHEMISTRY; METALLURGY
- C12—BIOCHEMISTRY; BEER; SPIRITS; WINE; VINEGAR; MICROBIOLOGY; ENZYMOLOGY; MUTATION OR GENETIC ENGINEERING
- C12Q—MEASURING OR TESTING PROCESSES INVOLVING ENZYMES, NUCLEIC ACIDS OR MICROORGANISMS; COMPOSITIONS OR TEST PAPERS THEREFOR; PROCESSES OF PREPARING SUCH COMPOSITIONS; CONDITION-RESPONSIVE CONTROL IN MICROBIOLOGICAL OR ENZYMOLOGICAL PROCESSES
- C12Q1/00—Measuring or testing processes involving enzymes, nucleic acids or microorganisms; Compositions therefor; Processes of preparing such compositions
- C12Q1/68—Measuring or testing processes involving enzymes, nucleic acids or microorganisms; Compositions therefor; Processes of preparing such compositions involving nucleic acids
- C12Q1/6813—Hybridisation assays
- C12Q1/6827—Hybridisation assays for detection of mutation or polymorphism
-
- C—CHEMISTRY; METALLURGY
- C12—BIOCHEMISTRY; BEER; SPIRITS; WINE; VINEGAR; MICROBIOLOGY; ENZYMOLOGY; MUTATION OR GENETIC ENGINEERING
- C12Q—MEASURING OR TESTING PROCESSES INVOLVING ENZYMES, NUCLEIC ACIDS OR MICROORGANISMS; COMPOSITIONS OR TEST PAPERS THEREFOR; PROCESSES OF PREPARING SUCH COMPOSITIONS; CONDITION-RESPONSIVE CONTROL IN MICROBIOLOGICAL OR ENZYMOLOGICAL PROCESSES
- C12Q1/00—Measuring or testing processes involving enzymes, nucleic acids or microorganisms; Compositions therefor; Processes of preparing such compositions
- C12Q1/68—Measuring or testing processes involving enzymes, nucleic acids or microorganisms; Compositions therefor; Processes of preparing such compositions involving nucleic acids
- C12Q1/6876—Nucleic acid products used in the analysis of nucleic acids, e.g. primers or probes
- C12Q1/6883—Nucleic acid products used in the analysis of nucleic acids, e.g. primers or probes for diseases caused by alterations of genetic material
-
- C—CHEMISTRY; METALLURGY
- C12—BIOCHEMISTRY; BEER; SPIRITS; WINE; VINEGAR; MICROBIOLOGY; ENZYMOLOGY; MUTATION OR GENETIC ENGINEERING
- C12Q—MEASURING OR TESTING PROCESSES INVOLVING ENZYMES, NUCLEIC ACIDS OR MICROORGANISMS; COMPOSITIONS OR TEST PAPERS THEREFOR; PROCESSES OF PREPARING SUCH COMPOSITIONS; CONDITION-RESPONSIVE CONTROL IN MICROBIOLOGICAL OR ENZYMOLOGICAL PROCESSES
- C12Q1/00—Measuring or testing processes involving enzymes, nucleic acids or microorganisms; Compositions therefor; Processes of preparing such compositions
- C12Q1/70—Measuring or testing processes involving enzymes, nucleic acids or microorganisms; Compositions therefor; Processes of preparing such compositions involving virus or bacteriophage
- C12Q1/701—Specific hybridization probes
-
- C—CHEMISTRY; METALLURGY
- C12—BIOCHEMISTRY; BEER; SPIRITS; WINE; VINEGAR; MICROBIOLOGY; ENZYMOLOGY; MUTATION OR GENETIC ENGINEERING
- C12Q—MEASURING OR TESTING PROCESSES INVOLVING ENZYMES, NUCLEIC ACIDS OR MICROORGANISMS; COMPOSITIONS OR TEST PAPERS THEREFOR; PROCESSES OF PREPARING SUCH COMPOSITIONS; CONDITION-RESPONSIVE CONTROL IN MICROBIOLOGICAL OR ENZYMOLOGICAL PROCESSES
- C12Q2600/00—Oligonucleotides characterized by their use
- C12Q2600/156—Polymorphic or mutational markers
Landscapes
- Chemical & Material Sciences (AREA)
- Life Sciences & Earth Sciences (AREA)
- Organic Chemistry (AREA)
- Health & Medical Sciences (AREA)
- Engineering & Computer Science (AREA)
- Wood Science & Technology (AREA)
- Zoology (AREA)
- Proteomics, Peptides & Aminoacids (AREA)
- Analytical Chemistry (AREA)
- Genetics & Genomics (AREA)
- Bioinformatics & Cheminformatics (AREA)
- Biotechnology (AREA)
- General Engineering & Computer Science (AREA)
- Biophysics (AREA)
- Immunology (AREA)
- Microbiology (AREA)
- Biochemistry (AREA)
- Physics & Mathematics (AREA)
- Molecular Biology (AREA)
- General Health & Medical Sciences (AREA)
- Biomedical Technology (AREA)
- Virology (AREA)
- Pathology (AREA)
- Chemical Kinetics & Catalysis (AREA)
- Crystallography & Structural Chemistry (AREA)
- Plant Pathology (AREA)
- Measuring Or Testing Involving Enzymes Or Micro-Organisms (AREA)
- Apparatus Associated With Microorganisms And Enzymes (AREA)
Abstract
The present disclosure relates generally to devices and methods for performing epitope electrophoresis. Accelerated electrophoresis may be used to perform sample analysis, such as by selective separation, detection, extraction, and/or preconcentration of target analytes, e.g., DNA, RNA, and/or other biological molecules. The target analyte may be collected after accelerated electrophoresis and used for desired downstream applications and further analysis.
Description
Technical Field
The present disclosure relates generally to the field of electrophoresis, and more particularly to sample analysis by selectively separating, detecting, extracting, and/or (pre) concentrating a sample (e.g., a biological sample) by an apparatus and method for accelerated electrophoresis (epiphoresis).
Background
Electrophoretic methods have long been used for the separation and analysis of samples for a variety of purposes, such as identifying particular substances or determining the size and type of molecules in solution. For example, a variety of molecular biology applications have employed electrophoresis to separate proteins or nucleic acids, determine molecular weight, and/or prepare samples for further analysis. In these and other applications, electrophoresis generally involves the movement of charged species (e.g., molecules or ions) under the influence of an electric field. Such movement may facilitate separation of the sample from other samples or substances. Once separated, the sample can be readily analyzed using optical or other methods.
Various electrophoresis-based methods are often used in conjunction with different applications depending on the particular needs of the analysis to be performed. For example, isotachophoresis ("ITP") is a concentration and separation technique that focuses (and in some cases separates) ionic analytes into distinct regions ("focal zones") using electrolytes with different electrophoretic mobilities. In ITP, analytes are focused and separated simultaneously between high effective mobility leading electrolyte ("LE") ions and low effective mobility trailing electrolyte ("TE") ions. In ITP, the balance of electromigration and diffusion at the region boundary typically results in a sharply moving boundary.
ITP has traditionally been implemented using devices and methods featuring capillary or microfluidic channel designs. Such devices and methods are only capable of handling small volumes (μ l scale) of sample for analysis, which may make analysis of biological samples, such as extraction of nucleic acids from blood and/or plasma, difficult. Therefore, further development of devices and methods for analyzing samples that may include large volumes may be beneficial. Accelerated electrophoresis methods that provide faster sample analysis are also beneficial.
Disclosure of Invention
The present disclosure generally relates to a method for isolating and/or purifying one or more cell-free nucleic acids from a sample, wherein the method comprises a. providing a device for performing accelerated Electrophoresis (ETP); b. providing a sample comprising the one or more cell-free nucleic acids; c. performing one or more accelerated electrophoresis runs to focus the one or more cell-free nucleic acids ("cfNA") into one or more focal regions, e.g., as one or more ETP bands, by performing ETP using the apparatus; collecting the one or more cfNA by collecting the one or more focusing regions comprising the one or more cfNA; thereby obtaining one or more isolated and/or purified cfNA. In some embodiments, the one or more cfnas can comprise cell-free DNA and/or cell-free RNA. In some embodiments, the sample comprising the one or more cell-free nucleic acids can comprise a blood, plasma, urine, lymph, and/or serum sample. In some embodiments, the sample may comprise maternal blood, plasma, and/or serum. In some embodiments, the one or more cell-free nucleic acids can comprise one or more circulating tumor nucleic acids (ctnas), e.g., wherein the one or more ctnas comprise circulating tumor DNA and/or circulating tumor RNA. In some embodiments, the one or more cell-free nucleic acids can comprise one or more circulating viral nucleic acids (cvnas), e.g., wherein the one or more cvnas comprise circulating viral DNA and/or circulating viral RNA.
In some embodiments, the ETP-based isolation and/or purification of the one or more cell-free nucleic acids can be such that 1% or less, 1% or more, 5% or more, 10% or more, 15% or more, 20% or more, 25% or more, 30% or more, 35% or more, 40% or more, 45% or more, 50% or more, 55% or more, 60% or more, 65% or more, 70% or more, 85% or more, 90% or more, 95% or more, or 99% or more of the one or more cell-free nucleic acids contained in the original sample are isolated and collected. In some embodiments, the method can produce 1% or less, 1% or more, 5% or more, 10% or more, 15% or more, 20% or more, 25% or more, 30% or more, 35% or more, 40% or more, 45% or more, 50% or more, 55% or more, 60% or more, 65% or more, 70% or more, 85% or more, 90% or more, 95% or more, or 99% or more purity of the one or more target analytes, e.g., as measured by analytical techniques, to determine the composition of an ETP isolated/purified sample comprising the one or more target analytes. In some embodiments, one or more buffer concentrations, such as LE and/or TE buffer concentrations, the percentage of gel contained in the ETP device, and/or the dwell time of an ETP-based isolation and collection run, may be varied and/or optimized to enhance the isolation of the one or more cfnas from other materials contained in the sample. In some embodiments, the sample may be digested with proteinase K prior to performing step c. In some embodiments, the one or more cfnas can be about 1000bp or longer, 1000bp or shorter, 900bp or shorter, 800bp or shorter, 700bp or shorter, 600bp or shorter, 500bp or shorter, 400bp or shorter, 300bp or shorter, 250bp or shorter, 200bp or shorter, 150bp or shorter in length. In some embodiments, the isolated and/or purified cfNA can be used in one or more downstream in vitro diagnostic applications. In some embodiments, the method can further comprise detecting the one or more cfnas during and/or after the ETP-based isolation and/or purification, e.g., the detecting comprises optical detecting, in some cases, wherein the optical detecting comprises detecting an intercalating dye and/or an optical tag that binds to or associates with the one or more cfnas. In some embodiments, the detecting may comprise electrical detecting.
In some embodiments, the method may be an automated method, wherein the sample of step b. In some embodiments, one or more isolated and/or purified cfnas may undergo one or more further ETP runs to further isolate and/or purify the one or more cfnas. In some embodiments, the method may further comprise at least one SPRI bead-based cleaning step after step d. In some embodiments, the methods can produce cfNA yields of 1.25-fold or more, 1.5-fold or more, 1.75-fold or more, 2.0-fold or more, 2.25-fold or more, 2.5-fold or more, 2.75-fold or more, 3-fold or more, 4-fold or more, 5-fold or more, 10-fold or more, 100-fold or more, or 1000-fold or more cfNA as compared to methods practiced without ETP-based isolation and/or purification. In some embodiments, the methods can obtain about 1.00ng or less, 1.0ng or more, 2.0ng or more, 3.0ng or more, 4.0ng or more, 5.0ng or more, 5.5ng or more, 6.0ng or more, 6.5ng or more, 6.8ng or more, 10ng or more, 50ng or more, or 100ng or more of the isolated and/or purified cfNA.
In some embodiments, the method may further comprise using a marker on ETP during step c. In some embodiments, the episomal marker can be larger in size and/or longer in length than the one or more cfnas. In some embodiments, the genetic marker on ETP may be generated by restriction digestion of a plasmid. In some embodiments, the restriction digestion may produce about 1000bp of an ETP episomal marker. In some embodiments, the isolated and/or purified cfNA may be further subjected to cancer personalized profiling by deep sequencing (CAPP-Seq). In some embodiments, the isolated and/or purified cfNA can be used to assess the risk of fetal aneuploidy. In some embodiments, one or more biomarkers of the isolated and/or purified cfNA can be determined. In some embodiments, the ratio and/or amount of fetal to maternal cfNA may be analyzed for the isolated and/or purified cfNA. In some embodiments, the isolated and/or purified cfNA may further undergo an assay system that utilizes both non-polymorphism and polymorphism detection to determine source contribution and Copy Number Variation (CNV). In some embodiments, isolated and/or purified cfNA may be analyzed for specific polymorphisms that are used to determine the percent contribution of the fetus to the maternal sample. In some embodiments, the isolated and/or purified cfNA can be further evaluated in one or more assays for identifying CNVs and sources of infection. In some embodiments, the isolated and/or purified cfNA can be further evaluated by one or more methods of detecting quantitative and qualitative tumor-specific changes in cfNA (such as DNA strand integrity, mutation frequency, microsatellite abnormalities, and gene methylation). In some embodiments, the isolated and/or purified cfNA can be further evaluated by one or more methods to detect diagnostic, prognostic, and monitoring markers in a sample, e.g., from a cancer patient. In some embodiments, the methods may be further combined with CNV detection to provide methods for aiding clinical diagnosis, treatment, outcome prediction, and progression monitoring of patients having or suspected of having a malignancy. In some embodiments, the isolated and/or purified cfNA may be further evaluated in one or more assay systems suitable for monitoring organ health of a transplanted patient, e.g., using cfDNA detection in combination with SNP or mutation detection in one or more single genes. In some embodiments, the isolated and/or purified cfNA may be further subjected to methods for detecting genetic characteristics in a sample, including Copy Number Variation (CNV), insertions, deletions, translocations, polymorphisms, and mutations. In some embodiments, the concentration of any one or more of the one or more isolated and/or purified cfnas can be determined. In some embodiments, the concentration may be determined by molecular barcodes. In some embodiments, the isolated and/or purified cfNA may further undergo analysis, including the use of ctDNA detection indices. In some embodiments, the isolated and/or purified cfNA can be further analyzed for tumor-derived SNV. In some embodiments, the concentration of one or more isolated and/or purified cfnas can be measured. In some embodiments, the sample volume of the sample in step b. may be 0.25mL or less, 0.25mL or more, 0.5mL or more, 0.75mL or more, 1.0mL or more, 2.5mL or more, 5.0mL or more, 7.5mL or more, 10.0mL or more, 12.5mL or more, or 15.0mL or more. In some embodiments, the cfNA can comprise a cfNA derived from one or more cancer cells.
Furthermore, the present disclosure relates generally to an assay for detecting the contribution of origin of fetal origin and the presence or absence of fetal Copy Number Variation (CNV) in one or more genomic regions in a maternal sample comprising fetal and maternal cell-free DNA, the assay comprising the steps of: a. isolating and/or purifying cfNA, e.g., cfDNA, from a maternal sample by performing ETP-based isolation and/or purification to obtain an isolated and/or purified maternal sample; b. hybridizing (i) a first set of two or more fixed sequence oligonucleotides to (ii) cell-free DNA in the isolated and/or purified maternal sample, wherein the first set of fixed sequence oligonucleotides comprises first and second fixed sequence oligonucleotides that are complementary to a contiguous region within each of at least 48 and less than 2000 loci in the first genomic region, wherein at least one of the first set of fixed sequence oligonucleotides comprises a universal primer region and the melting temperature (Tm) of the first fixed sequence oligonucleotide in the first set of fixed sequence oligonucleotides ranges from two degrees celsius; c. hybridizing (i) a second set of two or more fixed sequence oligonucleotides to (ii) cell-free DNA in the isolated and/or purified maternal sample, wherein the second set of fixed sequence oligonucleotides comprises first and second fixed sequence oligonucleotides that are complementary to a contiguous region within each of at least 48 and less than 2000 loci in the second genomic region, wherein at least one of the second set of fixed sequence oligonucleotides comprises a universal primer region and the Tm of the first fixed sequence oligonucleotide in the second set of fixed sequence oligonucleotides ranges from two degrees celsius; d. hybridizing (i) a third set of at least two fixed sequence oligonucleotides to (ii) cell-free DNA in the isolated and/or purified maternal sample, wherein the third set of at least two fixed sequence oligonucleotides are complementary to contiguous, polymorphic regions of two or more polymorphic information loci; e. ligating the hybridized first set of fixed sequence oligonucleotides to generate contiguous ligation products complementary to the first genomic region, ligating the hybridized second set of fixed sequence oligonucleotides to generate contiguous ligation products complementary to the second genomic region, and ligating the hybridized third set of fixed sequence oligonucleotides to generate contiguous ligation products complementary to the polymorphic information locus; f. amplifying the contiguous ligation products using the universal primer region to generate amplification products; g. detecting amplification products by averaging at least 100 measurements of each locus from the first genomic region and the second genomic region using high throughput sequencing; determining the relative frequency of the measured loci from the first and second genomic regions, wherein the relative frequency of the measured loci from the first genomic region is different from the relative frequency of the measured loci from the second genomic region, indicating the presence of fetal copy number variation, the determining being independent of detection of polymorphisms within the first and second genomic regions, and the proportion of sequence reads at the polymorphic information loci that originate from fetal origin and maternal origin is indicative of an origin contribution, wherein the origin contribution from fetal origin is at least 5% and less than 25%.
Furthermore, the present disclosure relates generally to an assay for detecting the contribution of origin of a fetal source and the presence or absence of a fetal aneuploidy in a maternal sample comprising fetal and maternal cell-free DNA using a single assay, the assay comprising the steps of: a. isolating and/or purifying cfNA, e.g., cfDNA, from a maternal sample by performing ETP-based isolation and/or purification to obtain an isolated and/or purified maternal sample; b. hybridizing (i) a first set of two or more fixed sequence oligonucleotides to (ii) cell-free DNA in the isolated and/or purified maternal sample, wherein the first set of fixed sequence oligonucleotides comprises first and second fixed sequence oligonucleotides that are complementary to a contiguous region within each of at least 48 and less than 2000 loci corresponding to a first chromosome, and the melting temperature (Tm) of the first fixed sequence oligonucleotides in the first set of fixed sequence oligonucleotides ranges from two degrees celsius; c. hybridizing (i) a second set of two or more fixed sequence oligonucleotides to (ii) cell-free DNA in the isolated and/or purified maternal sample, wherein the second set of fixed sequence oligonucleotides comprises first and second fixed sequence oligonucleotides that are complementary to a contiguous region within each of at least 48 and less than 2000 loci corresponding to the second chromosome, and the Tm of the first fixed sequence oligonucleotide in the second set of fixed sequence oligonucleotides ranges from two degrees celsius; d. hybridizing (i) a third set of at least two fixed sequence oligonucleotides to (ii) cell-free DNA in the isolated and/or purified maternal sample, wherein the third set of at least two fixed sequence oligonucleotides are complementary to contiguous, polymorphic regions of two or more polymorphic information loci; e. ligating the hybridized first set of fixed sequence oligonucleotides to generate contiguous ligation products complementary to a locus on the first chromosome, ligating the hybridized second set of fixed sequence oligonucleotides to generate contiguous ligation products complementary to a locus on the second chromosome, and ligating the hybridized third set of fixed sequence oligonucleotides to generate contiguous ligation products complementary to a polymorphic information locus; f. amplifying the consecutive ligation products to generate amplification products; g. detecting amplification products by measuring each locus on the first chromosome, each locus on the second chromosome, and each informative locus on an average of at least 100 times using high throughput sequencing; determining the relative frequency of the measured loci from the first and second genomic regions, wherein the relative frequency of the measured loci from the first genomic region is different from the relative frequency of the measured loci from the second genomic region, indicating the presence of fetal copy number variation, the determining being independent of detection of polymorphisms within the first and second genomic regions, and the proportion of sequence reads at the polymorphic information loci that originate from fetal origin and maternal origin is indicative of an origin contribution, wherein the origin contribution from fetal origin is at least 5% and less than 25%.
Furthermore, the present disclosure relates generally to an assay for detecting the contribution of origin of fetal origin and the presence or absence of fetal CNV in one or more genomic regions within a maternal sample comprising fetal and maternal cell-free DNA, the assay comprising the steps of: a. isolating and/or purifying cfNA, e.g., cfDNA, from a maternal sample by performing ETP-based isolation and/or purification to obtain an isolated and/or purified maternal sample; b. hybridizing (i) a first set of two or more fixed sequence oligonucleotides to (ii) cell-free DNA in the isolated and/or purified maternal sample, wherein the first set of fixed sequence oligonucleotides comprises first and second fixed sequence oligonucleotides that are complementary to regions of twenty-four or more loci in the first genomic region, and the melting temperature (Tm) of the first fixed sequence oligonucleotides in the first set of fixed sequence oligonucleotides ranges from two degrees celsius; c. hybridizing (i) a second set of two or more fixed sequence oligonucleotides to (ii) cell-free DNA in the isolated and/or purified maternal sample, wherein the second set of fixed sequence oligonucleotides comprises first and second fixed sequence oligonucleotides that are complementary to regions of twenty-four or more loci in the second genomic region, and the Tm of the first fixed sequence oligonucleotide in the second set of fixed sequence oligonucleotides ranges from two degrees celsius; d. hybridizing (i) a third set of at least two fixed sequence oligonucleotides to (ii) cell-free DNA in the isolated and/or purified maternal sample, wherein the third set of at least two fixed sequence oligonucleotides are complementary to contiguous, polymorphic regions of two or more polymorphic information loci; e. hybridizing (i) bridging oligonucleotides to (ii) cell-free DNA in the isolated and/or purified maternal sample, wherein the bridging oligonucleotides are complementary to regions in the loci between the regions complementary to the first, second and third sets of fixed sequence oligonucleotides; f. ligating the first set of fixed sequence oligonucleotides to the bridging oligonucleotides to generate contiguous ligation products complementary to loci in the first genomic region, ligating the second set of fixed sequence oligonucleotides to the bridging oligonucleotides to generate contiguous ligation products complementary to loci associated with the second genomic region, and ligating the hybridized third set of fixed sequence oligonucleotides to generate contiguous ligation products complementary to polymorphic information loci; g. amplifying the consecutive ligation products to generate amplification products; h. detecting amplification products by measuring each locus in the first genomic region and each locus in the second genomic region an average of at least 100 times using high throughput sequencing; determining the relative frequency of the measured loci from the first and second genomic regions, wherein the relative frequency of the measured loci from the first genomic region is different from the relative frequency of the measured loci from the second genomic region, indicating the presence of fetal copy number variation, the determining being independent of detection of polymorphisms within the first and second genomic regions, and the proportion of sequence reads at the polymorphic information loci that originate from fetal origin and maternal origin is indicative of an origin contribution, wherein the origin contribution from fetal origin is at least 5% and less than 25%.
Furthermore, the present disclosure relates generally to an assay method for providing a statistical likelihood of fetal copy number variation, comprising: providing a maternal plasma or serum sample comprising maternal and fetal cell-free DNA; isolating and/or purifying the cell-free DNA by performing ETP-based isolation and/or purification; interrogating at least 48 non-polymorphic loci from the first target genomic region by hybridizing sets of at least two fixed sequence oligonucleotides comprising a region complementary to a locus in the first target genomic region, wherein one of the fixed sequence oligonucleotides of each set comprises a first capture region, a first tag binding region and two restriction sites; interrogating at least 48 non-polymorphic loci from a second target genomic region by hybridizing sets of at least two fixed sequence oligonucleotides comprising a region complementary to a locus in the second target genomic region, wherein one of the fixed sequence oligonucleotides of each set comprises a first capture region, a second tag binding region and two restriction sites; ligating the hybridized fixed sequence oligonucleotides; amplifying the ligated fixed sequence oligonucleotides to generate amplicons; cleaving the amplicons at the restriction sites to generate cleaved amplicons, wherein each cleaved amplicon comprises a first capture region and a first or second tag binding region; detecting the cleaved amplicons from the first and second target genomic regions by hybridizing a first capture region of the cleaved amplicons to an array comprising capture probes complementary to the first capture region, wherein the cleaved amplicons from the first and second target genomic regions competitively hybridize to the capture probes complementary to the first capture region; quantifying the capture region of the cleaved amplicon by detecting the first and second tag binding regions to determine the relative frequency of the interrogated non-polymorphic loci from the first and second target genomic regions; estimating a relative frequency of the first and second target genomic regions based on the determined relative frequencies of the first and second tag binding regions; for each polymorphic locus, interrogating at least 48 polymorphic loci from at least one target genomic region different from the first and second target genomic regions by hybridizing sets of at least three fixed sequence allele-specific oligonucleotides, wherein two of the at least three allele-specific oligonucleotides of each set comprise a sequence complementary to one allele at the polymorphic locus, a capture region specific for each polymorphic locus, a different tag binding region for each allele at the polymorphic locus, and two restriction sites; ligating the hybridized fixed sequence allele-specific oligonucleotides; amplifying the ligated fixed sequence allele-specific oligonucleotides to generate allele-specific amplicons; cleaving the allele-specific amplicons at the restriction sites to generate cleaved allele-specific amplicons, wherein each cleaved allele-specific amplicon comprises a polymorphic locus-specific capture region and an allele-specific tag binding region; detecting a cleaved allele-specific amplicon from the polymorphic locus by competitively hybridizing a polymorphic locus-specific capture region of the cleaved allele-specific amplicon to a capture region on the array; quantifying the alleles of the polymorphic loci by detecting allele-specific tag binding regions for each allele on the cleaved allele-specific amplicons to determine the fraction of fetal DNA in the sample; determining a fraction of fetal DNA; and calculating a statistical likelihood of fetal copy number variation in the maternal sample using the estimated relative frequencies of the first and second target genomic regions in the sample and the fraction of fetal DNA.
Further, the present disclosure relates generally to an assay method for determining the likelihood of a fetal aneuploidy comprising the steps of: providing a maternal plasma or serum sample comprising maternal and fetal cell-free DNA; isolating and/or purifying the cell-free DNA by performing an ETP-based isolation and/or purification, thereby obtaining an isolated and/or purified maternal sample; introducing at least fifty first sets of two or more fixed sequence oligonucleotides complementary to a non-polymorphic locus under conditions that allow the complementary region of each fixed sequence oligonucleotide to specifically hybridize to the non-polymorphic locus in a first target genomic region in an isolated and/or purified maternal sample, wherein at least one of the fixed sequence oligonucleotides of each set comprises a universal primer site, a first capture region, a first tag binding region, and two restriction sites; introducing at least fifty second sets of two or more fixed sequence oligonucleotides complementary to a non-polymorphic locus under conditions that allow the complementary region of each fixed sequence oligonucleotide to specifically hybridize to the non-polymorphic locus in a second target genomic region in an isolated and/or purified maternal sample, wherein at least one of the fixed sequence oligonucleotides of each set comprises a universal primer site, a first capture region, a second tag binding region, and two restriction sites; introducing at least fifty third sets of three or more fixed sequence oligonucleotides complementary to a set of polymorphic loci in an isolated and/or purified maternal sample under conditions that allow the complementary region of each fixed sequence oligonucleotide to specifically hybridize to a polymorphic locus, wherein at least two of the three fixed sequence oligonucleotides of each set comprise a universal primer site, a sequence complementary to one allele at a polymorphic locus, an allele-specific tag binding region for each allele at a polymorphic locus, two restriction sites, and a polymorphic locus-specific capture region, wherein the capture region for each polymorphic locus is different from the capture region for each other polymorphic locus and different from the first capture region; hybridizing the first, second and third sets of fixed sequence oligonucleotides to the first and second target genomic regions and to the polymorphic locus; extending at least one of the hybridized first, second, and third sets of fixed sequence oligonucleotides to form adjacently hybridized fixed sequence oligonucleotides; ligating the hybridized first, second, and third sets of fixed sequence oligonucleotides to generate ligation products; amplifying the ligation products using the universal primer sites to generate amplicons corresponding to the polymorphic loci; cleaving the amplicons at the restriction sites to generate cleaved amplicons, wherein each cleaved amplicon comprises a capture region and a tag binding region; applying the cleaved amplicons to an array, wherein the array comprises a first capture probe complementary to a first capture region on the cleaved amplicons from the first and second target genomic regions, and wherein the array comprises a capture probe complementary to a capture region on the cleaved amplicons from each of the polymorphic loci; hybridizing first capture regions of the cleaved amplicons from the first and second target genomic regions to first capture probes on the array; hybridizing capture regions of cleaved amplicons from the polymorphic loci to capture probes on the array; detecting the hybridized cleaved amplicons; quantifying the relative frequency of cleaved amplicons corresponding to a locus from the first target genomic region and the relative frequency of cleaved amplicons corresponding to a locus from the second target genomic region by detecting the first and second tag binding regions; quantifying the relative frequency of each allele from the polymorphic locus by detecting an allele-specific tag-binding region for each allele on the lysed amplicon to determine the percentage of fetal cell-free DNA; and calculating the likelihood of a fetal aneuploidy using the relative frequency of cleaved amplicons corresponding to loci from the first and second target genomic regions used to determine the likelihood of a fetal aneuploidy and the determined percentage of fetal cell-free DNA.
Further, the present disclosure relates generally to an assay method for determining the likelihood of a fetal aneuploidy comprising the steps of: providing a maternal plasma or serum sample comprising maternal and fetal cell-free DNA; isolating and/or purifying the cell-free DNA by performing an ETP-based isolation and/or purification, thereby obtaining an isolated and/or purified maternal sample; introducing at least fifty first sets of two or more fixed sequence oligonucleotides complementary to a set of non-polymorphic loci in a first target genomic region in a maternal sample under conditions that allow the complementary region of each fixed sequence oligonucleotide to specifically hybridize to the set of non-polymorphic loci, wherein at least one of the fixed sequence oligonucleotides of each set comprises a universal primer site, a first capture region, a first tag binding region, and two restriction sites; introducing at least fifty second sets of two or more fixed sequence oligonucleotides complementary to a set of non-polymorphic loci under conditions that allow the complementary region of each fixed sequence oligonucleotide to specifically hybridize to the set of non-polymorphic loci in a second target genomic region in an isolated and/or purified maternal sample, wherein at least one of the fixed sequence oligonucleotides of each set comprises a universal primer site, a first capture region, a second tag binding region, and two restriction sites; introducing two or more sets of a third set of three or more fixed sequence oligonucleotides complementary to a set of polymorphic loci in an isolated and/or purified maternal sample under conditions that allow the complementary region of each fixed sequence oligonucleotide to specifically hybridize to a polymorphic locus, wherein at least two of the three or more fixed sequence oligonucleotides of each set comprise a universal primer site, a sequence complementary to one allele at the polymorphic locus, an allele-specific tag binding region for each allele at the polymorphic locus, two restriction sites, and a polymorphic locus-specific capture region, wherein the capture region for each polymorphic locus is different from the capture region for each other polymorphic locus and different from the first capture region; hybridizing the first, second and third sets of fixed sequence oligonucleotides to the first and second target genomic regions and to the polymorphic locus; extending at least one of the hybridized first, second, and third sets of fixed sequence oligonucleotides to form adjacently hybridized fixed sequence oligonucleotides for each set; ligating adjacently hybridized fixed sequence oligonucleotides from the first, second, and third sets to generate ligation products; amplifying the ligation products using the universal primer sites to generate amplicons; cleaving the amplicons at the restriction sites to generate cleaved amplicons, wherein each cleaved amplicon comprises a capture region and a tag binding region; applying the cleaved amplicons to an array, wherein the array comprises a first capture probe complementary to a first capture region on the cleaved amplicons from the first and second target genomic regions, and wherein the array comprises a capture probe complementary to a capture region on the cleaved amplicons from each of the polymorphic loci; hybridizing first capture regions of the cleaved amplicons from the first and second target genomic regions to first capture probes on the array; hybridizing capture regions of cleaved amplicons from the polymorphic loci to capture probes on the array; detecting the hybridized cleaved amplicons; quantifying the relative frequency of each allele from the polymorphic locus by detecting an allele-specific tag-binding region for each allele on the lysed amplicon to determine the percentage of fetal cell-free DNA; determining the percentage of fetal cell-free DNA by identifying low frequency alleles from the quantified alleles in the event that the maternal locus is homozygous and the corresponding fetal locus is heterozygous; quantifying the relative frequency of cleaved amplicons corresponding to a locus from the first target genomic region and the relative frequency of cleaved amplicons corresponding to a locus from the second target genomic region by detecting the first and second tag binding regions; and, calculating the likelihood of fetal aneuploidy using the relative frequencies of cleaved amplicons corresponding to loci from the first and second target genomic regions and the percentage of fetal cell-free DNA.
Furthermore, the present disclosure relates generally to a non-invasive method of identifying a tumor-derived SNV comprising (a) obtaining a sample from a subject having cancer or suspected of having cancer; (b) performing an ETP-based isolation and/or purification to isolate and/or purify a target nucleic acid, e.g., cfNA, e.g., cNA, to obtain an isolated and/or purified sample; (c) performing a sequencing reaction on the isolated and/or purified sample to generate sequencing information; (d) applying an algorithm to the sequencing information to generate a series of candidate tumor alleles based on the sequencing information from step (c), wherein the candidate tumor alleles comprise non-dominant bases that are not germline SNPs; and (e) identifying a tumor-derived SNV based on the set of candidate tumor alleles. In some embodiments, the candidate tumor allele can comprise a genomic region comprising the candidate SNV.
Further, the present disclosure relates generally to a method for detecting, diagnosing, prognosing or therapy selecting a subject having a disease or disorder, comprising: (a) obtaining sequence information of a subject-derived cell-free dna (cfDNA) sample, wherein the cfDNA sample is isolated and/or purified by performing ETP-based isolation and/or purification; and (b) using the sequence information derived from (a) to detect cell-free non-germline DNA (cfNG-DNA) in the sample, wherein the method may be capable of detecting a percentage of cfNG-DNA that may be less than 2% or greater than about 2% of the total cfDNA. Furthermore, the present disclosure relates generally to a non-invasive method of identifying cfNA derived from a virus comprising (a) obtaining a sample from a subject suspected of having a viral infection or suspected of having been exposed to a virus; (b) performing an ETP-based isolation and/or purification to isolate and/or purify a target cfNA to obtain an isolated and/or purified sample; (c) performing a sequencing reaction on the isolated and/or purified sample to generate sequencing information; and (d) determining whether the subject has been infected with one or more viruses based on the sequencing information. Furthermore, the present disclosure relates generally to an ETP-based separation and collection apparatus for performing any of the methods described herein.
Drawings
FIG. 1 provides a schematic diagram of an exemplary apparatus for performing accelerated electrophoresis.
Fig. 2A provides a schematic diagram of a top view of an exemplary apparatus for performing accelerated electrophoresis. In FIG. 2A, the numbers 1-8 refer to the following: 1. an outer circular electrode; 2. terminating the electrolyte cell; 3. a leading electrolyte, optionally contained within a gel or otherwise hydrodynamically separated from a terminating electrolyte; 4. a leading electrolyte electrode/collection cell; 5. a center electrode; 6. a power source; 7. a boundary between the leading electrolyte and the terminating electrolyte, between which the sample ions are focused; and 8. a bottom support; and the symbols r and d represent the radius of the leading electrolyte cell and the distance traveled by the LE/TE boundary, respectively.
Fig. 2B provides a schematic diagram of a side view of an exemplary apparatus for performing accelerated electrophoresis. In FIG. 2B, the numbers 1-8 refer to the following: 1. an outer circular electrode; 2. terminating the electrolyte cell; 3. a leading electrolyte, optionally contained within a gel or otherwise hydrodynamically separated from a terminating electrolyte; 4. a leading electrolyte electrode/collection cell; 5. a center electrode; 6. a power source; 7. a boundary between the leading electrolyte and the terminating electrolyte, between which the sample ions are focused; and 8. a bottom support; and the symbols r and d represent the radius of the leading electrolyte cell and the distance traveled by the LE/TE boundary, respectively.
Fig. 3 provides a schematic diagram of an exemplary apparatus for performing accelerated electrophoresis.
Fig. 4 provides a schematic diagram of an exemplary apparatus for performing accelerated electrophoresis. In fig. 4, the numbers 1-10 refer to the following: 1. an outer circular electrode; 2. terminating the electrolyte cell; 3. a leading electrolyte, optionally contained within a gel or otherwise hydrodynamically separated from a terminating electrolyte; 4. an opening to a leading electrolyte/collection tank; 5. a center electrode; 6. a power source; 7. a boundary between the leading electrolyte and the terminating electrolyte, between which the sample ions are focused; 8. a bottom support; 9. a tube connection to a leading electrolyte cell; 10. a lead electrolyte cell.
Fig. 5 provides a schematic of an exemplary apparatus for performing accelerated electrophoresis in which the sample is loaded between loading the leading electrolyte and the terminating electrolyte.
Fig. 6A provides a schematic diagram of an apparatus for performing accelerated electrophoresis, and the equation described in example 2 refers to this figure.
Fig. 6B provides a graph representing the distance d traveled in cm versus the relative velocity at distance d when operating the exemplary apparatus for accelerating electrophoresis (fig. 6A) using constant current. For the example presented in fig. 6B, the radius value 5 and the start speed value 1 are used.
Fig. 6C provides a graph representing the distance d traveled in cm versus the relative velocity at distance d when operating the exemplary apparatus for accelerating electrophoresis (fig. 6A) using a constant voltage. For the example presented in fig. 6C, a radius value of 5 and a start speed value of 1 are used.
Fig. 6D provides a graph representing the distance D traveled in cm versus the relative velocity at distance D when operating the exemplary apparatus for accelerating electrophoresis (fig. 6A) using constant power. For the example presented in fig. 6D, the radius value 5 and the start speed value 1 are used.
Fig. 7 provides an image of an accelerated electrophoresis apparatus for concentrating a sample according to example 3.
Fig. 8A provides an image of an exemplary apparatus for accelerated electrophoresis used in accordance with example 4.
FIG. 8B provides an image of an exemplary apparatus for accelerated electrophoresis for focusing a sample to a focal region according to example 4.
Figure 8C provides an image of an exemplary apparatus for accelerated electrophoresis for focusing a sample to a focal region according to example 4.
Fig. 9A provides an image of an exemplary apparatus for accelerated electrophoresis used in accordance with example 5.
Fig. 9B provides a schematic of an exemplary apparatus for accelerating electrophoresis for use in accordance with example 5. In fig. 9B, the numbers refer to dimensions in millimeters.
FIG. 9C provides an image of an exemplary apparatus for accelerated electrophoresis for focusing a sample to a focal region according to example 5.
FIG. 9D provides an image of an exemplary apparatus for accelerated electrophoresis for focusing a sample to a focal region according to example 5.
FIG. 10 provides an image of an exemplary apparatus for accelerated electrophoresis for focusing a sample to a focal region according to example 5.
FIG. 11 provides an image of an exemplary apparatus for accelerated electrophoresis for separating and focusing two different samples to a focal region according to example 5.
Fig. 12 provides an image of an exemplary apparatus for accelerated electrophoresis according to example 6.
Fig. 13A provides an image of an exemplary accelerated electrophoresis device according to example 7.
Fig. 13B provides a schematic of an exemplary accelerated electrophoresis device according to example 7. "a" corresponds to the central collection well and "b" corresponds to the leading electrolyte cell.
Fig. 14A provides an image of an exemplary conductivity measurement probe for use in an accelerated electrophoresis apparatus according to example 7.
Fig. 14B provides an image showing a closer view of the conductivity measurement probe shown in fig. 14A.
Fig. 15A provides an image of an exemplary accelerated electrophoresis device with conductivity probes according to example 7.
Fig. 15B provides a conductivity trace for the operation of an exemplary accelerated electrophoresis device according to example 7.
Figure 16A provides an image of an exemplary accelerated electrophoresis device having conductivity detection probes disposed below a semi-permeable membrane according to example 7.
Fig. 16B provides an image of an exemplary base substrate incorporating two conductivity detection probes connected by a dedicated channel located within the center post.
Fig. 17A provides an image of an exemplary accelerated electrophoresis apparatus, demonstrating focusing of a fluorescein-labeled DNA ladder sample according to example 7.
Fig. 17B provides the absorption spectra of the raw sample and the collected DNA step sample fractions before and after the accelerated electrophoresis run according to example 7.
Figure 17C provides data from electrophoresis-based analysis of DNA ladder samples before and after the accelerated electrophoresis run according to example 7.
Figure 18 provides an image of an ETP device and accessory according to example 8. a represents an ETP device; b represents a rectangular cover of the ETP apparatus; c represents a circular cover of the ETP apparatus; and d represents a teflon rod for adjusting the position of the movable central piston of the ETP device.
Figure 19 provides an image of the ETP experimental setup according to example 8.
Fig. 20 provides time lapse images of cfDNA isolated/purified from 1mL plasma according to example 9.
Figure 21 provides (QUBIT-based) measurements of cfDNA concentration isolated/purified by ETP-based isolation/purification and subsequent bead-based purification according to example 10. Measurement data of cfDNA concentration isolated/purified by spin column or bead-based methods are also presented.
Figure 22 provides data from size-based analysis of cfDNA and DNA ladders isolated/purified by ETP-based isolation/purification from plasma samples with DNA ladders added according to example 11.
Figure 23 provides data from size-based analysis of cfDNA isolated/purified from plasma samples by ETP-based isolation/purification according to example 12.
Fig. 24 provides data from size-based analysis of cfDNA isolated/purified by ETP-based isolation/purification according to example 13.
Fig. 25 provides measured values of ctDNA concentration isolated/purified by ETP-based isolation/purification and subsequent bead-based purification according to example 14. Also presented are measured data of ctDNA concentration isolated/purified by a spin column based method.
Figure 26 provides data from an electrophoresis-based analysis of the ETP episomal markers generated by digestion of the vector with three restriction enzymes according to example 15.
Detailed Description
Definition of
As used herein, the singular forms "a", "an" and "the" include plural references unless the context clearly dictates otherwise. Thus, for example, reference to "a cell" includes a plurality of such cells, and reference to "the protein" includes reference to one or more proteins and equivalents thereof known to those skilled in the art, and so forth. Unless otherwise defined, all technical and scientific terms used herein have the same meaning as commonly understood by one of ordinary skill in the art to which this invention belongs.
The term "electric field" is used to denote an effect resulting from the presence of an electric charge (such as an electron, ion, or proton) in a space or volume of medium surrounding it. Each charge distribution contributes to the entire field at one point on a superimposed basis. An electric charge placed in a space or surrounding medium volume has a force acting on it. The electric field may be generated by a voltage difference: the higher the voltage, the stronger the resulting field. Conversely, a magnetic field may be generated when current flows: the larger the current, the stronger the magnetic field. An electric field may be present even if no current flows. The electric field may be measured in volts per meter (V/m). In some embodiments, to induce movement of the charged particles in the present methods and apparatus, the electric field strength may be from about 10V to about 10kV and the electric power may be from about 1mW to about 100W, in a convenient time range. In some embodiments, the maximum electrical power for the fastest analysis may depend on the resistivity of the sample and electrolyte solution as well as the cooling capacity of the materials that may be used to construct the devices described herein.
As used herein, the term "isotachophoresis" generally refers to the separation of charged particles by creating boundaries or interfaces between materials (e.g., between charged particles and other materials in a solution) using an electric field. ITPs typically use multiple electrolytes in which the electrophoretic mobility of the sample ions is less than that of the Leading Electrolyte (LE) and greater than that of the Trailing Electrolyte (TE) in a device placed for ITP. The Leading Electrolyte (LE) typically contains ions of relatively high mobility, while the Trailing Electrolyte (TE) typically contains ions of relatively low mobility. The TE and LE ions are selected to have effective mobilities below and above, respectively, the target analyte ion of interest. That is, the effective mobility of the analyte ions is higher than TE but lower than LE. These target analytes have the same charge sign as the LE and TE ions (i.e., co-ions). The applied electric field moves the LE ions away from the TE ions, which trail behind them. A moving interface is formed between adjacent and contiguous TE and LE regions. This creates a region of electric field gradient (typically from a low electric field for LE to a high electric field for TE). The analyte ions in the TE will exceed the TE ions, but not the LE ions and accumulate at the interface between the TE and LE ("focus" or form a "focal region"). Alternatively, the target ion in the LE is replaced by an LE ion; and also accumulates at the interface. By judicious selection of LE and TE chemistries, ITP is quite universally applicable, can be accomplished with samples initially dissolved in one or both of the TE and LE electrolytes, and can eliminate the need for very low conductivity background electrolytes.
As used herein, the term "accelerated electrophoresis" generally refers to electrophoretic separation methods performed using circular or spherical and/or concentric devices and/or circular and/or concentric electrode arrangements, such as by using circular/concentric and/or polygonal devices as described herein. Due to the circular/concentric or another polygonal arrangement used during accelerated electrophoresis; unlike conventional isotachophoresis devices, the cross-sectional area varies during migration of ions and regions, and the speed at which the regions move is not constant over time due to the variation in cross-sectional area. Thus, the accelerated electrophoresis setup does not strictly follow the conventional isotachophoresis principle, in which regions migrate at a constant velocity. Despite these significant differences as shown herein, accelerated electrophoresis can be used to effectively separate and focus charged particles by creating boundaries or interfaces between materials that may have different electrophoretic mobilities (e.g., between charged particles and other materials in solution) using an electric field. LE and TE, as described for use with ITP, can also be used to accelerate electrophoresis. For embodiments in which a circular or spherical device structure (e.g., a device comprising one or more circular electrodes) may be used, a description of the movement of the regions at constant current, constant voltage, and constant power is given in the examples section below. In an exemplary embodiment, accelerated electrophoresis may be performed using constant current, constant voltage, and/or constant power. In an exemplary embodiment, accelerated electrophoresis may be performed using varying current, varying voltage, and/or varying power. In an exemplary embodiment, accelerated electrophoresis may be implemented in the context of a device and/or electrode arrangement, which may be generally described in the shape of a circle or sphere, such that the basic principles of accelerated electrophoresis may be implemented as described herein. In some embodiments, accelerated electrophoresis may be implemented in the context of a device and/or electrode arrangement, the shape of which may be generally described as a polygon, such that the basic principles of accelerated electrophoresis may be implemented as described herein. In some embodiments, accelerated electrophoresis may be implemented by any non-linear, continuous electrode arrangement, such as electrodes arranged in a circular shape and/or electrodes arranged in a polygonal shape.
As used herein, the terms "in vitro diagnostic application (IVD application)", "in vitro diagnostic method (IVD method)", and the like generally refer to any application and/or method and/or device that can evaluate a sample for diagnostic and/or monitoring purposes, such as identifying a human subject, optionally identifying a disease in a human subject. In an exemplary embodiment, the sample can include blood and/or plasma from a subject. In exemplary embodiments, the sample may comprise nucleic acids and/or target nucleic acids from a subject, optionally further wherein the nucleic acids are derived from blood and/or plasma from a subject. In an exemplary embodiment, the accelerated electrophoresis device may be used as an in vitro diagnostic device. In exemplary embodiments, the target analyte that has been concentrated/enriched by accelerated electrophoresis is useful for downstream in vitro diagnostic assays. In exemplary embodiments, the in vitro diagnostic assay can include nucleic acid sequencing, such as DNA sequencing. In further exemplary embodiments, the in vitro diagnostic method may be, but is not limited to, any one or more of the following: staining, immunohistochemical staining, flow cytometry, FACS, fluorescence activated droplet sorting, image analysis, hybridization, DASH, molecular beacons, primer extension, microarray, CISH, FISH, fiber FISH, quantitative FISH, flow FISH, comparative genomic hybridization, blotting, Western blotting, southern blotting, Eastern blotting, Far-Western blotting, DNA-Western blotting, RNA-Western blotting and RNA blotting, enzyme assays, ELISA, ligand binding assays, immunoprecipitation, ChIP-seq, ChIP-ChiP, radioimmunoassays, fluorescence polarization, FRET, surface plasmon resonance, filter binding assays, affinity chromatography, immunocytochemistry, gene expression profiling, DNA profiling and PCR, DNA microarrays, gene expression sequence analysis, real-time polymerase chain reaction, differential display PCR, RNA-seq, mass spectrometry measurements, DNA methylation detection, sonic energy, lipidomic based analysis, quantification of immune cells, detection of cancer-associated markers, affinity purification of specific cell types, DNA sequencing, next generation sequencing, detection of cancer-associated fusion proteins, and detection of chemotherapy-resistance-associated markers.
As used herein, the terms "leading electrolyte" and "leading ion" generally refer to ions having a higher effective electrophoretic mobility than the target sample ions and/or the trailing electrolyte used during ITP and/or accelerated electrophoresis. In exemplary embodiments, lead electrolytes for cation-accelerated electrophoresis can include, but are not limited to, chloride, sulfate, and/or formate buffered to a desired pH with a suitable base such as histidine, TRIS, creatinine, and the like. In an exemplary embodiment, the lead electrolyte for anion-accelerated electrophoresis may include, but is not limited to, lead electrolytes including potassium, ammonium, and/or sodium, and acetate or formate. In some embodiments, for a given applied voltage, an increase in the concentration of the lead electrolyte can result in a proportional increase in the sample area and a corresponding increase in the current (power). Typical concentrations may generally be in the range of 10-20 mM; however, higher concentrations may also be used.
As used herein, the terms "trailing electrolyte", "trailing ion", "terminating electrolyte", and "terminating ion" generally refer to ions having a lower effective electrophoretic mobility than the target sample ions and/or the leading electrolyte used during ITP and/or accelerated electrophoresis. In exemplary embodiments, trailing electrolytes for cation-accelerated electrophoresis may include, but are not limited to, MES, MOPS, acetate, glutamate, and other weak acid anions and low mobility anions. In an exemplary embodiment, the trailing electrolyte for anion accelerated electrophoresis may include, but is not limited to, including reactive hydronium ions at the mobile boundaries formed by any weak acid during accelerated electrophoresis.
As used herein, the term "focal region" generally refers to the volume of solution containing components that are concentrated ("focused") as a result of performing accelerated electrophoresis. The focal region can be collected or removed from the device, and can contain an enriched and/or concentrated amount of a desired sample, e.g., a target analyte, e.g., a target nucleic acid. In the accelerated electrophoresis methods described herein, the target analyte generally becomes focused at the center of the device, e.g., a circle or sphere or other polygonal device.
As used herein, the terms "band" and "ETP band" generally refer to a region (e.g., focal region) of an ion, analyte, or sample that travels separate from other ions, analytes, or samples during electrophoretic (e.g., isotachophoresis or accelerated electrophoresis) migration. The focal region within the accelerated electrophoresis device may alternatively be referred to as the "ETP band". In some embodiments, the ETP bands may include one or more types of ions, analytes, and/or samples. In some cases, an ETP band may contain a single type of analyte that is desired to be separated from other materials present in the sample, such as separating target nucleic acids from cell debris. In some cases, an ETP band may comprise more than one desired analyte, e.g., a polypeptide or nucleic acid sequence with a highly similar sequence, e.g., an allelic variant. In some cases, the ETP bands may contain different analytes of similar size or electrophoretic mobility, e.g., nucleic acids of 0-500bp in length. In such cases, more than one desired analyte may be separated by further ETP runs, e.g., under different conditions that facilitate separation of the more than one analyte, and/or the more than one analyte may be separated by other techniques known in the art for separating analytes, such as those described herein. In some embodiments, after one or more ETP-based separations and collections, ETP bands can be collected and optionally subjected to further analysis. In some embodiments, the ETP strip can include one or more target analytes undergoing or having undergone ETP-based separation/purification and optionally collection, e.g., as part of an ETP run.
Throughout this disclosure, the terms "nucleic acid" and "nucleic acid molecule" may be used interchangeably. The term generally refers to polymers of nucleotides (e.g., ribonucleotides, deoxyribonucleotides, nucleotide analogs, etc.) and includes deoxyribonucleic acids (DNA), ribonucleic acids (RNA), DNA-RNA hybrids, oligonucleotides, polynucleotides, aptamers, Peptide Nucleic Acids (PNA), PNA-DNA conjugates, PNA-RNA conjugates, and the like, comprising nucleotides covalently linked together in a linear or branched fashion. Nucleic acids are typically single-stranded or double-stranded, and will typically contain phosphodiester linkages, but in some cases include nucleic acid analogs that may have alternative backbones, including, for example, phosphoramides (Beaucage et al (1993) Tetrahedron 49 (10): 1925); phosphorothioate (Mag et al (1991) Nucleic Acids Res.19: 1437 and U.S. Pat. No. 5,644,048), phosphorodithioate (Briu et al (1989) J.Am.chem.Soc.111: 2321), O-methylphosphoamide linkages (see Eckstein, Oligonucleotides and antibiotics: A Practical application, Oxford University Press (1992)), and peptide Nucleic acid backbones and linkages (see Eghol (1992) J.Am.chem.Soc.114: 1895). Other analog nucleic acids include those with a positively charged backbone (Denpcy et al (1995) Proc. Natl. Acad. Sci. USA 92: 6097); non-ionic backbones (U.S. patent nos. 5,386,023, 5,637,684, 5,602,240, 5,216,141, and 4,469,863) and non-ribose backbones, including those described in U.S. patent nos. 5,235,033 and 5,034,506. Nucleic acids comprising one or more carbocyclic sugars are also included within the definition of nucleic acids (see Jenkins et al (1995) chem. Soc. Rev. pp.169-176), and analogues are also described, for example, in Rawls, C8C ENews Jun.2, page 35 of 1997. These modifications can be made to the ribose-phosphate backbone to facilitate the addition of additional moieties such as tags or to alter the stability and half-life of these molecules in physiological environments.
In addition to naturally occurring heterocyclic bases typically found in nucleic acids (e.g., adenine, guanine, thymine, cytosine, and uracil), nucleotide analogs can also include non-naturally occurring heterocyclic bases, such as those described in: for example, Seela et al (1999) helv. chim. acta82: 1640. certain bases used in nucleotide analogs can act as melting temperature (Tm) regulators. For example, some of these include 7-deazapurines (e.g., 7-deazaguanine, 7-deazaadenine, etc.), pyrazolo [3, 4-d ] pyrimidines, propynyl-dN (e.g., propynyl-dU, propynyl-dC, etc.), and the like, see, for example, U.S. patent No. 5,990,303. Other representative heterocyclic bases include, for example, hypoxanthine, inosine, xanthine; 2-aminopurine, 2, 6-diaminopurine, 2-amino-6-chloropurine, hypoxanthine, inosine and 8-aza derivatives of xanthine; 7-deaza-8-aza derivatives of adenine, guanine, 2-aminopurine, 2, 6-diaminopurine, 2-amino-6-chloropurine, hypoxanthine, inosine and xanthine; 6-azacytidine; 5-fluorocytidine; 5-chloro cytidine; 5-iodocytidine; 5-bromocytidine; 5-methylcytidine; 5-propynyl cytidine; 5-bromovinyluracil; 5-fluorouracil; 5-chlorouracil; 5-iodouracil; 5-bromouracil; 5-trifluoromethyl uracil; 5-methoxymethyluracil; 5-ethynyluracil; 5-propynyl uracil and the like.
The terms nucleic acid and nucleic acid molecule may also refer generally to oligonucleotides, oligos, polynucleotides, genomic DNA, mitochondrial DNA (mtdna), complementary DNA (cdna), bacterial DNA, viral RNA, messenger RNA (mrna), transfer RNA (trna), ribosomal RNA (rrna), siRNA, catalytic RNA, clones, plasmids, M13, PI, cosmids, Bacterial Artificial Chromosomes (BAC), Yeast Artificial Chromosomes (YAC), amplified nucleic acids, amplicons, PCR products and other types of amplified nucleic acids, RNA/DNA hybrids, and PNAs, all of which may be in single-stranded or double-stranded form, and unless otherwise limited, will encompass known analogs of natural nucleotides that may function in a similar manner as naturally occurring nucleotides and combinations and/or mixtures thereof. Thus, the term "nucleotide" refers to naturally occurring and modified/non-naturally occurring nucleotides, including nucleoside triphosphates, nucleoside diphosphates and nucleoside monophosphates and monophosphate monomers present within a polynucleic acid or oligonucleotide. The nucleotide can also be ribose; 2' -deoxidation; 2 ', 3' -deoxy and a wide variety of other nucleotide mimetics well known in the art. Mimetics include chain terminating nucleotides such as 3' -O-methyl, halo bases, or sugar substitutions; alternative sugar structures, including non-sugar, alkyl ring structures; alternative bases, including inosine; desazalation modification; chi and psi, modified with a linker; modified by a plurality of labels; phosphodiester modifications or substitutions including phosphorothioates, methylphosphonates, boranophosphates, amides, esters, ethers; and substantial or complete internucleotide substitutions, including cleavage bonds such as photolyzable nitrophenyl moieties.
"nucleoside" refers to a nucleic acid component comprising a base or basic group (including at least one homocyclic ring, at least one heterocyclic ring, at least one aryl group, and/or the like) covalently attached to a sugar moiety (ribose or deoxyribose), a derivative of a sugar moiety, or a functional equivalent of a sugar moiety (e.g., carbocyclic). For example, when a nucleoside includes a sugar moiety, the base is typically attached to the 1' -position of the sugar moiety. As described above, the base may be a naturally occurring base or a non-naturally occurring base. Exemplary nucleosides include ribonucleosides, deoxyribonucleosides, dideoxyribonucleosides, and carbocyclic nucleosides.
"purine nucleotide" refers to a nucleotide comprising a purine base, while "pyrimidine nucleotide" refers to a nucleotide comprising a pyrimidine base.
"modified nucleotides" refers to rare or minor nucleic acid bases, nucleotides, and modifications, derivatives or analogs of conventional bases or nucleotides, and includes synthetic nucleotides having modified base moieties and/or modified sugar moieties (see Protocols for Oligonucleotide Conjugates, Methods in Molecular Biology, Vol.26(Suhier Agrawal, Ed., Humana Press, Totowa, N.J., (1994)); and Oligonucleotide and Oligonucleotides, A Practical Approach (Fritz Eckstein, Ed., IRL Press, Oxford University Press, Oxford)).
As used herein, "oligonucleotide" refers to a linear oligomer of natural or modified nucleoside monomers linked by phosphodiester bonds or analogs thereof. Oligonucleotides include deoxyribonucleosides, ribonucleosides, anomeric forms thereof, PNAs, and the like, capable of specifically binding to a target nucleic acid. Typically, monomers are linked by phosphodiester bonds or the like to form oligonucleotides ranging in size from a few monomer units, e.g., 3-4, to tens of monomer units, e.g., 40-60. Whenever an oligonucleotide is represented by a letter sequence, such as "ATGCCTG," it is understood that the nucleotides are in 5 '-3' order from left to right, and unless otherwise indicated, "a" represents deoxyadenosine, "C" represents deoxycytidine, "G" represents deoxyguanosine, "T" represents deoxythymidine, and "U" represents the ribonucleoside uridine. Typically, an oligonucleotide comprises four natural deoxynucleotides; however, they may also comprise ribonucleosides or non-natural nucleotide analogues. When an enzyme has a particular oligonucleotide or polynucleotide substrate requirement for activity, e.g., single stranded DNA, RNA/DNA duplexes, etc., then the selection of an appropriate composition for that oligonucleotide or polynucleotide substrate is well known to those of ordinary skill in the art.
As used herein, "oligonucleotide primer" or simply "primer" refers to a polynucleotide sequence that hybridizes to a sequence on a target nucleic acid template and can facilitate detection or amplification of an oligonucleotide probe. During amplification, oligonucleotide primers serve as a starting point for nucleic acid synthesis. In a non-amplification process, oligonucleotide primers can be used to generate structures that can be cleaved by a cleavage agent. The primer can be of various lengths, and is typically less than 50 nucleotides in length, e.g., 12-25 nucleotides in length. The length and sequence of the primers used for PCR can be designed based on principles known to those skilled in the art.
As used herein, the term "oligonucleotide probe" refers to a polynucleotide sequence that is capable of hybridizing or annealing to a target nucleic acid of interest and allows for specific detection of the target nucleic acid.
When additional nucleotides are incorporated into a nucleic acid, for example, at the 3' end of the nucleic acid by a nucleotide incorporation biocatalyst, the nucleic acid is "extended" or "elongated".
As used herein, the terms "hybridization" and "annealing" and the like are used interchangeably to refer to the base-pairing interaction of one polynucleotide with another polynucleotide (typically an antiparallel polynucleotide) resulting in the formation of a duplex or other higher order structure, commonly referred to as a hybridization complex. The major interactions between antiparallel polynucleotide molecules are usually base specific, such as A/T and G/C, by Watson/Crick and/or Hoogsteen type hydrogen bonding. Achieving hybridization does not require that the two polynucleotides have 100% complementarity over their entire length. In some aspects, hybridization complexes may be formed by intermolecular interactions, or alternatively, may be formed by intramolecular interactions.
The term "complementary" means that one nucleic acid hybridizes to another nucleic acid molecule either identically or selectively. Hybridization selectivity exists when hybridization occurs that is more selective than the complete lack of specificity. In general, selective hybridization will occur when there is at least about 55%, preferably at least 65%, more preferably at least 75%, and most preferably at least 90% identity over a stretch of at least 14-25 nucleotides. Preferably, one nucleic acid specifically hybridizes to another nucleic acid. See m.kanehisa, Nucleic Acids res.12: 203(1984).
Primers that are "perfectly complementary" have sequences that are perfectly complementary over the entire primer length and no mismatches. The primer is typically perfectly complementary to the target sequence and/or a portion (subsequence) of the target nucleic acid. "mismatch" refers to a site where a nucleotide in a primer is not complementary to a nucleotide in the target nucleic acid to which it is aligned. The term "substantially complementary" when used in reference to a primer means that the primer is not perfectly complementary to its target sequence; in contrast, the degree of complementarity of the primers is only sufficient to selectively hybridize to their respective strands at the desired primer binding sites.
As used herein, the term "target nucleic acid" is intended to mean any nucleic acid whose presence is to be detected, measured, amplified, and/or subjected to further determination and analysis. The target nucleic acid can include any single-stranded and/or double-stranded nucleic acid. The target nucleic acid may be present as an isolated nucleic acid fragment or as part of a larger nucleic acid fragment. The target nucleic acid can be derived or isolated from essentially any source, such as a cultured microorganism, an uncultured microorganism, a complex biological mixture, a biological sample, a tissue, a serum, an ancient or preserved tissue or sample, an environmental isolate, and the like. In addition, a target nucleic acid includes or is derived from a cDNA, RNA, genomic DNA, cloned genomic DNA, genomic DNA library, enzymatically fragmented DNA or RNA, chemically fragmented DNA or RNA, physically fragmented DNA or RNA, and the like. In exemplary embodiments, the target nucleic acid can comprise a whole genome. In exemplary embodiments, the target nucleic acid can comprise the entire nucleic acid content of the sample and/or the biological sample. In exemplary embodiments, the target nucleic acid can comprise circulating or cell-free DNA, such as circulating tumor DNA ("ctDNA") present in an individual with cancer or circulating fetal or circulating maternal DNA ("cfDNA") fragments present in the plasma or serum of a pregnant woman. The target nucleic acid can be present in a variety of different forms, including, for example, simple or complex mixtures, or in a substantially purified form. For example, the target nucleic acid may be a portion of a sample that contains other components, or may be the sole or major component of the sample. The target nucleic acid may also have a known or unknown sequence.
The term "amplification reaction" refers to any in vitro means for amplifying copies of a nucleic acid target sequence.
The terms "amplification" and "amplifying" and the like generally refer to any process that results in an increase in the copy number of a molecule or group of related molecules. Components of the amplification reaction may include, but are not limited to, for example, primers, polynucleotide templates, nucleic acid polymerases, nucleotides, dntps, and the like. The term "amplification" generally refers to an "exponential" increase in a target nucleic acid. However, "amplification" as used herein may also refer to a linear increase in the number of selected target sequences of a nucleic acid. Amplification usually from a small amount of target nucleic acid (e.g. a single copy of the target nucleic acid) beginning, wherein the amplification of material is usually detectable. Amplification of a target nucleic acid involves a variety of chemical and enzymatic processes. The generation of multiple DNA copies from one or several copies of a target nucleic acid may be performed by Polymerase Chain Reaction (PCR), hot start PCR, Strand Displacement Amplification (SDA) reaction, Transcription Mediated Amplification (TMA) reaction, Nucleic Acid Sequence Based Amplification (NASBA) reaction or Ligase Chain Reaction (LCR). Amplification is not limited to the stringent replication of the initial target nucleic acid. For example, the generation of multiple cDNA molecules from a limited number of viral RNAs in a sample using RT-PCR is an amplified version. In addition, the production of multiple RNA molecules from a single DNA molecule during the transcription process is also an amplified form. Amplification may optionally be followed by additional steps such as, but not limited to, labeling, sequencing, purification, isolation, hybridization, size resolution, expression, detection, and/or cloning.
As used herein, the term "target microorganism" is intended to mean any single-or multi-cell microorganism found in blood, plasma, other bodily fluids, samples such as biological samples and/or tissues, for example microorganisms associated with infectious conditions or diseases. Examples include bacteria, archaea, eukaryotes, viruses, yeasts, fungi, protozoa, amoebae, and/or parasites. Other examples of diseases caused by microorganisms and microorganisms that may cause such diseases can be found in table 1 below. Thus, the term "microorganism" generally refers to a microorganism that may cause a disease, both disease and pathogenic microorganisms.
TABLE 1


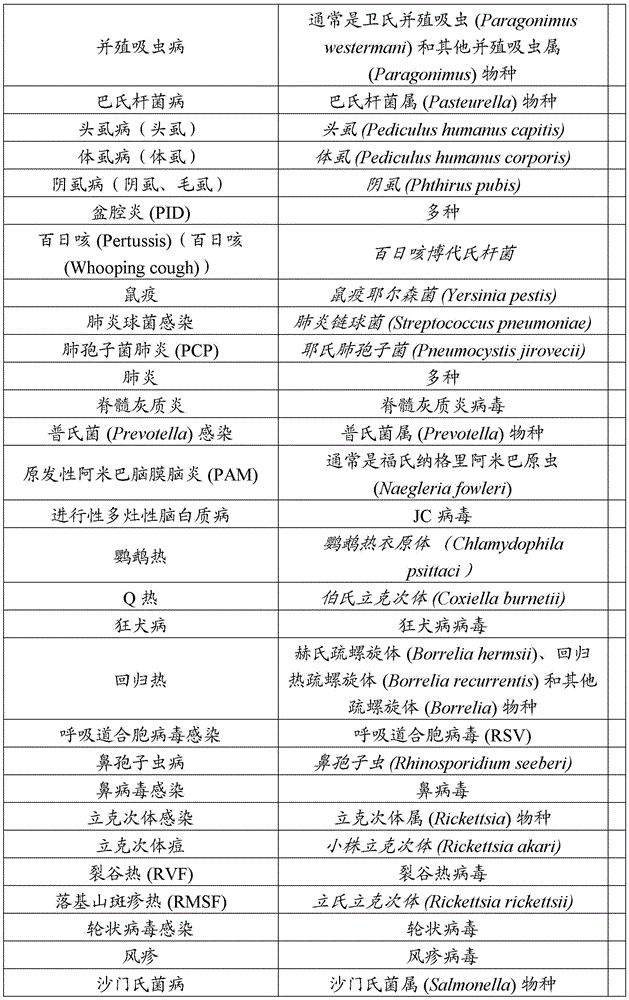
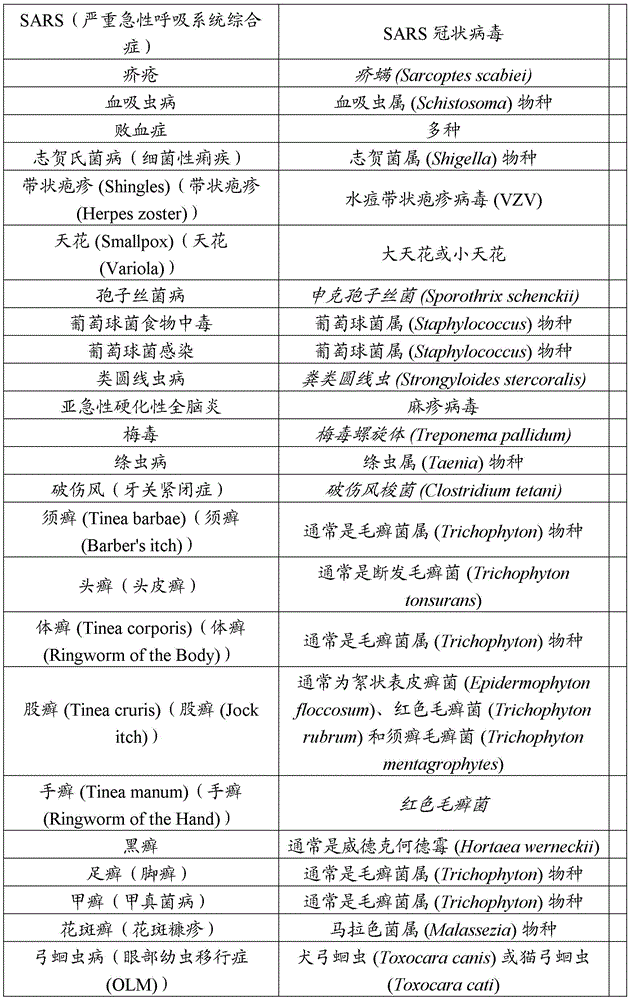
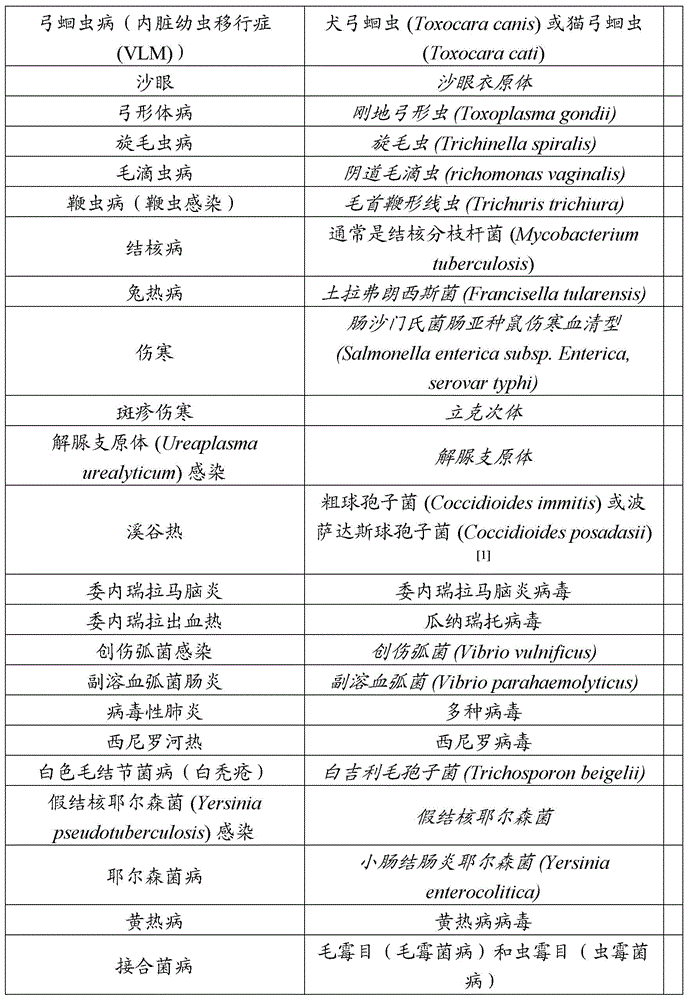
As used herein, the term "biomarker" or "target biomarker" refers to a biological molecule found in blood, plasma, other bodily fluids, and/or tissues that is a marker of a normal or abnormal process or disorder or disease (e.g., cancer). Biomarkers can be used to observe the body's response to treatment of a disease or disorder. In the case of cancer, biomarkers refer to biological substances that indicate the presence of cancer in vivo. The biomarker may be a molecule secreted by the tumor or a specific response of the body to the presence of cancer. Genetic, epigenetics, proteomics, carbohydrate and imaging biomarkers can be used for diagnosis, prognosis and epidemiology of cancer. Such biomarkers can be measured in non-invasively collected biological fluids (e.g., blood or serum). Several gene and protein based biomarkers have been used in patient care including, but not limited to, AFP (liver cancer), BCR-ABL (chronic myeloid leukemia), BRCA1/BRCA2 (breast/ovarian cancer), BRAF V600E (melanoma/colorectal cancer), CA-125 (ovarian cancer), CA19.9 (pancreatic cancer), CEA (colorectal cancer), EGFR (non-small cell lung cancer), HER-2 (breast cancer), KIT (gastrointestinal stromal tumor), PSA (prostate specific antigen) (prostate cancer), S100 (melanoma), etc. Biomarkers can be used as a diagnosis (to identify early stage cancer) and/or prognosis (to predict the aggressiveness of the cancer and/or to predict the extent of a subject's response to a particular treatment and/or the likelihood of cancer recurrence). Target biomarkers include, but are not limited to, tumor biomarkers such as AKAP4, ALK, APC, AR, BRAF, BRCA1, BRCA2, CCND1, CCND2, CCND3, CD274, CDK4, CDK6, CFB, CFH, CFI, DKK1, DPYD, EDNRB, EGFR, ERBB2, EPSTI1, ESR1, FCRL5, FGFR1, FN1, HER 1, HERC 1, IDH1, sepido 1, KIF5 1, KIT, KRAS, LGR 1, LIV1, LY6 1, LYPD 1, MACC1, MET, MRD, MSI, MSLN, MUC1, nac 363, napas 1, fra 1, tff 1, mitr 1, mitra 1, and mitra 1, etc.
Other exemplary biomarkers of interest may include Her2, bRaf, ERBB2 amplification, P13KCA mutation, FGFR2 amplification, P53 mutation, BRCA mutation, CCND1 amplification, MAP2K4 mutation, ATR mutation, or any other biomarker whose expression is associated with a particular cancer; at least one of AFP, ALK, BCR-ABL, BRCA1/BRCA2, BRAF, V600E, Ca-125, CA19.9, EGFR, Her-2, KIT, PSA, S100, KRAS, ER/Pr, UGT1A1, CD30, CD20, F1P1L1-PDGRF α, PDGFR, TMPT, and TMPRSS 2; or at least one biomarker selected from: ABCB5, AFP-L3, alpha-fetoprotein, alpha-methylacetyl-CoA racemase, BRCA1, BRCA2, CA15-3, CA 242, Ca27-29, CA-125, CA15-3, CA19-9, calcitonin, carcinoembryonic antigen peptide-1, des-gamma-carboxyprothrombin, early prostate cancer antigen-2, estrogen receptor, fibrin degradation products, glucose-6-phosphate isomerase, HPV antigens (such as vE6, E7, L1, L2 or p16INK4a), human chorionic gonadotropin, IL-6, keratin 19, lactate dehydrogenase, leucylaminopeptidase, lipotropin, norepinephrine, neprilysine, NMP22, norepinephrine, PCA3, prostate specific antigen, prostatic acid phosphatase, synaptophysin, thyroglobulin, TNF, thyroglobulin, alpha-methylacetylcoenzyme A racemase, BRCA1, BRCA2, CA 242, Ca 27-2-6, glucose-phosphate isomerase, HPV antigen, and its derivatives, Transcription factors selected from ERG, ETV1(ER81), FLI1, ETS1, ETS2, ELK1, ETV6(TEL1), ETV7(TEL2), GABP α, ELF1, ETV4(E1 AF; PEA3), ETV5(ERM), ERF, PEA3/E1AF, PU.1, ESE1/ESX, SAP1(ELK4), ETV3(METS), EWS/FLl1, ESE1, ESE2(ELF5), ESE3, PDEF, NET (ELK 3; SAP2), NERF (ELF2) or FEV. XXX, tumor associated glycoprotein 72, c-kit, SCF, pAKT, pc-kit and vimentin. Alternatively or additionally, the biomarker of interest may be an immune checkpoint inhibitor, such as but not limited to CTLA-4, PDL1, PDL2, PD1, B7-H3, B7-H4, BTLA, HVEM, KIR, TIM3, GAL9, GITR, LAG3, VISTA, KIR, 2B4, TRPO2, CD160, CGEN-15049, CHK1, CHK2, A2aR, TL1A and B-7 family ligands or combinations thereof, or a ligand of a checkpoint protein selected from the group consisting of: CTLA-4, PDL1, PDL2, PD1, B7-H3, B7-H4, BTLA, HVEM, TIM3, GAL9, LAG3, VISTA, KIR, 2B4, CD160, CGEN-15049, CHK1, CHK2, A2aR, B-7 family ligands, or a combination thereof. Other exemplary biomarkers can include, but are not limited to, including, any one or more biomarkers related to: acute lymphoblastic leukemia (etv6, am11, cyclophilin B), B-cell lymphoma (Ig-idiotype), glioma (E-cadherin, alpha-catenin, beta-catenin, gamma-catenin, p120ctn), bladder cancer (p21ras), biliary tract cancer (p21ras), breast cancer (MUC family, HER2/neu, C-erbB-2), cervical cancer (p53, p21ras), colon cancer (p21ras, HER2/neu, C-erbB-2, MUC family), colorectal cancer (colorectal-associated antigen (CRC) -C017-1A/GA733, APC), Choriocarcinoma (CEA), epithelial cell cancer (cyclophilin B), gastric cancer (HER2/neu, C-erbB-2, 733 GA), hepatocellular carcinoma (alpha-fetoprotein), Hodgkin lymphoma (Imp-1), lymphoma, EBNA-1), lung cancer (CEA, MAGE-3, NY-ESO-1), lymphoid cell-derived leukemia (cyclophilin b), melanoma (p5 protein, gp75, carcinoembryonic antigen, GM2 and GD2 gangliosides, Melan-A/MART-1, cdc27, MAGE-3, p21ras, gp100. sup.Pmell 117), myeloma (MUC family, p21ras), non-small cell lung cancer (HER2/neu, c-erbB-2), nasopharyngeal carcinoma (Imp-1, EBNA-1), ovarian cancer (MUC family, HER2/neu, c-erbB-2), prostate cancer (prostate specific antigen (PSA) and its epitope-1, PSA-2 and PSA-3, PSMA, HER2/neu, c-B-2, 733 glycoprotein), renal cancer (2/neu), HER-2-erb-2), and PSMA, Cervical and esophageal squamous cell carcinoma (viral products such as human papillomavirus protein), testicular cancer (NY-ESO-1), and/or T-cell leukemia (HTLV-1 epitope).
As used herein, the term "sample" includes a specimen or culture (e.g., a microbiological culture) comprising nucleic acids and/or target nucleic acids. The term "sample" is also meant to include biological, environmental and chemical samples, as well as any sample for which analysis is desired. The sample may comprise a specimen of synthetic origin. The sample may include one or more microorganisms from any source from which one or more microorganisms may be derived. "biological samples" may include, but are not limited to, whole blood, serum, plasma, cord blood, chorionic villi, amniotic fluid, cerebrospinal fluid, spinal fluid, lavage fluid (e.g., bronchoalveolar, gastric, peritoneal, catheter, ear, arthroscope), biopsy samples, urine, stool, sputum, saliva, nasal mucus, prostatic fluid, semen, lymph, bile, tears, sweat, breast milk, breast fluid, embryonic cells, and fetal cells. The biological sample may be blood or plasma. As used herein, the term "blood" encompasses whole blood or any fraction of blood, such as serum and plasma as conventionally defined. Plasma refers to the whole blood fraction resulting from centrifugation of blood treated with an anticoagulant. Serum refers to the aqueous portion of the fluid remaining after coagulation of a blood sample. Environmental samples include environmental materials such as surface materials, soil, water, and industrial samples, as well as samples obtained from food and dairy processing instruments, equipment, vessels, disposable and non-disposable items.
A "representative" sample may include different subpopulations of the sample, e.g., a sample comprising cancer cells contained within a tumor. Alternatively, a "representative" sample may comprise different subpopulations of normal and/or control samples, such as normal or control cells, or may comprise a mixed sample of test and normal/control samples, respectively, such as tumor cells and normal cells. More advantageously, these representative samples can be used in a variety of assay methods without compromising the ability of the specimen to be used in conventional diagnostic assays. In exemplary embodiments, a representative sample can be generated by analyzing a sample (e.g., a sample comprising tumor cells) using the devices and methods described herein. In some embodiments, a representative sample can be analyzed by the devices and methods described herein. Furthermore, a representative sample generated by analyzing a sample using the devices and methods described herein can be used simultaneously in several different assay formats to detect the presence of even smaller sample subpopulations in the sample, such as tumors or lymph nodes.
As used herein, the term "target analyte" is intended to mean any analyte whose presence is to be detected, measured, separated, concentrated, and/or subjected to further assay and analysis. In exemplary embodiments, the analyte may be, but is not limited to, any ion, molecule, nucleic acid, biomarker, cell or group of cells, such as a desired cell, etc., that is desired to be detected, measured, isolated, concentrated, and/or used for further analysis. In exemplary embodiments, the target analyte can be derived from any of the samples described herein.
The term "assay" generally refers to a process or step involving physical, chemical, biochemical, or biological analysis, including characterization, testing, measurement, optimization, separation, synthesis, addition, filtration, dissolution, or mixing.
The term "chemical" refers to a substance, compound, mixture, solution, emulsion, dispersion, molecule, ion, dimer, macromolecule such as a polymer or protein, biological molecule, precipitate, crystal, chemical moiety or group, particle, nanoparticle, reagent, reaction product, solvent, or fluid, any of which may be present in a solid, liquid, or gaseous state, and is typically the subject of analysis.
The term "protein" generally refers to a group of amino acids usually linked together in a specific sequence. Proteins may be naturally occurring or man-made. As used herein, the term "protein" includes amino acid sequences that have been modified to contain: moieties or groups such as sugars, polymers, metal organic groups, fluorescent or luminescent groups; moieties or groups that enhance or participate in processes such as intramolecular or intermolecular electron transfer; a moiety or group that promotes or induces a protein to assume a particular conformation or a series of conformations; moieties or groups that hinder or inhibit the protein from assuming a particular conformation or series of conformations; a moiety or group that induces, enhances or inhibits protein folding; or other moieties or groups that are incorporated into the amino acid sequence and are intended to modify the chemical, biochemical or biological properties of the sequence. As used herein, proteins include, but are not limited to, enzymes, structural elements, antibodies, hormones, electron carriers, and other macromolecules involved in processes such as cellular processes or activities. Proteins typically have up to four structural levels, including primary, secondary, tertiary, and quaternary structures.
For the purposes of this disclosure, it will be understood that when a given component, such as a layer, region, liquid, or substrate, is referred to herein as being disposed or formed "on," "in," or "at" another component, the given component can be directly on the other component, or alternatively, intervening components (e.g., one or more buffer layers, interlayers, electrodes, or contacts) can also be present. It should also be understood that the terms "disposed on" and "formed on" may be used interchangeably to describe how a given component is positioned or pointed relative to another component. Thus, the terms "disposed on" and "formed on" are not intended to introduce any limitations related to the particular method of material transport, arrangement, or manufacture.
The term "communicate" is used herein to refer to a structural, functional, mechanical, electrical, optical, thermal, or fluidic relationship, or any combination thereof, between two or more components or elements. Thus, the fact that one component is said to be in communication with a second component is not intended to exclude the possibility that additional components may be present between and/or operatively associated or engaged with the first and second components.
As used herein, "subject" refers to a mammalian subject (such as a human, rodent, non-human primate, canine, bovine, ovine, equine, feline, etc.) to be treated and/or from which a biological sample is obtained.
The term "tumor" refers to a mass or neoplasm, which is itself defined as an abnormal new growth of cells that typically grow faster than normal cells and that will continue to grow if untreated, sometimes resulting in damage to adjacent structures. The tumor sizes may vary widely. The tumor may be solid or liquid-filled. A tumor may refer to a benign (non-cancerous, generally harmless), premalignant (precancerous), or malignant (cancerous) growth. The dividing line between cancerous, precancerous and cancerous growths is not always clear (sometimes it may be arbitrary to determine which one is, especially if the tumor is in the middle of the spectrum), but each type of growth has general characteristics. Benign tumors are non-malignant/non-cancerous tumors. Benign tumors are usually localized and do not spread (metastasize) to other parts of the body. Most benign tumors respond well to treatment. However, some benign tumors grow large and cause serious disease because of their size if not treated in time. In this way, benign tumors can mimic malignant tumors and therefore are sometimes treated. A premalignant or precancerous tumor is not yet malignant, but it is ready to become malignant. Malignant tumors are cancerous growths. They are generally resistant to treatment, may spread to other parts of the body, and sometimes recur after removal. "cancer" is another term for malignant growth (malignant tumor or neoplasm).
The virulence of different tumors varies. Some cancers are relatively easy to treat and/or cure, while others are more aggressive. Tumor virulence may be determined at least in part by differential gene expression. In cancer cells (cells containing premalignant and/or malignant tumors), the mechanisms that allow the cells to activate or silence genes are disrupted. Thus, there is often aberrant activation of specific genes in other tissues and/or other developmental stages. For example, in lung cancer, tumor cells expressing a gene specific for the production of motile spermatozoa (which should be silent) are extremely virulent (a high risk cancer that exhibits enhanced proliferative capacity and can evade the body's immune system). It has also been shown that in almost all cancers, tens of specific genes in the germ line and placenta are abnormally activated. See, e.g., Rousseaux et al, Ectopic Activation of Germine and plant Genes identified elementary Metastasis-protein Lung cancer (2013)5 (186): 186. thus, since up-or down-regulation of genes may be associated with the virulent form of a particular cancer, it is possible to predict which cancers have a high risk of recurrence and a fatal prognosis at the diagnostic stage, even in cases where the cancer is adequately treated at an early stage of tumor development.
"resistivity," also referred to as "resistivity," "specific resistance," or "volume resistivity," is used as is conventionally understood in the art and generally refers to the property of a material that quantifies the strength of the material against the flow of electrical current. Low resistivity generally means a material that can easily allow current to flow. The resistivity is usually expressed in terms of the greek letter rho (rho). The SI unit of resistivity is ohm-meters (Ω · m).
"conductivity," also known as "conductance" or "specific conductivity," generally refers to the inverse of resistivity, and generally measures the ability of a material to conduct an electrical current. It is usually denoted by the greek letter sigma (sigma), but occasionally also kappa (kappa) (especially in electrical engineering) or gamma (gamma) are used. Its SI unit is Siemens per meter (S/m).
In the context of an accelerated electrophoresis device, system, or machine, "detecting" a sample may include detecting its position at one, several, or many points throughout the device. Detection may generally occur in any one or more ways that do not interfere with the desired device, system, or machine function and method performed using the device, system, or machine. In some embodiments, detecting includes any electrical detection means, such as by detecting conductivity, resistivity, voltage, current, and the like. Further, in some embodiments, the detection may include any one or more of: electrical detection, thermal detection, optical detection, spectroscopic detection, photochemical detection, biochemical detection, immunochemical detection and/or chemical detection. In some embodiments, one or more target analytes, such as cfNA, can be detected during ETP-based isolation/purification and optionally collection of the one or more target analytes. In some embodiments, any one or more analytes may be detected during the ETP-based assay.
A "robotic liquid handler" or "liquid handler" is a robotic system for automation in chemical or biochemical laboratories,a selected amount of reagent, sample or other liquid is dispensed into a designated container. Some versions may dispense a specified volume of liquid from a powered pipette or syringe; some systems may also manipulate the position of the dispenser and container (typically a cartesian robot) and/or integrate additional laboratory devices or accessories such as microplate readers, heat sealers, heaters/shakers, bar code readers, spectrophotometric or separating devices and instruments, storage devices, waste containers and incubators. In addition to motorized pipettors or syringes, the robotic liquid handler may also have a tray for sample wells or trays for holding sample vials, a pipette tip tray that mates with the pipettors, and a solvent container. In some embodiments, biological samples used with the present devices, systems, and methods may be in sample wells, vials, or any other sample container typically used on robotic liquid handlers currently or later developed. The methods, devices, and systems described herein may employ a robotic liquid handler capable of manipulating the position of pipette tips on cartesian 3-axis motion, typically implemented by an arm mechanism, and having multi-channel pipetting capabilities. To further reduce human interaction, it is also desirable to integrate a spectrophotometric or separation instrument with the processing program. An exemplary robotic liquid handler includes a liquid handling system from  Of a company
 STARTM、STARlet、STARplus、VANTAGE Liquid Handling
 Or
Or From
From The Bravo automated liquid handling platform of (e); from
 Is/are as follows
 From Beckman
 Is/are as follows
 4000. i5, i7, NX, or FX; from GilsonTMIs/are as follows
 System or
 A system; from
 Is/are as follows
 Freedom
 Or a D300e digital dispenser; from CTC Analytics
 A system; or from
 MPS of (4). In some embodiments, automated liquid processors used in the methods or systems of the present invention are those that can be modified to perform pipetting. The liquid processor may also be integrated with a variety of other in vitro diagnostic methods and devices, including, for example, sequencing, purification, and separation-mass spectrometers. Any commercially available robotic liquid handler can be used and/or modified to work in conjunction with the devices, methods, and systems for sample analysis described herein, e.g., for performingThose devices, methods and systems of ETP, such as devices, methods and systems for ETP-based separation/purification of one or more target analytes.
The term "pipette tip" is a generic term referring to a tapered tube having a larger end, referred to herein as a "hub", and a narrower end, referred to herein as a "delivery tip", that is precisely designed for the precise sampling and delivery of liquids. The hub is typically mounted on the barrel of a pipette or robotic liquid handler by a friction fit. The inner diameter of the tip hub must be slightly larger than the barrel of the pipette and the inner taper of the tip must also match the taper of the pipette barrel. Most manufacturers of hand-held pipettors and robotic liquid handling systems produce pipettors that use a universal tip. The hub is located at the proximal end of the pipette tip and the delivery tip is located at the distal end. A pipette tip is mounted on the barrel of a micropipette in an air tight manner such that when the plunger of the pipette is depressed and released, a vacuum is applied and fluid is drawn into the pipette tip. By depressing the plunger again, fluid can be delivered to any container as desired. Some pipette tips are sealed to the barrel of the pipette by using a gasket rather than the taper of the pipette tip. Some robotic pipette tips are not friction fit, but use expandable O-rings to implement the hermetic seal required for liquid pipetting. Accordingly, pipette tips are available in a variety of sizes to fit different pipettes. Preferably, the pipette tip has one or more ridges on its outer surface near the hub, such that the ridges allow the tip to be stored on a platform having an array of wells, the ridges preventing the risk of the conical tip sinking too far into the well and becoming stuck. Such ridges are common on pipette tips. A common ridge pattern includes an annular ridge that completely surrounds the pipette tip and a plurality of vertical fins that provide strength, support the tip over the hole, and also minimize material and weight. Combinations are also common. In some embodiments, the ridge is used to deposit pipette tips on the neck of the housing. In some embodiments, any one or more types of pipette tips known in the art may be used in conjunction with the devices, methods, and systems described herein to produce a desired result.
The term "robotic pipette tip" refers to a pipette tip whose internal taper in the hub is appropriate for a robotic liquid handler. In most cases, there is no difference between robotic pipette tips and hand-held pipette tips, but in some cases there may be a size difference. A "wide bore pipette tip" is a pipette tip having a wider orifice for its delivery tip than a standard conventional or similarly sized robotic pipette tip. Generally, the distal orifice is much larger than a standard tip. A large bore pipette tip may have a hub that can mate with a standard pipette or robotic liquid handler. The term "filtering pipette tip" refers to a standard or robotic pipette tip that has been modified to have a filter, screen, or screen plate near the distal (bottom) end of a narrow opening. Filtering pipette tips may optionally include a substrate, an adsorbent, a barrier, or a combination thereof, and optionally include a gasket. The term "tip-in-tip" refers to a configuration in which a "top" pipette tip fits within a second "bottom" pipette tip. Top pipette tips are typically standard or large bore pipette tips and bottom pipette tips are filter type pipette tips with optional substrates, adsorbents, barriers, or combinations thereof. The top pipette tip need not be of a large bore, but a large bore allows mixing of sample solutions containing solid particulate matter and/or viscosity. In some embodiments, any one or more types of robotic pipette tips known in the art may be used in conjunction with the devices, methods, and systems described herein to produce a desired result.
As used herein, the term "automated" refers to situations where any one or more steps of a procedure or method (e.g., sample collection) need not be performed "by hand" (i.e., manually), but where the desired step or procedure (e.g., sample collection) may be performed by one or more suitable devices or systems, such as one or more robots, liquid handling robots, and/or other (e.g., acoustic) liquid transfer devices, which are programmed prior to performing one or more steps, such that the corresponding steps and modes (particularly collection steps) are performed in an automated manner according to the programmed content. In some embodiments, storing the collected sample or immediately transferring the collected sample to another system or device for further purification, processing, analysis, or other IVD methods is also automated (e.g., by using a robot).
As used herein, the term "portion" includes any suitable sample for analysis in the systems, devices, or methods described herein. Such samples may include any biological sample, environmental sample, industrial sample, substance, liquid, solid, gas, suspension, colloid, chemical, mixture, buffer, solvent, analyte, electrolyte, solution, nucleic acid, polypeptide, metal, fluid, reactant, reagent, detectable label, dye, inorganic ion, organic ion, salt, polymer, peptide, polysaccharide, cell, bacterium, and/or virus.
In a sample analysis device or system, the term "sample collection volume" refers to the volume of sample that is intended for collection during or after analysis, e.g., by a robotic liquid processor. In a device for performing accelerated electrophoresis or a system comprising such a device, the sample collection volume is the collection volume intended for comprising the sample during or after accelerated electrophoresis. In some embodiments, the sample collection volume can be located in a centerwell of a device or system described herein. In some embodiments, the sample collection volume may be located anywhere that allows for collection of a desired sample. In some embodiments, the sample collection volume may be anywhere between the sample loading region and the leading electrolyte electrode/collection cell. The sample collection volume may be comprised of any suitable region, container, well, or space of a device or system. In some embodiments, the sample collection volume is comprised of a well, membrane, compartment, vial, pipette, and the like. In some embodiments, the sample collection volume may be formed by a space within or between components of a device or system, for example, a space between two gels or a hole in a gel.
As used herein, the term "cell-free nucleic acid" ("cfNA") generally refers to a non-encapsulated nucleic acid that can be found in the blood stream of an organism. In some cases, cfNA can be isolated from blood, plasma, and/or serum samples, and the like. In some cases, the cell-free nucleic acid can be cell-free dna (cfdna). In some cases, the cell-free nucleic acid can be cell-free rna (cfrna). In some cases, the cell-free nucleic acid can be a mixture of cell-free dna (cfdna) and cell-free rna (cfrna). In some cases, the cfNA may comprise fetal DNA and/or maternal DNA. In some cases, a blood sample and/or plasma sample from a pregnant woman may comprise cfNA. In some cases, the cfNA can comprise circulating tumor nucleic acid (ctNA). In some cases, cfNA may comprise DNA and/or RNA fragments that are about 1000bp or longer, 1000bp or shorter, 900bp or shorter, 800bp or shorter, 700bp or shorter, 600bp or shorter, 500bp or shorter, 400bp or shorter, 300bp or shorter, 250bp or shorter, 200bp or shorter, 150bp or shorter, e.g., about 180bp or shorter in length. In some cases, cfNA can be isolated/purified and optionally collected using the ETP-based devices and methods described herein. In some embodiments, after ETP-based isolation/purification, the isolated/purified cfNA can be collected and can be subjected to any one or more further analytical techniques described herein, such as sequencing, for example, such as those described in the section entitled "other methods used in connection with the devices and methods described herein.
As used herein, the term "circulating tumor nucleic acid NA" (ctNA) refers to cfNA derived from a cancerous cell, e.g., a tumor cell. In some cases, ctDNA may enter the bloodstream during apoptosis or necrosis of cancerous cells. In some cases, the tumor nucleic acid can be circulating tumor rna (ctrna). In some cases, the circulating tumor nucleic acid can be circulating tumor dna (ctdna). ctNA may be a mixture of ctDNA and ctRNA. In some embodiments, ctNA may be isolated/purified and optionally collected using ETP-based devices and methods described herein. In some embodiments, after ETP-based isolation/purification, the isolated/purified ctNA may be collected and may be subjected to any one or more further analytical techniques described herein, such as sequencing, for example, such as those described in the section entitled "other methods used in association with the devices and methods described herein. In some cases, ctNA may comprise DNA fragments and/or RNA fragments that are about 1000bp or longer, 1000bp or shorter, 900bp or shorter, 800bp or shorter, 700bp or shorter, 600bp or shorter, 500bp or shorter, 400bp or shorter, 300bp or shorter, 250bp or shorter, 200bp or shorter, 150bp or shorter in length, e.g., about 150bp or shorter in length.
As used herein, the term "ETP superscript" generally refers to compounds or molecules that are larger in size and/or longer in length than the target nucleic acid, such that during ETP-based target analyte separation/purification and subsequent collection, the ETP superscript represents a cut-off point at which collection of the target analyte can be stopped. For example, a fluorescently labeled or otherwise detectably labeled ETP uplicate label can be generated that is larger in size than the target DNA to be isolated/purified and collected during ETP-based isolation/purification. By monitoring the marker throughout the ETP run, the user or automated machine can stop running before the marker falls into the collection tube, allowing capture of DNA smaller than the marker while leaving it outside the tube due to the larger contaminating DNA being located behind the upper marker. Furthermore, the generic marker itself is not collected from the ETP, and thus can be used in large quantities and with a variety of detectable labels, since it does not interfere with downstream assays, such as those described in the section entitled "other methods used in connection with the devices and methods described herein". In some cases, an episomal marker of ETP can be used in ETP-based isolation/purification methods because it facilitates the exclusion of genomic DNA from samples collected and/or the isolation/purification of one or more target analytes.
As used herein, the terms "ETP device," "device for implementing ETP," "device for ETP," and the like are used interchangeably to refer to a device on which ETP and/or methods including ETP can be performed or can be performed.
As used herein, the term "ETP-based isolation/purification" generally refers to devices and methods that comprise ETPs, e.g., devices on which ETPs can be performed, e.g., including methods of performing ETPs, wherein ETPs focus one or more target analytes within one or more focal zones (e.g., one or more ETP bands) to thereby isolate/purify the one or more target analytes from other materials comprised by an initial sample, e.g., to isolate/purify cfnas from genomic DNA. Note that the terms "isolation" and "purification" are used interchangeably. Furthermore, ETP-based separation/purification generally allows for subsequent collection of one or more focal zones (one or more ETP bands) containing the one or more target analytes. The degree of separation/purification of the one or more target analytes effected by one or more ETP-based separations/purifications may be any degree or amount of separation/purification of the one or more target analytes from other materials. In some embodiments, an ETP-based method of isolating/purifying a target analyte from a sample can produce a target analyte of 1% or less, 1% or more, 5% or more, 10% or more, 15% or more, 20% or more, 25% or more, 30% or more, 35% or more, 40% or more, 45% or more, 50% or more, 55% or more, 60% or more, 65% or more, 70% or more, 85% or more, 90% or more, 95% or more, or 99% or more purity, e.g., as measured by analytical techniques, to determine the composition of an ETP-isolated/purified sample comprising one or more target analytes. In some embodiments, an ETP-based method of isolating/purifying a target analyte from a sample can result in recovery of 1% or less, 1% or more, 5% or more, 10% or more, 15% or more, 20% or more, 25% or more, 30% or more, 35% or more, 40% or more, 45% or more, 50% or more, 55% or more, 60% or more, 65% or more, 70% or more, 85% or more, 90% or more, 95% or more, or 99% or more of the target analyte from the original sample. In some embodiments, one or more ETP-based separations/purifications may be performed to isolate/purify one or more target analytes. For example, in some cases, ETP-based separation/purification can be performed on a sample containing one or more target analytes to focus the one or more target analytes into a focal zone (ETP zone), which substantially separates the one or more target analytes from other materials contained in the original sample. The sample may be collected after ETP separation/purification, and the separated/collected sample may be further subjected to another ETP-based separation/purification. Optionally, a second ETP-based separation-purification can be conducted under conditions such that in the case of more than one target analyte, each of the one or more target analytes is separated into separate focal zones, each of which can optionally be collected separately, thereby separating the target analytes from each other (if desired).
As used herein, the term "mixed sample" generally refers to a sample comprising material from more than one source, e.g., a blood sample comprising both fetal and maternal cfNA, e.g., a blood sample comprising cfDNA derived from both a host and an infectious source.
Apparatus and method
The present disclosure generally describes devices and methods for sample analysis, wherein the devices and methods include performing accelerated electrophoresis. In exemplary embodiments, the devices and methods include performing accelerated electrophoresis using a concentric or polygonal disk (e.g., circular) design, as opposed to capillary or microfluidic channel designs that are generally available for conventional isotachophoresis. As discussed herein, the devices and methods of the present disclosure impart a number of advantageous properties and features. For example, device architectures for accelerated electrophoresis are capable of analyzing large sample volumes, e.g., 15mL or more samples and/or biological samples, whereas conventional capillary or microfluidic technologies are generally only equipped to handle microliter-scale volumes. Furthermore, the present devices and methods allow for the extraction of whole genome and/or whole nucleic acid content from samples and/or biological samples, which would be difficult to perform when using conventional capillary or microfluidic based devices and methods, in particular ITP based capillary or microfluidic devices and methods. Furthermore, the efficient extraction of target nucleic acids obtained by using the devices and methods described herein facilitates downstream In Vitro Diagnostic (IVD) methods in which the amount of target nucleic acid (e.g., DNA and/or RNA) is directly related to the sensitivity that can be achieved in said downstream IVD assay. Sometimes, extraction of nucleic acid can be conventionally performed using a spin column or magnetic glass particles on the surface of which nucleic acid is bound. The devices and methods described herein may confer any one or more of the following advantages over these conventional methods: higher extraction yield (potentially less loss) compared to column or bead based extraction methods; compared with the larger floor space of the MagNA Pure or other desk type instruments, the device is simpler to set; sample turnover may be faster and have high parallelism than other devices applied for similar uses; are easily integrated with other microfluidic-based systems for downstream processing of extracted nucleic acids. Furthermore, flat channels may generally be used in the devices and methods described herein, and the channel architecture may generally have advantageous heat transfer capabilities compared to narrow channels that may generally be used in capillary and/or microfluidic devices. Thus, the use of the flat channel may prevent overheating or boiling of the sample and/or the focused sample. Furthermore, the devices and methods described herein generally allow for gentle sample collection, which can often be an important feature when performing whole genome extractions, microbial extractions, extraction of desired target cells (such as stem cells, tumor cells, e.g., circulating tumor cells, or other rare cells) where preservation of cellular function is desired, or for other unstable analytes. In general, traditional whole genome extraction may be characterized by the use of pipettes, which may shear genomic DNA. In some embodiments, the devices and methods described herein allow for obtaining samples without the need for potentially destructive pipetting, where disruption of the sample by pipetting may be an issue in some exemplary embodiments. In further embodiments, the devices and methods described herein may allow for whole genome extraction, wherein shearing and/or disruption of any portion of the whole genome may not occur or be minimal due to the use of the devices and methods.
Furthermore, the present disclosure relates generally to devices and methods for sample analysis. As described herein, devices and methods for sample analysis generally involve performing accelerated electrophoresis using the devices or methods. The apparatus for performing accelerated electrophoresis generally comprises an arrangement of one or more electrodes sufficient to perform said accelerated electrophoresis. In an exemplary embodiment, the device comprises a polygonal or circular geometry. During accelerated electrophoresis-based analysis of a sample using such an exemplary device, the accelerated electrophoresis zone of the device may move from the edge of the polygon or circle to the center of the polygon or circle. The polygon may be selected from a triangle, a quadrilateral, a pentagon, a hexagon, a heptagon, an octagon, a nonagon, a decagon, and/or the polygon may have 3, 4, 5, 6, 7, 8, 9, 10-20, 20-50, or 50-100 or more sides. Further, in exemplary embodiments, the means for performing accelerated electrophoresis may include any device size that facilitates analysis of a desired sample volume, such as a diameter, for example, a depth. In an exemplary embodiment, the size of the device may scale with the volume used. In some embodiments, the device may comprise a diameter in the range of about 1mm or more to about 20mm or more.
In an exemplary embodiment, the current may be applied in the device through one or more high voltage connections and a ground connection at the center of the system. In further exemplary embodiments, a device for sample analysis as described herein may comprise glass, ceramic, and/or plastic. In some cases, the plastic may include materials such as polypropylene, polytetrafluoroethylene (which may be referred to as polypropylene), and the like Commercially available), poly (methyl methacrylate) ("PMMA"), and/or polydimethylsiloxane ("PDMS"). These materials may result in improved heat transfer properties, particularly when glass and/or ceramic are used, which may be beneficial during device operation. For example, overheating (or boiling) of the focusing material may be prevented because the flat channels of a circular or concentric ITP device (i.e., ETP device) have good heat transfer capabilities compared to narrow channels. Furthermore, in further embodiments, the current/voltage programming may also be adapted to adjust the joule heating of the device.
In an exemplary embodiment, a device for sample analysis may comprise a two-dimensional arrangement of one or more electrodes, wherein the arrangement is sufficient to perform accelerated electrophoresis. In further exemplary embodiments, the one or more electrodes may include one or more ring-shaped (circular) electrodes, and/or the one or more electrodes may be arranged in a polygon. The polygon may be selected from a triangle, a quadrilateral, a pentagon, a hexagon, a heptagon, an octagon, a nonagon, a decagon, and/or the polygon may have 3, 4, 5, 6, 7, 8, 9, 10-20, 20-50, or 50-100 or more sides. In an exemplary embodiment, the one or more electrodes of the device may be arranged such that the arrangement comprises a diameter or width in the range of about 1mm to about 20 mm. In further exemplary embodiments, the arrangement of one or more electrodes of the device may comprise an electrode at the center of the device. In some embodiments, the one or more electrodes of the device may comprise a platinized and/or gold-plated stainless steel ring; one or more stainless steel electrodes; and/or one or more graphite electrodes. Further, in some embodiments, the one or more electrodes may comprise a wire electrode. In an exemplary embodiment, the arrangement of one or more electrodes may comprise an arrangement of more than one regularly spaced electrodes. In some embodiments, the arrangement of one or more electrodes may comprise a non-linear, continuous arrangement of more than one electrode. In some embodiments, the arrangement of one or more electrodes may comprise a single wire electrode formed into a desired shape, such as a circle. In some embodiments, the arrangement of one or more electrodes may comprise an array of line electrodes. In an exemplary embodiment, the device for sample analysis may be a disposable device. The disposable device may include stainless steel and/or graphite electrodes. In other exemplary embodiments, the device for sample analysis may be used as a bench-top instrument, i.e., the device may comprise a workstation and/or may be reusable.
Moreover, in further exemplary embodiments, a device for sample analysis as described herein can include a sample volume that holds 1 μ Ι or less, 1 μ Ι or more, 10 μ Ι or more, 100 μ Ι or more, 1mL or more, 4mL or more, 5mL or more, 10mL or more, or 15mL or more. In an exemplary embodiment, the volume may be about 15 mL. In an exemplary embodiment, the sample may be injected into the device through an opening in the top of the device. In further embodiments, the use of the device may produce a focused sample that is collected at the center of the device, and further, in some embodiments, the sample may be collected from the center of the device. In some embodiments, the sample may be collected by washing out a gel that may contain a focused sample at the center of the device. In some embodiments, the sample may be collected in a tube located at the center of the device. In some embodiments, once the focused sample reaches the center of the device, the sample can be collected by pipetting out the sample. In exemplary embodiments, the sample can comprise a target analyte. In further embodiments, application of electricity to the device can focus target analytes contained by a sample into a focal zone, and further can collect the target analytes from the device after accelerated electrophoresis. In further exemplary embodiments, the sample analyzed using any of the devices or methods of accelerated electrophoresis described herein may comprise a biological sample, such as blood and/or plasma. The blood and/or plasma can comprise a target analyte, such as a target nucleic acid. In some embodiments, the volume of the blood and/or the plasma may be about 4 mL. The blood and/or plasma may be derived from a subject. In exemplary embodiments, a sample analyzed using any of the devices or methods of accelerated electrophoresis described herein can comprise one or more biomarkers that can be separated and/or focused and/or collected from the device.
Furthermore, in exemplary embodiments, the device for sample analysis may further comprise a leading electrolyte and a trailing electrolyte. In exemplary embodiments, all common electrolytes known to those skilled in the art for isotachophoresis can be used with the present device when the precursor ions have an effective electrophoretic mobility that is higher than that of one or more target sample ions. Accordingly, the opposite may generally be true for the selected terminating ion. In exemplary embodiments, the device may be used for cation separation/acceleration electrophoresis (positive ion mode) or for anion separation/acceleration electrophoresis (negative ion mode). In further exemplary embodiments, common lead electrolytes for anion separation using accelerated electrophoresis can include, for example, chloride, sulfate, or formate buffered to a desired pH with a suitable base such as histidine, TRIS, creatinine, and the like. In some cases, chloride can be used as a precursor ion in anion isotachophoresis because it has very high electrophoretic mobility and is present in most biological samples. The concentration of the leader electrolyte used to perform accelerated electrophoresis of anion separation may be in the range of 5mM-1M relative to the leader ion. Accordingly, the terminating ion may typically comprise weak acid anions such as MES, TAPS, MOPS, HEPES, acetate, glutamate and low mobility anions. The concentration range of the terminating electrolyte for accelerated electrophoresis in positive ion mode is: relative to stop ion, 5 mM-10M. In some embodiments, because the device can operate in positive ion mode (separation/concentration of cationic species) or negative ion mode (separation/concentration of anionic species), the device for sample analysis can be used for a wide range of analytes, for example, from small inorganic and organic ions to large biopolymers (including peptides, proteins, polysaccharides, and DNA) or even particles including bacteria and viruses.
In some embodiments, for cation separation, common precursor ions for accelerating electrophoresis may generally include, for example: potassium, ammonium or sodium, with acetate or formate being the most common buffer counter ion. The reactive hydronium ion mobility boundary then acts as a universal terminating electrolyte formed by any weak acid.
In some embodiments, an increase in the concentration of the precursor ions in the positive and negative ion modes can result in a proportional increase in the sample area, at the expense of increased current (power) for a given applied voltage. Typical concentrations are generally in the range of 10-20 mM; however, higher concentrations may also be used.
In further exemplary embodiments, the means for sample analysis may include a lead electrolyte stabilized by a gel, viscous additive, and/or otherwise hydrodynamically separated from a terminating electrolyte. The gel or hydrodynamic separation may prevent leading and terminating electrolytes from mixing during device operation. Furthermore, the gel may comprise an uncharged material or any other material that forms a gel, such as agarose, polyacrylamide, pullulan, and the like. In particular, this includes all types of hydrogels. In some embodiments, the gel may be resistant to changes in pH, such as acid or base stable gels. In further embodiments, the device may include a leading electrolyte, e.g., a leading electrolyte stabilized by a gel, viscous additive, and/or otherwise hydrodynamically separated from a terminating electrolyte, having a diameter ranging from about 10 μm to about 20mm thickness (height). In some embodiments, the maximum thickness may generally be a thickness that can produce a uniform electric field throughout the thickness. In embodiments in which the thickness may be such that the electric field is not uniform, the electric field may not be linearly varied, however, the underlying principles of accelerated electrophoresis may still apply, and separation, concentration, focusing and/or collection of the target analyte may still occur as desired. In some embodiments, thicknesses greater than 20mm may be used, and curved device architectures may be used to obtain linear behavior. In some embodiments, the leading and/or trailing electrolytes can include electrolytes having a desired buffering capacity. For example, the leading electrolyte may include an electrolyte that minimizes the buffering capacity and/or counteracts any pH changes that may occur as a result of performing accelerated electrophoresis such that the pH of all accelerated electrophoresis zones is nearly the same or the same. For example, HCl-histidine can be used as a lead electrolyte with desirable buffering capacity. Further, in some embodiments, pH stable gels may be used.
In some embodiments, the device may include electrodes in a leading electrolyte cell connected to a concentrator by a tube. The tubes may be directly connected by a semi-permeable membrane or closed at one end. Furthermore, the concentrator may be connected on-line to other devices, such as capillary analyzers, chromatography, PCR devices, enzyme reactors, etc. Furthermore, in arrangements without a gel containing the lead electrolyte, the tube may be used to supply a counter-current flow of lead electrolyte.
In exemplary embodiments, the means for sample analysis may comprise a gel or other material that may be used to stabilize the lead electrolyte. In further embodiments, the means for sample analysis may comprise a gel, and the gel may help to avoid unwanted sample contamination. For example, a device for sample analysis may be used to extract ctDNA, and the gel may be used to help avoid contamination of ctDNA with genomic DNA. To avoid such unwanted contamination, the gel may have a composition to allow ctDNA, but not genomic DNA, to migrate through the gel. This principle can be applied to other sample analyses where it may be beneficial to avoid contamination of the target sample/target analyte. In further embodiments, the reticulated polymer and/or porous material may be used in a manner similar to a gel in a device for sample analysis, such as filter paper or a hydrogel. The selection of the reticulated polymer and/or porous material may be a material that facilitates the desired separation/concentration and/or prevents undesired sample contamination. For example, a material that does not allow the protein to pass/migrate but can allow the target nucleic acid to pass/migrate can be selected. In further exemplary embodiments, the device for sample analysis may not feature a gel but may still perform accelerated electrophoresis for sample analysis, which may feature focusing and/or concentrating and/or collecting the target analyte and/or desired sample.
In exemplary embodiments, the device for sample analysis may include at least one electrolyte cell, at least two electrolyte cells, or at least three electrolyte cells. In some embodiments, the sample may be mixed with a lead electrolyte and then loaded into the device. In some embodiments, the sample may be mixed with the trailing electrolyte and then loaded into the device. In a further embodiment, the sample may be mixed with a conducting solution and loaded into the device. Furthermore, in some embodiments, the sample may contain suitable terminating ions for accelerating electrophoresis and may be loaded into the device. The use of such a sample can eliminate the terminating electrolyte zone. In some embodiments, the sample may be loaded through an opening in the device, e.g., an opening in the top of the device, e.g., an opening in the side of the device. In some embodiments, the sample may be loaded in the space between the gel and the circular electrode of the ETP device.
In further exemplary embodiments, the device can be used to concentrate the target analyte, for example, about 2 times or more to about 1000 times or more. In some embodiments, the target analyte can include a target nucleic acid. In further embodiments, the target analyte may comprise small inorganic and organic ions, peptides, proteins, polysaccharides, DNA, or microorganisms such as bacteria and/or viruses.
Furthermore, in further exemplary embodiments, a device for sample analysis as described herein may be operated using constant current, constant voltage, or constant power. When using a circular architecture and further using a constant current operated device (e.g., a device comprising one or more circular electrodes), the accelerated electrophoresis boundary velocity equation for calculating the velocity v at a distance d from the starting point and radius r is given by: v. of(d)=uLI/2π(r-d)hκLConstant/(r-d). When using a circular architecture and operating the device (e.g., a device comprising one or more circular electrodes) with a constant voltage, the accelerated electrophoresis boundary velocity equation for calculating the velocity v at a distance d from the origin and radius r is given by: upsilon isL=uLUκT/[(r-d)κT+κLd. When using a circular architecture and operating the device (e.g., a device comprising one or more circular electrodes) with constant power, the accelerated electrophoresis boundary velocity equation for calculating the velocity v at a distance d from the origin and radius r is given by: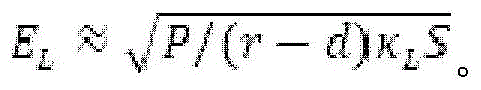 in further embodiments, the voltage or current or power available for performing accelerated electrophoresis in the device may be varied in discrete steps. For example, current or voltage or power may be applied at a first value to allow separation and grouping of electrolytes and/or charged species within the device and/or during implementation of any of the methods described herein, and after the separation and grouping occurs, current or voltage or power may be applied at a second value to increase or decrease Accelerating the rate of electrophoresis as may be desired for analysis of a given sample. In embodiments where a non-circular polygonal architecture is used, the electric field may not vary linearly as is the case with circular or spherical architectures. Further, in embodiments where a non-continuous arrangement of electrodes may be used, the electric field may be varied in a manner that produces a star-shaped arrangement of electrolyte and/or sample. For example, if a dot-based electrode array formed in a circular shape is used in a device for sample analysis, the resulting areas of electrolyte and/or sample, etc. may form a star shape rather than a circle formed by the electric field generated by the dot-based electrode array.
In further exemplary embodiments, the device for sample analysis may be used for extracting nucleic acids from a sample, such as a biological sample. The sample may comprise whole blood or plasma. The sample may comprise a cell culture from which the target analyte (such as a whole genome) may be harvested. The nucleic acid may comprise one or more target nucleic acids, such as tumor DNA and/or ctDNA. In exemplary embodiments, the device for sample analysis may be used to focus and collect tumor DNA and/or circulating tumor DNA (ctdna) and/or circulating cfDNA, such as those present in pregnant woman blood or plasma, and/or circulating DNA expressing proteins that are over-or under-expressed under specific conditions, which may then optionally be subjected to further downstream analysis, such as nucleic acid sequencing and/or other in vitro diagnostic applications. Such downstream in vitro applications include, for example, disease detection such as cancer diagnosis and/or cancer prognosis and/or cancer staging, detection of infectious disorders, paternity analysis, detection of fetal chromosomal abnormalities such as aneuploidy, detection of fetal genetic characteristics, detection of pregnancy-related diseases, detection of autoimmunity or inflammation, and myriad other potential uses.
In exemplary embodiments, the device for sample analysis can be used to focus and collect target nucleic acids, and the target nucleic acids can be of any desired size. For example, the target nucleic acid can be 5nt or less, 10nt or less, 20nt or less, 30nt or less, 50nt or less, 100nt or less, 1000nt or less, 10,000nt or less, 100,000nt or less, 1,000,000nt or less, or 1,000,000nt or more. In some embodiments, the device can be used to extract target nucleic acids from cell-free DNA. Furthermore, in exemplary embodiments, the device can be used to concentrate and collect a target analyte from a sample. The sample may comprise a biological sample. In further embodiments, the target analyte can be used in one or more downstream in vitro diagnostic applications. Furthermore, in exemplary embodiments, the device for sample analysis may be connected in-line to other devices, such as capillary analyzers, chromatography, PCR devices, enzyme reactors, etc., and/or any other device that may be used to perform further sample analysis, such as devices associated with IVD applications. In further exemplary embodiments, the apparatus for sample analysis may be used in a workflow with nucleic acid sequencing library preparation. Furthermore, in further embodiments, the device for sample analysis may be used with a liquid handling robot that may optionally be used to perform downstream analysis on samples that may have been focused and/or collected from the device.
In further exemplary embodiments, use of the apparatus may result in any one or more of: higher extraction yield (possibly without loss) compared to column or bead based extraction methods; compared with the larger floor space of the MagNA Pure or other desk type instruments, the device is simpler to set; sample turnover may be faster and have high parallelism than other devices applied for similar uses; are easily integrated with other microfluidic-based systems for downstream processing of extracted nucleic acids.
Furthermore, the present disclosure relates generally to a sample analysis method comprising performing accelerated electrophoresis for analyzing the sample. The method may be carried out using any of the devices for sample analysis described herein. In an exemplary embodiment, the method further comprises: a. providing a device for performing accelerated electrophoresis, such as those described herein; b. providing a sample on said device, wherein said sample comprises one or more target analytes; c. providing a leading electrolyte and a trailing electrolyte on the device; d. performing accelerated electrophoresis using the apparatus; collecting the one or more target analytes. In an exemplary embodiment, the means for sample analysis may comprise a polygonal or circular geometry. In a further exemplary embodiment, the accelerated electrophoresis zone of the device may move from the edge of the polygon or circle towards the center of the polygon or circle during accelerated electrophoresis. The polygon may be selected from a triangle, a quadrilateral, a pentagon, a hexagon, a heptagon, an octagon, a nonagon, a decagon, and/or the polygon may have 3, 4, 5, 6, 7, 8, 9, 10-20, 20-50, or 50-100 or more sides. Further, in exemplary embodiments, the device may include any device size, such as a diameter, for example a depth, that facilitates analysis of a desired sample volume. In an exemplary embodiment, the size of the device may scale with the volume used. In exemplary embodiments, the device may comprise a diameter in the range of about 1mm or more to about 20mm or more.
In an exemplary embodiment, the sample analysis method may include using accelerated electrophoresis, which may be implemented using a two-dimensional arrangement of one or more electrodes. In some embodiments, the method may comprise performing accelerated electrophoresis by using one or more annular (circular) electrodes and/or by using one or more electrodes arranged in a polygonal shape. The polygon may be selected from a triangle, a quadrilateral, a pentagon, a hexagon, a heptagon, an octagon, a nonagon, a decagon, and/or the polygon may have 3, 4, 5, 6, 7, 8, 9, 10-20, 20-50, or 50-100 or more sides. In an exemplary embodiment, the diameter or width of the electrode arrangement may be in the range of about 10mm to about 20 mm. Furthermore, in some embodiments of the sample analysis method, the method may further comprise using an electrode at the center of the apparatus for performing accelerated electrophoresis. In an exemplary embodiment of the method, one or more electrodes that may be used to perform accelerated electrophoresis may comprise one or more platinum and/or gold plated stainless steel rings; one or more stainless steel electrodes; and/or one or more graphite electrodes. In some embodiments of the method, accelerated electrophoresis may be performed using one or more line electrodes. In an exemplary embodiment of the method, accelerated electrophoresis may be carried out using an arrangement of more than one regularly spaced electrodes. In further embodiments, during a sample analysis method as described herein, current may be applied through one or more high voltage connections and a ground connection at the center of the system. In some embodiments, the arrangement of one or more electrodes may comprise a non-linear, continuous arrangement of more than one electrode. In some embodiments, the arrangement of one or more electrodes may comprise a single wire electrode formed into a desired shape, such as a circle. In some embodiments, the arrangement of one or more electrodes may comprise an array of line electrodes. In an exemplary embodiment of the method, the device for carrying out the sample analysis method may be a disposable device. The disposable device may include stainless steel and/or graphite electrodes. In other exemplary embodiments of the methods, the device for sample analysis according to the methods described herein may be used as a bench-top instrument, i.e., the device may comprise a workstation and/or may be reusable
Furthermore, in further exemplary embodiments, the methods may use sample volumes of 1 μ l or less, 1 μ l or more, 10 μ l or more, 100 μ l or more, 1mL or more, 4mL or more, 5mL or more, 10mL or more, or 15mL or more. In some embodiments, the volume may be about 15 mL. In exemplary embodiments, when practicing the methods described herein, the sample can be injected into the device through an opening in the top. In a further exemplary embodiment of the method, the sample may be focused and the sample may be collected in the center of the device. In some embodiments of the method, the sample may be collected by washing out a gel, which may contain a focused sample, located at the center of the device for sample analysis. In some embodiments of the method, the sample may be collected in a tube located at the center of the device for sample analysis. In some embodiments of the method, once the focused sample reaches the center of the apparatus for sample analysis, the sample may be collected by pipetting the sample. In an exemplary embodiment, the focused sample can include a target analyte. In a further exemplary embodiment of the method, the sample may be collected from the center of the device after accelerated electrophoresis. In a further embodiment, application of electricity to carry out the method focuses a target analyte contained in a sample into a focal zone. The target analyte can then be collected after accelerated electrophoresis. In further exemplary embodiments of the methods described herein, the sample analyzed using any of the devices or methods of accelerated electrophoresis described herein may comprise a biological sample, such as blood and/or plasma. The blood and/or plasma can comprise a target analyte, such as a target nucleic acid. In some embodiments, the volume of the blood and/or the plasma may be about 4 mL. The blood and/or plasma may be derived from a subject. In exemplary embodiments, a sample analyzed using any of the methods of accelerated electrophoresis described herein can comprise one or more biomarkers that can be separated and/or focused and/or collected.
In further embodiments, the method may further comprise using a leading electrolyte and a trailing electrolyte. Furthermore, in some embodiments, the accelerated electrophoresis may be used for cation separation/accelerated electrophoresis (positive ion mode) and/or anion separation/accelerated electrophoresis (negative ion mode). In further exemplary embodiments, common lead electrolytes for anion separation using accelerated electrophoresis can include, for example, chloride, sulfate, or formate buffered to a desired pH with a suitable base such as histidine, TRIS, creatinine, and the like. Further, the concentration of the leading electrolyte for accelerated electrophoresis for anion separation may be in the range of 5mM-1M relative to the leading ion. Accordingly, the terminating ion may typically comprise weak acid anions such as MES, MOPS, HEPES, acetate, glutamate and low mobility anions. The concentration range of the terminating electrolyte for accelerated electrophoresis in positive ion mode is: relative to stop ion, 5 mM-10M. In some embodiments, because the device can be operated in positive ion mode (separation/concentration of cationic species) or negative ion mode (separation/concentration of anionic species), the methods for sample analysis can be used for a wide range of analytes, for example, from small inorganic and organic ions to large biopolymers (including peptides, proteins, polysaccharides, and DNA) or even particles including bacteria and viruses.
In some embodiments, for cation separation, common precursor ions for accelerating electrophoresis may generally include, for example: potassium, ammonium or sodium, with acetate or formate being the most common buffer counter ion. The reactive hydronium ion mobility boundary then acts as a universal terminating electrolyte formed by any weak acid.
In some embodiments, an increase in the concentration of the precursor ions in the positive and negative ion modes can result in a proportional increase in the sample area, at the expense of increased current (power) for a given applied voltage. Typical concentrations are generally in the range of 10-20 mM; however, higher concentrations may also be used.
In some embodiments, the method may include using a lead electrolyte that is stabilized or otherwise hydrodynamically separated from a terminating electrolyte by a gel, viscous additive. The gel or hydrodynamic separation may prevent leading and terminating electrolytes from mixing during device operation. In addition, the gel may include uncharged materials such as agarose, polyacrylamide, pullulan, and the like. In some embodiments, the method can include using a leading electrolyte having a thickness (height) ranging from about 10 μm to about 20mm in diameter. In some embodiments, the maximum thickness may generally be a thickness that can produce a uniform electric field throughout the thickness. In embodiments where the thickness may be such that the electric field is not uniform, the electric field may not be linearly varied, however, the underlying principles of accelerated electrophoresis may still apply, and separation, concentration, focusing and/or collection of the target analyte should still occur as desired. In some embodiments, thicknesses greater than 20mm may be used, and curved or spherical device architectures may be used to obtain linear behavior.
In exemplary embodiments of the methods for sample analysis described herein, the methods for sample analysis may include the use of a gel used in conjunction with an accelerated electrophoresis method, which gel may be used to stabilize a lead electrolyte in a device for sample analysis according to the methods described. In further embodiments of the method, the method may comprise the use of a gel, and the gel may help to avoid unwanted sample contamination. For example, methods for sample analysis may be used to extract ctDNA, and the gel may be used to help avoid contamination of ctDNA with genomic DNA. To avoid such unwanted contamination, the gel may have a composition to allow ctDNA, but not genomic DNA, to migrate through the gel. This principle can be applied to other sample analyses where it may be beneficial to avoid contamination of the target sample/target analyte. In further embodiments, the reticulated polymer and/or porous material may be used in a manner similar to a gel used in methods of sample analysis, such as filter paper or a hydrogel. The selection of the reticulated polymer and/or porous material may be a material that facilitates the desired separation/concentration and/or prevents undesired sample contamination. For example, a material may be selected that does not allow the passage/migration of proteins but will allow the passage/migration of target nucleic acids. In further exemplary embodiments, methods for sample analysis may not feature gels but may still perform accelerated electrophoresis for sample analysis, which may feature focusing and/or concentrating and/or collecting target analytes and/or desired samples.
In further embodiments of the sample analysis method, after performing the accelerated electrophoresis, capillary analyzers, chromatography, PCR devices, enzyme reactors, and the like may be used to further evaluate the concentrated samples produced by the method. In some embodiments of the methods, the lead electrolyte may be first loaded into the apparatus for performing circular or concentric isotachophoresis, and then the sample mixed with the stop electrolyte may be loaded. In a further embodiment of the method, the sample may be mixed with a leading electrolyte and loaded into the apparatus for performing accelerated electrophoresis, and then a terminating electrolyte may be loaded. In a further embodiment of the method, the sample may be mixed with a conducting solution and then loaded into a device for performing accelerated electrophoresis. In exemplary embodiments of the method, a sample containing suitable stop ions for accelerated electrophoresis may be loaded into an apparatus for performing accelerated electrophoresis, and the use of the sample may eliminate the stop electrolyte zone.
In exemplary embodiments, the method can concentrate the target analyte, for example, about 2 times or more to about 1000 times or more. In exemplary embodiments, the target analyte can include a target nucleic acid. In further exemplary embodiments, the target analyte can include small inorganic and organic ions, peptides, proteins, polysaccharides, DNA, bacteria, and/or viruses.
In further embodiments, the sample analysis method may be performed by using a constant current, a constant voltage, or a constant power. When using a constant current and a method comprising using a device for sample analysis (which device further comprises a circular architecture, e.g. a device comprising one or more circular electrodes), the accelerated electrophoresis boundary velocity equation for calculating the velocity v at a distance d from the starting point and a radius r is given by: v. of(d)=uLI/2π(r-d)hκLConstant/(r-d). When using a constant voltage and a method comprising using a device for sample analysis (which device further comprises a circular architecture, e.g. a device comprising one or more circular electrodes), the accelerated electrophoresis boundary velocity equation for calculating the velocity v at a distance d from the starting point and a radius r is given by: v. ofL=uLUκT/[(r-d)κT+κLd. When using constant power and a method comprising using a device for sample analysis (which device further comprises a circular architecture, e.g. a device comprising one or more circular electrodes), the accelerated electrophoresis boundary velocity equation for calculating the velocity v at a distance d from the starting point and a radius r is given by: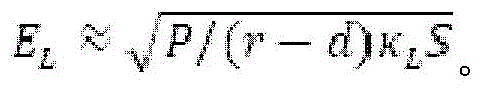 in further embodiments, the voltage or current or power available to perform accelerated electrophoresis may be varied in discrete steps. For example, a current or voltage or power may be applied at a first value to allow separation of electrolytes and/or charged species within the device and/or during implementation of any of the methods described herein And grouping, and after the separating and grouping occurs, current or voltage or power may be applied at a second value to increase or decrease the rate of accelerated electrophoresis, as may be desired for analysis of a given sample. In embodiments where a non-circular polygonal architecture is used, the electric field may not vary linearly as is the case with a circular architecture. Further, in embodiments where a non-continuous arrangement of electrodes may be used, the electric field may be varied in a manner that produces a star-shaped arrangement of electrolyte and/or sample. For example, if a dot-based electrode array forming a circular shape is used in a method for sample analysis, the resulting areas of electrolyte and/or sample, etc. may form a star shape rather than a circle formed by the electric field generated by the dot-based electrode array.
In further embodiments, the sample analysis method may comprise extracting nucleic acids from a sample, such as a biological sample. The sample may comprise whole blood or plasma. The sample may comprise a cell culture from which the target analyte (such as a whole genome) may be harvested. The nucleic acid may comprise one or more target nucleic acids, such as tumor DNA and/or ctDNA and/or cfDNA. In exemplary embodiments, methods for sample analysis may include focusing and collecting tumor DNA and/or circulating tumor DNA (ctdna) and/or circulating cell-free DNA, such as cell-free fetal DNA (cfdna), and then optionally performing further downstream analysis, such as sequencing and/or other in vitro diagnostic applications. In exemplary embodiments, the method for sample analysis can include focusing and collecting the target nucleic acid, and the target nucleic acid can be of any desired size. For example, the target nucleic acid can be 5nt or less, 10nt or less, 20nt or less, 30nt or less, 50nt or less, 100nt or less, 1000nt or less, 10,000nt or less, 100,000nt or less, 1,000,000nt or less, or 1,000,000nt or more. In further embodiments, the methods can be used to extract target nucleic acids from cell-free DNA. Furthermore, in some embodiments, the method can be used to concentrate and collect a target analyte from a sample. In some embodiments, the sample may comprise a biological sample. In further embodiments, the target analyte can be used in one or more downstream in vitro diagnostic applications. Further, in exemplary embodiments, a method for sample analysis may comprise using a device for sample analysis according to the methods described herein, and further wherein the device may be connected online to other devices, such as capillary analyzers, chromatography, PCR devices, enzyme reactors, etc., and/or any other devices that may be used to perform further sample analysis, such as devices associated with IVD applications. In further exemplary embodiments, the methods for sample analysis may be used in a workflow with nucleic acid sequencing library preparation. Furthermore, in further embodiments, the method for sample analysis may be used with a liquid handling robot that may optionally be used to perform downstream analysis of a sample that may have been focused and/or collected from a device for sample analysis used according to the method.
In an exemplary embodiment, the method may result in any one or more of: higher extraction yield (possibly without loss) compared to column or bead based extraction methods; compared with the larger floor space of the MagNA Pure or other desk type instruments, the device is simpler to set; sample turnover may be faster and have high parallelism than other devices applied for similar uses; are easily integrated with other microfluidic-based systems for downstream processing of extracted nucleic acids.
In further embodiments, the apparatus and/or method for accelerated electrophoresis may focus and allow for collection of the target analyte for any desired amount of time that allows the desired focusing and collection to occur. In some embodiments, the time to perform focusing and collecting as described herein can be from about 1 minute to about 30 minutes. In some embodiments, the time to perform a method as described herein may be about 15 min.
In some embodiments, by varying the buffer concentration, the percentage of gel, and/or the dwell time of the ETP run, enhanced separation/purification of the one or more target analytes from other materials contained in the original sample can be carried out by ETP-based separation/purification of the one or more target analytes. Moreover, such changes in buffer concentration, percentage of gel, and/or dwell time of the ETP run can enable enhanced separation/purification of each of the more than one target analytes from each other, e.g., focusing each of the more than one target analytes into a separate focusing zone (ETP band).
Furthermore, the present disclosure relates generally to devices, methods, and systems for sample analysis, wherein the devices, methods, and systems include performing accelerated electrophoresis and sample detection. The systems, apparatus and methods described herein are particularly applicable to automation using robotic liquid processors. The systems, devices, and methods discussed herein are compatible with the constant voltage, constant current, and constant power modes of accelerated electrophoresis as described above, as well as any one or more of the devices, systems, and methods discussed herein, and any downstream applications (e.g., IVD applications, such as those discussed).
Type of detection
Sample detection can be performed according to any known sample detection method. Detection can be by any of a variety of known methods, including electrical detection; spectrophotometric or optical tracking, e.g., of radioactive or fluorescent labels; or other methods of tracking molecules based on size, charge, or affinity. In a preferred embodiment, the one or more samples are detected by electrical detection. Electrical detection may include detection of conductivity, resistivity, current, voltage, and/or other electrical properties. In some embodiments, the sample detection may be performed by a conductivity or resistivity detector. In some embodiments, detecting may include detecting by spectroscopic, photochemical, biochemical, immunochemical, electrical, optical, thermal, or chemical means. The time-dependent transport properties of the sample collection volume can be measured by any suitable technique. The transport property can be a medium for transporting the target analyte, a solute (e.g., an ion) in the liquid, the target analyte itself (e.g., a chemical structure of a monomer), or a function of a label on the target analyte. Exemplary transport properties include current, conductance, resistance, capacitance, charge, concentration, optical properties (e.g., UV, fluorescence, and raman scattering), and chemical structure. In some embodiments, the transmission property is electrical conductivity.
Type of detector
The systems, devices, and methods may include one or more detectors or sensors, such as optical detectors, reflective sensors, Infrared (IR) detectors, electrical detectors, thermal sensors, flow sensors, and pressure sensors, including detectors described further in this disclosure. Optical detectors may include, but are not limited to, three-axis point detectors, Complementary Metal Oxide Semiconductor (CMOS) detectors, Charge Coupled Device (CCD) detectors, photodiode photosensors, photo resistors, photo multipliers, and phototransistors. The electrical detector may include electrodes or other detectors capable of detecting voltage, voltage difference, current, charge, conductivity, resistivity, or other electrical property. The electrical detector can be used to detect passage of the focal region of the extracted or purified nucleic acid, for example by detecting a change in conductivity at the interface between the trailing electrolyte and the leading electrolyte. The thermal sensors may include Infrared (IR) sensors, probe temperature sensors, thermistors, Negative Temperature Coefficient (NTC) thermistors, Resistance Temperature Detectors (RTDs), thermocouples, semiconductor-based sensors, and the like.
The systems, devices, and methods may include one or more electrical or electronic measurement devices, including ammeters (ammeters), capacitance meters, curve tracers, power factor (cos phi) meters, distortion testers, electricity meters, ESR meters, frequency counters, electrical leakage testers, LCR meters, microwave power meters, multimeters, network analyzers, ohmmeters, oscilloscopes, noise meters, Q meters, signal analyzers, signal generators, spectrum analyzers, scanner generators, transistor testers, electronic tube testers, wattmeters, vector oscilloscopes, video signal generators, voltage meters, and VU meters.
One or more detectors or sensors may be operated and controlled simultaneously or independently. In some cases, a single location may have a dedicated sensor, such as a conductivity or voltage sensor, that operates independently of other sensors dedicated to other points on the system or device. Feedback from the independent sensors may be used to independently control one or more electric fields on the system or device. For example, a sensor may detect changes in voltage over time within the collection well and feedback from the sensor may be used to control current flow within the system or device. The second sensor may act in a similar but independent manner at the second location. In some cases, a sensor may detect changes in an electrical property (e.g., conductivity or current) in the well over time, and feedback from the sensor may be used to control voltage or power within the system or device. In some cases, the systems, devices, and methods may include more than one sensor, optionally more than one type of sensor, such as an electrical sensor and a thermal sensor, provided that the systems, devices, and methods can still perform the desired analysis of the sample.
Conductivity detectors for use in the systems, devices and methods of the present invention may be designed according to known conductivity detection principles. The conductivity probe can be measured by amperometry, potentiometry, inductance or torroidal methods. Equivalently, detectors associated with the systems, devices, and methods can measure other characteristics related to conductivity, such as resistivity (inverse of conductivity) or total dissolved solids (TDS, conductivity related coefficient depending on the solution). The conductivity measurement can be covered from pure water (typically less than 1x 10) -7S/cm) to greater than 1S/cm. Because conductivity and resistivity are reciprocal, systems, devices, and methods described as measuring one of these properties will be understood to also measure another property.
In general, if two electrodes are inserted into the solution (or applied across the top of a gel containing the solution) and a potential is applied across the electrodes, the solution containing the sample, electrolyte and/or analyte will conduct an electrical current. The greater the current conducted by the solution, the higher its conductivity. Ohm's law applies, so:
V=IR
where V is the applied potential (volts), I is the current (amps), and R is the resistance (ohms). The resistance of a solution may be determined by several factors, including the concentration and type of ionic species in the solution, and the temperature. The conductance G (in Siemens, denoted by the symbol S) of the solution is represented byThe inverse of the resistance gives:
conductance may also be provided in units of inverse ohms (mhos). The resistivity in ohm-cm (p) is given by:

where A is the cross-sectional area (cm) of the electrode inserted into the solution2) And L (cm) is the distance between them. The reciprocal of the resistivity is the conductivity κ, in S/cm, also known as the specific conductance.

As shown in the above equation, measurement of one electrical property of a solution, sample, or analyte may be equivalent to measurement of other electrical properties by known equations and relationships. Thus, the present methods, devices and systems include any form of electrical detection used in conjunction with sample-accelerated electrophoresis.
The conductivity detector may be any known in the art. Such detectors generally operate according to the following principle: under the influence of a potential gradient, ions/analytes in solution can carry a charge, so if a voltage is applied between two electrodes located in solution, a current will flow between the two electrodes, and the solution is said to be electrically conductive. Such methods are useful for detecting a target analyte. In some embodiments, in a conductivity detector, the resistance of the solution is typically actually monitored, and what provides the output of the detector is the change in mobile phase resistance in the presence of the solute. Therefore, the operation of the detector is typically considered in terms of resistance measurement. In some embodiments, the conductivity detector cell comprises two electrodes, between which an AC potential is applied. The cell capacitance can be minimized by ensuring that the surface area of the electrodes is small. In general, the choice of electrodes and potentials will be optimized to increase the signal-to-noise ratio without interfering with the detection function. In some embodiments, the potential difference is 1-2V. In some embodiments, the potential difference is less than 1V, about 1V, 1-2V, or greater than 2V. The electrode size will typically be less than 1 min. In some embodiments, the electrode surface area is less than 1 μm, less than 10 μm, less than 50 μm, less than 100 μm, less than 500 μm, less than 1mm, or greater than 1 mm. The electrodes may be formed of any suitable material known in the art, such as platinum (Pt), carbon, graphite, and the like. In other embodiments, the detector may not be in direct contact with the solution, sample, or analyte to be measured, for example, a capacitively coupled contactless conductivity detector (C4D). The electrodes of the conductivity detector may be placed at any suitable location throughout the apparatus for performing accelerated electrophoresis. In some embodiments, the detector is specifically positioned to signal target analyte collection, e.g., in the vicinity of an elution pool.
In some embodiments, the method for measuring the position of the ETP belt is to measure the voltage or resistance between any two points in the system or device, such as between the drive electrode and the ground electrode. In systems with more than two electrodes, the measurement may be made between any pair of electrodes. The measurement can be easily performed because voltage-driven electrophoresis/accelerated electrophoresis can also be a measurement voltage in constant power mode. The voltage may be increased with trailing ion fill systems or devices throughout the accelerated electrophoresis process. However, the elution cell may have a large cross-section and thus the contribution to the total resistance may be small. Thus, changes in buffer conductivity in this region may not strongly affect the overall channel resistance, and the voltage may stop rising as the ETP region enters the elution cell. This can be used as a signal to stop applying current and end the run.
In some embodiments, to evaluate the voltage change, a derivative of the voltage may be calculated. In some embodiments, the Lanzcos differentiation method may be used to suppress high frequency noise. A threshold may be set for the derivative and a trigger may be made when the derivative exceeds the threshold. In some cases, the introduction of additional triggers may improve the robustness of the control. In some cases, only some of these flip-flops are used to change the drive current, while others may be used to mark a point in time in operation, which may improve the time setting of the final flip-flop.
In some embodiments, the method for detecting the position of the ETP strip is a local measurement of the conductivity. This can be done using a capacitively coupled contactless conductivity detector (C4D). The method may utilize a high frequency alternating current through the sample collection well wall and coupled to the electrolyte. This local measurement can be performed at the elution cell itself. This technique may reduce or eliminate ambiguity associated with measurements taken over the entire channel. In this technique, an end-of-run trigger may be selected once a change in conductivity is seen on the elution cell conductivity detector. C4D detection can be performed using electrodes placed below the elution volume.
In some embodiments, maximizing electrode area may reduce the necessary drive frequency. For example, a drive frequency of from about 100kHz to about 10MHz with an electrode contact pad of between about 0.2mm2 to about 50mm2 may be used. The C4D sensor may be implemented using electronic components including resistors, capacitors, diode bridges, and high frequency operational amplifiers, as well as high frequency signal sources such as from a direct digital synthesizer.
In some embodiments, the method for detecting the position of the ETP band is a local measurement of the temperature near the elution pool. The measurement may be made with a temperature sensor, including a thermocouple or an infrared temperature sensor. A sensor may be placed below the channel near the elution cell and may monitor the temperature over time. When trailing ions of lower mobility replace leading ions of higher mobility (e.g., the LE-TE interface of the ETP region), the electric field in the channel may increase and the temperature may increase. During isotachophoresis and accelerated electrophoresis, trailing electrolyte ions of lower mobility and leading electrolyte ions of higher mobility may meet at the ITP or ETP interface. The ETP interface may include a sample analyte, such as a nucleic acid, concentrated between leading electrolyte ions and trailing electrolyte ions. The presence of an ETP interface between the higher mobility leading ion and the lower mobility trailing ion can be detected by an increase in temperature, thus also indicating the presence of a sample therebetween. The temperature rise may be 1-10 ℃.
Alternatively, however, in some embodiments, the inventive systems, devices, or methods described herein are characterized by no or minimal temperature fluctuations in the course of accelerating an electrophoresis run.
Detector position
One or more sample detector components of a system, device, or method can be positioned anywhere in the sample analysis region, e.g., anywhere from where the sample of the device is loaded into the sample collection compartment. In some embodiments, sample detection occurs near or within a sample collection compartment of a system or device. In some embodiments, the detection occurs within the sample collection volume. In some embodiments, the detection occurs below the sample collection volume. In some embodiments, detection occurs within the LE cell below the sample collection volume.
In some embodiments, one or more detectors may be integrated with the apparatus for performing accelerated electrophoresis. For example, in some embodiments, one or more detectors are part of a bottom plate or bottom substrate that may be connected to a top plate or top substrate to perform accelerated electrophoresis. In some embodiments, the one or more detectors may be part of a top plate or substrate integrated with a bottom plate or substrate to perform accelerated electrophoresis. In some embodiments, one or more detector probes may be incorporated into the bottom substrate, and detection occurs near or within the center post of the bottom substrate. In some embodiments, one or more detector probes may be incorporated into the top substrate, and detection occurs near or inside the center post of the top substrate. In some embodiments, the detection can occur below, above, near, or in contact with the sample collection volume or a container (e.g., semi-permeable membrane, compartment, tube, well, etc.) containing the sample collection volume.
In embodiments where the detector and the means for performing accelerated electrophoresis are interconnected components, these components may be connected by any suitable means. In some embodiments, the components may be connected by physical or chemical means. In some embodiments, the components are connected by magnets. In some embodiments, O-rings, spacers, insulators, or other such components may be used to prevent leakage between the detection component and the accelerated electrophoresis component.
In some embodiments, there may be one or more sample detection components for use with the present systems, devices, or methods. In some embodiments, there is a single detector. In some embodiments, there are one or more detectors. In some embodiments, there are two or more detectors. In some embodiments, sample detection may be performed at several or more discrete locations throughout the system or device. In some embodiments, there may be a number of sample detection locations. In some embodiments, there may be continuous sample detection between any two locations throughout the system or device. In some embodiments, one or more detectors may be incorporated into the device and/or the system itself. In some embodiments, one or more detectors may contact the device and/or system. In some embodiments, one or more detectors may be incorporated into the device and/or system itself and one or more detectors may contact the device and/or system.
Automation, robotics, liquid handling
The invention also relates to a high throughput sample analysis device comprising a number of separate components for performing accelerated electrophoresis and sample detection. In some embodiments, the systems, devices, or methods of the invention may include automated sample collection during or after accelerated electrophoresis. Automated sample collection can be triggered by detection of a target analyte near or within the sample collection volume. Detection of the target analyte may be direct or indirect, e.g., the target analyte may be detected based on its physical, biochemical, optical, mechanical or other properties, or the target analyte may be indirectly detected. Indirect detection may include detecting a transition between the leading electrolyte and the trailing electrolyte by, for example, electrical detection. More generally, any detection method that includes detecting the focal region of the sample or the transition between the LE and TE regions may be used to detect the sample. This detection can then be used to trigger automatic liquid handling.In some embodiments, the system, apparatus or method may include a robotic assembly configured to move in at least one of an x-y direction, an x-y-z direction or a rotational direction and may include an automated liquid handler. An automated liquid handler may intake and dispense a volume of liquid between two or more containers within a system to transport the liquid between two or more stations or physical locations within the system. The systems, devices, and methods described herein are compatible with any commercially available liquid handling robot, e.g.  Liquid handling robot or
 Liquid handling robots, e.g. Tecan
 Tecan Freedom
 Or Tecan D300e digital dispenser robot.
In some embodiments, the method is a method in which an automated liquid handler is used, wherein the automated liquid handler comprises a 24-well, 48-well, 96-well, or 384-well manifold liquid handling head compatible with a microtiter plate to transfer solutions from one location to another.
In some embodiments, automated sample plating or streaking may be employed in conjunction with the systems and methods described herein. There are commercially available automated plating devices suitable for scribing or plating in laboratory standard petri dish formats. The following scribe-based devices may be included in the systems described herein: Isola(BioMerieux)、PetriPlaterTM(Scirobotics) and Inoqul ATM(BD Biosciences). There are also options that rely on automatically generated serial dilutions and plating, such as easySpiral
 (Interscience)。
In some embodiments, a liquid treatment system may include one or more liquid treatment machines and may be in communication with one or more treatment devices. In some embodiments, the liquid handling machine may be any programmable machine, robot or system or combination of programmable machines, robots or systems suitable for dispensing and/or extracting fluids. In some embodiments, the liquid handling machine includes a plurality of dispensing nozzles and a platform space for supporting a plurality of plates or other storage devices. Automated liquid handling systems are generally well known in the art. One example is  Freedom
  A robotic workstation. The device can implement automated liquid handling in a stand-alone instrument or in automated connection with an analytical system. A portable device for lysing and/or purifying biological samples is known from WO 2007/061943. The processing of nucleic acids is performed in the cartridge chamber using electrodes arranged on both sides, whereby the biological material is processed by electrolysis, electroporation, electro-osmosis, electrokinetic or resistive heating. The cartridge also includes a sieving matrix or membrane. By using sufficient buffers and other reagents, in conjunction with the application of electrodes, various reactions can be performed within the chamber and the desired product can be directed to, for example, a collection membrane. The cartridge itself may be placed in an integrated system that includes the required control elements and energy source. In some embodiments, the invention includes devices capable of performing accelerated electrophoresis to direct desired products to such collection membranes for further processing by liquid handling robots.
In some embodiments, the liquid handling machine is configured to accurately pipette and/or remove small volumes of fluid, e.g., 20mL or more, 20mL or less, 10mL or less, 5mL or less, 1mL or less, 500 μ L or less, 250 μ L or less, 100 μ L or less, 50 μ L or less, 10 μ L or less, or 1 μ L or less. In some embodiments, a liquid handling machine may include a fluid dispensing system, a suction system, and a communication system. In some embodiments, the fluid dispensing system may further comprise one or more fluid conduits and nozzles in communication with one or more fluid sources. In some embodiments, the aspiration system may include one or more fluid conduits in communication with the vacuum system and optionally in communication with the waste treatment system. In some embodiments, a communication system may include one or more displays and an input for inputting data to a machine. In some embodiments, the communication system may also include one or more components for communicating over a communication network, such as, but not limited to, the internet, an intranet, a local area network, a wireless local area network, a wide area network, or other communication networks and combinations of networks.
In some embodiments, the processing device used in conjunction with the liquid handling system or other robot may be a personal computer, workstation, server, mobile device, mobile phone, processor, and/or other processing device. In some embodiments, an apparatus may include one or more processors that process software or other machine-readable instructions and may include memory for storing software or other machine-readable instructions and data. The memory may include volatile and/or non-volatile memory. In some embodiments, the apparatus may further comprise or at least be in communication with one or more data structures and/or databases.
Further, in some embodiments, the apparatus may also include a communication system to communicate via wired and/or wireless communications, such as via the internet, intranets and ethernet, wired networks, wireless networks, and/or other communication networks. In some embodiments, the processing device may further include a display (not shown), such as a computer monitor, for viewing data, and an input device (not shown), such as a keyboard or pointing device (e.g., a mouse, trackball, pen, touchpad, or other device), for inputting and manipulating data, including inspection, images, documents, structured data, unstructured data, HTML pages, other web pages, and other data.
Sample (I)
The devices, methods, and systems of the present invention can be used to analyze and detect any suitable sample or samples, such as those described herein. The devices, methods, and systems of the present invention can be used to analyze, separate, and/or collect and detect any suitable sample or samples, such as those described herein, and/or to analyze, separate, and/or separate and detect any target analyte or analytes contained in any sample or samples. In some embodiments, the sample is a biological sample. In some embodiments, the biological sample is plasma, urine, blood, saliva, a tissue extract, or a biopsy extract, or a combination of any two or more biological samples. Samples containing the target analyte, e.g., nucleic acids, can be obtained from the subject by any number of means, including by collecting body fluids, collecting tissues, or by collecting cells/organisms. The sample may include or be obtained from blood, urine, serum, lymph, saliva, anal and vaginal secretions, sweat, semen, cerebrospinal fluid, semen, sputum, stool, and tissue. Any tissue or body fluid specimen may be used as a sample for analysis in accordance with the present disclosure. Nucleic acid molecules can also be isolated from cultured cells such as primary cell cultures or cell lines. The cells or tissues from which the nucleic acid is obtained may be infected by a virus or other intracellular pathogen. The sample may also be total RNA extracted from a biological specimen, cDNA library, virus or genomic DNA. The sample may also be isolated DNA from a non-cellular source, e.g., DNA amplified/isolated from a freezer. The obtained sample may consist of a single type of cell/organism or may consist of multiple types of cells/organisms. DNA can be extracted and prepared from a sample of a subject. For example, the sample can be treated to lyse the polynucleotide-containing cells using known lysis buffers, sonication techniques, electroporation, and the like. The target DNA may be further purified to remove contaminants, such as proteins, by using alcohol extraction, cesium gradient and/or column chromatography. Alternatively, the sample may be minimally or unaltered prior to analysis by accelerated electrophoresis.
In exemplary embodiments, the methods of the invention can include detecting, extracting, concentrating, and/or collecting a target analyte from a sample, e.g., a biological sample. In further exemplary embodiments, the method may comprise extracting ctDNA from a sample, and/or the method may comprise extracting cfDNA from a sample, such as blood or plasma of a pregnant woman. In further exemplary embodiments, the methods can include extracting, concentrating, and/or collecting a target analyte from a sample, e.g., a biological sample, and the target analyte can be used in one or more downstream in vitro diagnostic applications.
Benefits of automated sample analysis and detection using accelerated electrophoresis
Sample detection in a system or method comprising a device for performing accelerated electrophoresis may have one or more of the following advantages: ease of automation, ease of high throughput design, label-free sample detection, multiple sample concentration, minimal sample manipulation, convenient and rapid separation of sample from other components, less sample loss, higher sample yield, fewer steps to obtain a substantially pure sample, greater number of low concentration samples, greater utility and accuracy of downstream sample analysis, and less sample contamination.
In some embodiments, the system is particularly advantageous for allowing label-free, dye-free sample analysis, concentration, purification, and/or collection. Such a system may allow for rapid analysis of a sample without the need for expensive or time-consuming preparation steps. In some embodiments, accelerated electrophoretic separation of target analytes from other components of an analytical sample is particularly advantageous for downstream processing, such as nucleic acid sequencing.
In exemplary embodiments herein, systems and devices for sample analysis include systems and devices based on ETP design and manufacture suitable for large sample volume (e.g., up to 20mL) focusing. The system and device provide high recovery and concentration of DNA in an easily recoverable microliter volume collection cup for further use. For example, compared to existing solid phase DNA extraction methods, such ETP-based separations are simple and rapid, produce high concentration factors, and do not have extensive surface interactions. In some embodiments, small and short DNA fragments may be focused in one region in a non-sieving separation medium. In some embodiments, only selected sizes may be focused or separated from other sample components using a combination of sieving media and buffer compositions for focusing only a specific range of electrophoresis velocities. In general, electrical detection of a sample allows dye-free, label-free sample detection and does not require additional sample cleaning steps, such as the electrical detection described with respect to the devices, methods, and systems for sample analysis described herein.
Collecting and/or separating
The invention also relates to systems capable of separating two or more different samples or target analytes based on electrophoretic mobility. In some embodiments, many target analytes can be concentrated in the same focal region and can be collected together. In some embodiments, different analytes may be separated based on electrophoretic mobility and collected separately from the sample collection volume. In some embodiments, multiple target analytes may be focused in one region, while other substances may be focused in one or more regions different from the first region. For example, in one exemplary non-limiting embodiment, it is contemplated that between 1 and 500bp of DNA fragments may be focused in one region, between 500 and 3000bp of DNA fragments may be focused in another region, and larger DNA fragments (e.g., genomic DNA) may be focused in a third region. In some embodiments, the methods of the invention include accelerated electrophoresis followed by additional sample purification steps to separate the target analyte from other materials.
In some embodiments, the focal region can be very narrow (about 100 μm), and it can be advantageous to record the transition between LE and TE to indicate the location of the one or more target analytes. In some embodiments, the detection may indicate the location of one or more focal regions, respectively.
In some embodiments, the sample collection cup (or any other suitable container for sample collection, e.g., vial, tray, well, pipette, etc.) may be 5mL or more, 5mL or less, 1mL or less, 500 μ L or less, 200 μ L or less, 100 μ L or less, 50 μ L or less, 10 μ L or less, 5 μ L or less, or 1 μ L or less in volume. Preferably, the sample collection volume is selected to be small enough to allow for the desired increase in target analyte concentration. In some embodiments, the sample concentration may be increased by 2-fold or more, 5-fold or more, 10-fold or more, 15-fold or more, 20-fold or more, 25-fold or more, 30-fold or more, 35-fold or more, 40-fold or more, 45-fold or more, 50-fold or more, 100-fold or more, 150-fold or more, 200-fold or more, 500-fold or more, 1000-fold or more, 2000-fold or more, 2500-fold or more, 5000-fold or more, or 10,000-fold or more.
Feedback control of sample collection
Accelerated electrophoresis-based sample collection and/or purification can be performed according to the present methods, such as methods using the present systems and devices. In some embodiments, feedback control and process time settings (e.g., triggers) using sample detection as described herein can be used to control and/or automate accelerated electrophoresis processes. In some embodiments, a sensor (e.g., an electrical sensor) on the device can be used to detect the sample, such as based on electrical conductivity (or detection, e.g., fluorescence, UV, optical, thermal, electrical, etc.). In some embodiments, a conductivity change can be detected, which can be used to indicate a time setting to end an ETP run, for example, when a target analyte (e.g., nucleic acid) reaches a sample collection volume (or elution point or other fixed point). In some embodiments, other detection methods described herein, such as temperature or drive voltage, may also be used to determine the end of run-time settings or other triggers. For example, conductivity or optical or temperature or voltage sensors may be used to control the electric field applied to the channels within the device in order to automate the ETP process. For example, an electric field may be applied to the channel to initiate ETP sample analysis and/or purification. In some embodiments, sensory changes in the measured quantity may be used to trigger various events, such as the start of an ETP, the start of other sensing at one or more fixed locations, or the end of an ETP. In some embodiments, the measured property within the device may vary as the ETP focal region or regions containing one or more confined samples move. Changes indicative of the ETP region passing through a particular feature may be sensed by one or more sample detection instruments, and the feedback may be used to alter the electric field, for example, by reducing or terminating operation. In some embodiments, a change in conductivity may be detected as the ETP zone passes a conductivity sensor located at or near the elution cell, and feedback from this sensor may be used to control the electric field, such as by removing the electric field to end the ETP run. In some embodiments, when the ETP run is terminated, the target analyte or desired sample (e.g., nucleic acid) can be localized or separated in a collection volume or elution pool or region.
In some embodiments, the detection-based triggering of the end of an ETP run may also trigger other events, such as those that may help maintain an elution volume for pipetting. In some embodiments, the device may close or block multiple channels or features, which may fix the elution volume to maintain a constant volume of elution (e.g., by blocking or preventing flow into the LE or outlet wells during pipetting of the elution volume). Fixing the elution volume helps simplify use and helps report the concentration of the eluted sample material.
In some embodiments, the applied current may be stopped when the target ETP strip is in the elution position (e.g., sample collection volume, centerwell, LE electrolyte cell). The present disclosure provides techniques for assessing target ETP band position that can be used to trigger the end of a sample analysis run (e.g., a sample purification run). These techniques may include measurements of drive voltage, conductivity, and temperature, among other types of measurements.
In some embodiments, the system of the present invention is capable of (1) performing accelerated electrophoresis; (2) measuring by electrosection the transition between LE and TE near or within the sample volume; (3) based on the detection of the transition of step (2), the accelerated electrophoresis run is terminated and automated collection of sample volumes is initiated using an automated liquid handler.
In some embodiments, the system of the present invention is capable of (1) performing accelerated electrophoresis; (2) measuring one or more transitions between two or more ETP bands near or within the sample volume by electrosection; (3) based on the detection of one or more transitions of step (2), the accelerated electrophoresis run is terminated and automated collection of sample volumes is initiated using an automated liquid handler. The one or more transitions in step (2) may be the transitions between LE and target analyte, target analyte and TE, LE and TE.
Additional applications
Applications and/or uses of the invention disclosed herein may include, but are not limited to, the following: 1. relative or absolute gene expression levels were determined as indicated by mRNA, rRNA and tRNA. This includes natural, mutated and pathogenic nucleic acids and polynucleotides. 2. Determination of allele expression. 3. Haplotyping and phasing of multiple SNPs within a chromosome. Determination of the methylation status of DNA. Determination of mRNA alternative splicing and splice variant levels. Assay for RNA transport. Determination of protein-nucleic acid complexes in mRNA, rRNA and DNA. 8. The presence of microbial or viral content in food and environmental samples is determined by DNA, rRNA or mRNA. 9. Microbial or viral content in food and environmental samples is identified by DNA, rRNA or mRNA. 10. The pathology of plants, humans, microorganisms and animals is identified by DNA, rRNA or mRNA. 11. Nucleic acid determination in medical diagnostics. 12. Quantitative nuclear loss assay. 13. Gene rearrangements are determined at the DNA and RNA levels, including but not limited to those found in immune responses. 14. Determination of gene transfer in microorganisms, viruses and mitochondria. 15. And (4) gene evolution determination. 16. And (4) performing forensic determination.
Applications of the apparatus and method
In further exemplary embodiments, the apparatus and methods disclosed herein may be used for and/or with the following applications in accordance with the present disclosure.
In exemplary embodiments, the devices and methods described herein can be used in conjunction with IHC analysis of representative samples. For example, IHC analysis of representative samples from lymph node tissue (e.g., prepared from surgically resected lymph nodes) can detect very small tumor micrometastases by epithelial marker binding proliferation marker staining (e.g., cytokeratin 8/18 double IHC with Ki67), use of markers positive in the primary tumor, use of other markers of metastatic cells, or other diagnostic markers. The devices and methods described herein can be used to analyze pre-stained cells and/or can be used to selectively stain cells and/or can be used to isolate, focus, and collect desired cells, as identified by the presence of a desired marker/stain used in conjunction with IHC analysis techniques in some embodiments. In addition, metastatic tumor cells can also be detected at the nucleic acid, such as by using next generation sequencing maps to identify cancer-associated mutations, including mutations present in the primary tumor. As described herein, in exemplary embodiments, the devices and methods disclosed herein can be used to isolate, focus/concentrate, and collect such nucleic acids. Furthermore, in exemplary embodiments, DNA purified from representative samples from primary tumors and lymph nodes, as well as circulating tumor DNA from any distant metastatic cells, can be isolated, focused/concentrated, and/or collected.
Based on this, the representative samples obtained by the exemplary embodiments of the inventive methods and devices described herein may facilitate and substantially improve the accuracy of detecting, diagnosing, and/or staging different types of tumors (i.e., different solid tumors), regardless of tumor tissue type, location, size, or volume. Moreover, in some embodiments, the present methods and devices are potentially useful for generating representative samples from putative normal tissue samples or putative pre-cancerous tissues (e.g., obtained from subjects at higher risk of developing cancer due to genetic risk or past cancer) in order to identify rare cell types, such as cancer stem cell lines, that may be present therein even before any signs of the disease have been manifested.
In one aspect, the devices and methods described herein can provide methods and devices for producing a biological sample suitable for assessing heterogeneity of cells within a tumor or lymph node and/or assessing prognosis of a particular cancerous condition in a subject and/or determining an appropriate treatment regime for a subject having a cancerous condition, comprising (i) obtaining tissue (such as a tumor sample or lymph node) comprising spatially distinct regions of tissue or comprising the entire tumor or a major portion thereof, and (ii) preparing a sample for analysis, and (iii) analyzing cells comprising the sample using the devices and methods, e.g., isolating, focusing/concentrating and/or collecting desired cells.
In another aspect, the devices and methods described herein may provide devices and methods for generating a biological sample suitable for assessing heterogeneity of cells within a sample, such as a tumor sample or a lymph node, and/or assessing prognosis of a particular cancerous condition in a subject, comprising (i) obtaining one or more whole biopsy samples from a solid tumor or lymph node, preferably wherein each biopsy sample comprises at least about 100-200, 200-1000, 1000-5000, 10,000-100,000, 100,000-1,000,000 or more cells, (ii) preparing a sample for analysis, and (iii) analyzing cells comprising the sample using the devices and methods, e.g., isolating, focusing/concentrating and/or collecting desired cells.
In another aspect, the devices and methods described herein may provide devices and methods for generating a biological sample suitable for assessing whether a subject comprises a virulent form of a particular cancer and/or whether a subject having a cancer comprises a virulent form of the particular cancer, comprising (i) obtaining one or more whole biopsy samples from a solid tumor or lymph node, preferably wherein each biopsy sample comprises at least about 100-, and optionally isolating or detecting the expression of at least one biomarker. Up-regulation (such as increased expression) or down-regulation (such as decreased expression) of a biomarker is associated with a virulent form of a particular cancer.
In yet another aspect, the devices and methods described herein can provide for characterizing the landscape and/or detecting genetically distinct subclones within a heterogeneous tumor and/or identifying low-incidence events within a tumor and/or determining the prevalence of targets within a tumor, including (i) obtaining one or more tumor samples comprising spatially distinct regions of a tumor, (ii) preparing a sample for analysis, and (iii) analyzing cells comprising the sample using the devices and methods, for example, isolating, focusing/concentrating and/or collecting target analytes, e.g., desired cells, optionally creates a landscape representative of a heterogeneous tumor and is suitable for characterizing the landscape of the tumor and/or detecting genetically distinct subclones within a heterogeneous tumor and/or identifying low-incidence events within a tumor and/or determining the prevalence of targets within a tumor.
In yet another aspect, the devices and methods described herein can provide devices and methods for detecting a pre-cancerous cell or a cancerous cell in a putative normal tissue or a putative pre-cancerous tissue of a patient (e.g., a patient at risk for cancer due to a genetic mutation or a prior cancer), comprising (i) obtaining one or more samples of the putative normal tissue or the putative pre-cancerous tissue, these samples comprise spatially distinct regions of putative normal tissue or putative pre-cancerous tissue of the patient, (ii) preparing the samples for analysis, and (iii) analyzing cells comprising the sample using the device and method, e.g., isolating, focusing/concentrating and/or collecting desired cells, wherein the desired cell sample produced by the device and/or method is suitable for detecting rare cancer cells or cancer stem cells, e.g., even before the patient has developed any signs of disease.
In another aspect, the devices and methods described herein can provide devices and methods that use representative samples produced by any of the foregoing methods, and portions thereof, in different assay formats, wherein such assays can be performed simultaneously or at different times or different locations in high throughput, and/or by automation (fully or semi-automation).
In another aspect, a representative sample or portion thereof produced by any of the foregoing devices and methods is stored for future use, e.g., frozen.
In another aspect, the devices and methods described herein can be used to generate representative samples, wherein the representative samples or portions thereof can be used to derive antibodies or antigens specific for particular cancer cells or cell types in patient samples that can be used for personalized medicine, i.e., for the production of therapeutic or prophylactic cancer vaccines.
In exemplary embodiments, any of the devices and methods described herein can be used to detect expression of at least one biomarker, e.g., at least one lipid, protein, or nucleic acid biomarker, in a sample. Furthermore, in further embodiments, the devices and methods may further comprise detecting the percentage of tumor cells in a sample or portion or fraction thereof expressing a particular biomarker or combination of biomarkers. Optionally, in some embodiments, the relative frequency or percentage of tumor stem cells and/or tumor subclones in a sample or portion or fraction thereof can be detected and/or isolated. In addition, in further embodiments, the devices and methods described herein can also be used to detect genetic targets (such as point mutations, deletions, additions, translocations, genetic fusions, or gene amplifications).
In some embodiments, any of the above-described devices and methods described herein can also be used to detect, isolate, and/or quantify specific immune cells (such as B lymphocytes, T lymphocytes, macrophages, NK cells, monocytes, or a combination thereof).
Samples used in conjunction with the subject devices and methods are typically derived from one or more solid tumors. However, these devices and methods may also be applicable to non-solid tumors, such as blood cancers. In some embodiments, one or more samples of such tumors or other tissues used in the disclosed devices and methods may be derived, for example, from breast, colon, lung, pancreas, gall bladder, skin, bone, muscle, liver, kidney, cervix, ovary, prostate, esophagus, stomach, or other organs, such as breast, lung, liver, prostate, colon, bladder, or kidney cancer tumors. In some embodiments, the tumor sample used may be of human origin.
Furthermore, in some embodiments, any of the above devices and methods may further comprise purifying nucleic acids (such as DNA or mRNA) from the sample or a portion or fraction thereof. The purified nucleic acid may be subjected to northern blotting, DNA sequencing, PCR, RT-PCR, microarray profiling, differential display, or in situ hybridization. Moreover, the purified nucleic acid can be conjugated to nanoparticles (such as quantum dots, paramagnetic nanoparticles, superparamagnetic nanoparticles, and metal nanoparticles, preferably alloyed quantum dots, including, for example, but not limited to, CdSe, ZnSSe, ZnSeTe, ZnSTe, CdSeTe, ScSTe, HgSSe, HgSeTe, HgSTe, ZnCdS, ZnCdSe, ZnCdTe, ZnHgS, ZnHgSe, ZnHgTe, CdHgS, CdHgSe, CdHgTe, zncdcdsse, ZnHgSSe, zncdcdsete, ZnHgSeTe, cdhgssee, InGaAs, GaAlAs, and InGaN), to name a few.
It is also contemplated that any of the above-described devices and methods may further be used to purify lipids from a sample or portion or fraction thereof. The purified lipids may undergo mass spectrometry or histochemistry.
Furthermore, in some embodiments, it is also contemplated that any of the above devices and methods may further comprise purifying the protein from the sample or a portion or fraction thereof. The purified protein may be subjected to western blotting, ELISA, immunoprecipitation, chromatography, mass spectrometry, microarray spectroscopy, interferometry, electrophoretic staining, or immunohistochemical staining. Alternatively, or in addition to the above, the purified protein may be used to generate antisera specific for tumors.
Furthermore, it is contemplated that any of the above devices and methods can further comprise performing genomic, transcriptomic, proteomic, and/or metabolomic analysis on the sample or portion or fraction thereof.
Furthermore, it is contemplated that any of the above devices and methods may further comprise affinity purification of a particular cell type from the sample or a portion or fraction thereof. The particular cell type may comprise a biomarker of interest. Exemplary biomarkers of interest can include Her2, bRaf, ERBB2 amplification, Pl3KCA mutation, FGFR2 amplification, p53 mutation, BRCA mutation, CCND1 amplification, MAP2K4 mutation, ATR mutation, or any other biomarker whose expression is associated with a particular cancer; at least one of AFP, ALK, BCR-ABL, BRCA1/BRCA2, BRAF, V600E, Ca-125, CA19.9, EGFR, Her-2, KIT, PSA, S100, KRAS, ER/Pr, UGT1A1, CD30, CD20, F1P1L1-PDGRF α, PDGFR, TMPT, and TMPRSS 2; or at least one biomarker selected from: ABCB5, AFP-L3, alpha-fetoprotein, alpha-methylacetyl-CoA racemase, BRCA1, BRCA2, CA15-3, CA 242, Ca 27-29, CA-125, CA15-3, CA19-9, calcitonin, carcinoembryonic antigen peptide-1, des-gamma-carboxyprothrombin, early prostate cancer antigen-2, estrogen receptor, fibrin degradation products, glucose-6-phosphate isomerase, HPV antigens (such as vE6, E7, L1, L2, or p16INK4a), human chorionic gonadotropin, IL-6, keratin 19, lactate dehydrogenase, leucylaminopeptidase, lipotropin, norepinephrine, neprilysin, NMP22, norepinephrine, PCA3, prostate specific antigen, prostatic acid phosphatase, synaptophysin, thyroglobulin, TNF, a transcription factor selected from ERG, ETV1(ER81), FLI1, ETS1, ETS2, ELK1, ETV6(TEL1), ETV7(TEL2), GABP α, ELF1, ETV4(E1 AF; PEA3), ETV5(ERM), ERF, PEA3/E1AF, PU.1, ESE1/ESX, SAP1(ELK4), ETV3(METS), EWS/FLI1, ESE1, ESE2(ELF5), ESE3, PDEF, NET (ELK 3; SAP2), NERF (ELF2) or FEV. XXX, tumor associated glycoprotein 72, c-kit, SCF, pAKT, pc-kit and vimentin.
Alternatively or additionally, the biomarker of interest may be an immune checkpoint inhibitor, such as but not limited to CTLA-4, PDL1, PDL2, PD1, B7-H3, B7-H4, BTLA, HVEM, KIR, TIM3, GAL9, GITR, LAG3, VISTA, KIR, 2B4, TRPO2, CD160, CGEN-15049, CHK1, CHK2, A2aR, TL1A and B-7 family ligands or combinations thereof, or a ligand of a checkpoint protein selected from the group consisting of: CTLA-4, PDL1, PDL2, PD1, B7-H3, B7-H4, BTLA, HVEM, TIM3, GAL9, LAG3, VISTA, KIR, 2B4, CD160, CGEN-15049, CHK1, CHK2, A2aR, B-7 family ligands, or a combination thereof.
The devices and methods described herein may further be used to detect at least one biomarker associated with: acute lymphoblastic leukemia (etv6, am11, cyclophilin B), B-cell lymphoma (Ig-idiotype), glioma (E-cadherin, alpha-catenin, beta-catenin, gamma-catenin, p120 cm), bladder cancer (p21ras), biliary tract cancer (p21ras), breast cancer (MUC family, HER2/neu, C-erbB-2), cervical cancer (p53, p21ras), colon cancer (p21ras, HER2/neu, C-erbB-2, MUC family), colorectal cancer (colorectal-associated antigen (CRC) -C017-1A/GA733, APC), Choriocarcinoma (CEA), epithelial cell carcinoma (cyclophilin B), gastric cancer (HER2/neu, C-erbB-2, GA 733), hepatocellular carcinoma (alpha fetoprotein), Hodgkin lymphoma (Imp-1, alpha-catenin B), and gamma-catenin, EBNA-1), lung cancer (CEA, MAGE-3, NY-ESO-1), lymphoid cell-derived leukemia (cyclophilin b), melanoma (p5 protein, gp75, carcinoembryonic antigen, GM2 and GD2 gangliosides, Melan-A/MART-1, cdc27, MAGE-3, p21ras, gp100. sup.Pmell 117), myeloma (MUC family, p21ras), non-small cell lung cancer (HER2/neu, c-erbB-2), nasopharyngeal carcinoma (Imp-1, EBNA-1), ovarian cancer (MUC family, HER2/neu, c-erbB-2), prostate cancer (prostate specific antigen (PSA) and its epitope-1, PSA-2 and PSA-3, PSMA, HER2/neu, c-B-2, 733 glycoprotein), renal cancer (2/neu), HER-2-erb-2), and PSMA, Cervical and esophageal squamous cell carcinoma (viral products such as human papillomavirus protein), testicular cancer (NY-ESO-1), and/or T-cell leukemia (HTLV-1 epitope).
In some embodiments, the devices and methods described herein may further comprise the use of at least one detectable label selected from the group consisting of: fluorescent molecules or Fluorescent dyes (such as those sold by Invitrogen, see, for example, The Handbook-A Guide to Fluorescent Probes and laboratory Technologies, Invitrogen Detection Technologies, Molecular Probes, Eugene, Oreg, or as disclosed in U.S. Pat. No. 5,866,366 to Nazarenko et al), such as 4-acetamido-4 ' -isothiocyanatodistyrene-2, 2 ' disulfonic acid, acridine and derivatives such as acridine and isothiocyanate, 5- (2 ' -aminoethyl) aminonaphthalene-1-sulfonic acid (EDANS), 4-amino-N- [ 3-vinylsulfonyl) phenyl-sulfonyl]Naphthalimide-3, 5-disulfonate (fluorescein VS), N- (4-anilino-1-naphthyl) maleimide, aminoenrichide, brilliant yellow, coumarin and derivatives such as coumarin, 7-amino-4-methylcoumarin (AMC, coumarin 120), 7-amino-4-trifluoromethylcoumarin (coumarin 151); an anthocyanin; 4'6-diamidino-2-phenylindole (DAPI); 5', 5 "-dibromo pyrogallol-sulfonphthalein (bromopyrogallol red); 7-diethylamino-3- (4' -isothiocyanatophenyl) -4-methylcoumarin; diethylenetriaminepentaacetate; 4, 4 '-diisothiocyanato dihydro-stilbene-2, 2' -disulfonic acid; 4, 4 '-diisothiocyanatostilbene-2, 2' -disulfonic acid; 5- [ dimethylamino group ]Naphthalene-1-sulfonyl chloride (DNS, dansyl chloride); 4- (4' -dimethylaminophenylazo) benzoic acid (DABCYL); 4-dimethylaminophenylazophenyl-4' -isothiocyanate (DABITC); eosin and derivatives such as eosin and eosin isothiocyanate; erythrosine and derivatives such as erythrosine B and erythrosine isothiocyanate; b, ingot making; fluorescein and derivatives such as 5-carboxyfluorescein (FAM), 5- (4, 6-dichlorotriazin-2-yl) aminofluorescein (DTAF), 2 '7' -dimethoxy-4 '5' -dichloro-6-carboxyfluorescein (JOE), Fluorescein Isothiocyanate (FITC) and qfitc (xritc); 2 ', 7' -Difluorofluorescein (OREGON) ) (ii) a Fluorescamine; IR 144; IR 1446; malachite green isothiocyanate; 4-methylumbelliferone; o-cresolphthalein; nitrotyrosine; pararosaniline; phenol red; b-phycoerythrin; o-phthalaldehyde; pyrene and derivatives such as pyrene, pyrene butyrate and succinimidyl 1-pyrenebutyrate; reactive Red 4: (
 Brilliant red 3B-a); rhodamine and derivatives such as 6-carboxy-X-Rhodamine (ROX), 6-carboxyrhodamine (R6G), Lissamine rhodamine B sulfonyl chloride, rhodamine (Rhod), rhodamine B, rhodamine 123, rhodamine X isothiocyanate, rhodamine Green, sulforhodamine B, sulforhodamine 101 and sulfonyl chloride derivatives of sulforhodamine 101 (Texas Red); n, N' -tetramethyl-6-carboxyrhodamine (TAMRA); tetramethyl rhodamine; tetramethylrhodamine isothiocyanate (TRITC); riboflavin; rosolic acid and terbium chelate derivatives; thiol-reactive europium chelates having an emission wavelength of about 617nm (Heyduk and Heyduk, Analyt. biochem.248: 216-27, 1997; J.biol. chem.274: 3315-22, 1999) And GFP and LissamineTMDiethylaminocoumarin, chlorotriazinyl fluorescein, naphthyl fluorescein, 4, 7-dichlororhodamine, and xanthene (as described in U.S. patent No. 5,800,996 to Lee et al), and derivatives thereof. Other fluorophores known to those skilled in the art may also be used, such as those available from Invitrogen Detection Technologies, Molecular Probes (Eugene, Oreg.), and including ALEXA FLUORTMThe series of dyes (e.g., as described in U.S. Pat. Nos. 5,696,157, 6,130,101, and 6,716,979), the BODIPY series of dyes (dipyrromethene boron difluoride dyes, e.g., as described in U.S. Pat. Nos. 4,774,339, 5,187,288, 5,248,782, 5,274,113, 5,338,854, 5,451,663, and 5,433,896), waterfall blue (an amine-reactive derivative of sulfonated pyrene as described in U.S. Pat. No. 5,132,432), and sea blue (U.S. Pat. No. 5,830,912), fluorescent nanoparticles such as semiconductor nanocrystals, e.g., QUANTUM DOTTM (obtained, for example, from Quantum dot Corp, Invitrogen Nanocrytal Technologies, Eugene, Oreg., see also U.S. Pat. Nos. 6,815,064, 6,682,596, and 6,649,138). Semiconductor nanocrystals described, for example, in U.S. patent No. 6,602,671, Bruchez et al (1998) Science 281: 2013-6, Chan et al (1998) Science 281: 2016-8 and U.S. Pat. Nos. 6,274,323, 6,927,069, 6,914,256, 6,855,202, 6,709,929, 6,689,338, 6,500,622, 6,306,736, 6,225,198, 6,207,392, 6,114,038, 6,048,616, 5,990,479, 5,690,807, 5,571,018, 5,505,928, 5,262,357 and U.S. patent publication No. 2003/0165951 and PCT publication No. 99/26299 (published 5/27 of 1999); radioisotopes (such as 3H) (ii) a Metal chelates, e.g. radioactive or paramagnetic metal ions such as Gd3+DOTA and DPTA chelates of (a); and liposomes; enzymes, such as horseradish peroxidase, alkaline phosphatase, acid phosphatase, glucose oxidase, beta-galactosidase, beta-glucuronidase, or beta-lactamase, in combination with a chromophore, fluorescent, or luminescent compound that produces a detectable signal, such as those sold by Invitrogen Corporation, Eugene oreg). Specific examples of the color-developing compound include: diaminobenzidine (DAB), 4-nitrophenyl phosphate (pNPP), fast red, bromochloroIndole Phosphate (BCIP), Nitro Blue Tetrazolium (NBT), BCIP/NBT, fast Red, AP orange, AP blue, Tetramethylbenzidine (TMB), 2' -diaza-bis- [ 3-ethylbenzothiazoline sulfonate](ABTS), o-dianisidine, 4-chloronaphthol (4-CN), nitrophenyl-beta-D-galactopyranoside (ONPG), o-phenylenediamine (OPD), 5-bromo-4-chloro-3-indole-beta-galactoside (X-Gal), methylumbelliferone-beta-D-galactopyranoside (MU-Gal), p-nitrophenyl-alpha-D-galactopyranoside (PNP), 5-bromo-4-chloro-3-indole-beta-D-galactoside (X-Gluc), 3-amino-9-ethylcarbazole (AEC), carmine, Iodonitrotetrazole (INT), tetrazole blue, and tetrazole violet, and the like.
The present disclosure also generally includes compositions produced by any of the devices and methods described herein.
Furthermore, in some embodiments, the results obtained by using the aforementioned devices and methods (such as detection of rare genetic and/or epigenetic events, rare cells, etc.) or the compositions produced by any of the aforementioned devices and methods can be used in the selection of an appropriate treatment regimen for treating a subject. The treatment regimen may include any one of chemotherapy, immune modulator administration, radiation, cytokine administration, surgery, or a combination thereof. In addition, the disclosed devices and methods can be used to select at least one therapeutic agent (such as an antibody, nucleic acid, small molecule, or polypeptide that antagonizes, inhibits, or blocks the expression or functional activity of at least one detected biomarker) suitable for use in a subject whose tumor is the source of a representative sample analyzed by the devices and/or methods.
Furthermore, samples analyzed by the devices and/or methods, e.g., target nucleic acids obtained using the devices and/or methods, may be suitable for additional diagnostic tests, such as whole genome sequencing, which may be important for future pharmacological and diagnostic findings as well as personalized medicine. The analyzed samples can be used in a variety of diagnostic protocols in order to identify rare tumor subclones and thereby improve clinical diagnosis and personalized cancer treatment. Furthermore, the resulting analyzed samples can be used to derive antibodies or antigens that can be used in the development of therapeutic or prophylactic tumor vaccines.
The detection procedures used in conjunction with the devices and methods for sample analysis described herein may also include cytochemical staining procedures that exhibit chromogenic or fluorescent staining of cells or cellular compartments. Such staining procedures are known to those skilled in the art and may for example include staining of subcellular regions (e.g., nucleus, mitochondria, golgi, cytoplasm, etc.), eosinophilic or basophilic structures of specific molecules (chromosomes, lipids, glycoproteins, polysaccharides, etc.) in cytological specimens. Fluorescent dyes such as DAPI, quinacrine (Quinacrin), chromomycin, and the like may be employed. In addition, chromogenic dyes such as Azan, acridine orange, hematoxylin, eosin, sudan red, thiazine dyes (toluidine blue, thionine) may be used. In other embodiments, staining procedures such as papanicolaou staining, giemsa staining, hematoxylin-eosin staining, van-Gieson staining, schiff staining (using schiff's reagent), staining procedures using metal precipitation (e.g., precipitation of silver in staining procedures with nitrate), or insoluble staining such as turnbull's blue (or other insoluble metal cyanide), and the like, may be used. It must be understood that the specified dyes and staining methods should be examples of suitable methods, and that any other method known in the art may be used in conjunction with the devices and methods for sample analysis described herein.
The staining procedure may result in a chromogenic stain for light microscopy or a fluorescent stain for examination under fluorescent microscopy. In another embodiment, a radiation emission procedure, i.e. a procedure for imaging a cytological condition in a sample with a substance impairing radiation or other contrast agent transport (e.g. generating an optical impression by means such as (micro) autoradiography or (micro) radiograph generation) may be used in conjunction with the apparatus and method for sample analysis described herein.
Any staining and imaging procedure may be used not only for analysis in microscopic procedures, but also for analysis in automated analysis procedures, such as flow cytometry, automated microscopic (computerized or computer-aided) analysis, or any other method for analyzing stained cytological specimens. "automated" or "automatic" refers to activities that are substantially computer or machine driven and that are substantially free of human intervention.
Furthermore, the present disclosure relates generally to devices and methods that include ETP-based isolation/purification of one or more target analytes (e.g., one or more target nucleic acids, which may include cell-free nucleic acids (cfNA), such as cfDNA) by: providing means for implementing ETP; providing a sample comprising the one or more cell-free nucleic acids; performing one or more ETP runs by implementing ETP using the apparatus, wherein the ETP runs focus the one or more cfnas into one or more focal zones, e.g., as one or more ETP bands; and collecting the one or more cfnas, thereby obtaining one or more isolated/purified cfnas. In some cases, cfNA, e.g., cfDNA, can be isolated/purified from a plasma sample by using the ETP-based devices and methods described herein. In some cases, the plasma sample may be digested with proteinase K prior to ETP-based isolation/purification of one or more target analytes, such as one or more cfnas. In some cases, ETP-based isolation/purification of one or more cfnas (e.g., one or more cfdnas) can include using a LE comprising 100mM HCl-histidine pH6.25 and/or a TE comprising 100mM tptsas-Tris pH 8.30. In some cases, cfnas to be isolated/purified by ETP-based devices and methods can be about 1000bp or longer, 1000bp or shorter, 900bp or shorter, 800bp or shorter, 700bp or shorter, 600bp or shorter, 500bp or shorter, 400bp or shorter, 300bp or shorter, 250bp or shorter, 200bp or shorter, 150bp or shorter in length. In some embodiments, after ETP-based isolation/purification, one or more cfnas, e.g., cfDNA and/or cfRNA, can be collected as an isolated/purified sample of the one or more cfnas, and the isolated/purified sample can be further subjected to any one or more of the analytical techniques described herein, e.g., sequencing, such as those described in the section entitled "other methods used in connection with the devices and methods described herein. In some cases, after ETP-based isolation/purification, one or more target analytes, e.g., one or more target nucleic acids, such as one or more cfdnas, can be collected and can further undergo one or more bead-based cleaning steps, e.g., a post-collection KAPA pure bead-based cleaning step. In some cases, an intercalating dye (e.g., a SYBR gold dye) can be used to aid in visualization of DNA during ETP-based isolation/purification of one or more target nucleic acids (e.g., one or more cfdnas). In some cases, an intercalating dye may not be used to aid visualization of one or more target nucleic acids, such as one or more cfdnas, during ETP-based isolation/purification of the one or more target nucleic acids. In some cases, ETP-based isolation/purification of one or more cfnas (e.g., one or more cfdnas) of a plasma sample derived from a pregnant mother may be to isolate/purify the one or more cfnas present in the original plasma sample from genomic DNA and fragments thereof. In some cases, ETP-based isolation/purification of one or more cfnas can yield 1.25-fold or more, 1.5-fold or more, 1.75-fold or more, 2.0-fold or more, 2.25-fold or more, 2.5-fold or more, 2.75-fold or more, 3-fold or more, 4-fold or more, 5-fold or more, 10-fold or more, 100-fold or more, or 1000-fold or more of one or more cfnas as compared to methods practiced without ETP-based isolation/purification. In some cases, ETP-based isolation/purification of a target analyte (e.g., cfNA, e.g., cfDNA) from a sample can be such that about 1% or less, 1% or more, 5% or more, 10% or more, 20% or more, 30% or more, 40% or more, 50% or more, 60% or more, 70% or more, 80% or more, 90% or more, 95% or more, 99% or more, or 100% of the target analyte (e.g., cfNA) present in the original sample is isolated/purified and, optionally, collected. In some cases, ETP-based isolation/purification of one or more target analytes (e.g., one or more cfnas, e.g., one or more cfdnas) can result in about 1.0ng or less, 1.0ng or more, 2.0ng or more, 3.0ng or more, 4.0ng or more, 5.0ng or more, 5.5ng or more, 6.0ng or more, 6.5ng or more, 6.8ng or more, 10ng or more, 50ng or more, or 100ng or more of the one or more target analytes (e.g., one or more cfnas, e.g., one or more cfdnas), wherein the isolated/purified target analytes are optionally collected. In some embodiments, an ETP-based method of isolating/purifying a target analyte from a sample can produce a target analyte of 1% or less, 1% or more, 5% or more, 10% or more, 15% or more, 20% or more, 25% or more, 30% or more, 35% or more, 40% or more, 45% or more, 50% or more, 55% or more, 60% or more, 65% or more, 70% or more, 85% or more, 90% or more, 95% or more, or 99% or more purity, e.g., as measured by analytical techniques, to determine the composition of an ETP-isolated/purified sample comprising one or more target analytes. In some embodiments, one or more ETP-based separations/purifications may be performed to isolate/purify one or more target analytes. For example, in some cases, ETP-based separation/purification can be performed on a sample containing one or more target analytes to focus the one or more target analytes into a focal zone (ETP zone), which substantially separates the one or more target analytes from other materials contained in the original sample. The sample may be collected after ETP separation/purification, and the separated/collected sample may be further subjected to another ETP-based separation/purification. Optionally, a second ETP-based separation-purification can be conducted under conditions such that in the case of more than one target analyte, each of the one or more target analytes is separated into separate focal zones, each of which can optionally be collected separately, thereby separating the target analytes from each other (if desired).
In some embodiments, cfNA, e.g., cfDNA, isolated/purified by ETP-based methods and apparatus can further undergo an assay system that utilizes non-polymorphism and polymorphism detection to determine source contribution and Copy Number Variation (CNV) from a single source in a mixed sample, such as described in U.S. patent application publication No. 2012/0034685, which is incorporated herein by reference in its entirety. Determining the contribution of the major and/or minor sources in a sample may provide information on whether there is sufficient genetic material from both sources to allow sufficient identification of genomic regions to determine CNV in a mixed sample. In addition, an assay system can utilize amplification and detection of selected loci in a mixed sample from an individual to calculate source contributions and identify copy number of one or more genomic regions, and such an assay system has the ability to determine nucleic acid contributions from primary and/or secondary sources in the mixed sample, as well as the presence or absence of CNV at one or more genomic regions from a single source in the mixed sample. Such an assay system can specifically detect the copy number of genomic regions present in two or more sources in a mixed sample. To determine the contribution, a selected locus from one source can be distinguished from a selected locus from at least one other source in a mixed sample. To determine copy number variation of a genomic region, source contributions of selected loci may, but need not, be distinguished, as copy number variation can be detected by comparing the levels of two or more genomic regions in a mixed sample. In some cases, such an assay system, when used with cfNA (e.g., cfDNA and/or cfRNA) isolated/purified by ETP-based devices and methods, can provide: 1) determining contributions of primary and/or secondary sources in the mixed sample using frequency data from the two or more informative loci; 2) determining the frequency of one or more genomic regions in the primary and secondary sources; and 3) identifying the presence or absence of chromosomal abnormalities in the major and/or minor sources in the mixed sample. Furthermore, such an assay system can be used with cfNA isolated/purified by ETP-based methods and devices to identify fetal contribution percentage and chromosomal abnormalities in maternal samples. The assay system may comprise the steps of: performing ETP-based isolation/purification of cfNA on a maternal sample, such as a maternal blood and/or plasma sample, to obtain an isolated/purified maternal sample; introducing a first set of fixed sequence oligonucleotides into the isolated and collected sample under conditions that allow the fixed oligonucleotides to specifically hybridize to complementary regions at two or more loci corresponding to the first chromosome; introducing a second set of fixed sequence oligonucleotides into the isolated and collected sample under conditions that allow the fixed oligonucleotides to specifically hybridize to complementary regions at two or more loci corresponding to a second chromosome; introducing a third set of fixed sequence oligonucleotides into the isolated/purified sample under conditions that allow the fixed oligonucleotides to specifically hybridize to complementary regions on two or more informative loci; ligating the hybridized oligonucleotides to produce contiguous ligation products complementary to the nucleic acids; amplifying the contiguous ligation products to produce amplification products; and detecting the amplification product. Detection of the amplification products can be used to calculate fetal contribution in maternal samples and to identify chromosomal abnormalities in fetal nucleic acids.
Furthermore, the present disclosure relates generally to isolating/purifying one or more cfnas, e.g., one or more cfdnas and/or one or more cfrnas, by ETP-based devices and methods, wherein the isolated/purified one or more cfnas are further analyzed to detect fetal aneuploidy. For example, such assays for detecting fetal aneuploidy are generally described in U.S. patent application publication No. 2012/0034685, which is incorporated herein by reference in its entirety, and specifically in example 7. For example, one or more cfnas, e.g., one or more cfdnas, can be isolated/purified by using the ETP-based devices and methods described herein, and the isolated/purified one or more cfnas from a maternal sample can be used as a template for hybridizing, ligating, and amplifying multiple selected loci from both chromosome 21 and chromosome 18 in each maternal sample. Examples containing cfDNA are now described. Three oligonucleotides can be hybridized to each selected locus to generate ligation products for amplification and detection. The left (or first) fixed sequence oligonucleotide may comprise a region complementary to the selected locus and a first universal primer region. The right (or second) fixed sequence oligonucleotide may comprise a second region complementary to the selected locus and a second universal primer region. Bridging oligonucleotides for use in assays, for example, can be designed such that they each hybridize to a bridging region of two or more selected loci for use in an aneuploidy detection assay. When the fixed sequence oligonucleotide and the bridging oligonucleotide hybridize to complementary regions on the cfDNA, their ends may form two nicks. After ligating the hybridized oligonucleotides to the cfDNA, ligation products can be generated for each selected locus, including templates that can be used as a set of amplification primers. The ligation product can then be amplified using two amplification primers that comprise regions complementary to the first and second universal primer regions, respectively. The amplification product may comprise the sequence of the selected locus. The right amplification primer may also contain a sample index to identify the particular sample from which the locus was obtained in the multiplex assay. For example, amplification using 96 different right amplification primers can pool and sequence 96 different amplification products simultaneously on a single lane. This amplification may occur in 96-well plates. For example, amplification products from individual 96-well plates can be pooled in equal volumes, and pooled amplification products can be purified using SPRI beads (Beckman-Coulter, Danvers, Mass.) and/or KAPA pure beads according to the manufacturer's instructions. Each purified pooled library can then be used as a template for cluster amplification on the NGS platform, according to the manufacturer's protocol. A scale metric for each target chromosome can then be calculated using known methods, such as those described in U.S. patent application publication No. 2012/0034685.
In addition to detecting aneuploidy, specific polymorphisms can also be used to determine the percent contribution of a fetus to a maternal sample, where cfNA (e.g., cfDNA) isolated/purified by the ETP-based apparatus and methods described herein is used for such determination. A general method for determining these fetal contribution percentages is described in U.S. serial No. 61/509,188 filed 2011 on 7/19, which is incorporated by reference in its entirety. In short, sequencing certain loci with detectable polymorphisms can identify those loci as informative loci. The count of identified loci that have fetal polymorphic regions different from the maternal polymorphic region can then be used to calculate an approximate fetal contribution of the maternal sample. Each locus used to calculate the percent contribution of the fetus to the maternal sample may have a minimum of about 256 counts. Exemplary SNP data sets for this calculation are illustrated below in tables 2 and 3 in example 7 of U.S. patent application publication No. 2012/0034685. Data corresponding to the informative loci identified from these sets can then be used to calculate the percentage contribution. The informative loci are shown in bold in each of tables 2 and 3 of example 7 of U.S. patent application publication No. 2012/0034685.
Furthermore, the use of cfnas (e.g., cfDNA) isolated/purified by the ETP-based methods and devices discussed herein can be further subjected to CNV analysis, such as the above-described analysis, which can allow identification of CNVs and infection sources for mixed samples. This is particularly helpful for monitoring patients whose clinical outcome may be compromised by the presence of the source of the infection. For example, patients who have undergone transplant surgery may be taking immunosuppressant drugs and are therefore generally more susceptible to infection. Also, the immune system of pregnant women changes and thus may be more susceptible to pathogens, which may adversely affect the mother and/or fetus. In addition, certain types of cancer are associated with a source of infection (e.g., liver cancer associated with hepatitis b and c infections, cervical cancer associated with human papillomavirus infections), and identification of the source of infection may be helpful in predicting clinical outcome or in determining a patient's preferred medical course. Thus, in certain aspects, an assay system for calculating source contribution, detecting the presence or absence of CNV of a genomic region, and detecting the presence or absence of an infectious source in a mixed sample using a single assay may comprise the steps of: providing a target nucleic acid isolated/purified by an ETP-based device and/or method, e.g., ETP is performed using an ETP-based device to focus the target nucleic acid into a focal region, and optionally subsequently collecting the focal region; introducing a first set of fixed sequence oligonucleotides into the mixed sample under conditions that allow the fixed oligonucleotides to specifically hybridize to complementary regions in the genomic region or at one or more loci associated with the genomic region; introducing a second set of fixed sequence oligonucleotides into the mixed sample under conditions that allow the fixed oligonucleotides to specifically hybridize to complementary regions on at least one information locus; introducing a third set of fixed sequence oligonucleotides into the mixed sample under conditions that allow the fixed sequence oligonucleotides to specifically hybridize to complementary regions on the locus indicative of the source of infection; ligating the hybridized oligonucleotides to produce contiguous ligation products complementary to the locus; amplifying the contiguous ligation products to produce amplification products; and detecting the amplification product. Detection of the amplification product is correlated with the copy number and presence or absence of the source of infection of the genomic region in the mixed sample.
Furthermore, isolated/purified cfNA, e.g., cfDNA, by ETP-based devices and methods (such as those described herein) can further undergo quantitative and qualitative detection of tumor-specific changes in cfNA (such as cfDNA strand integrity, frequency mutations, microsatellite abnormalities, and methylation of genes), as a diagnostic, prognostic, and monitoring marker for cancer patients, and optionally in conjunction with CNV detection to provide a method for aiding clinical diagnosis, treatment, outcome prediction, and progress monitoring in patients with or suspected of having malignant tumors. For further discussion, see U.S. patent application publication No. 2012/0034685.
In addition, cfNA (e.g., cfDNA) isolated/purified by ETP-based devices and methods, such as those described herein, can be further subjected to an assay system that can be used to monitor organ health of transplanted patients using a combination of cfDNA detection and SNP detection or mutations in one or more single genes (for further discussion, see U.S. patent application publication No. 2012/0034685). The genome of the transplanted organ is different from the genome of the recipient patient, and such an assay system can be used to detect organ health. For example, acute cell rejection in heart transplant recipients has been shown to be associated with a significant increase in the level of cell-free DNA from the donor genome.
In some cases, a target analyte, e.g., cfNA, isolated and collected by ETP-based devices and methods can be subjected to any one or more of the methods and/or assays of U.S. patent application publication No. 2012/0034685, e.g., those methods and assays described in the sections entitled "assay methods", "detecting copy number variation", "polymorphisms associated with disease or predisposition", "selected amplification", "universal amplification", "minimization of variation within and between samples", "detection of mixed samples from cancer patients using an assay system", "detection of mixed samples from transplant patients using an assay system", "detection of maternal samples using an assay system", and "determination of the amount of DNA of secondary origin in mixed samples", in addition to the methods and assays described above.
Furthermore, the present disclosure relates generally to an assay for detecting the contribution of origin of fetal origin and the presence or absence of fetal Copy Number Variation (CNV) in one or more genomic regions in a maternal sample comprising fetal and maternal cell-free DNA, the assay comprising the steps of: a. isolating/purifying cfNA, e.g., cfDNA, from a maternal sample using one or more ETP-based devices and/or one or more ETP-based methods, such as those described herein, to obtain an isolated/purified maternal sample; b. hybridizing (i) a first set of two or more fixed sequence oligonucleotides to (ii) cell-free DNA in the isolated/purified maternal sample, wherein the first set of fixed sequence oligonucleotides comprises first and second fixed sequence oligonucleotides that are complementary to a contiguous region within each of at least 48 and less than 2000 loci in the first genomic region, wherein at least one of the first set of fixed sequence oligonucleotides comprises a universal primer region and the melting temperature (Tm) of the first fixed sequence oligonucleotides in the first set of fixed sequence oligonucleotides varies within a range of two degrees celsius; c. hybridizing (i) a second set of two or more fixed sequence oligonucleotides to (ii) cell-free DNA in the isolated/purified maternal sample, wherein the second set of fixed sequence oligonucleotides comprises first and second fixed sequence oligonucleotides that are complementary to a contiguous region within each of at least 48 and less than 2000 loci in a second genomic region, wherein at least one of the second set of fixed sequence oligonucleotides comprises a universal primer region and the Tm of the first fixed sequence oligonucleotide in the second set of fixed sequence oligonucleotides ranges from two degrees celsius; d. hybridizing (i) a third set of at least two fixed sequence oligonucleotides to (ii) cell-free DNA in the isolated/purified maternal sample, wherein the third set of at least two fixed sequence oligonucleotides is complementary to contiguous, polymorphic regions of two or more polymorphic information loci; e. ligating the hybridized first set of fixed sequence oligonucleotides to generate contiguous ligation products complementary to the first genomic region, ligating the hybridized second set of fixed sequence oligonucleotides to generate contiguous ligation products complementary to the second genomic region, and ligating the hybridized third set of fixed sequence oligonucleotides to generate contiguous ligation products complementary to the polymorphic information locus; f. amplifying the contiguous ligation products using the universal primer region to generate amplification products; g. detecting amplification products by averaging at least 100 measurements of each locus from the first genomic region and the second genomic region using high throughput sequencing; determining the relative frequency of the measured loci from the first and second genomic regions, wherein the relative frequency of the measured loci from the first genomic region is different from the relative frequency of the measured loci from the second genomic region, indicating the presence of fetal copy number variation, the determining being independent of detection of polymorphisms within the first and second genomic regions, and the proportion of sequence reads at the polymorphic information loci that originate from fetal origin and maternal origin is indicative of an origin contribution, wherein the origin contribution from fetal origin is at least 5% and less than 25%. Furthermore, the present disclosure generally encompasses an assay for detecting the contribution of origin of a fetal source and the presence or absence of a fetal aneuploidy in a maternal sample comprising fetal and maternal cell-free DNA using a single assay, the assay comprising the steps of: a. isolating/purifying cfNA, e.g., cfDNA, from a maternal sample using one or more ETP-based devices and/or one or more ETP-based methods as described herein to obtain an isolated/purified maternal sample; b. hybridizing (i) a first set of two or more fixed sequence oligonucleotides to (ii) cell-free DNA in the isolated/purified maternal sample, wherein the first set of fixed sequence oligonucleotides comprises first and second fixed sequence oligonucleotides that are complementary to a contiguous region within each of at least 48 and less than 2000 loci corresponding to the first chromosome, and the melting temperature (Tm) of the first fixed sequence oligonucleotides in the first set of fixed sequence oligonucleotides ranges from two degrees celsius; c. hybridizing (i) a second set of two or more fixed sequence oligonucleotides to (ii) cell-free DNA in the isolated/purified maternal sample, wherein the second set of fixed sequence oligonucleotides comprises first and second fixed sequence oligonucleotides that are complementary to a contiguous region within each of at least 48 and less than 2000 loci corresponding to the second chromosome, and the Tm of the first fixed sequence oligonucleotide in the second set of fixed sequence oligonucleotides ranges from two degrees celsius; d. hybridizing (i) a third set of at least two fixed sequence oligonucleotides to (ii) cell-free DNA in the isolated/purified maternal sample, wherein the third set of at least two fixed sequence oligonucleotides is complementary to contiguous, polymorphic regions of two or more polymorphic information loci; e. ligating the hybridized first set of fixed sequence oligonucleotides to generate contiguous ligation products complementary to a locus on the first chromosome, ligating the hybridized second set of fixed sequence oligonucleotides to generate contiguous ligation products complementary to a locus on the second chromosome, and ligating the hybridized third set of fixed sequence oligonucleotides to generate contiguous ligation products complementary to a polymorphic information locus; f. amplifying the consecutive ligation products to generate amplification products; g. detecting amplification products by measuring each locus on the first chromosome, each locus on the second chromosome, and each informative locus on an average of at least 100 times using high throughput sequencing; determining the relative frequency of the measured loci from the first and second genomic regions, wherein the relative frequency of the measured loci from the first genomic region is different from the relative frequency of the measured loci from the second genomic region, indicating the presence of fetal copy number variation, the determining being independent of detection of polymorphisms within the first and second genomic regions, and the proportion of sequence reads at the polymorphic information loci that originate from fetal origin and maternal origin is indicative of an origin contribution, wherein the origin contribution from fetal origin is at least 5% and less than 25%. Furthermore, the present disclosure generally encompasses an assay for detecting the contribution of origin of fetal origin and the presence or absence of fetal CNV in one or more genomic regions within a maternal sample comprising fetal and maternal cell-free DNA, the assay comprising the steps of: a. isolating/purifying cfNA, e.g., cfDNA, from a maternal sample using one or more ETP-based devices and/or one or more ETP-based methods, such as those described herein, to obtain an isolated and/or purified maternal sample; b. hybridizing (i) a first set of two or more fixed sequence oligonucleotides to (ii) cell-free DNA in the isolated/purified maternal sample, wherein the first set of fixed sequence oligonucleotides comprises first and second fixed sequence oligonucleotides that are complementary to regions of twenty-four or more loci in the first genomic region, and the melting temperature (Tm) of the first fixed sequence oligonucleotides in the first set of fixed sequence oligonucleotides ranges from two degrees celsius; c. hybridizing (i) a second set of two or more fixed sequence oligonucleotides to (ii) cell-free DNA in the isolated/purified maternal sample, wherein the second set of fixed sequence oligonucleotides comprises first and second fixed sequence oligonucleotides that are complementary to regions of twenty-four or more loci in the second genomic region, and the Tm of the first fixed sequence oligonucleotides in the second set of fixed sequence oligonucleotides ranges from two degrees celsius; d. hybridizing (i) a third set of at least two fixed sequence oligonucleotides to (ii) cell-free DNA in the isolated/purified maternal sample, wherein the third set of at least two fixed sequence oligonucleotides is complementary to contiguous, polymorphic regions of two or more polymorphic information loci; e. hybridizing (i) bridging oligonucleotides to (ii) cell-free DNA in the isolated/purified maternal sample, wherein the bridging oligonucleotides are complementary to regions in the loci between the regions complementary to the first, second and third sets of fixed sequence oligonucleotides; f. ligating the first set of fixed sequence oligonucleotides to the bridging oligonucleotides to generate contiguous ligation products complementary to loci in the first genomic region, ligating the second set of fixed sequence oligonucleotides to the bridging oligonucleotides to generate contiguous ligation products complementary to loci associated with the second genomic region, and ligating the hybridized third set of fixed sequence oligonucleotides to generate contiguous ligation products complementary to polymorphic information loci; g. amplifying the consecutive ligation products to generate amplification products; h. detecting amplification products by measuring each locus in the first genomic region and each locus in the second genomic region an average of at least 100 times using high throughput sequencing; determining the relative frequency of the measured loci from the first and second genomic regions, wherein the relative frequency of the measured loci from the first genomic region is different from the relative frequency of the measured loci from the second genomic region, indicating the presence of fetal copy number variation, the determining being independent of detection of polymorphisms within the first and second genomic regions, and the proportion of sequence reads at the polymorphic information loci that originate from fetal origin and maternal origin is indicative of an origin contribution, wherein the origin contribution from fetal origin is at least 5% and less than 25%.
In addition, one or more target analytes, e.g., one or more target nucleic acids, e.g., (cf) DNA and/or (cf) RNA, can be isolated/purified by ETP-based devices and/or methods, such as those described herein, and can further be subjected to methods for detecting genetic features in a sample, including Copy Number Variations (CNVs), insertions, deletions, translocations, polymorphisms, and mutations, such as those described in U.S. patent No. 9,567,639, which is incorporated by reference herein in its entirety. For example, such a method may employ the following techniques: the loci from two or more target genomic regions are interrogated using at least two fixed sequence oligonucleotides for each interrogated locus, and the fixed sequence oligonucleotides are linked, directly or indirectly, by ligation. The ligation products from different loci in the selected genomic region comprise a nucleic acid capture region designed to include a region complementary to one or more capture probes on the solid support. The capture region comprises one or more detectable tags that identify the ligation product as originating from a particular target genomic region. Ligation products from different target genomic regions can be identified by binding the capture regions of the ligation products to complementary capture probes on the solid support. In some cases, such methods may be used to detect fetal aneuploidy, for example, assay methods for providing a statistical likelihood of fetal aneuploidy include: performing an ETP-based isolation/purification on a maternal sample to isolate/purify maternal and fetal cell-free DNA, thereby obtaining an isolated/purified maternal sample, followed by interrogating one or more loci from a first target genomic region using a sequence-specific oligonucleotide comprising a capture region, interrogating one or more loci from a second target genomic region using a sequence-specific oligonucleotide comprising a capture region, detecting isolated selected loci from the first and second target genomic regions by hybridization to an array, quantifying the total count of the isolated loci to determine the relative frequency of the first and second target genomic regions, interrogating selected polymorphic loci from at least one target genomic region different from the first and second target genomic regions using a sequence-specific oligonucleotide, detecting the isolated selected polymorphic loci, quantifying the total count of the isolated selected polymorphic loci to calculate a percentage of fetal cell-free DNA in the isolated/purified maternal sample, calculating a statistical likelihood of a fetal aneuploidy in the isolated/purified maternal sample, wherein the relative frequency of loci from the first target genomic region, the relative frequency of loci from the second target genomic region, and the quantified count from the isolated selected polymorphic loci provide the statistical likelihood of the presence of a fetal aneuploidy. In some cases, such methods for detecting fetal aneuploidy can provide for identifying low frequency alleles from isolated selected polymorphic loci, wherein maternal DNA is homozygous and non-maternal DNA is heterozygous; calculating a sum of low frequency alleles from the isolated selected polymorphic loci; and calculating a statistical likelihood of fetal aneuploidy in the isolated and collected maternal sample using a sum of low frequency alleles from the isolated selected polymorphic loci to calculate a statistically significant difference in frequency of the target genomic region for the first and second target genomic regions, and wherein the statistically significant difference in chromosome frequency provides a statistical likelihood of the presence of fetal aneuploidy. In some cases of methods for detecting fetal aneuploidy using samples subjected to ETP-based separation/purification, a "threshold" level may be used to determine the presence or absence of fetal aneuploidy based on the observed deviation in the relative frequencies of the first and second chromosomes in the mixed sample. The threshold may be determined, for example, using techniques such as those disclosed in the following documents: U.S. published application nos. 2012/0149583, 2013/0324420, 2013/0029852; and U.S. patent No. 8,532,936, each of which is incorporated by reference herein in its entirety. In certain aspects, a threshold level determined from a representative sample population is used to determine deviation from expected counts, and preferably, the representative population includes samples from patients with similar characteristics, such as past risk profile, maternal age, and/or gestational age. In some cases, the target analyte isolated/purified by ETP-based devices and methods may be subjected to any one or more of the methods and/or assays of U.S. patent No. 9,567,639, for example, in addition to the methods and assays described above, those described in the sections entitled "detecting copy number variation", "tandem junction assay", "detecting polymorphisms", "additional examples", "universal amplification", "estimating the proportion of fetal DNA in a maternal sample", "data analysis", and "computer implementation of the process of the invention".
Furthermore, the present disclosure relates generally to an assay method for providing a statistical likelihood of fetal copy number variation, comprising: providing a maternal plasma or serum sample comprising maternal and fetal cell-free DNA; isolating/purifying the cell-free DNA by using one or more ETP-based devices and/or methods as described herein; interrogating at least 48 non-polymorphic loci from the first target genomic region by hybridizing sets of at least two fixed sequence oligonucleotides comprising a region complementary to a locus in the first target genomic region, wherein one of the fixed sequence oligonucleotides of each set comprises a first capture region, a first tag binding region and two restriction sites; interrogating at least 48 non-polymorphic loci from a second target genomic region by hybridizing sets of at least two fixed sequence oligonucleotides comprising a region complementary to a locus in the second target genomic region, wherein one of the fixed sequence oligonucleotides of each set comprises a first capture region, a second tag binding region and two restriction sites; ligating the hybridized fixed sequence oligonucleotides; amplifying the ligated fixed sequence oligonucleotides to generate amplicons; cleaving the amplicons at the restriction sites to generate cleaved amplicons, wherein each cleaved amplicon comprises a first capture region and a first or second tag binding region; detecting the cleaved amplicons from the first and second target genomic regions by hybridizing a first capture region of the cleaved amplicons to an array comprising capture probes complementary to the first capture region, wherein the cleaved amplicons from the first and second target genomic regions competitively hybridize to the capture probes complementary to the first capture region; quantifying the capture region of the cleaved amplicon by detecting the first and second tag binding regions to determine the relative frequency of the interrogated non-polymorphic loci from the first and second target genomic regions; estimating a relative frequency of the first and second target genomic regions based on the determined relative frequencies of the first and second tag binding regions; for each polymorphic locus, interrogating at least 48 polymorphic loci from at least one target genomic region different from the first and second target genomic regions by hybridizing sets of at least three fixed sequence allele-specific oligonucleotides, wherein two of the at least three allele-specific oligonucleotides of each set comprise a sequence complementary to one allele at the polymorphic locus, a capture region specific for each polymorphic locus, a different tag binding region for each allele at the polymorphic locus, and two restriction sites; ligating the hybridized fixed sequence allele-specific oligonucleotides; amplifying the ligated fixed sequence allele-specific oligonucleotides to generate allele-specific amplicons; cleaving the allele-specific amplicons at the restriction sites to generate cleaved allele-specific amplicons, wherein each cleaved allele-specific amplicon comprises a polymorphic locus-specific capture region and an allele-specific tag binding region; detecting a cleaved allele-specific amplicon from the polymorphic locus by competitively hybridizing a polymorphic locus-specific capture region of the cleaved allele-specific amplicon to a capture region on the array; quantifying the alleles of the polymorphic loci by detecting allele-specific tag binding regions for each allele on the cleaved allele-specific amplicons to determine the fraction of fetal DNA in the sample; determining a fraction of fetal DNA; and calculating a statistical likelihood of fetal copy number variation in the maternal sample using the estimated relative frequencies of the first and second target genomic regions in the sample and the fraction of fetal DNA.
Furthermore, the present disclosure generally encompasses an assay method for determining the likelihood of a fetal aneuploidy comprising the steps of: providing a maternal plasma or serum sample comprising maternal and fetal cell-free DNA; isolating/purifying the cell-free DNA by using one or more ETP-based devices and/or methods as described herein, thereby obtaining an isolated/purified maternal sample; introducing at least fifty first sets of two or more fixed sequence oligonucleotides complementary to a non-polymorphic locus under conditions that allow the complementary region of each fixed sequence oligonucleotide to specifically hybridize to the non-polymorphic locus in a first target genomic region in an isolated and collected maternal sample, wherein at least one of the fixed sequence oligonucleotides of each set comprises a universal primer site, a first capture region, a first tag binding region, and two restriction sites; introducing at least fifty second sets of two or more fixed sequence oligonucleotides complementary to a non-polymorphic locus under conditions that allow the complementary region of each fixed sequence oligonucleotide to specifically hybridize to the non-polymorphic locus in a second target genomic region in the maternal sample, wherein at least one of the fixed sequence oligonucleotides of each set comprises a universal primer site, a first capture region, a second tag binding region, and two restriction sites; introducing at least fifty third sets of three or more fixed sequence oligonucleotides complementary to a set of polymorphic loci in an isolated/purified maternal sample under conditions that allow the complementary region of each fixed sequence oligonucleotide to specifically hybridize to a polymorphic locus, wherein at least two of the three fixed sequence oligonucleotides of each set comprise a universal primer site, a sequence complementary to one allele at a polymorphic locus, an allele-specific tag binding region for each allele at a polymorphic locus, two restriction sites, and a polymorphic locus-specific capture region, wherein the capture region for each polymorphic locus is different from the capture region for each other polymorphic locus and different from the first capture region; hybridizing the first, second and third sets of fixed sequence oligonucleotides to the first and second target genomic regions and to the polymorphic locus; extending at least one of the hybridized first, second, and third sets of fixed sequence oligonucleotides to form adjacently hybridized fixed sequence oligonucleotides; ligating the hybridized first, second, and third sets of fixed sequence oligonucleotides to generate ligation products; amplifying the ligation products using the universal primer sites to generate amplicons corresponding to the polymorphic loci; cleaving the amplicons at the restriction sites to generate cleaved amplicons, wherein each cleaved amplicon comprises a capture region and a tag binding region; applying the cleaved amplicons to an array, wherein the array comprises a first capture probe complementary to a first capture region on the cleaved amplicons from the first and second target genomic regions, and wherein the array comprises a capture probe complementary to a capture region on the cleaved amplicons from each of the polymorphic loci; hybridizing first capture regions of the cleaved amplicons from the first and second target genomic regions to first capture probes on the array; hybridizing capture regions of cleaved amplicons from the polymorphic loci to capture probes on the array; detecting the hybridized cleaved amplicons; quantifying the relative frequency of cleaved amplicons corresponding to a locus from the first target genomic region and the relative frequency of cleaved amplicons corresponding to a locus from the second target genomic region by detecting the first and second tag binding regions; quantifying the relative frequency of each allele from the polymorphic locus by detecting an allele-specific tag-binding region for each allele on the lysed amplicon to determine the percentage of fetal cell-free DNA; and calculating the likelihood of a fetal aneuploidy using the relative frequency of cleaved amplicons corresponding to loci from the first and second target genomic regions used to determine the likelihood of a fetal aneuploidy and the determined percentage of fetal cell-free DNA.
Further, the present disclosure pertains generally to an assay method for determining the likelihood of a fetal aneuploidy comprising the steps of: providing a maternal plasma or serum sample comprising maternal and fetal cell-free DNA; isolating/purifying the cell-free DNA by using one or more ETP-based devices and/or methods as described herein, thereby obtaining an isolated/purified maternal sample; introducing at least fifty first sets of two or more fixed sequence oligonucleotides complementary to a set of non-polymorphic loci in a first target genomic region in a maternal sample under conditions that allow the complementary region of each fixed sequence oligonucleotide to specifically hybridize to the set of non-polymorphic loci, wherein at least one of the fixed sequence oligonucleotides of each set comprises a universal primer site, a first capture region, a first tag binding region, and two restriction sites; introducing at least fifty second sets of two or more fixed sequence oligonucleotides complementary to a set of non-polymorphic loci under conditions that allow the complementary region of each fixed sequence oligonucleotide to specifically hybridize to the set of non-polymorphic loci in a second target genomic region in an isolated/purified maternal sample, wherein at least one of the fixed sequence oligonucleotides of each set comprises a universal primer site, a first capture region, a second tag binding region, and two restriction sites; introducing two or more sets of a third set of three or more fixed sequence oligonucleotides complementary to a set of polymorphic loci in a maternal sample under conditions that allow the complementary region of each fixed sequence oligonucleotide to specifically hybridize to a polymorphic locus, wherein at least two of the three or more fixed sequence oligonucleotides of each set comprise a universal primer site, a sequence complementary to one allele at a polymorphic locus, an allele-specific tag binding region for each allele at a polymorphic locus, two restriction sites, and a polymorphic locus-specific capture region, wherein the capture region for each polymorphic locus is different from the capture region for each other polymorphic locus and different from the first capture region; hybridizing the first, second and third sets of fixed sequence oligonucleotides to the first and second target genomic regions and to the polymorphic locus; extending at least one of the hybridized first, second, and third sets of fixed sequence oligonucleotides to form adjacently hybridized fixed sequence oligonucleotides for each set; ligating adjacently hybridized fixed sequence oligonucleotides from the first, second, and third sets to generate ligation products; amplifying the ligation products using the universal primer sites to generate amplicons; cleaving the amplicons at the restriction sites to generate cleaved amplicons, wherein each cleaved amplicon comprises a capture region and a tag binding region; applying the cleaved amplicons to an array, wherein the array comprises a first capture probe complementary to a first capture region on the cleaved amplicons from the first and second target genomic regions, and wherein the array comprises a capture probe complementary to a capture region on the cleaved amplicons from each of the polymorphic loci; hybridizing first capture regions of the cleaved amplicons from the first and second target genomic regions to first capture probes on the array; hybridizing capture regions of cleaved amplicons from the polymorphic loci to capture probes on the array; detecting the hybridized cleaved amplicons; quantifying the relative frequency of each allele from the polymorphic locus by detecting an allele-specific tag-binding region for each allele on the lysed amplicon to determine the percentage of fetal cell-free DNA; determining the percentage of fetal cell-free DNA by identifying low frequency alleles from the quantified alleles in the event that the maternal locus is homozygous and the corresponding fetal locus is heterozygous; quantifying the relative frequency of cleaved amplicons corresponding to a locus from the first target genomic region and the relative frequency of cleaved amplicons corresponding to a locus from the second target genomic region by detecting the first and second tag binding regions; and, calculating the likelihood of fetal aneuploidy using the relative frequencies of cleaved amplicons corresponding to loci from the first and second target genomic regions and the percentage of fetal cell-free DNA.
The present disclosure further generally encompasses a method of separating/purifying one or more target analytes (e.g., one or more target nucleic acids) comprising ETP-based separation/purification of the one or more target analytes, further comprising the use of an episomal marker for ETP. In some embodiments, the ETP up-label can comprise a compound or molecule that is larger in size and/or longer in length than the target analyte, such that during ETP-based target analyte separation/purification, the ETP up-label represents a cut-off point at which collection of the target analyte can cease. For example, fluorescently labeled or otherwise detectably labeled ETP uploadg markers can be generated that are larger in size than the target DNA to be collected during ETP-based isolation/purification. By monitoring the marker throughout the ETP run, the user or automated machine can stop running before the marker falls into the collection tube, allowing capture of DNA smaller than the marker while leaving it outside the tube due to the larger contaminating DNA being positioned behind the marker on the ETP. Furthermore, the label itself is not collected, and thus the label can be used in large quantities and with a variety of detectable labels, as it does not interfere with downstream assays, such as those described in the section entitled "other methods used in connection with the devices and methods described herein". In some cases, an episomal marker of ETP can be used in ETP-based isolation/purification methods as it helps to exclude unwanted material, e.g., genomic DNA from isolated/purified cfDNA. In some embodiments, the up-marker on ETP may be about 1000bp or longer in length.
Furthermore, the present disclosure generally encompasses ETP-based isolation/purification of ctnas (e.g., ctDNA), wherein the ctnas may be further subjected to methods including cancer personalized profiling (CAPP-Seq) by deep sequencing, such as described in U.S. patent application publication No. 20160032396, which is incorporated by reference herein in its entirety. Such methods may generally include methods that combine optimized library preparation methods with multi-stage bioinformatics methods to design a population of "selectors" of DNA oligonucleotides that correspond to regions of recurrent mutation in the target cancer. A selection subgroup of DNA oligonucleotides, which may be referred to as a selection subgroup, comprises probes for a plurality of genomic regions and is designed such that at least one mutation in the plurality of genomic regions is present in a majority of subjects with a particular cancer; and in some embodiments, there are multiple mutations in the majority of all subjects with a particular cancer. Furthermore, such a CAPP-Seq method may comprise a data analysis step, which may be provided as a program of instructions executable by a computer and carried out by a software component loaded into the computer. Such methods include designing an identification selection subset for the target cancer. Other bioinformatic methods are provided for determination and quantification when circulating tumor DNA above background is detectable, for example using methods that integrate informational content and mutation classes into the detection index. Further, a method for determining the presence of tumor nucleic acid (tNA) in a cell-free nucleic acid (cfNA) sample from an individual by detecting a somatic mutation may comprise: (a) isolating/purifying cfNA from a sample by performing ETP-based isolation/purification; (b) selecting cfnas for sequences corresponding to a plurality of mutant regions in a cancer of interest; (c) sequencing the selected cfNA; (d) determining the presence of a somatic mutation, wherein the presence of the somatic mutation is indicative of the presence of a tumor cell in the individual; and (e) providing the individual with an assessment of the presence of tumor cells.
In some cases, the concentration of cfNA isolated/purified by ETP-based devices and/or methods can be determined by the molecular barcode of cfDNA. Molecular barcodes of cfDNA can include ligating an adaptor (adaptor) to one or more ends of the cfDNA. The adaptor may comprise a plurality of oligonucleotides. The adapter may comprise one or more deoxyribonucleotides. The adapter may comprise ribonucleotides. The adapter may be single stranded. The adapter may be double stranded. The adapter may include double stranded and single stranded portions. For example, the adapter may be a Y-shaped adapter. The adaptor may be a linear adaptor. The adapter may be a circular adapter. The adapters can include molecular barcodes, sample indices, primer sequences, adapter sequences, or a combination thereof. The molecular barcode may be adjacent to the sample index. The molecular barcode may be adjacent to the primer sequence. The sample index may be adjacent to the primer sequence. The linker sequence can link the molecular barcode to the sample index. The linker sequence can link the molecular barcode to the primer sequence. The linker sequence can link the sample index to the primer sequence.
The adaptor may comprise a molecular barcode. The molecular barcode may comprise a random sequence. The molecular barcode may comprise a predetermined sequence. The two or more adaptors may comprise two or more different molecular barcodes. Molecular barcodes can be optimized to minimize dimerization. Molecular barcodes can be optimized to allow identification even in the event of amplification or sequencing errors. For example, amplification of a first molecular barcode can introduce single base errors. The first molecular barcode may comprise more than a single base difference from the other molecular barcodes. Thus, a first molecular barcode with a single base error can still be identified as a first molecular barcode. The molecular barcode may comprise at least 2, 3, 4, 5, 6, 7, 8, 9, 10, or more nucleotides. The molecular barcode may comprise at least 3 nucleotides. The molecular barcode may comprise at least 4 nucleotides. The molecular barcode may comprise less than 20, 19, 18, 17, 16, or 15 nucleotides. A molecular barcode may comprise less than 10 nucleotides. A molecular barcode may comprise fewer than 8 nucleotides. A molecular barcode may comprise fewer than 6 nucleotides. The molecular barcode may comprise 2 to 15 nucleotides. The molecular barcode may comprise 2 to 12 nucleotides. The molecular barcode may comprise 3 to 10 nucleotides. Molecular barcodes may comprise 3 to 8 nucleotides. Molecular barcodes may comprise 4 to 8 nucleotides. The molecular barcode may comprise 4 to 6 nucleotides.
The adapter may include a sample index. The sample index may include a random sequence. The sample index may include a predetermined sequence. The two or more sets of adaptors may comprise two or more different sample indices. The linkers in a set of adaptors can include the same sample index. The sample index can be optimized to minimize dimerization. The sample index can be optimized to allow identification even in the event of amplification or sequencing errors. For example, amplification of a first sample index may introduce single base errors. The first sample index may comprise more than a single base difference from the other sample indices. Thus, a first sample index with a single base error can still be identified as a first molecular barcode. The sample index may comprise at least 2, 3, 4, 5, 6, 7, 8, 9, 10 or more nucleotides. The sample index may comprise at least 3 nucleotides. The sample index may comprise at least 4 nucleotides. The sample index may comprise less than 20, 19, 18, 17, 16, or 15 nucleotides. The sample index may comprise less than 10 nucleotides. The sample index may comprise less than 8 nucleotides. The sample index may comprise less than 6 nucleotides. The sample index may comprise 2 to 15 nucleotides. The sample index may comprise 2 to 12 nucleotides. The sample index may comprise 3 to 10 nucleotides. The sample index may comprise 3 to 8 nucleotides. The sample index may comprise 4 to 8 nucleotides. The sample index may comprise 4 to 6 nucleotides.
In some cases, ctnas, e.g., ctdnas, isolated/purified by ETP-based devices and methods (such as those described herein) may be further subjected to methods, kits, and systems comprising a ctDNA detection index or uses thereof. In general, the ctDNA detection index is based on the p-value of one or more types of mutations present in a sample from a subject. ctDNA detection indices may include integration of information content across multiple mutation and somatic mutation classes. ctDNA detection index may be similar to false positive rate. ctDNA detection index may be based on a decision tree, where fusion breakpoints are prioritized by the context of their absence and/or where p-values of mutations from multiple classes may be integrated. Classes of mutations may include, but are not limited to, SNVs, indels, copy number variants, and rearrangements. The ctDNA detection index can be used to assess the statistical significance of a selected subset of genomic regions comprising mutations with multiple classes. For example, a ctDNA detection index can be used to assess the statistical significance of a selected subset comprising genomic regions with SNVs and indels. In another example, a ctDNA detection index may be used to assess the statistical significance of a selected subset comprising genomic regions with SNVs and rearrangements. In another example, a ctDNA detection index may be used to assess the statistical significance of a selected subset comprising genomic regions with rearrangements and indels. In another example, a ctDNA detection index may be used to assess the statistical significance of a selected subset comprising genomic regions with SNVs, indels, copy number variants, and rearrangements. The ctDNA detection index may be calculated based on the type (e.g., class) of mutations in the genomic region of the selected subset detected in the subject. For example, the selection set may comprise genomic regions with SNVs, indels, copy number variants, and rearrangements, however, the mutation types of the selector detected in the subject may be SNVs and indels. The ctDNA detection index can be determined by combining the p-value of SNV with the p-value of indels. Any method suitable for combining independent, partial tests can be used to combine SNV with indel p-values. Combining the p-value of SNV with indels can be based on Fisher's method.
In addition, target nucleic acids, such as cfDNA, isolated/purified by ETP-based devices and methods can further undergo methods of identifying rearrangements. Rearrangements may be genomic fusion events and/or breakpoints. The method can be used for de novo analysis of cfDNA samples isolated/purified by ETP-based methods and devices (such as those described herein). Alternatively, the method can be used to analyze known tumor/germline DNA samples isolated/purified by ETP-based devices and methods (such as those described herein). The method may include a heuristic method. In general, the method can include (a) obtaining an alignment file of paired-end reads, exon coordinates, a reference genome, or a combination thereof; and (b) applying an algorithm to the information from the alignment file to identify one or more rearrangements. The algorithm may be applied to information belonging to one or more genomic regions. The algorithm can be applied to information that overlaps with one or more genomic regions.
This method may be referred to as FACTERA (FACILE translocation enumeration and recovery algorithm). As an input, FACTERA can use alignment files of paired end reads, exon coordinates, and reference genomes. In addition, the analysis can optionally be limited to reads that overlap with a particular genomic region. Facts can process input in three successive stages: identification of inconsistent reads, breakpoint detection at base pair resolution, and computer validation of candidate fusions.
In addition, one or more target nucleic acids, e.g., ctNA, isolated/purified by ETP-based devices and methods can further undergo identification of tumor-derived SNVs. Tumor-derived SNVs can be identified without prior knowledge of the somatic variants identified in the corresponding tumor biopsy samples. In some embodiments of the invention, cfDNA is analyzed without comparison to known tumor DNA samples from patients. In such embodiments, the presence of ctDNA is directed to an iterative model of (i) background noise in the paired germline DNA, (ii) base-to-resolution background frequency in cfDNA across the entire selection subset, and (iii) sequencing errors in cfDNA. These methods may utilize the following steps that may be iterated through the data points to automatically invoke tumor-derived SNVs: obtaining allele frequencies and selecting high quality data from a single cfDNA sample that has undergone ETP-based isolation/purification; testing whether a given input cfDNA allele is significantly different from a corresponding paired germline allele; assembling a cfDNA background allele frequency database; testing whether a given input allele is significantly different from the cfDNA background at the same location and selecting those with an average background frequency of a predetermined threshold (e.g., 5% or higher, 2.5% or higher, etc.); the tumor-derived SNVs were distinguished from the remaining background noise by outlier analysis.
Accordingly, a non-invasive method of identifying a tumor-derived SNV can comprise (a) obtaining a sample from a subject having cancer or suspected of having cancer; (b) ETP-based isolation/purification is performed to isolate/purify a target nucleic acid, e.g., cfNA, e.g., cNA; (c) performing a sequencing reaction on the sample to generate sequencing information; (d) applying an algorithm to the sequencing information to generate a series of candidate tumor alleles based on the sequencing information from step (c), wherein the candidate tumor alleles comprise non-dominant bases that are not germline SNPs; and (e) identifying a tumor-derived SNV based on the set of candidate tumor alleles. A candidate tumor allele can refer to a region of the genome that comprises a candidate SNV.
Further disclosed herein are methods for detecting, diagnosing, prognosing or therapy selecting a subject having a disease or disorder. The method can comprise the following steps: (a) obtaining sequence information of a subject-derived cell-free dna (cfDNA) sample, wherein the cfDNA sample is isolated/purified by ETP-based methods and devices (such as those described herein); (b) using the sequence information derived from (a) to detect cell-free non-germline DNA (cfNG-DNA) in the sample, wherein the method may be capable of detecting a percentage of cfNG-DNA that may be less than 2% or greater than about 2% of the total cfDNA.
Other methods used in connection with the devices and methods described herein
Other diagnostic methods may be applied to the sample for analysis and/or the sample analyzed by the devices and methods described herein as well as compositions comprising the sample for analysis and/or the sample analyzed, including, but not limited to, ELISA-based protein detection, affinity purification of specific cell types, and the like. To further illustrate the numerous diagnostic and therapeutic applications of the present disclosure, applicants provide additional summaries below of various techniques that may be performed with samples and subsamples, or components isolated therefrom (e.g., cells, nucleic acids, proteins, lipids, etc.), that are used, or have been analyzed, using the devices and methods described herein.
The sample for analysis and/or the sample analyzed by the devices and/or methods described herein may be subjected to further processing steps. These include, but are not limited to, further analytical techniques such as those detailed in this disclosure, including further diagnostic assays where applicable. The following methods may be used in conjunction with samples for analysis and/or samples analyzed by the devices and methods described herein, which may yield information about the identity and biological properties of the sample, e.g., cells containing a heterogeneous tumor cell population. The combined analysis provided by the devices and methods described herein and the techniques described below may allow for the identification, detection, or characterization of even smaller subclone populations within a sample (e.g., a tumor). In some embodiments, these results may provide information for diagnosis, selection of treatment methods, and patient management.
In exemplary embodiments, the sample for analysis and/or the sample analyzed by the devices and methods described herein may be subjected to one or more of the following methods or steps: staining, immunohistochemical staining, flow cytometry, FACS, fluorescence activated droplet sorting, image analysis, hybridization, DASH, molecular beacons, primer extension, microarray, CISH, FISH, fiber FISH, quantitative FISH, flow FISH, comparative genomic hybridization, blotting, Western blotting, southern blotting, Eastern blotting, Far-Western blotting, DNA-Western blotting, RNA-Western blotting and RNA blotting, enzyme assays, ELISA, ligand binding assays, immunoprecipitation, ChIP-seq, ChIP-ChiP, radioimmunoassays, fluorescence polarization, FRET, surface plasmon resonance, filtration binding assays, affinity chromatography, immunocytochemistry, electrophoretic assays, nucleic acid electrophoresis, polyacrylamide gel electrophoresis, native gel method, free flow electrophoresis, isoelectric focusing, immunoelectrophoresis, electrophoretic mobility shift assays, restriction fragment length polymorphism analysis, Zymography, gene expression profiling, DNA profiling and PCR, DNA microarray, gene expression sequence analysis, real-time polymerase chain reaction, differential display PCR, RNA-seq, mass spectrometry, DNA methylation detection, sonic energy, lipidomic based analysis, quantification of immune cells, detection of cancer-related markers, affinity purification of specific cell types, DNA sequencing, next generation sequencing, detection of cancer-related fusion proteins, and detection of chemotherapy resistance-related markers. Exemplary embodiments of these methods are described below to illustrate these techniques. However, it should be understood that variations and alternatives to these and other methods may be utilized.
Dyeing technology
The fluid may be applied for pretreatment (e.g., protein cross-linking, exposing nucleic acids, etc.), denaturation, hybridization, washing (e.g., stringent washing), detection (e.g., linking display or marker molecules to probes), amplification (e.g., amplifying proteins, genes, etc.), counterstaining, etc. In various embodiments, the substance includes, but is not limited to, a stain (e.g., hematoxylin solution, eosin solution, etc.), a wetting agent, a probe, an antibody (e.g., monoclonal antibody, polyclonal antibody, etc.), an antigen recovery solution (e.g., aqueous or non-aqueous based antigen retrieval solution, antigen recovery buffer, etc.), a solvent (e.g., alcohol, limonene, etc.), and the like. Stains include, but are not limited to, dyes, hematoxylin stains, eosin stains, conjugates of antibodies or nucleic acids with detectable labels such as haptens, enzymes or fluorescent moieties, or other types of substances for imparting color and/or for enhancing contrast. See WO2015197742 and WO2015150278, each of which is incorporated by reference herein in its entirety.
Staining techniques may employ systems and methods to receive a plurality of assay information and queries for one or more target features, and to project anatomical information from an anatomical assay onto an image of the staining assay (e.g., an Immunohistochemistry (IHC) assay, typically registered in an anatomical assay) to locate or determine features suitable for analysis. The anatomical information can be used to generate a mask that is projected onto one or more commonly registered staining or IHC assays. The location of the target feature in the IHC assay may be correlated with the anatomical context provided by the mask, where any target feature matching the anatomical mask is selected or indicated as suitable for analysis. Furthermore, the anatomical mask may be divided into a plurality of regions, and a plurality of target features from a plurality of IHC assays may be respectively associated with each of these regions. Thus, the disclosed apparatus and method provide a systematic, quantitative and intuitive approach to comprehensive multi-assay analysis, thereby overcoming the restrictive temporal or subjective visual analysis steps of the prior art. See WO2015052128, which is incorporated by reference herein in its entirety.
Typically, cancer samples are pathologically examined by immobilizing cells on microscopic slides and staining them using various staining methods (e.g., morphological or cytogenetic staining). The stained specimen is then assessed for the presence or absence of abnormal or cancerous cells and cell morphology. Although providing only general information, histological staining methods are currently the most common methods used to detect cancerous cells in biological samples. Other staining methods commonly used for cancer detection include immunohistochemistry and active staining. These methods are based on the presence or absence of a particular antigen or enzymatic activity in the cancerous cell. See WO2012152747, which is incorporated herein by reference in its entirety.
Methods, kits and systems for processing a sample containing a confounding pigment are disclosed. The method includes applying a clearing reagent to the sample, thereby decolorizing confounding pigments in the sample. Decolorizing the confounding pigments enhances the pathologist's ability to examine the samples. In an illustrative embodiment, an automated method of processing a sample mounted on a substrate to mitigate staining confusion associated with pigments within the sample is disclosed. The method includes placing the substrate with the sample immobilized thereon on an automated instrument and applying a clearing reagent such that the clearing reagent contacts the sample and a pigment within the sample is decolorized. The method further includes applying a rinsing reagent such that the clearing reagent is substantially removed from the sample, and applying a chromogenic reagent such that the sample is specifically stained. The pigment within the sample is decolorized by the clearing reagent so that a qualified plate reader can read the specifically stained sample. In other illustrative embodiments, kits for decolorizing confounding pigments in a sample are disclosed. The reagent kit comprises a reagent bottle and a clarifying reagent stored in the reagent bottle. The clearing reagent comprises an aqueous hydrogen peroxide solution, and the reagent bottle is configured to be operably connected to the automated slide staining apparatus such that the automated slide staining apparatus controls application of the clearing reagent such that the clearing reagent contacts the sample. In a further illustrative embodiment, a system for mitigating specific signal aliasing of a pigment-containing histopathological sample is disclosed. The system includes an automated instrument, a clearing reagent, and a chromogenic reagent. The automated instrument is configured to receive a histopathological sample adhered to a substrate, deliver a clearing reagent and a developing reagent to the sample, and provide heating and mixing of the clearing reagent and the developing reagent delivered to the sample. The clearing reagent is configured to contact the histopathological sample and decolorize the confounding pigment. The chromogenic reagent is configured to contact the histopathological sample and deposit a specific signal. See WO2014056812, which is incorporated by reference herein in its entirety.
Immunostaining and in situ DNA analysis can be useful tools for histological diagnosis. Immunostaining can rely on the specific binding affinity of an antibody to an epitope in a sample, as well as the increased availability of antibodies that specifically bind to unique epitopes that are sometimes only present in certain types of diseased cells. Immunostaining can involve a series of processing steps performed on a sample mounted on a slide to selectively highlight certain morphological indicators of disease status. In some cases, the processing steps may include sample pretreatment to reduce non-specific binding, antibody treatment and incubation, enzyme-labeled secondary antibody treatment and incubation, substrate reaction with enzyme, and counterstaining. As a result, a fluorescent or chromogenic prominent region of the sample can be produced that has an epitope bound to the antibody. In some cases, in situ DNA analysis relies on the specific binding affinity of a probe to a nucleotide sequence in a cell or sample. Immunohistochemistry (IHC) or Immunocytochemistry (ICC) can include visualizing cellular components in situ by detecting specific antibody-antigen interactions, wherein the antibodies have been labeled with visible markers. IHC is sometimes referred to as detecting an antigen in tissue, while ICC is sometimes referred to as detecting an antigen in or on cells in culture (JAVOIS, Methods in Molecular Medicine, V.115: Immunocytochemical Methods and Protocols, 2nd edition, (1999) Humana Press, Totowa, New Jersey, incorporated herein by reference in its entirety), however, Methods described as IHC or ICC may be equally applicable. The visible label may be a fluorescent dye, a colloidal metal, a hapten, a radiolabel, or an enzyme. Whatever the method of preparation, it may be desirable to have the maximum signal intensity with minimal background or non-specific staining to give optimal visualization of the antigen. See WO2013139555, which is incorporated herein by reference in its entirety.
According to early studies, mirnas play a role in the regulation of mammalian development and cell differentiation as well as cardiogenesis and lymphocyte development. In addition, mirnas are also involved in other biological processes, such as hypoxia, apoptosis, stem cell differentiation, proliferation, inflammation, and response to infection. mirnas can be used to simultaneously target multiple effectors of pathways involved in cell differentiation, proliferation and survival, key features of tumorigenesis. Several mirnas are associated with cancer. Thus, in situ analysis of mirnas can be used for cancer diagnosis and treatment, as mirnas appear to act as oncogenes or tumor suppressors. For example, many tumor cells have different miRNA expression patterns compared to normal tissue. Studies using genetically engineered mice to produce excess c-Myc, a mutated form of a protein associated with multiple cancers, demonstrated that mirnas affect cancer development. Methods for detecting mirnas and proteins translated or otherwise regulated by mirnas are highly desirable, particularly in automated methods for efficient and rapid detection. Previous methods for detecting mirnas are unable to detect both mirnas and their protein expression targets (possibly regulated by mirnas) in the same sample. Exemplary methods generally require digestion of cellular components using protease-based cell conditioning to expose nucleic acid targets. In addition, exemplary methods correlate the level of miRNA with protein levels using northern blotting and western blotting. In addition, molecular methods of "grinding and binding" the sample may be utilized. Tissue-based approaches have been previously demonstrated. These methods often include an enzymatic step. See WO2013079606, which is incorporated herein by reference in its entirety.
The disclosed embodiments may utilize automated methods that are particularly suited for multiplex detection of mirnas and proteins. In illustrative embodiments, the expression of one or more proteins may be regulated by miRNA. In another embodiment, the method is capable of identifying a cellular background between the miRNA and the protein. The method can include, for example, applying to the sample using an automated system (a) a reagent suitable for detecting the miRNA target, (b) a reagent suitable for detecting the protein target, and (c) a reagent suitable for staining the miRNA target and the protein target. One aspect of this embodiment relates to the use of non-enzymatic cellular regulation, i.e., avoiding protease-based cellular regulation, to preserve protein targets. The cell conditioning step can include treating the sample with a cell conditioning solution (such as a buffer having a weakly basic pH, including a Tris-based buffer having a pH of about 7.7 to about 9) at a temperature above ambient (such as about 80 ℃ to about 95 ℃)And (5) preparing the product. Automated methods can detect miRNA targets and protein targets simultaneously or sequentially, but generally achieve better staining results by first detecting and staining miRNA and then protein targets. More specific disclosed embodiments first include non-enzymatic cell conditioning of a sample. The sample is then contacted with a nucleic acid-specific binding moiety selected for a particular miRNA target, and the miRNA-specific binding moiety is then detected. The sample is then contacted with a protein-specific binding member selected for the protein target, followed by detection of the protein-specific binding member. In certain embodiments, the nucleic acid-specific binding moiety is a Locked Nucleic Acid (LNA) probe conjugated to a detectable moiety such as an enzyme, fluorophore, luminophore, hapten, fluorescent nanoparticle, or combination thereof. Certain suitable haptens are common in the art, such as digoxin, dinitrophenyl, biotin, fluorescein, rhodamine, bromodeoxyuridine, mouse immunoglobulin, or combinations thereof. Other suitable haptens were specifically developed by Ventana Medical Systems, inc, and include those selected from oxazoles, pyrazoles, thiazoles, benzofurazans, triterpenes, ureas, thioureas, carotenoids, coumarins, cyclolignans, heteroaromatics, azoaromatics, benzodiazepines  Haptens of class and combinations thereof. Haptens can be detected using anti-hapten antibodies. In certain disclosed embodiments, the anti-hapten antibody is detected by an anti-species antibody-enzyme conjugate, wherein the enzyme is any suitable enzyme, such as alkaline phosphatase or horseradish peroxidase. See WO2013079606, which is incorporated herein by reference in its entirety.
Counterstaining is a method of post-treating samples after they have been stained with reagents to detect one or more targets so that their structure can be more easily viewed under a microscope. For example, a counterstain may optionally be used prior to coverslipping to make immunohistochemical staining more evident. The color of the counterstain is different from that of the primary stain. Many counterstains are well known, such as hematoxylin, eosin, methyl green, methylene blue, giemsa, alcian blue, DAPI, and fast red. In some examples, more than one stain may be mixed together to obtain a counterstain. This provides flexibility and the ability to select a stain. For example, a first stain may be selected for a mixture having a particular property but no other desired property. A second colorant may be added to the mixture that exhibits the desired attribute of being absent. For example, toluidine blue, DAPI and pontamine sky blue may be mixed together to form a counterstain. See WO2012116949, which is incorporated by reference herein in its entirety.
Hematoxylin is a naturally occurring compound found in the red heartwood of sappanwood. Hematoxylin itself is colorless in aqueous solution and is not an active ingredient of the stained tissue components. In contrast, the oxidation products of hematoxylin oxidize hematoxylin to the active staining component of the hematoxylin dye solution, particularly when complexed with mordants. Oxidized hematoxylin is naturally produced by exposure to air and sunlight. The natural process, known as "maturation," may take 3 months or more to provide a solution suitable for cell staining. Automated staining procedures and systems use a mechanical system to deliver a staining solution to a biological sample. Standard oxidative hematoxylin staining procedures utilize a pre-mixed stock solution containing both hematoxylin/oxidized hematoxylin and mordant. See WO2012096842, which is incorporated herein by reference in its entirety.
Immunostaining typically utilizes a series of processing steps performed on a sample mounted on a glass slide, highlighted by selectively staining certain morphological indicators of the disease state. Typical steps include sample pretreatment to reduce non-specific binding, antibody treatment and incubation, treatment and incubation with an enzyme-labeled secondary antibody, reaction of a substrate with an enzyme to produce fluorophore or chromophore highlighted regions of the sample having an epitope bound to the antibody, counterstaining, and the like. Each of these steps is separated by multiple washing steps to remove unreacted residual reagents from the previous step. The incubation is performed at elevated temperatures, typically around 40 ℃, and typically continuously protects the sample from dehydration. In situ DNA analysis uses the specific binding affinity of probes to unique nucleotide sequences in a sample and similarly involves a series of processing steps, with various reagents and processing temperature requirements. See WO2011139976, which is incorporated herein by reference in its entirety.
Immunohistochemical (IHC) staining
Immunohistochemistry or IHC staining (or immunocytochemistry, i.e., staining of cells) of samples is perhaps the most commonly used immunostaining technique. Although the first case of IHC staining used fluorescent dyes (see immunofluorescence), other non-fluorescent methods using enzymes such as peroxidase (see immunoperoxidase staining) and alkaline phosphatase are now used. These enzymes are capable of catalyzing reactions that produce colored products that are readily detectable by optical microscopy. Alternatively, radioactive elements may be used as labels, and the immune response may be observed by autoradiography. Preparation or fixation may aid in preservation of cell morphology and structure. Improper or long-term immobilization may significantly reduce antibody binding capacity. Many antigens can be successfully demonstrated in formalin fixed samples. The detection of many antigens can be improved by antigen retrieval methods that reveal hidden antigenic sites by breaking some of the protein crosslinks formed by immobilization. This can be done by heating for different lengths of time (heat induced epitope repair or HIER) or using enzymatic digestion (proteolytically induced epitope repair or PIER).
"Immunohistochemistry (IHC)" refers to a method of determining the presence or distribution of an antigen, such as a protein, in a sample, such as a pancreatic cancer sample, by detecting the interaction of the antigen with a specific binding agent, such as an antibody. A sample comprising an antigen (such as a target antigen) is incubated with the antibody under conditions that allow antibody-antigen binding. Antibody-antigen binding can be detected by means of a detectable label conjugated to the antibody (direct detection) or a detectable label conjugated to a secondary antibody raised against the primary antibody (e.g., indirect detection). Exemplary detectable labels that can be used in IHC include, but are not limited to, radioisotopes, fluorescent dyes (such as fluorescein, fluorescein isothiocyanate, and rhodamine), haptens, enzymes (such as horseradish peroxidase or alkaline phosphatase), and chromophores (3, 3' -diaminobenzidine or fast red). In some examples, IHC is used to detect the presence or determine the amount of one or more proteins in a sample, such as a pancreatic cancer sample. See WO2013019945, which is incorporated by reference herein in its entirety.
Immunohistochemistry or IHC refers to the process of localizing an antigen (such as a protein) in a sample cell and using the antigen to promote specific binding of an antibody to a particular antigen. The advantage of this detection technique is the ability to accurately display the location of a given protein in a sample. This is also an effective way of examining the sample itself. The detection of antigens and nucleic acids using small molecules such as haptens has become a major method in the IHC field. Haptens bind to anti-hapten antibodies and can be used to detect specific molecular targets. For example, specific binding moieties such as primary antibodies and nucleic acid probes may be labeled with one or more hapten molecules and, once bound to their molecular targets, may be detected using anti-hapten antibody conjugates that include an enzyme or detectable label such as a fluorescent label as part of a chromophore-based detection system. Binding of the detectable anti-hapten antibody conjugate to the sample indicates the presence of the target in the sample. Digoxin is only present as a secondary metabolite in digitalis plants and is one example of a hapten that has been used in a variety of molecular assays. U.S. patent No. 4,469,797 discloses the use of an immunoassay to determine digoxin concentration in a blood sample based on the specific binding of anti-digoxin antibodies to a drug in the test sample. U.S. patent No. 5,198,537 describes a number of additional digoxin derivatives that have been used in immunological tests such as immunoassays. For in situ assays of samples, such as Immunohistochemical (IHC) assays and In Situ Hybridization (ISH) assays, and in particular multiplex assays of such samples, it is highly desirable to identify and develop methods that provide desirable results without background interference. One of the methods involves the use of Tyramine Signal Amplification (TSA), which is based on patented catalytic reporter deposition (CARD). U.S. Pat. No. 6,593,100, which is incorporated herein by reference in its entirety, discloses enhancing the catalysis of an enzyme in a CARD or Tyramide Signal Amplification (TSA) process by reacting a labeled phenol conjugate with the enzyme, wherein the reaction is carried out in the presence of an enhancing agent. See WO2012003476, which is incorporated herein by reference in its entirety, as is the case with the aforementioned publications.
Examples of methods using hapten conjugates can be utilized. In general, the method may comprise the steps of: a) immobilizing a peroxidase on a target in a sample, wherein the peroxidase is capable of reacting with a peroxidase-activatable aryl moiety, such as tyramine or a tyramine derivative, b) contacting the sample with a solution comprising a hapten conjugate, wherein the hapten conjugate comprises a hapten bound to a peroxidase-activatable aryl moiety as described above, and c) contacting the sample with a solution comprising a peroxide, whereby the hapten conjugate reacts with the peroxidase and the peroxide to form a covalent bond with or in proximity to the immobilized peroxidase; and d) localizing the target in the sample by detecting the hapten. See WO2012003476, which is incorporated herein by reference in its entirety.
Flow cytometry
Flow cytometry is a laser-based biological technique for cell counting, cell sorting, biomarker detection, and protein engineering, performed by suspending cells in a fluid stream and passing them through an electronic detection device. It allows simultaneous multi-parameter analysis of physical and chemical characteristics of up to thousands of particles per second. Flow cytometry is commonly used to diagnose health disorders, particularly blood cancer, but there are many other applications in basic research, clinical practice, and clinical trials. One common variation is to physically sort particles according to their properties to purify the target population.
Fluorescence Activated Cell Sorting (FACS)
Fluorescence Activated Cell Sorting (FACS) is a special type of flow cytometry. It provides a method of sorting heterogeneous mixtures of cells into two or more containers, one cell at a time, based on the specific light scattering and fluorescence characteristics of each cell. It is a useful scientific instrument because it provides rapid, objective and quantitative recording of fluorescence signals from individual cells, as well as physical separation of specific target cells. The cell suspension is entrained in the center of a narrow, fast-flowing liquid stream. The arrangement of the streams is such that there is a large distance between the cells relative to their diameter. The vibration mechanism causes the cell stream to break up into individual droplets. The system is adjusted so that there is a low probability of more than one cell per droplet. Just prior to breaking up the stream into droplets, the stream passes through a fluorescence measurement station where the target fluorescence characteristic of each cell is measured. The charging ring is placed at the location where the stream breaks up into droplets. A charge is placed on the ring based on previous fluorescence intensity measurements, while the opposite charge is captured on the droplet as it breaks from the stream. The charged droplets then fall through an electrostatic deflection system that transfers the droplets into a container based on the charge of the droplets. In some systems, charge is applied directly to the stream, while the shed droplets retain charge of the same sign as the stream. Then, after the droplets break up, the flow returns to neutral.
Fluorescence activated droplet sorting of single cells
Compartmentalization of individual cells in droplets enables analysis of proteins released or secreted by the cells, overcoming one of the major limitations of traditional flow cytometry and fluorescence activated cell sorting. An example of such a method is a binding assay for detecting antibodies secreted by a single mouse hybridoma cell. Secreted antibodies were detected after only 15 minutes by co-compartmentalization of single mouse hybridoma cells, fluorescent probes, and single beads coated with anti-mouse IgG antibody in 50pl droplets. The beads capture the secreted antibody and when the captured antibody binds to the probe, the fluorescence becomes localized on the beads, producing a clearly distinguishable fluorescent signal, enabling droplet sorting and cell enrichment at-200 Hz. The microfluidic system described is readily adapted for screening for other intracellular, cell surface or secreted proteins and for quantifying catalytic or regulatory activities. To screen about 100 million cells, microfluidic operations can be completed in 2-6 hours; the whole process, including the preparation of microfluidic devices and mammalian cells, can be completed in 5-7 days. See Mazutis et al (2013), "Single-cell analysis and conditioning using loop-based microfluidics". nat. protoc.8: 870-891, which is hereby incorporated by reference in its entirety).
Image analysis
Samples can be analyzed by systematic and computer-implemented automated immune cell detection methods, which facilitate clinical immune profiling studies. Automated immune cell detection methods involve retrieving multiple image channels from a multi-channel image (such as an RGB image or an unmixed image with biological significance). See WO2015177268, which is incorporated by reference herein in its entirety.
An image analysis algorithm and/or system can be utilized to automatically calculate an immune score from a set of images of multiple IHC slides and/or fluorescence stained slides. An image analysis algorithm involves a computer-implemented method for counting multiple types of cells in a single sample that has been stained with multiple assays, comprising: imaging a sample comprising lymphocyte markers CD3, CD8, CD20, FoxP3 and a tumor detection marker that has been stained with a multiplex assay; separating images of a single sample that has been stained with the multiplex assay into separate image channels for each marker of the multiplex assay; identifying a region of interest in each image channel based on the intensity information in each channel, wherein low intensity regions in each channel are removed and high intensity regions represent cell signals; generating a single replacement image, wherein the replacement image is a combination of image channel information for all lymphocyte markers; applying a cell detection algorithm, wherein the cell detection algorithm is a membrane searching algorithm or a nuclear searching algorithm; identifying characteristics of the images of each image channel or combined channel, or combinations of lymphocytes and lymphocytes in the transformed images (such as gray scale or absorbance images) or substitute images; training a classification algorithm based on the characteristics of known lymphocytes and lymphocyte combinations; applying a trained algorithm to features of lymphocytes and lymphocyte combinations in each image channel or in each image of a combined channel, or in a transformed image (such as a grayscale or absorbance image) or in a substitute image, the features identified to classify detected cells as at least one of: false positive cells, CD 3T cells only, CD3 and CD 8T cells, FP 3T cells, and CD 20B cells; counting the number of each distinct type of cell classified; generating a score for the sample, wherein the score is based on the number of each type of cell counted. See WO2015124737, which is incorporated by reference herein in its entirety.
Exemplary embodiments may include utilizing systems and methods including a two-step classification method. Operations disclosed herein include dividing a WS image into a plurality of tiles and first classifying each tile using a "soft" classification (such as SVM) and generating a confidence score and label for each tile. The location of each tile, its features, the type obtained as a result of the classification, and its confidence score may be stored in a database. The second classification step includes comparing low confidence tiles with high confidence tiles in the database and using similar tiles to increase spatial consistency of tiles in the database. In other words, for each low confidence segment, neighboring high confidence segments make a greater contribution to refining the labels of each segment, thereby improving the segmentation accuracy of the low confidence segments. In contrast to existing adaptive/active learning techniques for growing training databases, the disclosed operations are less concerned with growing a single training database, but rather focus on processing each test image independently, while adaptively improving classification accuracy based on labeling confidence information for the image being analyzed. In other words, a database of confidence tag patches is generated for each image, and similarity retrieval operations are performed within the images to refine the classification results of low confidence patches. See WO2015113895, which is incorporated by reference herein in its entirety.
Exemplary embodiments can include methods of using detection and scoring of Mesothelin (MSLN) expression, such as MSLN protein expression. In particular examples, the method comprises contacting a sample comprising tumor cells with a MSLN protein-specific binding agent (such as an antibody). Exemplary tumors that express MSLN include, but are not limited to, ovarian cancer, lung cancer (e.g., non-small cell lung cancer NSCLC), pancreatic cancer, and mesothelioma. For example, microscopy and Immunohistochemistry (IHC) are used to detect or measure expression of MSLN protein in tumor cells. For MSLN protein expression, samples were scored on a scale of 0 to 3 +. For example, it is determined whether at least 10% of the tumor cells (such as at least about 10% of the tumor cells) in the sample are stained with the protein-specific binding agent (e.g., have detectable MSLN protein expression). A sample is assigned a MSLN protein expression score of zero if less than 10% (such as less than about 10%) of the tumor cells are stained with the specific binding agent. A sample is assigned an MSLN protein expression score of 1+ if at least 10% of the tumor cells (such as at least about 10% of the tumor cells) in the sample are stained with a protein-specific binding agent (e.g., have detectable MSLN protein expression), but less than 10% > (such as less than about 10%) of the tumor cells are stained with a specific binding agent at an intensity of 2+ or greater. A sample is assigned an MSLN protein expression score of 2+ if at least 10% of the tumor cells (such as at least about 10% of the tumor cells) in the sample are stained with a protein-specific binding agent (e.g., have detectable MSLN protein expression) at an intensity of 2+ or greater and the majority of the stained tumor cells are stained at an intensity of 2 +. A sample is assigned an MSLN protein expression score of 3+ if at least 10% of the tumor cells (such as at least about 10% of the tumor cells) in the sample are stained with a protein-specific binding agent (e.g., having detectable MSLN protein expression) at an intensity of 2+ or greater and a majority of the stained tumor cells are stained with a 3+ intensity, and at least 10% of the tumor cells (such as at least about 10% of the tumor cells) in the sample are stained with a 3+ intensity with a protein-specific binding agent (e.g., having detectable MSLN protein expression). See WO2015032695, incorporated herein by reference in its entirety.
Hybridization of
In Situ Hybridization (ISH) involves contacting a sample (such as a sample mounted on a slide) containing a target nucleic acid (e.g., a genomic target nucleic acid) in the context of metaphase or interphase chromosome preparation with labeled probes (e.g., one or more of the probes disclosed herein) that can specifically hybridize to or are specific for the target nucleic acid. The slide is optionally pretreated, for example, to remove material that would interfere with uniform hybridization. Both the chromosome sample and the probe are subjected to a treatment, for example, denaturation of the double-stranded nucleic acid by heating. The probe (formulated in a suitable hybridization buffer) and sample are combined under conditions and for a sufficient time (usually sufficient to reach equilibrium) to allow hybridization to occur. The chromosomal preparation is washed to remove excess probe and specific labeling of the target is detected using standard techniques. See WO2015124702, which is incorporated by reference herein in its entirety.
Other methods of detecting cancerous cells utilize the presence of chromosomal aberrations in cancer cells. In particular, deletions or additions of copies of whole chromosomes or chromosome segments, as well as higher levels of amplification of specific regions of the genome, are common in cancer. Chromosomal aberrations are usually detected using cytogenetic methods, such as giemsa stained chromosomes (G banding) or Fluorescence In Situ Hybridization (FISH). See WO2012152747, which is incorporated herein by reference in its entirety.
The presently disclosed technology provides improved methods for improving the specificity of analyzing the molecular mechanisms of cancer. Thus, in certain embodiments, the technology relates to a multivariate cancer diagnostic method, wherein said method determines the presence of both a molecular marker and a phenotypic morphometric marker at the cellular level in a single cell or a single sample comprising cells, said method comprising:
a. obtaining molecular marker data from a single sample of a subject comprising a single cell or a plurality of cells;
b. obtaining quantitative cell morphology data from the same single cell or plurality of cells as used in step (a) to provide a multivariate analysis of the single sample, the multivariate data set comprising both quantitative cell morphology data from step (b) and molecular marker data from step (a); and
c. comparing the multivariate analysis dataset obtained in step (b) with a reference multivariate analysis dataset created by obtaining molecular marker data and quantitative cellular morphology data from cancer and non-cancer cell samples taken from individuals having known clinical outcomes.
The comparison of step (c) provides a prediction of the clinical outcome for the subject defined by the particular combination of features and markers that are statistically correlated with the progression, occurrence, metastasis or other features of the clinical outcome seen in the reference multivariate analysis dataset. See WO2012152747, which is incorporated herein by reference in its entirety.
Exemplary embodiments may include the use of techniques to provide information to determine the pathological prognostic status of cancer by using fluorescent labeling of molecular markers in concert with specialized imaging methods involving spectrally resolved detection and data preprocessing. The technique provides an imaging method that can acquire and analyze the nuclear morphology of a sample prepared for detection of a molecular specific probe on the sample within a single data acquisition cycle. This imaging method employs a combination of labeling, acquisition, pre-processing and analysis techniques. Multi-dimensional images are collected and analyzed to separate and distinguish different target analyte channels by emission wavelength. The subsequent analyte channels represent different aspects of the data quantifying cell morphology and genetic rearrangements, genetic expression and/or protein expression. See WO2012152747, which is incorporated herein by reference in its entirety.
Exemplary embodiments can include visualizing a nucleus with systems, methods, and kits. The sample may be pre-treated with protease to permeabilize the nucleus of the cell and then incubated with the nanoparticle/DNA binding moiety conjugate. The DNA binding portion includes at least one DNA binding molecule. The conjugate binds to DNA within the nucleus and the nanoparticle is visualized, thereby visualizing the nucleus. Computer and image analysis techniques are used to evaluate nuclear features such as chromosome distribution, ploidy, shape, size, texture features, and/or background features. The method can be used in combination with other multiplex assays on the sample, including fluorescence in situ hybridization. See WO2012116949, which is incorporated by reference herein in its entirety.
Fluorescence In Situ Hybridization (FISH) is a technique that can be used to detect and locate the presence or absence of specific DNA sequences on chromosomes. FISH uses fluorescent probes that bind only to portions of the chromosome that show a high degree of sequence similarity to the fluorescent probes. FISH can also be used to detect specific mRNA sequences within a sample. See WO2012116949, which is incorporated by reference herein in its entirety.
Various procedures for FISH, CISH and SISH are known in the art. For example, procedures for performing FISH are described in U.S. patent nos. 5,447,841, 5,472,842, and 5,427,932; CISH is described in U.S. patent No. 6,942,970, while additional detection methods are provided in U.S. patent No. 6,280,929, the disclosures of which are incorporated herein by reference in their entirety. Many reagents and detection schemes can be used in conjunction with FISH, CISH and SISH programs to improve sensitivity, resolution or other desirable properties. As described above, probes labeled with fluorophores (including fluorescent dyes and quantum dots) can be directly detected optically in FISH. Alternatively, the probe may be labeled with a non-fluorescent molecule such as a hapten (such as the following non-limiting examples: biotin, digoxin, DNP, and various oxazoles, pyrazoles, thiazoles, nitroaromatics, benzofurazans, triterpenes, ureas, thioureas, roteones, coumarins, coumarin-based compounds, podophyllotoxin-based compounds, and combinations thereof), a ligand, or other indirectly detectable moiety. The probes can then be labeled with non-fluorescent molecules (and the target nucleic acid sequences to which they bind) by contacting the sample (e.g., a sample of cells to which the probes bind) with a labeled detection reagent, such as an antibody (or receptor, or other specific binding partner) specific for a selected hapten or ligand. The detection reagent may be labeled with a fluorophore (e.g., a quantum dot) or another indirectly detectable moiety; or may be contacted with one or more additional specific binding agents (e.g., a secondary antibody or specific antibody) which in turn may be labeled with a fluorophore. Optionally, the detectable label is directly linked to the antibody, receptor (or other specific binding agent). Alternatively, the detectable label is attached to the binding agent via a linker (such as a hydrazide thiol linker, a polyethylene glycol linker, or any other flexible linking moiety of comparable reactivity). For example, specific binding agents, such as antibodies, receptors (or other anti-ligands), avidin, and the like, may be covalently modified with a fluorophore (or other tag) through a heterobifunctional polyalkylene glycol linker, such as a heterobifunctional polyethylene glycol (PEG) linker. The heterobifunctional linker combines two different reactive groups selected from, for example, a carbonyl reactive group, an amine reactive group, a thiol reactive group, and a photoreactive group, wherein the first is attached to a label and the second is attached to a specific binding agent. In other examples, the probe or specific binding agent (such as an antibody, e.g., a primary antibody, receptor, or other binding agent) is labeled with an enzyme capable of converting the fluorescent or chromogenic composition into a detectable fluorescent, colored, or other detectable signal (e.g., deposition of a detectable metal particle in SISH). As described above, the enzyme may be linked directly or indirectly to the relevant probe or detection reagent via a linker. Examples of suitable reagents (e.g., binding reagents) and chemicals (e.g., linkers and linking chemicals) are described in U.S. patent application publication nos. 2006/0246524, 2006/0246523, and 2007/0117153, the disclosures of which are incorporated herein by reference in their entirety. See WO2015124702, which is incorporated by reference herein in its entirety.
The method may allow for the detection of more than one (e.g., 2, 3, 4, etc.) different targets. In some embodiments, a different detectable label and/or detection system may be used for each target, such that each may be detected separately in a single sample. Any suitable detectable label and/or detection system may be used. More specifically, systems for bright field in situ hybridization are contemplated. In some embodiments, the system comprises a probe set comprising X unique 2' -O-methyl RNA probes specific for a target RNA, wherein X > 2 (e.g., X ═ 2, X ═ 3, X ═ 4, X ═ 5, etc.) that target X different moieties within the target RNA. Each 2' -O-methyl RNA probe can be conjugated to at least one detectable moiety. The detectable moiety may be adapted to bind to a reactive chromophore conjugate system (e.g., a tyramide chromophore conjugate system) for signal amplification. In some embodiments, the 2' -O-methyl RNA probes each comprise a length between 15 to 30 nucleotides, between 20 to 50 nucleotides, between 40 to 80 nucleotides, between 20 to 100 nucleotides, or between 20 to 200 nucleotides. See WO2015124738, which is incorporated herein by reference in its entirety.
The specimen may be a breast cell sample treated according to an In Situ Hybridization (ISH) protocol. ISH protocols can provide visualization of a particular nucleic acid sequence (e.g., DNA, mRNA, etc.) in a cell preparation by hybridizing a complementary strand of nucleotides (e.g., a probe) to the target sequence. The ISH scheme may include, but is not limited to, a dual SISH and Red ISH scheme, a single SISH scheme, and the like. See WO2013113707, which is incorporated by reference herein in its entirety.
Dynamic allele-specific hybridization (DASH)
Dynamic Allele Specific Hybridization (DASH) genotyping exploits differences in DNA melting temperatures caused by the instability of mismatched base pairs. The process can be highly automated and covers some simple principles. In the first step, genomic segments are amplified and attached to beads by PCR reaction with biotinylated primers. In the second step, the amplification product is attached to a streptavidin column and washed with NaOH to remove the non-biotinylated strand. The allele-specific oligonucleotide is then added in the presence of a molecule that fluoresces when bound to double-stranded DNA. The intensity is then measured as the temperature increases until the melting temperature (Tm) can be determined. SNPs will result in lower than expected Tm. Since DASH genotyping measures quantifiable changes in Tm, it is capable of measuring all types of mutations, not just SNPs. Other advantages of DASH include its ability to work with a non-labeled probe and its simple design and performance conditions.
Molecular beacons
Molecular beacons utilize specifically engineered single-stranded oligonucleotide probes. The oligonucleotides are designed with complementary regions at each end and the probe sequence located between them. This design allows the probe to assume a hairpin or stem-loop structure in its natural, isolated state. One end of the probe is connected with a fluorophore, and the other end is connected with a fluorescence quencher. Due to the stem-loop structure of the probe, the fluorophore is close to the quencher, thereby preventing any fluorescence from being emitted by the molecule. The molecule was also engineered such that only the probe sequence was complementary to the genomic DNA to be used for the assay (Abravaya et al (4. 2003), "Molecular beacons as diagnostic tools: technologies and applications". Clin. chem. Lab. Med.41 (4): 468-74). If the probe sequence of a molecular beacon encounters its target genomic DNA during the assay, it will anneal and hybridize. Due to the length of the probe sequence, the hairpin segment of the probe will be denatured, facilitating the formation of a longer, more stable probe-target hybrid. Due to the hairpin association, this conformational change allows the fluorophore and quencher to escape their close proximity, allowing the molecule to fluoresce. On the other hand, if the probe sequence encounters a target sequence with only one non-complementary nucleotide, the molecular beacon will preferentially remain in its native hairpin state and no fluorescence will be observed, as the fluorophore remains quenched.
Primer extension
Primer extension is a two-step process that first involves hybridizing a probe to the base immediately upstream of a SNP nucleotide from the SNP, and then performing a "minisequencing" reaction in which a DNA polymerase extends the hybridized primer by adding a base complementary to the SNP nucleotide. The incorporated base is detected and the SNP allele is determined (Syvanen, Nat Rev Genet.2001Dec; 2 (12): 930-42). Since primer extension is based on highly accurate DNA polymerases, this method is generally very reliable. Primer extension is also very flexible, since it enables genotyping of most SNPs under very similar reaction conditions. Primer extension methods are used in a variety of assay formats. These formats use a wide range of detection techniques, including MALDI-TOF mass spectrometry (see Sequenom) and ELISA-like methods. In general, there are two main approaches using incorporation of fluorescently labeled dideoxynucleotides (ddNTPs) or fluorescently labeled deoxynucleotides (dNTPs). Using ddntps, the probe hybridizes directly to the target DNA immediately upstream of the SNP nucleotide from the SNP, and a single ddNTP complementary to the SNP allele is added to the 3 'end of the probe (the missing 3' -hydroxyl in the dideoxynucleotide prevents the addition of more nucleotides). Each ddNTP is labeled with a different fluorescent signal, allowing detection of all four alleles in the same reaction. Using dntps, the allele-specific probe has 3' bases that are complementary to each SNP allele being interrogated. If the target DNA contains an allele that is complementary to the 3 'base of the probe, the target DNA will hybridize fully to the probe, allowing the DNA polymerase to extend from the 3' end of the probe. This is detected by incorporating fluorescently labeled dntps onto the probe ends. If the target DNA does not contain an allele that is complementary to the 3 ' base of the probe, the target DNA will produce a mismatch at the 3 ' end of the probe and the DNA polymerase will not be able to extend from the 3 ' end of the probe. The benefit of the second approach is that several labeled dntps can be incorporated into the growing strand, thereby increasing the signal.
Microarray
The core principle behind microarrays is the hybridization between two DNA strands, the property of complementary nucleic acid sequences to specifically pair with each other by forming hydrogen bonds between complementary nucleotide base pairs. The large number of complementary base pairs in the nucleotide sequence results in a tighter non-covalent bond between the two chains. After washing away the non-specific binding sequences, only strongly paired strands will remain hybridized. The fluorescently labeled target sequence bound to the probe sequence generates a signal that depends on the hybridization conditions (such as temperature) and post-hybridization washes. The total intensity of the signal from a spot (feature) depends on the amount of target sample bound to the probe present at that spot. Microarrays use relative quantitation, where the intensity of a feature is compared to the intensity of the same feature under different conditions, and the identity of the feature is known by its location.
Nucleic acid arrays (also known as oligonucleotide arrays, DNA microarrays, DNA chips, gene chips, or biochips) have become powerful analytical tools. Nucleic acid arrays are essentially a systematic distribution of oligonucleotides on a surface, e.g., in rows and columns. The oligonucleotide may be physically or covalently attached to the surface. One method of physically attaching an oligonucleotide to a surface includes drying the oligonucleotide solution as it contacts the surface. After drying or otherwise immobilizing, the oligonucleotides are confined in "spots" on the surface. The drying process begins with the production of very low density arrays known as "dot blots". Dot blots can be made by manually depositing drops of oligonucleotides on a solid surface and drying. Most dot blots involve less than about 20 different oligonucleotide dots arranged in rows and columns. Improving past speckle blots, micro-spotting (micro-spotting) methods use mechanical or robotic systems to create multiple microscopic spots. Small size dots can implement higher dot densities. For example, tens of thousands of spots are deposited on a microscope slide using micro spotting. According to different methods, oligonucleotides are synthesized directly on a substrate or support. Maskless lithography and digital photo-chemistry techniques are techniques for synthesizing nucleic acids directly on a support; these methods have been used to generate very high density arrays (e.g., U.S. patent No. 7,785,863, which is incorporated herein by reference in its entirety). Similarly, Maskless lithography has been used to fabricate peptide arrays (see, e.g., Singh-Gasson et al, Mass publication of light-directed oligonucleotide microarray using a digital microarray array Nat Biotechnol1999, 17: 974-. Digital optical chemistry has been used to create arrays with millions of discrete regions, each region containing a unique population of oligonucleotides. Nucleic acid and peptide arrays include an array of regions (referred to herein as "spots") on the surface of a substrate, each region designated for a particular oligonucleotide or peptide. The "array density" is essentially the number of rows and columns of dots distributed in a given area. High density arrays have more rows and columns in a given area. With the development of the nucleic acid and peptide array industry, the availability of high density arrays has increased. As the number of points in a given area increases, the size of each point decreases. For example, one spot in an array with millions of unique oligonucleotides or peptides distributed over an area of a microscope slide is approximately 100pm 2. The small size of such dots presents technical challenges in reading and understanding the results of using the array. For example, while the 100pm2 spot can be visually observed alone, a human cannot visually distinguish two or more 100pm2 spots without magnification. Thus, the manufacture and use of high density arrays has progressed to the point where users can no longer visually read the array. Since the array contains a large number (millions) of closely spaced dots in a small area, complex imaging devices are used to detect the signals from the array and software is used to interpret the data. In addition, highly sensitive detection methods can be used. Fluorescence imaging is a highly sensitive technique that has become the standard method for detecting hybridization events. Fluorescence imaging of these arrays typically uses a microscope equipped with a filter and a camera. Without the aid of these devices, fluorescence is generally not visually distinguishable. Highly complex fluorescence images are processed using software because of the large amount of data and the way they are presented is not discernable. For example, U.S. Pat. No. 6,090,555 to Fiekowsky et al describes a complex process involving computer-assisted alignment and deconvolution of fluorescence images obtained from nucleic acid arrays. While the ability to perform massively parallel genomics or proteomics studies is of great value, nucleic acid and peptide arrays are limited in applicability due to the difficulty in detecting and deciphering the binding events. Furthermore, the use of fluorescence poses a number of obstacles to the general applicability of the array due to the degradation of the fluorescence signal over time and the complexity of the accompanying fluorescence detection hardware. The present disclosure relates to a device comprising an oligonucleotide or peptide array and a method of detecting a target molecule using the device. The device includes a plurality of binding molecules bound to a surface of a substrate. The binding molecule is designed to bind to the target molecule. The binding of the target and the binding molecule can be recognized by examination of the device. In some embodiments, the device is capable of detecting a hybridization event between a target nucleic acid and an immobilized oligonucleotide. In other embodiments, the device is capable of detecting a binding event between the target polypeptide and the immobilized peptide. In an illustrative embodiment, a device includes a substrate having at least one substrate surface and a plurality of immobilized oligonucleotides or peptides bound to the substrate surface, wherein the plurality of immobilized oligonucleotides or peptides are patterned on the substrate surface to form at least one optically decipherable pattern. See WO2013110574, which is incorporated herein by reference in its entirety.
Exemplary embodiments can include utilizing a device for detecting one or more target compounds. One particular class of target compounds of interest are target nucleic acids or target oligonucleotides. Another particular class of target compounds of interest are target polypeptides. For embodiments comprising immobilized oligonucleotides, a target nucleic acid will generally be understood as a type of target molecule. However, it is understood by those of ordinary skill in the art that the immobilized oligonucleotide provides a binding partner for a conjugate of an oligonucleotide binding moiety that is capable of detecting a variety of other target compounds. For example, using immobilized oligonucleotides, antibody-oligonucleotide conjugates can be immobilized on a device to convert the device into an antibody microarray. Antibody microarrays can be used to detect protein targets of interest. Similarly, including embodiments where the peptide is immobilized, the target molecule type may include an antibody, a protein, or an enzyme. However, the underlying peptide may also be modified by using a conjugate of a peptide binding moiety and a molecular targeting moiety. Furthermore, while the present disclosure specifically discloses immobilized oligonucleotides and peptides, those are merely exemplary immobilized detection moieties. There are many other useful immobilized detection moieties that can be incorporated into a device as described herein without departing from the concepts disclosed herein. For example, the detection moiety may include aptamers, ligands, chelators, carbohydrates, and artificial equivalents thereof. See WO2013110574, which is incorporated herein by reference in its entirety.
Methods of isolating CTCs may include the use of antibodies specific for EpCAM, ERG, PSMA, or a combination thereof. The isolated CTCs are applied to a slide or other substrate and immobilized (e.g., using methods known in the art). Diffusion methods using prostate-specific antibodies can also be used to isolate CTCs and apply them to a substrate, such as a glass slide, prior to fixation. The mounted and immobilized CTCs are then contacted with one or more nucleic acid probes specific for ERG, PTEN, and CEN-10, for example, under conditions sufficient for the nucleic acid probes to hybridize to complementary sequences in the CTCs. For example, the nucleic acid probe is labeled with one or more quantum dots. For example, one or more nucleic acid probes specific for ERG, PTEN, and CEN-10 may each be labeled with a different quantum dot to allow the probes to be distinguished from each other. After hybridizing the nucleic acid probes to ERG, PTEN, and CEN-10, signals from one or more quantum dots on one or more of the nucleic acid probes are detected, for example, by using spectroscopic imaging. The signals are then analyzed to determine whether, in isolated CTCs, one or more ERGs are rearranged, one or more PTEN genes are deleted, and CEN-10 is detected. Prostate cancer is characterized based on whether one or more ERGs are rearranged, one or more PTEN genes are deleted, and CEN-10 is detected. See WO2013101989, which is incorporated herein by reference in its entirety.
Chromogenic In Situ Hybridization (CISH)
Chromogenic In Situ Hybridization (CISH) is a cytogenetic technique that combines the chromogenic signal detection method of the Immunohistochemical (IHC) technique with in situ hybridization. It was developed in around 2000 and used as an alternative to Fluorescence In Situ Hybridization (FISH) for the detection of HER-2/neu oncogene amplification. CISH is similar to FISH in that they are in situ hybridization techniques for detecting the presence or absence of specific regions of DNA. However, CISH is more practical in diagnostic laboratories because it uses bright field microscopy rather than the more expensive and complex fluorescence microscopy used in FISH.
The probe design for CISH can be very similar to that of FISH, except for the differences in labeling and detection. FISH probes are usually labeled with a variety of different fluorescent labels and can only be detected under fluorescent microscopy, whereas CISH probes are labeled with biotin or digoxigenin and can be detected using bright field microscopy after applying other processing steps. CISH probes are about 20 nucleotides in length and are designed specifically for DNA targets. They are complementary to the targeted sequence and bind to it after denaturation and hybridization steps. Only a few CISH probes are commercially available and therefore for most applications they must be extracted from Bacterial Artificial Chromosomes (BACs), amplified, sequenced, labeled and mapped. BAC was developed during the human genome project because of the need to isolate and amplify short fragments of human DNA for sequencing. BACs can now be selected and mapped on the human Genome using public databases such as UCSC Genome Browser. This ensures optimal complementarity and sequence specificity. DNA is extracted from BAC clones and amplified using polymerase-based techniques, such as Degenerate Oligonucleotide Primer (DOP) -PCR. Next, the clones were sequenced and their positions on the genome were verified. Probe labeling can be performed by using random priming or nick translation to incorporate biotin or digoxigenin.
Sample preparation, probe hybridization and detection: the sample may comprise chromosomes at interphase or metaphase. The sample is firmly attached to a surface such as a slide. The sample may be subjected to pepsin digestion to ensure that the target is accessible. Add 10-20. mu.L of probe, cover the slide with rubber cement to cover the sample, heat the slide to 97 ℃ for 5-10 minutes to denature the DNA. The slides were then placed in an oven at 37 ℃ overnight so that the probes could hybridize. The next day, the samples were washed and applied with blocking agent for non-specific protein binding sites. If horseradish peroxidase (HRP) is to be used, the sample must be incubated in hydrogen peroxide to inhibit endogenous peroxidase activity. If digoxin is used as the probe tag, an anti-digoxigenin-fluorescein primary antibody is used, followed by an HRP-conjugated anti-fluorescein secondary antibody. If biotin is used as the probe tag, the non-specific binding sites must first be blocked using Bovine Serum Albumin (BSA). Detection was then performed using HRP-conjugated streptavidin. HRP then converts Diaminobenzidine (DAB) to an insoluble brown product that can be detected in a bright field microscope at 40 to 60 times magnification. Counterstains such as hematoxylin and eosin may be used to make the product more visible.
Molecular cytogenetic techniques, such as Chromogenic In Situ Hybridization (CISH), combine visual assessment of chromosomes (karyotyping) with molecular techniques. Molecular cytogenetic methods are based on the hybridization of a nucleic acid probe to its complementary nucleic acid within a cell. Probes for specific chromosomal regions will recognize and hybridize to complementary sequences on metaphase chromosomes or within interphase nuclei (e.g., in a sample). Probes have been developed for a variety of diagnostic and research purposes. Sequence probes hybridize to a single copy of a DNA sequence in a particular chromosomal region or gene. These are probes for identifying key regions or genes of the chromosome that are associated with the targeted syndrome or condition. On metaphase chromosomes, such probes hybridize to each chromatid, typically giving two small, discrete signals per chromosome. Hybridization of sequence probes (such as repeat depletion probes or unique sequence probes) makes it possible to detect chromosomal abnormalities associated with a variety of diseases and syndromes, including constitutive genetic abnormalities such as microdeletion syndrome, chromosomal translocations, gene amplification and aneuploidy syndrome, neoplastic diseases, and pathogen infections. Most commonly, these techniques are applied to standard cytogenetics systems on microscope slides And (4) preparing. In addition, these procedures can be used on slides that immobilize cells or other nuclear isolates. For example, these techniques are often used to characterize tumor cells for the diagnosis and prognosis of cancer. Many chromosomal abnormalities are associated with the development of cancer (e.g., aneuploidy associated with certain bone marrow diseases such as trisomy 8, translocation such as BCR/ABL rearrangement in chronic myelogenous leukemia, and amplification of specific nucleic acid sequences associated with neoplastic transformation). Molecular techniques can enhance standard cytogenetic testing in the detection and characterization of such acquired chromosomal abnormalities. Systems for two-color CISH have been introduced. These systems include Dako DuoCISHTMSystem and Zyto Vision 2C system. Both systems use separate enzymes (alkaline phosphatase and horseradish peroxidase) to perform two color detection steps.
In some embodiments, systems and processes for Chromogenic In Situ Hybridization (CISH), particularly methods of preventing interference between two or more color detection systems in a single assay, are contemplated, and further involve processes for scoring assays with cleaved probes. See WO2011133625, which is incorporated herein in its entirety.
Fluorescence In Situ Hybridization (FISH)
Fluorescence In Situ Hybridization (FISH) is a cytogenetic technique that uses fluorescent probes that bind only to those portions of chromosomes that have a high degree of sequence complementarity. It was developed by biomedical researchers in the early 1980 s for detecting and localizing the presence or absence of specific DNA sequences on chromosomes. Fluorescence microscopy can be used to find the binding site of the fluorescent probe to the chromosome. FISH is commonly used to look for specific features in DNA for genetic counseling, medicine and species identification. FISH can also be used to detect and localize specific RNA targets (e.g., mRNA, lncRNA, and miRNA) in cells, circulating tumor cells, and samples. In this case, it may help to define the spatiotemporal pattern of gene expression within the cell.
And (3) probe: RNA and DNA: RNA probes can be designed against any gene or any sequence within a gene to visualize mRNA, lncRNA, and miRNA in a cell. FISH is used to examine the cell reproductive cycle, particularly nuclear interphase for any chromosomal abnormality. This technique [ FISH ] allows for easier analysis of large numbers of archival cases by creating a probe with an artificial chromosome base that will attract similar chromosomes, thereby identifying precisely located chromosomes. Detecting a hybridization signal of each probe when the nucleic acid is abnormal. Each probe for detection of mRNA and lncRNA consists of 20 oligonucleotide pairs, each covering a space of 40-50 bp. For miRNA detection, the probe uses proprietary chemistry to specifically detect miRNA and cover the entire miRNA sequence. Probes are typically derived from DNA fragments that are isolated, purified, and amplified for use in the human genome project. The size of the human genome is so large compared to the length that it can be directly sequenced that it is necessary to divide the genome into multiple fragments. (in the final analysis, the fragments were sequenced by digesting copies of each fragment into smaller fragments using sequence-specific endonucleases, measuring the size of each small fragment using size exclusion chromatography, and using this information to determine where the large fragments overlap each other.) to preserve the fragments with their respective DNA sequences, the fragments were added to a system that continuously replicates the bacterial population. Clonal populations of bacteria, each maintaining an artificial chromosome, are stored in different laboratories around the world. Artificial Chromosomes (BACs) can be grown, extracted and labeled in any laboratory. These fragments have approximately 10 ten thousand base pairs and are the basis for most FISH probes.
Preparation and hybridization procedure-RNA: the cells may be permeabilized to allow target accessibility. FISH has also been successfully accomplished on non-fixed cells. A target-specific probe consisting of 20 oligonucleotide pairs is hybridized to one or more target RNAs. Independent but compatible signal amplification systems support multiple assays (up to two targets per assay). Signal amplification is achieved by a series of sequential hybridization steps. At the end of the measurement, the sample is observed under a fluorescence microscope.
Preparation and hybridization procedure-DNA: first, a probe was constructed. The probe must be sufficiently large to hybridize specifically to its target, but not so large as to interfere with the hybridization process. The probes are labeled directly with fluorophores, with targets for antibodies, or with biotin. Labeling can be accomplished in a variety of ways, such as nick translation or PCR using labeled nucleotides. Interphase or metaphase chromosomal preparations are then produced. The chromosomes are firmly attached to the substrate (usually glass). The repetitive DNA sequences must be blocked by adding short DNA fragments to the sample. The probe is then applied to the chromosomal DNA and incubated for about 12 hours while hybridizing. Several washing steps remove all non-hybridized or partially hybridized probes. The results are then visualized and quantified using a microscope capable of exciting the dye and recording the image. If the fluorescence signal is weak, it may be necessary to amplify the signal to exceed the detection threshold of the microscope. The intensity of the fluorescent signal depends on many factors, such as the efficiency of labeling the probe, the type of probe, and the type of dye. A fluorescently labeled antibody or streptavidin is bound to the dye molecule. These secondary components are chosen to have a strong signal.
Fiber FISH
In fiber FISH, an alternative technique to interphase or metaphase preparation, interphase chromosomes are attached to slides in such a way that they extend in a straight line rather than tightly coiled as in traditional FISH, or adopt a chromosome region conformation as in interphase FISH. This is done by applying mechanical shear to cells that have been fixed to the slide and then lysed or to the purified DNA solution along the length of the slide. A technique called chromosome combing is increasingly used for this purpose. The extended conformation of the chromosome allows for significantly higher resolution-even down to several kilobases.
Quantitative FISH (Q-FISH)
Quantitative fluorescence in situ hybridization (Q-FISH) is a cytogenetic technique based on the traditional FISH method. In Q-FISH, the technique uses labeled (Cy3 or FITC) synthetic DNA mimics called Peptide Nucleic Acid (PNA) oligonucleotides to quantify target sequences in chromosomal DNA using fluorescence microscopy and analytical software.
Flow-through FISH
Flow FISH is a cytogenetic technique that quantifies the copy number of a particular repeat element in genomic DNA of an entire population of cells by combining flow cytometry with a cytogenetic fluorescent in situ hybridization staining protocol. Flow-through FISH was first published in 1998 by Rufer et al as an improvement over another technique for analysing telomere length, Q-FISH, and uses a peptide nucleic acid probe of the 3 '-CCCTAACCCTAACCCTAA-5' sequence labelled with a fluorescein fluorophore to stain telomeric repeats in preparation of metaphase spreads of cells that have been fixed to a glass slide with colchicine, hypotonic shock and by methanol/acetic acid treatment (protocol available on-line). The resulting images of the fluorescence spots can then be analyzed by a specialized computer program (methods and software available from the Flintbox network) to generate quantitative fluorescence values, which can then be used to estimate the actual telomere length. The fluorescence produced by probe staining is considered quantitative because PNA binds preferentially to DNA in the presence of low ionic salt concentrations and formamide, and thus the DNA duplex may not reform after it has melted and annealed to the PNA probe, allowing the probe to saturate its target repeat sequence (since it is not displaced from the target DNA by competing antisense DNA on the complementary strand), thereby producing a reliable and quantifiable reading of the frequency of the PNA probe target at a given chromosomal site after washing away unbound probe.
Comparative genomic hybridization
Comparative genomic hybridization is a molecular cytogenetic method for analyzing Copy Number Variation (CNV) at the ploidy level of DNA in test samples compared to reference samples without culturing the cells. The aim of this technique is to rapidly and efficiently compare two genomic DNA samples from two sources that are usually most closely related, since they are suspected of having differences in the acquisition or loss of whole chromosome or sub-chromosome regions (part of the whole chromosome). This technique was originally developed to assess the differences between the chromosomal complements of solid tumor and normal tissue samples and has improved resolution to 5-10 megabases compared to more traditional cytogenetic analysis techniques such as giemsa banding and Fluorescence In Situ Hybridization (FISH), which are limited by the resolution of the microscope used.
Print
Exemplary blotting techniques that can be used include western blotting, southern blotting, Eastern blotting, Far-western blotting, DNA-western blotting, RNA-western blotting, and northern blotting, as further described in the following sections and known in the art.
Western blot
Western blotting (sometimes referred to as western immunoblotting) is a widely used analytical technique for detecting specific proteins in a sample or extract. It uses gel electrophoresis to separate native proteins by 3-D structure or denatured proteins by polypeptide length. The proteins are then transferred to a membrane (usually nitrocellulose or PVDF) where they are stained with antibodies specific for the target protein. The gel electrophoresis step is included in western blot analysis to address the problem of antibody cross-reactivity.
Southern blotting
Southern blotting the electrophoretically separated DNA fragments are transferred to a filter and then subjected to fragment detection by probe hybridization. Hybridization of the probe to a specific DNA fragment on the filter indicates that the fragment contains a DNA sequence complementary to the probe. The step of transferring the DNA from the electrophoresis gel to a membrane allows easy binding of labeled hybridization probes to size fractionated DNA. It also allows for immobilization of target-probe hybrids, which can be used for analysis by autoradiography or other detection methods. Southern blotting of genomic DNA digested with restriction enzymes can be used to determine the number of sequences (e.g., gene copies) in the genome. Probes that hybridize only to a single piece of DNA that is not cleaved by the restriction enzyme will produce a single band on the southern blot, while multiple bands will likely be observed when the probe hybridizes to several highly similar sequences (e.g., those that may be the result of sequence replication). Modification of hybridization conditions (e.g., increasing hybridization temperature or decreasing salt concentration) can be used to increase specificity and reduce hybridization of probes to sequences less than 100% similar.
Easter blot
Eastern blotting is a biochemical technique for analyzing protein post-translational modifications (PTMs), such as lipids, phosphate moieties, and glycoconjugates. It is most commonly used for detecting carbohydrate epitopes. Therefore, Eastern blotting can be considered as an extension of western blotting biochemical techniques. The term Eastern blotting describes a variety of techniques, most of which use proteins blotted from SDS-PAGE gels onto PVDF or nitrocellulose membranes. Post-translational modifications were analyzed for transferred proteins using probes that can detect lipid, carbohydrate, phosphorylation, or any other protein modification. Eastern blot shall be used to refer to a method for detecting its target by the specific interaction of PTM and probe, distinguishing them from standard Far-western blots. In principle, eastern blots are similar to lectin blots (i.e., detect carbohydrate epitopes on proteins or lipids).
Far-Western blot
Far-western blot uses non-antibody proteins to probe one or more target proteins on the blot. In this way, binding partners of the probe (or imprinted) protein can be identified. The probe protein is usually produced in E.coli using an expression cloning vector. Proteins in cell lysates containing prey proteins were first separated by SDS or native PAGE and then transferred to membranes as in standard WB. The proteins in the membrane are then denatured and renatured. The membrane is then blocked and probed with one or more purified bait proteins. If the bait protein and prey protein together form a complex, the bait protein is detected at the membrane site where the prey protein is located. The probe protein can then be visualized by usual methods-it can be radiolabeled; it may carry a specific affinity tag, such as His or FLAG for which antibodies are present; or may have a protein-specific antibody (directed against the probe protein).
DNA-Western blot
Southern-western blotting, based on Southern blotting (created by Edwin Southern) and described first in 1980 by b.bowen, j.steinberg and colleagues, is a laboratory technique that involves the identification and characterization of DNA binding proteins (proteins that bind to DNA) by their ability to bind to specific oligonucleotide probes. Proteins were separated by gel electrophoresis and subsequently transferred to nitrocellulose membranes similar to other types of blots. "DNA-Western blot analysis" is used to rapidly characterize DNA binding proteins and their specific sites on genomic DNA. Proteins were separated on a polyacrylamide gel (PAGE) containing Sodium Dodecyl Sulfate (SDS), renatured by removing SDS in the presence of urea, and blotted onto nitrocellulose by diffusion. The genomic DNA region of interest is digested with selected restriction enzymes to produce fragments of appropriate but different sizes, which are then end-labeled and allowed to bind to the isolated protein. Specifically bound DNA was eluted from each individual protein-DNA complex and analyzed by polyacrylamide gel electrophoresis. Evidence has been presented that specific DNA binding proteins can be detected by this technique. In addition, their sequence-specific binding allows the purification of corresponding selectively bound DNA fragments and may improve protein-mediated DNA regulatory sequence cloning.
RNA-Western blot
Running RNA-western blots involves separating RNA-binding proteins by gel electrophoresis, which separates RNA-binding proteins according to their size and charge. A single sample may be loaded onto an agarose or polyacrylamide gel (typically SDS-PAGE) in order to analyse multiple samples simultaneously. Once the gel electrophoresis is complete, the gel and associated RNA binding protein are transferred to nitrocellulose transfer paper. Then soaking the newly transferred blot in a sealing solution; skim milk and bovine serum albumin are common blocking buffers. This blocking solution helps to prevent non-specific binding of the primary and/or secondary antibodies to the nitrocellulose membrane. Once the blocking solution has been in contact with the blot for a sufficient time, specific competitor RNA is applied and incubated for a given time at room temperature. During this time, the competitor RNA binds to the RNA binding protein in the sample on the blot. During this process, the incubation time may vary depending on the concentration of competitor RNA applied; but the incubation time is typically one hour. After incubation is complete, the blot is typically washed at least 3 times for 5 minutes each to dilute the RNA in solution. Common wash buffers include Phosphate Buffered Saline (PBS) or 10% Tween 20 solutions. Improper or insufficient washing will affect the clarity of the blot development. Once the wash is complete, the blot is typically subsequently visualized by X-ray or similar autoradiography.
Northern blotting
A typical northern blotting procedure begins with the extraction of total RNA from a sample (e.g., cells). Eukaryotic mRNA can then be isolated by chromatography using oligo (dT) cellulose to isolate only those RNAs with a poly (a) tail. The RNA samples were then separated by gel electrophoresis. The RNA sample, now separated by size, is transferred to a nylon membrane by a capillary or vacuum blotting system, since the gel is fragile and the probe cannot enter the matrix. Positively charged nylon membranes are best suited for northern blotting because negatively charged nucleic acids have a high affinity for them. The transfer buffer used for blotting typically contains formamide because it lowers the annealing temperature for probe-RNA interactions, thereby eliminating the need for high temperatures that could lead to RNA degradation. Once the RNA is transferred to the membrane, it is immobilized on the membrane by uv or thermal covalent bonds. After the probe is labeled, it is hybridized with RNA on the membrane. Experimental conditions that can affect hybridization efficiency and specificity include ionic strength, viscosity, duplex length, mismatched base pairs, and base composition. The membrane is washed to ensure that the probes have specifically bound and to prevent background signal generation. The hybridization signal is then detected by X-ray film and can be quantified by densitometry. After determination by microarray or RT-PCR, a control for comparison can be created using a northern blot sample that does not reveal the gene product of interest.
Enzymatic process
A proximal detection (proximity detection) method is described, possibly using an automated staining platform, which uses enzymatic biotinylation to detect a target in a sample. One disclosed embodiment includes contacting a sample with a first conjugate comprising biotin ligase and a first specific binding moiety proximally bound to a first target; contacting the sample with a second conjugate comprising a biotin ligase substrate and a second specific binding moiety proximally bound to a second target; subjecting the sample to conditions that allow biotinylation of the biotin ligase substrate by biotin ligase when the first target and the second target have a proximal arrangement; and detecting biotinylation of the biotin ligase substrate. Conditions that allow biotinylation of the substrate include the addition of biotin and ATP. The method can further comprise contacting the sample with a streptavidin-enzyme conjugate. Signal amplification may also be used. See WO2014139980, which is incorporated herein by reference in its entirety.
Enzyme-linked immunosorbent assay (ELISA)
Performing an ELISA involves at least one antibody specific for a particular antigen. Samples with unknown amounts of antigen are immobilized on a solid support (usually a polystyrene microtiter plate) either non-specifically (by adsorption to the surface) or specifically (by capture of another antibody specific for the same antigen, in a "sandwich" ELISA). After the antigen is immobilized, a detection antibody is added to form a complex with the antigen. The detection antibody may be covalently linked to the enzyme, or may itself be detected by a secondary antibody linked to the enzyme via bioconjugation. Between each step, the plate is typically washed with a mild detergent solution to remove any non-specifically bound proteins or antibodies. After the final washing step, the plate is developed by adding an enzymatic substrate to generate a visible signal indicative of the amount of antigen in the sample.
Ligand binding assays
Methods of analyzing samples known or suspected of containing circulating CTCs may include an imaging step. In one example, imaging includes immunofluorescence imaging of CTC identification agents (e.g., by detecting tags associated with each antibody used). In another example, the imaging includes using a multispectral band-pass filter. Immunofluorescence may be emitted from an antibody directly or indirectly labeled with a fluorophore, or immunofluorescence may be generated by exciting the fluorophore with spectrally filtered visible light. In one embodiment, the spectrally filtered visible light includes a first selected range that excites the first fluorophore and a second selected range that excites the second fluorophore, wherein the first selected range does not significantly excite the second fluorophore and the second selected range does not significantly excite the first fluorophore. Imaging the sample may include acquiring a first immunofluorescence image of the sample excited by the first selected range and acquiring a second immunofluorescence image of the sample excited by the second selected range (additional immunofluorescence images are acquired for each tag if more than two CTC identification agents are used), and locating or identifying CTCs by locating or visualizing the CTC identification agents, which may include comparing or superimposing the first immunofluorescence image and the second immunofluorescence image (and, if so obtained, the additional images). For example, imaging the first immunofluorescence image may identify CK + cells and the second immunofluorescence image may identify CD45+ cells, wherein the comparing or superimposing includes identifying the cells as CK + and CD 45-. In another embodiment, localizing CTCs by localizing CTC identification agents comprises algorithmically analyzing the first and second immunofluorescence images (and, if obtained, additional immunofluorescence images) using a computer. In one embodiment, algorithmically analyzing comprises numerically querying the image to measure cell size, cellular compartmentalization of the marker, and/or intensity of marker expression. See WO2013101989, which is incorporated herein by reference in its entirety.
Immunoprecipitation (IP)
Liquid phase ligand binding assays for Immunoprecipitation (IP) are one method of purifying or enriching a specific protein or group of proteins using antibodies from complex mixtures. The extract of the disrupted cells or sample can be mixed with an antibody against the antigen of interest, thereby producing an antigen-antibody complex. When the antigen concentration is low, it may take several hours or even days for the antigen-antibody complex to precipitate, and it is difficult to separate a small amount of precipitate formed. Enzyme-linked immunosorbent assay (ELISA) or Western blotting are two different methods by which purified antigen(s) can be obtained and analyzed. The method involves purification of the antigen by means of antibodies attached to a solid (bead) support, such as agarose resin. The immobilization of the protein complex may be carried out in one step or in sequence. IP can also be used in conjunction with biosynthetic radioisotope labels. Using this combination of techniques, it can be determined whether a specific antigen is synthesized by the sample or by the cell.
Chromatin immunoprecipitation (ChIP)
Chromatin immunoprecipitation (Chip) is an immunoprecipitation assay technique used to explore the interaction between proteins and DNA in cells. It is aimed at determining whether a specific protein is associated with a specific genomic region, such as a promoter or transcription factor on other DNA binding sites, and whether it is possible to define cis-trans groups (cistomes). ChIP also aims to identify specific locations in the genome that are associated with various histone modifications, indicating the target of the histone modifier.
Chromatin immunoprecipitation sequencing (ChIP-seq)
ChIP sequencing, also known as ChIP-seq, is a method for analyzing protein-DNA interactions. ChIP-seq combines chromatin immunoprecipitation (ChIP) with massively parallel DNA sequencing to identify binding sites for DNA-associated proteins. It can be used to map precisely global binding sites for any protein of interest. ChIP-seq is mainly used to determine how transcription factors and other chromatin-associated proteins affect the phenotypic influence mechanism. Determining how proteins interact with DNA to regulate gene expression is critical to a full understanding of many biological processes and disease states. This epigenetic information is complementary to the analysis of genotype and expression. The ChIP-seq technology is currently mainly considered as an alternative to ChIP-chips that can utilize hybridization arrays. This necessarily introduces some bias because the array is limited to a fixed number of probes. In contrast, sequencing is considered to have a minor bias, although the sequencing bias of different sequencing technologies has not been completely broken. Specific DNA sites that physically interact directly with transcription factors and other proteins can be isolated by chromatin immunoprecipitation. ChIP generates a library of target DNA sites that bind to proteins of interest in vivo. Massively parallel sequence analysis was used in conjunction with whole genome sequence databases to analyze the pattern of interaction of any protein with DNA, or the pattern of any epigenetic chromatin modifications. This can be applied to a group of proteins and modifications that can be subjected to ChIP, such as transcription factors, polymerases and transcription mechanisms, structural proteins, protein modifications and DNA modifications. As an alternative to relying on specific antibodies, different approaches have been developed to find a superset of all nucleosome depleted or nucleosome disrupted active regulatory regions in the genome, such as DNase-Seq and FAIRE-Seq.
ChIP-on-chip(ChP-ChIP)
ChIP-on-ChIP (also known as ChIP-ChIP) is a technique that combines chromatin immunoprecipitation ("ChIP") with DNA microarrays ("chips"). Like conventional ChIP, ChIP-on-ChIP is used to study the interaction between protein and DNA in vivo. In particular, it allows identification of the cis-trans group of DNA binding proteins, i.e. the sum of binding sites, on a genome-wide basis. Whole genome analysis can be performed to determine the location of binding sites for almost any protein of interest. As the name of the art suggests, such proteins are typically proteins that operate in a chromatin environment. The most prominent representatives of this class are transcription factors, replication-related proteins such as origin recognition complex proteins (ORC), histones, their variants and histone modifications. The goal of ChIP-on-ChIP is to localize protein binding sites that may help identify functional elements in the genome. For example, in the case of a transcription factor as a target protein, its transcription factor binding site in the entire genome can be determined. Other proteins allow the identification of promoter regions, enhancers, inhibitors and silencing elements, insulators, border elements and sequences that control DNA replication. If histones are the subject of interest, it is believed that the distribution of modifications and their localization may provide new insight into the regulatory mechanisms. One of the long-term goals of ChIP-on-ChIP is to build a (selected) organism list that lists all protein-DNA interactions under various physiological conditions. This knowledge will ultimately help to understand the mechanisms behind gene regulation, cell proliferation and disease progression. Thus, ChIP-on-ChIP not only offers great potential to complement our knowledge of genomic organisation at the nucleotide level, but also provides a higher level of information and regulation as it is propagated through epigenetic studies.
Radioimmunoassay
Radioimmunoassay (RIA) is a very sensitive in vitro assay technique for measuring antigen concentrations (e.g., hormone levels in blood) by using antibodies. Thus, it can be seen as the reverse process of the radioactive binding assay, which quantifies antibodies by using the corresponding antigen. Traditionally, to perform radioimmunoassays, a known amount of antigen is made radioactive, usually by labeling the antigen with a gamma radioisotope of iodine (such as 125-I) linked to tyrosine. The radiolabeled antigen is then mixed with a known amount of antibody to the antigen, and as a result, the two specifically bind. Then, a serum sample from the patient is added, which contains an unknown amount of the same antigen. This results in unlabeled (or "cold") antigen from the serum competing with the radiolabeled ("hot") antigen for antibody binding sites. As the concentration of "cold" antigen increases, more of it binds to the antibody, displaces the radiolabeled variant, and reduces the ratio of radiolabeled antigen bound by the antibody to free radiolabeled antigen. The bound antigen is then separated from the unbound antigen and the radioactivity of the bound antigen remaining in the supernatant is measured using a gamma counter.
The method can be used in principle with any biological molecule and is not limited to serum antigens, nor does it require the use of a method for indirect measurement of free antigen instead of direct measurement of captured antigen. For example, RIA can be performed if it is not desired or possible to radiolabel an antigen or target molecule of interest, if two different antibodies recognizing the target are available, and the target is large enough (e.g., one protein) to present multiple epitopes to the antibody. One antibody will be radiolabeled as described above, while the other will remain unmodified. The RIA will be adapted to allow the "cold" unlabeled antibody to interact with and bind to the target molecule in solution. Preferably, the unlabeled antibody is immobilized in some manner, such as coupled to agarose beads, coated onto a surface, and the like. Next, the "hot" radiolabeled antibody is allowed to interact with the first antibody-target molecule complex. After extensive washing, the direct amount of bound radioactive antibody is measured and the amount of target molecule is quantified by comparing it with a reference amount determined simultaneously. This method is similar in principle to the nonradioactive sandwich ELISA method.
Fluorescence polarization
Fluorescence polarization is synonymous with fluorescence anisotropy. The method measures the change in rotational velocity of a fluorescently labeled ligand after binding to a receptor. The ligands are excited using polarized light and the amount of light emitted is measured. The depolarization of the emitted light depends on the size of the present ligand. If a small ligand is used, it will have a large depolarization, which will rotate the light rapidly. If a larger ligand size is used, the resulting depolarization will be reduced. An advantage of this method is that it may comprise only one marking step. However, if this method is used at low nanomolar concentrations, the results can be accurate.
Forster Resonance Energy Transfer (FRET)
Forster resonance energy transfer (also known as fluorescence resonance energy transfer) utilizes energy transfer between donor and acceptor molecules that are in close proximity, e.g., a donor fluorophore and an acceptor fluorophore, or a fluorophore and a quencher. FRET uses a fluorescently labeled ligand, such as FP. Energy transfer within FRET begins with excitation of the donor. The dipole-dipole interaction between the donor and acceptor molecules transfers energy from the donor to the acceptor molecule. The interaction between two or more molecules targeted by the donor and acceptor can be monitored by detecting a fluorescence spectrum associated with the incoming transfer or the absence of the incoming transfer. For example, if a ligand binds to a receptor-antibody complex, the receptor will emit light. Energy transfer depends on the distance between the donor and acceptor, so the presence or absence of transfer indicates molecular distance. In general, distances of less than 10nm allow for efficient energy transfer between the acceptor and donor, but greater or lesser distances may be used depending on the particular molecule involved.
Surface Plasmon Resonance (SPR)
Surface Plasmon Resonance (SPR) does not require labeling of ligands. Instead, it works by measuring the change in the angle (index of refraction) at which polarized light is reflected from a surface. This angle is related to a change in mass or layer thickness, such as immobilization of the ligand changes the resonance angle, which increases the reflected light. The apparatus for deriving SPR includes a sensor chip, a flow cell, a light source, a prism, and a fixed angular position detector.
Filter binding assay
The filter assay is a solid phase ligand binding assay, using a filter to measure the affinity between two molecules. In a filter binding assay, a filter is used to retain cell membranes by drawing media through the filter. This rapid process proceeds at a rapid rate, wherein filtration and recovery of the fraction found can be achieved. Washing the filter with a buffer removes residual unbound ligand and any other ligands present that can be washed away from the binding sites. Receptor-ligand complexes present when the filter is washed will not dissociate significantly because they will be completely retained by the filter. The characteristics of the filter are important to every job being completed. Thicker filters are useful for more thorough recovery of small membranes, but may require longer washing times. It is recommended that the filter be pretreated to help retain the negatively charged membrane. Soaking the filter in a solution that will positively charge the filter surface will attract the negatively charged membrane fragments.
Affinity chromatography
Affinity chromatography is a method for separating biochemical mixtures based on highly specific interactions, such as the interaction between an antigen and an antibody, an enzyme and a substrate, or a receptor and a ligand. The stationary phase is typically a gel matrix, typically agarose; linear sugar molecules derived from algae. Typically, the starting point is an undefined heterogeneous set of molecules in solution, such as cell lysate, growth medium or serum. The target molecule will have well-known and well-defined properties and can be utilized during the affinity purification process. The process itself can be considered as a type of entrapment, wherein the target molecule is entrapped on a solid or stationary phase or medium. Other molecules in the mobile phase will not be trapped because they do not possess this property. The stationary phase can then be removed from the mixture, washed and the target molecule released from the retentate in a process called elution. The most common use of affinity chromatography is for the purification of recombinant proteins.
Immunoaffinity: another use of this procedure is the affinity purification of antibodies from serum. If the serum is known to contain antibodies to a specific antigen (e.g., if the serum is from an organism immunized against the relevant antigen), it can be used for affinity purification of that antigen. This is also known as immunoaffinity chromatography. For example, if an organism is immunized against a GST fusion protein, the organism will produce antibodies to the fusion protein, and possibly also to the GST tag. The protein may then be covalently coupled to a solid support, such as agarose, and used as an affinity ligand for the purification of antibodies from immune sera. For complete purification, the GST protein and GST fusion protein may each be coupled separately. The serum was initially allowed to bind to the GST affinity matrix. This will remove the antibody directed against the GST portion of the fusion protein. The serum is then separated from the solid support and bound to a GST fusion protein matrix. This allows any antibody recognizing the antigen to be captured on the solid support. Elution of the target antibody is most often achieved using a low pH buffer (such as glycine pH 2.8). The eluate is collected into neutral tris or phosphate buffer to neutralize the low pH elution buffer and prevent any degradation of antibody activity. This is a good example, because affinity purification is used to purify the initial GST fusion protein, remove unwanted anti-GST antibodies from serum, and purify the target antibody. Simplified strategies are often employed to purify antibodies raised against peptide antigens. When a peptide antigen is synthetically produced, a terminal cysteine residue is added at the N-terminus or C-terminus of the peptide. The cysteine residue contains a thiol functionality that allows the peptide to be easily conjugated to a carrier protein, such as Keyhole Limpet Hemocyanin (KLH). The same cysteine-containing peptide was also immobilized on agarose resin via cysteine residues and then used to purify the antibody. Most monoclonal antibodies have been purified using affinity chromatography based on immunoglobulin-specific protein a or protein G derived from bacteria.
Immunocytochemistry (ICC)
Immunocytochemistry (ICC) is a common laboratory technique for anatomically visualizing the localization of a specific protein or antigen in a cell by using specific primary antibodies that bind to the protein or antigen. When the primary antibody is bound by a secondary antibody with a conjugated fluorophore, the primary antibody allows the protein to be viewed under a fluorescent microscope. ICC allows researchers to assess whether cells in a particular sample express the antigen in question. In the case of an immune positive signal, ICC also allows researchers to determine which subcellular compartments are expressing the antigen. There are many ways to perform an immunoassay on a sample, including methods directly related to primary antibodies or antisera. Direct methods include applying a detectable label (e.g., a fluorescent molecule, gold particle, etc.) directly to the antibody, which is then bound to an antigen (e.g., a protein) in the cell. Alternatively, there are many indirect methods. In one such method, the antigen is bound by a primary antibody and then amplified by using a secondary antibody that binds to the primary antibody. Next, a tertiary reagent containing an enzyme moiety is applied and binds to the secondary antibody. When the quaternary reagent or substrate is applied, the enzymatic end of the tertiary reagent converts the substrate to a pigment reaction product, thereby producing a color (possibly multiple colors; brown, black, red, etc.) at the same location where the original primary antibody recognizes the antigen of interest. Some examples of substrates used (also called chromophores) are AEC (3-amino-9-ethylcarbazole) or DAB (3, 3' -diaminobenzidine). Use of one of these reagents after exposure to the necessary enzyme (e.g., horseradish peroxidase conjugated to antibody reagents) produces a positive immunoreaction product. Immunocytochemical visualization of target-specific antigens can be used when less specific stains such as H & E (hematoxylin and eosin) cannot be used for the diagnosis to be performed or to provide additional prognostic information about the treatment (e.g., in certain cancers). Alternatively, the secondary antibody may be covalently linked to a fluorophore that is detected in a fluorescent or confocal microscope (FITC and rhodamine are the most common). The location of fluorescence will vary depending on the target molecule, externally against membrane proteins and internally against cytoplasmic proteins. Thus, immunofluorescence is a powerful technique when used in combination with confocal microscopy to study the location and dynamic processes of proteins (exocytosis, endocytosis, etc.).
Analysis of Gene expression profiles
Exemplary gene expression profiling techniques that can be utilized include DNA profiling with PCR, DNA microarray, SAGE, real-time PCR, differential display PCR, and RNA-seq, as further described in the sections below and known in the art.
DNA profiling Using PCR
The Polymerase Chain Reaction (PCR) process mimics the biological process of DNA replication, but confines it to a target-specific DNA sequence. With the invention of PCR technology, DNA profiling has made great progress in both the ability to distinguish between and recover information from very small (or degenerated) starting samples. PCR greatly amplifies the number of specific regions of DNA. During PCR, a DNA sample is denatured into individual polynucleotide strands by heating. The use of two oligonucleotide DNA primers hybridizes to two corresponding adjacent sites on opposing DNA strands in such a way that normal enzymatic extension of the active end (i.e., the 3' end) of each primer proceeds toward the other primer. PCR uses a thermostable replicase, such as thermostable Taq polymerase. In this way, two new copies of the target sequence are generated. In this way, repeated denaturation, hybridization and extension produce exponentially increasing copy numbers of the target DNA. Instruments for performing thermal cycling are now readily available from commercial sources. This process can produce millions of amplifications or more of the desired region in 2 hours or less.
DNA microarray
The core principle behind microarrays is the hybridization between two DNA strands, the property of complementary nucleic acid sequences to specifically pair with each other by forming hydrogen bonds between complementary nucleotide base pairs. The large number of complementary base pairs in the nucleotide sequence means a tighter non-covalent bond between the two strands. After washing away the non-specific binding sequences, only strongly paired strands will remain hybridized. The fluorescently labeled target sequence bound to the probe sequence generates a signal that depends on the hybridization conditions (such as temperature) and post-hybridization washes. The total intensity of the signal from a spot (feature) depends on the amount of target sample bound to the probe present at that spot. Microarrays use relative quantitation, where the intensity of a feature is compared to the intensity of the same feature under different conditions, and the identity of the feature is known by its location.
Gene expression Series Analysis (SAGE)
Serial Analysis of Gene Expression (SAGE) is a technique used by molecular biologists to generate snapshots of messenger RNA populations in a target sample in the form of small tags corresponding to those transcript fragments. Briefly, SAGE experiments were performed as follows:
mRNA from an input sample (e.g., tumor) is isolated and cDNA is synthesized from the mRNA using reverse transcriptase and biotinylated primers.
The cDNA is bound to streptavidin beads by interaction with biotin attached to primers, and then cleaved using a restriction endonuclease called an Anchor Enzyme (AE). For each individual cDNA (mRNA), the position of the cleavage site will be different, and thus the length of the remaining cDNA bound to the beads will be different.
The cleaved cDNA downstream of the cleavage site is then discarded, and the remaining fixed cDNA fragment upstream of the cleavage site is divided in half and exposed to one of two adaptor oligonucleotides (a or B) comprising several components in the following order upstream of the ligation site: 1) sticky ends with AE cleavage sites to allow ligation to the cleaved cDNA; 2) a recognition site for a restriction endonuclease called a marker enzyme (TE) that cleaves about 15 nucleotides downstream of its recognition site (within the original cDNA/mRNA sequence); 3) short primer sequences unique to linker A or B will be used later for further amplification by PCR.
After adaptor ligation, the cdnas were cleaved using TE to remove them from the beads, leaving only a short "tag" of about 11 nucleotides of the original cDNA (15 nucleotides minus 4 nucleotides corresponding to the AE recognition site).
The cleaved cDNA tags are then repaired with DNA polymerase to generate blunt-ended cDNA fragments.
These cDNA tag fragments (with adapter primers and ligated AE and TE recognition sites) were ligated, sandwiching the two tag sequences, and flanking adapters A and B at either end. These new constructs, called ditags, were then PCR amplified using anchor a and B specific primers.
The ditags were then cleaved using the original AE and allowed to ligate together with other ditags that would be ligated to create cDNA concatemers with each ditag separated by an AE recognition site.
These concatemers were then transformed into bacteria and amplified by bacterial replication.
cDNA concatemers can then be isolated and sequenced using modern high throughput DNA sequencers, and these sequences can be analyzed using a computer program that can quantify the recurrence of individual tags.
Real-time polymerase chain reaction
Real-time polymerase chain reaction is a molecular biology laboratory technique based on the Polymerase Chain Reaction (PCR). It monitors the amplification of the targeted DNA molecule in real time during PCR, rather than at its end as in conventional PCR. Real-time PCR can be used for quantification (quantitative real-time PCR); semi-quantitative, i.e., above/below a certain amount of DNA molecules (semi-quantitative real-time PCR) or qualitative (qualitative real-time PCR). Two common methods for detecting PCR products in real-time PCR are: (1) a non-specific fluorescent dye into which any double-stranded DNA is inserted, and (2) a sequence-specific DNA probe consisting of an oligonucleotide labeled with a fluorescent reporter gene that can be detected only after hybridization of the probe to its complementary sequence. Real-time PCR is performed in a thermal cycler that is capable of illuminating each sample with at least one light beam of a specific wavelength and detecting the fluorescence emitted by the excited fluorophores. The thermal cycler also enables rapid heating and cooling of the sample, thereby taking advantage of the physicochemical properties of nucleic acids and DNA polymerases. The PCR process typically consists of a series of temperature changes that are repeated 25 to 50 times. Normally, these cycles consist of three phases: a first stage, at around 95 ℃, to allow the double strands to separate; a second stage of allowing the primer to bind to the DNA template at a temperature of about 50-60 ℃; the third stage, between 68 and 72 ℃, promotes polymerization by DNA polymerase. Due to the small size of the fragments, the last step is usually omitted in this type of PCR, since the enzymes are able to increase their number during the change between the alignment phase and the denaturation phase. Furthermore, in the four-step PCR, fluorescence is measured during a short temperature phase lasting only a few seconds in each cycle, wherein the temperature is, for example, 80 ℃, in order to reduce the signal caused by the presence of primer dimers when non-specific dyes are used. The temperature and time used per cycle depend on various parameters such as: an enzyme for synthesizing DNA, concentrations of divalent ions and deoxyribonucleotides (dNTPs) in a reaction, and a binding temperature of a primer.
Differential display PCR
Differential display (also known as DDRT-PCR or DD-PCR) is a technique in which researchers can compare and identify gene expression changes at the mRNA level between any pair of eukaryotic cell samples. The assay can be extended to more than one pair if desired. Paired samples will have morphological, genetic or other experimental differences for which researchers wish to study gene expression patterns and elucidate the underlying causes of specific differences or experimentally affected specific genes. The concept of differential display is to use a limited number of arbitrary short primers in combination with an anchored oligo-dT primer to systematically amplify and visualize most of the mRNA in a cell. After the early 1990's invention, differential display became a common technique for identifying differentially expressed genes at the mRNA level. Different improved DD-PCR protocols have been proposed, including fluorescent DD processes and radiolabelling, which provide high accuracy and reading.
RNA sequencing (RNA-seq)
RNA sequencing (RNA-seq), also known as Whole Transcriptome Shotgun Sequencing (WTSS), is a technique that uses the ability of next generation sequencing to reveal snapshots of the presence and quantity of RNA in a genome at a given point in time.
RNA 'poly (a)' library RNA-seq: in high throughput sequencing, the creation of sequence libraries can vary from platform to platform, with each platform having several kits designed to construct different types of libraries and tailor the resulting sequences to the specific requirements of their instrument. However, there is commonality with each technique due to the nature of the template being analyzed. Generally, in mRNA analysis, the 3' polyadenylation (poly (a)) tail is targeted in order to ensure that coding RNA is separated from non-coding RNA. This can be done simply by covalently linking to a given substrate a poly (T) oligonucleotide. Currently, many studies utilize magnetic beads to perform this step. Studies of the transcriptome portion including poly (A) RNA have shown that when poly (T) magnetic beads are used, the flow-through RNA (non-poly (A) RNA) can produce important non-coding RNA gene findings that would otherwise be lost and unnoticed. Moreover, since ribosomal RNA accounts for over 90% of RNA in a given cell, studies have shown that removal of ribosomal RNA by probe hybridization increases the ability to retrieve data from the remainder of the transcriptome. The next step is reverse transcription. Hydrolysis of RNA to 200-300 nucleotides prior to reverse transcription reduces both problems due to the 5' bias of random primer reverse transcription and secondary structure affecting the primer binding site. However, there are some trade-offs in this approach, and although the entire transcript is efficiently converted to DNA, the conversion rates at the 5 'and 3' ends are low. Depending on the purpose of the study, the researcher may choose to apply or omit this step.
Small RNA/non-coding RNA sequencing: when sequencing RNA other than mRNA, library preparation was modified. The cellular RNA is selected based on the desired size range. For small RNA targets, such as mirnas, RNA is isolated by size selection. This can be done using size exclusion gels, by volume selective magnetic beads or using commercially developed kits. Once isolated, linkers are added to the 3 'and 5' ends and then purified. The final step is the generation of cDNA by reverse transcription.
Direct RNA sequencing: since the use of reverse transcriptase to convert RNA to cDNA has been shown to introduce bias and artifacts that may interfere with proper characterization and quantification of transcripts, Helicos (now bankruptcy) is developing single molecule Direct RNA Sequencing (DRSTM) technology. DRSTM sequences RNA molecules directly in a massively parallel manner without the need to convert RNA to cDNA or other biased sample manipulations such as ligation and amplification. Once the cDNA is synthesized, it can be further fragmented to achieve the desired fragment length for the sequencing system.
(protein) Mass Spectrometry
Protein mass spectrometry refers to the application of mass spectrometry to the study of proteins. Mass spectrometry is an important emerging method for characterizing proteins. Two major methods for ionizing whole proteins are electrospray ionization (ESI) and matrix-assisted laser desorption/ionization (MALDI). To keep pace with the performance and mass range of available mass spectrometers, two methods are used to characterize proteins. First, intact proteins are ionized by either of the two techniques described above and then introduced into a mass analyzer. This approach is called the "top-down" strategy of protein analysis. In the second case, a protease (such as trypsin) is used to enzymatically digest the protein into smaller peptides. These peptides are then introduced into a mass spectrometer and identified by peptide mass fingerprinting or tandem mass spectrometry. Thus, the latter approach (also known as "bottom-up" proteomics) uses identification at the peptide level to infer the presence of proteins. Whole protein mass analysis is mainly performed using time of flight (TOF) MS or fourier transform ion cyclotron resonance (FT-ICR). Both types of instruments are preferred here because of their wide mass range and their high mass accuracy in the case of FT-ICR. Mass analysis of proteolytic peptides is a more popular method of protein characterization because characterization can be performed using cheaper instrument designs. In addition, sample preparation is easier once the entire protein is digested into smaller peptide fragments. The most widely used peptide mass analysis instruments are MALDI time-of-flight instruments because they allow the acquisition of Peptide Mass Fingerprints (PMFs) at high speed (1PMF can be analyzed in about 10 seconds). Multi-stage quadrupole time-of-flight and quadrupole ion traps may also be used for this application.
Mass spectrometry CMS has been increasingly used for bioanalytical analysis. Mass spectrometry is well suited for multiplexing because mass discrimination allows multiple simultaneous detection channels. However, complex biological molecules, such as DNA, have a complex mass spectrum that may be difficult to detect in the matrix due to relatively poor sensitivity. MS is an analytical technique for measuring the mass-to-charge ratio of charged species. It can be used to determine the chemical composition of a sample or molecule. A sample analyzed by mass spectrometry is ionized to generate charged molecules or atoms, separated according to their mass-to-charge ratio, and detected. This technique is used qualitatively and quantitatively, depending on the application. Inductively coupled plasma (OCP) is a type of plasma source in which energy is provided by a current generated by electromagnetic induction, i.e., by a time-varying magnetic field. ICP can be used as an ionization source for mass spectrometry. The combination of inductively coupled plasma and mass spectrometry is called ICP-MS. Mass Spectrometry Imaging (MSI) is an application of mass spectrometry that involves analyzing chemical information using spatial information so that the chemical information can be visualized as a chemical image or map. By generating a chemical map, the compositional differences of the sample surface can be elucidated. Laser ablation is the process of removing material from a solid surface by irradiating the solid surface with a laser beam. Laser ablation has been used as a means of sampling materials for mass spectrometry, particularly mass spectrometry imaging. According to one embodiment, a system for mass spectrometry imaging of a sample includes a laser ablation sampler, an inductively coupled plasma ionizer, a mass spectrometer, and a computer. Illustratively, a laser ablation sampler includes a laser, a laser ablation chamber, and a sample platform configured such that the laser can irradiate a sample positioned on the sample platform to form an ablated sample, wherein the laser and the sample platform are coordinated by a computer. The laser ablation sampler is operably connected to the inductively coupled plasma ionizer such that the ablated sample can be transferred from the laser ablation sampler into the inductively coupled plasma ionizer, thereby vaporizing, atomizing and ionizing the ablated sample to form a population of atomic ions having a mass-to-charge ratio distribution. The mass spectrometer is operably connected to the inductively coupled plasma ionizer such that a group of ions can be transferred from the inductively coupled plasma ionizer to the mass spectrometer, wherein the mass spectrometer separates the group of ions according to a mass-to-charge ratio distribution, thereby generating mass-to-charge ratio data. The computer is configured to receive a position input and communicate with the laser ablation sampler to ablate the sample according to the position input, and it is configured to associate mass-to-charge ratio data with a position on the sample according to the position input. In a further illustrative embodiment, the system further comprises a registration system configured to determine a location of the sample, thereby implementing the automatic association of the location input with the location on the sample, wherein the laser is configured to illuminate the location. In an illustrative embodiment, a composition for multiplex sample LA-ICP-MS assays includes a mass label and a specific binding moiety conjugated to the mass label. The mass tag includes a first population of atoms that is detectably different from endogenous elements of the sample. In one embodiment, the first population of atoms is a non-endogenous stable isotope of an element. In another embodiment, the atomic groups are configured as colloidal particles. See WO2014079802, which is incorporated herein by reference in its entirety.
A method for detecting a target in a sample involves contacting the sample with an enzyme-specific binding moiety conjugate selected to recognize the target. The sample is then contacted with a mass tag precursor conjugate comprising a mass tag precursor and an enzyme substrate, a tyramine moiety or tyramine derivative, and optionally a linker. The mass tag precursor conjugate is reacted with an enzyme or a product of an enzymatic reaction to produce a precipitated mass tag, a covalently bound mass tag, or a non-covalently bound mass tag. The sample is exposed to an energy source that provides sufficient energy to generate a mass code from the mass label. After ionization, the mass code can be detected using a detection method such as mass spectrometry. In some embodiments, the sample is exposed to a first solution comprising an enzyme-specific binding moiety conjugate and a second solution comprising a mass tag precursor conjugate. The enzyme portion of the enzyme-specific binding moiety may be selected from the group consisting of oxidoreductases (e.g., peroxidases), phosphatases (e.g., alkaline phosphatase), lactamases (e.g., beta-lactamases), and galactosidases (e.g., beta-D-galactosidases, beta-galactosidases). The specific binding member may be selected from the group consisting of proteins, polypeptides, oligopeptides, peptides, nucleic acids, DNA, RNA, oligosaccharides, polysaccharides and monomers thereof. Certain disclosed embodiments relate to the use of alkaline phosphatase-antibody conjugates and horseradish peroxidase-antibody conjugates. In some disclosed embodiments, the specific binding member recognizes a target. In other disclosed embodiments, the specific binding member recognizes a primary antibody that binds to the target. In some embodiments, depositing the mass label comprises immobilizing the enzyme at the target and contacting the sample with the enzyme substrate portion and the mass label precursor. The enzyme substrate portion reacts with the enzyme and the mass tag precursor to produce and deposit the mass tag on the target. When two or more targets are present in the sample, mass labels are deposited on each target in the order described above. After deposition of a mass label, the corresponding enzyme is inactivated before deposition of a subsequent mass label at a subsequent target. In other disclosed embodiments, the enzyme is reacted with a mass tag precursor-tyramine conjugate or a mass tag precursor-tyramine derivative conjugate to deposit the mass tag, typically covalently, in proximity to the target. In some embodiments, immobilizing the enzyme at the target comprises contacting the sample with a conjugate comprising a specific binding moiety and the enzyme. In certain embodiments, the specific binding member is an antibody. The specific binding member is capable of recognizing and binding directly to the target or another specific binding member previously bound to the target. In particular embodiments, the first enzyme, the second enzyme, and any additional enzyme are the same. See WO2012003478, which is incorporated herein by reference in its entirety.
DNA methylation detection
In recent years, methods for diagnosing cancer by measuring DNA methylation have been proposed. DNA methylation occurs primarily at the cytosine of CpG islands in the promoter region of a specific gene to interfere with transcription factor binding and thus silence gene expression. Therefore, detection of methylation of CpG islands in tumor suppressor gene promoters is of great help for cancer research. In recent years, determination of promoter methylation by methods such as methylation specific PCR (hereinafter referred to as MSP) or automated DNA sequencing has been actively attempted for diagnosis and screening of cancer. See WO2009069984a2, which is incorporated herein by reference in its entirety.
Acoustic energy
At least some embodiments relate to methods and systems for analyzing a specimen. The sample may be analyzed according to its properties. These properties include acoustic properties, mechanical properties, optical properties, etc., which may be static or dynamic during processing. In some embodiments, the properties of the specimen are monitored continuously or periodically during processing to assess the state and condition of the specimen. Based on the obtained information, processing can be controlled to enhance processing consistency, reduce processing time, improve processing quality, and the like. Acoustics can be used to analyze soft objects, such as samples. When an acoustic signal interacts with a sample, the transmitted signal depends on several mechanical properties of the sample, such as elasticity and robustness. As the degree of cross-linking of the sample that has been placed in a fixative (e.g., formalin) becomes higher, the transport speed will vary depending on the nature of the sample. In some embodiments, the state of the biological sample may be monitored based on the time of flight of the acoustic wave. The state may be a density state, a fixed state, a dyed state, or the like. Monitoring may include, but is not limited to, measuring changes in sample density, cross-linking, decalcification, staining, and the like. The biological sample may be a non-fluid sample, such as bone, or other type of sample. In some embodiments, methods and systems relate to monitoring a specimen using acoustic energy. Based on the interaction between the acoustic energy in the reflection mode and/or the transmission mode, information about the specimen may be obtained. Acoustic measurements can be made. Examples of measurements include acoustic signal amplitude, attenuation, scattering, absorption, time of flight (TOF), phase shift of acoustic waves, or combinations thereof in the sample. In some embodiments, the properties of the specimen change during processing. In some embodiments, a fixative is applied to the specimen. As the specimen becomes more stationary, the mechanical properties (e.g., elasticity, stiffness, etc.) change due to molecular cross-linking. These changes can be monitored by TOF using sound speed measurements. Based on the measurements, the fixation state or other histological state of the specimen may be determined. To avoid under-fixation or over-fixation, the static characteristics of the sample, the dynamic characteristics of the sample, or both, may be monitored. The characteristics of the sample include transmission characteristics, reflection characteristics, absorption characteristics, attenuation characteristics, and the like. In certain embodiments, the method for evaluating a sample includes analyzing acoustic wave velocity before, during, and/or after sample processing. This is performed by first establishing a baseline measurement for a fresh, unfixed sample by transmitting sound waves from a transmitter to the sample taken from the subject. The baseline TOF acoustic wave is detected using a receiver. After or during processing of the sample, a second acoustic wave is transmitted from the emitter to the sample. After the second acoustic wave has passed through the sample, the second TOF acoustic wave is detected using the receiver. The speed of sound in the sample is compared based on the first TOF and the second TOF to determine a change in speed. These measurements may be unique for each sample analyzed and thus used to establish a baseline for each sample. Additional TOF measurements can be used to determine TOF contributions attributable to the medium, measurement channels, and the like. In some embodiments, the TOF of the medium is measured when the specimen is not present to determine a baseline TOF of the medium. See WO2011109769, which is incorporated by reference herein in its entirety.
Lipidomics
Lipidomics studies involve the identification and quantification of thousands of cellular lipid molecular species and their interactions with other lipids, proteins, and other metabolites. In lipidomics, researchers examine the structure, function, interactions and kinetics of cellular lipids as well as changes that occur during system perturbations. Lipidomic analysis techniques may include Mass Spectrometry (MS), Nuclear Magnetic Resonance (NMR) spectroscopy, fluorescence spectroscopy, dual polarization interferometry, and computational methods. In lipidomics studies, data quantitatively describing the spatiotemporal variation of the content and composition of different lipid molecular species are generated by the change in the physiological or pathological state of cells after they have been perturbed. The information obtained from these studies is helpful in understanding changes in cell function.
Quantification of immune cells
Immune cells in a sample can be quantified by using quantitative real-time PCR-assisted cell counting (qpac) based on epigenetics. The methylation state of chromatin structure of actively expressed or silenced genes is the basis of epigenetic-based cellular identification and quantification techniques. The discovery of cell types that specifically remove the methyl group (demethylated) from the 5' -carbon of the cytosine base in dinucleotide cytosine phosphate guanine allows for accurate and robust quantification of immune cells from only a small sample of human blood or tissue. These epigenetic biomarkers located on genomic DNA are stably associated with the target cells. Kleen and Yuan (11.2015), "Quantitative real-time PCR assisted cell counting (qPACC) for oligomeric-based immune cell quantification in blood and tissue". J.Immunother. cancer 46(3).
Detection of cancer-associated markers
Detection of "tumor markers" using techniques such as, but not limited to, RNA, DNA or protein sequencing, including, but not limited to, proteins, antigens, enzymes, hormones, DNA mutations associated with the presence of cancerAnd carbohydrates, are important for the correct diagnosis of the type of cancer and for the selection of an appropriate treatment. Such markers include, but are not limited to: alpha-fetoprotein (typically associated with, but not limited to, germ cell tumors and hepatocellular carcinoma), CA 15-3 (typically associated with, but not limited to, breast cancer), CA27-29 (typically associated with, but not limited to, breast cancer), CA19-9 (typically associated with, but not limited to, prostate cancer, colorectal cancer, and other types of gastrointestinal cancers), CA-125 (typically associated with, but not limited to, ovarian cancer, endometrial cancer, fallopian tube cancer, lung cancer, breast cancer, and gastrointestinal cancer), calcitonin (typically associated with, but not limited to, medullary thyroid cancer), calcium-binding protein (typically associated with, but not limited to, mesothelioma, gonadal-interstitial tumor, adrenocortical carcinoma, synovial sarcoma), carcinoembryonic antigen (typically associated with, gastrointestinal cancer, cervical cancer, lung cancer, ovarian cancer, breast cancer, urinary tract cancer, but not limited to), CD34 (typically associated with but not limited to, hemangiopericytoma/solitary fibrous tumor, lipoma multiforme, gastrointestinal stromal tumor, dermatofibrosarcoma protruberans), CD99MIC 2 (typically associated with but not limited to Ewing's sarcoma, primitive neuroectodermal tumor, hemangiopericytoma/solitary fibrous tumor, synovial sarcoma, lymphoma, leukemia, gonadal-gonadal stromal tumor), CD117 (typically associated with but not limited to gastrointestinal stromal tumor, mastocytosis, seminoma), chromogranin (typically associated with but not limited to neuroendocrine tumor), chromosomes 3, 7, 17 and 9p21 (typically associated with but not limited to bladder cancer), various types of cytokeratins (typically associated with but not limited to many types of cancer and some types of sarcoma), and, Myoglobin (typically associated with, but not limited to, leiomyosarcoma, skeletal myosarcoma, and endometrial interstitial sarcoma), epithelial membrane antigen (typically associated with, but not limited to, multiple types of cancer, meningioma, and some types of sarcoma), factor VIII/CD31FL1 (typically associated with, but not limited to, angiosarcoma), glifibril acidic protein (typically associated with, but not limited to, glioma (astrocytoma, ependymoma)), and macrocystic disease liquid protein (typically associated with breast cancer, ovarian cancer, and salivary gland carcinoma) But are not limited to, HMB-45 (typically associated with melanoma, PEComa (e.g., vascular smooth muscle lipoma), clear cell carcinoma, adrenocortical carcinoma), human chorionic gonadotropin (typically associated with, but not limited to, gestational trophoblastic disease, germ cell tumor, and choriocarcinoma), immunoglobulin (typically associated with, but not limited to, lymphoma, leukemia), inhibin (typically associated with, but not limited to, gonadal stromal tumor, adrenocortical carcinoma, hemangioblastoma), multiple types of keratin (typically associated with, but not limited to, carcinoma, some types of sarcoma), multiple types of lymphocyte markers (typically associated with, but not limited to, lymphoma, leukemia), MART-1(Melan-A) (typically associated with melanoma, steroid-producing tumors (adrenocortical carcinoma), MARB-45 (typically associated with, but not limited to, melanoma, and adrenocortical carcinoma), and choriocarcinoma, Gonadal tumor), Myo D1 (typically associated with, but not limited to, rhabdomyosarcoma, small, round, blue cell tumor), muscle-specific actin (MSA) (typically associated with, but not limited to, myosarcoma (leiomyosarcoma, rhabdomyosarcoma), neurofilament (typically associated with, but not limited to, neuroendocrine tumor, small cell carcinoma of lung), neuron-specific enolase (typically associated with, but not limited to, neuroendocrine tumor, small cell carcinoma of lung, breast cancer), placental alkaline phosphatase (PLAP) (typically associated with, but not limited to, seminoma, dysgerminoma, embryonic carcinoma), prostate-specific antigen (typically associated with, but not limited to, prostate cancer), PTPRC (CD45) (typically associated with, but not limited to, lymphoma, leukemia, histiocytic tumor), Myo tumor, Myo, and Myo, S100 protein (typically associated with melanoma, sarcoma (neurosarcoma, lipoma, chondrosarcoma), astrocytoma, gastrointestinal stromal tumor, salivary gland cancer, some types of adenocarcinoma, histiocytic tumor (dendritic cell, macrophage), but not limited thereto), Smooth Muscle Actin (SMA) (typically associated with gastrointestinal stromal tumor, smooth muscle tumor, PEComa, but not limited thereto), synaptophysin (typically associated with neuroendocrine tumor, but not limited thereto), thyroglobulin (typically associated with postoperative marker of thyroid cancer, but not limited thereto), thyroid transcription factor-1 (typically associated with all types of thyroid cancer, lung cancer, but not limited thereto) This), tumors M2-PK (typically associated with, but not limited to, colorectal, breast, renal cell, lung, pancreatic, esophageal, gastric, cervical, ovarian cancers), vimentin (typically associated with, but not limited to, sarcoma, renal cell carcinoma, endometrial, lung, lymphoma, leukemia, melanoma), ALK gene rearrangement (typically associated with, but not limited to, non-small cell lung cancer and anaplastic large cell lymphoma), β -2-microglobulin (B2M) (typically associated with, but not limited to, multiple myeloma, chronic lymphocytic leukemia and some lymphomas), β -human choriogonadotropin (Beta-hCG) (typically associated with, but not limited to, choriocarcinoma and germ cell tumors), BRCA1 and BRCA2 gene mutations (typically associated with, but not limited to, ovarian cancers) BCR-ABL fusion gene (Philadelphia chromosome) (typically associated with, but not limited to, chronic myelogenous leukemia, acute lymphoblastic leukemia, and acute myelogenous leukemia), BRAF V600 mutation (typically associated with, but not limited to, cutaneous melanoma and colorectal cancer), CD20 (typically associated with, but not limited to, non-Hodgkin's lymphoma), chromogranin A (CgA) (typically associated with, but not limited to, neuroendocrine tumors), circulating tumor cells of epithelial origin  (typically associated with, but not limited to, metastatic breast, prostate and colorectal cancer), cytokeratin fragment 21-1 (typically associated with, but not limited to, lung cancer), EGFR gene mutation analysis (typically associated with, but not limited to, non-small cell lung cancer), Estrogen Receptor (ER)/Progestin Receptor (PR) (typically associated with, but not limited to, breast cancer), HE4 (typically associated with, but not limited to, ovarian cancer), KRAS gene mutation analysis (typically associated with, but not limited to, colorectal cancer and non-small cell lung cancer), lactate dehydrogenase (typically associated with, but not limited to, germ cell influx, lymphoma, leukemia, melanoma and neuroblastoma), neuron-specific enolase (NSE) (typically associated with, but not limited to, small cell lung cancer and neuroblastoma), nuclear matrix protein 22 (typically associated with, but not limited to, bladder cancer, but not limited to), programmed death ligand 1 (PD-L1)) (typically associated with, but not limited to, non-small cell lung cancer), urokinase plasminogen activator (uPA) and plasminogen activator inhibitor (PAT-1) (typically associated with, but not limited to, breast cancer), 5-protein signature
 (commonly associated with ovarian cancer, but not limited thereto), 21-Gene signature (Oncotype)
  ) (commonly associated with breast cancer), 70-Gene signature
 (typically associated with, but not limited to, breast cancer) and HER2/neu gene amplification or overexpression (typically associated with, but not limited to, breast cancer, ovarian cancer, esophageal-gastric junction adenocarcinoma, gastric cancer, non-small cell lung cancer, and uterine cancer). Additional biomarkers associated with tumors may include, but are not limited to: pl3KCA mutation, FGFR2 amplification, p53 mutation, BRCA mutation, CCND1 amplification, MAP2K4 mutation, ATR mutation, or any other biomarker whose expression is associated with a particular cancer; at least one of AFP, ALK, BCR-ABL, BRCA1/BRCA2, BRAF, V600E, Ca-125, CA19.9, EGFR, Her-2, KIT, PSA, S100, KRAS, ER/Pr, UGT1A1, CD30, CD20, F1P1L1-PDGRF α, PDGFR, TMPT, and TMPRSS 2; or at least one biomarker selected from: ABCB5, AFP-L3, alpha-fetoprotein, alpha-methylacetyl-CoA racemase, BRCA1, BRCA2, CA15-3, CA 242, Ca 27-29, CA-125, CA15-3, CA19-9, calcitonin, carcinoembryonic antigen peptide-1, des-gamma-carboxyprothrombin, early prostate cancer antigen-2, estrogen receptor, fibrin degradation products, glucose-6-phosphate isomerase, HPV antigens (such as vE6, E7, L1, L2, or p16INK4a), human chorionic gonadotropin, IL-6, keratin 19, lactate dehydrogenase, leucylaminopeptidase, lipotropin, norepinephrine, neprilysin, NMP22, norepinephrine, PCA3, prostate specific antigen, prostatic acid phosphatase, synaptophysin, thyroglobulin, TNF, selected from ERG, ETV1(ER81), FLI1, ETS1, ETS2, ELK1, ETV6(TEL1), ETV7(TEL2), GABP alpha, ELF1, ETV4(E1 AF; PEA3), ETV5(ERM), ERF, PEA3/E1AF, PU.1, ESE1/ESX, SAP1(ELK4), ETV3(METS), EWS/FLI1, ESE1, ESE2(ELF5), ESE3, PDEF, NET (ELK 3; SAP2), NERF (ELF2) or FEV. XXX, tumor associated glycoprotein 72, c-kit, SCF, pAKT, pc-kit and vimentin. Alternatively or additionally, the biomarker of interest may be an immune checkpoint inhibitor, such as but not limited to CTLA-4, PDL1, PDL2, PD1, B7-H3, B7-H4, BTLA, HVEM, KIR, TIM3, GAL9, GITR, LAG3, VISTA, KIR, 2B4, TRPO2, CD160, CGEN-15049, CHK1, CHK2, A2aR, TL1A and B-7 family ligands or combinations thereof, or a ligand of a checkpoint protein selected from the group consisting of: CTLA-4, PDL1, PDL2, PD1, B7-H3, B7-H4, BTLA, HVEM, TIM3, GAL9, LAG3, VISTA, KIR, 2B4, CD160, CGEN-15049, CHK1, CHK2, A2aR, B-7 family ligands, or a combination thereof. Additional markers may include, but are not limited to, detecting at least one biomarker associated with: acute lymphoblastic leukemia (etv6, am11, cyclophilin B), B-cell lymphoma (Ig-idiotype), glioma (E-cadherin, alpha-catenin, beta-catenin, gamma-catenin, p120cm), bladder cancer (p21ras), biliary tract cancer (p21ras), breast cancer (MUC family, HER2/neu, C-erbB-2), cervical cancer (p53, p21ras), colon cancer (p21ras, HER2/neu, C-B-2, MUC family), colorectal cancer (colorectal-associated antigen (CRC) -C017-1A/GA733, APC), Choriocarcinoma (CEA), epithelial cell cancer (cyclophilin B), gastric cancer (HER2/neu, C-erbB-2, 733 GA), hepatocellular carcinoma (alpha-fetoprotein), Hodgkin lymphoma (Imp-1), lymphoma (Imp-1-2-erb), lymphoma, EBNA-1), lung cancer (CEA, MAGE-3, NY-ESO-1), lymphoid cell-derived leukemia (cyclophilin b), melanoma (p5 protein, gp75, carcinoembryonic antigen, GM2 and GD2 gangliosides, Melan-A/MART-1, cdc27, MAGE-3, p21ras, gp100.sup. Pmell 1l7), myeloma (MUC family, p21ras), non-small cell lung cancer (HER2/neu, c-erbB-2), nasopharyngeal carcinoma (Imp-1, EBNA-1), ovarian cancer (MUC family, HER2/neu, c-erbB-2), prostate cancer (prostate specific antigen (PSA) and its epitopes PSA-1, PSA-2 and PSA-3, PSM) A. HER2/neu, c-erbB-2, ga733 glycoprotein), renal cancer (HER2/neu, c-erbB-2), cervical and esophageal squamous cell carcinoma (viral products such as human papillomavirus protein), testicular cancer (NY-ESO-1), and/or T-cell leukemia (HTLV-1 epitope).
It is now known that specific aspects of precisely targeting the kinase cascade provide a previously unfeasible breakthrough for disease treatment. The importance of the protein kinase family is underscored by the numerous disease states resulting from dysregulated kinase activity. Abnormal cell signaling by many of these protein and lipid kinases can lead to diseases such as cancer. Several proteins, serine/threonine and tyrosine kinases, are known to be activated in cancer cells and to drive tumor growth and progression. The technology described herein provides methods for enriching (or isolating) kinases, such as ATP-dependent kinases, using one or more kinase capture agents. Examples of kinase capture agents include, but are not limited to, relatively non-selective protein kinase inhibitors, substrates, or pseudo-substrates. For example, these methods can be used to profile a kinase panel by tandem mass spectrometry. Although, as noted above, a number of highly selective and potent small molecule kinase inhibitors have been previously identified, a large number of relatively non-selective small molecule kinase inhibitors have also been identified. For the methods described herein, the use of relatively non-selective small molecule kinase inhibitors reduces the need to customize purification procedures for individual kinases and amplifies the analytical signals obtained by enriching for enzymes that are normally only present in catalytic concentrations in cells, tissues and body fluids. However, it will be appreciated that selective small molecule kinase inhibitors may also be useful in these kinase assays. In addition, combinations of non-selective and selective small molecule kinase inhibitors may be used in these methods. In addition, a kinase capture agent (or more than one kinase capture agent) may also be combined with a phosphatase capture agent to simultaneously enrich (or isolate) for both kinase and phosphatase. The methods described herein can also be applied to multiplex analysis of protein kinases and/or phosphatases from single or multiple targets by tandem mass spectrometry. The technology described herein provides a method for analyzing a kinase population, such as a kinase panel. The method comprises isolating kinases from a sample using one or more kinase capture agents, proteolytically digesting the protein sample into constituent peptides (e.g., with a protease such as trypsin), supplementing the obtained peptides with rationally designed calibration peptides related to a specific protein kinase peptide sequence comprising a cleavable aspartate-proline (DP) bond, and quantifying native peptides derived from the kinase population by tandem mass spectrometry. See WO2007131191, which is incorporated herein by reference in its entirety.
Affinity purification of specific cell types
Putative circulating tumor cells have now been reported in a variety of human tumors including AML, CML, multiple myeloma, brain tumors, breast tumors, melanoma and prostate, colon and gastric cancers. In principle, circulating tumor cells can be identified by several experimental strategies. Many circulating tumor cells appear to express cell surface markers that identify their normal counterparts. This observation provides a relatively simple enrichment procedure using flow cytometry-based cell sorting or bead-based cell affinity purification. See Schawb, m.encyclopedia of Cancer, 3 rd edition, Springer-Verlag Berlin Heidelberg, 2011.
DNA sequencing
In further exemplary embodiments, the sample or one or more cells thereof may be subjected to DNA sequencing. DNA sequencing can target, for example, specific genes, regions, regulatory sequences, introns, exons, SNPs, potential fusions, etc., e.g., to detect sequences associated with cancer or associated with its diagnosis. DNA sequencing can also be performed on the entire genome or significant portions thereof. Exemplary sequencing methods that can be utilized include, but are not limited to: sanger sequencing and dye terminator sequencing, as well as Next Generation Sequencing (NGS) technologies such as pyrosequencing, nanopore sequencing, microwell-based sequencing, nanosphere sequencing, MPSS, soid, Solexa, Ion Torrent, Starlite, SMRT, tSMS, sequencing-by-synthesis, sequencing-by-ligation, mass spectrometry sequencing, polymerase sequencing, RNA polymerase (RNAP) sequencing, microscope-based sequencing, microfluidic sanger sequencing, microscope-based sequencing, RNAP sequencing, tunnel current DNA sequencing, and in vitro virus sequencing. See WO2014144478, WO2015058093, WO2014106076, and WO2013068528, each of which is incorporated herein by reference in its entirety.
DNA sequencing technology has evolved exponentially. Recently, high throughput sequencing (or next generation sequencing) techniques parallelize the sequencing process, producing thousands or millions of sequences at a time. In ultra-high throughput sequencing, up to 500,000 sequencing-by-synthesis operations can be run in parallel. Next generation sequencing reduces cost and greatly increases speed compared to industry standard dye terminator methods.
Pyrosequencing amplifies DNA in water droplets in an oil solution (emulsion PCR), where each droplet contains a DNA template attached to a single primer-coated bead, and clonal colonies are formed. The sequencing machine contained many picoliter volume wells, each containing a single bead and sequencing enzyme. Pyrosequencing uses luciferase to generate light to detect individual nucleotides added to nascent DNA, and uses the combined data to generate sequence reads. See Margulies, M et al 2005, Nature, 437, 376-380, which is incorporated herein by reference in its entirety. Pyrosequencing is a sequencing-by-synthesis technique that also utilizes pyrosequencing. Pyrosequencing of DNA involves two steps. In the first step, the DNA is cleaved into fragments of approximately 300-800 base pairs and the fragments are blunt-ended. Oligonucleotide adaptors are then ligated to the ends of the fragments. The adaptors are used as primers for amplifying and sequencing the fragments. The fragments can be ligated to DNA capture beads, such as streptavidin-coated beads, using, for example, adaptor B comprising a 5' -biotin tag. Fragments attached to the beads were PCR amplified in droplets of an oil-water emulsion. The result is multiple copies of the clonally amplified DNA fragment on each bead. In the second step, the beads are captured in the wells (picoliter size). Pyrophosphoric acid sequencing was performed in parallel for each DNA fragment. The addition of one or more nucleotides generates an optical signal that is recorded by a CCD camera in the sequencing instrument. The signal intensity is proportional to the number of incorporated nucleotides. Pyrophosphate sequencing utilizes pyrophosphate (PPi) released upon addition of nucleotides. PPi is converted to ATP by ATP sulfurylase in the presence of adenosine 5' phosphate sulfate. Luciferase uses ATP to convert luciferin to oxyluciferin, which reaction produces Can be detected and analyzed. In another embodiment, pyrosequencing is used to measure gene expression. RNA pyrosequencing is used similarly to DNA pyrosequencing by attaching a partial rRNA gene sequencing application to beads and then placing the attachments into individual wells. The attached partial rRNA sequences were then amplified to determine the gene expression profile. The number of the shadow Marsh is that the shadow Marsh, Protocols in Methods in Molecular Biology,Vol.373,15-23(2007)。
another example of a sequencing technique that may be used is nanopore sequencing (Soni G V and Meller, A Clin Chem 53: 1996-2001, 2007, which is incorporated herein by reference in its entirety). A nanopore is a small hole, on the order of about 1 nanometer in diameter. The nanopore is immersed in a conducting fluid and an electrical potential is applied across the nanopore, creating a small current by conduction of ions through the nanopore. The amount of current flowing is sensitive to the size of the nanopore. As a DNA molecule passes through a nanopore, each nucleotide on the DNA molecule blocks the nanopore to a different degree. Thus, as a DNA molecule passes through a nanopore, a change in the current passing through the nanopore represents a reading of the DNA sequence. See, bayer, Clin chem.2015jan; 61(1): 25-31, which are incorporated herein by reference in their entirety.
Another example of a DNA and RNA detection technique that can be used is SOLIDTMTechnology (Applied Biosystems). SOLIDTMThe technical system is a sequencing technology based on connection, and can be used for massively parallel next-generation sequencing of DNA and RNA. In DNA SOLIDTMIn sequencing, genomic DNA is cut into fragments and adaptors are ligated to the 5 'and 3' ends of the fragments to generate a library of fragments. Alternatively, the mate pair library can be generated by ligating adaptors to the 5 'and 3' ends of the fragments, circularizing the fragments, digesting the circularized fragments to generate internal adaptors, and ligating adaptors to the 5 'and 3' ends of the resulting fragments. Next, a population of cloned beads is prepared in a microreactor comprising beads, primers, templates, and PCR components. After PCR, the template is denaturedThe beads are enriched to isolate beads with expanded template. The template on selected beads is 3' modified to allow bonding to a slide. The sequence can be determined by sequential hybridization and ligation of a portion of the random oligonucleotide to a centrally defined base (or base pair) identified by a specific fluorophore. After color is recorded, the ligated oligonucleotide is cleaved and removed, and the process is repeated.
In other embodiments, SOLiDTMSerial Analysis of Gene Expression (SAGE) was used to measure gene expression. Serial Analysis of Gene Expression (SAGE) is a method that allows quantitative analysis of a large number of gene transcripts simultaneously, without the need to provide separate hybridization probes for each transcript. First, a short sequence tag (about 10-14bp) is generated that contains sufficient information to uniquely identify the transcript, provided that the tag is obtained from a unique position in each transcript. Many transcripts are then linked together to form long sequence molecules that can be sequenced while revealing the identity of multiple tags. The expression pattern of any population of transcripts can be quantitatively assessed by determining the abundance of individual tags and identifying the genes corresponding to each tag. For more details, see, e.g., Velculescu et al, Science 270: 484487 (1995); and Velculescu et al, Cell 88: 24351 (1997, the contents of each are incorporated herein by reference in their entirety).
Another Sequencing technique that may be used includes, for example, Helicos True Single Molecule Sequencing (tSMS) (Harris T.D. et al (2008) Science 320: 106-. In the tSMS technique, a DNA sample is cleaved into strands of about 100 to 200 nucleotides, and a polyA sequence is added at the 3' end of each DNA strand. Each strand is labeled by the addition of a fluorescently labeled adenosine nucleotide. The DNA strands are then hybridized to a flow cell containing millions of oligo-T capture sites immobilized on the surface of the flow cell. The templates may have a density of about 1 hundred million templates/cm. The flow cell is then loaded into an instrument such as a HeliScope sequencer and a laser illuminates the flow cell surface to reveal the position of each template. The CCD camera can map the position of the template on the flow cell surface. The template fluorescent label is then cleaved and washed away. The sequencing reaction begins with the introduction of a DNA polymerase and a fluorescently labeled nucleotide. oligo-T nucleic acids were used as primers. The polymerase incorporates the labeled nucleotides into the primer in a template-directed manner. The polymerase and unincorporated nucleotides are removed. Templates that have been oriented to incorporate fluorescently labeled nucleotides are detected by imaging the flow cell surface. After imaging, the cleavage step removes the fluorescent tag and repeats the process with other fluorescently labeled nucleotides until the desired read length is reached. Sequence information was collected for each nucleotide addition step. Further description of tSMS is shown, for example, in the following documents: lapidus et al (U.S. patent No. 7,169,560), Lapidus et al (U.S. patent application No. 2009/0191565), Quake et al (U.S. patent No. 6,818,395), Harris (U.S. patent No. 7,282,337), Quake et al (U.S. patent application No. 2002/0164629), and braswavsky et al, pnas (usa), 100: 3960-.
Another example of a sequencing technique that can be used includes Single Molecule Real Time (SMRT) techniques by Pacific Biosciences to sequence DNA and RNA. In SMRT, each of the four DNA bases is linked to one of four different fluorescent dyes. These dyes are phosphorus linked. A single DNA polymerase is immobilized on the bottom of a Zero Mode Waveguide (ZMW) with a single template single-stranded DNA molecule. A ZMW is a confinement structure that enables the incorporation of a single nucleotide by a DNA polymerase to be observed in the background of fluorescent nucleotides that diffuse rapidly into and out of the ZMW (in microseconds). Incorporation of one nucleotide into an ever-growing chain takes several milliseconds. During this time, the fluorescent label is excited and generates a fluorescent signal, and the fluorescent label is cleaved off. Detection of the corresponding fluorescence of the dye indicates which base was incorporated. The process is repeated. To sequence RNA, the DNA polymerase is replaced with reverse transcriptase in ZMWs and the process is followed accordingly.
Another example of a sequencing technique that can be included uses a chemical sensitive field effect transistor (chemFET) array to sequence DNA (e.g., as described in U.S. patent application publication No. 20090026082). In one example of this technique, a DNA molecule can be placed in a reaction chamber and a template molecule can be hybridized to a sequencing primer that binds to a polymerase. The incorporation of one or more triphosphates into a new nucleic acid strand at the 3' end of the sequencing primer can be detected by a change in current through a chemFET. An array can have a plurality of chemFET sensors. In another example, a single nucleic acid can be attached to a bead and the nucleic acid can be amplified on the bead and the individual beads can be transferred to individual reaction chambers on a chemFET array, wherein each chamber has a chemFET sensor and the nucleic acid can be sequenced.
Another example of a sequencing technique that can be used includes the use of electron microscopy (Moudrianaakis E.N. and Beer M.Proc Natl Acad Sci USA.1965March; 53: 564-71). In one example of this technique, single DNA molecules are labeled using metal labels that are distinguishable by electron microscopy. These molecules were then stretched in a plane and imaged using an electron microscope to measure the sequence.
DNA nanosphere sequencing is a type of high throughput sequencing technology used to determine the entire genomic sequence of an organism. The method uses rolling circle replication to amplify small segments of genomic DNA into DNA nanospheres. The nucleotide sequence is then determined using non-chain sequencing by ligation. This method of DNA sequencing allows a large number of DNA nanospheres to be sequenced per run. See WO2014122548 and Drmanac et al, science.2010jan 1; 327(5961): 78-81; porreca, Nat biotechnol.2010jan; 28(1): 43-4, each of which is incorporated herein by reference in its entirety.
Massively Parallel Signature Sequencing (MPSS) is one of the older next-generation sequencing technologies. MPSS uses a complex adaptor ligation method followed by adaptor decoding, reading the sequence in four nucleotide increments.
Polony sequencing the E.coli genome was sequenced by combining the in vitro paired tag library with emulsion PCR, automated microscopy and ligation-based sequencing chemistry. The technology is also integrated into the Applied Biosystems SOLiD platform.
In Solexa sequencing, DNA molecules and primers are first attached to a glass slide and amplified with polymerase to form a partially cloned colony, initially referred to as a "DNA colony". To determine the sequence, four types of reversible terminator bases (RT-bases) were added and unincorporated nucleotides were washed away. Unlike pyrosequencing, where the DNA strand is extended one nucleotide at a time, image acquisition can be performed at a delayed time, allowing a large number of DNA colonies to be captured by successive images taken from a single camera.
The SOLiD technology adopts a ligation method for sequencing. Here, the set of all possible fixed length oligonucleotides is labeled according to the position sequenced.
Annealing and ligating the oligonucleotides; preferential ligation of the matched sequence by DNA ligase generates signal information for the nucleotide at that position. Prior to sequencing, DNA was amplified by emulsion PCR. The resulting beads were deposited on glass slides, where each bead contained a single copy of the same DNA molecule. The result is a sequence of comparable number and length to Solexa sequencing.
At Ion TorrentTMIn sequencing, the DNA was cleaved into approximately 300-800 base pair fragments and the fragments were blunt-ended. Oligonucleotide adaptors are then ligated to the ends of the fragments. The adaptors are used as primers for amplifying and sequencing the fragments. The fragments may be attached to the surface and with a resolution such that the fragments can be resolved individually. Addition of one or more nucleotides releases protons (H +), which are detected and recorded in the sequencing instrument. The signal intensity is proportional to the number of incorporated nucleotides. The Ion Torrent data may also be output as a FASTQ file. See U.S. publication nos. 2009/0026082, 2009/0127589, 2010/0035252, 2010/0137143, 2010/0188073, 2010/0197507, 2010/0282617, 2010/0300559, 2010/0300895, 2010/0301398, and 2010/0304982, each of which is incorporated by reference herein in its entirety.
Detection of cancer-associated fusion proteins
The fused gene may promote tumor formation because the fused gene may produce an abnormal protein much more actively than the non-fused gene. Typically, the fusion gene is an oncogene that causes cancer; these include BCR-ABL, TEL-AML1 (ALL with t (12; 21)), AML1-ETO (M2 AML with t (8; 21)), and TMPRSS2-ERG (interstitial deletion on chromosome 21, commonly found in prostate cancer). In the case of TMPRSS2-ERG, the fusion product modulates prostate cancer by disrupting Androgen Receptor (AR) signaling and inhibiting AR expression by oncogenic ETS transcription factors. Most fusion genes are found in hematological cancers, sarcomas, and prostate cancers. Oncogenic fusion genes may result in gene products with new or different functions than the two fusion partners. Alternatively, the protooncogene is fused to a strong promoter, and thus the oncogenic function is set to act through up-regulation by the strong promoter of the upstream fusion partner. The latter is common in lymphomas, where oncogenes are juxtaposed to the promoters of immunoglobulin genes. Oncogenic fusion transcripts may also be caused by trans-splicing or read-through events. The presence of certain chromosomal aberrations and the resulting fusion genes are commonly used in cancer diagnosis for accurate diagnosis. Chromosomal banding analysis, Fluorescence In Situ Hybridization (FISH), and reverse transcription polymerase chain reaction (RT-PCR) are common methods used in diagnostic laboratories to identify cancer-associated fusion proteins.
Detecting chemotherapy drug resistance markers
Drug resistance is the cause of chemotherapy failure in malignancies, either pre-existing (intrinsic resistance) or drug induced (acquired resistance). Detection of drug resistance markers is based on, but not limited to: identifying cancer-associated fibroblasts by immunohistochemistry and flow cytometry; identification of aldehyde dehydrogenase 1, cleaved caspase 3, cyclooxygenase 2, phosphorylated Akt, Ki-67, and H2AX proteins using immunohistochemical staining; comparison of P-glycoprotein expression, hyaluronic acid (the major glycosaminoglycan component of the extracellular matrix), gain of 3q26.2 and loss of 6q11.2-12, 9P22.3, 9P22.2-22.1, 9P22.1-21.3, Xp22.2-22.12, Xp22.11-11.3 and Xp11.23-11.1, identified by genome-wide array comparative genomic hybridization; LRP overexpression as identified by immunostaining; HGF and c-MET identified using RNA sequencing, which are gene products related to microRNA MiR-193a-5 p; CD44 overexpression identified by cell sorting; and identifying trichostatin a, a potent histone deacetylase inhibitor. Chemoresistance markers can generally take the form of protein overexpression, identified at any/or DNA, RNA, or protein level using techniques such as, but not limited to, DNA sequencing, RNA sequencing, and protein sequencing. Some chemotherapy resistance markers take the form of epigenetic changes, and identification of these changes by DNA pyrosequencing is particularly useful for identifying chemotherapy resistance markers. In addition, gene mutations may directly affect the expression of gene products, may lead to the formation of cancer cells, and identification of gene mutations by DNA sequencing has high utility. At present, resistance is often diagnosed during treatment after long-term administration. There are currently methods for rapidly assessing drug resistance. Three types of test procedures are commonly used: fresh tumor cell culture testing, cancer biomarker testing, and Positron Emission Tomography (PET) testing. Drug resistance can be diagnosed by fresh tumor cell culture testing prior to in vitro therapy and by PET testing after a period of in vivo therapy. See Lippert, t. et al (2011) "Current status of methods to access capacitor drug resistance". int.j.med.sci.8 (3): 245-253.
Production of tumor-specific antigens or tumor-specific antibodies and anti-tumor vaccines using representative samples
As mentioned above, another application of test samples is for the isolation of tumor cells and antigens derived therefrom, which can be used for the production of tumor-specific antibodies or for the manufacture of cancer or tumor vaccines.
One approach to cancer vaccination is to isolate proteins from cancer cells and immunize cancer patients against these proteins in order to stimulate an immune response that will kill the cancer cells. Therapeutic cancer vaccines are being developed for the treatment of breast, lung, colon, skin, kidney, prostate and other cancers. Indeed, one such vaccine developed by the Dendreon Corporation for the treatment of prostate cancer was approved by the U.S. Food and Drug Administration (FDA) on 29.4.2010 and could be used to treat patients with advanced prostate cancer. Such vaccines This approval stimulates renewed interest in this therapy.
For example, tumor cells or proteolytically cleaved cell surface antigens derived from identified tumor cells can be used to develop effective therapeutic or prophylactic tumor vaccines. These antigens may be naked or multimerised or conjugated to other moieties such as other proteins, adjuvants, or loaded onto cells such as dendritic cells. Proteolytic treatment of living cancer cells has been shown to release antigenic targets sufficient to induce an anti-cancer immune response in vitro that exceeds that of untreated cancer cells. (Lokhov et al, J Cancer 20101: 230-.
In particular, the production of a tumor vaccine comprising a different antigen derived from tumor cells isolated from a particular patient sample or a cocktail thereof is contemplated, essentially a "personalized cancer vaccine" such that the patient can be treated with an immunostimulatory moiety that is poly-specific to their particular tumor type. Generally, these vaccines will comprise an effective amount of such antigens to generate an effective immune response, such as an antigen-specific CTL response against tumor cells expressing the particular antigen. As described above, in some cases, these antigens may be loaded onto other moieties such as dendritic cells. Generally, such vaccines will also comprise other immunological adjuvants, such as cytokines, TLR agonists, TNF/R agonists or antagonists, agents that modulate checkpoint inhibitors, and the like.
Moreover, in some embodiments, the present disclosure further contemplates the use of such antigens for the production of antisera and monoclonal antibodies. These antibodies can be used for diagnostic purposes, i.e. for the detection of tumor cells or antigens in a sample. Alternatively, such antibodies, particularly human or humanized antibodies specific for such tumor antigens, may be therapeutically used to treat cancers expressing these antigens. Methods for making antibodies that may be used in therapy are well known in the art.
Examples of the invention
Example 1: apparatus for accelerating electrophoresis
Devices for accelerated electrophoresis typically use concentric or polygonal disk architectures, e.g.As shown in fig. 1 to 4. Glass or ceramic are used in manufacturing systems (i.e., materials for concentric or polygonal disks) because these materials provide improved heat transfer properties, which are beneficial during device operation. For example, overheating (or boiling) of the focusing material is generally prevented because the flat channels of an accelerated electrophoresis device have good heat transfer capabilities compared to narrow channels. Current/voltage programming is also applicable to regulate joule heating of the device. Plastic materials are also used for device fabrication, such as polypropylene, polytetrafluoroethylene (as Commercially available), poly (methyl methacrylate) ("PMMA"), and/or polydimethylsiloxane ("PDMS"), among others, generally, the device is fabricated to a size that accommodates a desired sample volume, such as a milliliter scale sample volume, for example, up to 15 mL.
Referring to fig. 1-3, two concentric discs are separated by a partition, forming a flat channel for accelerated electrophoretic sample processing. The current is applied through a plurality of high voltage connections (HV connections) and a ground connection at the center of the system (see, e.g., fig. 1 and 3). In some cases, the sample is injected into the device through an opening in the device, such as on the top or side (see, e.g., fig. 3). The application of electricity focuses the target analyte of the sample into a concentric ring that migrates to the center of the disc (discussed further below), and the target analyte is then collected by a syringe located at the bottom of the device (see, e.g., FIG. 3). As shown in fig. 2A (top view) and fig. 2B, the preferred device setup consists of an outer circular electrode (1), a terminating electrolyte (2) and a leading electrolyte (3). Generally, the diameter of the outer circular electrode (1) is about 10-200mm, and the diameter of the leading electrolyte ranges from about 10 μm to a thickness (height) of about 20 mm. The leading electrolyte is stabilized by a gel, viscous additive, or is otherwise separated from the terminating electrolyte hydrodynamically, for example by a membrane. Gel or hydrodynamic separation can prevent leading and terminating electrolytes from mixing during device operation. Also, in some devices, mixing is prevented by using very thin (< 100um) electrolyte layers, as discussed further in example 2 below.
Referring to fig. 2A-2B, at the center of the front conductive electrolyte is an electrode cell (4) with an electrode (5). The assembly of electrodes (1, 5) and electrolytes (2, 3) is placed on a flat electrically insulating support (8). The electrolyte cell (4) is used to remove concentrated sample solution after the separation process, such as by pipetting the sample through the cell.
In an alternative arrangement (see fig. 4), the central electrode (5) is moved to a leading electrolyte cell (10) connected to the concentrator by a tube (9). The tubes (9) are directly connected or closed at one end by a semi-permeable membrane (not shown). This arrangement facilitates collection by preventing migration of macromolecules depending on the nature of the membrane used. This arrangement simplifies sample collection and provides a means to connect the concentrator on-line to other devices, such as capillary analyzers, chromatography, PCR devices, enzymatic reactors, etc. The tube (9) may also be used to supply a counter-current flow of lead electrolyte in an arrangement without a gel containing the lead electrolyte.
In general, the gel used for lead electrolyte stabilization is formed from any uncharged material such as agarose, polyacrylamide, pullulan, and the like. In some devices the top surface is open or in some devices the top surface is closed, depending on the nature of the separation to be performed. If closed, the material used for the covering means is preferably a thermally conductive and insulating material to prevent evaporation during accelerated operation of the electrophoretic device.
In general, the ring (circular) electrode is preferably a gold or platinum plated stainless steel ring, as this achieves maximum chemical resistance and electric field uniformity. Alternatively, stainless steel and graphite electrodes may be used in some devices, particularly disposable devices. Also, the ring (circular) electrodes may be replaced with other parts providing similar functionality, e.g. an array of line electrodes. Furthermore, a 2-dimensional array of regularly spaced electrodes may additionally or alternatively be used in an accelerated electrophoresis device. Circularly oriented arrays of regularly spaced electrodes may also be used in accelerated electrophoresis devices. In addition, other electrode configurations may also be used to implement different electric field shapes based on the desired separation of the sample (e.g., for directing the focal region). Such a configuration is described as a polygonal arrangement of electrodes. When divided into electrically separated segments, a switching electric field is generated for driving the time-dependent shape of the electric field. In some devices, this arrangement facilitates sample collection.
Example 2: accelerating electrophoretic device operation
Accelerated electrophoresis devices, such as those having the designs presented in fig. 1-4, operate either in a two-electrolyte cell arrangement, in which the leading electrolyte is followed by the sample mixed with the terminating electrolyte, or a sample mixed with the leading electrolyte is followed by the terminating electrolyte, or in a three-electrolyte cell arrangement, as shown in fig. 5. In this arrangement, the sample may be mixed with any conductive solution. Alternatively, the terminating electrolyte region may be eliminated when the sample contains a suitable terminating ion. Referring to fig. 2A to 2B, after filling the terminating electrolyte cell (2) with a mixture of the sample and a suitable terminating electrolyte and turning on the power supply (6), ions start to move towards the central electrode (5) and form a plurality of zones (7) at the boundary between the leading electrolyte and the terminating electrolyte. During migration, the concentration of the sample zones was adjusted according to the general principle of isotachophoresis [ Foret, F., Krivankovava, L., Bocek, P., Capillary Zone electrophoresis. electrophoresis Library, (Editor Raola, B.J.) VCH, Verlagsgesselsschaft, Weinheim, 1993 ]. Thus, a low concentration of sample ions is concentrated, while a high concentration of sample ions is diluted. Once the sample area enters the electrolyte cell (4), the separation process is stopped and the focused material is collected in the center of the device. In practice, the final concentration of the migration zone is comparable to the concentration of the precursor ion. Typically, concentration factors of 2 to 1000 or even more are achieved using accelerated electrophoresis.
In a three-cell arrangement, the sample is applied between the leading electrolyte and the terminating electrolyte (see, e.g., fig. 5), which allows the sample to concentrate and separate slightly faster than in a two-cell arrangement.
To avoid mixing, the leading electrolyte and the trailing electrolyte are stabilized by a neutral (uncharged) viscous medium, such as agarose gel (see, e.g., fig. 2A-2B, 3, which represent the leading electrolyte optionally contained within the gel or hydrodynamically separated from the terminating electrolyte).
All commonly used electrolytes known to those skilled in the art for isotachophoresis can be used with the present accelerated electrophoresis device when the precursor ions have a higher effective electrophoretic mobility than one or more target sample ions. The opposite is true for the selected terminating ion.
The device operates in positive ion mode (separation/concentration of cationic species) or negative ion mode (separation/concentration of anionic species). The most common lead electrolytes for anion separation using accelerated electrophoresis include, for example, chloride, sulfate or formate buffered to the desired pH with a suitable base such as histidine, TRIS, creatinine, and the like. The concentration of the leader electrolyte for accelerated electrophoresis for anion separation is in the range of 5mM-1M relative to the leader ion. The terminating ions typically include weak acid anions such as MES, MOPS, HEPES, TAPS, acetate, glutamate and low mobility anions. The concentration range of the terminating electrolyte used for accelerated electrophoresis in positive ion mode is: relative to stop ion, 5 mM-10M.
For cation separation, common precursor ions for accelerated electrophoresis include, for example: potassium, ammonium or sodium, with acetate or formate being the most common buffer counter ion. The reactive hydronium ion mobility boundary then acts as a universal terminating electrolyte formed by any weak acid.
In both positive and negative ion modes, an increase in the concentration of the precursor ions results in a proportional increase in the sample area, at the expense of increased current (power) for a given applied voltage. Typical concentrations are in the range of 10-100 mM; however, higher concentrations are also possible.
Furthermore, in cases where only regional electrophoretic separation is sufficient, the device may be operated using only one background electrolyte.
Current and/or voltage programming is suitable for adjusting the migration speed of the sample. It should be noted that with this concentric arrangement, the cross-sectional area changes during migration, and the velocity of the region motion is not constant in time. Thus, this arrangement does not strictly follow the principle of isotachophoresis, in which the regions migrate at a constant velocity. Depending on the mode of operation of the power supply (6), three basic cases can be distinguished: 1. separation at constant current; 2. separation constant voltage separation at a constant voltage; and 3. separation at constant power.
The variables used for the following equations are as follows: d is the migration distance (d < 0; r >); e-electric field strength; h-electrolyte (gel) height; i is current; j ═ current density; k — electrolyte conductivity; r is radius; s-cross-sectional area; u-electrophoretic mobility; v is speed; x is the length from the center electrode to the accelerated electrophoresis boundary.
In a common mode of operation using a constant current supplied by a High Voltage Power Supply (HVPS), the migration zone accelerates as it moves toward the center due to an increase in current density. In an exemplary separation at constant current and using a device comprising a circular architecture (e.g., a device comprising one or more circular electrodes), the relative velocity at distance d depends only on the mobility (conductivity) of the leading electrolyte, as evidenced by the derivation of the accelerated electrophoretic boundary velocity v at distance d from the starting radius r, as follows:
the general equation:
u ═ IR or E ═ J/κ (ohm's law)
E ═ U/X (electric field strength)

v=uE
5=2πXH
Accelerated electrophoretic boundary velocity v at distance d from the starting point with radius r:
v(d)=uLI/2π(r-d)hκLconstant/(r-d)
See fig. 6B for a plot of distance (d) traveled at constant current versus relative velocity at distance d.
With respect to separations performed at constant voltage and using devices comprising a circular architecture (e.g. devices comprising one or more circular electrodes), the relative velocity at distance d depends on the mobility (conductivity) of both LE and TE, as evidenced by the derivation of the accelerated electrophoretic boundary velocity v at distance d from the starting radius r, as follows:
The general equation:
u ═ IR or E ═ J/κ (ohm's law)
E ═ U/X (electric field strength)
Calculation of boundary velocity:
UL=U-UT=U-IRT
UL=U-Id/SκT
UL=U-ULκLd/(r-d)κT
UL=U(r-d)κT/((r-d)κT+κLd]
EL=UL/(r-d)
EL=UκT/[(r-d)κT+κLd]
υL=uLEL
vL=uLUκT/[(r-d)κT+κLd
see fig. 6C for a plot of distance (d) traveled at constant voltage versus relative velocity at distance d.
With respect to separations performed at constant power and using devices comprising a circular architecture (e.g. devices comprising one or more circular electrodes), the relative velocity at distance d depends on the mobility (conductivity) of both LE and TE, as evidenced by the derivation of the accelerated electrophoretic boundary velocity v at distance d from the starting radius r, as follows:
the general equation:
P=UI=I2r (electric power)
U ═ IR or E ═ J/κ (ohm's law)
E ═ U/X (electric field strength)
Calculation of boundary velocity:
P=PL+PT
P=I2(RL+RT)

UL=IRL=I(r-d)/κLS


κ is a small number, so:
see fig. 6D for a plot of distance (D) traveled at constant power versus relative velocity at distance D.
Example 3: accelerated electrophoresis using an exemplary apparatus
Accelerated electrophoretic separation, in which sulfanilic acid dye (SPADNS) is focused within concentric rings, is performed using an accelerated electrophoretic device as shown in fig. 7. 1W of constant power was applied to carry out accelerated electrophoresis in an accelerated electrophoresis apparatus.
Referring to fig. 7, SPADNS is focused within a concentric ring-shaped focal region, which can be seen as the red region in fig. 7. The upper half of the red circle shows that the height of the area is about 5 mm. As the accelerated electrophoresis zone moves from the edge to the center of the device, eventually the focus zone of SPADNS enters and is collected at the center of the device, demonstrating the focusing and recovery of the desired sample using accelerated electrophoresis.
Example 4: accelerated electrophoresis using an exemplary apparatus
Accelerated electrophoresis was performed using an accelerated electrophoresis apparatus (fig. 8A) to focus sulfanilic acid dye (SPADNS). The device of fig. 8A has a circular architecture and a circular gold electrode with a diameter of 10.2 cm. 10mM HCl-histidine (pH6.25) was used as the leading electrolyte and contained in 10mL of 0.3% agarose gel having a diameter of 5.8 cm. 15mL of 10mM MES Tris (pH 8.00) was used as the trailing electrolyte. The syringe cell of the device contained the lead electrolyte HCl His (pH6.25) at a concentration of 100 mM. SPADNS was prepared in trailing electrolyte at a concentration of 0.137mM in 300. mu.l and loaded into the space between the gel and the circular electrode of the device. To perform accelerated electrophoresis, a constant power of 1W was used.
Referring to FIG. 8B, SPADNS is focused within a concentric ring-shaped focal region, which can be seen as the red region in FIG. 8B. As the accelerated electrophoresis zone moves from the edge to the center of the device, eventually the focus zone of SPADNS enters and is collected at the center of the device, demonstrating the focusing and recovery of the desired sample using accelerated electrophoresis.
In addition, the accelerated electrophoresis apparatus of FIG. 8A is used to perform accelerated electrophoresis to focus on 30nt oligomers (ROX-oligos). The device of fig. 8A has a circular architecture and a circular gold electrode with a diameter of 10.2 cm. 10mM HCl-histidine (pH6.25) was used as the lead electrolyte and contained in 10mL of 0.3% agarose gel having a diameter of 5.8 cm. 15mL of 10mM MES Tris (pH 8.00) was used as the trailing electrolyte. The syringe reservoir of the device contained the lead electrolyte HClHis (pH6.25) at a concentration of 100 mM. 75 μ l of ROX-oligo at a concentration of 100 μ M was prepared in the trailing electrolyte and loaded into the device. To perform accelerated electrophoresis, a constant power of 1W was used.
Referring to FIG. 8C, the ROX-oligo is focused in a concentric ring-shaped focal region, which can be seen as the blue region in FIG. 8C. As the accelerated electrophoresis zone moves from the edge toward the center of the device, eventually the focusing region of the ROX-oligo enters and is collected at the center of the device, thus demonstrating the focusing and recovery of the desired sample using accelerated electrophoresis.
Example 5: accelerated electrophoresis using an exemplary apparatus
Accelerated electrophoresis was performed using an accelerated electrophoresis device (fig. 9A to 9B) to focus sulfanilic dye (SPADNS), which was then collected from the device (fig. 9C to 9D). The device of fig. 9A to 9B has a circular architecture and circular stainless steel wire electrodes with a diameter of 11.0 cm. Referring to fig. 9B, the numbers of the schematic represent dimensions in millimeters. 20mM HCl-histidine (pH6.20) was used as the lead electrolyte. Either 5mL of 10mM MES Tris (pH8.00) was used as the trailing electrolyte with 0.3% agarose gel in the LE, where the gel was 8.9cm in diameter (FIG. 9C) and formed before the introduction of TE; either 15mL of 10mM MES Tris (pH8.00) was used as the trailing electrolyte and had 0.3% gel in the LE, where the gel had a diameter of 5.8cm (FIG. 9D) and was formed before the introduction of the TE. The electrode cell of the device contained the lead electrolyte HCl His (pH 6.25) at a concentration of 100 mM.
Referring to FIG. 9C, 150 μ l of SPADNS at a concentration of 0.137mM was prepared in 15mL of trailing electrolyte and loaded into the device. To perform accelerated electrophoresis, a constant power of 2W was used. SPADNS is focused within a concentric ring-shaped focal region, which can be seen as the red area in fig. 9C. As the accelerated electrophoresis zone moves from the edge to the center of the device, eventually the focus zone of SPADNS enters and is collected at the center of the device, demonstrating the focusing and recovery of the desired sample using accelerated electrophoresis. The absorbance of the recovered SPADNS was increased 40-fold compared to the absorbance of the initial 15mL SPADNS-containing sample.
Referring to FIG. 9D, 150 μ l of SPADNS at a concentration of 0.137mM was prepared in 15mL of trailing electrolyte and loaded into the device. To perform accelerated electrophoresis, a constant power of 2W was used. SPADNS is focused within a concentric ring-shaped focal region, which can be seen as the red area in fig. 9D. As the accelerated electrophoresis zone moves from the edge to the center of the device, eventually the focus zone of SPADNS enters and is collected at the center of the device, demonstrating the focusing and recovery of the desired sample using accelerated electrophoresis. The absorbance of the recovered SPADNS was increased 40-fold compared to the absorbance of the initial 15mL SPADNS-containing sample.
The accelerated electrophoresis device of fig. 9A to 9B is also used for accelerated electrophoresis to focus SPADNS from a physiological saline solution in a device that does not use gel. 20mM HCl-histidine (pH 6.20) was used as the leading electrolyte. 13mL of 10mM MES Tris (pH 8.00) was used as the trailing electrolyte, which was further mixed with 3mL of 0.9% NaCl. The electrode cell of the device contained the lead electrolyte HCl histidine at a concentration of 100mM (pH 6.25).
Referring to FIG. 10, 150 μ l of SPADNS at a concentration of 0.137mM was prepared in 13mL of trailing electrolyte mixed with 3mL of 0.9% NaCl and loaded into the device. To perform accelerated electrophoresis, a constant power of 2W was used. SPADNS is focused within a concentric ring-shaped focal region, which can be seen as the red area in fig. 10. As the accelerated electrophoresis zone moves from the edge to the center of the device, eventually the focus zone of SPADNS enters and is collected at the center of the device, demonstrating the focusing and recovery of the desired sample using accelerated electrophoresis.
The accelerated electrophoresis apparatus of fig. 9A to 9B is also used to perform accelerated electrophoresis to separate and focus SPADNS and patent blue dyes, with acetic acid as a spacer. 20mM HCl-histidine (pH 6.20) was used as the leading electrolyte. 5mL of 10mM MES Tris (pH 8.00) was used as the trailing electrolyte, which was further mixed with 150. mu.l of 10mM acetic acid, 150. mu.l of 0.1mM patent blue dye and 150. mu.l of 0.137mM SPADNS. Effective mobility values for SPADNS, acetic acid and patent blue dyes (10) -9m2Vs) are 55, 42, 7 and 32, respectively. The electrode cell of the device contained the lead electrolyte HCl His (pH 6.25) at a concentration of 100 mM. For this experiment no gel was used in the channels of the device, but the gel was present on top of the platform of the device.
Referring to fig. 11, a mixture of trailing electrolytes, SPADNs, acetic acid and patent blue dye is loaded into the device. To perform accelerated electrophoresis, a constant power of 2W was used. SPADNS is focused into a concentric ring-shaped focal zone, which can be seen as the red zone/inner zone of fig. 11, and patent blue dye is also focused into a concentric ring-shaped focal zone, which can be seen as the blue zone/outer zone of fig. 11. As the accelerated electrophoresis zone moves from the edge to the center of the device, eventually the focusing zones for SPADNS and patent blue dyes go in sequence to the center of the device and can be collected independently at the center of the device, demonstrating the separation, focusing and recovery of the desired sample using accelerated electrophoresis.
Example 6: apparatus for accelerating electrophoresis
The accelerated electrophoresis apparatus is designed to perform accelerated electrophoresis (fig. 12). The device of fig. 12 has a circular architecture and circular copper bar electrodes with a diameter of 5.8 cm.
Example 7: exemplary System for performing accelerated electrophoresis by conductivity-based sample detection
Device construction
According to the previous example, an accelerated electrophoresis device with a large sample volume capacity is processed with circular separation channels. Fig. 13A and 13B show two views of the device structure. Wire ring electrodes (stainless steel wire with a diameter of 1 mm; radius 55mm) were attached to the edges of the circular separation chamber. The sample volume is defined by the space between the ring electrode and the agarose-stabilized leading electrolyte disk (radius 35 mm). Thus, a suitable sample volume is 5.7 milliliters per millimeter of height. The second electrode is placed in the leading electrolyte cell at the side of the device. The ring electrodes are connected to the upper banana connector shown in fig. 13A. The bottom banana connector was connected to a 3cm long, 0.4mm diameter platinum wire electrode ("B" in the scheme shown in fig. 13B) positioned in the front conducting electrode cell. To prevent possible interference from electrolysis products, migrating from the leading electrolyte cell to the central collection well ("a" in the scheme shown in fig. 13B), a 9mm ID internal channel with a total length of 20cm was drilled inside the device. The side openings of the device after drilling were blocked by silicon spacers. The central collection well with a diameter of 9mm was drilled through the device and moved by sealing with a rubber o-ring Bottom of the rodThe parts are closed.
For each analysis, after filling the central collection well with the leading electrolyte down to the leading electrode cell, a plastic vial (Slide-a-Lyzer) with a semi-permeable membrane was placedTMMINI analysis Units2000 Da MWCO, Thermo Fisher Scientific, USA) were inserted into the central collection well. To minimize volume, Slide-A-Lyser was cut in half with a razor blade to form a collection cup with a volume of less than 200 microliters. Next, a 0.3% agarose gel disk (70 mm diameter, 4mm thick) with a central 8mm hole was prepared in the pre-conductive electrolyte, positioned in the center of the device, and covered by a 75xlmm circular glass plate also with a central 8mm hole to avoid bubble accumulation. Although a variety of electrophoretic separation modes can be applied (e.g., zonal electrophoresis, isoelectric focusing, or displacement electrophoresis), we have used accelerated electrophoresis and electrolyte systems including Leading (LE) and Terminating (TE) electrolytes. The sample solution in the terminating electrolyte was injected into the space between the gel tray and the ring electrode with a syringe. The polarity of the galvanic coupling is chosen such that the anionic sample component migrates from the ring electrode towards the collection well in the centre of the device. After the focused sample area enters the collection cup, the current is turned off and the sample is pipetted out for use. The empty collection cup is lifted by the travel bar and discarded.
Electrically driven separation conditions
The separation is carried out in the negative ion mode, with Cl-ions as the leading ions (effective mobility 79.1X 10)-9Detail V-1s-1). The Leader Electrolyte (LE) contained 100mM HCl-histidine buffer pH6.2, while the Terminator Electrolyte (TE) contained 10mM TAPS, titrated by TRIS to pH 8.30. Agarose stabilized lead electrolyte disks were prepared in 20mM lead electrolyte (HCl-histidine; pH 6.25). All buffers were prepared in deionized water. The power supply is provided by PowerPac3000(BioRad), which runs at 2W in constant power mode (this corresponds to approximately 16mA and 120V at the beginning of the analysis). The analysis took about 1 hour (about 10mA and 200V at the end of the analysis).
Sample detection
To test the samples, surface resistivity test cells were constructed and attached to a conductivity detector of a commercial ITP instrument (Villa Labeco, sp.n.ves, Slovakia). The detection cell was prepared as follows: two platinum (Pt) wires (300 μm x2cm long) were connected to connectors that matched the ITP instrument. Both ends of the Pt wire were inserted into a 1mL pipette tip and then filled with a fast curing epoxy resin. Finally, a 1mm pipette tip with an embedded epoxy wire was cut with a blade to expose a flat epoxy surface with two circular Pt electrodes. See fig. 14A and 14B. The test wells were mounted on a laboratory holder and gently contacted to the surface of the agarose gel plate adjacent to the collection vial, as shown in FIG. 15A. The system for detection was employed to generate the conductivity curve of fig. 15B.
Another exemplary system was also constructed to accelerate sample detection during electrophoresis. In this system, a surface resistivity detection probe composed of two platinum (Pt) wires having a diameter of 500 μm was integrated in a bottom substrate (i.e., a base plate) of an accelerated electrophoresis apparatus, as shown in fig. 16A and 16B. The tip of the wire is brought from the bottom to the semi-permeable membrane through a dedicated channel in the center post on the bottom substrate. The opposite end of the wire was coupled to a conductivity detector of a commercial ITP instrument (Villa Labeco, sp.n.ves, Slovakia). The top plate used as the accelerated electrophoresis device is assembled with the bottom substrate using magnets, while the o-ring (see fig. 16B) enables a complete seal between the two substrates to prevent any leakage.
Chemical product
Buffer composition: l-histidine monohydrochloride monohydrate (99%), L-histidine (99%), N-TRIS (hydroxymethyl) methyl-3-aminopropanesulfonic acid (TAPS; 99.5%) and TRIS (hydroxymethyl) aminomethane (TRIS; 99.8%) were purchased from Sigma-Aldrich (USA). Agarose NEEO superframes with low electroosmosis garose was purchased from Carl Roth (Germany). Acetic acid and anionic dye patent blue V sodium salt from Sigma-Aldrich; the red anionic dye SPADNS (
trisodium 1, 8-dihydroxy-2- (4-sulfophenylazo) naphthalene-3, 6-disulfonate) is from Lachema, Bmo, Czech Republic.
Focusing of SPADNS and patent blue
To test the above exemplary device comprising accelerated electrophoresis and electrical sample detection, the device was used to focus and detect the test analyte: SPADNS and patent blue. Lead Electrolyte (LE): buffered to HCl-HIS at pH 6.2. Trailing Electrolyte (TE): TAPS-TRIS buffered to pH 8.3. The gel was formed from 20ml of 6% polyacrylamide gel in 20mM LE. 100mM LE was added to the electrode cell. Sample solution: 15ml of 10mM TE + 150. mu.L of 0.1mM SPADNS + 150. mu.L of 0.1mM patent blue. The sample solution in the terminating electrolyte was injected into the space between the gel tray and the ring electrode with a syringe. The device operates in constant power mode, P2W. Fig. 15A provides focused images of SPADNS and patent blue showing conductivity sample detection near the sample collection well. Fig. 15B provides a trace of the conductivity of the sample focus and shows significant changes in conductivity/resistivity due to the transition between LE and TE, including the focal region of the sample (SPADNS and patent blue).
DNA analysis
The low molecular weight dsDNA ladder labeled with fluorescein (ten fragments from 75 base pairs (bp) to 1622 bp) was from Bio-Rad, USA. The DNA concentration in the collected fractions was assessed by using a high sensitivity dsDNA Qubit quantification kit using a Qubit fluorimeter (Invitrogen, Carlsbad, CA, USA). The concentration of the target molecule in the sample is reported by the fluorescent dye that emits only when bound to DNA. The collected fractions were further analyzed using a chip CGE-LIF Instrument Agilent 2100 bioanalyzer (Agilent, Santa Clara, Calif., United States). The assay provides information on the size of the DNA fragments in the collected sample using a high sensitivity DNA kit (Agilent, United States).
DNA focusing
The electrophoretic mobility of DNA fragment with more than 50bp in free solution is about 37x10-9m2Vs, whereas the deviation for short fragments (about 20-50bp) may be only about 10%. Based on these mobilities, we designed a discontinuous electrolyte system suitable for focusing all sample DNA fragments to a single focal region. For experimental testing, we selected a fluorescein-labeled low molecular range DNA ladder with fragment sizes ranging from 75 to 1632 bp. Only one fluorescence per DNA fragmentThe fluorescence of the sample of the bolus was irradiated with a laser beam of 2cm radius (FIG. 17A). The surface resistivity measurements are used to indicate transitions near the LE/TE boundary of the collection well. The overall change in resistivity from LE to TE is used as an indicator of the sample location. Based on this change, the voltage is turned off and the separation is stopped. The collected fractions were analyzed by UV spectroscopy (absorbance measurements) (fig. 17B) and bioanalyzer-based analysis (fig. 17C). The lower signal intensity of the pre-and post-markers in figure 17C (added in the same amount to the initial and final samples according to the manufacturer's instructions) is due to the higher DNA concentration in the collected fractions. In both cases, an increase of about 30x concentration in the collected fractions corresponds to a decrease in sample volume from the initial 15mL to the 280 μ L sample collection volume in this exemplary embodiment. The volume of the migrating DNA region before entering the collection cup is much smaller (about 3 μ L) and the final fraction concentration depends mainly on the volume of the collection vial chosen.
Example 8: isolation/purification of cell-free nucleic acids by ETP
ETP was performed using an accelerated electrophoresis apparatus and experimental setup (see fig. 18-20) to perform the separation (purification) of cell-free nucleic acids comprising cell-free DNA. The device has a circular architecture and circular electrodes (see fig. 18 and 20).
Before ETP was set up and performed to isolate/purify cfDNA, ETP buffer, agarose gel of ETP set-up, shortened dialysis unit and one or more plasma samples digested with proteinase K were prepared. A Leading Electrolyte (LE) buffer containing HCl-histidine pH6.25 was prepared, and a Trailing Electrolyte (TE) buffer containing TAPS-Tris pH8.30 was prepared. The agarose gel used with the ETP apparatus was prepared by mixing an amount of agarose appropriate for the desired agarose percent gel with the LE buffer in an erlenmeyer flask.
Proteinase K digested plasma was prepared by: the plasma samples were first thawed at room temperature, then the samples were mixed, the desired volume was removed and dispensed into nuclease-free tubes. Next, proteinase K was added, the solution was mixed well and then incubated at 37-70 ℃ depending on the sample.
ETP-based isolation/purification of cfDNA is generally performed as follows. The ETP system was prepared by: the movable central piston (see fig. 18) is first moved to a lower position using a teflon rod (see fig. 18) or a pair of tweezers. The center electrode channel was filled with LE buffer (25mL LE +1.25 μ LSYBR gold (if used for visualization of DNA bands)) via the corner opening of the ETP platform, and the filling was stopped when the center opening was completely filled. The dialysis unit is secured in the central opening by an O-ring (see fig. 18). The dialysis unit was then filled with LE buffer (and SYBR gold solution if desired). The agarose gel prepared as described above was carefully transferred from the mold to an ETP apparatus and fixed. Circular overlays were then placed on the gel.
A sample mixture was prepared, typically containing 15mL of TE buffer +1 μ L SYBR gold (if used for visualization of DNA bands) +50bp DNA ladder (if used as marker) + PK pretreated plasma sample, and pipetted into the gap between the gel and the circular electrode of the ETP device. Finally, a second lid is placed on top of the device.
The power supply is then prepared by plugging the ETP device into the power supply. The power supply was set at a constant power between 1 and 8W (depending on the amount of plasma sample used) and ETP was performed for approximately 1-2 hours. Upon turning on the power source, the ETP focuses the one or more target analytes into one or more focal zones (one or more ETP bands).
In some cases, samples were monitored and collected as follows. If SYBR gold is included in the ETP run, a blue light source and appropriate filters are used to monitor the movement of the DNA focal region (ETP bands). Once DNA is collected in the dialysis unit, the power is turned off. If it is desired to select the size of the DNA/analyte, only one or more target DNA foci (one or more ETP bands) are collected, as described further below. Once the power was turned off, the LE buffer was removed from the corner openings of the ETP device, and then the TE buffer and gel were removed from the device. Next, the sample contained in the dialysis unit is collected. The moving center piston is then moved to the upper position. In some cases, the collected DNA solution is subsequently washed by using a mixture of KAPA pure beads and eluted in 30-50 μ L of tris.
In some cases, the collected cfDNA was analyzed using a Qubit fluorometer (Invitrogen, Carlsbad, CA, USA) by using a high sensitivity dsDNA Qubit quantification kit. The concentration of the target molecule in the sample is reported by the fluorescent dye that emits only when bound to DNA. In some cases, the collected cfDNA was analyzed by using a chip CGE-LIF instrument Agilent 2100 bioanalyzer (Agilent, Santa Clara, CA, United States). The assay provides information on the size of the DNA fragments in the collected sample using a high sensitivity DNA kit (Agilent, United States).
Example 9: ETP-based cfDNA isolation/purification
In this example, cfDNA was isolated/purified by ETP-based isolation/purification, as generally described in example 8, with the following modifications. DNA ladder was added to the plasma samples and SYBR gold was used to visualize the DNA regions. The sample contained 1mL of plasma, which contained cfDNA and a 200ng DNA ladder.
Referring now to fig. 20, time-lapse photographs were taken of the ETP-based process of isolating/purifying DNA from 1mL plasma samples, which isolated/purified cfDNA and DNA ladders. SYBR gold was used for visualization of DNA regions (see fig. 20).
Example 10: ETP-based cfDNA isolation/purification
In this example, cfDNA was isolated and collected from 1mL of plasma samples by ETP-based isolation/purification as generally described in example 8 and with the following modifications. No SYBR gold was used. After ETP-based purification and subsequent collection of cfDNA, a single KAPA-pure bead-based clean-up step (1X SPRI beads) or two KAPA-pure bead-based clean-up steps (2X SPRI beads) were performed. cfDNA was also isolated/purified from plasma samples (1mL) by spin column method using AVENIO kit, followed by a single KAPA pure bead based clean up step; and the "UNA method" which involves removal of genomic DNA contamination using two bead-based cleanings (i.e. two clean-up steps, each using the same type of bead) followed by spin column method using the AVENIO kit. After the cfDNA was isolated/purified and cleaned using the methods described above, the concentration of cfDNA was measured using a quibit-based assay and recorded in ng.
Referring now to fig. 21, the results demonstrate extraction of cfDNA by using ETP-based separation and collection, including one or two bead clean-up steps. The amount of cfDNA generated by isolating and collecting cfDNA by ETP-based isolation and collection was about 2.5-fold compared to other methods used in this example. Notably, performing ETP-based isolation and collection of cfDNA followed by one bead-based cleaning step contained higher amounts of cfDNA than ETP-based cfDNA isolation and collection that included two bead-based cleaning steps.
Example 11: ETP-based cfDNA isolation/purification
In this example, DNA comprising cfDNA and DNA ladder was isolated/purified from 1mL plasma by ETP-based isolation/purification as generally described in example 8 and with the following modifications. A60 ng DNA ladder was added to 1mL of plasma. After isolation/purification and subsequent collection of cfDNA and DNA ladder, size-based analysis was performed on the isolated/purified and collected DNA samples using a bioanalyzer run as generally described in example 8.
Referring now to fig. 22, the results indicate the presence of cfDNA in the isolated/purified and collected samples, as evidenced by the fluorescent signal and bands that do not correspond to DNA ladders, because cfDNA exhibits bands of about 150 to about 200bp in length (see fig. 22).
Example 12: ETP-based cfDNA isolation/purification
In this example, cfDNA was isolated/purified from 1mL of plasma samples by ETP-based isolation/purification as generally described in example 8 and with the following modifications. In this example, no SYBR gold or DNA ladder was used. After isolation/purification and subsequent collection of cfDNA, size-based analysis was performed on the isolated/purified and collected DNA samples using a bioanalyzer run as generally described in example 8.
Referring now to fig. 23, the results show the presence of cfDNA in the isolated/purified and collected samples as evidenced by the fluorescent signal and bands of about 150 to about 200bp in length (see fig. 23). Notably, 25bp and 10,300bp markers were used as standards.
Example 13: ETP-based cfDNA isolation/purification
In this example, cfDNA was isolated/purified from 1mL of plasma samples by ETP-based isolation/purification as generally described in example 8 and with the following modifications. In this example, cfDNA was isolated/purified and then collected from 1mL plasma samples by varying buffer concentration, gel percentage and stop time of ETP run, thereby isolating/purifying DNA of various size ranges and then collecting, which allowed enhanced isolation/purification of cfDNA from fragmented genomic DNA.
Referring now to fig. 24, results of ETP-based separation/purification and subsequent collection using different buffer concentrations, gel percentages, and stop times are presented. Electrophoretic based analysis of ETP run results showed that various DNA size cut-off values were achieved by ETP based separation/purification and subsequent collection (see figure 24).
Example 14: ETP-based isolation/purification of circulating tumor DNA
In this example, circulating tumor DNA was isolated/purified from 1mL plasma samples by ETP-based isolation/purification and subsequently collected as generally described in example 8 and with the following modifications. In addition to ETP-based isolation/purification, spin-column based methods using the AVENIO kit were also used to isolate ctDNA from 4mL plasma samples in separate assays. Furthermore, after ETP-based isolation/purification and subsequent collection of ctDNA, a KAPA-based pure bead clean-up step was performed. In addition, the isolated/purified and subsequently collected ctDNA was subjected to QUBIT-based analysis as generally described in example 8.
Referring now to fig. 25, the results of ETP-based separation/purification and subsequent collection of ctDNA from 0.5mL plasma are presented. Notably, the results of the spin column based method were back-calculated from 4mL of sample to 0.5 mL. Five readings were taken for each sample. The results presented in fig. 26 show that the yield of ctDNA isolated/purified by ETP-based methods and subsequently collected exceeds the yield of spin column-based methods. ctDNA yields obtained by ETP-based methods averaged about 5.7ng, with a maximum yield of 6.8ng, ranging from about 5.1ng to about 6.8 ng.
Example 15: ETP-based isolation/purification using an episomal marker of ETP
In this example, an epaxial marker of ETP was generated for use during ETP-based separation/purification.
One method for generating a generic marker for the marker used during ETP is to digest the plasmid at one restriction site and then subsequently generate an amplicon of the desired size, for example a 1003bp amplicon, using appropriate primers to generate an amplicon of size 1003 bp. Optionally, the amplicon may be fluorescently labeled.
Alternatively, a generic marker of the marker is generated as described below. Three different restriction enzymes were used to cut the vector at three different restriction sites to generate fragments of 744bp, 875bp and 1067 bp. After digestion, the digestion products were cleared, followed by fluorescent labeling of the three vectors, respectively. After cleaning, the ETP episomal markers were analyzed using an Agilent bioanalyzer (see FIG. 26), confirming that the episomal markers with three fragments of 744bp, 875bp and 1067bp were generated.
Such an ETP episomal marker can be used during the performance of ETP-based methods and with ETP-based devices to indicate a cut-off point at which collection of target analytes (e.g., DNA) can cease. For example, a fluorescently labeled or otherwise detectably labeled ETP episomal marker can be generated that is larger in size than the target analyte to be collected during performance of the ETP-based method. By monitoring the marker throughout the ETP run, the user or automated machine can stop running before the marker falls into the collection tube, allowing capture of target analytes smaller than the marker while leaving the larger contaminating analytes outside the tube as they are positioned behind the superordinate marker. Furthermore, the epimarker on ETP itself is not collected and therefore can be used in large quantities and with a variety of detectable labels, as it does not interfere with downstream detection. In particular, the episomal marker of ETP can be used in cfDNA isolation/purification methods as it helps to exclude genomic DNA. For example, in some cases, the up-marker of ETP may be about 1000 bp.
Claims (19)
Applications Claiming Priority (3)
| Application Number | Priority Date | Filing Date | Title |
|---|---|---|---|
| US201962847699P | 2019-05-14 | 2019-05-14 | |
| US62/847699 | 2019-05-14 | ||
| PCT/EP2020/063112 WO2020229437A1 (en) | 2019-05-14 | 2020-05-12 | Devices and methods for sample analysis |
Publications (1)
| Publication Number | Publication Date |
|---|---|
| CN114269916A true CN114269916A (en) | 2022-04-01 |
Family
ID=70779687
Family Applications (1)
| Application Number | Title | Priority Date | Filing Date |
|---|---|---|---|
| CN202080050994.1A Pending CN114269916A (en) | 2019-05-14 | 2020-05-12 | Device and method for sample analysis |
Country Status (5)
| Country | Link |
|---|---|
| US (1) | US20220325268A1 (en) |
| EP (1) | EP3969583A1 (en) |
| JP (2) | JP7441243B2 (en) |
| CN (1) | CN114269916A (en) |
| WO (1) | WO2020229437A1 (en) |
Cited By (2)
| Publication number | Priority date | Publication date | Assignee | Title |
|---|---|---|---|---|
| CN115144519A (en) * | 2022-06-30 | 2022-10-04 | 上海交通大学 | Single cell sample fingerprint detection method based on inorganic nanoparticles and application |
| CN116045835A (en) * | 2023-03-31 | 2023-05-02 | 成都太科光电技术有限责任公司 | Ultra-large caliber plane or spherical surface optical interference testing device |
Families Citing this family (7)
| Publication number | Priority date | Publication date | Assignee | Title |
|---|---|---|---|---|
| US11542541B2 (en) * | 2019-11-26 | 2023-01-03 | Bio-Rad Laboratories, Inc. | Method and system for sampling material from cells |
| US11635380B2 (en) * | 2020-07-13 | 2023-04-25 | Buckman Laboratories International, Inc. | Fluorometer calibration device and method |
| EP4301839A1 (en) | 2021-03-03 | 2024-01-10 | F. Hoffmann-La Roche AG | Devices and methods for electrophoretic extraction of nucleic acids from biological samples |
| EP4373929A1 (en) * | 2021-07-23 | 2024-05-29 | F. Hoffmann-La Roche AG | Methods and devices for nucleic acid extraction using epitachophoresis |
| CN114067315B (en) * | 2021-10-23 | 2022-11-29 | 广州市艾贝泰生物科技有限公司 | Cell counting method, cell counting device, computer device, and storage medium |
| TWM645911U (en) * | 2022-10-27 | 2023-09-11 | 醫華生技股份有限公司 | Biological particle enrichment equipment and its droplet generator |
| CN115791933B (en) * | 2022-11-14 | 2025-07-25 | 上海交通大学 | Biochemical sensor based on epitaxial gate type field effect transistor and application thereof |
Citations (2)
| Publication number | Priority date | Publication date | Assignee | Title |
|---|---|---|---|---|
| US20120034685A1 (en) * | 2010-08-06 | 2012-02-09 | Tandem Diagnostics, Inc. | Assay systems for determination of source contribution in a sample |
| US20140349859A1 (en) * | 2010-08-06 | 2014-11-27 | Ariosa Diagnostics, Inc. | Detection of target nucleic acids using hybridization |
Family Cites Families (112)
| Publication number | Priority date | Publication date | Assignee | Title |
|---|---|---|---|---|
| US4469863A (en) | 1980-11-12 | 1984-09-04 | Ts O Paul O P | Nonionic nucleic acid alkyl and aryl phosphonates and processes for manufacture and use thereof |
| US4469797A (en) | 1982-09-23 | 1984-09-04 | Miles Laboratories, Inc. | Digoxigenin immunogens, antibodies, labeled conjugates, and related derivatives |
| US5235033A (en) | 1985-03-15 | 1993-08-10 | Anti-Gene Development Group | Alpha-morpholino ribonucleoside derivatives and polymers thereof |
| US5034506A (en) | 1985-03-15 | 1991-07-23 | Anti-Gene Development Group | Uncharged morpholino-based polymers having achiral intersubunit linkages |
| DE3529478A1 (en) | 1985-08-16 | 1987-02-19 | Boehringer Mannheim Gmbh | 7-DESAZA-2'DESOXYGUANOSINE NUCLEOTIDES, METHOD FOR THE PRODUCTION THEREOF AND THEIR USE FOR NUCLEIC ACID SEQUENCING |
| US5447841A (en) | 1986-01-16 | 1995-09-05 | The Regents Of The Univ. Of California | Methods for chromosome-specific staining |
| US6280929B1 (en) | 1986-01-16 | 2001-08-28 | The Regents Of The University Of California | Method of detecting genetic translocations identified with chromosomal abnormalities |
| US4774339A (en) | 1987-08-10 | 1988-09-27 | Molecular Probes, Inc. | Chemically reactive dipyrrometheneboron difluoride dyes |
| US5216141A (en) | 1988-06-06 | 1993-06-01 | Benner Steven A | Oligonucleotide analogs containing sulfur linkages |
| DE3836656A1 (en) | 1988-10-27 | 1990-05-03 | Boehringer Mannheim Gmbh | NEW DIGOXIGENINE DERIVATIVES AND THEIR USE |
| US5132432A (en) | 1989-09-22 | 1992-07-21 | Molecular Probes, Inc. | Chemically reactive pyrenyloxy sulfonic acid dyes |
| US5274113A (en) | 1991-11-01 | 1993-12-28 | Molecular Probes, Inc. | Long wavelength chemically reactive dipyrrometheneboron difluoride dyes and conjugates |
| US5433896A (en) | 1994-05-20 | 1995-07-18 | Molecular Probes, Inc. | Dibenzopyrrometheneboron difluoride dyes |
| US5386023A (en) | 1990-07-27 | 1995-01-31 | Isis Pharmaceuticals | Backbone modified oligonucleotide analogs and preparation thereof through reductive coupling |
| US5602240A (en) | 1990-07-27 | 1997-02-11 | Ciba Geigy Ag. | Backbone modified oligonucleotide analogs |
| US5248782A (en) | 1990-12-18 | 1993-09-28 | Molecular Probes, Inc. | Long wavelength heteroaryl-substituted dipyrrometheneboron difluoride dyes |
| US5338854A (en) | 1991-02-13 | 1994-08-16 | Molecular Probes, Inc. | Fluorescent fatty acids derived from dipyrrometheneboron difluoride dyes |
| US5427932A (en) | 1991-04-09 | 1995-06-27 | Reagents Of The University Of California | Repeat sequence chromosome specific nucleic acid probes and methods of preparing and using |
| US5187288A (en) | 1991-05-22 | 1993-02-16 | Molecular Probes, Inc. | Ethenyl-substituted dipyrrometheneboron difluoride dyes and their synthesis |
| US5262357A (en) | 1991-11-22 | 1993-11-16 | The Regents Of The University Of California | Low temperature thin films formed from nanocrystal precursors |
| US5505928A (en) | 1991-11-22 | 1996-04-09 | The Regents Of University Of California | Preparation of III-V semiconductor nanocrystals |
| US5644048A (en) | 1992-01-10 | 1997-07-01 | Isis Pharmaceuticals, Inc. | Process for preparing phosphorothioate oligonucleotides |
| US6048616A (en) | 1993-04-21 | 2000-04-11 | Philips Electronics N.A. Corp. | Encapsulated quantum sized doped semiconductor particles and method of manufacturing same |
| US5472842A (en) | 1993-10-06 | 1995-12-05 | The Regents Of The University Of California | Detection of amplified or deleted chromosomal regions |
| US6090555A (en) | 1997-12-11 | 2000-07-18 | Affymetrix, Inc. | Scanned image alignment systems and methods |
| US5637684A (en) | 1994-02-23 | 1997-06-10 | Isis Pharmaceuticals, Inc. | Phosphoramidate and phosphorothioamidate oligomeric compounds |
| US5571018A (en) | 1994-11-23 | 1996-11-05 | Motorola, Inc. | Arrangement for simulating indirect fire in combat training |
| US5690807A (en) | 1995-08-03 | 1997-11-25 | Massachusetts Institute Of Technology | Method for producing semiconductor particles |
| US5800996A (en) | 1996-05-03 | 1998-09-01 | The Perkin Elmer Corporation | Energy transfer dyes with enchanced fluorescence |
| US5830912A (en) | 1996-11-15 | 1998-11-03 | Molecular Probes, Inc. | Derivatives of 6,8-difluoro-7-hydroxycoumarin |
| US5696157A (en) | 1996-11-15 | 1997-12-09 | Molecular Probes, Inc. | Sulfonated derivatives of 7-aminocoumarin |
| US5866366A (en) | 1997-07-01 | 1999-02-02 | Smithkline Beecham Corporation | gidB |
| US6130101A (en) | 1997-09-23 | 2000-10-10 | Molecular Probes, Inc. | Sulfonated xanthene derivatives |
| US6322901B1 (en) | 1997-11-13 | 2001-11-27 | Massachusetts Institute Of Technology | Highly luminescent color-selective nano-crystalline materials |
| US5990479A (en) | 1997-11-25 | 1999-11-23 | Regents Of The University Of California | Organo Luminescent semiconductor nanocrystal probes for biological applications and process for making and using such probes |
| US6207392B1 (en) | 1997-11-25 | 2001-03-27 | The Regents Of The University Of California | Semiconductor nanocrystal probes for biological applications and process for making and using such probes |
| AU4333799A (en) | 1998-06-04 | 1999-12-20 | Board Of Regents, The University Of Texas System | Digital optical chemistry micromirror imager |
| US6617583B1 (en) | 1998-09-18 | 2003-09-09 | Massachusetts Institute Of Technology | Inventory control |
| US6372937B1 (en) | 1998-11-09 | 2002-04-16 | Mark Norman Bobrow | Enhanced catalyzed reporter deposition |
| US6114038A (en) | 1998-11-10 | 2000-09-05 | Biocrystal Ltd. | Functionalized nanocrystals and their use in detection systems |
| US6855202B2 (en) | 2001-11-30 | 2005-02-15 | The Regents Of The University Of California | Shaped nanocrystal particles and methods for making the same |
| WO2000068692A1 (en) | 1999-05-07 | 2000-11-16 | Quantum Dot Corporation | A method of detecting an analyte using semiconductor nanocrystals |
| US6818395B1 (en) | 1999-06-28 | 2004-11-16 | California Institute Of Technology | Methods and apparatus for analyzing polynucleotide sequences |
| US6306736B1 (en) | 2000-02-04 | 2001-10-23 | The Regents Of The University Of California | Process for forming shaped group III-V semiconductor nanocrystals, and product formed using process |
| US6225198B1 (en) | 2000-02-04 | 2001-05-01 | The Regents Of The University Of California | Process for forming shaped group II-VI semiconductor nanocrystals, and product formed using process |
| WO2001071044A1 (en) | 2000-03-22 | 2001-09-27 | Quantum Dot Corporation | Methods of using semiconductor nanocrystals in bead-based nucleic acid assays |
| JP2003535063A (en) | 2000-06-01 | 2003-11-25 | ザ・ボード・オブ・リージェンツ・フォー・オクラホマ・ステート・ユニバーシティー | Bioconjugates of nanoparticles as radiopharmaceuticals |
| WO2002012195A1 (en) | 2000-08-04 | 2002-02-14 | Molecular Probes, Inc. | Derivatives of 1,2-dihydro-7-hydroxyquinolines containing fused rings |
| US6942970B2 (en) | 2000-09-14 | 2005-09-13 | Zymed Laboratories, Inc. | Identifying subjects suitable for topoisomerase II inhibitor treatment |
| US6649138B2 (en) | 2000-10-13 | 2003-11-18 | Quantum Dot Corporation | Surface-modified semiconductive and metallic nanoparticles having enhanced dispersibility in aqueous media |
| US20020083888A1 (en) | 2000-12-28 | 2002-07-04 | Zehnder Donald A. | Flow synthesis of quantum dot nanocrystals |
| JP2004523243A (en) | 2001-03-12 | 2004-08-05 | カリフォルニア インスティチュート オブ テクノロジー | Method and apparatus for analyzing polynucleotide sequences by asynchronous base extension |
| US6709929B2 (en) | 2001-06-25 | 2004-03-23 | North Carolina State University | Methods of forming nano-scale electronic and optoelectronic devices using non-photolithographically defined nano-channel templates |
| EP1409240B1 (en) | 2001-07-20 | 2012-05-09 | Life Technologies Corporation | Luminescent nanoparticles and methods for their preparation |
| US7169560B2 (en) | 2003-11-12 | 2007-01-30 | Helicos Biosciences Corporation | Short cycle methods for sequencing polynucleotides |
| DK1877101T3 (en) | 2005-04-28 | 2017-01-09 | Ventana Med Syst Inc | ENZYMES CONJUGATED TO ANTIBODIES THROUGH A PEG hetero LINKER |
| EP1893241A2 (en) | 2005-04-28 | 2008-03-05 | Ventana Medical Systems, Inc. | Fluorescent nanoparticles conjugated to antibodies via a peg linker |
| US20090233291A1 (en) * | 2005-06-06 | 2009-09-17 | 454 Life Sciences Corporation | Paired end sequencing |
| US20070141605A1 (en) | 2005-11-21 | 2007-06-21 | Applera Corporation | Portable preparation, analysis, and detection apparatus for nucleic acid processing |
| AU2006318438B2 (en) | 2005-11-23 | 2011-09-22 | Ventana Medical Systems, Inc. | Molecular conjugate |
| US7282337B1 (en) | 2006-04-14 | 2007-10-16 | Helicos Biosciences Corporation | Methods for increasing accuracy of nucleic acid sequencing |
| US20090253156A1 (en) | 2006-05-05 | 2009-10-08 | Perkinelmer Las, Inc. | Mass spectrometry methods for multiplexed quantification of protein kinases and phosphatases |
| US8349167B2 (en) | 2006-12-14 | 2013-01-08 | Life Technologies Corporation | Methods and apparatus for detecting molecular interactions using FET arrays |
| EP3285067B1 (en) | 2006-12-14 | 2022-06-22 | Life Technologies Corporation | Apparatus for measuring analytes using fet arrays |
| US8262900B2 (en) | 2006-12-14 | 2012-09-11 | Life Technologies Corporation | Methods and apparatus for measuring analytes using large scale FET arrays |
| JP2011505132A (en) | 2007-11-30 | 2011-02-24 | ゲノミクトリー インコーポレーテッド | Bladder cancer diagnostic kit and chip using methylation marker gene specific to bladder cancer |
| US20100035252A1 (en) | 2008-08-08 | 2010-02-11 | Ion Torrent Systems Incorporated | Methods for sequencing individual nucleic acids under tension |
| US20100301398A1 (en) | 2009-05-29 | 2010-12-02 | Ion Torrent Systems Incorporated | Methods and apparatus for measuring analytes |
| US20100137143A1 (en) | 2008-10-22 | 2010-06-03 | Ion Torrent Systems Incorporated | Methods and apparatus for measuring analytes |
| US8546128B2 (en) | 2008-10-22 | 2013-10-01 | Life Technologies Corporation | Fluidics system for sequential delivery of reagents |
| US8673627B2 (en) | 2009-05-29 | 2014-03-18 | Life Technologies Corporation | Apparatus and methods for performing electrochemical reactions |
| US8574835B2 (en) | 2009-05-29 | 2013-11-05 | Life Technologies Corporation | Scaffolded nucleic acid polymer particles and methods of making and using |
| US20120100548A1 (en) | 2010-10-26 | 2012-04-26 | Verinata Health, Inc. | Method for determining copy number variations |
| US9260745B2 (en) | 2010-01-19 | 2016-02-16 | Verinata Health, Inc. | Detecting and classifying copy number variation |
| CA2788664C (en) | 2010-03-04 | 2023-04-11 | Ventana Medical Systems, Inc. | Processing system for processing specimens using acoustic energy |
| CA2936532A1 (en) | 2010-04-20 | 2011-10-27 | Ventana Medical Systems, Inc. | Two-color chromogenic in situ hybridization |
| WO2011139976A1 (en) | 2010-05-04 | 2011-11-10 | Ventana Medical Systems, Inc. | Cell staining with air quenched steam heating |
| WO2012003478A2 (en) | 2010-07-02 | 2012-01-05 | Ventana Medical Systems, Inc. | Detecting targets using mass tags and mass spectrometry |
| CA2800936A1 (en) | 2010-07-02 | 2012-01-05 | Ventana Medical Systems, Inc. | Hapten conjugates for target detection |
| CN103415762A (en) | 2011-01-10 | 2013-11-27 | 文塔纳医疗系统公司 | Hematoxylin staining method |
| US9448231B2 (en) | 2011-02-28 | 2016-09-20 | Ventana Medical Systems, Inc. | Application of quantum dots for nuclear staining |
| GB2484764B (en) | 2011-04-14 | 2012-09-05 | Verinata Health Inc | Normalizing chromosomes for the determination and verification of common and rare chromosomal aneuploidies |
| JP6208121B2 (en) | 2011-05-09 | 2017-10-04 | ヴェンタナ メディカル システムズ, インク. | Spectral imaging to measure nuclear pathological features of cancer cells prepared for in situ analysis |
| US20130116209A1 (en) | 2011-08-02 | 2013-05-09 | Ventana Medical Systems, Inc. | Method for selection of chemotherapeutic agents for adenocarcinoma cancer |
| GB2497510A (en) | 2011-11-10 | 2013-06-19 | Harry Cuppens | Methods for determining mononucleotide sequence repeats |
| WO2013079606A1 (en) | 2011-12-01 | 2013-06-06 | Ventana Medical Systems, Inc. | Automated dual stain of mirna and protein targets |
| ES2695101T3 (en) | 2011-12-30 | 2019-01-02 | Ventana Med Syst Inc | Automated analysis of circulating tumor cells |
| US20130196880A1 (en) | 2012-01-27 | 2013-08-01 | Ventana Medical Systems, Inc. | Patterned devices and methods for detecting analytes |
| AU2013214345B2 (en) | 2012-02-01 | 2016-09-15 | Ventana Medical Systems, Inc. | System for detecting genes in tissue samples |
| US20130252240A1 (en) | 2012-03-21 | 2013-09-26 | Ventana Medical Systems, Inc. | Cryoembedded cell concentrates, methods for making, and methods for using |
| EP2904374B1 (en) | 2012-10-08 | 2023-11-29 | Ventana Medical Systems, Inc. | Methods and kits for clarifying pigmented samples |
| WO2014079802A2 (en) | 2012-11-20 | 2014-05-30 | Ventana Medical Systems, Inc. | Laser ablation inductively-coupled plasma mass spectral tissue diagnostics |
| WO2014106076A2 (en) | 2012-12-28 | 2014-07-03 | Quest Diagnostics Investments Incorporated | Universal sanger sequencing from next-gen sequencing amplicons |
| WO2014122548A2 (en) | 2013-02-07 | 2014-08-14 | Koninklijke Philips N.V. | Processing of nucleotide sequences |
| AU2014230945B2 (en) | 2013-03-12 | 2019-07-11 | Ventana Medical Systems, Inc. | Proximity assay for in situ detection of targets |
| EP3795696B1 (en) | 2013-03-15 | 2023-04-26 | The Board of Trustees of the Leland Stanford Junior University | Identification and use of circulating nucleic acid tumor markers |
| US20140278461A1 (en) | 2013-03-15 | 2014-09-18 | Memorial Sloan-Kettering Cancer Center | System and method for integrating a medical sequencing apparatus and laboratory system into a medical facility |
| WO2015032695A1 (en) | 2013-09-09 | 2015-03-12 | Ventana Medical Systems, Inc. | Scoring method for mesothelin protein expression |
| EP3055835B1 (en) | 2013-10-07 | 2019-12-18 | Ventana Medical Systems, Inc. | Systems and methods for comprehensive multi-assay tissue analysis |
| JP2017500004A (en) | 2013-10-18 | 2017-01-05 | セブン ブリッジズ ジェノミクス インコーポレイテッド | Methods and systems for genotyping gene samples |
| JP6588444B2 (en) | 2014-01-28 | 2019-10-09 | ベンタナ メディカル システムズ, インコーポレイテッド | Adaptive classification for total slide tissue segmentation |
| ES2689568T3 (en) | 2014-02-21 | 2018-11-14 | Ventana Medical Systems, Inc. | Single stranded oligonucleotide probes for enumeration of copies of chromosomes or genes |
| JP6825915B2 (en) | 2014-02-24 | 2021-02-03 | ヴェンタナ メディカル システムズ, インク. | Automatic RNA detection using a labeled 2'-O-methyl RNA oligonucleotide probe and signal amplification system |
| DK3111221T4 (en) | 2014-02-24 | 2022-04-19 | Ventana Med Syst Inc | Methods, kits and systems for scoring the immune response to cancer by simultaneous detection of CD3, CD8, CD20 and FOXP3 |
| EP3126847B1 (en) | 2014-03-31 | 2021-07-28 | Ventana Medical Systems, Inc. | Automated specimen processing systems and multistep processing of microscope slides |
| JP6629762B2 (en) | 2014-05-23 | 2020-01-15 | ベンタナ メディカル システムズ, インコーポレイテッド | Systems and methods for detection of biological structures and / or patterns in images |
| AU2015279191B2 (en) | 2014-06-27 | 2018-07-26 | F. Hoffmann-La Roche Ag | Automated specimen processing systems and methods of detecting specimen-bearing microscope slides |
| AU2017355460B2 (en) | 2016-11-02 | 2022-12-08 | Archerdx, Llc | Methods of nucleic acid sample preparation for immune repertoire sequencing |
| CA3046007A1 (en) | 2016-12-22 | 2018-06-28 | Guardant Health, Inc. | Methods and systems for analyzing nucleic acid molecules |
| EP3710820B1 (en) * | 2017-11-13 | 2025-06-11 | F. Hoffmann-La Roche AG | Devices for sample analysis using epitachophoresis |
| EP4269582A3 (en) * | 2017-12-21 | 2024-01-24 | F. Hoffmann-La Roche AG | Target enrichment by unidirectional dual probe primer extension |
| EP3864403A1 (en) * | 2018-10-12 | 2021-08-18 | F. Hoffmann-La Roche AG | Detection methods for epitachophoresis workflow automation |
-
2020
- 2020-05-12 CN CN202080050994.1A patent/CN114269916A/en active Pending
- 2020-05-12 US US17/595,263 patent/US20220325268A1/en active Pending
- 2020-05-12 JP JP2021567934A patent/JP7441243B2/en active Active
- 2020-05-12 EP EP20727170.1A patent/EP3969583A1/en active Pending
- 2020-05-12 WO PCT/EP2020/063112 patent/WO2020229437A1/en not_active Ceased
-
2023
- 2023-11-02 JP JP2023188408A patent/JP2024012501A/en not_active Withdrawn
Patent Citations (2)
| Publication number | Priority date | Publication date | Assignee | Title |
|---|---|---|---|---|
| US20120034685A1 (en) * | 2010-08-06 | 2012-02-09 | Tandem Diagnostics, Inc. | Assay systems for determination of source contribution in a sample |
| US20140349859A1 (en) * | 2010-08-06 | 2014-11-27 | Ariosa Diagnostics, Inc. | Detection of target nucleic acids using hybridization |
Non-Patent Citations (3)
| Title |
|---|
| BECKMAN: "SPRI 磁珠技术概述", Retrieved from the Internet <URL:https://www.mybeckman.cn/resources/technologies/spri-beads> * |
| FRANTISEK FORET: ""Macrofluidic Device for Preparative Concentration Based onEpitachophoresis"", 《ANALYTICAL CHEMISTRY》, pages 7047 - 7053 * |
| 曹际娟: "《食品微生物学与现代检测技术》", 30 April 2006, 辽宁师范大学出版社, pages: 539 - 540 * |
Cited By (3)
| Publication number | Priority date | Publication date | Assignee | Title |
|---|---|---|---|---|
| CN115144519A (en) * | 2022-06-30 | 2022-10-04 | 上海交通大学 | Single cell sample fingerprint detection method based on inorganic nanoparticles and application |
| CN116045835A (en) * | 2023-03-31 | 2023-05-02 | 成都太科光电技术有限责任公司 | Ultra-large caliber plane or spherical surface optical interference testing device |
| CN116045835B (en) * | 2023-03-31 | 2023-06-02 | 成都太科光电技术有限责任公司 | Ultra-large caliber plane or spherical surface optical interference testing device |
Also Published As
| Publication number | Publication date |
|---|---|
| US20220325268A1 (en) | 2022-10-13 |
| EP3969583A1 (en) | 2022-03-23 |
| JP2022532607A (en) | 2022-07-15 |
| JP2024012501A (en) | 2024-01-30 |
| WO2020229437A1 (en) | 2020-11-19 |
| JP7441243B2 (en) | 2024-02-29 |
Similar Documents
| Publication | Publication Date | Title |
|---|---|---|
| CN111656179B (en) | Device for sample analysis using epitope electrophoresis | |
| JP7441243B2 (en) | Apparatus and method for sample analysis | |
| US12153013B2 (en) | Detection methods for epitachophoresis workflow automation | |
| EP4428246B1 (en) | Methods of measuring mislocalization of an analyte | |
| EP4320271B1 (en) | Methods for increasing resolution of spatial analysis | |
| US12031177B1 (en) | Methods of enhancing spatial resolution of transcripts | |
| CN112166199B (en) | Methods, systems and compositions for counting nucleic acid molecules | |
| Sridhar et al. | Molecular genetic testing methodologies in hematopoietic diseases: current and future methods | |
| CN108026591B (en) | Diagnostic methods and compositions | |
| Solomon et al. | Molecular diagnostics of non-Hodgkin lymphoma | |
| CN116438454A (en) | Compositions and methods for isolating cell-free DNA | |
| US20230416809A1 (en) | Spatial detection of biomolecule interactions | |
| US20250122562A1 (en) | Proximity detection of biomolecule interactions | |
| US20250354209A1 (en) | In situ proximity detection of target biomolecules | |
| US20250243532A1 (en) | Oligonucleotide conjugates useful for in situ target detection | |
| US20240254544A1 (en) | Proximity oligonucleotides and methods of use thereof | |
| WO2024141901A1 (en) | Heat-based transfer of reaction products made in situ to a planar support |
Legal Events
| Date | Code | Title | Description |
|---|---|---|---|
| PB01 | Publication | ||
| PB01 | Publication | ||
| SE01 | Entry into force of request for substantive examination | ||
| SE01 | Entry into force of request for substantive examination |