CN113390666B - Method for detecting performance index of chemical substance in cell - Google Patents
Method for detecting performance index of chemical substance in cell Download PDFInfo
- Publication number
- CN113390666B CN113390666B CN202110682860.8A CN202110682860A CN113390666B CN 113390666 B CN113390666 B CN 113390666B CN 202110682860 A CN202110682860 A CN 202110682860A CN 113390666 B CN113390666 B CN 113390666B
- Authority
- CN
- China
- Prior art keywords
- data
- detection
- sample
- target
- sample slice
- Prior art date
- Legal status (The legal status is an assumption and is not a legal conclusion. Google has not performed a legal analysis and makes no representation as to the accuracy of the status listed.)
- Active
Links
- 239000000126 substance Substances 0.000 title claims abstract description 44
- 238000000034 method Methods 0.000 title claims abstract description 34
- 238000001514 detection method Methods 0.000 claims abstract description 60
- 238000010166 immunofluorescence Methods 0.000 claims abstract description 17
- 238000001262 western blot Methods 0.000 claims abstract description 16
- 150000001875 compounds Chemical class 0.000 claims abstract description 4
- 230000007831 electrophysiology Effects 0.000 claims abstract 4
- 238000002001 electrophysiology Methods 0.000 claims abstract 4
- 239000002207 metabolite Substances 0.000 claims description 24
- 102000004169 proteins and genes Human genes 0.000 claims description 17
- 108090000623 proteins and genes Proteins 0.000 claims description 17
- 150000002500 ions Chemical class 0.000 claims description 16
- FAPWRFPIFSIZLT-UHFFFAOYSA-M Sodium chloride Chemical compound [Na+].[Cl-] FAPWRFPIFSIZLT-UHFFFAOYSA-M 0.000 claims description 14
- 230000001242 postsynaptic effect Effects 0.000 claims description 14
- 210000005013 brain tissue Anatomy 0.000 claims description 12
- 230000002964 excitative effect Effects 0.000 claims description 8
- 239000000203 mixture Substances 0.000 claims description 7
- WQZGKKKJIJFFOK-GASJEMHNSA-N Glucose Natural products OC[C@H]1OC(O)[C@H](O)[C@@H](O)[C@@H]1O WQZGKKKJIJFFOK-GASJEMHNSA-N 0.000 claims description 6
- 229930006000 Sucrose Natural products 0.000 claims description 6
- CZMRCDWAGMRECN-UGDNZRGBSA-N Sucrose Chemical compound O[C@H]1[C@H](O)[C@@H](CO)O[C@@]1(CO)O[C@@H]1[C@H](O)[C@@H](O)[C@H](O)[C@@H](CO)O1 CZMRCDWAGMRECN-UGDNZRGBSA-N 0.000 claims description 6
- 239000008103 glucose Substances 0.000 claims description 6
- 239000005720 sucrose Substances 0.000 claims description 6
- 239000002858 neurotransmitter agent Substances 0.000 claims description 4
- 230000003518 presynaptic effect Effects 0.000 claims description 4
- 238000012545 processing Methods 0.000 claims description 4
- 101001092197 Homo sapiens RNA binding protein fox-1 homolog 3 Proteins 0.000 claims description 3
- 102100035530 RNA binding protein fox-1 homolog 3 Human genes 0.000 claims description 3
- 102000004310 Ion Channels Human genes 0.000 claims description 2
- 238000006243 chemical reaction Methods 0.000 claims description 2
- 230000002401 inhibitory effect Effects 0.000 claims description 2
- 239000012528 membrane Substances 0.000 claims description 2
- 230000003287 optical effect Effects 0.000 claims description 2
- 238000005259 measurement Methods 0.000 claims 1
- 230000035479 physiological effects, processes and functions Effects 0.000 claims 1
- 238000001507 sample dispersion Methods 0.000 claims 1
- 230000000007 visual effect Effects 0.000 claims 1
- 238000011160 research Methods 0.000 abstract description 6
- 239000000243 solution Substances 0.000 description 14
- 210000004027 cell Anatomy 0.000 description 12
- 230000003834 intracellular effect Effects 0.000 description 10
- 238000004458 analytical method Methods 0.000 description 6
- 239000011780 sodium chloride Substances 0.000 description 6
- HUCVOHYBFXVBRW-UHFFFAOYSA-M caesium hydroxide Chemical compound [OH-].[Cs+] HUCVOHYBFXVBRW-UHFFFAOYSA-M 0.000 description 4
- 210000001175 cerebrospinal fluid Anatomy 0.000 description 4
- 230000037353 metabolic pathway Effects 0.000 description 4
- 210000001519 tissue Anatomy 0.000 description 4
- 239000012482 calibration solution Substances 0.000 description 3
- 230000008569 process Effects 0.000 description 3
- JKMHFZQWWAIEOD-UHFFFAOYSA-N 2-[4-(2-hydroxyethyl)piperazin-1-yl]ethanesulfonic acid Chemical compound OCC[NH+]1CCN(CCS([O-])(=O)=O)CC1 JKMHFZQWWAIEOD-UHFFFAOYSA-N 0.000 description 2
- -1 CaCl 2 Chemical compound 0.000 description 2
- 239000007995 HEPES buffer Substances 0.000 description 2
- 241000282414 Homo sapiens Species 0.000 description 2
- HLCFGWHYROZGBI-JJKGCWMISA-M Potassium gluconate Chemical compound [K+].OC[C@@H](O)[C@@H](O)[C@H](O)[C@@H](O)C([O-])=O HLCFGWHYROZGBI-JJKGCWMISA-M 0.000 description 2
- 230000008859 change Effects 0.000 description 2
- 238000012258 culturing Methods 0.000 description 2
- 238000011161 development Methods 0.000 description 2
- 238000005516 engineering process Methods 0.000 description 2
- DEFVIWRASFVYLL-UHFFFAOYSA-N ethylene glycol bis(2-aminoethyl)tetraacetic acid Chemical compound OC(=O)CN(CC(O)=O)CCOCCOCCN(CC(O)=O)CC(O)=O DEFVIWRASFVYLL-UHFFFAOYSA-N 0.000 description 2
- HNDVDQJCIGZPNO-UHFFFAOYSA-N histidine Natural products OC(=O)C(N)CC1=CN=CN1 HNDVDQJCIGZPNO-UHFFFAOYSA-N 0.000 description 2
- 210000002569 neuron Anatomy 0.000 description 2
- 229960003189 potassium gluconate Drugs 0.000 description 2
- 239000004224 potassium gluconate Substances 0.000 description 2
- 235000013926 potassium gluconate Nutrition 0.000 description 2
- 210000002966 serum Anatomy 0.000 description 2
- 210000000225 synapse Anatomy 0.000 description 2
- 238000005406 washing Methods 0.000 description 2
- 102000007469 Actins Human genes 0.000 description 1
- 108010085238 Actins Proteins 0.000 description 1
- 102000047174 Disks Large Homolog 4 Human genes 0.000 description 1
- 108700019745 Disks Large Homolog 4 Proteins 0.000 description 1
- 230000015572 biosynthetic process Effects 0.000 description 1
- 210000004369 blood Anatomy 0.000 description 1
- 239000008280 blood Substances 0.000 description 1
- 230000008499 blood brain barrier function Effects 0.000 description 1
- 210000001218 blood-brain barrier Anatomy 0.000 description 1
- 238000004364 calculation method Methods 0.000 description 1
- 230000033310 detection of chemical stimulus Effects 0.000 description 1
- 201000010099 disease Diseases 0.000 description 1
- 208000037265 diseases, disorders, signs and symptoms Diseases 0.000 description 1
- 239000006185 dispersion Substances 0.000 description 1
- 239000003814 drug Substances 0.000 description 1
- 230000000694 effects Effects 0.000 description 1
- 238000010191 image analysis Methods 0.000 description 1
- 238000011534 incubation Methods 0.000 description 1
- 238000004949 mass spectrometry Methods 0.000 description 1
- 230000002503 metabolic effect Effects 0.000 description 1
- 238000012544 monitoring process Methods 0.000 description 1
- 238000010606 normalization Methods 0.000 description 1
- 230000008621 organismal health Effects 0.000 description 1
- 230000037361 pathway Effects 0.000 description 1
- 230000004044 response Effects 0.000 description 1
- 230000000638 stimulation Effects 0.000 description 1
- 230000000946 synaptic effect Effects 0.000 description 1
- 230000008685 targeting Effects 0.000 description 1
- 238000012360 testing method Methods 0.000 description 1
- 210000003462 vein Anatomy 0.000 description 1
Images

Classifications
-
- G—PHYSICS
- G01—MEASURING; TESTING
- G01N—INVESTIGATING OR ANALYSING MATERIALS BY DETERMINING THEIR CHEMICAL OR PHYSICAL PROPERTIES
- G01N1/00—Sampling; Preparing specimens for investigation
- G01N1/02—Devices for withdrawing samples
- G01N1/04—Devices for withdrawing samples in the solid state, e.g. by cutting
- G01N1/06—Devices for withdrawing samples in the solid state, e.g. by cutting providing a thin slice, e.g. microtome
-
- G—PHYSICS
- G01—MEASURING; TESTING
- G01N—INVESTIGATING OR ANALYSING MATERIALS BY DETERMINING THEIR CHEMICAL OR PHYSICAL PROPERTIES
- G01N27/00—Investigating or analysing materials by the use of electric, electrochemical, or magnetic means
-
- G—PHYSICS
- G01—MEASURING; TESTING
- G01N—INVESTIGATING OR ANALYSING MATERIALS BY DETERMINING THEIR CHEMICAL OR PHYSICAL PROPERTIES
- G01N27/00—Investigating or analysing materials by the use of electric, electrochemical, or magnetic means
- G01N27/62—Investigating or analysing materials by the use of electric, electrochemical, or magnetic means by investigating the ionisation of gases, e.g. aerosols; by investigating electric discharges, e.g. emission of cathode
-
- G—PHYSICS
- G01—MEASURING; TESTING
- G01N—INVESTIGATING OR ANALYSING MATERIALS BY DETERMINING THEIR CHEMICAL OR PHYSICAL PROPERTIES
- G01N33/00—Investigating or analysing materials by specific methods not covered by groups G01N1/00 - G01N31/00
- G01N33/48—Biological material, e.g. blood, urine; Haemocytometers
- G01N33/50—Chemical analysis of biological material, e.g. blood, urine; Testing involving biospecific ligand binding methods; Immunological testing
- G01N33/53—Immunoassay; Biospecific binding assay; Materials therefor
- G01N33/531—Production of immunochemical test materials
-
- G—PHYSICS
- G01—MEASURING; TESTING
- G01N—INVESTIGATING OR ANALYSING MATERIALS BY DETERMINING THEIR CHEMICAL OR PHYSICAL PROPERTIES
- G01N33/00—Investigating or analysing materials by specific methods not covered by groups G01N1/00 - G01N31/00
- G01N33/48—Biological material, e.g. blood, urine; Haemocytometers
- G01N33/50—Chemical analysis of biological material, e.g. blood, urine; Testing involving biospecific ligand binding methods; Immunological testing
- G01N33/58—Chemical analysis of biological material, e.g. blood, urine; Testing involving biospecific ligand binding methods; Immunological testing involving labelled substances
- G01N33/582—Chemical analysis of biological material, e.g. blood, urine; Testing involving biospecific ligand binding methods; Immunological testing involving labelled substances with fluorescent label
-
- G—PHYSICS
- G01—MEASURING; TESTING
- G01N—INVESTIGATING OR ANALYSING MATERIALS BY DETERMINING THEIR CHEMICAL OR PHYSICAL PROPERTIES
- G01N33/00—Investigating or analysing materials by specific methods not covered by groups G01N1/00 - G01N31/00
- G01N33/48—Biological material, e.g. blood, urine; Haemocytometers
- G01N33/50—Chemical analysis of biological material, e.g. blood, urine; Testing involving biospecific ligand binding methods; Immunological testing
- G01N33/68—Chemical analysis of biological material, e.g. blood, urine; Testing involving biospecific ligand binding methods; Immunological testing involving proteins, peptides or amino acids
- G01N33/6875—Nucleoproteins
Landscapes
- Health & Medical Sciences (AREA)
- Life Sciences & Earth Sciences (AREA)
- Immunology (AREA)
- Chemical & Material Sciences (AREA)
- Engineering & Computer Science (AREA)
- Pathology (AREA)
- Biomedical Technology (AREA)
- Hematology (AREA)
- General Physics & Mathematics (AREA)
- Molecular Biology (AREA)
- Urology & Nephrology (AREA)
- Analytical Chemistry (AREA)
- General Health & Medical Sciences (AREA)
- Biochemistry (AREA)
- Physics & Mathematics (AREA)
- Cell Biology (AREA)
- Medicinal Chemistry (AREA)
- Food Science & Technology (AREA)
- Microbiology (AREA)
- Biotechnology (AREA)
- Chemical Kinetics & Catalysis (AREA)
- Electrochemistry (AREA)
- Proteomics, Peptides & Aminoacids (AREA)
- Investigating Or Analysing Biological Materials (AREA)
- Measuring Or Testing Involving Enzymes Or Micro-Organisms (AREA)
Abstract
Description
技术领域technical field
本发明涉及人生物技术领域,特别涉及一种检测细胞内化学物质的性能指标方法。The invention relates to the technical field of human biology, in particular to a performance index method for detecting intracellular chemical substances.
背景技术Background technique
随着科技的发展,人们对生物的化学物质的研究越来越重要,尤其是细胞内的化学物质,可以在不同领域对人类的发展做出贡献,例如在医学领域能够攻克许多疾病,在对细胞内的化学物质的研究就离不开细胞内的化学物质的检测过程,只有准确的检测才能更好的了解化学物质的性能和用途。With the development of science and technology, people's research on biological chemical substances is becoming more and more important, especially the chemical substances in cells, which can contribute to the development of human beings in different fields. For example, in the field of medicine, many diseases can be overcome. The study of chemical substances in cells is inseparable from the detection process of chemical substances in cells. Only accurate detection can better understand the properties and uses of chemical substances.
目前,对于细胞内的化学物质会根据不同的实验结果进行分析,得到不同研究成果,现有技术中无法对细胞内的化学物质检测形成一套系统,以用于针对不同成分或者含量细胞内化学物质得到一个初步的判断方向,以用于进一步的研究,避免对细胞内的化学物质的研究出现误导,浪费研发资源和时间。At present, the chemical substances in cells are analyzed according to different experimental results, and different research results are obtained. In the prior art, it is impossible to form a system for the detection of chemical substances in cells, which can be used to target different components or contents of intracellular chemicals. Substances get a preliminary judgment direction for further research, avoiding misleading research on chemical substances in cells and wasting R&D resources and time.
发明内容Contents of the invention
为了解决现有技术的问题,能够基于同一个样本切片进行多种检测,一方面能够减少其他外部因素对检测的影响,导致对于同一实验对象具有不同的实验结果,另一方面,能够满足不同检测的需求,提供细胞内的化学物质初步的研究方向;本发明实施例提供了一种检测细胞内化学物质的性能指标方法,所述方法包括如下步骤:In order to solve the problems of the existing technology, multiple detections can be performed based on the same sample slice. On the one hand, it can reduce the influence of other external factors on the detection, resulting in different experimental results for the same experimental object. On the other hand, it can meet different detection requirements. To meet the demand, provide the preliminary research direction of the chemical substances in the cells; the embodiment of the present invention provides a method for detecting the performance indicators of the chemical substances in the cells, and the method includes the following steps:
S1、制备样本切片;S1, preparing sample slices;
S2、对所述样本切片依次进行MS检测、电学生理学检测、蛋白质印迹检测和免疫荧光检测,得到目标样本切片对应的目标检测数据集,所述目标检测数据集包括:MS数据、电学生理数据、蛋白质印迹数据和免疫荧光数据;S2. Perform MS detection, electrophysiological detection, Western blot detection, and immunofluorescence detection on the sample slice in sequence to obtain a target detection data set corresponding to the target sample slice. The target detection data set includes: MS data, electrophysiological data, Western blot data and immunofluorescence data;
S3、将所述目标检测数据进行分析,得到所述样本切片中化合物的性能指标。S3. Analyzing the target detection data to obtain the performance index of the compound in the sample slice.
进一步地,S1还包括如下步骤:Further, S1 also includes the following steps:
取出目标对象的脑部组织样本;Remove a sample of brain tissue from the subject;
将所述脑部组织样本放置在切片溶液内进行培养处理,其中,所述切片溶液成分包括:蔗糖、NaCl、NaHCO3、MgCl2、葡萄糖、KCl和NaH2PO4;placing the brain tissue sample in a slicing solution for culturing, wherein the components of the slicing solution include: sucrose, NaCl, NaHCO 3 , MgCl 2 , glucose, KCl and NaH 2 PO 4 ;
将培养后的脑部组织样本进行切片,得到所述样本切片。Slicing the cultured brain tissue samples to obtain the sample slices.
进一步地,蔗糖、NaCl、NaHCO3、MgCl2、葡萄糖、KCl和NaH2PO4的化学成分含量为:200mM、30mM、26mM、1mM、10mM、4.5mM和1.2mM,含量的顺序是按照化学成分的顺序进行排序。Further, the chemical composition contents of sucrose, NaCl, NaHCO 3 , MgCl 2 , glucose, KCl and NaH 2 PO 4 are: 200mM, 30mM, 26mM, 1mM, 10mM, 4.5mM and 1.2mM, the order of contents is according to the chemical composition sorted in order.
进一步地,所述样本切片厚度为300μm。Further, the sample slice thickness is 300 μm.
进一步地,所述方法还包括如下方法对MS数据进行分析:提取MS数据中代谢物离子强度,以根据代谢物离子强度得到同位素标记的代谢物和未被同位素标记的代谢物之间的变化值。Further, the method further includes analyzing the MS data as follows: extracting the ion intensity of the metabolites in the MS data, so as to obtain the change value between the isotope-labeled metabolite and the non-isotope-labeled metabolite according to the metabolite ion intensity .
进一步地,所述方法还包括如下方法对电学生理学检测数据进行分析:电学生理学检测数据中60-90个光激发的兴奋性突触后电流的平均值,得到兴奋性突触后电流的变异度。Further, the method also includes the following method for analyzing the electrophysiological detection data: the average value of 60-90 light-excited excitatory postsynaptic currents in the electrophysiological detection data to obtain the variability of the excitatory postsynaptic current .
进一步地,所述方法还包括如下方法对蛋白质印迹数据进行分析:提取蛋白质印迹数据中蛋白条带,并根据蛋白条带计算出目标灰度值;Further, the method also includes analyzing the western blot data as follows: extracting protein bands in the western blot data, and calculating the target gray value according to the protein bands;
根据目标灰度值与预设的灰度阈值进行对比,调整蛋白条带。Adjust the protein bands according to the comparison between the target gray value and the preset gray threshold.
进一步地,所述方法还包括如下方法对免疫荧光数据进行分析:根据免疫荧光数据得到荧光标记的NeuN蛋白数量。Further, the method further includes analyzing the immunofluorescence data as follows: obtaining the quantity of fluorescently labeled NeuN protein according to the immunofluorescence data.
本发明提供的一种检测细胞内化学物质的性能指标方法,具有如下技术效果:A performance index method for detecting intracellular chemical substances provided by the present invention has the following technical effects:
本发明能够制备出样本切片,将所述样本切片进行检测,得到样本切片的中化学物质和化学物质的检测结果,对所述化学物质的检测结果进行分析,得到所述样本切片的性能指标值;其中,所述化学物质的检测结果包括:MS数据、电学生理数据、蛋白质印迹数据和免疫荧光数据,能够实现多种检测且不需要更换检测样本,保证检测的准确性,以及根据不同的化学物质采用对应的检测方法进行检测,避免检测结果的不准确进而影响到对该细胞内化学物质的判断,使得研究人员可以根据胞内化学物质预测出细胞的代谢状态。The present invention can prepare a sample slice, detect the sample slice, obtain the chemical substance in the sample slice and the detection result of the chemical substance, analyze the detection result of the chemical substance, and obtain the performance index value of the sample slice ; Wherein, the detection results of the chemical substances include: MS data, electrophysiological data, Western blot data and immunofluorescence data, which can realize multiple detections and do not need to replace the detection samples to ensure the accuracy of detection, and according to different chemical Substances are detected by corresponding detection methods to avoid inaccurate detection results and affect the judgment of the chemical substances in the cell, so that researchers can predict the metabolic state of the cell based on the intracellular chemical substances.
附图说明Description of drawings
为了更清楚地说明本发明实施例中的技术方案,下面将对实施例描述中所需要使用的附图作简单地介绍,显而易见地,下面描述中的附图仅仅是本发明的一些实施例,对于本领域普通技术人员来讲,在不付出创造性劳动的前提下,还可以根据这些附图获得其他的附图。In order to more clearly illustrate the technical solutions in the embodiments of the present invention, the drawings that need to be used in the description of the embodiments will be briefly introduced below. Obviously, the drawings in the following description are only some embodiments of the present invention. For those skilled in the art, other drawings can also be obtained based on these drawings without creative effort.
图1是本发明实施例一种检测细胞内化学物质的性能指标方法的流程图。FIG. 1 is a flowchart of a method for detecting performance indicators of intracellular chemical substances according to an embodiment of the present invention.
具体实施方式Detailed ways
下面将结合本发明实施例中的附图,对本发明实施例中的技术方案进行清楚、完整地描述,显然,所描述的实施例仅仅是本发明一部分实施例,而不是全部的实施例。基于本发明中的实施例,本领域普通技术人员在没有做出创造性劳动的前提下所获得的所有其他实施例,都属于本发明保护的范围。The following will clearly and completely describe the technical solutions in the embodiments of the present invention with reference to the accompanying drawings in the embodiments of the present invention. Obviously, the described embodiments are only some, not all, embodiments of the present invention. Based on the embodiments of the present invention, all other embodiments obtained by persons of ordinary skill in the art without making creative efforts belong to the protection scope of the present invention.
需要说明的是,本发明的说明书和权利要求书及上述附图中的术语“第一”、“第二”等是用于区别类似的对象,而不必用于描述特定的顺序或先后次序。应该理解这样使用的数据在适当情况下可以互换,以便这里描述的本发明的实施例能够以除了在这里图示或描述的那些以外的顺序实施。此外,术语“包括”和“具有”以及他们的任何变形,意图在于覆盖不排他的包含,例如,包含了一系列步骤或单元的过程、方法、系统、产品或服务器不必限于清楚地列出的那些步骤或单元,而是可包括没有清楚地列出的或对于这些过程、方法、产品或设备固有的其它步骤或单元。It should be noted that the terms "first" and "second" in the description and claims of the present invention and the above drawings are used to distinguish similar objects, but not necessarily used to describe a specific sequence or sequence. It is to be understood that the data so used are interchangeable under appropriate circumstances such that the embodiments of the invention described herein can be practiced in sequences other than those illustrated or described herein. Furthermore, the terms "comprising" and "having", as well as any variations thereof, are intended to cover a non-exclusive inclusion, for example, a process, method, system, product or server comprising a series of steps or elements is not necessarily limited to the expressly listed instead, may include other steps or elements not explicitly listed or inherent to the process, method, product or apparatus.
如图1所示,本实施例提供了一种检测细胞内化学物质的性能指标方法,所述方法包括如下步骤:As shown in Figure 1, the present embodiment provides a method for detecting performance indicators of intracellular chemical substances, the method comprising the following steps:
S1、制备样本切片;S1, preparing sample slices;
S2、对所述样本切片依次进行MS检测、电学生理学检测、蛋白质印迹检测和免疫荧光检测,得到目标样本切片对应的目标检测数据集,所述目标检测数据集包括:MS数据、电学生理数据、蛋白质印迹数据和免疫荧光数据;S2. Perform MS detection, electrophysiological detection, Western blot detection, and immunofluorescence detection on the sample slice in sequence to obtain a target detection data set corresponding to the target sample slice. The target detection data set includes: MS data, electrophysiological data, Western blot data and immunofluorescence data;
S3、将所述目标检测数据进行分析,得到所述样本切片中化合物的性能指标。S3. Analyzing the target detection data to obtain the performance index of the compound in the sample slice.
进一步地,S1还包括如下步骤:Further, S1 also includes the following steps:
取出目标对象的脑部组织样本;Remove a sample of brain tissue from the subject;
将所述脑部组织样本放置在切片溶液内进行培养处理,其中,所述切片溶液成分包括:蔗糖、NaCl、NaHCO3、MgCl2、葡萄糖、KCl和NaH2PO4;placing the brain tissue sample in a slicing solution for culturing, wherein the components of the slicing solution include: sucrose, NaCl, NaHCO 3 , MgCl 2 , glucose, KCl and NaH 2 PO 4 ;
将培养后的脑部组织样本进行切片,得到所述样本切片。Slicing the cultured brain tissue samples to obtain the sample slices.
进一步地,蔗糖、NaCl、NaHCO3、MgCl2、葡萄糖、KCl和NaH2PO4的化学成分含量为:200mM、30mM、26mM、1mM、10mM、4.5mM和1.2mM,含量的顺序是按照化学成分的顺序进行排序。Further, the chemical composition contents of sucrose, NaCl, NaHCO 3 , MgCl 2 , glucose, KCl and NaH 2 PO 4 are: 200mM, 30mM, 26mM, 1mM, 10mM, 4.5mM and 1.2mM, the order of contents is according to the chemical composition sorted in order.
进一步地,所述样本切片厚度为300μm。Further, the sample slice thickness is 300 μm.
进一步地,所述方法还包括根据所述样本切片制备目标样本切片,如下在制备预制溶液,其中,所述预制溶液是指标记同位素组氨酸的稀释溶液;Further, the method also includes preparing target sample slices according to the sample slices, as follows to prepare a prefabricated solution, wherein the prefabricated solution refers to a diluted solution of the labeled isotope histidine;
在室温条件下,将所述样本切片在所述预制溶液中进行预设时间的孵育处理;Under room temperature conditions, incubating the sample slices in the prefabricated solution for a preset time;
将孵育处理后的所述样本切片进行清洗处理,并在清洗处理后的所述样本切片上获取单神经元样本;Washing the sample slice after incubation, and obtaining a single neuron sample on the sample slice after washing;
将预设的同位素溶液注射至所述单神经元样本内,得到所述目标样本切片。A preset isotope solution is injected into the single neuron sample to obtain the target sample slice.
进一步地,所述同位素可以采用13C。Further, the isotope may be 13 C.
进一步地,在S3中对所述MS数据进行分析之前还包括:将MS数据中UCA数值曲线进行校准处理,所述校准处理包括如下步骤:Further, before analyzing the MS data in S3, it also includes: performing calibration processing on the UCA numerical curve in the MS data, and the calibration processing includes the following steps:
根据标准样品配制若干个不同浓度的校准溶液,其中每个所述校准溶液为细胞内溶液;Prepare several calibration solutions with different concentrations according to the standard sample, wherein each calibration solution is an intracellular solution;
基于每个所述校准溶液按照浓度的大小依次对所述UCA数值曲进行校准。Based on each of the calibration solutions, the UCA value curve is calibrated sequentially according to the concentration.
进一步地,所述细胞内溶液的化学成分为:葡萄糖酸钾、NaCl、EGTA、HEPES、CaCl2、CsOH、MgCl2、Na-ATP和Na-GTP。Further, the chemical composition of the intracellular solution is: potassium gluconate, NaCl, EGTA, HEPES, CaCl 2 , CsOH, MgCl 2 , Na-ATP and Na-GTP.
进一步地,萄糖酸钾、NaCl、EGTA、HEPES、CaCl2、CsOH、MgCl2、Na-ATP和Na-GTP的含量分别为:130mM、6mM、10mM,、10mM、1mM、4mM、1mM、2mM和0.2mM,其中,含量的顺序是按照化学成分的顺序进行排序。Further, the contents of potassium gluconate, NaCl, EGTA, HEPES, CaCl 2 , CsOH, MgCl 2 , Na-ATP and Na-GTP are respectively: 130mM, 6mM, 10mM, 10mM, 1mM, 4mM, 1mM, 2mM and 0.2mM, wherein, the order of content is sorted according to the order of chemical composition.
进一步地,所述同位素组氨酸的稀释溶液通过脑脊液进行稀释和清洗处理。Further, the dilute solution of the isotope histidine is diluted and washed through the cerebrospinal fluid.
进一步地,在S3中,根据所述MS数据的分析结果,得到样本切片的中化学物质的代谢路径,还包括如下步骤:Further, in S3, according to the analysis result of the MS data, obtaining the metabolic pathway of the chemical substance in the sample slice also includes the following steps:
对标记同位素的代谢物离子强度对应的增值与预设的阈值进行对比,所述增值是指代谢物离子强度占物质质量数百分比的增量值;Comparing the increment value corresponding to the metabolite ion intensity of the labeled isotope with the preset threshold, the increment refers to the increment value of the metabolite ion intensity as a percentage of the mass number of the substance;
当标记同位素的代谢物离子强度对应的增值大于所述阈值,则跟踪标记同位素的化学物质形成代谢路径上。When the increase value corresponding to the ion intensity of the metabolite of the labeled isotope is greater than the threshold value, the formation of the chemical substance of the labeled isotope is tracked on the metabolic pathway.
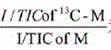
进一步地,所述方法还包括如下方法对MS数据进行分析:提取MS数据中代谢物离子强度,以根据代谢物离子强度得到同位素标记的代谢物和未被同位素标记的代谢物之间的变化值。Further, the method further includes analyzing the MS data as follows: extracting the ion intensity of the metabolites in the MS data, so as to obtain the change value between the isotope-labeled metabolite and the non-isotope-labeled metabolite according to the metabolite ion intensity .
优先地,具体采用如下公式:Preferably, the following formula is specifically adopted:

其中,
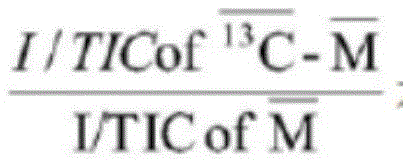
由此可见,通过上述的方法对MS数据进行预处理时使用代谢物离子强度除以总离子流(I/TIC)进行标准化,能够避免原始数据中不同样品质谱检测信号的总离子流存在差异,致使各个样品间可比性差,进而提高样品间信号的可比性和结果更准确。进一步地,所述方法还包括如下方法对电学生理学检测数据进行分析:电学生理学检测数据中60-90个光激发的兴奋性突触后电流的平均值,得到兴奋性突触后电流的变异度。It can be seen that when the MS data is preprocessed by the above method, the metabolite ion intensity is divided by the total ion current (I/TIC) for normalization, which can avoid the difference in the total ion current of different sample mass spectrometry detection signals in the original data, As a result, the comparability between samples is poor, thereby improving the comparability of signals between samples and making the results more accurate. Further, the method also includes the following method for analyzing the electrophysiological detection data: the average value of 60-90 light-excited excitatory postsynaptic currents in the electrophysiological detection data to obtain the variability of the excitatory postsynaptic current .
具体地,采用如下公式进行处理:Specifically, the following formula is used for processing:
ρ2=IQ(1-P),ρ2=IQ(1-P),
其中,N为突触数目,即进行电学生理学分析中脑组织切片上给电刺激区域的神经突触的数量;Among them, N is the number of synapses, that is, the number of synapses in the area of electrical stimulation on the brain tissue slice in the electrophysiological analysis;
Q为量子大小,即为单个神经递质囊泡释放导致的的突触后反应;Q is the quantum size, which is the post-synaptic response caused by the release of a single neurotransmitter vesicle;
ρ2为变异度,为统计学指标,即样本离散程度;ρ2 is the degree of variability, which is a statistical indicator, that is, the degree of dispersion of the sample;
I为电流,即为电学生理监测突触后兴奋性电流或突触后抑制性电流,其产生是由于突触前递质释放,作用于突触后的离子通道所致带电离子流动形成的;I is the current, which is the electrophysiological monitoring of post-synaptic excitatory current or post-synaptic inhibitory current, which is formed by the flow of charged ions caused by the release of pre-synaptic transmitters and acting on post-synaptic ion channels;
P为释放概率,即为突触前膜释放神经递质这一事件的概率。P is the release probability, which is the probability of the event that the presynaptic membrane releases the neurotransmitter.
进一步地,所述方法还包括如下方法对蛋白质印迹数据进行分析:Further, the method also includes analyzing the western blot data as follows:
提取蛋白质印迹数据中蛋白条带,并根据蛋白条带计算出目标灰度值;Extract the protein bands in the western blot data, and calculate the target gray value according to the protein bands;
根据目标灰度值与预设的灰度阈值进行对比,调整蛋白条带。Adjust the protein bands according to the comparison between the target gray value and the preset gray threshold.
具体地,采用如下公式:Specifically, the following formula is used:


进一步地,参照蛋白条带可以选择NAPDH或β-actin,但在某些特殊组织区域,选取更具特异性的参照蛋白,可以在对应组织获得更为准确的结果,使实验结果具有组织特异性和靶向性。如在突触区域样品分析中,选用PSD-95作为参照蛋白;进而能够避免由于样品绝对量难免存在差异,绝对量大的样品其蛋白条带宽,因此可能导致分析结果不准确。Furthermore, NAPDH or β-actin can be selected as the reference protein band, but in some special tissue regions, a more specific reference protein can be selected to obtain more accurate results in the corresponding tissue, making the experimental results tissue-specific and targeting. For example, in the analysis of synaptic region samples, PSD-95 is selected as the reference protein; thus, it can avoid the unavoidable difference in the absolute amount of the sample, and the protein band width of the sample with a large absolute amount may lead to inaccurate analysis results.
进一步地,所述方法还包括如下方法对免疫荧光数据进行分析:根据免疫荧光数据得到荧光标记的NeuN蛋白数量。Further, the method further includes analyzing the immunofluorescence data as follows: obtaining the quantity of fluorescently labeled NeuN protein according to the immunofluorescence data.
具体地,采用公式如下:Specifically, the formula is as follows:
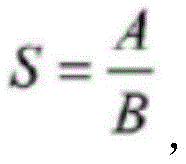
进一步地,A和B均是通过免疫荧光数据进行提取的,并且视野内是指通过显微仪器观察的视野,本领域技术人员能够根据实际需求进行选择,在此不再赘述。Further, both A and B are extracted through immunofluorescence data, and the field of view refers to the field of view observed by a microscopic instrument, which can be selected by those skilled in the art according to actual needs, and will not be repeated here.
由此可见,通过上述方法能够提高了实验结果的准确性,排除了因拍摄、切片、组织大小差异带来的误差。图像分析使用平均灰度值计算荧光强度,有效排除细胞大小、每个视野内细胞数目带来的计算结果差异。It can be seen that the accuracy of the experimental results can be improved through the above method, and errors caused by differences in photographing, slicing, and tissue size can be eliminated. Image analysis uses the average gray value to calculate the fluorescence intensity, which effectively excludes the differences in the calculation results caused by the cell size and the number of cells in each field of view.
在一个具体的实施例中,采用同位素和未采用同位素的血液和脑脊液的数据进行对比,得到如表1。In a specific embodiment, the data of blood and cerebrospinal fluid with and without isotope are compared, as shown in Table 1.
表1Table 1

在一个具体的实施例中,采用同位素和未采用同位素进行孵育处理的目标样本切片对应的MS分析数据分析结果进行对比,得到如表2。In a specific embodiment, the analysis results of MS analysis data corresponding to the slices of target samples incubated with and without isotopes were compared, as shown in Table 2.
表2Table 2

根据表1和表2可知,通过尾静脉注射稳定同位素进行代谢物和代谢通路示踪,可有效说明:代谢物跨过血脑屏障的能力、代谢物之间转化的特异性和准确性和代谢通路的准确确认。此外,稳定同位素较传统放射性同位素示踪有着明显的优点,安全性和稳定性得到显著提升。According to Table 1 and Table 2, it can be seen that traces of metabolites and metabolic pathways by injecting stable isotopes into the tail vein can effectively explain: the ability of metabolites to cross the blood-brain barrier, the specificity and accuracy of metabolite conversion, and the metabolic pathways. Accurate identification of pathways. In addition, stable isotopes have obvious advantages over traditional radioisotope tracers, and their safety and stability have been significantly improved.
综上所述,表能够通过制备血清和脑脊液样本,基于所述血清和脑脊液,制备出样本切片,将所述样本切片进行检测,得到样本切片的中化学物质和化学物质的检测结果,对所述化学物质的检测结果进行分析,得到所述样本切片的性能指标值;其中,所述化学物质的检测结果包括:MS数据、MR数据、电学生理数据、蛋白质印迹数据和免疫荧光数据一种或者多种组合,能够实现多种检测且不需要更换检测样本,保证检测的准确性,以及根据不同的化学物质采用对应的检测方法进行检测,避免检测结果的不准确进而影响到对该细胞内化学物质的判断,使得研究人员可以根据胞内化学物质预测出生物的健康。In summary, the table can prepare samples of serum and cerebrospinal fluid, prepare sample slices based on the serum and cerebrospinal fluid, and test the sample slices to obtain the detection results of chemical substances and chemical substances in the sample slices. The detection results of the chemical substances are analyzed to obtain the performance index values of the sample slices; wherein the detection results of the chemical substances include: one of MS data, MR data, electrophysiological data, Western blot data and immunofluorescence data or A variety of combinations can achieve a variety of detection without changing the detection sample, to ensure the accuracy of detection, and to use corresponding detection methods for detection according to different chemical substances, so as to avoid inaccurate detection results and affect the intracellular chemistry. The judgment of substances allows researchers to predict the health of organisms based on intracellular chemicals.
Claims (2)


Priority Applications (1)
| Application Number | Priority Date | Filing Date | Title |
|---|---|---|---|
| CN202110682860.8A CN113390666B (en) | 2021-06-17 | 2021-06-17 | Method for detecting performance index of chemical substance in cell |
Applications Claiming Priority (1)
| Application Number | Priority Date | Filing Date | Title |
|---|---|---|---|
| CN202110682860.8A CN113390666B (en) | 2021-06-17 | 2021-06-17 | Method for detecting performance index of chemical substance in cell |
Publications (2)
| Publication Number | Publication Date |
|---|---|
| CN113390666A CN113390666A (en) | 2021-09-14 |
| CN113390666B true CN113390666B (en) | 2023-01-24 |
Family
ID=77623141
Family Applications (1)
| Application Number | Title | Priority Date | Filing Date |
|---|---|---|---|
| CN202110682860.8A Active CN113390666B (en) | 2021-06-17 | 2021-06-17 | Method for detecting performance index of chemical substance in cell |
Country Status (1)
| Country | Link |
|---|---|
| CN (1) | CN113390666B (en) |
Citations (1)
| Publication number | Priority date | Publication date | Assignee | Title |
|---|---|---|---|---|
| CN1571848A (en) * | 2001-09-05 | 2005-01-26 | 普赖德普罗特奥米克斯公司 | Proteins in type 2 diabetes |
Family Cites Families (12)
| Publication number | Priority date | Publication date | Assignee | Title |
|---|---|---|---|---|
| WO2006132116A1 (en) * | 2005-06-07 | 2006-12-14 | Matsushita Electric Industrial Co., Ltd. | Cell electric physiology measurement device and method of manufacturing the same |
| EP1644856A2 (en) * | 2003-06-30 | 2006-04-12 | Ajinomoto Co., Inc. | Intracellular metabolic flux analysis method using substrate labeled with isotope |
| US8114615B2 (en) * | 2006-05-17 | 2012-02-14 | Cernostics, Inc. | Method for automated tissue analysis |
| CN102911938B (en) * | 2012-08-03 | 2015-01-21 | 华侨大学 | siRNA (si Ribonucleic Acid) sequence for targeted restrain of POLD1 genetic expression |
| WO2015069187A1 (en) * | 2013-11-05 | 2015-05-14 | Agency For Science, Technology And Research | Bladder Carcinoma Biomarkers |
| CN105784991A (en) * | 2016-05-25 | 2016-07-20 | 南昌德漫多科技有限公司 | Device and method for repeated immunostaining of same tissue section |
| US9759709B1 (en) * | 2016-09-16 | 2017-09-12 | The Florida International University Board Of Trustees | Devices and methods to monitor HIV-infection in presence of substance of abuse and/or therapeutic agent |
| CN110850094A (en) * | 2019-11-22 | 2020-02-28 | 西安交通大学 | Immunohistochemical double-label single-staining kit and use method and application thereof |
| CN111317830A (en) * | 2019-12-24 | 2020-06-23 | 吉林大学 | Research method of pharmacological effect of mangiferin on diabetes of mice |
| CN111575336A (en) * | 2020-05-14 | 2020-08-25 | 华东理工大学 | Method for acquiring metabolic flux of intracellular central carbon metabolic pathway under metabolic steady isotope unsteady state |
| CN111721862B (en) * | 2020-06-12 | 2022-03-18 | 山西大学 | Method for identifying depression energy metabolism abnormal pathway based on stable isotope tracing metabonomics |
| CN112462058A (en) * | 2020-11-20 | 2021-03-09 | 上海交通大学 | Circulating nerve cell detection kit and detection method |
-
2021
- 2021-06-17 CN CN202110682860.8A patent/CN113390666B/en active Active
Patent Citations (1)
| Publication number | Priority date | Publication date | Assignee | Title |
|---|---|---|---|---|
| CN1571848A (en) * | 2001-09-05 | 2005-01-26 | 普赖德普罗特奥米克斯公司 | Proteins in type 2 diabetes |
Non-Patent Citations (1)
| Title |
|---|
| 适量UV照射对脑内谷氨酸合成新通路的影响;王宁;《中国博士学位论文全文数据库 基础科学辑》;20190815(第08期);第A006-44页 * |
Also Published As
| Publication number | Publication date |
|---|---|
| CN113390666A (en) | 2021-09-14 |
Similar Documents
| Publication | Publication Date | Title |
|---|---|---|
| Judge et al. | Continuous in vivo metabolism by NMR | |
| Xiong et al. | DNA walker-powered ratiometric SERS cytosensor of circulating tumor cells with single-cell sensitivity | |
| EP3153588B1 (en) | Rapid determination of microbial growth and antimicrobial susceptibility | |
| Jayan et al. | Surface-enhanced Raman spectroscopy combined with stable isotope probing to assess the metabolic activity of Escherichia coli cells in chicken carcass wash water | |
| Farsi et al. | Single synapse glutamate imaging reveals multiple levels of release mode regulation in mammalian synapses | |
| JP2016513259A (en) | Method for identifying bacterial species in a biological sample by gas chromatography mass spectrometry (GC / MS) | |
| Kim et al. | A fit-for-purpose LC–MS/MS method for the simultaneous quantitation of ATP and 2, 3-DPG in human K2EDTA whole blood | |
| Li et al. | Label-free detection of early oligomerization of α-synuclein and its mutants A30P/E46K through solid-state nanopores | |
| Lin et al. | Omics for deciphering oral microecology | |
| Petrova et al. | Recent developments in single-cell metabolomics by mass Spectrometry─ A perspective | |
| Yao et al. | Discriminating leukemia cellular heterogeneity and screening metabolite biomarker candidates using label-free mass cytometry | |
| US20200173996A1 (en) | Device for diagnosing colorectal cancer and method for providing colorectal cancer diagnosis information | |
| US20190259469A1 (en) | Method for Evaluating Genotoxicity of Substance | |
| Yang et al. | O-GlcNAcylation mapping of single living cells by in situ quantitative SERS imaging | |
| CN103193746B (en) | Specific probe substrate of catechol-O-methyltransgerase and application thereof | |
| CN113390666B (en) | Method for detecting performance index of chemical substance in cell | |
| Hancock et al. | FACS-assisted single-cell lipidome analysis of phosphatidylcholines and sphingomyelins in cells of different lineages | |
| Garcia et al. | Saliva metabolomics: concepts and applications in oral disorders | |
| CN102141531A (en) | Method for measuring water content in ethanol supernatant of salvia miltiorrhiza bunge injection | |
| CN110669820A (en) | Quick detection method for microbial drug sensitivity | |
| Prządka et al. | Optimization of Au electrode parameters for pathogen detection in aquaculture | |
| Gu et al. | Nanopore single-molecule detection of circulating microRNAs | |
| CN113358733B (en) | Method for detecting new biosynthesis pathway in cell | |
| Zhao et al. | Direct single-molecule detection of CoA-SH and ATP by the membrane proteins TMEM120A and TMEM120B | |
| Ramesh et al. | Assays used in vitro to study cancer cell lines |
Legal Events
| Date | Code | Title | Description |
|---|---|---|---|
| PB01 | Publication | ||
| PB01 | Publication | ||
| SE01 | Entry into force of request for substantive examination | ||
| SE01 | Entry into force of request for substantive examination | ||
| TA01 | Transfer of patent application right | ||
| TA01 | Transfer of patent application right |
Effective date of registration: 20220114 Address after: 230000 96 Jinzhai Road, Hefei City, Anhui Province Applicant after: University of Science and Technology of China Applicant after: Xiong Wei Applicant after: Liu Dan Applicant after: Zhang Xuehe Address before: 230000 96 Jinzhai Road, Hefei City, Anhui Province Applicant before: University of Science and Technology of China |
|
| TA01 | Transfer of patent application right | ||
| TA01 | Transfer of patent application right |
Effective date of registration: 20230105 Address after: 401, Building B3, Zhong'an Chuanggu Science Park, No. 900, Wangjiang West Road, High tech Zone, Hefei City, Anhui Province, 230000 Applicant after: Anhui Kecheng Intelligent Health Technology Co.,Ltd. Address before: Room 306, Building 11, Lingshuiyuan South, Shuiyangjiang Road, Baohe District, Hefei City, Anhui Province, 230000 Applicant before: Xiong Wei Applicant before: Liu Dan Applicant before: Zhang Xuehe Effective date of registration: 20230105 Address after: Room 306, Building 11, Lingshuiyuan South, Shuiyangjiang Road, Baohe District, Hefei City, Anhui Province, 230000 Applicant after: Xiong Wei Applicant after: Liu Dan Applicant after: Zhang Xuehe Address before: 230000 96 Jinzhai Road, Hefei City, Anhui Province Applicant before: University of Science and Technology of China Applicant before: Xiong Wei Applicant before: Liu Dan Applicant before: Zhang Xuehe |
|
| GR01 | Patent grant | ||
| GR01 | Patent grant |