Detailed Description
For the purposes of promoting an understanding of the principles of the disclosure, reference will now be made to the embodiments illustrated in the drawings and specific language will be used to describe the same. It will nevertheless be understood that no limitation of the scope of the disclosure is thereby intended. Any alterations and further modifications in the described devices, systems, methods, and any further applications of the principles of the disclosure as described herein are contemplated as would normally occur to one skilled in the art to which the disclosure relates.
Referring now to fig. 1, fig. 1 shows a schematic diagram of a system 100 for obtaining anatomy-specific activation data in a patient's brain. The system 100 includes a computing device 120 connected to a Magnetic Resonance Imaging (MRI) device 110, a user input device 130, and a display 140. The computing device 120 includes processing circuitry, e.g., one or more processors in communication with a memory. The memory can be a tangible computer-readable storage medium that stores instructions executable by one or more processors. The computing device 120 can be a workstation or controller that serves as an interface between the MRI device 110 and the display 140. In some embodiments, the MRI device 110 is capable of operating in different modalities including, but not limited to, Magnetic Resonance (MR) imaging, Diffusion Tensor Imaging (DTI) and Positron Emission Tomography (PET) imaging, functional magnetic resonance imaging (fMRI) and outputting imaging data to the computing device 120. In some embodiments, the MRI device 110 is capable of operating in different modalities simultaneously. For example, the MRI apparatus can simultaneously perform an MR scan and a PET scan, or simultaneously perform an MR scan and a DTI scan.
In some embodiments, the computing device 120 can receive MR data from the MRI device 110, process the MR data, and output MR image data to the display 140 such that the display 140 can display MR images. In some embodiments, computing device 120 is capable of receiving fMRI data from MRI device 110, processing the fMRI data, and outputting the fMRI data to display 140 for display of the fMRI image. In some embodiments, the computing device 120 can align the MR data with the fMRI data through suitable procedures (e.g., survey scan, rigid registration, volume location, and direction cosine).
In some embodiments, the MR data can be a T1-weighted (T1W) MR image, and the computing device 120 can automatically segment the MR image to delineate the geometry of anatomical structures in the brain of the patient. In some implementations, the computing device 120 can segment the MR image data based on a three-dimensional (3D) brain model. In some instances, computing device 120 receives the 3D brain model from a storage medium or through a wired or wireless connection to a server or remote workstation. In some other instances, the 3D brain model can be stored in a storage device in computing device 120, or in a storage device that can be retrieved by computing device 120. In some embodiments, the 3D brain model is a shape-constrained deformable brain model. In some examples, the 3D brain model may be the brain model described in "Evaluation of the traditional brain imaging using a shape-constrained and formed model" by l.zagroche v, c.meyer, t.stem, r.kneser, s.young and j.weese (2011 in multi-modal brain image analysis by Liu t., Shen D., Ibanez l., Tao x., MBIA 2011, computer science lecture, volume 7012, schpringe, berlin, heidelberg, which is incorporated herein by reference in its entirety). In some embodiments, the 3D BRAIN model may be a deformable BRAIN model described in U.S. patent No. US 9256951 entitled "SYSTEM FOR raw AND available technology dependent BRAIN model or a shape constrained deformable BRAIN model described in U.S. patent application publication No. US 20150146951 entitled" METHOD AND SYSTEM FOR achieving flexibility OF IMAGE OF ge acquisition technology ", both OF which are incorporated herein by reference in their entirety.
In some embodiments, the automatic segmentation not only delineates the geometry of anatomical structures in the brain, but also defines a number of voxels in each of these geometries. By aligning the MR data with the fMRI data, the geometry and voxels can be transferred to the fMRI space. In some implementations, the computing device 120 can determine an activation level within a voxel, where the activation level can be a cumulative activation level, an instantaneous activation level, a time-averaged activation level, or an event-averaged activation level. With the activation level of each of the voxels known, the computing device 120 is then able to determine the activation level within the geometry of the anatomical structure by integrating the activation levels of all voxels within the geometry. In some embodiments, the computing device 120 can use color coding to refer to different activation levels, which may also be cumulative activation levels, instantaneous activation levels, time-averaged activation levels, or event-averaged activation levels. In some implementations, the computing device 120 can also output an activation level profile within the geometry based on the activation levels of the voxels in the geometry. In some embodiments, computing device 120 can output a graphical representation of the determined activation level within the geometry to display 140.
In some embodiments, the MR data and fMRI data include information about a plurality of geometries of different anatomical structures of the patient's brain. When performing tasks on a patient designed to increase local brain activity, the activation levels within the geometry of different anatomical structures may exhibit a sequence or pattern over time. For example, a first high average activation level can be observed within a first anatomy, and then a second high average activation level can be observed within a second anatomy. The computing device 120 is also capable of determining an activation sequence or pattern between anatomical structures.
In some embodiments, the computing device 120 can be used to develop biomarkers for neurological diseases. In some implementations, the computing device 120 can receive a diagnosis of a neurological condition (or lack thereof) for a patient and associate an activation level with each anatomical structure and a sequence/pattern of activation between the respective anatomical structures with the diagnosis. In some embodiments, the computing device 120 can store the activation levels, anatomical structures, and sequences/patterns of activation in a database 150 in communication with the computing device 120 according to the received diagnosis. The computing device 120 can access the database 150 to determine biomarkers or identifying characteristics of the neurological disease.
Referring now to fig. 2, fig. 2 shows a flow diagram illustrating an exemplary method 200 of obtaining anatomy-specific activation data in a patient's brain. Method 200 includes operations 202, 204, 206, 208, 210, 212, 214, and 216. It should be understood that the operations of method 200 can be performed in a different order than shown in fig. 2, additional operations can be provided before, during, and after the operations, and/or some of the operations described can be replaced or eliminated in other embodiments. The operations of method 200 can be performed by a computing device in the fMRI system (e.g., computing device 120 of system 100). The method 200 will be described below with reference to fig. 3, 4, 5, and 6.
At operation 202 of the method 200, MR data of a patient's brain is received at the computing device 120. The MR data is obtained by using the MRI apparatus 110. In some embodiments, MRI device 110 is in communication with computing device 120. The computing device 120 can process the MR data of the patient's brain and output the MR image data to the display 140 for display of an MR image (e.g., the MR image 320 in fig. 3). In some embodiments, the MR data comprises T1W MR data. Although the MR image 320 shown in fig. 3 is a top view of the patient's brain, one of ordinary skill in the art will appreciate that the computing device 120 can also obtain or derive MR images of the patient's brain viewed from other directions. The MR data received at operation 202 includes MR data of anatomical structures in the brain of the patient.
At operation 204 of the method 200, MR data of a patient's brain is segmented to delineate a first geometry of a first anatomical structure and a second geometry of a second anatomical structure in the patient's brain. Referring now to fig. 3, fig. 3 shows a process flow 300 for segmenting MR data to delineate the geometry of anatomical structures in the brain of a patient. In some embodiments, the computing device 120 can segment MR data of the patient's brain represented by the MR image 320 based on the 3D brain model 310. In some embodiments, the 3D brain model 310 can be a shape-constrained deformable brain model. In some examples, 3D brain model 310 may be a brain model described in "Evaluation of traditional brain imaging using a shape-constrained and formed model" (2011 in multi-modal brain image analysis by Liu t., Shen D., Ibanez l., Tao x. editor, MBIA 2011, computer science lecture, volume 7012, schpringe, berlin, heidelberg, which is incorporated herein by reference in its entirety) by l.zagroche, c.meyer, t.stem, r.kneser, s.young, and j.weese. In some examples, the 3D BRAIN model may be a deformable BRAIN model described in U.S. patent No. US 9256951 entitled "SYSTEM FOR RAPID AND adaptive simulation analysis OF traffic brake in INJURY" or a shape constrained deformable BRAIN model described in U.S. patent application publication No. US 20150146951 entitled "METHOD AND SYSTEM FOR simulation estimation OF IMAGE registration," both OF which are incorporated herein by reference in their entirety. In some implementations, the 3D brain model 310 is stored in the computing device 120 or in a storage device or medium that is retrievable by the computing device 120.
The 3D brain model 310 is initialized by matching with the MR image 320 of the brain, as shown in MR image 330. Then, a Generalized Hough Transform (GHT) is performed on the 3D brain model 310 to match the 3D brain model 310 with the geometry of the anatomical structure in the MR image 320 in terms of position and orientation, as illustrated in the MR image 340. Thereafter, as shown in the MR image 350, the 3D brain model 310 is subjected to parameter adjustments, wherein the position, orientation and scaling are adjusted using a global similarity transform and/or a multi-linear transform to make better adjustments to the anatomy in the MR image 320. As shown in the MR image 360, the 3D brain model 310 is subjected to deformable adaptation, wherein a plurality of iterations of boundary detection and mesh adaptation are performed in the 3D brain model 310 to adapt the 3D brain model to the anatomical structures in the brain.
At operation 206 of the method 200, fMRI data of the patient's brain is received at the computing device 120. fMRI data is obtained using an MRI apparatus. In some embodiments, the MRI device 110 used to obtain MR data is the same as the MRI device 110 used to obtain fMRI data. In some embodiments, MRI device 110 is in communication with computing device 120. fMRI relies on the fact that: oxy-hemoglobin and deoxy-hemoglobin have different magnetic properties, resulting in different Magnetic Resonance (MR) signal strengths. Because cerebral blood flow is directly related to neuronal activation, fMRI can measure the level of activation in a brain region by measuring blood demand in that region. In addition, because blood demand can be indicative of oxygen demand, fMRI can also be a tool and technique to measure oxygen demand in brain regions. During an fMRI scan, a task designed to increase regional brain activity is performed on the patient, and the MRI apparatus is able to detect changes in the ratio of oxygenated blood to deoxygenated blood.
For example, the task can be a dual N-fallback task. In the dual N-back task, the patient is presented with a series of visual and auditory stimuli simultaneously. In some embodiments, the patient starts with a 1-fallback condition, wherein he/she is asked to provide a positive response if the current visual stimulus matches the immediately preceding visual stimulus. Likewise, if the current auditory stimulus matches the immediately preceding auditory stimulus, the patient is asked to provide a positive response. The patient is asked to provide a double positive response if both the current visual stimulus and auditory stimulus match the immediately preceding visual stimulus and auditory stimulus. If none of the stimuli match, no response is required. If the patient's accuracy reaches a certain level, the n-backoff level is increased by 1 (e.g., from 1-backoff to 2-backoff). If the accuracy level is below a certain level, the n-backoff level is decreased by 1 (e.g., from 3-backoff to 2-backoff). In some examples, the n-fallback level remains unchanged if the patient's accuracy level is maintained at a certain level. Jaeggi et al describe a dual N-fallback task in "Improving Fluid integration with Training on learning Memory" (Pro. Natl. Acad. Sc., U.S.A., 13.5.2008; vol. 105, 19, page 6829-6833).
At operation 208 of the method 200, the MR data of the patient's brain is aligned with fMRI data of the patient's brain. In some embodiments, the computing device 120 can align the MR data with the fMRI data through suitable procedures (e.g., survey scan, rigid registration, volume location, and direction cosine). In some embodiments, if the radiologist is only required to obtain fMRI images of one or more target anatomies, the radiologist need only ensure that a predetermined desired activation level is met for the one or more target anatomies. The method 200 of the present disclosure saves time and can be performed in a shorter period of time than conventional practice in which a predetermined desired activation level must be met in all anatomical structures in the fMRI field of view.
At operation 210 of the method 200, a level of activation within the geometry of the anatomical structures and a sequence of activations between the anatomical structures are determined. Referring now to fig. 5, fig. 5 shows an MR image 500 of a patient's brain superimposed with highlighted boundaries of the geometry of the anatomy (including the geometry of the thalamus 510 and corpus callosum 520). In some embodiments, by automatically segmenting the MR data at operation 204 and aligning the MR data with fMRI data at operation 208, the computing device 120 can determine a first activation level within a first geometry (e.g., the geometry of the thalamus 510) and a second activation level in a second geometry (e.g., the geometry of the corpus callosum 520). Here, the first activation level and the second activation level can be a cumulative activation level, an instantaneous activation level, a time-averaged activation level, or an event-averaged activation level. Additionally, the computing device 120 can determine patterns or sequences of activation in different anatomical structures. For example, a first activation level in the geometry of thalamus 510 may increase while a second activation level in the geometry of corpus callosum 520 is increasing, and then the second activation level can increase in response to a double N-fallback task while the first activation level diminishes in response to the same task. In addition to the quantitative intensity of the activation level, the pattern/sequence of activation between different anatomical structures in response to a task or stimulus can also be indicative of a neurological disease or condition.
Figure 4 shows the level of activation in the brain of a control subject and the level of activation in the brain of a subject with mild craniocerebral injury (MTBI) when the subject was subjected to a dual N-fallback task. When the N-withdrawal level changes from 1-withdrawal to 0-withdrawal, the activation level in the brain of the control subject is shown in fMRI image 410, while the activation level in the brain of the MTBI subject is shown in fMRI image 420. When the N-fallback level changes from 2-fallback to 1-fallback, the activation level in the brain of the control subject is shown in fMRI image 412, while the activation level in the brain of the MTBI subject is shown in fMRI image 422. When the N-fallback level changes from 3-fallback to 2-fallback, the activation level in the brain of the control subject is shown in fMRI image 414, while the activation level in the brain of the MTBI subject is shown in fMRI image 424. The variation of the ratio of oxygenated to deoxygenated blood can be used for a task-related time series of metabolic activities of different regions in the brain of a patient. As can be seen from fig. 4, although differences in the pattern and intensity of the activation levels are observed in fMRI images 410, 412, 414, 420, 422, and 424, the activation levels are not due to any geometry of the particular anatomy. Without an anatomy-specific activation level, the activation level within a particular anatomy cannot be quantified and meaningfully correlated with a particular neurological disease. The system and method of the present disclosure accomplishes this precisely. By segmenting the MR data and aligning the MR data with fMRI data, the activation level (which can be a cumulative activation level, an instantaneous activation level, a time-averaged activation level, or an event-averaged activation level) in each of the geometries of the anatomy can be determined and correlated with a diagnosis of the patient.
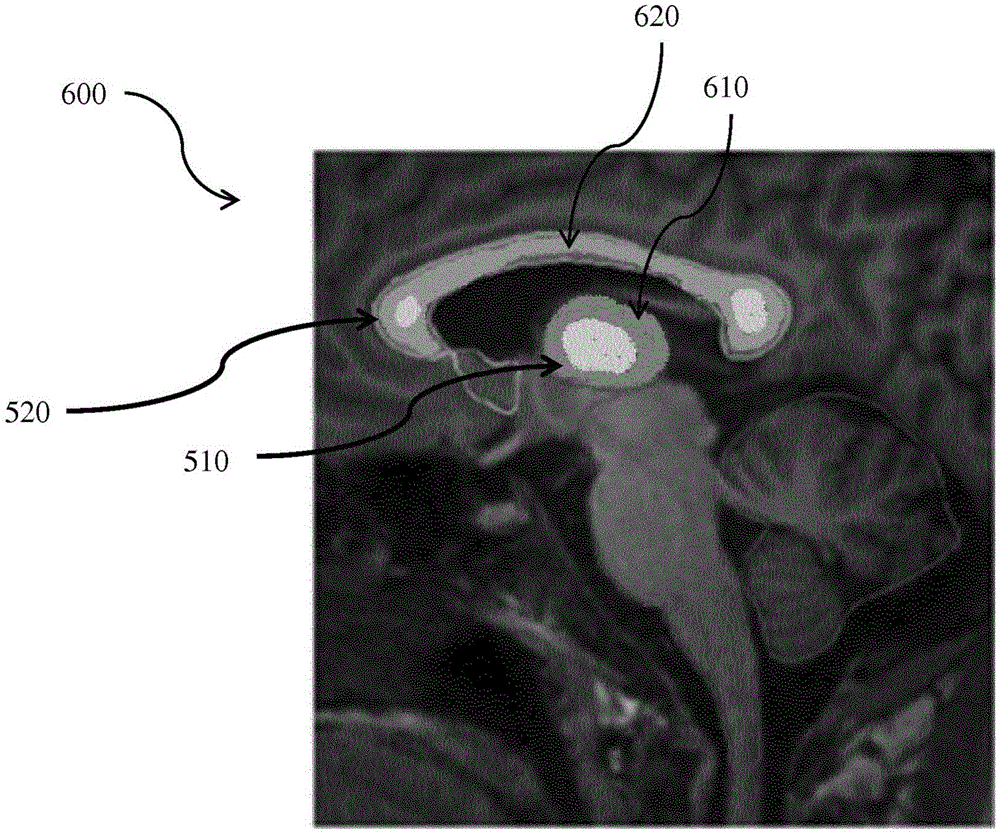
At operation 212 of the method 200, a graphical representation of a sequence of first activation levels within the first geometry, second activation levels within the second geometry, and activations between the first and second anatomical structures is generated. Referring to fig. 6, fig. 6 illustrates an exemplary graphical representation 600 of activation levels within a first geometry of a thalamus 510 of a brain. The graphical representation 600 in fig. 6 can also be referred to as a brain activity map or an anatomy-specific brain activity map. As shown in fig. 6, a first activation level within the geometry of thalamus 510 is graphically represented by a graphical overlay 610. In some embodiments represented by fig. 6, the graphic overlay 610 includes color-coded contours of different activation levels. As used herein, an activation level can be a cumulative activation level, an instantaneous activation level, a time-averaged activation level, or an event-averaged activation level. In those embodiments, the darker color near the edges of the first geometry of the thalamus 510 represents a lower activation level than the activation level of the lighter color near the center of the first geometry of the thalamus 510. Similarly, a second activation level within the geometry of corpus callosum 520 is graphically represented by graphical overlay 620. The graphic overlay 620 also includes color-coded contours of different activation levels. The darker colors along the length of the second geometry of the callus 520 represent activation levels that are lower than activation levels of lighter colors near either end of the second geometry of the callus 520 (e.g., the callus presses and the callus knees). Note that the graphical representation 600 is for illustrative purposes only and does not necessarily correspond to a real-world brain activity map.
Unlike the fMRI image shown in fig. 4, the first activation level is specific to the first geometry of the thalamus 510, rather than the activation level over a region that includes only the first geometry. Thus, the method 200 of the present disclosure allows for determining an anatomy-specific activation level. The ability to determine anatomy-specific activation levels eliminates the subjectivity of visually matching activity levels to anatomy, thereby reducing the level of expertise required to understand read fMRI data.
At operation 214 of the method 200, the first activation level, the second activation level, the first geometry, the second geometry, and the sequence of activations between the first and second anatomies are correlated with a diagnosis of the patient about the brain. In some embodiments, the computing device 120 can receive a doctor's diagnosis. The diagnosis can be positive, which indicates that the patient has at least one neurological condition, or negative, which indicates that the patient does not have all neurological conditions. Note that the diagnosis here is not necessarily made based only on fMRI data, but on all tests and examinations performed on the patient. In some embodiments, if the diagnosis of the patient is negative, the activation level, geometry of the anatomical structure, and sequence of activations will be associated with a healthy subject. In some embodiments, if the patient's diagnosis is positive, the level of activation, geometry of the anatomical structure, and sequence of activation will be associated with the neurological disease(s) identified in the patient's diagnosis.
At operation 216 of the method 200, the activation levels within the geometry of the anatomical structures, and the sequence of activations between anatomical structures associated with the diagnosis of the brain of the patient are stored in a database (e.g., database 150). Over time, the database 150 can store activation levels and sequences of activations for more healthy subjects and for more patients with neurological disease. fMRI biomarkers for neurological disease can be detected and developed based on data stored in database 150.
Referring now to fig. 7, fig. 7 shows a flow diagram illustrating an exemplary method 700 of obtaining anatomy-specific activation data in a patient's brain. Method 700 includes operations 702, 704, 706, 708, 710, 712, 714, and 716. It should be understood that the operations of method 700 can be performed in a different order than shown in fig. 7. Additional operations can be provided before, during, and after these operations, and/or some of the operations described can be replaced or eliminated in other embodiments. The operations of method 700 can be performed by a computing device in the fMRI system (e.g., computing device 120 of system 100). Method 700 will be described below with reference to fig. 3, 4, 5, and 6.
At operation 702 of the method 700, MR data of a patient's brain is received at a computing device 120. The MR data is obtained by using the MRI apparatus 110. In some embodiments, MRI device 110 is in communication with computing device 120. The computing device 120 can process the MR data of the patient's brain and output the MR image data to the display 140 for display of an MR image (e.g., the MR image 320 in fig. 3). In some embodiments, the MR data comprises T1W MR data. While the MR image 320 shown in fig. 3 can be a top view of the patient's brain, one of ordinary skill in the art will appreciate that the computing device 120 can also obtain or derive MR images of the patient's brain viewed from other directions. The MR data received at operation 702 includes MR data of anatomical structures in the brain of the patient.
At operation 704 of the method 700, MR data of a patient's brain is segmented to delineate a plurality of geometric shapes. Each of the plurality of geometries corresponds to a respective anatomical structure in the brain of the patient. Referring now to fig. 3, fig. 3 shows a process flow 300 for segmenting MR data to delineate the geometry of anatomical structures in the brain of a patient. In some embodiments, the computing device 120 can segment MR data of the patient's brain represented by the MR image 320 based on the 3D brain model 310. In some embodiments, the 3D brain model 310 can be a shape-constrained deformable brain model. In some examples, 3D brain model 310 may be a brain model described in "Evaluation of traditional brain imaging using a shape-constrained and formed model" (2011 in multi-modal brain image analysis by Liu t., Shen D., Ibanez l., Tao x. editor, MBIA 2011, computer science lecture, volume 7012, schpringe, berlin, heidelberg, which is incorporated herein by reference in its entirety) by l.zagroche, c.meyer, t.stem, r.kneser, s.young, and j.weese. In some examples, the 3D BRAIN model may be a deformable BRAIN model described in U.S. patent No. US 9256951 entitled "SYSTEM FOR RAPID AND adaptive simulation analysis OF traffic brake in INJURY" or a shape constrained deformable BRAIN model described in U.S. patent application publication No. US 20150146951 entitled "METHOD AND SYSTEM FOR simulation estimation OF IMAGE registration," both OF which are incorporated herein by reference in their entirety. In some implementations, the 3D brain model 310 is stored in the computing device 120 or in a storage device or medium that is retrievable by the computing device 120.
The 3D brain model 310 is initialized by matching with the MR image 320 of the brain, as shown in MR image 330. Then, a Generalized Hough Transform (GHT) is performed on the 3D brain model 310 to match the 3D brain model 310 with the geometry of the anatomical structure in the MR image 320 in terms of position and orientation, as illustrated in the MR image 340. Thereafter, as shown in the MR image 350, the 3D brain model 310 is subjected to parameter adjustments, wherein the position, orientation and scaling are adjusted using a global similarity transform and/or a multi-linear transform to make better adjustments to the anatomy in the MR image 320. As shown in the MR image 360, the 3D brain model 310 is subjected to deformable adaptation, wherein a plurality of iterations of boundary detection and mesh adaptation are performed in the 3D brain model 310 to adapt the 3D brain model to the anatomical structures in the brain.
At operation 706 of method 700, fMRI data of the patient's brain is received at computing device 120. fMRI data is obtained using an MRI apparatus. In some embodiments, the MRI device 110 used to obtain MR data is the same as the MRI device 110 used to obtain fMRI data. In some embodiments, MRI device 110 is in communication with computing device 120. fMRI relies on the fact that: oxy-hemoglobin and deoxy-hemoglobin have different magnetic properties, resulting in different Magnetic Resonance (MR) signal strengths. Because cerebral blood flow is directly related to neuronal activation, fMRI can measure the level of activation in a brain region by measuring blood demand in that region. In addition, because blood demand can be indicative of oxygen demand, fMRI can also be a tool and technique to measure oxygen demand in brain regions. During an fMRI scan, a task designed to increase regional brain activity is performed on the patient, and the MRI apparatus is able to detect changes in the ratio of oxygenated blood to deoxygenated blood.
For example, the task can be a dual N-fallback task. In the dual N-back task, the patient is presented with a series of visual and auditory stimuli simultaneously. In some embodiments, the patient starts with a 1-fallback condition, wherein he/she is asked to provide a positive response if the current visual stimulus matches the immediately preceding visual stimulus. Likewise, if the current auditory stimulus matches the immediately preceding auditory stimulus, the patient is asked to provide a positive response. The patient is asked to provide a double positive response if both the current visual stimulus and auditory stimulus match the immediately preceding visual stimulus and auditory stimulus. If none of the stimuli match, no response is required. If the patient's accuracy reaches a certain level, the n-backoff level is increased by 1 (e.g., from 1-backoff to 2-backoff). If the accuracy level is below a certain level, the n-backoff level is decreased by 1 (e.g., from 3-backoff to 2-backoff). In some examples, the n-fallback level remains unchanged if the patient's accuracy level is maintained at a certain level. Jaeggi et al describe a dual N-fallback task in "Improving Fluid integration with Training on learning Memory" (Pro. Natl. Acad. Sc., U.S.A., 13.5.2008; vol. 105, 19, page 6829-6833).
At operation 708 of the method 700, the MR data of the patient's brain is aligned with fMRI data of the patient's brain. In some embodiments, the computing device 120 can align the MR data with the fMRI data through suitable procedures (e.g., survey scan, rigid registration, volume location, and direction cosine). In some embodiments, if the radiologist is only required to obtain fMRI images of one or more target anatomies, the radiologist need only ensure that a predetermined desired activation level is met for the one or more target anatomies. The method 700 of the present disclosure saves time and can be performed in a shorter period of time than conventional practice in which a predetermined desired activation level must be met in all anatomical structures in the fMRI field of view.
At operation 710 of the method 700, a plurality of activation levels is determined. The activation level is related to activity within the delineated geometry of the anatomical structure. In other words, the activation level corresponds to activity within the geometry of the anatomical structure. Thus, activation levels for a plurality of geometries are determined. An activation level is determined based on the aligned MR data and fMRI data.
Figure 4 shows the level of activation in the brain of a control subject and the level of activation in the brain of a subject with mild craniocerebral injury (MTBI) when the subject was subjected to a dual N-fallback task. When the N-withdrawal level changes from 1-withdrawal to 0-withdrawal, the activation level in the brain of the control subject is shown in fMRI image 410, while the activation level in the brain of the MTBI subject is shown in fMRI image 420. When the N-fallback level changes from 2-fallback to 1-fallback, the activation level in the brain of the control subject is shown in fMRI image 412, while the activation level in the brain of the MTBI subject is shown in fMRI image 422. When the N-fallback level changes from 3-fallback to 2-fallback, the activation level in the brain of the control subject is shown in fMRI image 414, while the activation level in the brain of the MTBI subject is shown in fMRI image 424. The variation of the ratio of oxygenated to deoxygenated blood can be used for a task-related time series of metabolic activities of different regions in the brain of a patient. As can be seen from fig. 4, although differences in the pattern and intensity of the activation levels are observed in fMRI images 410, 412, 414, 420, 422, and 424, the activation levels are not due to any geometry of the particular anatomy. Without an anatomy-specific activation level, the activation level within a particular anatomy cannot be quantified and meaningfully correlated with a particular neurological disease. The system and method of the present disclosure accomplishes this precisely. By segmenting the MR data and aligning the MR data with fMRI data, the activation level (which can be a cumulative activation level, an instantaneous activation level, a time-averaged activation level, or an event-averaged activation level) in each of the geometries of the anatomy can be determined and correlated with a diagnosis of the patient.
Referring now to fig. 5, fig. 5 shows an MR image 500 of a patient's brain superimposed with highlighted boundaries for the geometry of a number of anatomical structures, including the geometry of the thalamus 510 and corpus callosum 520. In some embodiments, by automatically segmenting the MR data at operation 704 and aligning the MR data with fMRI data at operation 708, computing device 120 can determine an activation level within one geometry (e.g., the geometry of thalamus 510) and another activation level within another geometry (e.g., the geometry of corpus callosum 520). These activation levels can be cumulative activation levels, instantaneous activation levels, time-averaged activation levels, event-averaged activation levels, or other types of activation levels. In some embodiments, activation levels for additional other geometries are also determined.
At operation 712 of the method 700, a sequence of activations is determined. The computing device 120 can determine patterns or sequences of activation in different anatomical structures. For example, the activation level in the geometry of thalamus 510 may increase while the activation level in the geometry of corpus callosum 520 increases, and then the activation level in the geometry of corpus callosum 520 can increase in response to a double N-fallback task while the activation level in the geometry of thalamus 510 diminishes in response to the same task. In other embodiments, a sequence of activation levels in even more geometries can be determined. In addition to the quantitative intensity of the activation level, the pattern/sequence of activation between different anatomical structures in response to a task or stimulus can also be indicative of a neurological disease or condition. The sequence of activation is determined based on the order or timing of the MR data and fMRI data.
At operation 714 of the method 700, propagation of activity between anatomical structures is determined. For example, based on the determined activation levels corresponding to the respective delineated geometries of the anatomical structures, a propagation of the activity from one anatomical structure to another anatomical structure and on to the other anatomical structure over time can be determined, indicating a propagation of the activity in the brain of the patient. Propagation of the activity is determined based on the order or timing of the MR data and fMRI data. In some embodiments, the determined activation levels are associated with a single structure or all of the depicted structures or a subset of the structures in a particular order, depending on the spread of brain activity and the patient's diagnosis of neurological or neuropsychiatric disorders.
At operation 716 of method 700, a graphical representation of dynamic activity in the brain is output. The dynamic activity includes at least one of a sequence of activations of the anatomical structures and a propagation of the activity between the anatomical structures. The graphical representation may also include drawn geometries representing the anatomical structures included in the representation and corresponding activation levels for the drawn geometries. Some embodiments may also include temporal features related to dynamic activities. In some embodiments, the graphical representation will include a brain activity map or an anatomical-specific brain activity map.
Referring to fig. 6, fig. 6 illustrates an exemplary graphical representation 600 of activation levels within the geometry of the thalamus 510 of the brain. The graphical representation 600 in fig. 6 can also be referred to as a brain activity map or an anatomy-specific brain activity map. As shown in fig. 6, the activation level within the geometry of thalamus 510 is graphically represented by a graphical overlay 610. In some embodiments represented by fig. 6, the graphic overlay 610 includes color-coded contours of different activation levels. As used herein, an activation level can be a cumulative activation level, an instantaneous activation level, a time-averaged activation level, or an event-averaged activation level. In those embodiments, the darker color near the edges of the geometry of the thalamus 510 represents a lower activation level than the activation level of the lighter color near the center of the geometry of the thalamus 510. Similarly, the level of activation within the geometry of corpus callosum 520 is graphically represented by graphic overlay 620. The graphic overlay 620 also includes color-coded contours of different activation levels. The darker colors along the length of the second geometry of the callus 520 represent activation levels that are lower than activation levels of lighter colors near either end of the second geometry of the callus 520 (e.g., the callus presses and the callus knees). Note that the graphical representation 600 is for illustrative purposes only and does not necessarily correspond to a real-world brain activity map.
Unlike the fMRI image shown in fig. 4, the activation level is specific to the geometry of the thalamus 510, rather than the activation level over a region that includes only that geometry. Thus, the method 700 of the present disclosure allows for determining an anatomy-specific activation level. The ability to determine anatomy-specific activation levels eliminates the subjectivity of visually matching activity levels to anatomy, thereby reducing the level of expertise required to understand read fMRI data. In some embodiments, the computing device 120 can receive a doctor's diagnosis. The diagnosis can be positive, which indicates that the patient has at least one neurological condition, or negative, which indicates that the patient does not have all neurological conditions. Note that the diagnosis here is not necessarily made based only on fMRI data, but on all tests and examinations performed on the patient. In some embodiments, if the diagnosis of the patient is negative, the activation level, geometry of the anatomical structure, and sequence of activations will be associated with a healthy subject. In some embodiments, if the patient's diagnosis is positive, the level of activation, geometry of the anatomical structure, and sequence of activation will be associated with the neurological disease(s) identified in the patient's diagnosis.
At operation 716 of method 700, the activation levels within the geometry of the anatomical structures, and the sequence of activations between anatomical structures associated with the diagnosis of the brain of the patient are stored in a database (e.g., database 150). Over time, the database 150 can store activation levels and sequences of activations for more healthy subjects and for more patients with neurological disease. fMRI biomarkers for neurological disease can be detected and developed based on data stored in database 150.
The systems, apparatus and methods of the present disclosure can include features described in U.S. provisional application US62/711812(atty.dkt.us 2017PF02541/44755.1857PV01), which is incorporated herein by reference in its entirety.
Those skilled in the art will recognize that the above-described apparatus, systems, and methods can be modified in various ways. Therefore, those of ordinary skill in the art will appreciate that the embodiments encompassed by the present disclosure are not limited to the specific exemplary embodiments described above. In this regard, while exemplary embodiments have been shown and described, a wide variety of modifications, changes, and substitutions are contemplated in the foregoing disclosure. It will be appreciated that such variations may be made to the foregoing without departing from the scope of the present disclosure. Accordingly, it is appropriate that the claims be construed broadly and in a manner consistent with the disclosure.