CN111814111A - Industrial park atmospheric pollutant tracing method - Google Patents
Industrial park atmospheric pollutant tracing method Download PDFInfo
- Publication number
- CN111814111A CN111814111A CN202010447423.3A CN202010447423A CN111814111A CN 111814111 A CN111814111 A CN 111814111A CN 202010447423 A CN202010447423 A CN 202010447423A CN 111814111 A CN111814111 A CN 111814111A
- Authority
- CN
- China
- Prior art keywords
- contribution
- suspected
- park
- emission
- receptor
- Prior art date
- Legal status (The legal status is an assumption and is not a legal conclusion. Google has not performed a legal analysis and makes no representation as to the accuracy of the status listed.)
- Granted
Links
Images


Classifications
-
- G—PHYSICS
- G06—COMPUTING OR CALCULATING; COUNTING
- G06F—ELECTRIC DIGITAL DATA PROCESSING
- G06F17/00—Digital computing or data processing equipment or methods, specially adapted for specific functions
- G06F17/10—Complex mathematical operations
- G06F17/18—Complex mathematical operations for evaluating statistical data, e.g. average values, frequency distributions, probability functions, regression analysis
-
- G—PHYSICS
- G06—COMPUTING OR CALCULATING; COUNTING
- G06F—ELECTRIC DIGITAL DATA PROCESSING
- G06F17/00—Digital computing or data processing equipment or methods, specially adapted for specific functions
- G06F17/10—Complex mathematical operations
- G06F17/16—Matrix or vector computation, e.g. matrix-matrix or matrix-vector multiplication, matrix factorization
Landscapes
- Engineering & Computer Science (AREA)
- Physics & Mathematics (AREA)
- General Physics & Mathematics (AREA)
- Data Mining & Analysis (AREA)
- Mathematical Physics (AREA)
- Mathematical Analysis (AREA)
- Theoretical Computer Science (AREA)
- Mathematical Optimization (AREA)
- Pure & Applied Mathematics (AREA)
- Computational Mathematics (AREA)
- Algebra (AREA)
- Databases & Information Systems (AREA)
- Software Systems (AREA)
- General Engineering & Computer Science (AREA)
- Computing Systems (AREA)
- Life Sciences & Earth Sciences (AREA)
- Bioinformatics & Cheminformatics (AREA)
- Bioinformatics & Computational Biology (AREA)
- Evolutionary Biology (AREA)
- Operations Research (AREA)
- Probability & Statistics with Applications (AREA)
- Management, Administration, Business Operations System, And Electronic Commerce (AREA)
Abstract
The invention discloses an industrial park atmospheric pollutant tracing method, which comprises the following steps: collecting station monitoring data in an industrial park in real time, wherein the station monitoring data comprises a detailed component station, a micro station and a weather station, and dynamically judging the standard exceeding according to the monitoring data; comparing the standard exceeding factor with a pollutant characteristic factor fingerprint database of the park enterprises, and primarily screening suspected pollution sources; determining pollution source tracing time and interval according to meteorological data and the size of a park, and dynamically calculating the contribution condition of a suspected source to a receptor point by using a Lagrange model minute by minute in a source tracing period; establishing a normalized distribution lag model by combining the online working condition information of the enterprise and the online monitoring data of the enterprise discharge port, and further locking a pollution source; and finally, carrying out statistical simulation calculation on the comprehensive evaluation index, and comprehensively evaluating the contribution rate of the park enterprises to the standard-exceeding point positions. The invention can realize dynamic accurate tracing of atmospheric pollutants in the industrial park under the conditions of different wind directions, wind speeds and strong source emission.
Description
Technical Field
The invention relates to the technical field of pollutant tracing, in particular to an atmospheric pollutant tracing method for an industrial park.
Background
Along with the rapid development of economy and the continuous improvement of urbanization level, the problem of air pollution is increasingly prominent, and the air pollution has great influence on daily production life and body health of people, and the air pollutants are discharged as main industrial sources in industrial parks in the tracing city, so that great pressure is brought to the local air quality standard, and the air pollutants are also increasingly concerned and even complained by the surrounding public. At this moment, a comprehensive utilization methods such as garden monitoring data and model statistics are necessary for the accurate source tracing of the developments of industrial park atmospheric pollutants, not only can manage the clean safe production service in garden, more can improve local environmental air quality.
The current mainstream air pollution tracing modes mainly comprise: the method is characterized in that the source tracing and tracing of pollutants are realized by utilizing stable isotope release, and the method is high in cost and long in time consumption; the method is characterized in that an air quality traceability model is utilized, the method comprises a complex physical and chemical reaction process, the spatial scale is large, the resolution is low, the corresponding calculation amount is large, and the method is not suitable for the industrial park level; and thirdly, deducing the position of the pollution source by using a Gaussian backstepping model, wherein the method cannot give the contribution ratio of different pollution sources to the receptor site.
For example, patent No. CN201611041286.3 discloses an atmospheric pollutant tracing method for industrial parks, which comprises the following steps: acquiring observation data through monitoring points and performing standard exceeding judgment; performing region screening according to the standard exceeding observation data; obtaining observation data collected in the screened region, and performing model back calculation according to the source position estimation model; obtaining and verifying a result; concentration data collected by monitoring stations around the diffusion source park are utilized to estimate the source intensity and the specific position of the diffusion source, and the method can adapt to the situation that the source intensity and the wind field data are variable. However, in the invention, only wind speed and wind direction and enterprise distribution factors are considered, over-standard factors, enterprise online working condition information and enterprise discharge online monitoring data are not considered, in addition, a solution of the maximum posterior probability is estimated by utilizing ridge regression on the basis of the prior information, and multi-source data of pollutant over-standard discharge historical events, industrial park enterprise information and historical results are collected as the prior information for result verification. The calculation precision of the position of the pollution source can be improved as far as possible, and the contribution ratio of each pollution source to the receptor site cannot be accurately determined.
Disclosure of Invention
The invention aims to provide a tracing method for atmospheric pollutants in an industrial park, which can realize dynamic and accurate tracing of the atmospheric pollutants in the industrial park under the conditions of different wind directions, wind speeds and strong source emission.
To achieve the above objective, with reference to fig. 1, the present invention provides a tracing method for atmospheric pollutants in an industrial park, which includes the following steps:
s1, collecting pollutant monitoring data of the detailed component station and the micro station of the industrial park, and dynamically performing standard exceeding judgment in real time according to the pollutant monitoring data;
s2, according to the result of the overproof judgment, obtaining the overproof factor and the corresponding overproof point, comparing the overproof factor with the fingerprint database of the pollutant characteristic factors of all the park enterprises, primarily screening suspected pollution sources, and screening the emission contribution factor EF of the suspected pollution sources1Assigned a value of 1, emission contribution factors EF for the remaining emission sources1The value is assigned to 0;
s3, acquiring meteorological monitoring data of the industrial park, and determining the pollution tracing time T and the interval S according to the meteorological monitoring data and the enterprise distribution situation in the park;
s4, dynamically calculating the concentration contribution M of suspected pollution sources to receptor points by minutes in a tracing period based on a Lagrangian numerical modelmn,MmnThe concentration contribution coefficients of different suspected pollution sources to receptor sites;
s5, collecting the on-line working condition information and the on-line monitoring data of the enterprise row port, and building a normalized distribution lag statistic model at the out-of-limit pointEmission contribution factor EF for each suspected pollution source2And EF3Carrying out analysis;
s6, combining the contribution M of suspected pollution source to the concentration of receptor sitemnAnd emission contribution factor EF of each suspected pollution source1、EF2、EF3And calculating to obtain the concentration contribution comprehensive index Con of each suspected pollution source to the receptor site.
In a further embodiment, in step S1, the dynamically performing the out-of-standard determination in real time according to the pollutant monitoring data includes the following steps:
s11, collecting basic pollutant monitoring data and establishing a park atmospheric pollutant basic concentration level library;
and S12, performing dynamic standard exceeding judgment according to the real-time concentration variability and relevant concentration standard limit values of all pollutants.
In a further embodiment, in step S2, the process of preliminarily screening suspected pollution sources includes the following steps:
s21, carrying out waste gas emission and carding on the park enterprises, and establishing a pollutant characteristic factor fingerprint library;
s22, comparing the standard exceeding factor with the fingerprint database of the pollutant characteristic factor, and primarily screening suspected pollution sources;
s23, defining emission contribution factor EF of suspected pollution source1With a value of 1, maintaining its emission contribution factor EF for the remaining emission sources1The value is assigned to 0.
In a further embodiment, in step S3, the process of determining the time and the interval of the pollution source tracing includes the following steps:
s31, collecting basic meteorological data of the park;
s32, selecting the maximum straight line distance from a suspected pollution source to a receptor point as S according to the distribution of the enterprises in the garden, and according to the real-time change of the wind speed And (3) carrying out integral solution according to the following formula, and determining the time T and the interval S of the pollution source tracing:

in a further embodiment, in step S4, the minute-by-minute dynamic calculation of the contribution M of suspected pollution source to the concentration of the receptor sitemnComprises the following steps:
s41, establishing a Lagrangian numerical model;
s42, releasing a large number of particles at the position of a receptor point in a tracing period, and calculating a response function for the input change of the suspected pollution source based on three-dimensional space and time to obtain a transmission relation matrix between the suspected pollution source and the receptor point and the residence time of a grid point air mass changing along with a time sequence;
and S43, performing backward source receptor relation and potential source contribution analysis.
In a further embodiment, in step S42, when calculating the transmission relationship matrix between the suspected pollution source and the receptor site, the following formula is used to calculate the grid site air mass residence time τi:

Where Ts is the time resolution in seconds, N is the number of samples within the time range of Ts, J is the total number of particles released, fijnRepresenting the number of particles contributing to a given point.
In a further embodiment, the contribution M of the suspected contamination source to the concentration of the receptor site is calculated by the following formulamn:
Ym=MmnXn
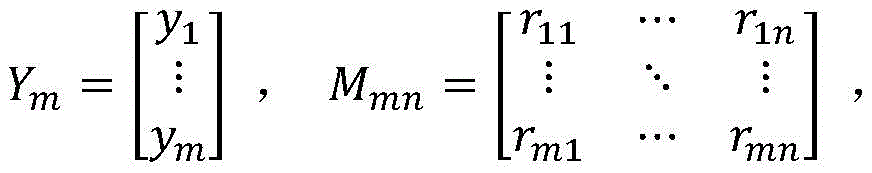
In the formula, YmRepresenting a concentration value matrix obtained by simulation; xnThe unknown quantity represents an emission source matrix which needs to be obtained by inversion solution; mmnMatrix representationA concentration contribution coefficient matrix of the same grid point discharge to the receptor points; m represents the number of receptor sites and n represents the number of suspected contamination sources.
In a further embodiment, in step S5, the establishing the normalized distribution hysteresis statistical model at the out-of-limit point is performed to determine the emission contribution factor EF of each suspected pollution source2And EF3The process of performing the analysis comprises the steps of:
s51, collecting real-time online working condition data of enterprises in the park and online monitoring data of enterprise row openings, and establishing a park online production and discharge information base;
s52, establishing a normalized distribution hysteresis statistical model for the production emission information and the standard exceeding point, and analyzing:
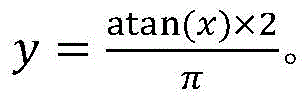
s521, performing normalization processing on all the data collected in the step S51 by adopting a nonlinear normalization method of inverse cotangent function conversion, and mapping the data into a range from 0 to 1 to form dimensionless quantity;
s522, establishing a normalized distribution hysteresis statistical model of the online working condition data of the enterprise, the online monitoring data of the enterprise row port and the standard exceeding point positions by adopting the following formula:
At=α+β0Bt+β1Bt-1+β2Bt-2+…+βsBt-s+ut
in the formula:
s is a lag length, and is dynamically adjusted according to the source tracing time T determined in the step S3;
β0the short-term multiplier is used for representing the average influence on the value A when the variable B changes by one unit;
βithe delay multiplier represents the average influence of the past time variable B changing by one unit on the value A;
S523, combining the normalized distribution hysteresis statistical model, calculating to obtain an emission contribution factor EF of each emission point position2And EF3。
In a further embodiment, in step S6, the calculating of the comprehensive index Con of contribution of each suspected pollution source to the concentration of the receptor site refers to:
calculating the concentration contribution comprehensive index Con of each suspected pollution source to the receptor site according to the following formula:
Con=EF1×EF2×EF3×Mmn。
compared with the prior art, the technical scheme of the invention has the following remarkable beneficial effects:
(1) according to the invention, the monitoring data of each area are accurately obtained through the distributed micro-station, and the overproof factors, the corresponding receptor points and the corresponding suspected pollution sources are analyzed through the detailed component station, so that the subsequent pollution source tracing calculated amount is reduced, and the accuracy of the pollutant tracing result is improved.
(2) And calculating the contribution condition of each suspected pollution source to a receptor site by combining the online working condition information of the meteorological station and the enterprise and the online monitoring data of the enterprise discharge port, further locking the real pollution source from the suspected pollution sources, calculating the contribution rate of each pollution source or the park enterprise to the overproof site, and realizing dynamic accurate source tracing of atmospheric pollutants in the industrial park under the conditions of different wind directions, wind speeds and strong source discharge.
(3) Based on a Lagrange numerical model, in a tracing period, dynamically calculating the concentration contribution M of suspected pollution sources to receptor points by minutesmnAnd the accuracy of the calculation result is high, and the tracing efficiency is high.
It should be understood that all combinations of the foregoing concepts and additional concepts described in greater detail below can be considered as part of the inventive subject matter of this disclosure unless such concepts are mutually inconsistent. In addition, all combinations of claimed subject matter are considered a part of the presently disclosed subject matter.
The foregoing and other aspects, embodiments and features of the present teachings can be more fully understood from the following description taken in conjunction with the accompanying drawings. Additional aspects of the present invention, such as features and/or advantages of exemplary embodiments, will be apparent from the description which follows, or may be learned by practice of specific embodiments in accordance with the teachings of the present invention.
Drawings
The drawings are not intended to be drawn to scale. In the drawings, each identical or nearly identical component that is illustrated in various figures may be represented by a like numeral. For purposes of clarity, not every component may be labeled in every drawing. Embodiments of various aspects of the present invention will now be described, by way of example, with reference to the accompanying drawings, in which:
FIG. 1 is a flow chart of the industrial park atmospheric pollutants tracing method of the present invention.
Fig. 2 is a schematic diagram of the spatial distribution of the concentration contribution of each grid point to the receptor point a at a certain time in the present invention.
Fig. 3 is a schematic diagram of the spatial distribution of the concentration contribution of each grid point to the receptor point B at a certain time in the present invention.
Detailed Description
In order to better understand the technical content of the present invention, specific embodiments are described below with reference to the accompanying drawings.
With reference to fig. 1, the present invention provides a tracing method for atmospheric pollutants in an industrial park, which includes the following steps:
and S1, collecting pollutant monitoring data of the detailed component station and the micro station of the industrial park, and dynamically judging the standard exceeding according to the pollutant monitoring data in real time.
S2, according to the result of the overproof judgment, obtaining the overproof factor and the corresponding overproof point, comparing the overproof factor with the fingerprint database of the pollutant characteristic factors of all the park enterprises, primarily screening suspected pollution sources, and screening the emission contribution factor EF of the suspected pollution sources1Assigned a value of 1, emission contribution factors EF for the remaining emission sources1The value is assigned to 0.
And S3, acquiring the meteorological monitoring data of the industrial park, and determining the pollution tracing time T and the interval S according to the meteorological monitoring data and the enterprise distribution situation in the park.
S4, dynamically calculating the concentration contribution M of suspected pollution sources to receptor points by minutes in a tracing period based on a Lagrangian numerical modelmn,MmnThe contribution coefficient of different suspected pollution sources to the concentration of the receptor site.
S5, collecting the on-line working condition information and the on-line monitoring data of the enterprise discharge port, and establishing a normalized distribution lag statistical model at the out-of-limit point to obtain the emission contribution factor EF of each suspected pollution source2And EF3And (6) carrying out analysis.
S6, combining the contribution M of suspected pollution source to the concentration of receptor sitemnAnd emission contribution factor EF of each suspected pollution source1、EF2、EF3And calculating to obtain the concentration contribution comprehensive index Con of each suspected pollution source to the receptor site.
Step one, performing standard exceeding judgment according to pollutant monitoring data in real time and dynamically
In step S1, the overproof determination includes: collecting basic monitoring data, establishing a park atmospheric pollutant basic concentration level library, and performing dynamic standard exceeding judgment and the like according to the real-time variability of the pollutant concentration and relevant concentration standard limit values.
Preferably, according to actual needs, a plurality of micro stations are distributed and deployed in the garden to monitor each important area of interest or all areas in real time.
It should be understood that in the present invention, the overproof judgment can be performed in the micro station, or the micro station can transmit the monitoring data back to the detailed component station to perform further detailed component analysis and overproof judgment on the monitoring data, lock the overproof factor therein, and then determine the overproof point (receptor point) according to the installation position of the micro station corresponding to the monitoring data.
Step two, preliminarily screening suspected pollution sources
Firstly, exhaust emission and carding are carried out on park enterprises, a pollution characteristic factor fingerprint library is established, then, standard exceeding factors are compared with the pollution characteristic factor fingerprint library, suspected pollution sources are preliminarily screened, and the suspected pollution sources are aimed atSource, defining its emission contribution factor EF1With a value of 1, maintaining its emission contribution factor EF for the remaining emission sources1A value of 0 is assigned for distinction.
The name of each park enterprise, the position of an emission source (emission point) and a pollutant factor corresponding to each emission point are recorded in the pollution characteristic factor fingerprint library. When the exceeding factor is found to exist, the exceeding factor is compared with the pollutant factor in the pollutant characteristic factor fingerprint library, the successfully compared emission source is screened out and defined as a suspected pollution source, and the emission contribution factor EF of the suspected pollution source1The assignment is updated to 1 and the other emission sources maintain the initial assignment of 0.
When more than one overproof factor exists, each overproof factor can be analyzed one by one to screen out a plurality of groups of suspected pollution sources, and then the pollution source tracing analysis process of the following steps is carried out respectively to find out the pollutant source tracing analysis result corresponding to each overproof factor.
Step three, determining the time and interval of pollution tracing
Specifically, the method includes the steps of firstly collecting basic meteorological data of a park, selecting the maximum linear distance from a suspected pollution source to a receptor point to be S according to the distribution of park enterprises, and according to the real-time changing wind speed And (3) carrying out integral solution according to the following formula, and further determining the time (T) and the interval (S) of the pollution tracing:
 therefore, the part which does not conform to the time and the interval in the suspected pollution source can be deleted, and the range of the suspected pollution source is further reduced.
Step four, dynamically calculating the concentration contribution M of suspected pollution sources to receptor sites by minutesmn
In the invention, based on the Lagrange numerical model, the contribution M of suspected pollution sources to the concentration of receptor sitesmnAnd (6) performing calculation. The Lagrange numerical model tracks the motion trail of a large number of particles by using a statistical method and calculates the space of virtual particlesAnd (5) obtaining the track of the motion in space and time, and further carrying out other calculations. The core part is how the movement of the air mass is described. For a particle, assuming its initial position P (t), a first guess position P' (t + Δ t) is obtained:
P′(t+Δt)=P(t)+V(P,t)Δt。
the final position is therefore:
P(t+Δt)=P(t)+0.5[V(P,t)+V(P′,t+Δt)]Δt。
to first order accuracy, the integral trajectory equation used is:

wherein t is time, Δ t is time step, and V is wind speed.
In a source tracing period, a large number of particles are released at a receptor point position, then a response function is calculated for the change of emission source input based on three-dimensional space and time, a transmission relation matrix between an emission source and a receptor and a mesh point air mass residence time changing along with a time sequence are obtained, and further backward source receptor relation and potential source contribution analysis are carried out.
When calculating a transmission relation matrix between the suspected pollution source and the receptor point, calculating the grid point air mass residence time tau by adopting the following formulai:
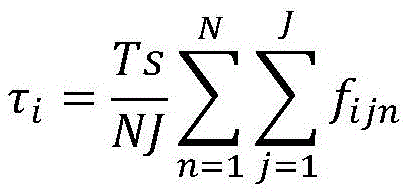
Where Ts is the time resolution in seconds, N is the number of samples within the time range of Ts, J is the total number of particles released, fijnRepresenting the number of particles contributing to a given point.
Finally, calculating the concentration contribution M of the suspected pollution source to the receptor site by the following formulamn:
Ym=MmnXn
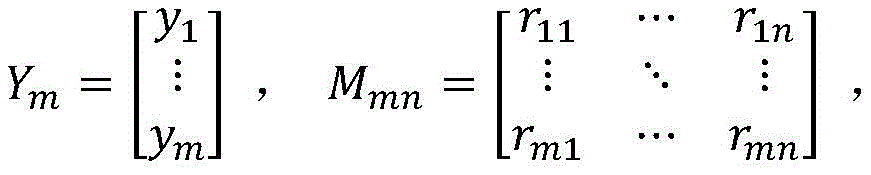
In the formula, YmRepresenting a concentration value matrix obtained by simulation; xnThe unknown quantity represents an emission source matrix which needs to be obtained by inversion solution; mmnThe matrix represents a concentration contribution coefficient matrix of different grid point discharge to the receptor points; m represents the number of receptor sites and n represents the number of suspected contamination sources.
Step five, establishing a normalized distribution hysteresis statistical model at the standard exceeding point position to obtain emission contribution factors EF of each suspected pollution source2And EF3Performing an analysis
The method comprises the following steps: collecting real-time online working condition data of enterprises in the park and online monitoring data of enterprise row openings, and establishing a park online production and discharge information base; establishing a normalized distribution lag statistical model for analyzing the production emission information and the standard exceeding point; and finally, calculating to obtain an emission contribution factor EF of each emission point position by combining a normalized distribution hysteresis statistical model2And EF3. The process of establishing the normalized distribution hysteresis statistical model comprises the following steps:
and S521, performing normalization processing on all the data acquired in the step S51 by adopting a nonlinear normalization method of inverse cotangent function conversion, and mapping the data into a range from 0 to 1 to form dimensionless quantity, so that the data processing is facilitated. The normalization formula used is as follows:
s522, establishing a normalized distribution hysteresis statistical model of the online working condition data of the enterprise, the online monitoring data of the enterprise row port and the standard exceeding point positions by adopting the following formula:
At=α+β0Bt+β1Bt-1+β2Bt-2+…+βsBt-s+ut
in the formula:
s is a lag length, and is dynamically adjusted according to the source tracing time T determined in the step S3;
β0the short-term multiplier is used for representing the average influence on the value A when the variable B changes by one unit;
βithe delay multiplier represents the average influence of the past time variable B changing by one unit on the value A;
Step six, calculating and obtaining a comprehensive index Con of concentration contribution of each suspected pollution source to receptor sites
Specifically, a comprehensive evaluation index is established according to the model traceability and statistical traceability method results so as to realize dynamic and accurate traceability of the industrial park. Wherein, the establishment of the comprehensive evaluation index comprises the following steps: on one hand, based on a statistical tracing method, according to the emission contribution factor EF obtained by solving in the second step and the fifth step1、EF2And EF3On the other hand, the concentration contribution M of the suspected point source minute by minute dynamic to the receptor point obtained by model tracing calculation in step 4mnFinally, establishing a comprehensive index Con of the concentration contribution of each emission source to the receptor points, and realizing dynamic accurate tracing of the industrial park, wherein the calculation formula is as follows:
Con=EF1×EF2×EF3×Mmn。
fig. 2 and 3 are schematic diagrams of the spatial distribution of the concentration contributions of each grid point to the receptor point a and the receptor point B at a certain time in the same industrial park, respectively.
In this disclosure, aspects of the present invention are described with reference to the accompanying drawings, in which a number of illustrative embodiments are shown. Embodiments of the present disclosure are not necessarily defined to include all aspects of the invention. It should be appreciated that the various concepts and embodiments described above, as well as those described in greater detail below, may be implemented in any of numerous ways, as the disclosed concepts and embodiments are not limited to any one implementation. In addition, some aspects of the present disclosure may be used alone, or in any suitable combination with other aspects of the present disclosure.
Although the present invention has been described with reference to the preferred embodiments, it is not intended to be limited thereto. Those skilled in the art can make various changes and modifications without departing from the spirit and scope of the invention. Therefore, the protection scope of the present invention should be determined by the appended claims.
Claims (9)
1. A tracing method for atmospheric pollutants in an industrial park is characterized by comprising the following steps:
s1, collecting pollutant monitoring data of the detailed component station and the micro station of the industrial park, and dynamically performing standard exceeding judgment in real time according to the pollutant monitoring data;
s2, according to the result of the overproof judgment, obtaining the overproof factor and the corresponding overproof point, comparing the overproof factor with the fingerprint database of the pollutant characteristic factors of all the park enterprises, primarily screening suspected pollution sources, and screening the emission contribution factor EF of the suspected pollution sources1Assigned a value of 1, emission contribution factors EF for the remaining emission sources1The value is assigned to 0;
s3, acquiring meteorological monitoring data of the industrial park, and determining the pollution tracing time T and the interval S according to the meteorological monitoring data and the enterprise distribution situation in the park;
s4, dynamically calculating the concentration contribution M of suspected pollution sources to receptor points by minutes in a tracing period based on a Lagrangian numerical modelmn,MmnThe concentration contribution coefficients of different suspected pollution sources to receptor sites;
s5, collecting the on-line working condition information and the on-line monitoring data of the enterprise discharge port, and establishing a normalized distribution lag statistical model at the out-of-limit point to obtain the emission contribution factor EF of each suspected pollution source2And EF3Carrying out analysis;
s6, combining the contribution of suspected pollution source to the concentration of receptor siteMmnAnd emission contribution factor EF of each suspected pollution source1、EF2、EF3And calculating to obtain the concentration contribution comprehensive index Con of each suspected pollution source to the receptor site.
2. The industrial park atmospheric pollutant tracing method of claim 1, wherein in step S1, the real-time dynamic overproof judgment according to the pollutant monitoring data comprises the following steps:
s11, collecting basic pollutant monitoring data and establishing a park atmospheric pollutant basic concentration level library;
and S12, performing dynamic standard exceeding judgment according to the real-time concentration variability and relevant concentration standard limit values of all pollutants.
3. The method of claim 1, wherein in step S2, the process of preliminarily screening suspected sources of pollution comprises the following steps:
s21, carrying out waste gas emission and carding on the park enterprises, and establishing a pollutant characteristic factor fingerprint library;
s22, comparing the standard exceeding factor with the fingerprint database of the pollutant characteristic factor, and primarily screening suspected pollution sources;
s23, defining emission contribution factor EF of suspected pollution source1With a value of 1, maintaining its emission contribution factor EF for the remaining emission sources1The value is assigned to 0.
4. The industrial park atmospheric pollutant tracing method of claim 1, wherein in step S3, the process of determining the pollution tracing time and interval comprises the following steps:
s31, collecting basic meteorological data of the park;
s32, selecting the maximum straight line distance from a suspected pollution source to a receptor point as S according to the distribution of the enterprises in the garden, and according to the real-time change of the wind speed And (3) carrying out integral solution according to the following formula, and determining the time T and the interval S of the pollution source tracing:

5. the method of claim 1, wherein in step S4, the contribution M of suspected pollution sources to the concentration of the receptor sites is dynamically calculated every minutemnComprises the following steps:
s41, establishing a Lagrangian numerical model;
s42, releasing a large number of particles at the position of a receptor point in a tracing period, and calculating a response function for the input change of the suspected pollution source based on three-dimensional space and time to obtain a transmission relation matrix between the suspected pollution source and the receptor point and the residence time of a grid point air mass changing along with a time sequence;
and S43, performing backward source receptor relation and potential source contribution analysis.
6. The method as claimed in claim 5, wherein in step S42, the following formula is used to calculate the grid point air mass residence time τ when calculating the transmission relationship matrix between the suspected pollution source and the receptor pointi:

Where Ts is the time resolution in seconds, N is the number of samples within the time range of Ts, J is the total number of particles released, fijnRepresenting the number of particles contributing to a given point.
7. The method of claim 5, wherein the contribution M of suspected pollution sources to the concentration of the receptor sites is calculated by the following formulamn:
Ym=MmnXn

In the formula, YmRepresenting a concentration value matrix obtained by simulation; xnThe unknown quantity represents an emission source matrix which needs to be obtained by inversion solution; mmnThe matrix represents a concentration contribution coefficient matrix of different grid point discharge to the receptor points; m represents the number of receptor sites and n represents the number of suspected contamination sources.
8. The method according to claim 7, wherein in step S5, the emission contribution factor EF of the normalized distribution hysteresis statistical model to each suspected pollution source is established at the out-of-limit point2And EF3The process of performing the analysis comprises the steps of:
s51, collecting real-time online working condition data of enterprises in the park and online monitoring data of enterprise row openings, and establishing a park online production and discharge information base;
s52, establishing a normalized distribution hysteresis statistical model for the production emission information and the standard exceeding point, and analyzing:
s521, performing normalization processing on all the data collected in the step S51 by adopting a nonlinear normalization method of inverse cotangent function conversion, and mapping the data into a range from 0 to 1 to form dimensionless quantity;
s522, establishing a normalized distribution hysteresis statistical model of the online working condition data of the enterprise, the online monitoring data of the enterprise row port and the standard exceeding point positions by adopting the following formula:
At=α+β0Bt+β1Bt-1+β2Bt-2+…+βsBt-s+ut
in the formula:
s is a lag length, and is dynamically adjusted according to the source tracing time T determined in the step S3;
β0the short-term multiplier is used for representing the average influence on the value A when the variable B changes by one unit;
βithe delay multiplier represents the average influence of the past time variable B changing by one unit on the value A;

S523, combining the normalized distribution hysteresis statistical model, calculating to obtain an emission contribution factor EF of each emission point position2And EF3。
9. The method as claimed in claim 1, wherein in step S6, the step of calculating the concentration contribution comprehensive index Con of each suspected pollution source to the receptor site is:
calculating the concentration contribution comprehensive index Con of each suspected pollution source to the receptor site according to the following formula:
Con=EF1×EF2×EF3×Mmn。
Priority Applications (1)
| Application Number | Priority Date | Filing Date | Title |
|---|---|---|---|
| CN202010447423.3A CN111814111B (en) | 2020-05-25 | 2020-05-25 | A method for traceability of air pollutants in industrial parks |
Applications Claiming Priority (1)
| Application Number | Priority Date | Filing Date | Title |
|---|---|---|---|
| CN202010447423.3A CN111814111B (en) | 2020-05-25 | 2020-05-25 | A method for traceability of air pollutants in industrial parks |
Publications (2)
| Publication Number | Publication Date |
|---|---|
| CN111814111A true CN111814111A (en) | 2020-10-23 |
| CN111814111B CN111814111B (en) | 2021-07-27 |
Family
ID=72848442
Family Applications (1)
| Application Number | Title | Priority Date | Filing Date |
|---|---|---|---|
| CN202010447423.3A Active CN111814111B (en) | 2020-05-25 | 2020-05-25 | A method for traceability of air pollutants in industrial parks |
Country Status (1)
| Country | Link |
|---|---|
| CN (1) | CN111814111B (en) |
Cited By (26)
| Publication number | Priority date | Publication date | Assignee | Title |
|---|---|---|---|---|
| CN112562794A (en) * | 2020-12-09 | 2021-03-26 | 河北先进环保产业创新中心有限公司 | Pollution source analysis method and device and terminal equipment |
| CN113393058A (en) * | 2021-07-14 | 2021-09-14 | 成都佳华物链云科技有限公司 | Pollutant management and control method, prediction management and control method, real-time management and control method and device |
| CN113436045A (en) * | 2021-06-15 | 2021-09-24 | 深圳中兴网信科技有限公司 | Atmospheric pollution multi-scale fusion traceability method and device and readable storage medium |
| CN113552289A (en) * | 2021-07-14 | 2021-10-26 | 清华苏州环境创新研究院 | A method for traceability of air pollution based on Gaussian model |
| CN113777223A (en) * | 2021-08-12 | 2021-12-10 | 北京金水永利科技有限公司 | Atmospheric pollutant tracing method and system |
| CN113970610A (en) * | 2021-11-19 | 2022-01-25 | 孙扬 | Chemical industry park atmosphere VOCs traceability online monitoring system and method |
| CN113984968A (en) * | 2021-10-26 | 2022-01-28 | 上海建科环境技术有限公司 | Industrial park atmospheric VOCs tracing method |
| CN114121169A (en) * | 2021-11-04 | 2022-03-01 | 四川工商学院 | Deep learning-based chemical industry park VOCs pollution tracing method |
| CN114356880A (en) * | 2021-12-15 | 2022-04-15 | 浙江工业大学 | Data-driven small-scale region atmospheric pollutant fast tracing method |
| CN114461737A (en) * | 2021-12-20 | 2022-05-10 | 北京市科学技术研究院城市安全与环境科学研究所 | Monitoring traceability method and system based on imprint model |
| CN114547127A (en) * | 2020-11-25 | 2022-05-27 | 上海金艺检测技术有限公司 | Method for analyzing transportation source of polluted air mass in small-scale area of industrial park |
| CN114611361A (en) * | 2022-03-18 | 2022-06-10 | 徐起翔 | Atmospheric pollutant chemical rapid tracing method based on numerical model |
| CN114757687A (en) * | 2022-05-07 | 2022-07-15 | 合肥先进产业研究院 | Atmospheric pollutant tracing system and method based on big data technology |
| CN115114352A (en) * | 2022-08-25 | 2022-09-27 | 深圳市华云中盛科技股份有限公司 | Rapid analysis management system for typical pollutants |
| CN115130831A (en) * | 2022-06-08 | 2022-09-30 | 北京工业大学 | Small-scale refined atmospheric pollution tracing method |
| CN115374877A (en) * | 2022-09-14 | 2022-11-22 | 深圳市安帕尔科技有限公司 | Particulate matter emission source analysis method, device, equipment and medium |
| CN115409483A (en) * | 2022-09-05 | 2022-11-29 | 江苏尚维斯环境科技股份有限公司 | Tracing method and system for atmospheric pollution source |
| CN115639326A (en) * | 2022-11-14 | 2023-01-24 | 西安圆方环境卫生检测技术有限公司 | A system and method for monitoring and managing atmospheric environment in industrial areas |
| CN115713980A (en) * | 2022-11-08 | 2023-02-24 | 北京首创大气环境科技股份有限公司 | High-value tracing method for VOCs in industrial park |
| CN116228501A (en) * | 2023-05-08 | 2023-06-06 | 中科三清科技有限公司 | Method, device, storage medium and electronic equipment for identifying industries in areas with excessive pollutant discharge |
| CN118066652A (en) * | 2024-04-25 | 2024-05-24 | 无锡中科电气设备有限公司 | A method and system for intelligent air conditioning in rail transit stations |
| CN118535884A (en) * | 2024-05-20 | 2024-08-23 | 北京工业大学 | A screening and identification method and system for key road dust control sections |
| CN118671292A (en) * | 2024-08-16 | 2024-09-20 | 南京言和意丰环保科技有限公司 | Water pollution monitoring method and system for multi-parameter water quality measurement |
| CN119291054A (en) * | 2024-08-30 | 2025-01-10 | 重庆市生态环境科学研究院 | Risk-oriented comprehensive traceability method and system for VOCs in industrial parks |
| CN119917869A (en) * | 2024-12-31 | 2025-05-02 | 山西低碳环保产业集团有限公司 | Industrial pollution tracing method and system based on machine learning |
| CN120539354A (en) * | 2025-05-20 | 2025-08-26 | 内蒙古自治区环境监测总站包头分站 | An air quality detection and early warning system for environmental monitoring and analysis |
Citations (13)
| Publication number | Priority date | Publication date | Assignee | Title |
|---|---|---|---|---|
| CN102622670A (en) * | 2012-02-20 | 2012-08-01 | 中国环境科学研究院 | Tracing method for suspected risk sources of sudden water environment pollution accidents |
| CN102830674A (en) * | 2012-08-27 | 2012-12-19 | 宇星科技发展(深圳)有限公司 | Automatic monitoring system and monitoring method for working conditions of pollution source discharging process |
| EP1914015B1 (en) * | 2006-10-19 | 2016-08-24 | SOCIETA' ITALIANA ACETILENE E DERIVATI S.I.A.D. S.p.A. in abbreviated form SIAD S.p.A. | Method based on the use of a gas mixture for sizing systems of gas diffusion in groundwater and evaluating the aquifer contamination |
| CN106295905A (en) * | 2016-08-22 | 2017-01-04 | 南京大学 | A kind of air quality based on Lagrange conveying model is quickly traced to the source forecasting procedure |
| CN107941994A (en) * | 2017-11-09 | 2018-04-20 | 北京伟瑞迪科技有限公司 | It is a kind of towards industrial park pollutant Source Tracing method |
| CN108108336A (en) * | 2016-11-24 | 2018-06-01 | 上海栖芯信息科技有限公司 | A kind of atmosphere pollution source tracing method towards industrial park |
| CN109409666A (en) * | 2018-09-21 | 2019-03-01 | 浙江仁欣环科院有限责任公司 | Environment impact assessment method based on model of atmospheric diffusion and linear programming |
| CN109583743A (en) * | 2018-11-26 | 2019-04-05 | 南京创蓝科技有限公司 | Atmosphere pollution source tracing method based on Lagrangian model and mobile observation platform |
| CN110085281A (en) * | 2019-04-26 | 2019-08-02 | 成都之维安科技股份有限公司 | A kind of environmental pollution traceability system and method based on feature pollution factor source resolution |
| CN110516838A (en) * | 2019-07-15 | 2019-11-29 | 袁静 | A kind of air pollution integrated synthesis assessment prediction method |
| CN110673229A (en) * | 2019-10-23 | 2020-01-10 | 新亚优华科技有限公司 | A method for tracking the diffusion trajectory of atmospheric pollutants based on hotspot grid technology |
| CN110824110A (en) * | 2019-10-30 | 2020-02-21 | 山东大学 | A regional ozone pollution traceability system based on Lagrangian trajectory model and chemical box model |
| CN111103397A (en) * | 2019-11-21 | 2020-05-05 | 浙江华珍科技有限公司 | Atmospheric pollution tracing monitoring method |
-
2020
- 2020-05-25 CN CN202010447423.3A patent/CN111814111B/en active Active
Patent Citations (13)
| Publication number | Priority date | Publication date | Assignee | Title |
|---|---|---|---|---|
| EP1914015B1 (en) * | 2006-10-19 | 2016-08-24 | SOCIETA' ITALIANA ACETILENE E DERIVATI S.I.A.D. S.p.A. in abbreviated form SIAD S.p.A. | Method based on the use of a gas mixture for sizing systems of gas diffusion in groundwater and evaluating the aquifer contamination |
| CN102622670A (en) * | 2012-02-20 | 2012-08-01 | 中国环境科学研究院 | Tracing method for suspected risk sources of sudden water environment pollution accidents |
| CN102830674A (en) * | 2012-08-27 | 2012-12-19 | 宇星科技发展(深圳)有限公司 | Automatic monitoring system and monitoring method for working conditions of pollution source discharging process |
| CN106295905A (en) * | 2016-08-22 | 2017-01-04 | 南京大学 | A kind of air quality based on Lagrange conveying model is quickly traced to the source forecasting procedure |
| CN108108336A (en) * | 2016-11-24 | 2018-06-01 | 上海栖芯信息科技有限公司 | A kind of atmosphere pollution source tracing method towards industrial park |
| CN107941994A (en) * | 2017-11-09 | 2018-04-20 | 北京伟瑞迪科技有限公司 | It is a kind of towards industrial park pollutant Source Tracing method |
| CN109409666A (en) * | 2018-09-21 | 2019-03-01 | 浙江仁欣环科院有限责任公司 | Environment impact assessment method based on model of atmospheric diffusion and linear programming |
| CN109583743A (en) * | 2018-11-26 | 2019-04-05 | 南京创蓝科技有限公司 | Atmosphere pollution source tracing method based on Lagrangian model and mobile observation platform |
| CN110085281A (en) * | 2019-04-26 | 2019-08-02 | 成都之维安科技股份有限公司 | A kind of environmental pollution traceability system and method based on feature pollution factor source resolution |
| CN110516838A (en) * | 2019-07-15 | 2019-11-29 | 袁静 | A kind of air pollution integrated synthesis assessment prediction method |
| CN110673229A (en) * | 2019-10-23 | 2020-01-10 | 新亚优华科技有限公司 | A method for tracking the diffusion trajectory of atmospheric pollutants based on hotspot grid technology |
| CN110824110A (en) * | 2019-10-30 | 2020-02-21 | 山东大学 | A regional ozone pollution traceability system based on Lagrangian trajectory model and chemical box model |
| CN111103397A (en) * | 2019-11-21 | 2020-05-05 | 浙江华珍科技有限公司 | Atmospheric pollution tracing monitoring method |
Non-Patent Citations (4)
| Title |
|---|
| ANNAFRANCOVÁA: "Evaluating the suitability of different environmental samples for tracing atmospheric pollution in industrial areas", 《ENVIRONMENTAL POLLUTION》 * |
| CHAOWANG: "Tracking sensitive source areas of different weather pollution types using GRAPES-CUACE adjoint model", 《ATMOSPHERIC ENVIRONMENT》 * |
| 张雪晶: "关于大气污染溯源监测的探索和思考", 《黑龙江科技信息》 * |
| 曹雅静 等: "渤海海域油污溯源模拟预测研究", 《广西科学院学报》 * |
Cited By (38)
| Publication number | Priority date | Publication date | Assignee | Title |
|---|---|---|---|---|
| CN114547127A (en) * | 2020-11-25 | 2022-05-27 | 上海金艺检测技术有限公司 | Method for analyzing transportation source of polluted air mass in small-scale area of industrial park |
| CN112562794A (en) * | 2020-12-09 | 2021-03-26 | 河北先进环保产业创新中心有限公司 | Pollution source analysis method and device and terminal equipment |
| CN112562794B (en) * | 2020-12-09 | 2022-11-08 | 河北先进环保产业创新中心有限公司 | Pollution source analysis method and device and terminal equipment |
| CN113436045A (en) * | 2021-06-15 | 2021-09-24 | 深圳中兴网信科技有限公司 | Atmospheric pollution multi-scale fusion traceability method and device and readable storage medium |
| CN113552289A (en) * | 2021-07-14 | 2021-10-26 | 清华苏州环境创新研究院 | A method for traceability of air pollution based on Gaussian model |
| CN113393058A (en) * | 2021-07-14 | 2021-09-14 | 成都佳华物链云科技有限公司 | Pollutant management and control method, prediction management and control method, real-time management and control method and device |
| CN113552289B (en) * | 2021-07-14 | 2024-01-23 | 清华苏州环境创新研究院 | An air pollution source tracing method based on Gaussian model |
| CN113393058B (en) * | 2021-07-14 | 2023-10-20 | 成都佳华物链云科技有限公司 | Pollutant control method, prediction control method, real-time control method and device |
| CN113777223A (en) * | 2021-08-12 | 2021-12-10 | 北京金水永利科技有限公司 | Atmospheric pollutant tracing method and system |
| CN113777223B (en) * | 2021-08-12 | 2024-04-30 | 北京金水永利科技有限公司 | Atmospheric pollutant tracing method and system |
| CN113984968A (en) * | 2021-10-26 | 2022-01-28 | 上海建科环境技术有限公司 | Industrial park atmospheric VOCs tracing method |
| CN114121169A (en) * | 2021-11-04 | 2022-03-01 | 四川工商学院 | Deep learning-based chemical industry park VOCs pollution tracing method |
| CN113970610A (en) * | 2021-11-19 | 2022-01-25 | 孙扬 | Chemical industry park atmosphere VOCs traceability online monitoring system and method |
| CN114356880A (en) * | 2021-12-15 | 2022-04-15 | 浙江工业大学 | Data-driven small-scale region atmospheric pollutant fast tracing method |
| CN114461737A (en) * | 2021-12-20 | 2022-05-10 | 北京市科学技术研究院城市安全与环境科学研究所 | Monitoring traceability method and system based on imprint model |
| CN114611361A (en) * | 2022-03-18 | 2022-06-10 | 徐起翔 | Atmospheric pollutant chemical rapid tracing method based on numerical model |
| CN114757687A (en) * | 2022-05-07 | 2022-07-15 | 合肥先进产业研究院 | Atmospheric pollutant tracing system and method based on big data technology |
| CN115130831A (en) * | 2022-06-08 | 2022-09-30 | 北京工业大学 | Small-scale refined atmospheric pollution tracing method |
| CN115130831B (en) * | 2022-06-08 | 2024-02-27 | 北京工业大学 | A small-scale refined air pollution source tracing method |
| CN115114352B (en) * | 2022-08-25 | 2023-01-31 | 深圳市华云中盛科技股份有限公司 | Rapid analysis and management system for typical pollutants |
| CN115114352A (en) * | 2022-08-25 | 2022-09-27 | 深圳市华云中盛科技股份有限公司 | Rapid analysis management system for typical pollutants |
| CN115409483A (en) * | 2022-09-05 | 2022-11-29 | 江苏尚维斯环境科技股份有限公司 | Tracing method and system for atmospheric pollution source |
| CN115409483B (en) * | 2022-09-05 | 2023-10-20 | 江苏尚维斯环境科技股份有限公司 | Tracing method and system for atmospheric pollution source |
| CN115374877A (en) * | 2022-09-14 | 2022-11-22 | 深圳市安帕尔科技有限公司 | Particulate matter emission source analysis method, device, equipment and medium |
| CN115713980A (en) * | 2022-11-08 | 2023-02-24 | 北京首创大气环境科技股份有限公司 | High-value tracing method for VOCs in industrial park |
| CN115639326B (en) * | 2022-11-14 | 2023-11-03 | 西安圆方环境卫生检测技术有限公司 | Atmospheric environment monitoring and management system and method for industrial area |
| CN115639326A (en) * | 2022-11-14 | 2023-01-24 | 西安圆方环境卫生检测技术有限公司 | A system and method for monitoring and managing atmospheric environment in industrial areas |
| CN116228501A (en) * | 2023-05-08 | 2023-06-06 | 中科三清科技有限公司 | Method, device, storage medium and electronic equipment for identifying industries in areas with excessive pollutant discharge |
| CN118066652A (en) * | 2024-04-25 | 2024-05-24 | 无锡中科电气设备有限公司 | A method and system for intelligent air conditioning in rail transit stations |
| CN118066652B (en) * | 2024-04-25 | 2024-08-09 | 无锡中科电气设备有限公司 | Intelligent air adjusting method and system for rail transit station |
| CN118535884A (en) * | 2024-05-20 | 2024-08-23 | 北京工业大学 | A screening and identification method and system for key road dust control sections |
| CN118671292A (en) * | 2024-08-16 | 2024-09-20 | 南京言和意丰环保科技有限公司 | Water pollution monitoring method and system for multi-parameter water quality measurement |
| CN118671292B (en) * | 2024-08-16 | 2024-11-12 | 南京言和意丰环保科技有限公司 | A water pollution monitoring method and system for multi-parameter water quality measurement |
| CN119291054A (en) * | 2024-08-30 | 2025-01-10 | 重庆市生态环境科学研究院 | Risk-oriented comprehensive traceability method and system for VOCs in industrial parks |
| CN119917869A (en) * | 2024-12-31 | 2025-05-02 | 山西低碳环保产业集团有限公司 | Industrial pollution tracing method and system based on machine learning |
| CN119917869B (en) * | 2024-12-31 | 2025-11-25 | 山西低碳环保产业集团有限公司 | Machine Learning-Based Methods and Systems for Industrial Pollution Source Tracing |
| CN120539354A (en) * | 2025-05-20 | 2025-08-26 | 内蒙古自治区环境监测总站包头分站 | An air quality detection and early warning system for environmental monitoring and analysis |
| CN120539354B (en) * | 2025-05-20 | 2025-12-26 | 内蒙古自治区环境监测总站包头分站 | Air environment quality detection and early warning system for environment monitoring analysis |
Also Published As
| Publication number | Publication date |
|---|---|
| CN111814111B (en) | 2021-07-27 |
Similar Documents
| Publication | Publication Date | Title |
|---|---|---|
| CN111814111B (en) | A method for traceability of air pollutants in industrial parks | |
| CN115759488B (en) | Carbon emission monitoring early warning analysis system and method based on edge calculation | |
| CN113610243B (en) | Atmospheric pollutant tracing method based on coupled machine learning and correlation analysis | |
| CN110673229A (en) | A method for tracking the diffusion trajectory of atmospheric pollutants based on hotspot grid technology | |
| CN112926223B (en) | A method for evaluating the effect of artificial weather modification | |
| CN106529410A (en) | Haze diffusion path mapping and source determination method based on surveillance video | |
| CN113740221B (en) | Air pollution source area determination method based on fine particulate matter and ozone | |
| CN115293579A (en) | Inversion evaluation method and device capable of obtaining odor pollution treatment target | |
| CN114004514A (en) | Atmospheric ozone pollution occurrence meteorological condition grade discrimination method | |
| AU2021105563A4 (en) | Method for Traceability of Air Pollutants Based on Coupled Machine Learning and Correlation Analysis | |
| CN119849764A (en) | Method for determining small-drainage-basin non-point source pollution key source area | |
| CN119199030A (en) | Microscale source tracing method of atmospheric pollutants based on atmospheric concentration monitoring in industrial parks | |
| CN116913409A (en) | A particle pollution prediction method and device based on generative adversarial network | |
| CN120355100A (en) | Atmospheric pollution channel transmission data analysis system | |
| CN120801631A (en) | Air quality risk early warning and treatment integrated method and system | |
| CN116466368B (en) | Dust extinction coefficient profile estimation method based on laser radar and satellite data | |
| CN117871790A (en) | Roadside monitoring station data analysis and traffic tracing method based on multiple data fusion | |
| CN115757534B (en) | Air quality prediction method of deep learning model based on potential source contribution analysis | |
| CN113552289B (en) | An air pollution source tracing method based on Gaussian model | |
| CN118277792A (en) | A PM2.5 real-time prediction method based on improved GRU | |
| CN117273190A (en) | An improved air quality forecasting method and system based on AutoFormer | |
| CN116777710A (en) | Emergency treatment analysis method and system for snow melting non-point source pollution | |
| CN113420443A (en) | Accurate stink simulation method coupled with peak-to-average factor | |
| CN120446407B (en) | Carbon emission calculation method and device based on dynamic simulation and actual measurement of navigation | |
| CN118644370B (en) | Air-ground integrated ecological environment management method and device |
Legal Events
| Date | Code | Title | Description |
|---|---|---|---|
| PB01 | Publication | ||
| PB01 | Publication | ||
| SE01 | Entry into force of request for substantive examination | ||
| SE01 | Entry into force of request for substantive examination | ||
| CB02 | Change of applicant information |
Address after: 211505 Building A6, 5 Floors, 9 Kechuang Avenue, Jiangbei New District, Nanjing City, Jiangsu Province Applicant after: Nanjing University environmental planning and Design Institute Group Co., Ltd Address before: 211505 Building A6, 5 Floors, 9 Kechuang Avenue, Jiangbei New District, Nanjing City, Jiangsu Province Applicant before: ACADEMY OF ENVIRONMENTAL PLANNING & DESIGN CO., LTD. NANJING University |
|
| CB02 | Change of applicant information | ||
| GR01 | Patent grant | ||
| GR01 | Patent grant |