CN111259306B - Method for measuring and calculating crop coefficient in winter wheat area - Google Patents
Method for measuring and calculating crop coefficient in winter wheat area Download PDFInfo
- Publication number
- CN111259306B CN111259306B CN201911416931.9A CN201911416931A CN111259306B CN 111259306 B CN111259306 B CN 111259306B CN 201911416931 A CN201911416931 A CN 201911416931A CN 111259306 B CN111259306 B CN 111259306B
- Authority
- CN
- China
- Prior art keywords
- crop
- crop coefficient
- winter wheat
- coefficient
- growth period
- Prior art date
- Legal status (The legal status is an assumption and is not a legal conclusion. Google has not performed a legal analysis and makes no representation as to the accuracy of the status listed.)
- Active
Links
Images


Classifications
-
- G—PHYSICS
- G06—COMPUTING OR CALCULATING; COUNTING
- G06F—ELECTRIC DIGITAL DATA PROCESSING
- G06F17/00—Digital computing or data processing equipment or methods, specially adapted for specific functions
- G06F17/10—Complex mathematical operations
-
- A—HUMAN NECESSITIES
- A01—AGRICULTURE; FORESTRY; ANIMAL HUSBANDRY; HUNTING; TRAPPING; FISHING
- A01G—HORTICULTURE; CULTIVATION OF VEGETABLES, FLOWERS, RICE, FRUIT, VINES, HOPS OR SEAWEED; FORESTRY; WATERING
- A01G25/00—Watering gardens, fields, sports grounds or the like
- A01G25/16—Control of watering
-
- G—PHYSICS
- G01—MEASURING; TESTING
- G01N—INVESTIGATING OR ANALYSING MATERIALS BY DETERMINING THEIR CHEMICAL OR PHYSICAL PROPERTIES
- G01N33/00—Investigating or analysing materials by specific methods not covered by groups G01N1/00 - G01N31/00
- G01N33/0098—Plants or trees
-
- Y—GENERAL TAGGING OF NEW TECHNOLOGICAL DEVELOPMENTS; GENERAL TAGGING OF CROSS-SECTIONAL TECHNOLOGIES SPANNING OVER SEVERAL SECTIONS OF THE IPC; TECHNICAL SUBJECTS COVERED BY FORMER USPC CROSS-REFERENCE ART COLLECTIONS [XRACs] AND DIGESTS
- Y02—TECHNOLOGIES OR APPLICATIONS FOR MITIGATION OR ADAPTATION AGAINST CLIMATE CHANGE
- Y02A—TECHNOLOGIES FOR ADAPTATION TO CLIMATE CHANGE
- Y02A20/00—Water conservation; Efficient water supply; Efficient water use
- Y02A20/152—Water filtration
Landscapes
- Engineering & Computer Science (AREA)
- Life Sciences & Earth Sciences (AREA)
- Physics & Mathematics (AREA)
- General Physics & Mathematics (AREA)
- Chemical & Material Sciences (AREA)
- Data Mining & Analysis (AREA)
- Health & Medical Sciences (AREA)
- Theoretical Computer Science (AREA)
- Mathematical Physics (AREA)
- Algebra (AREA)
- Mathematical Analysis (AREA)
- Analytical Chemistry (AREA)
- Biochemistry (AREA)
- General Health & Medical Sciences (AREA)
- Water Supply & Treatment (AREA)
- Immunology (AREA)
- Pathology (AREA)
- Wood Science & Technology (AREA)
- Computational Mathematics (AREA)
- Medicinal Chemistry (AREA)
- Environmental Sciences (AREA)
- Mathematical Optimization (AREA)
- Food Science & Technology (AREA)
- Pure & Applied Mathematics (AREA)
- Databases & Information Systems (AREA)
- Software Systems (AREA)
- General Engineering & Computer Science (AREA)
- Botany (AREA)
- Cultivation Of Plants (AREA)
- Management, Administration, Business Operations System, And Electronic Commerce (AREA)
Abstract
本发明属于作物系数测算方法技术领域,具体涉及一种区域冬小麦作物系数测算方法。该方法以单作物系数法为基础,并结合实际对单作物系数法进行改进,再将改进后的单作物系数法公式作为表达式带入地图代数,对栅格图的每个像元进行区域作物系数的计算,从而的到本发明的区域冬小麦作物系数图。该方法提出了适合中国种植分区的作物系数基础推荐值和修正公式,并结合地图代数,提出一种区域单作物系数法,并用冬小麦实测需水量资料进行验证,为解决作物系数由点到面转化的难题提供有效途径,为农田水利工程规划、设计和管理、地区间水量分配、跨流域调配水提供技术支撑。
The invention belongs to the technical field of methods for measuring and calculating crop coefficients, and in particular relates to a method for measuring and calculating regional winter wheat crop coefficients. This method is based on the single crop coefficient method, and combined with the actual situation to improve the single crop coefficient method. Calculation of the crop coefficient, thus to the regional winter wheat crop coefficient map of the present invention. This method proposes the basic recommended values and correction formulas of crop coefficients suitable for China's planting regions, and combines map algebra to propose a regional single crop coefficient method, which is verified by the measured water demand data of winter wheat, in order to solve the transformation of crop coefficients from point to area It provides an effective way to solve difficult problems, and provides technical support for the planning, design and management of farmland water conservancy projects, water allocation between regions, and water allocation across river basins.
Description
技术领域technical field
本发明属于作物系数计算方法技术领域,具体涉及一种冬小麦区域作物系数测算方法。The invention belongs to the technical field of crop coefficient calculation methods, and in particular relates to a method for measuring and calculating winter wheat regional crop coefficients.
背景技术Background technique
小麦是世界三大粮食作物之一,冬小麦占小麦总产的91%和播种面积的90%,冬小麦产量的高低直接决定着我国小麦的总产,而灌溉是小麦产量的重要保障。灌溉用水是农业用水的主要组成部分,灌溉用水占我国农业用水的90%以上,而作物需水量是制定灌溉制度的基础,是实现农业节水的重要依据,对提高农业用水管理水平和农业用水效率具有重要意义。作物需水量是农作物在土壤水分适宜、生长良好、产量水平较高的条件下棵间蒸发和植株蒸腾以及用于组成植株体、消耗于光合作用等生理过程的需水量之和。作物需水量是水权制度建设、水法制定的重要根据,是一个国家和地区农田水利工程规划与设计等工作的基础资料,也是水资源开发、利用与管理、农作物种植区划与布局、农业生产运筹等工作的理论依据,是国民经济发展与决策制定的保障。因此,准确确定作物需水量十分重要。Wheat is one of the three major food crops in the world. Winter wheat accounts for 91% of the total wheat production and 90% of the sown area. The level of winter wheat production directly determines the total wheat production in my country, and irrigation is an important guarantee for wheat production. Irrigation water is the main component of agricultural water use. Irrigation water accounts for more than 90% of agricultural water use in my country. Crop water demand is the basis for formulating irrigation systems and an important basis for realizing agricultural water saving. Efficiency matters. Crop water demand is the sum of the water demand for inter-tree evaporation, plant transpiration, plant body composition, photosynthesis and other physiological processes under the conditions of suitable soil moisture, good growth and high yield level. Crop water demand is an important basis for the construction of the water rights system and the formulation of water laws. It is the basic data for the planning and design of farmland water conservancy projects in a country and region. The theoretical basis of operational research and other work is the guarantee for national economic development and decision-making. Therefore, it is very important to accurately determine the water requirement of crops.
作物需水量的计算分为直接法和间接法两类。直接法通常根据作物需水量实测数据,建立作物需水量与主要影响因素的经验关系式,该方法具有简便,结果较为准确的优点,但是直接法是根据试验得到经验公式,没有严格的物理基础,通常有严格限制条件,不可直接套用。间接法是通过参考作物腾发量与作物系数的乘积得到作物需水量,联合国粮农组织第56卷(FAO56)将参考作物腾发量(Reference evapotranspiration,ET0)定义为假想的参考作物腾发速率,该作物高度为12cm,反射率恒定为0.23,叶面阻力为70s/m,类似于表面开阔、生长旺盛、完全覆盖地面、土壤水分适宜条件下的绿色草地的腾发量。目前使用最多的是联合国粮农组织(FAO)推荐的基于能量平衡和空气动力学方法的FAO56PenmanMonteith法,也称综合法,该方法具有很好的物理基础,适用范围广泛,不需地区率定,根据气象条件即可得到ET0。The calculation of crop water requirement can be divided into direct method and indirect method. The direct method usually establishes the empirical relationship between the crop water demand and the main influencing factors based on the measured data of the crop water demand. This method has the advantages of simplicity and relatively accurate results. There are usually strict restrictions and cannot be directly applied. The indirect method is to obtain the crop water requirement by multiplying the reference crop evapotranspiration and the crop coefficient. The UN Food and Agriculture Organization volume 56 (FAO56) defines the reference crop evapotranspiration (Reference evapotranspiration, ET 0 ) as the imaginary reference crop evapotranspiration rate , the crop height is 12cm, the reflectance is constant at 0.23, and the leaf surface resistance is 70s/m, which is similar to the evaporation of green grassland under the conditions of open surface, vigorous growth, complete coverage of the ground, and suitable soil moisture. Currently the most used method is the FAO56PenmanMonteith method based on energy balance and aerodynamic methods recommended by the Food and Agriculture Organization of the United Nations (FAO), also known as the comprehensive method. This method has a good physical basis, a wide range of applications, and does not require regional calibration. Meteorological conditions can be obtained ET 0 .
作物系数是实际作物需水量ETc和参考作物腾发量ET0的比值,主要影响因素有作物本身生物学特性、土壤水分因素和栽培管理措施,具有全生育期年际间稳定性、生育阶段不稳定性和地域性的特点。作物系数通常通过灌溉试验得到,在传统的作物系数模型中,多采用线性或非线性回归,建立影响因素和作物系数的回归关系,但是传统的作物系数模型不具有较好的物理基础,也往往代表了开展灌溉试验的点尺度上的作物系数模型,与当地的气象、土壤、作物等紧密相关,其他无资料地区无法直接套用。The crop coefficient is the ratio of the actual crop water demand ET c to the reference crop evaporation ET 0 , the main influencing factors are the biological characteristics of the crop itself, soil moisture factors and cultivation management measures, and it has the interannual stability of the whole growth period, the growth stage Instability and regional characteristics. Crop coefficients are usually obtained through irrigation experiments. In traditional crop coefficient models, linear or nonlinear regression is often used to establish the regression relationship between influencing factors and crop coefficients. However, traditional crop coefficient models do not have a good physical basis and often It represents the point-scale crop coefficient model for irrigation experiments, which is closely related to local meteorology, soil, crops, etc., and cannot be directly applied to other areas without data.
作物系数还可以通过单作物系数法和双作物系数法得到,然而单作物系数法和双作物系数法得到的作物系数与实测值差别较大, FAO56单作物系数法和双作物系数法的作物系数推荐值不是为中国地区量身定制,使用时容易产生较大误差;而且单作物系数法得到的作物系数仍然为点尺度,作物系数的空间上的代表性未从得知。由于作物系数具有较大的空间变异性,这些点尺度的数据不能直接用于其他点,更不能代替某一较大面积上的平均值,但是在农田水利工程规划、设计和管理、地区间水量分配、跨流域调配水需要的是不同尺度上的作物系数和作物需水量,因此水利部门全国布局了灌溉试验总站、中心站和终点站,但是由于人力、物力和财力等限制,不可能无限制的布置观测站点。因此,如何利用有限的灌溉试验数据,由点及面,由灌溉试验站“扩展”更多无灌溉资料地区的应用和生产中,是当前面临的一个难题。The crop coefficient can also be obtained by the single crop coefficient method and the double crop coefficient method. However, the crop coefficient obtained by the single crop coefficient method and the double crop coefficient method are quite different from the measured value. The recommended value is not tailored for the Chinese region, and it is prone to large errors when used; moreover, the crop coefficient obtained by the single crop coefficient method is still on a point scale, and the spatial representativeness of the crop coefficient is unknown. Due to the large spatial variability of crop coefficients, these point-scale data cannot be directly used for other points, let alone replace the average value on a larger area. Water distribution and cross-basin allocation require crop coefficients and crop water requirements on different scales. Therefore, the water conservancy department has deployed irrigation test stations, central stations and terminal stations nationwide. However, due to limitations in manpower, material and financial resources, it is impossible to limit arrangement of observation sites. Therefore, how to use the limited irrigation test data to "expand" the application and production of more areas without irrigation data from point to area and from the irrigation test station is a difficult problem at present.
发明内容Contents of the invention
针对目前的作物系数测算方法是基于灌溉试验,通过线性或非线性回归建立的作物系数经验公式,不具有较好的物理基础,仅仅是开展灌溉试验的点尺度上的作物系数经验公式,与当地的气象、土壤、作物等紧密相关,其他无资料地区无法直接套用;且FAO56单作物系数法和双作物系数法的作物系数推荐值不是为中国地区量身定制,多个研究表明单作物系数法和双作物系数法在中国计算作物系数时有较大误差;而且单作物系数法得到的作物系数仍然为点尺度,点尺度的数据不能直接用于其他点,更不能代替某一较大面积上的平均值,作物系数的空间上的代表性未从得知的缺陷和问题,本发明提供一种冬小麦区域作物系数测算方法。The current crop coefficient calculation method is based on irrigation experiments, and the crop coefficient empirical formula established through linear or nonlinear regression does not have a good physical basis. The weather, soil, and crops are closely related to other areas without data, and cannot be directly applied in other areas without data; and the crop coefficient recommended by FAO56 single crop coefficient method and double crop coefficient method are not tailored for China. Many studies have shown that the single crop coefficient method In addition, the crop coefficient obtained by the single-crop coefficient method is still point-scale, and the point-scale data cannot be directly used for other points, let alone replace a large area. The average value of the crop coefficient and the spatial representativeness of the crop coefficient are unknown defects and problems. The invention provides a method for measuring and calculating the regional crop coefficient of winter wheat.
本发明解决其技术问题所采用的方案是:一种冬小麦区域作物系数测算方法,包括以下步骤:The solution adopted by the present invention to solve the technical problems is: a method for measuring and calculating the regional crop coefficient of winter wheat, comprising the following steps:
第一步、对研究区域进行分区,收集研究区域内不同分区灌溉试验的气象数据和冬小麦需水量数据,将不同分区冬小麦全生育期划分为生长初期、快速生育期、生长中期、生长后期;The first step is to partition the research area, collect meteorological data and water demand data of winter wheat in different partitions in the research area, and divide the whole growth period of winter wheat in different partitions into early growth period, rapid growth period, middle growth period and late growth period;
第二步、确定各分区生长初期、生长中期、生长后期的典型气候条件,即确定各分区不同生育阶段的2m风速多年平均实测值(u2(obs)) 及最小相对湿度(RHmin(obs))多年平均实测值;The second step is to determine the typical climate conditions in the early, middle and late growth stages of each zone, that is, to determine the average measured value of 2m wind speed (u 2(obs) ) and the minimum relative humidity (RH min(obs) ) ) The average measured value for many years;
第三步、根据各分区开展冬小麦需水量试验,通过生长初期、生长中期、生长后期实测的冬小麦需水量ETc与参考作物腾发量ET0的比值,确定冬小麦生长初期、生长中期、生长后期作物系数实测值 Kcini(obs)、Kcmid(obs)、Kcend(obs);The third step is to carry out winter wheat water demand test according to each division, and determine the initial growth period, middle growth period and late growth period of winter wheat through the ratio of the measured winter wheat water demand ET c to the reference crop evapotranspiration ET 0 Crop coefficient measured value K cini(obs) , K cmid(obs) , K cend(obs) ;
第四步、将不同生育阶段作物系数实测值与FAO56单作物系数法的作物系数进行对比,得到单作物系数法冬小麦作物系数与实测值的相对误差;The fourth step is to compare the measured values of crop coefficients at different growth stages with the crop coefficients of the FAO56 single crop coefficient method to obtain the relative error between the single crop coefficient method winter wheat crop coefficient and the measured value;
第五步、若相对误差较大,将冬小麦作物系数实测值的平均值替代FAO56单作物系数法的作物系数推荐值,并将第一步得到的不同分区实测2m风速及最小相对湿度多年平均实测值替代FAO56单作物系数法中2m风速和最小相对湿度的界定值,得到改进的单作物系数的表达式,Step 5. If the relative error is large, replace the crop coefficient recommended value of the FAO56 single-crop coefficient method with the average value of the measured value of the winter wheat crop coefficient, and use the measured 2m wind speed and minimum relative humidity in different zones obtained in the first step. Values replace the 2m wind speed and the minimum relative humidity limit values in the FAO56 single crop coefficient method, and the improved expression of the single crop coefficient is obtained,

式(1)中:Kc(obs)表示各生育阶段的作物系数多年平均实测值,分别代表生长初期、生长中期、生长后期或全生长期的作物系数多年平均实测值Kcini(obs)、Kcmid(obs)、Kcend(obs),RHmin(obs)、u2(obs)分别表示对应生育阶段的最小相对湿度RHmin和2m风速u2的多年平均实测值;In formula (1): K c(obs) represents the multi-year average measured values of crop coefficients at each growth stage, respectively representing the multi-year average measured values of crop coefficients K cini(obs) , K cmid(obs) , K cend(obs) , RH min(obs) , u 2(obs) represent the minimum relative humidity RH min and the 2m wind speed u 2 of the corresponding growth stage, respectively, the multi-year average measured values;
若相对误差较小,则使用单作物系数法;If the relative error is small, use the single crop coefficient method;
第六步、将改进的单作物系数或单作物系数法的表达式带入地图代数,对栅格图的每个像元进行区域单作物系数法的计算,得到区域冬小麦作物系数图。The sixth step is to bring the improved single-crop coefficient or the expression of the single-crop coefficient method into the map algebra, and calculate the regional single-crop coefficient method for each pixel of the grid map, and obtain the regional winter wheat crop coefficient map.
上述的一种冬小麦区域作物系数测算方法,第六步中冬小麦区域单作物系数图的计算方法为:首先对冬小麦种植区域划分网格,选择合适的网格大小;其次,将最小相对湿度和2m风速栅格图加载到 ArcMap中显示;最后,以最小相对湿度、2m风速栅格图和作物系数实测值作为输入,把改进的单作物系数法表达式代入地图代数,对栅格图的每个像元进行改进的单作物系数法的计算,从而得到作物系数图。In the above-mentioned method for calculating the regional crop coefficient of winter wheat, the calculation method of the single crop coefficient map of the winter wheat region in the sixth step is as follows: first, divide the winter wheat planting area into a grid, and select an appropriate grid size; secondly, the minimum relative humidity and 2m The wind speed raster map is loaded into ArcMap and displayed; finally, with the minimum relative humidity, 2m wind speed raster map and the measured value of crop coefficient as input, the improved single crop coefficient method expression is substituted into the map algebra, and each raster map The improved single-crop coefficient method is used to calculate the pixels, so as to obtain the crop coefficient map.
本发明的有益效果:本发明基于多站点冬小麦需水量试验,对 FAO56单作物系数法适用性进行检验,并对单作物系数法进行改进,提出适合中国种植分区的作物系数基础推荐值和修正公式,并结合地图代数,提出一种区域单作物系数法,并用冬小麦实测需水量资料进行验证,为解决作物系数由点到面转化的难题提供有效途径,为农田水利工程规划、设计和管理、地区间水量分配、跨流域调配水提供技术支撑。Beneficial effects of the present invention: the present invention is based on the multi-site winter wheat water demand test, tests the applicability of the FAO56 single crop coefficient method, and improves the single crop coefficient method, and proposes the crop coefficient basic recommendation value and correction formula suitable for China's planting divisions , combined with map algebra, put forward a regional single crop coefficient method, and verify it with the measured water demand data of winter wheat, provide an effective way to solve the problem of crop coefficient transformation from point to area, and provide a basis for the planning, design and management of farmland water conservancy projects, regional Provide technical support for inter-water allocation and cross-basin water allocation.
附图说明Description of drawings
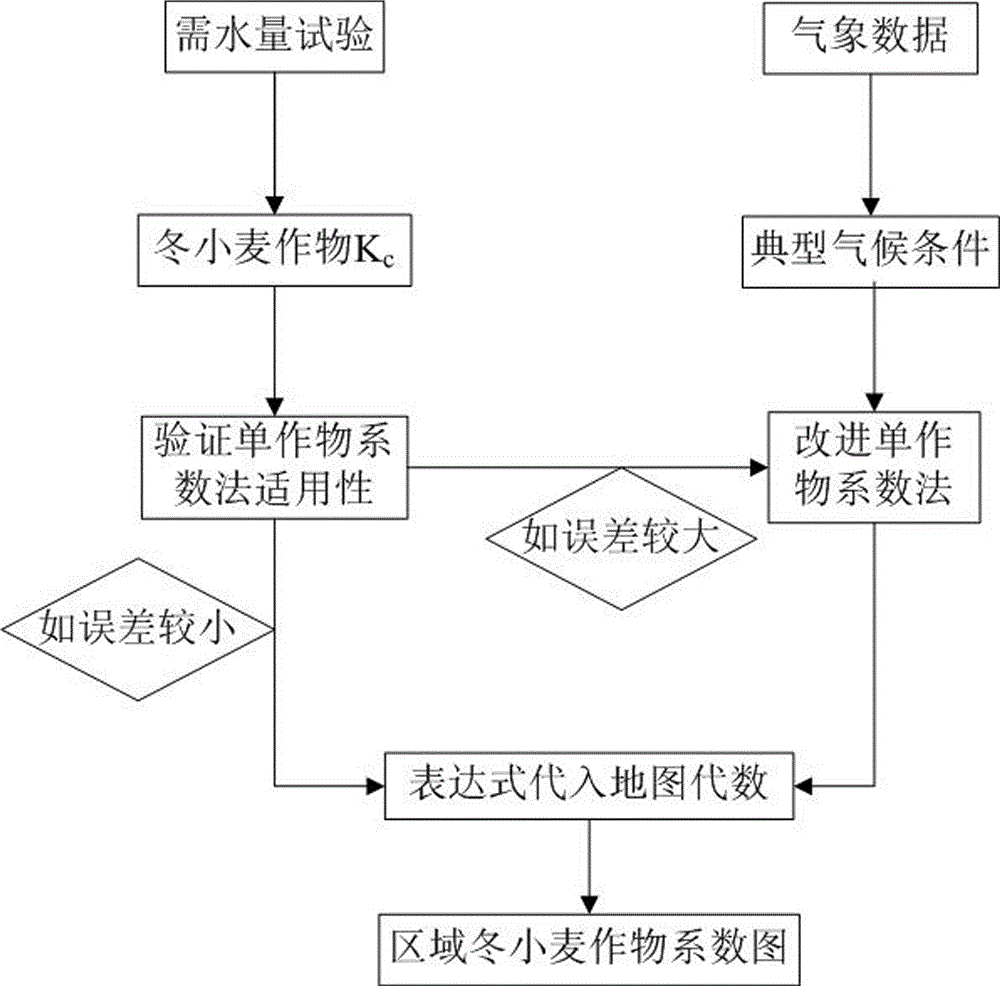
图1为本发明技术路线图。Fig. 1 is a technical roadmap of the present invention.
图2为区域单作物系数法的计算流程图。Figure 2 is the calculation flow chart of the regional single crop coefficient method.
图3为本发明冬小麦研究区域分区及灌溉试验站分布图。Fig. 3 is a distribution map of the winter wheat research area and irrigation test stations of the present invention.
图4为本发明的区域冬小麦作物系数分布图。Fig. 4 is the regional winter wheat crop coefficient distribution map of the present invention.
具体实施方式Detailed ways
下面结合附图和实施例对本发明进一步说明。The present invention will be further described below in conjunction with the accompanying drawings and embodiments.
实施例1:本发明的技术路线图见图1。首先进行基础数据的处理,将研究区域进行分区,确定各分区生长初期、生长中期、生长后期的典型气候条件。Embodiment 1: The technical roadmap of the present invention is shown in Figure 1. Firstly, the basic data are processed, and the research area is divided into subregions to determine the typical climate conditions in the early, mid-growth, and late-growth stages of each subregion.
其次,根据不同分区,将冬小麦作物系数实测值的平均值替代 FAO56单作物系数法的作物系数推荐值,并将不同分区气象站点实测 2m风速及最小相对湿度平均值替代FAO56单作物系数法中2m风速和最小相对湿度的界定值(2m/s和45%),从而得到改进后的单作物系数法。值得注意的是,2m/s和45%为“标准气象条件”下的数据,这种“标准气象条件”定义为最小相对湿度为45%和弱风条件下2m 风速为2m/s的亚湿润气候,45%和2m/s为该特定亚湿润气候条件下的最小相对湿度和2m风速典型值,同时作为气象条件的界定值,是一个静态值,而本发明采用各分区不同生育阶段的2m风速多年平均实测值(u2(obs))及最小相对湿度(RHmin(obs))多年平均实测值,动态调整,更能符合各分区的气候条件,有利于提高冬小麦作物系数的计算精度。Secondly, according to different divisions, the average value of the measured value of the winter wheat crop coefficient is replaced by the recommended value of the crop coefficient of the FAO56 single crop coefficient method, and the average value of the measured 2m wind speed and the minimum relative humidity of the meteorological stations in different regions is replaced by the 2m value of the FAO56 single crop coefficient method. The defined values of wind speed and minimum relative humidity (2m/s and 45%) are used to obtain the improved single crop coefficient method. It is worth noting that 2m/s and 45% are data under "standard meteorological conditions", which are defined as sub-humid conditions with a minimum relative humidity of 45% and a weak wind of 2m with a wind speed of 2m/s Climate, 45% and 2m/s are the minimum relative humidity and the typical value of 2m wind speed under this specific sub-humid climate condition, simultaneously as the limit value of meteorological condition, it is a static value, and the present invention adopts the 2m of different growth stages of each division The multi-year average measured values of wind speed (u 2(obs) ) and the minimum relative humidity (RH min(obs) ) are dynamically adjusted to better meet the climatic conditions of each region, which is conducive to improving the calculation accuracy of winter wheat crop coefficients.
最后,将改进后的单作物系数法和地图代数结合,提出基于地图代数的区域单作物系数计算方法,简称区域单作物系数法。利用区域单作物系数法,得冬小麦作物系数栅格图。Finally, combining the improved mono-crop coefficient method with map algebra, a regional mono-crop coefficient calculation method based on map algebra is proposed, referred to as the regional mono-crop coefficient method. The raster map of winter wheat crop coefficient was obtained by using the regional single crop coefficient method.
下面结合我国冬小麦的种植地区及种植情况对本发明方法做详细阐述。The method of the present invention is described in detail below in conjunction with the planting areas and planting conditions of my country's winter wheat.
第一步,对研究区域进行分区。中国冬小麦主要分布在河南省、河北省、山东省、山西省、陕西省、安徽省、江苏省、北京市、天津市,结合中国小麦种植区划研究,本发明将中国冬小麦种植区域分为北部冬麦区、黄淮冬麦区、长江中下游冬麦区,见图3,由图3可知,三个冬麦区域冬小麦的播种面积占全国的88.0%,冬小麦产量占全国的91.4%。The first step is to partition the study area. China's winter wheat is mainly distributed in Henan Province, Hebei Province, Shandong Province, Shanxi Province, Shaanxi Province, Anhui Province, Jiangsu Province, Beijing City, and Tianjin City. In combination with the research on China's wheat planting divisions, the present invention divides China's winter wheat planting areas into northern winter wheat areas. The wheat region, the Huanghuai winter wheat region, and the winter wheat region in the middle and lower reaches of the Yangtze River are shown in Figure 3. From Figure 3, it can be seen that the sown area of winter wheat in the three winter wheat regions accounts for 88.0% of the country's total, and the winter wheat production accounts for 91.4% of the country's total.
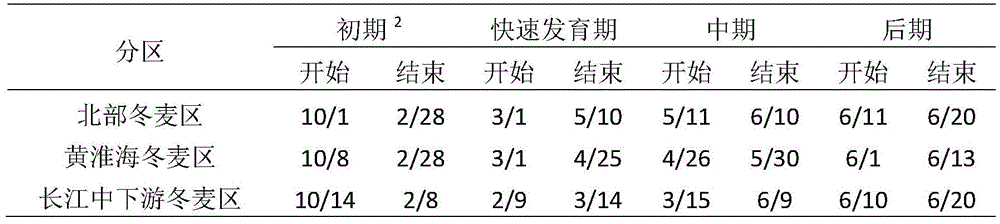
根据不同区域灌溉试验站的观测成果,对冬小麦的生育期进行划分,冬小麦生育期的划分见表1。由于当地观测数据生育期的划分和 FAO概化的四阶段生育期不同,需进行生育期的转化。生长初期包含苗期和返青期,快速发育期包含返青期和拔节期,生长中期包括抽穗期和灌浆期,生长后期为成熟期。According to the observation results of irrigation test stations in different regions, the growth period of winter wheat was divided, and the division of winter wheat growth period is shown in Table 1. Since the growth period division of local observation data is different from the four-stage growth period generalized by FAO, it is necessary to transform the growth period. The initial growth stage includes the seedling stage and the greening stage, the rapid growth stage includes the greening stage and the jointing stage, the middle growth stage includes the heading stage and the filling stage, and the late growth stage is the maturity stage.
表1 冬小麦生育期划分Table 1 Growth period division of winter wheat
第二步和第三步,确定各分区生长初期、生长中期、生长后期的典型气候条件,确定各分区不同生育阶段的2m风速多年平均实测值 (u2(obs))及最小相对湿度(RHmin(obs))多年平均实测值;确定冬小麦生长初期、生长中期、生长后期作物系数实测值Kcini(obs)、Kcmid(obs)、Kcend(obs),见表2。The second and third steps are to determine the typical climate conditions in the early, middle and late growth stages of each subregion, and to determine the multi-year average measured value of 2m wind speed (u 2 (obs) ) and the minimum relative humidity (RH min(obs) ) average measured values for many years; determine the measured values K cini(obs) , K cmid(obs) , and K cend(obs) of winter wheat crop coefficients at the early growth stage, mid-growth stage, and late growth stage, see Table 2.
表2 冬小麦各生育阶段实测作物系数和典型气候值参数表Table 2 Parameters of measured crop coefficients and typical climate values at each growth stage of winter wheat

第四步,按FAO56单作物系数法公式可得冬小麦作物系数Kc,将各生育阶段作物系数实测值Kc(见表2)与FAO56单作物系数法的作物系数进行对比,得到单作物系数法冬小麦作物系数与实测值的相对误差,结果见表3。The fourth step is to obtain the winter wheat crop coefficient Kc according to the formula of the FAO56 single-crop coefficient method, and compare the measured value Kc of the crop coefficient at each growth stage (see Table 2) with the crop coefficient of the FAO56 single-crop coefficient method to obtain the single-crop coefficient The relative error between the winter wheat crop coefficient and the measured value is shown in Table 3.
表3 FAO56单作物系数法与作物系数实测值对比结果Table 3 Comparison results of the FAO56 single-crop coefficient method and the measured value of the crop coefficient
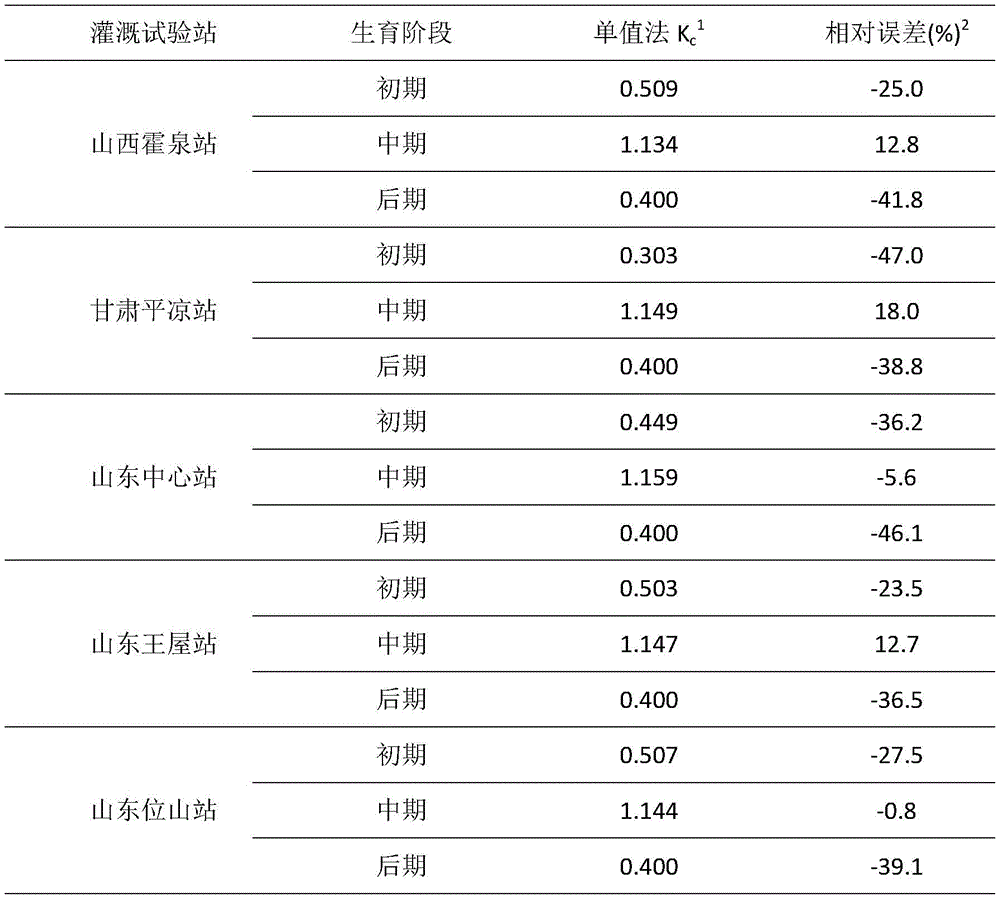

表注:1.单作物系数法得到的冬小麦作物系数;2.单作物系数法得到的冬小麦作物系数与实测值的相对误差,相对误差=(单作物系数法得到的作物系数- 实测作物系数)/实测作物系数×100。Table notes: 1. The winter wheat crop coefficient obtained by the single crop coefficient method; 2. The relative error between the winter wheat crop coefficient obtained by the single crop coefficient method and the measured value, relative error = (crop coefficient obtained by the single crop coefficient method - measured crop coefficient) / Measured crop factor × 100.
由表3可以看出,生长初期七个站作物系数计算值均偏小,相对误差除安徽肥东站较小外(-6.0%),其他六站相对误差范围在 -47.0%--23.5%之间;生长中期相对误差在-13.3%-18.0%之间,其中山西霍泉站、甘肃平凉站、山东王屋站计算值偏大,其他站偏小;生长后期作物系数计算值均偏小,相对误差范围在-46.1%--36.5%之间。由此可见,FAO56单作物系数法计算冬小麦误差较大。由于FAO56单作物系数法计算冬小麦误差较大,因此,对单作物系数法进行改进。It can be seen from Table 3 that the calculated values of the crop coefficients at the seven stations in the early growth stage are all relatively small, and the relative error ranges from -47.0% to 23.5% in the other six stations except Feidong Station in Anhui, which is relatively small (-6.0%) The relative error in the mid-growth period is between -13.3% and 18.0%, among which the calculated values at Huoquan Station in Shanxi, Pingliang Station in Gansu, and Wangwu Station in Shandong are relatively large, while those at other stations are relatively small; the calculated values of crop coefficients at the late growth stage are all relatively small , the relative error range is between -46.1% - 36.5%. It can be seen that the calculation error of winter wheat by FAO56 single crop coefficient method is large. Because the FAO56 single-crop coefficient method has large errors in calculating winter wheat, the single-crop coefficient method was improved.
第五步,将冬小麦作物系数实测值的平均值替代FAO56单作物系数法的作物系数推荐值,并将不同分区气象站点实测2m风速及最小相对湿度平均值替代FAO56单作物系数法中2m风速和最小相对湿度的界定值(2m/s和45%),从而得到改进的单作物系数法,如下式所示。The fifth step is to replace the recommended crop coefficient value of the FAO56 single crop coefficient method with the average value of the measured value of the winter wheat crop coefficient, and to replace the 2m wind speed and the minimum relative humidity average value measured at different regional meteorological stations in the FAO56 single crop coefficient method. The limiting value of the minimum relative humidity (2m/s and 45%), thereby obtaining an improved single crop coefficient method, as shown in the following formula.

第六步、将改进的作物系数的表达式带入地图代数,对栅格图的每个像元进行区域单作物系数法的计算,得到区域冬小麦作物系数图。The sixth step is to bring the improved crop coefficient expression into the map algebra, and calculate the regional single crop coefficient method for each pixel of the grid map to obtain the regional winter wheat crop coefficient map.
将改进后的单作物系数法和地图代数结合,提出基于地图代数的区域单作物系数计算方法,简称区域单作物系数法,具体流程如图2 所示,具体如下:Combining the improved single-crop coefficient method with map algebra, a regional single-crop coefficient calculation method based on map algebra is proposed, referred to as the regional single-crop coefficient method. The specific process is shown in Figure 2, and the details are as follows:
首先,对冬小麦种植区域划分网格,选择适合的网格大小。 ArcMap10.3中默认将研究区域长宽的较小值除以250作为网格大小,即默认网格大小为17.9km*17.9km,满足分析作物系数空间变异性的要求。Firstly, the winter wheat planting area is divided into grids, and the appropriate grid size is selected. In ArcMap10.3, by default, the smaller value of the length and width of the research area is divided by 250 as the grid size, that is, the default grid size is 17.9km*17.9km, which meets the requirements for analyzing the spatial variability of crop coefficients.
其次,将最小相对湿度和2m风速栅格图加载到ArcMap中显示。Second, load the minimum relative humidity and 2m wind speed raster images into ArcMap for display.
最后,以最小相对湿度、2m风速栅格图和作物系数实测值作为输入,把改进的单作物系数法作为地图代数表达式,按照赋值参数表 2对栅格图的每个像元进行单作物系数法的计算,从而得到区域冬小麦作物系数图,计算流程图见图2。Finally, taking the minimum relative humidity, the 2m wind speed raster map and the measured value of the crop coefficient as input, the improved single crop coefficient method is used as the map algebraic expression, and each pixel of the raster map is single-cropped according to the assignment parameter table 2. The coefficient method is used to calculate the regional winter wheat crop coefficient map, and the calculation flow chart is shown in Figure 2.
借助ArcGIS环境的地图代数可以实现上述区域单作物系数法的计算,地图代数作为简易而强大的代数语言,可借助ArcPy Python站点包的扩展模块空间分析(SpatialAnalyst)模块获得,利用地图代数可以实现ArcGIS中空间分析工具、运算符号以及各种函数,来执行地理分析。With the help of the map algebra of the ArcGIS environment, the calculation of the above-mentioned regional single-crop coefficient method can be realized. As a simple and powerful algebraic language, map algebra can be obtained with the help of the extension module SpatialAnalyst module of the ArcPy Python site package. ArcGIS can be realized by using map algebra. Spatial analysis tools, operators, and various functions to perform geographic analysis.
利用区域单作物系数法,得区域冬小麦作物系数分布图,见图4。由图4可以看出,整体上呈现如下规律:生长初期、中期、后期和全期自黄淮海冬麦区向南北两个方向递减,作物系数分布呈现明显的板块特征。由图4a中可以看出,生长初期作物系数最大值出现在黄淮海冬麦区(0.687),最小值出现在北部冬麦区(0.625),各区作物系数为常数。由图4b可以看出,生长中期作物系数高值区出现在黄淮海冬麦区的山东半岛(1.150-1.223),低值区出现在北部冬麦区的河北北部、山西中部和关中地区(0.958-1.000)。图4c可以看出,冬小麦生育后期作物系数高值区出现在黄淮海冬麦区(0.750-0.857),低值区出现在长江中下游冬麦区(0.621-0.650)。由图4d可知,全生育期作物系数高值出现在黄淮海冬麦区及安徽南部、湖南中部部分地区 (0.900-0.955),低值区出现在由陕西中部向东北延伸的山西南部、河北中部、北京、天津、辽宁西部的条形带上(0.763-0.800)。Using the regional single crop coefficient method, the distribution map of the regional winter wheat crop coefficient is obtained, as shown in Figure 4. It can be seen from Figure 4 that the overall pattern is as follows: the early, middle, late and full growth stages decrease from the Huanghuaihai winter wheat region to the north and the south, and the distribution of crop coefficients shows obvious plate characteristics. It can be seen from Figure 4a that the maximum value of the crop coefficient at the early growth stage appears in the Huanghuaihai winter wheat region (0.687), and the minimum value appears in the northern winter wheat region (0.625). The crop coefficients in each region are constant. It can be seen from Figure 4b that the high-value area of crop coefficient in the mid-growth period appears in the Shandong Peninsula (1.150-1.223) of the Huanghuaihai winter wheat region, and the low-value area appears in the northern part of Hebei, central Shanxi and Guanzhong in the northern winter wheat region (0.958 -1.000). It can be seen from Figure 4c that the high-value area of crop coefficient in the late growth period of winter wheat appears in the Huanghuaihai winter wheat area (0.750-0.857), and the low-value area appears in the winter wheat area of the middle and lower reaches of the Yangtze River (0.621-0.650). It can be seen from Figure 4d that the high value of the crop coefficient in the whole growth period appears in the Huanghuaihai winter wheat region, southern Anhui, and central Hunan (0.900-0.955), and the low value area appears in the southern Shanxi and central Hebei extending from central Shaanxi to the northeast. , Beijing, Tianjin, and western Liaoning (0.763-0.800).
提取上述冬小麦各生育期作物系数栅格图中7个灌溉试验站对应的作物系数,与实测的作物系数进行比较。区域单作物系数法得到的作物系数和实测作物系数差异结果见表4。The crop coefficients corresponding to the seven irrigation test stations in the above-mentioned crop coefficient raster map of each growth stage of winter wheat were extracted, and compared with the measured crop coefficients. The difference between the crop coefficient obtained by the regional single crop coefficient method and the measured crop coefficient is shown in Table 4.
表4 区域单作物系数法得到的作物系数与实测作物系数的比较Table 4 Comparison of crop coefficients obtained by regional single crop coefficient method and measured crop coefficients

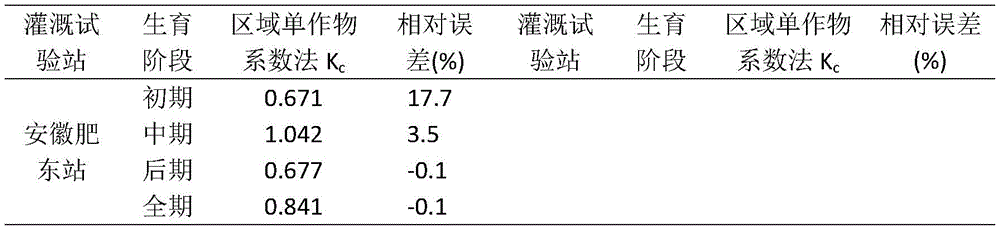
由表4中数据可以看出,除了安徽肥东站和江苏涟水站的相对误差为17.7%和-13.1%之外,生长初期的作物系数误差绝对值在9.3%之内;生长中期作物系数相对误差除山东王屋站较大(13.7%)外,其他六站相对误差绝对值均小于5.5%,除山西霍泉站和山东中心站计算值偏小外,其他五站计算值均偏大;生长后期相对误差在-6.0%-9.6%之间,山西霍泉站、山东中心站和安徽肥东站计算值偏小,其他四站生长后期作物系数计算值偏大;所有灌溉试验站全生育期相对误差均在9.0%以下,同生长后期一样,山西霍泉站、山东中心站和安徽肥东站全生育期作物系数计算值偏小,其他四站均偏大。值得注意的是快速发育期作物系数未进行计算。经验证,区域单作物系数法得到的作物系数精度比FAO单作物系数法显著提高,可用于计算作物系数空间分布图。It can be seen from the data in Table 4 that, except for the relative errors of Anhui Feidong Station and Jiangsu Lianshui Station, which are 17.7% and -13.1%, the absolute value of the crop coefficient error in the early growth stage is within 9.3%; Except for Wangwu Station in Shandong Province which is relatively large (13.7%), the absolute values of the relative errors of the other six stations are all less than 5.5%. Except for Huoquan Station in Shanxi Province and Shandong Central Station which are relatively small, the calculation values of the other five stations are all relatively large ; The relative error in the late growth period was between -6.0% and 9.6%. The calculated values at Shanxi Huoquan Station, Shandong Central Station and Anhui Feidong Station were relatively small, while the calculated values of the other four stations’ late growth crop coefficients were relatively large; all irrigation test stations were The relative errors of the growth period were all below 9.0%. Like the late growth period, the calculated values of the crop coefficients in the whole growth period of Shanxi Huoquan Station, Shandong Central Station and Anhui Feidong Station were relatively small, and the other four stations were all relatively large. It is worth noting that the coefficient of fast growing crops is not calculated. It has been verified that the accuracy of the crop coefficient obtained by the regional single crop coefficient method is significantly higher than that of the FAO single crop coefficient method, and it can be used to calculate the spatial distribution map of the crop coefficient.
实施例2:本实施例提供另一种情况的冬小麦作物系数的测算方法,具体如下。Embodiment 2: This embodiment provides another method for calculating the crop coefficient of winter wheat, specifically as follows.
第一步、对研究区域进行分区,收集研究区域内灌溉试验的气象数据和冬小麦需水量试验,将不同分区冬小麦全生育期划分为生长初期、快速生育期、生长中期、生长后期;The first step is to partition the research area, collect the meteorological data of the irrigation experiment and the water demand experiment of winter wheat in the research area, and divide the whole growth period of winter wheat in different regions into early growth period, rapid growth period, middle growth period and late growth period;
第二步、确定各分区生长初期、生长中期、生长后期的典型气候条件,即确定各分区不同生育阶段的2m风速多年平均实测值(u2(obs)) 及最小相对湿度(RHmin(obs))多年平均实测值;The second step is to determine the typical climate conditions in the early, middle and late growth stages of each zone, that is, to determine the average measured value of 2m wind speed (u 2(obs) ) and the minimum relative humidity (RH min(obs) ) ) The average measured value for many years;
第三步、根据各分区开展冬小麦需水量试验,通过生长初期、生长中期、生长后期实测的冬小麦需水量ETc与参考作物腾发量ET0的比值,确定冬小麦生长初期、生长中期、生长后期作物系数实测值 Kcini(obs)、Kcmid(obs)、Kcend(obs);The third step is to carry out winter wheat water demand test according to each division, and determine the initial growth period, middle growth period and late growth period of winter wheat through the ratio of the measured winter wheat water demand ET c to the reference crop evapotranspiration ET 0 Crop coefficient measured value K cini(obs) , K cmid(obs) , K cend(obs) ;
第四步、将作物系数实测值与FAO56单作物系数法的作物系数进行对比,得到单作物系数法冬小麦作物系数与实测值的相对误差;The fourth step, compare the crop coefficient measured value of crop coefficient with the crop coefficient of FAO56 single crop coefficient method, and obtain the relative error between the winter wheat crop coefficient of single crop coefficient method and the measured value;
第五步、单作物系数法冬小麦作物系数与实测值的相对误差较小,则直接选用单作物系数法,具体为。The fifth step, the single crop coefficient method If the relative error between the winter wheat crop coefficient and the measured value is small, the single crop coefficient method is directly selected, specifically.
首先,根据作物生长特征,将作物生育期概化为四个阶段:生长初期(从播种日延续到地面覆盖达10%)、快速发育期(从地面覆盖 10%到地面被有效全覆盖)、生长中期(从有效全覆盖到开始成熟) 和生长后期(从开始成熟到收获或完全衰老),然后查FAO56,确定相应气候条件下的推荐作物系数:Kcini(Tab)、Kcmid(Tab)、Kcend(Tab)。最后根据不同阶段的气候条件对作物系数分别进行修正。First, according to the characteristics of crop growth, the growth period of crops is generalized into four stages: the early growth period (from the sowing date until the ground coverage reaches 10%), the rapid development period (from the ground coverage of 10% to the effective full coverage of the ground), In the mid-growth period (from effective full coverage to the beginning of maturity) and the late growth period (from the beginning of maturity to harvest or complete senescence), then check FAO56 to determine the recommended crop coefficients under corresponding climate conditions: K cini (Tab) , K cmid (Tab) , K cend (Tab) . Finally, the crop coefficients were corrected according to the climatic conditions in different stages.
(1)生长初期作物系数(Kcini)的确定(1) Determination of the crop coefficient (K cini ) in the initial stage of growth
以冬小麦为例,在冬小麦生长初期,土壤蒸发占主导地位,需考虑降雨或灌溉对作物系数的影响。土壤蒸发分为两个阶段,第一阶段为“能量限制”阶段,潜在蒸发速率Eso=1.15ETo,第一阶段干燥过程持续时长t1=REW/Eso。当湿润间隔时间tw<t1时,即第一阶段的全过程,此时Kcini=Eso/ETo=1.15;Taking winter wheat as an example, in the early growth stage of winter wheat, soil evaporation is dominant, and the influence of rainfall or irrigation on the crop coefficient needs to be considered. Soil evaporation is divided into two stages. The first stage is the "energy limited" stage, the potential evaporation rate E so =1.15ET o , and the duration of the drying process in the first stage is t 1 =REW/E so . When the wetting interval time t w <t 1 , that is the whole process of the first stage, at this time K cini =E so /ET o =1.15;
当tw>t1时,即第二阶段,Kcini计算公式为:When t w >t 1 , that is the second stage, the calculation formula of K cini is:

式中,TEW为一个干旱周期总蒸发水量,mm;REW为能量限制阶段可被蒸发的水量,mm;tw为湿润过程平均间隔,天;t1为第一阶段持续时间,天;Eso为潜在蒸发率,mm/d。In the formula, TEW is the total evaporated water in a drought cycle, mm; REW is the water that can be evaporated in the energy-limited stage, mm; t w is the average interval of the wetting process, days; t 1 is the duration of the first stage, days; Eso is the potential evaporation rate, mm/d.
(2)中期作物系数(Kcmid)的确定(2) Determination of mid-term crop coefficient (K cmid )
当地气候条件不是典型气候,即最小相对湿度平均值RH≠45%, 2米处平均风速u2≠2.0m/s时,FAO56提供的作物系数值需按照下式进行修正:When the local climatic conditions are not typical, that is, when the average minimum relative humidity RH≠45%, and the average wind speed u 2 ≠2.0m/s at 2 meters, the crop coefficient value provided by FAO56 needs to be corrected according to the following formula:
Kcmid=Kcmid(tab)+[0.04(u2-2)-0.004(RHmin-45)](h/3)0.3 K cmid =K cmid(tab) +[0.04(u 2 -2)-0.004(RH min -45)](h/3) 0.3
式中,Kctab为中期作物系数推荐值;u2为该阶段2m风速,m/s;RHmin为该阶段内最低相对湿度的平均值,%,h为作物平均高度,m。In the formula, K ctab is the recommended value of mid-term crop coefficient; u 2 is the wind speed at 2 m in this stage, m/s; RH min is the average value of the lowest relative humidity in this stage, %, and h is the average height of crops, in m.
(3)后期作物系数(Kcend)的确定(3) Determination of late crop coefficient (K cend )
当地气候条件不是典型气候,即最小相对湿度平均值RH≠45%, 2米处平均风速u2≠2.0m/s时,需按照下式进行修正:When the local climate conditions are not typical, that is, the minimum average relative humidity RH≠45%, and the average wind speed u 2 ≠2.0m/s at 2 meters, it needs to be corrected according to the following formula:
Kcend=Kcend(tab)+[0.04(u2-2)-0.004(RHmin-45)](h/3)0.3 K cend =K cend(tab) +[0.04(u 2 -2)-0.004(RH min -45)](h/3) 0.3
式中,Kctab为后期作物系数;U2为该阶段2m高的日平均风速,m/s; RHmin为该阶段内最低相对湿度的平均值,%,h为作物平均高度,m。根据FAO56规定,当后期作物系数推荐值小于0.45时,不需要修正。In the formula, K ctab is the late crop coefficient; U 2 is the daily average wind speed at a height of 2 m in this stage, m/s; RH min is the average value of the lowest relative humidity in this stage, %, and h is the average height of crops, in m. According to the provisions of FAO56, when the recommended value of late crop coefficient is less than 0.45, no correction is required.
当缺乏最小相对湿度数据时,可以利用下式进行计算,When the minimum relative humidity data is lacking, the following formula can be used for calculation,
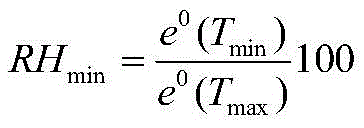
式中,Tmax、Tmin为日最高温度和日最低温度。In the formula, T max and T min are daily maximum temperature and daily minimum temperature.
将上述单作物系数法的计算公式作为表达式代入地图代数,对栅格图的每个像元进行区域单作物系数法的计算,得到区域冬小麦作物系数图。Substituting the calculation formula of the single crop coefficient method above into the map algebra as an expression, the regional single crop coefficient method is calculated for each pixel of the raster map, and the regional winter wheat crop coefficient map is obtained.
以上所述仅为本发明的较佳实施例,并不限制本发明,凡在本发明的精神和原则范围内所做的任何修改、等同替换和改进,均应包含在本发明的保护范围之内。The above descriptions are only preferred embodiments of the present invention, and do not limit the present invention. Any modifications, equivalent replacements and improvements made within the spirit and principle of the present invention shall be included in the protection scope of the present invention. Inside.
Claims (2)

Priority Applications (1)
| Application Number | Priority Date | Filing Date | Title |
|---|---|---|---|
| CN201911416931.9A CN111259306B (en) | 2019-12-31 | 2019-12-31 | Method for measuring and calculating crop coefficient in winter wheat area |
Applications Claiming Priority (1)
| Application Number | Priority Date | Filing Date | Title |
|---|---|---|---|
| CN201911416931.9A CN111259306B (en) | 2019-12-31 | 2019-12-31 | Method for measuring and calculating crop coefficient in winter wheat area |
Publications (2)
| Publication Number | Publication Date |
|---|---|
| CN111259306A CN111259306A (en) | 2020-06-09 |
| CN111259306B true CN111259306B (en) | 2023-03-17 |
Family
ID=70946768
Family Applications (1)
| Application Number | Title | Priority Date | Filing Date |
|---|---|---|---|
| CN201911416931.9A Active CN111259306B (en) | 2019-12-31 | 2019-12-31 | Method for measuring and calculating crop coefficient in winter wheat area |
Country Status (1)
| Country | Link |
|---|---|
| CN (1) | CN111259306B (en) |
Families Citing this family (1)
| Publication number | Priority date | Publication date | Assignee | Title |
|---|---|---|---|---|
| CN113378381B (en) * | 2021-06-09 | 2022-01-28 | 水利部交通运输部国家能源局南京水利科学研究院 | Method for calculating winter wheat crop coefficient based on air temperature distribution and surface heat |
Family Cites Families (3)
| Publication number | Priority date | Publication date | Assignee | Title |
|---|---|---|---|---|
| US10564316B2 (en) * | 2014-09-12 | 2020-02-18 | The Climate Corporation | Forecasting national crop yield during the growing season |
| CN106771056A (en) * | 2016-11-29 | 2017-05-31 | 鲁东大学 | A kind of crop coefficient evaluation method based on Plant stress index |
| CN109919395A (en) * | 2019-04-01 | 2019-06-21 | 安徽大学 | A kind of winter wheat yield monitoring method based on short cycle remote sensing area data |
-
2019
- 2019-12-31 CN CN201911416931.9A patent/CN111259306B/en active Active
Also Published As
| Publication number | Publication date |
|---|---|
| CN111259306A (en) | 2020-06-09 |
Similar Documents
| Publication | Publication Date | Title |
|---|---|---|
| US20250131716A1 (en) | Rapid drought monitoring and identification method for winter wheat based on uav measurements of leaf area index | |
| Zhang et al. | Evaluation of the APSIM-Wheat model in terms of different cultivars, management regimes and environmental conditions | |
| CN110567892B (en) | A hyperspectral prediction method of summer maize nitrogen based on critical nitrogen concentration | |
| CN104517030B (en) | A kind of artificial pasture grows Suitable Area extracting method | |
| US12112105B1 (en) | Soil-climate intelligent type determining method for rice target yield and nitrogen fertilizer amount | |
| CN108802728B (en) | Crop Irrigation Guidance Method for Assimilation of Dual Polarization Synthetic Aperture Radar and Crop Model | |
| CN112598277B (en) | A method to evaluate cross-regional reduction of winter wheat yield gap and improvement of nitrogen fertilizer efficiency | |
| CN113039908A (en) | Dynamic decision-making method and system for fertilization and irrigation | |
| Liu et al. | Reponses and sensitivities of maize phenology to climate change from 1981 to 2009 in Henan Province, China | |
| CN105321120A (en) | Assimilation evapotranspiration and LAI (leaf area index) region soil moisture monitoring method | |
| CN108446999A (en) | Irrigated area Different Crop ET evaluation methods are carried out based on canopy-air temperature difference and remote sensing information | |
| Liu et al. | Comparison of evapotranspiration measurements between eddy covariance and lysimeters in paddy fields under alternate wetting and drying irrigation | |
| CN109392398A (en) | A kind of potato nitrogen fertilizer recommendation method that soil testing is combined with plant diagnosis | |
| CN109544047A (en) | The method for building up of corn soil nutrient Plentiful-lack index system based on height above sea level subregion | |
| Yang | Estimation of irrigation requirements for drip-irrigated maize in a sub-humid climate | |
| CN115545519B (en) | A method for measuring and evaluating crop transpiration scale in different soil and water environments | |
| CN111259306B (en) | Method for measuring and calculating crop coefficient in winter wheat area | |
| He et al. | Characteristics of winter wheat evapotranspiration in Eastern China and comparative evaluation of applicability of different reference evapotranspiration models | |
| CN108334701A (en) | A kind of plastic tent cucumber Nitrogen Nutrition Diagnosis and recommend N application method | |
| CN114202702B (en) | Based on D-fGWinter wheat dynamic harvest index remote sensing estimation method obtained by parameter remote sensing | |
| CN115327666A (en) | Novel method and equipment for measuring evapotranspiration of reference crops for meteorological station | |
| CN120317414A (en) | Refined grain crop yield prediction method and system | |
| CN113641941A (en) | Method for accurately calculating basic seedlings in ultrahigh-yield cultivation of wheat | |
| Nie et al. | Spatio-temporal variability in rice water supply and crop coefficients based on lysimeter measurements at 21 stations in Heilongjiang Province | |
| CN113009108A (en) | Prediction method for predicting soil organic carbon content based on hydrothermal conditions |
Legal Events
| Date | Code | Title | Description |
|---|---|---|---|
| PB01 | Publication | ||
| PB01 | Publication | ||
| SE01 | Entry into force of request for substantive examination | ||
| SE01 | Entry into force of request for substantive examination | ||
| GR01 | Patent grant | ||
| GR01 | Patent grant |