CN110765703B - A modeling method for wind farm aggregation characteristics - Google Patents
A modeling method for wind farm aggregation characteristics Download PDFInfo
- Publication number
- CN110765703B CN110765703B CN201911066604.5A CN201911066604A CN110765703B CN 110765703 B CN110765703 B CN 110765703B CN 201911066604 A CN201911066604 A CN 201911066604A CN 110765703 B CN110765703 B CN 110765703B
- Authority
- CN
- China
- Prior art keywords
- wind
- power
- output
- layer
- units
- Prior art date
- Legal status (The legal status is an assumption and is not a legal conclusion. Google has not performed a legal analysis and makes no representation as to the accuracy of the status listed.)
- Active
Links
Images


Classifications
-
- G—PHYSICS
- G06—COMPUTING OR CALCULATING; COUNTING
- G06N—COMPUTING ARRANGEMENTS BASED ON SPECIFIC COMPUTATIONAL MODELS
- G06N3/00—Computing arrangements based on biological models
- G06N3/02—Neural networks
- G06N3/04—Architecture, e.g. interconnection topology
- G06N3/045—Combinations of networks
-
- Y—GENERAL TAGGING OF NEW TECHNOLOGICAL DEVELOPMENTS; GENERAL TAGGING OF CROSS-SECTIONAL TECHNOLOGIES SPANNING OVER SEVERAL SECTIONS OF THE IPC; TECHNICAL SUBJECTS COVERED BY FORMER USPC CROSS-REFERENCE ART COLLECTIONS [XRACs] AND DIGESTS
- Y04—INFORMATION OR COMMUNICATION TECHNOLOGIES HAVING AN IMPACT ON OTHER TECHNOLOGY AREAS
- Y04S—SYSTEMS INTEGRATING TECHNOLOGIES RELATED TO POWER NETWORK OPERATION, COMMUNICATION OR INFORMATION TECHNOLOGIES FOR IMPROVING THE ELECTRICAL POWER GENERATION, TRANSMISSION, DISTRIBUTION, MANAGEMENT OR USAGE, i.e. SMART GRIDS
- Y04S10/00—Systems supporting electrical power generation, transmission or distribution
- Y04S10/50—Systems or methods supporting the power network operation or management, involving a certain degree of interaction with the load-side end user applications
Landscapes
- Engineering & Computer Science (AREA)
- Theoretical Computer Science (AREA)
- Physics & Mathematics (AREA)
- Data Mining & Analysis (AREA)
- General Health & Medical Sciences (AREA)
- Biomedical Technology (AREA)
- Biophysics (AREA)
- Computational Linguistics (AREA)
- Life Sciences & Earth Sciences (AREA)
- Evolutionary Computation (AREA)
- Artificial Intelligence (AREA)
- Molecular Biology (AREA)
- Computing Systems (AREA)
- General Engineering & Computer Science (AREA)
- General Physics & Mathematics (AREA)
- Mathematical Physics (AREA)
- Software Systems (AREA)
- Health & Medical Sciences (AREA)
- Wind Motors (AREA)
Abstract
Description
技术领域technical field
本发明涉及新能源发电技术领域,特别是涉及风电场聚合特性建模方法。The invention relates to the technical field of new energy power generation, in particular to a method for modeling aggregation characteristics of wind farms.
背景技术Background technique
大规模风电接入电网是电力系统未来发展的突出特征之一。随着风电在世界各国的电力供应占比逐年提升,并网型风电呈现集群开发、弱电网接入、长距离外送的特点,风电固有的随机性和波动性给电力系统带来了电力平衡、反向调峰、电压稳定、频率稳定一系列问题,增加了电网规划和调度的难度。“平滑效应”为大规模风电共有的特性之一,表现为风电聚合出力比个体出力平滑且波动性小,有研究提出地域多元化的方法平滑风电出力的波动,因此了解和掌握风电聚合特性尤其是风电集结出力的波动性规律并对其进行建模是解决上述问题的关键基础。The integration of large-scale wind power into the grid is one of the prominent features of the future development of the power system. As the proportion of wind power in the power supply of various countries in the world increases year by year, grid-connected wind power presents the characteristics of cluster development, weak grid access, and long-distance transmission. The inherent randomness and volatility of wind power have brought power balance to the power system. , reverse peak regulation, voltage stability, frequency stability and a series of problems, increasing the difficulty of power grid planning and scheduling. "Smoothing effect" is one of the common characteristics of large-scale wind power, which means that the aggregate output of wind power is smoother and less volatile than the individual output. Some studies have proposed a method of geographical diversification to smooth the fluctuation of wind power output. Therefore, it is especially important to understand and master the characteristics of wind power aggregation. It is the fluctuation law of wind power aggregate output and modeling it is the key basis to solve the above problems.
风资源分布的差异性是产生平滑效应的关键因素,从本质上来说是由于风电机组在风电场内的空间分散性,使风电场内不同风电机组点位处的风资源表现出差异性,各风电机组出力随风速变化再通过协同的解耦作用,在某些情况下抵消了对方的波动,从而在整体上降低了风电功率的波动性。因此风电场聚合功率波动性及其平滑效应与风电场区域规模、风电场风电机组台数、风电场风况、风电场风电机组间出力相关性等因素紧密相关,且这些因素之间又互相影响。风电机组国内外现有的研究大多是对风电聚合波动性及平滑效应的规律进行描述和定性分析,主要得出了以下结论:1.风电规模(区域规模、机组台数)的扩大可以降低风电聚合波动性,增强平滑效应。2.风电机组间出力相关性越强,则互补性越差,平滑效果越差,反之平滑效果越好。少数现有对风电聚合波动性的定量研究仅仅从观测的历史数据出发,对其与各影响因素间的函数关系进行简单的线性或非线性拟合。然而风电场功率聚合特性是受风电场内地形、机组排布以及多机组点位处风况等多变量影响的复杂时空耦合过程,其具体映射关系为复杂的非线性映射,很难通过简单的线性或非线性拟合准确描述各影响因素与风电场功率聚合特性之间的关系。The difference in the distribution of wind resources is the key factor for the smoothing effect. Essentially, due to the spatial dispersion of wind turbines in the wind farm, the wind resources at different wind turbine locations in the wind farm show differences. The output of the unit changes with the wind speed and then through the synergistic decoupling effect, in some cases, the fluctuation of the other party is offset, thereby reducing the fluctuation of the wind power as a whole. Therefore, the volatility and smoothing effect of the aggregated power of the wind farm are closely related to the regional scale of the wind farm, the number of wind turbines in the wind farm, the wind condition of the wind farm, and the output correlation between the wind turbines in the wind farm, and these factors affect each other. Most of the existing researches on wind turbines at home and abroad describe and qualitatively analyze the law of wind power aggregation volatility and smoothing effect, and the following conclusions are mainly drawn: 1. The expansion of wind power scale (regional scale, number of units) can reduce wind power aggregation. Volatility, enhanced smoothing effect. 2. The stronger the output correlation between wind turbines, the worse the complementarity and the worse the smoothing effect, and vice versa. The few existing quantitative studies on the volatility of wind power aggregation only start from the observed historical data, and perform simple linear or nonlinear fitting of the functional relationship between it and various influencing factors. However, the power aggregation characteristic of a wind farm is a complex spatiotemporal coupling process affected by multiple variables such as the topography of the wind farm, the arrangement of units, and the wind conditions at multiple units. Linear or nonlinear fitting accurately describes the relationship between each influencing factor and the power aggregation characteristics of the wind farm.
因此希望有一种风电场聚合特性建模方法能够解决现有技术中存在的问题。Therefore, it is hoped that a modeling method for wind farm aggregation characteristics can solve the problems existing in the prior art.
发明内容SUMMARY OF THE INVENTION
本发明公开了风电场聚合特性建模方法,所述建模方法包括以下步骤:The invention discloses a modeling method for wind farm aggregation characteristics, and the modeling method includes the following steps:
步骤一:采集风电场多台风电机组位置处的实测运行数据,并对上述数据进行清洗及归一化处理;Step 1: Collect the measured operation data at the positions of multiple wind turbines in the wind farm, and clean and normalize the above data;
步骤二:建立风电功率波动性衡量指标;Step 2: Establish wind power volatility metrics;
步骤三:建立风电场聚合出力平滑效应衡量指标,并由数理统计的分析方法得出平滑效应衡量指标与聚合机组台数N及机组间功率序列的相关系数的关系式;Step 3: Establish the smoothing effect measurement index of the aggregated output of the wind farm, and obtain the relationship between the smoothing effect measurement index and the number of aggregated units N and the correlation coefficient of the power series between units by the analysis method of mathematical statistics;
步骤四:建立基于卷积神经网络的多位置点风况信息与机组间功率序列相关性的映射模型,根据指定时间段内的时刻数与风电场聚合特性建模机组台数对卷积神经网络的相应参数进行设置;Step 4: Establish a mapping model based on the convolutional neural network for the multi-location point wind condition information and the power sequence correlation between units, and model the number of units on the convolutional neural network according to the number of moments in the specified time period and the aggregation characteristics of the wind farm. Set the corresponding parameters;
步骤五:以指定时间尺度的多机组点位实测风速序列数据、实测风向序列数据作为模型输入,以机组两两之间的出力相关性系数作为输出,构成模型训练样本,以均方根误差函数指标训练神经网络模型,输出机组出力相关性映射结果;Step 5: Use the measured wind speed series data and the measured wind direction series data of multiple units at the specified time scale as the model input, and use the output correlation coefficient between the two units as the output to form a model training sample, and use the root mean square error function. The index trains the neural network model, and outputs the unit output correlation mapping result;
步骤六:根据步骤五的机组出力相关性映射结果和步骤三中平滑效应衡量指标与聚合机组台数N及机组间功率序列相关系数的函数关系式计算表征风电场聚合特性的平滑效应衡量指标s,实现基于卷积神经网络的风电场聚合特性建模。Step 6: According to the unit output correlation mapping result in
优选地,所述步骤一实测运行数据包括:实测风速数据、实测风向数据和实测功率数据。Preferably, the measured operation data in the first step includes: measured wind speed data, measured wind direction data, and measured power data.
优选地,风电机组集群的聚合出力为各单机出力之和,如公式(1):Preferably, the aggregate output of the wind turbine cluster is the sum of the output of each single unit, as shown in formula (1):

式中,P∑(t)为t时刻风电机组集群的总功率;i是风电机组的编号;N为风电机组台数;Pi(t)为t时刻第i号风电机组的功率;where P ∑ (t) is the total power of the wind turbine cluster at time t; i is the number of wind turbines; N is the number of wind turbines; P i (t) is the power of the ith wind turbine at time t;
所述步骤二采用公式(2)和(3)表示功率序列的标准差衡量单台风电机组出力和风电机组聚合出力的波动性:In the second step, formulas (2) and (3) are used to express the standard deviation of the power sequence to measure the fluctuation of the output of a single wind turbine and the aggregate output of the wind turbine:


式中,σi、σ∑分别为第i号风电机组的功率标准差和聚合功率标准差;T为统计的时间尺度;
优选地,平滑效应系数为以装机容量为基值的风电机组聚合出力标准差标幺值与单台机组出力标准差标幺值的比值为公式(4):Preferably, the smoothing effect coefficient is the ratio of the standard deviation per unit value of the aggregate output of the wind turbines based on the installed capacity to the standard deviation per unit value of the output of a single unit, which is formula (4):

其中,PR为风电机组的额定功率,σi、σ∑分别为第i号风电机组的功率标准差和聚合功率标准差,N表示聚合机组台数,系数s越小,表明各风电机组出力之间的互补性越强,平滑效应越明显;Among them, P R is the rated power of the wind turbine, σ i and σ ∑ are the standard deviation of power and the standard deviation of the aggregated power of the ith wind turbine, respectively, and N represents the number of aggregated units. The smaller the coefficient s, the smaller the output of each wind turbine. The stronger the complementarity between the two, the more obvious the smoothing effect;
通过所述步骤三数理统计得出风电机组聚合功率标准差与单机功率标准差的关系公式(5):Through the mathematical statistics in the third step, the relational formula (5) of the standard deviation of the aggregate power of the wind turbine and the standard deviation of the single-unit power is obtained:

式中,ri,j为第i号风电机组和第j号风电机组功率序列的相关系数;In the formula, ri ,j is the correlation coefficient of the power sequence of the ith wind turbine and the jth wind turbine;
设各台机组的出力标准差相同,都视为单台机组出力标准差平均值,则由公式(4)和(5)得出所述平滑效应衡量指标与聚合机组台数N及机组间功率序列的相关系数关系为公式(6):Assuming that the output standard deviation of each unit is the same, it is regarded as the average output standard deviation of a single unit, then the smoothing effect measurement index and the aggregated unit number N and the power sequence between units can be obtained from formulas (4) and (5). The correlation coefficient relationship of is formula (6):

优选地,所述步骤四的卷积神经网络包含两个卷积层,两个池化层,一个展平层和一个全连接层;多机组的实测风速序列数据和实测风向序列数据通过第一卷积层以及ReLU激活层,生成一组特征图,再经过无重叠最大池化进行降采样,随后通过第二卷积层以及ReLU激活层,生成另一组特征图,将这组特征图与展平层连接使多维张量一维化,再与全连接层连接,最后经过sigmoid函数激活作为卷积神经网络的输出。Preferably, the convolutional neural network in the step 4 includes two convolution layers, two pooling layers, one flattening layer and one fully connected layer; the measured wind speed sequence data and the measured wind direction sequence data of multiple units pass through the first The convolutional layer and the ReLU activation layer generate a set of feature maps, which are then downsampled by non-overlapping maximum pooling, and then pass through the second convolutional layer and the ReLU activation layer to generate another set of feature maps, which are combined with the feature map. The flattening layer is connected to make the multi-dimensional tensor one-dimensional, and then connected to the fully connected layer, and finally activated by the sigmoid function as the output of the convolutional neural network.
优选地,所述步骤四采用批次规范化的方法在部分层输出后添加一层规范化层,将输出按照同一批次的特征数值规范化至同一分布,用公式(7)表示卷积运算过程:Preferably, in the step 4, a batch normalization method is used to add a normalization layer after the output of some layers, and the output is normalized to the same distribution according to the characteristic values of the same batch, and the convolution operation process is represented by formula (7):

其中,


用公式(8)表示池化层的运算过程:The operation process of the pooling layer is represented by formula (8):

其中,


优选地,所述步骤五中机组两两之间的出力相关性系数计算公式为公式(9):Preferably, the calculation formula of the output correlation coefficient between the units in the
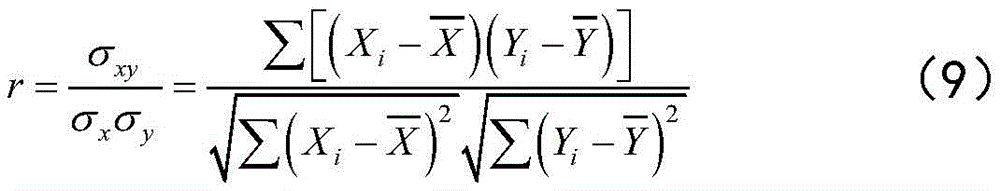
其中σxy是指两个数据序列X和Y的协方差,σx、σy分别为X和Y各自的方差,
本发明提出了一种风电场聚合特性建模方法,本发明基于卷积神经网络的风电场出力聚合特性建模方法,其源于深度学习方法,结合已有的通过数理统计的分析方法得出的数学模型,能够适应大数据量样本的训练,泛化能力更强;与传统的简单线性或非线性拟合方法相比,由于风电场功率聚合特性是受风电场内地形、机组排布以及多机组点位处风况等多变量影响的复杂时空耦合过程,其具体映射关系为复杂的非线性映射,本发明采用卷积神经网络深度学习算法模拟风电场流场场景,并建立风电场出力聚合特性的影响因素与风电场聚合特性的映射模型,能更准确地描述各影响因素与风电场功率聚合特性之间的关系,从而可以更有效地配合电力系统的规划和调度。The present invention proposes a method for modeling the aggregation characteristics of wind farms. The method for modeling the output aggregation characteristics of wind farms based on convolutional neural networks is derived from the deep learning method and is obtained by combining the existing analysis methods through mathematical statistics. Compared with traditional simple linear or nonlinear fitting methods, the power aggregation characteristics of wind farms are affected by the topography, unit arrangement and other factors of wind farms. The complex spatiotemporal coupling process affected by multi-variables such as wind conditions at multiple unit points, the specific mapping relationship is a complex nonlinear mapping, the present invention uses the convolutional neural network deep learning algorithm to simulate the flow field scene of the wind farm, and establishes the output of the wind farm The mapping model between the influencing factors of the aggregation characteristics and the aggregation characteristics of wind farms can more accurately describe the relationship between the influencing factors and the power aggregation characteristics of wind farms, so that it can more effectively cooperate with the planning and dispatching of the power system.
附图说明Description of drawings
图1为的风电场聚合特性建模方法流程图Figure 1 is the flow chart of the modeling method of wind farm aggregation characteristics.
图2为基于卷积神经网络的风电机组出力相关性映射模型的结构示意图。Figure 2 is a schematic structural diagram of a wind turbine output correlation mapping model based on a convolutional neural network.
具体实施方式Detailed ways
为使本发明实施的目的、技术方案和优点更加清楚,下面将结合本发明实施例中的附图,对本发明实施例中的技术方案进行更加详细的描述。在附图中,自始至终相同或类似的标号表示相同或类似的元件或具有相同或类似功能的元件。所描述的实施例是本发明一部分实施例,而不是全部的实施例。下面通过参考附图描述的实施例是示例性的,旨在用于解释本发明,而不能理解为对本发明的限制。基于本发明中的实施例,本领域普通技术人员在没有作出创造性劳动前提下所获得的所有其他实施例,都属于本发明保护的范围。In order to make the objectives, technical solutions and advantages of the present invention clearer, the technical solutions in the embodiments of the present invention will be described in more detail below with reference to the accompanying drawings in the embodiments of the present invention. Throughout the drawings, the same or similar reference numbers refer to the same or similar elements or elements having the same or similar functions. The described embodiments are some, but not all, of the embodiments of the present invention. The embodiments described below with reference to the accompanying drawings are exemplary, and are intended to explain the present invention and should not be construed as limiting the present invention. Based on the embodiments of the present invention, all other embodiments obtained by those of ordinary skill in the art without creative efforts shall fall within the protection scope of the present invention.
以中国北方某风电场中5台风电机组的实测风速数据、实测风向数据、实测功率数据作为测试算例,该算例采集了2016年11月至2017年11月的实测风速数据、实测风向数据、实测功率数据,数据时间分辨率为10分钟。选取每个月前70%数据的集合作为训练样本,每个月后30%数据的集合作为测试样本,对时间尺度为4小时的风电功率聚合特性进行建模。Taking the measured wind speed data, measured wind direction data, and measured power data of five wind turbines in a wind farm in northern China as a test example, the example collected the measured wind speed data and measured wind direction data from November 2016 to November 2017. , Measured power data, the data time resolution is 10 minutes. The first 70% data set of each month is selected as the training sample, and the second 30% data set of each month is selected as the test sample, and the aggregation characteristics of wind power with a time scale of 4 hours are modeled.
如图1所示,风电场聚合特性建模方法包括如下步骤:As shown in Figure 1, the modeling method of wind farm aggregation characteristics includes the following steps:
步骤一:采集风电场多台风电机组位置处的实测运行数据,并对上述数据进行清洗与预处理;实测运行数据包括实测风速数据、实测风向数据、实测功率数据,预处理包括数据清洗及归一化处理;Step 1: Collect the measured operation data at the locations of multiple wind turbines in the wind farm, and clean and preprocess the above data; the measured operation data includes the measured wind speed data, the measured wind direction data, and the measured power data, and the preprocessing includes data cleaning and normalization. unified treatment;
步骤二:建立风电功率波动性衡量指标。风电机组集群的聚合出力为各单机出力之和,如公式(1):Step 2: Establish wind power volatility metrics. The aggregate output of the wind turbine cluster is the sum of the output of each single unit, such as formula (1):

式中,P∑(t)为t时刻风电机组集群的总功率;i是风电机组的编号;N为风电机组台数;Pi(t)为t时刻第i号风电机组的功率;where P ∑ (t) is the total power of the wind turbine cluster at time t; i is the number of wind turbines; N is the number of wind turbines; P i (t) is the power of the ith wind turbine at time t;
采用公式(2)和(3)表示功率序列的标准差衡量单台风电机组出力和风电机组聚合出力的波动性:Formulas (2) and (3) are used to express the standard deviation of the power series to measure the volatility of the output of a single wind turbine and the aggregate output of wind turbines:


式中,σi、σ∑分别为第i号风电机组的功率标准差和聚合功率标准差;T为统计的时间尺度;
步骤三:建立风电场聚合出力平滑效应衡量指标,定义平滑效应系数为以装机容量为基值的风电机组聚合出力标准差标幺值与单台机组出力标准差标幺值的比值,即公式(4):Step 3: Establish the smoothing effect measurement index of the aggregate output of the wind farm, and define the smoothing effect coefficient as the ratio of the standard deviation per unit value of the wind turbine aggregate output based on the installed capacity to the standard deviation per unit value of the output of a single unit, that is, the formula ( 4):

其中,PR为风电机组的额定功率,σi、σ∑分别为第i号风电机组的功率标准差和聚合功率标准差,N表示聚合机组台数,系数s越小,表明各风电机组出力之间的互补性越强,平滑效应越明显;Among them, P R is the rated power of the wind turbine, σ i and σ ∑ are the standard deviation of power and the standard deviation of the aggregated power of the ith wind turbine, respectively, and N represents the number of aggregated units. The smaller the coefficient s, the smaller the output of each wind turbine. The stronger the complementarity between the two, the more obvious the smoothing effect;
通过所述步骤三数理统计得出风电机组聚合功率标准差与单机功率标准差的关系公式(5):Through the mathematical statistics in the third step, the relational formula (5) of the standard deviation of the aggregate power of the wind turbine and the standard deviation of the single-unit power is obtained:

式中,ri,j为第i号风电机组和第j号风电机组功率序列的相关系数;In the formula, ri ,j is the correlation coefficient of the power sequence of the ith wind turbine and the jth wind turbine;
设各台机组的出力标准差相同,都视为单台机组出力标准差平均值,则由公式(4)和(5)得出所述平滑效应衡量指标与聚合机组台数N及机组间功率序列的相关系数关系为公式(6):Assuming that the output standard deviation of each unit is the same, it is regarded as the average output standard deviation of a single unit, then the smoothing effect measurement index and the aggregated unit number N and the power sequence between units can be obtained from formulas (4) and (5). The correlation coefficient relationship of is formula (6):

步骤四:建立基于卷积神经网络的多位置点风况信息与机组间功率序列相关性的映射模型,其中所述的卷积神经网络包含两个卷积层,两个池化层,一个展平层,以及一个全连接层,其结构如附图2所示。5台机组的实测风速序列数据、实测风向序列数据通过第一个卷积层以及ReLU激活层,生成一组特征图,再经过无重叠最大池化进行降采样,随后通过第二个卷积层以及ReLU激活层,生成另一组特征图,将这组特征图与展平层连接使多维张量一维化,再与全连接层连接,最后经过sigmoid函数激活作为卷积神经网络的输出,针对各层分布不均和“梯度弥散”问题,本方案采用批次规范化的方法(Batch Normalization-BN)来减小这种影响,即在部分层输出后添加一层规范化层,将输出按照同一批次的特征数值规范化至同一分布;Step 4: Establish a mapping model based on the convolutional neural network based on the multi-location point wind condition information and the power sequence correlation between the units. The convolutional neural network includes two convolutional layers, two pooling layers, and one expansion layer. A flat layer, and a fully connected layer, the structure of which is shown in Figure 2. The measured wind speed sequence data and the measured wind direction sequence data of the 5 units pass through the first convolution layer and the ReLU activation layer to generate a set of feature maps, which are then down-sampled through non-overlapping max pooling, and then passed through the second convolution layer. And the ReLU activation layer to generate another set of feature maps, connect this set of feature maps to the flattening layer to make the multi-dimensional tensor one-dimensional, and then connect to the fully connected layer, and finally activate the sigmoid function as the output of the convolutional neural network, In view of the uneven distribution of each layer and the "gradient dispersion" problem, this scheme adopts the batch normalization method (Batch Normalization-BN) to reduce this effect, that is, a normalization layer is added after the output of some layers, and the output is based on the same The eigenvalues of the batches are normalized to the same distribution;
用公式(7)表示卷积运算过程:The convolution operation process is represented by formula (7):

其中,


用公式(8)表示池化层的运算过程:The operation process of the pooling layer is represented by formula (8):

其中,


基于卷积神经网络的出力相关性映射模型网络结构参数如表1所示:The network structure parameters of the output correlation mapping model based on convolutional neural network are shown in Table 1:
表1基于卷积神经网络的出力相关性映射模型网络结构参数Table 1 Network structure parameters of output correlation mapping model based on convolutional neural network

步骤五:以指定时间尺度(如4小时)的多机组点位实测风速序列数据、实测风向序列数据作为模型输入,以机组两两之间的出力相关性系数作为输出,构成模型训练样本,以均方根误差函数指标训练神经网络模型,输出映射结果。其中机组两两间的出力相关性系数计算公式为公式(9):Step 5: Use the measured wind speed sequence data and the measured wind direction sequence data of multiple units at a specified time scale (such as 4 hours) as the model input, and use the output correlation coefficient between the units as the output to form a model training sample. The root mean square error function index trains the neural network model and outputs the mapping result. The formula for calculating the output correlation coefficient between two units is formula (9):

其中σxy是指两个数据序列X和Y的协方差,σx、σy分别为X和Y各自的方差,
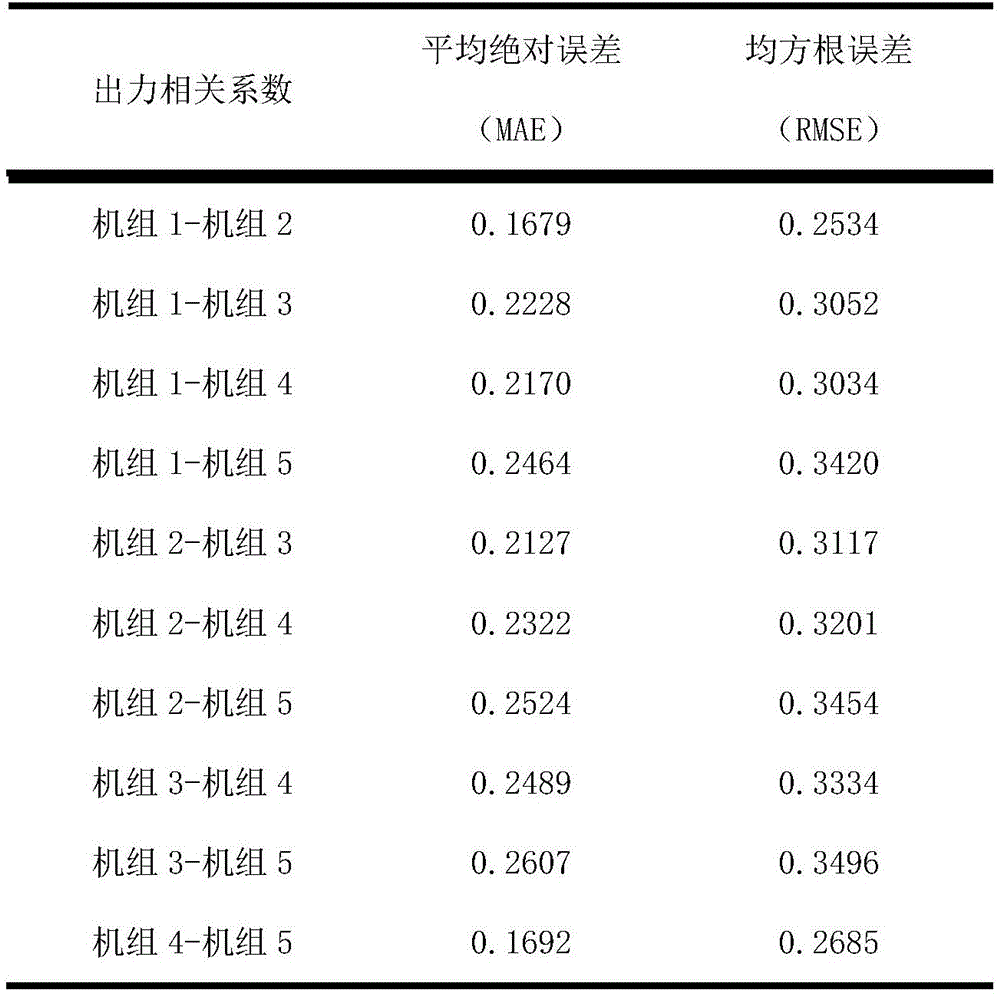
经过训练与预测,模型映射结果与真实机组出力相关性系数的误差如表2。After training and prediction, the error between the model mapping result and the actual unit output correlation coefficient is shown in Table 2.
表2模型映射结果与真实机组出力相关性系数的误差Table 2 The error of the model mapping result and the actual unit output correlation coefficient
步骤六:根据步骤五的机组出力相关性映射结果及公式(6)计算表征风电场聚合特性的平滑效应衡量指标s,实现基于卷积神经网络的风电场聚合特性建模,在本实施例中根据映射结果计算出的平滑效应系s与真实平滑效应系数的平均绝对误差和均方根误差分别为0.1386和0.1781。Step 6: According to the unit output correlation mapping result in
最后需要指出的是:以上实施例仅用以说明本发明的技术方案,而非对其限制。尽管参照前述实施例对本发明进行了详细的说明,本领域的普通技术人员应当理解:其依然可以对前述各实施例所记载的技术方案进行修改,或者对其中部分技术特征进行等同替换;而这些修改或者替换,并不使相应技术方案的本质脱离本发明各实施例技术方案的精神和范围。Finally, it should be pointed out that the above embodiments are only used to illustrate the technical solutions of the present invention, but not to limit them. Although the present invention has been described in detail with reference to the foregoing embodiments, those of ordinary skill in the art should understand that: it is still possible to modify the technical solutions described in the foregoing embodiments, or perform equivalent replacements to some of the technical features; and these Modifications or substitutions do not make the essence of the corresponding technical solutions deviate from the spirit and scope of the technical solutions of the embodiments of the present invention.
Claims (7)


Priority Applications (1)
| Application Number | Priority Date | Filing Date | Title |
|---|---|---|---|
| CN201911066604.5A CN110765703B (en) | 2019-11-04 | 2019-11-04 | A modeling method for wind farm aggregation characteristics |
Applications Claiming Priority (1)
| Application Number | Priority Date | Filing Date | Title |
|---|---|---|---|
| CN201911066604.5A CN110765703B (en) | 2019-11-04 | 2019-11-04 | A modeling method for wind farm aggregation characteristics |
Publications (2)
| Publication Number | Publication Date |
|---|---|
| CN110765703A CN110765703A (en) | 2020-02-07 |
| CN110765703B true CN110765703B (en) | 2022-05-27 |
Family
ID=69336090
Family Applications (1)
| Application Number | Title | Priority Date | Filing Date |
|---|---|---|---|
| CN201911066604.5A Active CN110765703B (en) | 2019-11-04 | 2019-11-04 | A modeling method for wind farm aggregation characteristics |
Country Status (1)
| Country | Link |
|---|---|
| CN (1) | CN110765703B (en) |
Families Citing this family (5)
| Publication number | Priority date | Publication date | Assignee | Title |
|---|---|---|---|---|
| CN112149903B (en) * | 2020-09-22 | 2022-04-08 | 内蒙古电力(集团)有限责任公司内蒙古电力科学研究院分公司 | Primary frequency modulation analysis and optimization method of thermal power generating unit based on BP neural network algorithm |
| CN112507604B (en) * | 2020-11-04 | 2021-09-07 | 清华大学 | A Data-Driven Voltage-Frequency Response Modeling Method for Renewable Power Sources |
| CN112395812B (en) * | 2020-11-26 | 2024-03-26 | 华北电力大学 | Method for evaluating time shifting property of wind speed |
| CN114583767B (en) * | 2022-03-10 | 2023-03-17 | 中国电力科学研究院有限公司 | Data-driven wind power plant frequency modulation response characteristic modeling method and system |
| CN116522176A (en) * | 2023-05-05 | 2023-08-01 | 国网江苏省电力有限公司南京供电分公司 | Wind turbine generator external characteristic aggregation method |
Citations (8)
| Publication number | Priority date | Publication date | Assignee | Title |
|---|---|---|---|---|
| CN102570449A (en) * | 2011-12-21 | 2012-07-11 | 西安交通大学 | Regional wind power prediction method based on spatial and temporal distribution characteristics |
| CN103268366A (en) * | 2013-03-06 | 2013-08-28 | 辽宁省电力有限公司电力科学研究院 | Combined wind power prediction method suitable for distributed wind power plant |
| CN103401236A (en) * | 2013-07-30 | 2013-11-20 | 华北电力大学 | Wind power farm generator unit grouping method based on flow correlation of wind power farm |
| CN104978608A (en) * | 2015-06-24 | 2015-10-14 | 云南电网有限责任公司电力科学研究院 | A wind power forecasting device and forecasting method |
| CN109086527A (en) * | 2018-08-03 | 2018-12-25 | 合肥工业大学 | A kind of practical equivalent modeling method based on running of wind generating set state |
| CN109670213A (en) * | 2018-11-29 | 2019-04-23 | 国电南瑞科技股份有限公司 | A kind of wind power plant multimachine equivalent modeling method and device |
| CN109802430A (en) * | 2018-12-29 | 2019-05-24 | 上海电力学院 | A kind of wind-powered electricity generation power grid control method based on LSTM-Attention network |
| CN110061524A (en) * | 2019-05-06 | 2019-07-26 | 中国科学院电工研究所 | A kind of distributed generation resource virtual plant active power dispatch equivalence polymerization and system based on deep neural network |
Family Cites Families (2)
| Publication number | Priority date | Publication date | Assignee | Title |
|---|---|---|---|---|
| US10198689B2 (en) * | 2014-01-30 | 2019-02-05 | Hrl Laboratories, Llc | Method for object detection in digital image and video using spiking neural networks |
| WO2017196821A1 (en) * | 2016-05-09 | 2017-11-16 | Strong Force Iot Portfolio 2016, Llc | Methods and systems for the industrial internet of things |
-
2019
- 2019-11-04 CN CN201911066604.5A patent/CN110765703B/en active Active
Patent Citations (8)
| Publication number | Priority date | Publication date | Assignee | Title |
|---|---|---|---|---|
| CN102570449A (en) * | 2011-12-21 | 2012-07-11 | 西安交通大学 | Regional wind power prediction method based on spatial and temporal distribution characteristics |
| CN103268366A (en) * | 2013-03-06 | 2013-08-28 | 辽宁省电力有限公司电力科学研究院 | Combined wind power prediction method suitable for distributed wind power plant |
| CN103401236A (en) * | 2013-07-30 | 2013-11-20 | 华北电力大学 | Wind power farm generator unit grouping method based on flow correlation of wind power farm |
| CN104978608A (en) * | 2015-06-24 | 2015-10-14 | 云南电网有限责任公司电力科学研究院 | A wind power forecasting device and forecasting method |
| CN109086527A (en) * | 2018-08-03 | 2018-12-25 | 合肥工业大学 | A kind of practical equivalent modeling method based on running of wind generating set state |
| CN109670213A (en) * | 2018-11-29 | 2019-04-23 | 国电南瑞科技股份有限公司 | A kind of wind power plant multimachine equivalent modeling method and device |
| CN109802430A (en) * | 2018-12-29 | 2019-05-24 | 上海电力学院 | A kind of wind-powered electricity generation power grid control method based on LSTM-Attention network |
| CN110061524A (en) * | 2019-05-06 | 2019-07-26 | 中国科学院电工研究所 | A kind of distributed generation resource virtual plant active power dispatch equivalence polymerization and system based on deep neural network |
Non-Patent Citations (2)
| Title |
|---|
| The integration of PHEV aggregations into a power system with wind resources;Christophe Guille等;《IEEE》;20100806;第1-9页 * |
| 光伏发电出力特征提取及区域集群聚合特性;苏适等;《云南电力技术》;20180215;第86-94页 * |
Also Published As
| Publication number | Publication date |
|---|---|
| CN110765703A (en) | 2020-02-07 |
Similar Documents
| Publication | Publication Date | Title |
|---|---|---|
| CN110765703B (en) | A modeling method for wind farm aggregation characteristics | |
| WO2021073462A1 (en) | 10 kv static load model parameter identification method based on similar daily load curves | |
| CN111475909B (en) | Wind turbine generator output correlation mapping modeling method based on long-term and short-term memory network | |
| CN113141008B (en) | Data-driven power distribution network distributed new energy consumption capability assessment method | |
| CN103324980B (en) | A kind of method for forecasting | |
| CN108846530B (en) | Short-term load prediction method based on clustering-regression model | |
| CN110826791A (en) | A hybrid wind power prediction method based on long short-term memory neural network | |
| CN111489038B (en) | A method for improving the accuracy of ultra-short-term power forecasting of wind farms | |
| CN108596242B (en) | Prediction method of power grid meteorological load based on wavelet neural network and support vector machine | |
| CN111709454B (en) | Multi-wind-field output clustering evaluation method based on optimal copula model | |
| CN110889535A (en) | A multi-point wind speed prediction method in wind farm based on convolutional recurrent neural network | |
| CN105938578A (en) | Large-scale photovoltaic power station equivalent modeling method based on clustering analysis | |
| CN105790261B (en) | A Random Harmonic Power Flow Calculation Method | |
| CN115758246A (en) | Non-invasive load identification method based on EMD and AlexNet | |
| CN115392133B (en) | Optimal clustering equivalent method for wind farms using Gaussian mixture model | |
| CN105069236A (en) | Generalized load joint probability modeling method considering node spatial correlation of wind power plant | |
| CN114925931B (en) | Method and system for predicting load of platform area | |
| CN114036845A (en) | Wind power plant group model construction method | |
| CN108154260A (en) | A kind of short-term wind power forecast method | |
| CN117592255A (en) | A modeling method of scenery output sequence considering spatiotemporal correlation | |
| CN105741192A (en) | Short-term wind speed combined forecasting method for wind turbine cabin of wind power plant | |
| CN105354761B (en) | Safety and efficiency evaluation method and system for accessing wind power into power grid | |
| CN110336322B (en) | Photovoltaic power generation access capacity determination method based on daily minimum load confidence interval | |
| CN106251238B (en) | Selection of discretization step size of wind farm modeling sequence and model error analysis method | |
| CN114819504B (en) | Flexibility evaluation method of AC/DC hybrid distribution network based on typical operation scenarios |
Legal Events
| Date | Code | Title | Description |
|---|---|---|---|
| PB01 | Publication | ||
| PB01 | Publication | ||
| SE01 | Entry into force of request for substantive examination | ||
| SE01 | Entry into force of request for substantive examination | ||
| GR01 | Patent grant | ||
| GR01 | Patent grant |