CN110631624B - Method, device and system for identifying abnormal operation data of mine sensor - Google Patents
Method, device and system for identifying abnormal operation data of mine sensor Download PDFInfo
- Publication number
- CN110631624B CN110631624B CN201910833203.1A CN201910833203A CN110631624B CN 110631624 B CN110631624 B CN 110631624B CN 201910833203 A CN201910833203 A CN 201910833203A CN 110631624 B CN110631624 B CN 110631624B
- Authority
- CN
- China
- Prior art keywords
- sensor
- data
- value
- data value
- abnormal
- Prior art date
- Legal status (The legal status is an assumption and is not a legal conclusion. Google has not performed a legal analysis and makes no representation as to the accuracy of the status listed.)
- Active
Links
- 230000002159 abnormal effect Effects 0.000 title claims abstract description 158
- 238000000034 method Methods 0.000 title claims abstract description 41
- 238000012544 monitoring process Methods 0.000 claims description 45
- 230000035772 mutation Effects 0.000 claims description 38
- 230000010355 oscillation Effects 0.000 claims description 36
- 238000012360 testing method Methods 0.000 claims description 25
- 230000006870 function Effects 0.000 claims description 24
- 230000005856 abnormality Effects 0.000 claims description 23
- 230000009467 reduction Effects 0.000 claims description 17
- 238000005315 distribution function Methods 0.000 claims description 11
- 238000003860 storage Methods 0.000 claims description 10
- 230000008859 change Effects 0.000 claims description 4
- 230000002547 anomalous effect Effects 0.000 claims 1
- 239000003245 coal Substances 0.000 description 12
- 238000004519 manufacturing process Methods 0.000 description 5
- 230000008901 benefit Effects 0.000 description 4
- 238000009826 distribution Methods 0.000 description 4
- VNWKTOKETHGBQD-UHFFFAOYSA-N methane Chemical compound C VNWKTOKETHGBQD-UHFFFAOYSA-N 0.000 description 4
- 238000004364 calculation method Methods 0.000 description 3
- UGFAIRIUMAVXCW-UHFFFAOYSA-N Carbon monoxide Chemical compound [O+]#[C-] UGFAIRIUMAVXCW-UHFFFAOYSA-N 0.000 description 2
- 229910002091 carbon monoxide Inorganic materials 0.000 description 2
- 238000004590 computer program Methods 0.000 description 2
- 238000011156 evaluation Methods 0.000 description 2
- 239000000779 smoke Substances 0.000 description 2
- 238000009423 ventilation Methods 0.000 description 2
- 238000004891 communication Methods 0.000 description 1
- 238000010586 diagram Methods 0.000 description 1
- 230000000694 effects Effects 0.000 description 1
- 238000012986 modification Methods 0.000 description 1
- 230000004048 modification Effects 0.000 description 1
- 238000012545 processing Methods 0.000 description 1
- 238000005086 pumping Methods 0.000 description 1
- 230000003068 static effect Effects 0.000 description 1
- 238000007619 statistical method Methods 0.000 description 1
- 238000006467 substitution reaction Methods 0.000 description 1
- 230000001360 synchronised effect Effects 0.000 description 1
- 238000012546 transfer Methods 0.000 description 1
- 230000000007 visual effect Effects 0.000 description 1
Images


Classifications
-
- G—PHYSICS
- G01—MEASURING; TESTING
- G01D—MEASURING NOT SPECIALLY ADAPTED FOR A SPECIFIC VARIABLE; ARRANGEMENTS FOR MEASURING TWO OR MORE VARIABLES NOT COVERED IN A SINGLE OTHER SUBCLASS; TARIFF METERING APPARATUS; MEASURING OR TESTING NOT OTHERWISE PROVIDED FOR
- G01D18/00—Testing or calibrating apparatus or arrangements provided for in groups G01D1/00 - G01D15/00
Landscapes
- Physics & Mathematics (AREA)
- General Physics & Mathematics (AREA)
- Testing Or Calibration Of Command Recording Devices (AREA)
Abstract
The embodiment of the invention discloses a method, a device and a system for identifying abnormal operation data of a mine sensor, and relates to the field of identification of abnormal data characteristics.
Description
Technical Field
The embodiment of the invention relates to the field of data abnormality feature identification, in particular to a method, a device and a system for identifying mine sensor operation data abnormality.
Background
The real-time monitoring of the mine is one of the main measures for realizing the coal mine safety production, and plays an important role in improving the coal mine safety production condition in China. When the mine works normally, the underground sensor can monitor the mine operation site in real time and automatically upload the monitored data to the mine monitoring platform and the upper supervision department.
However, many enterprises currently have data falsification done manually for the benefit of, for example, when the data uploaded by the sensor is about to reach an overrun or has been overrun, the system is prevented from alarming by modifying factors such as the value and status monitored by the sensor, so as to conceal the data overrun.
However, coal mine data monitoring is a life line of coal mine safety monitoring work, and data abnormity has great harm to safety production, so that normal production deployment of a coal mine can be influenced, accidents can also happen in serious conditions, and certain harm is caused to safety production and personnel of a mine. Therefore, it is necessary to recognize an abnormality in sensor data by using the sensor monitoring value, the sensor operating state, and the monitoring time.
Disclosure of Invention
The embodiment of the invention aims to provide a method, a device and a system for identifying the abnormal operation data of a mine sensor, which are used for solving the problem that the data or the state of the sensor is tampered in the existing mine operation.
In order to achieve the above object, the embodiments of the present invention mainly provide the following technical solutions:
in a first aspect, an embodiment of the present invention provides a method for identifying an abnormality in operation data of a mine sensor, where the method includes: acquiring real-time data of a sensor; judging the state of the sensor according to the sensor state label in the real-time data; when the sensor state is determined to be a normal state, judging whether the sensor data value is abnormal according to the data value abnormal confidence interval and a preset monitoring judgment threshold value, and judging the data value abnormal type; and when the sensor is determined to be in the calibration state or the fault state, judging whether the state of the sensor is abnormal or not according to the duration of the state and the confidence limit value of the state of the sensor.
Further, the method for estimating the data value abnormal confidence interval comprises the following steps: classifying and counting all catastrophe points in the historical data values of the sensor according to the abnormal types; respectively calculating the mean value and the variance of all mutation points in each data value abnormal type; constructing a mutation point normal distribution function and a mutation point test statistic function of the corresponding data value abnormal type by using the mean value and the variance of all mutation points in each data value abnormal type; and obtaining a confidence interval with the true value of the overall mean value of the mutation points of the corresponding data value abnormal type being 95 percent according to the mutation point test statistic function of each data value abnormal type, namely the data value abnormal confidence interval of the corresponding data value abnormal type.
Further, classifying and counting all catastrophe points in the historical data values of the sensor according to the abnormal types, wherein the classifying and counting comprise the following steps: judging the abnormal data value continuous section of each data value abnormal type according to the change quantity of the historical data value of the sensor within the preset time; taking a mutation starting point of each data value abnormal continuous segment as a mutation point; classifying all mutation points according to the data value abnormal types and forming a mutation point set of each data value abnormal type; wherein the data value exception types comprise data sudden increase, data sudden decrease and narrow amplitude oscillation; if the increment of the historical data value of the sensor in the data sudden increase time threshold exceeds the data sudden increase variation threshold, judging the historical data value as a data sudden increase continuous segment; if the reduction of the sensor historical data value in the data sudden reduction time threshold exceeds the data sudden reduction variation threshold, judging the sensor historical data value to be a data sudden reduction continuous segment; and if the data value variation of the historical data value of the sensor in the range exceeding the narrow oscillation time threshold value is continuously smaller than the narrow oscillation variation threshold value, judging the sensor to be a narrow oscillation continuous section.
Further, judging whether the sensor data value is abnormal according to the data value abnormal confidence interval and a preset monitoring judgment threshold value, and judging the data value abnormal type, wherein the judging step comprises the following steps: judging whether the real-time data value of the sensor is in any data value abnormal confidence interval or not; if the real-time data value of the sensor is in any data value abnormal confidence interval, the real-time data value of the sensor is an abnormal value, and the abnormal type of the data value is determined by comparing the variation of the real-time data value of the sensor at a preset time interval with the monitoring judgment threshold value; and if the real-time data value of the sensor is not in any data value abnormal confidence interval, the real-time data value of the sensor is a normal value.
Further, the data value anomaly confidence interval comprises: a data sudden increase confidence interval, a data sudden decrease confidence interval and a narrow oscillation confidence interval; when the real-time sensor data value is in the data sudden increase confidence interval, if the variation of the sensor data value in the preset time interval is greater than the data sudden increase monitoring judgment threshold, the real-time sensor data value in the preset time interval is a data sudden increase abnormal value; when the real-time sensor data value is in the data sudden decrease confidence interval, if the variation of the sensor data value in the preset time interval is greater than the data sudden decrease monitoring judgment threshold, the real-time sensor data value in the preset time interval is a data sudden decrease abnormal value; and when the real-time sensor data value is within the narrow oscillation confidence interval, if the variation of the sensor data value in the preset time interval is smaller than the narrow oscillation monitoring judgment threshold, the real-time sensor data value in the preset time interval is an abnormal narrow oscillation value.
Further, the estimation method of the sensor state confidence limit value comprises the following steps: the sensor state confidence limits include: calibrating a state confidence upper limit value and a fault state confidence lower limit value; counting the calibration duration of each calibration state in the sensor historical data; calculating the mean value and the variance of all calibration duration; constructing a normal distribution function and a test statistic function of the calibration duration by using the mean value and the variance of all the calibration durations; obtaining a confidence upper limit value of a confidence interval with the true value of the overall average value of the calibration duration being 95%, namely a calibration state confidence upper limit value, according to a test statistic function of the calibration duration; counting the fault duration of each fault state in the sensor historical data; calculating the mean value and the variance of all fault duration; constructing a normal distribution function and a test statistic function of the fault duration by using the mean value and the variance of all fault durations; and obtaining a confidence lower limit value of a confidence interval with the true value of the overall mean value of the fault duration being 95%, namely the confidence lower limit value of the fault state, according to the test statistic function of the fault duration.
Further, the method for judging whether the state of the sensor is abnormal comprises the following steps: when the sensor is in a calibration state, comparing the calibration time staying length in the real-time data of the sensor with the confidence upper limit, if the calibration time staying length is smaller than the confidence upper limit, indicating that the sensor state is normal in calibration, otherwise indicating that the calibration is abnormal; and when the sensor is in a fault state, comparing the fault time staying length in the real-time data of the sensor with the lower confidence limit, if the fault time staying length is larger than the lower confidence limit, indicating that the fault mark is normal, otherwise, indicating that the fault mark is abnormal.
In a second aspect, an embodiment of the present invention further provides an apparatus for identifying an abnormality in operation data of a mine sensor, where the apparatus includes: the real-time data acquisition unit is used for acquiring real-time data of the sensor; the state judgment unit is used for judging the state of the sensor according to the sensor state label in the real-time data; the data value abnormality judgment unit is used for judging whether the sensor data value is abnormal or not according to the data value abnormality confidence interval and a preset monitoring judgment threshold value when the sensor state is determined to be a normal state, and judging the data value abnormality type; the calibration abnormity judging unit is used for judging whether the state of the sensor is abnormal or not according to the duration of the calibration state and the confidence limit value of the state of the sensor when the sensor is determined to be in the calibration state; and the fault mark abnormity judging unit is used for judging whether the state of the sensor is abnormal or not according to the duration of the fault state and the confidence limit value of the state of the sensor when the sensor is confirmed to be in the fault state.
In a third aspect, an embodiment of the present invention further provides a system for identifying an abnormality in operation data of a mine sensor, where the system includes: at least one processor and at least one memory; the memory is to store one or more program instructions; the processor is configured to execute one or more program instructions to perform a method of identifying anomalies in mine sensor operational data.
In a fourth aspect, embodiments of the present invention also provide a computer-readable storage medium having one or more program instructions embodied therein for performing a method of identifying anomalies in mine sensor operational data by a system for identifying anomalies in mine sensor operational data.
The technical scheme provided by the embodiment of the invention at least has the following advantages:
according to the embodiment of the invention, the state of the sensor is judged according to the sensor state label of the real-time data of the sensor, and then the abnormal type of the running data of the sensor is judged according to different sensor states, wherein whether the data value of the sensor is abnormal or not is judged according to the abnormal confidence interval of the data value and the preset monitoring judgment threshold value, the abnormal type of the data value is judged, and whether the state of the sensor is abnormal or not is judged according to the duration of the state and the confidence limit value, so that whether the uploaded running data of the sensor is abnormal or not can be rapidly and accurately identified, the coal mine safety monitoring can be better carried out, the coal mine safety management level is improved, and the accident.
Drawings
Fig. 1 is a flowchart of a method for identifying an abnormal operation data of a mine sensor according to an embodiment of the present invention.
Fig. 2 is a flowchart of a method for estimating a confidence interval of an abnormal data value according to an embodiment of the present invention.
Fig. 3 is a flowchart of classifying and counting all mutation points in the sensor historical data values according to the anomaly types according to an embodiment of the present invention.
Fig. 4 is a flowchart for determining whether a sensor data value is abnormal and determining the type of the abnormal sensor data value according to an embodiment of the present invention.
Fig. 5 is a schematic logical structure diagram of an apparatus for identifying an abnormality in operation data of a mine sensor according to an embodiment of the present invention.
Detailed Description
The following description of the embodiments of the present invention is provided for illustrative purposes, and other advantages and effects of the present invention will become apparent to those skilled in the art from the present disclosure.
In the following description, for purposes of explanation and not limitation, specific details are set forth such as particular system structures, interfaces, techniques, etc. in order to provide a thorough understanding of the present invention. It will be apparent, however, to one skilled in the art that the present invention may be practiced in other embodiments that depart from these specific details. In other instances, detailed descriptions of well-known systems, circuits, and methods are omitted so as not to obscure the description of the present invention with unnecessary detail.
The embodiment of the invention provides a method for identifying the abnormal operation data of a mine sensor, and with reference to fig. 1, the method comprises the following steps:
firstly, acquiring real-time data of a sensor; the sensor types of the invention include the coal mine underground monitoring analog quantity sensor, such as a methane sensor: the device for continuously monitoring the concentration of methane in the mine environment gas and in the pumping pipeline generally has the functions of display and audible and visual alarm; a wind speed sensor: a device for continuously monitoring wind speed in a mine tunnel; a wind pressure sensor: the device is used for continuously monitoring the ventilation pressure of the mine ventilator, the air door, the closed tunnel, the ventilation tunnel and the like; carbon monoxide sensor: a device for continuously monitoring the concentration of carbon monoxide in the mine ambient gas; a temperature sensor: a device for continuously monitoring the temperature of the mine environment; a smoke sensor: a device for continuously monitoring smoke generated in a mine when a belt of a belt conveyor or the like catches fire.
Then, the state of the sensor is judged according to the sensor state label in the real-time data, and the operation data itself uploaded by the sensor comprises the data value of the sensor at any moment and the state label of the sensor, namely the specific data value detected by each sensor and the state of the sensor itself. The sensor state label comprises a normal state, a calibration state and a fault state, and the sensor running state can be judged to belong to which state through the sensor state label.
And when the sensor state is determined to be a normal state, judging whether the sensor data value is abnormal according to the data value abnormal confidence interval and a preset monitoring judgment threshold value, and judging the data value abnormal type. The abnormal data value types comprise data sudden increase, data sudden decrease and narrow amplitude oscillation, a curve of the sensor data in a normal state rises with a certain slope, the curve suddenly rises when a certain value is reached to be the data sudden increase, the curve suddenly sinks when the certain value is reached to be the data sudden decrease, and the curve suddenly oscillates in a small range when the certain value is reached to be the narrow amplitude oscillation.
According to the embodiment of the invention, the historical data sensor data value is used for estimating the confidence interval of the abnormal data value to judge whether the real-time data of the sensor falls in the confidence interval, so that the judgment on whether the sensor data value is abnormal is realized. Therefore, before determining whether the sensor data value is abnormal, it is necessary to estimate the abnormality type of each data value, and referring to fig. 2, the method for estimating the data value abnormality confidence interval includes: classifying and counting all catastrophe points in the historical data values of the sensor according to the abnormal types, namely respectively finding out data sudden increase points, data sudden decrease points and catastrophe points with narrow oscillation; then respectively calculating the mean value and the variance of all mutation points in each data value abnormal type; constructing a mutation point normal distribution function and a mutation point test statistic function of the corresponding data value abnormal type by using the mean value and the variance of all mutation points in each data value abnormal type; and obtaining a confidence interval with the true value of the overall mean value of the mutation points of the corresponding data value abnormal type being 95 percent according to the mutation point test statistic function of each data value abnormal type, namely the data value abnormal confidence interval of the corresponding data value abnormal type.
Further, referring to fig. 3, the classification statistics of all mutation points in the sensor historical data values according to the anomaly types includes: judging the abnormal data value continuous section of each data value abnormal type according to the change quantity of the historical data value of the sensor within the preset time; taking a mutation starting point of each data value abnormal continuous segment as a mutation point; classifying all mutation points according to the data value abnormal types and forming a mutation point set of each data value abnormal type; wherein the data value exception types comprise data sudden increase, data sudden decrease and narrow amplitude oscillation; if the increment of the historical data value of the sensor in the data sudden increase time threshold exceeds the data sudden increase variation threshold, judging the historical data value as a data sudden increase continuous segment; if the reduction of the sensor historical data value in the data sudden reduction time threshold exceeds the data sudden reduction variation threshold, judging the sensor historical data value to be a data sudden reduction continuous segment; and if the data value variation of the historical data value of the sensor in the range exceeding the narrow oscillation time threshold value is continuously smaller than the narrow oscillation variation threshold value, judging the sensor to be a narrow oscillation continuous section.
In a specific example, take data sudden decrease as an example: finding all the sudden drop points x according to the classification statistical method1,x2…xnCalculating the mean value of all the sudden drop points Sum variance s2The formula is as follows:


wherein n represents the number of all the dip points, i is 1, 2, … … n, mean value, s, of all dip points2The variance of the dip point represents the fluctuation degree of the whole from the mean value, mu is the whole mean value to be estimated, namely expectation, and alpha represents the confidence coefficient.
It can be known from statistics that the normal distribution function of the dip point is X-N (mu,2),2is the overall variance, in the case of large samples,2≈s2i.e. X to N (μ, s)2) The test statistic is a statistic for hypothesis test calculation. In the case of the null hypothesis, the statistic obeys a given probability distribution, whereas this does not. Thus, if the value of the test statistic falls outside the threshold of the probability distribution, the null hypothesis may not be considered correct. In the application, the formula of the function of the statistic of the abrupt drop point test is as follows:

wherein, represents the mean value of all the sudden drop points, s is the standard deviation of the sudden drop points, mu is the estimated total mean value of the sudden drop points, and U to N (0,1) represent that U obeys the standard normal distribution with the mean value of 0 and the variance of 1.
Given 1- α 95%, i.e., to find an interval that contains a true value of μ with a probability of 95%, the probability can be found according to the standard normally distributed quantile table
 Is a two-sided alpha quantile of a standard normal distribution, which indicates

That is to say that the first and second electrodes,
therefore, the 95% confidence interval is: is recorded as confidence interval (a)1,b1) I.e. by
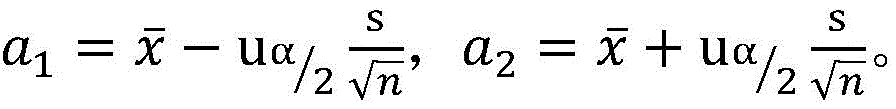
Similarly, according to the above method, a confidence interval (a) of the data burst point is calculated2,b2) And confidence interval of narrow amplitude oscillation (a)3,b3)。
Referring to fig. 4, determining whether the sensor data value is abnormal according to the data value abnormality confidence interval and the preset monitoring judgment threshold, and determining the data value abnormality type includes: judging whether the real-time data value of the sensor is in any data value abnormal confidence interval or not; if the real-time data value of the sensor is in any data value abnormal confidence interval, the real-time data value of the sensor is an abnormal value, and the abnormal type of the data value is determined by comparing the variation of the real-time data value of the sensor at a preset time interval with the monitoring judgment threshold value; and if the real-time data value of the sensor is not in any data value abnormal confidence interval, the real-time data value of the sensor is a normal value.
Further, the data value anomaly confidence interval comprises: a data sudden increase confidence interval, a data sudden decrease confidence interval and a narrow oscillation confidence interval; when the real-time sensor data value is in the data sudden increase confidence interval, if the variation of the sensor data value in the preset time interval is greater than the data sudden increase monitoring judgment threshold, the real-time sensor data value in the preset time interval is a data sudden increase abnormal value; when the real-time sensor data value is in the data sudden decrease confidence interval, if the variation of the sensor data value in the preset time interval is greater than the data sudden decrease monitoring judgment threshold, the real-time sensor data value in the preset time interval is a data sudden decrease abnormal value; and when the real-time sensor data value is within the narrow oscillation confidence interval, if the variation of the sensor data value in the preset time interval is smaller than the narrow oscillation monitoring judgment threshold, the real-time sensor data value in the preset time interval is an abnormal narrow oscillation value.
For example by checking the data value x in the sensor real-time data at time ttWhether or not the data value is within the above-mentioned abnormal confidence interval (a)1,b1)、(a2,b2) And (a)3,b3) Whether the sensor data value at the time t is abnormal or not is judged.
If the data value in the real-time data is in the data sudden increase confidence interval and the variation of the sensor data value of the preset time interval is larger than the data sudden increase monitoring judgment threshold value, namely xt+Δt-xt>c1If the sensor real-time data value in the preset time interval is the data burst abnormal value, judging that the sensor real-time data value in the preset time interval is the data burst abnormal value;
if the data value in the real-time data is in the data sudden decrease confidence interval and the variation of the sensor data value of the preset time interval is larger than the data sudden decrease monitoring judgment threshold, namely xt-xt+Δt>c2If the data value of the sensor in the preset time interval is the data sudden reduction abnormal value;
if the data value in the real-time data is within the narrow oscillation confidence interval and if the variation of the sensor data value of the preset time interval is smaller than the narrow oscillation monitoring judgment threshold, that is, the absolute value is | x |t+Δt-xt|>c3And if so, the real-time data value of the sensor in the preset time interval is a narrow oscillation abnormal value.
Wherein x ist+ΔtSensor data value, x, representing the time t + Δ ttSensor data value representing time t, c1Indicating a threshold for sudden increase in data monitoring evaluation, c2Indicating a data sudden decrease monitoring evaluation threshold, c3Indicating a narrow oscillation monitoring judgment threshold.
And if the sensor data value at the time t is not in any data value abnormality confidence interval, the sensor data value at the time t is a normal value.
Referring to fig. 1, further, when the sensor is determined to be in the calibration state or the fault state, whether the state of the sensor is abnormal is determined according to the upper and lower limits of the confidence interval of the state of the sensor and the duration of the state of the sensor. Specifically, when the sensor is in a calibration state, comparing the calibration time staying length in the real-time data of the sensor with the confidence upper limit, if the calibration time staying length is smaller than the confidence upper limit, indicating that the sensor state is normal in calibration, otherwise indicating that the calibration is abnormal; and when the sensor is in a fault state, comparing the fault time staying length in the real-time data of the sensor with the lower confidence limit, if the fault time staying length is larger than the lower confidence limit, indicating that the fault mark is normal, otherwise, indicating that the fault mark is abnormal.
Further, the estimation method of the sensor state confidence limit value comprises the following steps: counting the calibration duration of each calibration state in the sensor historical data; calculating the mean value and the variance of all calibration duration; constructing a normal distribution function and a test statistic function of the calibration duration by using the mean value and the variance of all the calibration durations; and obtaining a confidence upper limit value of a confidence interval with the true value of the overall mean value of the calibration duration being 95%, namely a calibration state confidence upper limit value, according to the test statistic function of the calibration duration.
For example, taking the estimation of the confidence upper limit value of the calibration state as an example, the calibration duration T of each time the calibration state is represented in the historical data of the sensor is counted1,T2…TpAnd calculating the mean value and the variance of the calibration duration, and obtaining the confidence upper limit value of the calibration state according to the test statistic function of the calibration duration, wherein the specific calculation method is similar to the calculation methods described in the formula (1), the formula (2), the formula (3), the formula (4) and the formula (5), and the confidence upper limit value of the confidence interval of which the true value of the overall mean value of the calibration duration is 95% is calculated Time of calibrationLength of stay T<d, indicating that the calibration is normal, otherwise indicating that the calibration is abnormal.
Similarly, counting the fault duration of each fault state in the sensor historical data; calculating the mean value and the variance of all fault duration; constructing a normal distribution function and a test statistic function of the fault duration by using the mean value and the variance of all fault durations; and obtaining a confidence lower limit value of a confidence interval with the true value of the overall mean value of the fault duration being 95%, namely the confidence lower limit value of the fault state, according to the test statistic function of the fault duration. For example, the estimation of the confidence lower limit value of the fault state is taken as an example, the fault duration T of each fault state represented in the historical data of the sensor is counted1,T2…TqCalculating a confidence lower limit value of a confidence interval with the truth value of the overall mean value of the fault duration being 95%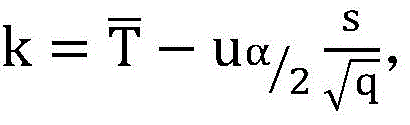 If the fault time stays for a length T>And k, indicating that the fault mark is normal, otherwise, indicating that the fault mark is abnormal.
According to the embodiment of the invention, the state of the sensor is judged according to the sensor state label of the real-time data of the sensor, and then the abnormal type of the running data of the sensor is judged according to different sensor states, wherein whether the data value of the sensor is abnormal or not is judged according to the abnormal confidence interval of the data value and the preset monitoring judgment threshold value, the abnormal type of the data value is judged, and whether the state of the sensor is abnormal or not is judged according to the duration of the state and the confidence limit value, so that whether the uploaded running data of the sensor is abnormal or not can be rapidly and accurately identified, the coal mine safety monitoring can be better carried out, the coal mine safety management level is improved, and the accident.
Corresponding to the above embodiments, the embodiment of the present invention provides a device for identifying abnormality of operation data of a mine sensor, and referring to fig. 5, a real-time data obtaining unit 01 is used for obtaining real-time data of the sensor; the state judgment unit 02 is used for judging the state of the sensor according to the sensor state label in the real-time data; the data value abnormality judgment unit 03 is configured to judge whether the sensor data value is abnormal according to the data value abnormality confidence interval and a preset monitoring judgment threshold when the sensor state is determined to be a normal state, and judge the type of the data value abnormality; the calibration abnormity judging unit 04 is used for judging whether the state of the sensor is abnormal or not according to the duration of the calibration state and the confidence limit value of the state of the sensor when the sensor is determined to be in the calibration state; and the fault mark abnormity judging unit 05 is used for judging whether the state of the sensor is abnormal or not according to the duration of the fault state and the confidence limit value of the state of the sensor when the sensor is confirmed to be in the fault state.
The specific functions performed by the components of this embodiment are described in detail in the above embodiments, and are not described in detail herein.
Corresponding to the above embodiment, an embodiment of the present invention provides a system for identifying abnormality of operation data of a mine sensor, including: at least one processor and at least one memory; the memory is used for storing one or more program instructions; a processor for executing one or more program instructions for performing a method of identifying anomalies in mine sensor operational data.
In accordance with the embodiments described above, embodiments of the present invention provide a computer-readable storage medium having one or more program instructions embodied therein for use by a system for identifying anomalies in operational data of mine sensors to perform a method for identifying anomalies in operational data of mine sensors.
The disclosed embodiments of the present invention provide a computer-readable storage medium having stored therein computer program instructions which, when run on a computer, cause the computer to perform the above-described method.
According to the embodiment of the invention, the state of the sensor is judged according to the state label of the sensor, and then the abnormal type of the sensor is judged according to different sensor states, wherein whether the data value of the sensor is abnormal or not is judged according to the abnormal confidence interval of the data value, the abnormal type of the data value is judged, and whether the state of the sensor is abnormal or not is judged according to the duration and the confidence limit value of the state, so that whether the uploaded sensor operation data is abnormal or not can be rapidly and accurately identified, the coal mine safety monitoring can be better carried out, the coal mine safety management level is improved, and the accident rate is reduced.
In an embodiment of the invention, the processor may be an integrated circuit chip having signal processing capability. The Processor may be a general purpose Processor, a Digital Signal Processor (DSP), an Application Specific Integrated Circuit (ASIC), a Field Programmable Gate Array (FPGA) or other programmable logic device, discrete Gate or transistor logic device, discrete hardware component.
The various methods, steps and logic blocks disclosed in the embodiments of the present invention may be implemented or performed. A general purpose processor may be a microprocessor or the processor may be any conventional processor or the like. The steps of the method disclosed in connection with the embodiments of the present invention may be directly implemented by a hardware decoding processor, or implemented by a combination of hardware and software modules in the decoding processor. The software module may be located in ram, flash memory, rom, prom, or eprom, registers, etc. storage media as is well known in the art. The processor reads the information in the storage medium and completes the steps of the method in combination with the hardware.
The storage medium may be a memory, for example, which may be volatile memory or nonvolatile memory, or which may include both volatile and nonvolatile memory.
The nonvolatile Memory may be a Read-Only Memory (ROM), a Programmable ROM (PROM), an Erasable PROM (EPROM), an Electrically Erasable PROM (EEPROM), or a flash Memory.
The volatile Memory may be a Random Access Memory (RAM) which serves as an external cache. By way of example and not limitation, many forms of RAM are available, such as Static Random Access Memory (SRAM), Dynamic RAM (DRAM), Synchronous DRAM (SDRAM), Double Data Rate SDRAM (DDRSDRAM), Enhanced SDRAM (ESDRAM), SLDRAM (SLDRAM), and Direct Rambus RAM (DRRAM).
The storage media described in connection with the embodiments of the invention are intended to comprise, without being limited to, these and any other suitable types of memory.
Those skilled in the art will appreciate that the functionality described in the present invention may be implemented in a combination of hardware and software in one or more of the examples described above. When software is applied, the corresponding functionality may be stored on or transmitted over as one or more instructions or code on a computer-readable medium. Computer-readable media includes both computer storage media and communication media including any medium that facilitates transfer of a computer program from one place to another. A storage media may be any available media that can be accessed by a general purpose or special purpose computer.
The above-mentioned embodiments, objects, technical solutions and advantages of the present invention are further described in detail, it should be understood that the above-mentioned embodiments are only exemplary embodiments of the present invention, and are not intended to limit the scope of the present invention, and any modifications, equivalent substitutions, improvements and the like made on the basis of the technical solutions of the present invention should be included in the scope of the present invention.
Claims (8)
1. A method of identifying anomalies in mine sensor operational data, the method comprising:
acquiring real-time data of a sensor;
judging the state of the sensor according to the sensor state label in the real-time data;
when the sensor state is determined to be a normal state, judging whether the sensor data value is abnormal according to the data value abnormal confidence interval and a preset monitoring judgment threshold value, and judging the data value abnormal type;
when the sensor is determined to be in a calibration state or a fault state, judging whether the state of the sensor is abnormal or not according to the duration of the state and the confidence limit value of the state of the sensor;
the method for estimating the data value abnormal confidence interval comprises the following steps:
classifying and counting all catastrophe points in the historical data values of the sensor according to the abnormal types;
respectively calculating the mean value and the variance of all mutation points in each data value abnormal type;
constructing a mutation point normal distribution function and a mutation point test statistic function of the corresponding data value abnormal type by using the mean value and the variance of all mutation points in each data value abnormal type;
obtaining a confidence interval with the true value of the overall mean value of the catastrophe points of the corresponding data value abnormal type being 95% according to the catastrophe point test statistic function of each data value abnormal type, namely the data value abnormal confidence interval of the corresponding data value abnormal type;
classifying and counting all catastrophe points in the historical data values of the sensor according to the abnormal types, wherein the classifying and counting method comprises the following steps:
judging the abnormal data value continuous section of each data value abnormal type according to the change quantity of the historical data value of the sensor within the preset time;
taking a mutation starting point of each data value abnormal continuous segment as a mutation point;
classifying all mutation points according to the data value abnormal types and forming a mutation point set of each data value abnormal type;
wherein the data value exception types comprise data sudden increase, data sudden decrease and narrow amplitude oscillation;
if the increment of the historical data value of the sensor in the data sudden increase time threshold exceeds the data sudden increase variation threshold, judging the historical data value as a data sudden increase continuous segment;
if the reduction of the sensor historical data value in the data sudden reduction time threshold exceeds the data sudden reduction variation threshold, judging the sensor historical data value to be a data sudden reduction continuous segment;
and if the data value variation of the historical data value of the sensor in the range exceeding the narrow oscillation time threshold value is continuously smaller than the narrow oscillation variation threshold value, judging the sensor to be a narrow oscillation continuous section.
2. The method for identifying the abnormal operation data of the mine sensor as claimed in claim 1, wherein the step of judging whether the data value of the sensor is abnormal or not according to the abnormal confidence interval of the data value and the preset monitoring judgment threshold value and judging the abnormal type of the data value comprises the following steps:
judging whether the real-time data value of the sensor is in any data value abnormal confidence interval or not;
if the real-time data value of the sensor is in any data value abnormal confidence interval, the real-time data value of the sensor is an abnormal value, and the abnormal type of the data value is determined by comparing the variation of the real-time data value of the sensor at a preset time interval with the monitoring judgment threshold value;
and if the real-time data value of the sensor is not in any data value abnormal confidence interval, the real-time data value of the sensor is a normal value.
3. The method of identifying anomalies in mine sensor operational data as set forth in claim 2, wherein the data value anomaly confidence interval includes: a data sudden increase confidence interval, a data sudden decrease confidence interval and a narrow oscillation confidence interval;
when the real-time sensor data value is in the data sudden increase confidence interval, if the variation of the sensor data value in the preset time interval is greater than the data sudden increase monitoring judgment threshold, the real-time sensor data value in the preset time interval is a data sudden increase abnormal value;
when the real-time sensor data value is in the data sudden decrease confidence interval, if the variation of the sensor data value in the preset time interval is greater than the data sudden decrease monitoring judgment threshold, the real-time sensor data value in the preset time interval is a data sudden decrease abnormal value;
and when the real-time sensor data value is within the narrow oscillation confidence interval, if the variation of the sensor data value in the preset time interval is smaller than the narrow oscillation monitoring judgment threshold, the real-time sensor data value in the preset time interval is an abnormal narrow oscillation value.
4. The method of identifying anomalies in mine sensor operational data as set forth in claim 1, wherein the sensor state confidence limits are estimated by a method including:
the sensor state confidence limits include: calibrating a state confidence upper limit value and a fault state confidence lower limit value;
counting the calibration duration of each calibration state in the sensor historical data; calculating the mean value and the variance of all calibration duration; constructing a normal distribution function and a test statistic function of the calibration duration by using the mean value and the variance of all the calibration durations; obtaining a confidence upper limit value of a confidence interval with the true value of the overall average value of the calibration duration being 95%, namely a calibration state confidence upper limit value, according to a test statistic function of the calibration duration;
counting the fault duration of each fault state in the sensor historical data; calculating the mean value and the variance of all fault duration; constructing a normal distribution function and a test statistic function of the fault duration by using the mean value and the variance of all fault durations; and obtaining a confidence lower limit value of a confidence interval with the true value of the overall mean value of the fault duration being 95%, namely the confidence lower limit value of the fault state, according to the test statistic function of the fault duration.
5. The method for identifying anomalies in mine sensor operational data as set forth in claim 1, wherein the method for determining whether a sensor state is anomalous includes:
when the sensor is in a calibration state, comparing the calibration time staying length in the real-time data of the sensor with the confidence upper limit, if the calibration time staying length is smaller than the confidence upper limit, indicating that the sensor state is normal in calibration, otherwise indicating that the calibration is abnormal;
and when the sensor is in a fault state, comparing the fault time staying length in the real-time data of the sensor with the lower confidence limit, if the fault time staying length is larger than the lower confidence limit, indicating that the fault mark is normal, otherwise, indicating that the fault mark is abnormal.
6. An apparatus for identifying anomalies in mine sensor operational data, the apparatus comprising:
the real-time data acquisition unit is used for acquiring real-time data of the sensor;
the state judgment unit is used for judging the state of the sensor according to the sensor state label in the real-time data;
the data value abnormality judgment unit is used for judging whether the sensor data value is abnormal or not according to the data value abnormality confidence interval and a preset monitoring judgment threshold value when the sensor state is determined to be a normal state, and judging the data value abnormality type;
the calibration abnormity judging unit is used for judging whether the state of the sensor is abnormal or not according to the duration of the calibration state and the confidence limit value of the state of the sensor when the sensor is determined to be in the calibration state;
the fault mark abnormity judgment unit is used for judging whether the state of the sensor is abnormal or not according to the duration of the fault state and the confidence limit value of the state of the sensor when the sensor is confirmed to be in the fault state;
the method for estimating the data value abnormal confidence interval comprises the following steps:
classifying and counting all catastrophe points in the historical data values of the sensor according to the abnormal types;
respectively calculating the mean value and the variance of all mutation points in each data value abnormal type;
constructing a mutation point normal distribution function and a mutation point test statistic function of the corresponding data value abnormal type by using the mean value and the variance of all mutation points in each data value abnormal type;
obtaining a confidence interval with the true value of the overall mean value of the catastrophe points of the corresponding data value abnormal type being 95% according to the catastrophe point test statistic function of each data value abnormal type, namely the data value abnormal confidence interval of the corresponding data value abnormal type;
classifying and counting all catastrophe points in the historical data values of the sensor according to the abnormal types, wherein the classifying and counting method comprises the following steps:
judging the abnormal data value continuous section of each data value abnormal type according to the change quantity of the historical data value of the sensor within the preset time;
taking a mutation starting point of each data value abnormal continuous segment as a mutation point;
classifying all mutation points according to the data value abnormal types and forming a mutation point set of each data value abnormal type;
wherein the data value exception types comprise data sudden increase, data sudden decrease and narrow amplitude oscillation;
if the increment of the historical data value of the sensor in the data sudden increase time threshold exceeds the data sudden increase variation threshold, judging the historical data value as a data sudden increase continuous segment;
if the reduction of the sensor historical data value in the data sudden reduction time threshold exceeds the data sudden reduction variation threshold, judging the sensor historical data value to be a data sudden reduction continuous segment;
and if the data value variation of the historical data value of the sensor in the range exceeding the narrow oscillation time threshold value is continuously smaller than the narrow oscillation variation threshold value, judging the sensor to be a narrow oscillation continuous section.
7. A system for identifying anomalies in mine sensor operational data, the system comprising: at least one processor and at least one memory;
the memory is to store one or more program instructions;
the processor, configured to execute one or more program instructions to perform the method of any of claims 1-5.
8. A computer readable storage medium containing one or more program instructions for performing the method of any of claims 1-5 by a system for identifying mine sensor operational data anomalies.
Priority Applications (1)
| Application Number | Priority Date | Filing Date | Title |
|---|---|---|---|
| CN201910833203.1A CN110631624B (en) | 2019-09-04 | 2019-09-04 | Method, device and system for identifying abnormal operation data of mine sensor |
Applications Claiming Priority (1)
| Application Number | Priority Date | Filing Date | Title |
|---|---|---|---|
| CN201910833203.1A CN110631624B (en) | 2019-09-04 | 2019-09-04 | Method, device and system for identifying abnormal operation data of mine sensor |
Publications (2)
| Publication Number | Publication Date |
|---|---|
| CN110631624A CN110631624A (en) | 2019-12-31 |
| CN110631624B true CN110631624B (en) | 2020-12-15 |
Family
ID=68970257
Family Applications (1)
| Application Number | Title | Priority Date | Filing Date |
|---|---|---|---|
| CN201910833203.1A Active CN110631624B (en) | 2019-09-04 | 2019-09-04 | Method, device and system for identifying abnormal operation data of mine sensor |
Country Status (1)
| Country | Link |
|---|---|
| CN (1) | CN110631624B (en) |
Families Citing this family (18)
| Publication number | Priority date | Publication date | Assignee | Title |
|---|---|---|---|---|
| CN111830208A (en) * | 2020-07-24 | 2020-10-27 | 精英数智科技股份有限公司 | Method and system for monitoring position state of methane sensor |
| CN111855897B (en) * | 2020-08-26 | 2024-11-19 | 精英数智科技股份有限公司 | A method, system, device and medium for identifying downhole sensor calibration status |
| CN112763662B (en) * | 2020-12-29 | 2023-08-22 | 精英数智科技股份有限公司 | Gas sensor data abnormality identification method and related device |
| US12084946B2 (en) | 2021-02-18 | 2024-09-10 | Yantai Jereh Petroleum Equipment & Technologies Co., Ltd. | Monitoring system and method for wellsite equipment |
| CN112861741A (en) * | 2021-02-18 | 2021-05-28 | 烟台杰瑞石油装备技术有限公司 | Wellsite equipment monitoring system and wellsite equipment monitoring method |
| CN113687048B (en) * | 2021-07-01 | 2024-11-19 | 精英数智科技股份有限公司 | Sensor data detection interruption identification method, device and electronic equipment |
| CN113723338B (en) * | 2021-09-08 | 2024-03-15 | 深圳市汉德网络科技有限公司 | Sensor abnormality detection method, device and computer-readable storage medium |
| CN114382661A (en) * | 2021-12-07 | 2022-04-22 | 重庆海装风电工程技术有限公司 | Sensor running state detection method and system for wind generating set and electronic equipment |
| CN113918376B (en) * | 2021-12-14 | 2022-03-04 | 湖南天云软件技术有限公司 | Fault detection method, device, equipment and computer readable storage medium |
| CN114967613B (en) * | 2022-05-11 | 2023-06-09 | 杭州康吉森自动化科技有限公司 | Method and device for state monitoring of production equipment with multiple sensors |
| CN115096344A (en) * | 2022-05-13 | 2022-09-23 | 珠海格力电器股份有限公司 | Data real-time display method and device, electronic equipment and storage medium |
| CN115077962B (en) * | 2022-06-13 | 2024-10-11 | 杭州康吉森自动化科技有限公司 | Monitoring method, system and storage medium for stability of production device |
| CN115941807B (en) * | 2022-12-22 | 2024-02-23 | 陕西通信规划设计研究院有限公司 | Efficient data compression method for park security system |
| CN117034109A (en) * | 2023-08-03 | 2023-11-10 | 中国人民解放军95616部队保障部 | Engine oil abrasive grain analysis method and system based on segmentation threshold and computer readable storage medium |
| CN118539605A (en) * | 2024-05-09 | 2024-08-23 | 杭州东显科技有限公司 | A sensor measurement system based on wind and solar power supply |
| CN118885726B (en) * | 2024-07-15 | 2025-05-13 | 华夏天信物联科技有限公司 | A method and device for determining faults during advance drilling |
| CN119058634A (en) * | 2024-08-21 | 2024-12-03 | 中国第一汽车股份有限公司 | Vehicle control method and device based on estimated wheel speed, vehicle and storage medium |
| CN118934057A (en) * | 2024-08-23 | 2024-11-12 | 安徽江南爆破工程有限公司 | A data acquisition system for loosening analysis of surrounding rock in deep tunnels |
Family Cites Families (8)
| Publication number | Priority date | Publication date | Assignee | Title |
|---|---|---|---|---|
| GB9208704D0 (en) * | 1992-04-22 | 1992-06-10 | Foxboro Ltd | Improvements in and relating to sensor units |
| CN102608286B (en) * | 2012-03-01 | 2015-07-08 | 煤炭科学技术研究院有限公司 | Method for monitoring abnormality of gas monitored value of coal mine in real time |
| CN104165649B (en) * | 2014-08-28 | 2016-08-24 | 西北工业大学 | A kind of brshless DC motor Hall element power-on self-test surveys method |
| CN104375057A (en) * | 2014-11-07 | 2015-02-25 | 国网上海市电力公司 | Automatic underground power line fault positioning and warning system |
| CN104713585A (en) * | 2015-04-08 | 2015-06-17 | 南车株洲电力机车有限公司 | Suspension sensor diagnosis device and method |
| CN106296435B (en) * | 2016-08-18 | 2018-02-02 | 西安科技大学 | A kind of mine gas monitors disorder data recognition method |
| CN108873928A (en) * | 2017-05-10 | 2018-11-23 | 中国航空工业集团公司西安飞行自动控制研究所 | A kind of unmanned helicopter height keeping method based on sensor states assessment result |
| CN109645750B (en) * | 2019-01-22 | 2021-06-18 | 浙江想能云软件股份有限公司 | Intelligent mattress temperature control fault automatic alarm processing system and method |
-
2019
- 2019-09-04 CN CN201910833203.1A patent/CN110631624B/en active Active
Also Published As
| Publication number | Publication date |
|---|---|
| CN110631624A (en) | 2019-12-31 |
Similar Documents
| Publication | Publication Date | Title |
|---|---|---|
| CN110631624B (en) | Method, device and system for identifying abnormal operation data of mine sensor | |
| CN115059634B (en) | Fault diagnosis method and device for air blowing equipment and electronic equipment | |
| CN111189488B (en) | Sensor value abnormity identification method, device, equipment and storage medium | |
| CN112348237B (en) | A method for detecting abnormal trends in dynamic drilling data | |
| CN110595525B (en) | Method, device, system and medium for monitoring abnormality of downhole sensor | |
| US8289160B1 (en) | Systems and methods for recording and using information about conditions present in a house or other location | |
| CN117405177B (en) | Cable tunnel harmful gas leakage early warning method, system, equipment and medium | |
| CN114446020B (en) | Linkage early warning management method, system, storage medium and equipment | |
| CN108777051A (en) | Fire alarm method, device, computer equipment and storage medium | |
| US10000912B2 (en) | Freeze prediction system | |
| US10002514B2 (en) | Machine tool having function of monitoring sealing of control panel | |
| CN105473921B (en) | The method being monitored for the valve to aircraft engine | |
| CN110750413B (en) | Multi-machine room temperature alarm method and device and storage medium | |
| CN107632132A (en) | A kind of water quality monitoring warning system with forecast function | |
| CN116105802A (en) | Underground facility safety monitoring and early warning method based on Internet of things | |
| CN111274098B (en) | An IoT-based storage device alarm method and device | |
| CN120048053A (en) | Fire-fighting early warning management system and method | |
| CN112542029A (en) | Fan noise detection monitoring method and system, computer equipment and storage medium | |
| CN112763662A (en) | Method for identifying data abnormity of gas sensor and related device | |
| CN111971556A (en) | Moisture contamination detection device, moisture contamination detection program, moisture contamination detection method, and moisture contamination detection system | |
| CN110595526B (en) | Detection method, device and equipment for calibration of coal mine underground sensor | |
| CN116311829B (en) | A remote alarm method and device for a data computer room | |
| EP4194976B1 (en) | Soft error aggregation method for detection and reporting of risks in a safety plc system | |
| CN113687048B (en) | Sensor data detection interruption identification method, device and electronic equipment | |
| CN117671913A (en) | Smoke sensor maintenance methods, devices, equipment and storage media |
Legal Events
| Date | Code | Title | Description |
|---|---|---|---|
| PB01 | Publication | ||
| PB01 | Publication | ||
| SE01 | Entry into force of request for substantive examination | ||
| SE01 | Entry into force of request for substantive examination | ||
| GR01 | Patent grant | ||
| GR01 | Patent grant |