CN109887548B - ctDNA ratio detection method and detection device based on capture sequencing - Google Patents
ctDNA ratio detection method and detection device based on capture sequencing Download PDFInfo
- Publication number
- CN109887548B CN109887548B CN201910049677.7A CN201910049677A CN109887548B CN 109887548 B CN109887548 B CN 109887548B CN 201910049677 A CN201910049677 A CN 201910049677A CN 109887548 B CN109887548 B CN 109887548B
- Authority
- CN
- China
- Prior art keywords
- cfdna
- mutation
- ctdna
- sites
- detected
- Prior art date
- Legal status (The legal status is an assumption and is not a legal conclusion. Google has not performed a legal analysis and makes no representation as to the accuracy of the status listed.)
- Active
Links
- 238000001514 detection method Methods 0.000 title claims abstract description 88
- 238000012163 sequencing technique Methods 0.000 title claims abstract description 59
- 230000035772 mutation Effects 0.000 claims abstract description 103
- 230000036438 mutation frequency Effects 0.000 claims abstract description 68
- 238000000034 method Methods 0.000 claims abstract description 36
- 238000001914 filtration Methods 0.000 claims abstract description 24
- 238000007476 Maximum Likelihood Methods 0.000 claims abstract description 22
- 108090000623 proteins and genes Proteins 0.000 claims abstract description 22
- 108020004414 DNA Proteins 0.000 claims description 97
- 206010028980 Neoplasm Diseases 0.000 claims description 41
- 238000009826 distribution Methods 0.000 claims description 31
- 238000012360 testing method Methods 0.000 claims description 25
- 238000012545 processing Methods 0.000 claims description 11
- 238000012800 visualization Methods 0.000 claims description 10
- 238000012217 deletion Methods 0.000 claims description 9
- 238000010586 diagram Methods 0.000 claims description 9
- 230000037430 deletion Effects 0.000 claims description 8
- 230000008569 process Effects 0.000 claims description 8
- 238000000528 statistical test Methods 0.000 claims description 8
- 238000004422 calculation algorithm Methods 0.000 claims description 6
- 230000009946 DNA mutation Effects 0.000 claims description 5
- 238000004364 calculation method Methods 0.000 claims description 5
- 230000008859 change Effects 0.000 claims description 4
- 238000011156 evaluation Methods 0.000 claims description 3
- 238000011144 upstream manufacturing Methods 0.000 claims description 3
- 238000012795 verification Methods 0.000 claims description 3
- 230000035945 sensitivity Effects 0.000 abstract description 6
- 239000000523 sample Substances 0.000 description 235
- 210000001519 tissue Anatomy 0.000 description 24
- LFQSCWFLJHTTHZ-UHFFFAOYSA-N Ethanol Chemical compound CCO LFQSCWFLJHTTHZ-UHFFFAOYSA-N 0.000 description 20
- 239000006228 supernatant Substances 0.000 description 18
- 239000007788 liquid Substances 0.000 description 17
- 239000011324 bead Substances 0.000 description 16
- 210000000601 blood cell Anatomy 0.000 description 16
- 210000000349 chromosome Anatomy 0.000 description 15
- 210000004881 tumor cell Anatomy 0.000 description 14
- 239000012634 fragment Substances 0.000 description 13
- 239000000203 mixture Substances 0.000 description 13
- 239000013074 reference sample Substances 0.000 description 12
- 238000010790 dilution Methods 0.000 description 11
- 239000012895 dilution Substances 0.000 description 11
- 239000000872 buffer Substances 0.000 description 9
- 239000000047 product Substances 0.000 description 7
- 230000003321 amplification Effects 0.000 description 6
- 238000004458 analytical method Methods 0.000 description 6
- 238000003199 nucleic acid amplification method Methods 0.000 description 6
- 238000002360 preparation method Methods 0.000 description 6
- 238000000746 purification Methods 0.000 description 6
- 210000004027 cell Anatomy 0.000 description 5
- 238000006243 chemical reaction Methods 0.000 description 4
- 230000000694 effects Effects 0.000 description 4
- 239000012149 elution buffer Substances 0.000 description 4
- 238000012165 high-throughput sequencing Methods 0.000 description 4
- 238000011002 quantification Methods 0.000 description 4
- 238000003260 vortexing Methods 0.000 description 4
- 206010069754 Acquired gene mutation Diseases 0.000 description 3
- 210000001124 body fluid Anatomy 0.000 description 3
- 239000010839 body fluid Substances 0.000 description 3
- 238000007865 diluting Methods 0.000 description 3
- 238000001035 drying Methods 0.000 description 3
- 238000002156 mixing Methods 0.000 description 3
- 238000012216 screening Methods 0.000 description 3
- 230000037439 somatic mutation Effects 0.000 description 3
- 229910021642 ultra pure water Inorganic materials 0.000 description 3
- 239000012498 ultrapure water Substances 0.000 description 3
- 230000004536 DNA copy number loss Effects 0.000 description 2
- 108090000790 Enzymes Proteins 0.000 description 2
- 102000004190 Enzymes Human genes 0.000 description 2
- 238000012408 PCR amplification Methods 0.000 description 2
- 108091081062 Repeated sequence (DNA) Proteins 0.000 description 2
- 238000000876 binomial test Methods 0.000 description 2
- 230000002759 chromosomal effect Effects 0.000 description 2
- 239000003086 colorant Substances 0.000 description 2
- 230000007547 defect Effects 0.000 description 2
- 238000013461 design Methods 0.000 description 2
- 238000005516 engineering process Methods 0.000 description 2
- 238000002474 experimental method Methods 0.000 description 2
- 210000004602 germ cell Anatomy 0.000 description 2
- 238000007689 inspection Methods 0.000 description 2
- 239000002184 metal Substances 0.000 description 2
- 238000012986 modification Methods 0.000 description 2
- 230000004048 modification Effects 0.000 description 2
- 238000007481 next generation sequencing Methods 0.000 description 2
- 239000002773 nucleotide Substances 0.000 description 2
- 125000003729 nucleotide group Chemical group 0.000 description 2
- 230000001575 pathological effect Effects 0.000 description 2
- 102000054765 polymorphisms of proteins Human genes 0.000 description 2
- 239000002096 quantum dot Substances 0.000 description 2
- 238000007789 sealing Methods 0.000 description 2
- 239000000243 solution Substances 0.000 description 2
- 238000010186 staining Methods 0.000 description 2
- 238000012546 transfer Methods 0.000 description 2
- 238000005406 washing Methods 0.000 description 2
- 238000007482 whole exome sequencing Methods 0.000 description 2
- GUAHPAJOXVYFON-ZETCQYMHSA-N (8S)-8-amino-7-oxononanoic acid zwitterion Chemical compound C[C@H](N)C(=O)CCCCCC(O)=O GUAHPAJOXVYFON-ZETCQYMHSA-N 0.000 description 1
- 108700024394 Exon Proteins 0.000 description 1
- 238000000729 Fisher's exact test Methods 0.000 description 1
- 206010064571 Gene mutation Diseases 0.000 description 1
- 101001024425 Mus musculus Ig gamma-2A chain C region secreted form Proteins 0.000 description 1
- 206010061309 Neoplasm progression Diseases 0.000 description 1
- 108091028043 Nucleic acid sequence Proteins 0.000 description 1
- -1 PCR amplification Proteins 0.000 description 1
- 230000006907 apoptotic process Effects 0.000 description 1
- 238000013459 approach Methods 0.000 description 1
- 238000010009 beating Methods 0.000 description 1
- 210000004369 blood Anatomy 0.000 description 1
- 239000008280 blood Substances 0.000 description 1
- 238000007664 blowing Methods 0.000 description 1
- JJWKPURADFRFRB-UHFFFAOYSA-N carbonyl sulfide Chemical compound O=C=S JJWKPURADFRFRB-UHFFFAOYSA-N 0.000 description 1
- 239000003153 chemical reaction reagent Substances 0.000 description 1
- 108091092240 circulating cell-free DNA Proteins 0.000 description 1
- 230000000295 complement effect Effects 0.000 description 1
- 238000010276 construction Methods 0.000 description 1
- 230000018732 detection of tumor cell Effects 0.000 description 1
- 239000012470 diluted sample Substances 0.000 description 1
- 238000010353 genetic engineering Methods 0.000 description 1
- 238000010438 heat treatment Methods 0.000 description 1
- 238000009396 hybridization Methods 0.000 description 1
- 230000006872 improvement Effects 0.000 description 1
- 238000011534 incubation Methods 0.000 description 1
- 238000002372 labelling Methods 0.000 description 1
- 238000012544 monitoring process Methods 0.000 description 1
- 230000017074 necrotic cell death Effects 0.000 description 1
- 238000003752 polymerase chain reaction Methods 0.000 description 1
- 238000011176 pooling Methods 0.000 description 1
- 238000007781 pre-processing Methods 0.000 description 1
- 238000004393 prognosis Methods 0.000 description 1
- 230000035755 proliferation Effects 0.000 description 1
- 230000002040 relaxant effect Effects 0.000 description 1
- 230000008439 repair process Effects 0.000 description 1
- 230000028327 secretion Effects 0.000 description 1
- 238000002864 sequence alignment Methods 0.000 description 1
- 238000007619 statistical method Methods 0.000 description 1
- 239000011550 stock solution Substances 0.000 description 1
- 238000006467 substitution reaction Methods 0.000 description 1
- 239000000725 suspension Substances 0.000 description 1
- 230000005751 tumor progression Effects 0.000 description 1
- 238000002604 ultrasonography Methods 0.000 description 1
- 239000013026 undiluted sample Substances 0.000 description 1
- 230000000007 visual effect Effects 0.000 description 1
- 239000002699 waste material Substances 0.000 description 1
- XLYOFNOQVPJJNP-UHFFFAOYSA-N water Substances O XLYOFNOQVPJJNP-UHFFFAOYSA-N 0.000 description 1
Images


Landscapes
- Measuring Or Testing Involving Enzymes Or Micro-Organisms (AREA)
Abstract
The invention discloses a ctDNA ratio detection method and a ctDNA ratio detection device based on capture sequencing. The detection method comprises the following steps: s1, acquiring gene data of capture sequencing of a base line sample DNA and cfDNA to be tested; s2, simultaneously using homozygous and heterozygous sites in the DNA of the baseline sample, and selecting sites which have obviously different mutation frequencies between the DNA of the baseline sample and the cfDNA to be detected and meet preset filtering conditions as candidate SNP sites; s3, judging the mutation types of the candidate SNP sites of the normal cell DNA and the ctDNA by combining the copy number mutation condition of the region where the candidate SNP sites are located; and S4, establishing a probability model by using a maximum likelihood method, and calculating the ctDNA ratio through the probability model. The technical scheme of the invention can improve the CNV detection sensitivity and accuracy of the plasma ctDNA from multiple aspects.
Description
Technical Field
The invention relates to the technical field of genetic engineering, in particular to a ctDNA ratio detection method and a ctDNA ratio detection device based on capture sequencing.
Background
Circulating tumor DNA (circulating tumor ctDNA) is produced by tumor cell apoptosis, necrosis or secretion, and is one of circulating cell-free DNA (cfDNA). The half-life of ctDNA in blood is short, and the ctDNA can be used for real-time monitoring of tumor patients. Except Single Nucleotide Polymorphisms (SNPs), inDel-deletion markers (indels), and Copy Number Variation (CNV) of ctDNA, the ratio of ctDNA in cfDNA can also be used as an index of tumor progression and prognosis. The detection results of SNP, inDel, and CNV may also be corrected according to the ratio of ctDNA.
ctDNA cannot be detected by staining pathological sections as in tumor tissues, and the main detection method is Next Generation Sequencing (NGS). Considering the characteristics of ctDNA, capture sequencing is generally adopted: massive DNA fragment information is obtained by interrupting a series of processes of DNA, PCR amplification, DNA fragment capturing, fluorescence sequencing and the like, and then the DNA sequence of a sample to be detected in a capturing area is obtained by replying, and further analysis is carried out by applying software or an algorithm. At present, the detection of tumor cell proportion detection software aiming at second generation sequencing data is mainly divided into two steps: the first step is to obtain the depth and base information of a sample to be detected and a reference sample at each position, extract available SNP, and quantify the copy number of each capture area by using the average sequencing depth of each target capture area; the second step is to estimate the tumor cell ratio by an algorithm using the information obtained in the first step. Commonly used algorithms include: sequenza, FACETS, pureCN, etc.
Among them, sequenza was designed for Whole Exome Sequencing (WES) using Python and R languages, and is not suitable for capture Sequencing. The input file required to be provided includes: the sample to be tested and the matched reference sample are a pileup file and a human genome reference file generated by SAMtools. The reference sample must be a paired normal cell sample of the test sample. The method comprises the steps of correcting GC content according to the average sequencing depth of sites in each region, calculating copy number, establishing a Bayesian probability model by combining with B-Allele Frequency (BAF) of germline heterozygosis mutation, estimating the tumor cell ratio, and outputting the copy number variation detection result corrected according to the tumor cell ratio.
The preprocessing module of FACETS is written by perl and c + + languages, and SAMtools software is called; the statistical analysis module is compiled by adopting an R language, and the required input file is a BAM file generated by comparing the sequencing data of the sample to be tested with the paired reference sample. The copy number was calculated similarly to Sequenza. However, when using SNP information, log-ratio of the tissue to be tested versus paired normal tissue was calculated for all dbSNPs and SNPs documented in the 1000genome database, and additionally log-odds-ratio was calculated for heterozygous SNPs to correct for BAF bias. And establishing a probability model by combining the BAF and the copy number information obtained in the previous step. The final output result is: and (3) correcting the copy number variation result of the sample to be detected, and detecting the tumor cell ratio, the chromosome ploidy and the tumor heterogeneity and displaying the result graphically.
PureCN is written in R language and can choose to use a paired normal sample or a set of unpaired normal samples as reference samples. When using unpaired samples, the dbSNP is required to be utilized with the COSMIC common database. The required input file is a BAM file after comparison of a sample to be detected and a reference sample, and a mutation list VCF file of a pair/single sample output by MuTect or other SNP detection software. Copy number calculation procedures were similar to Sequenza and FACETS. And after a copy number detection result is obtained, combining the mutation condition of the germline heterozygous mutation in the sample to be detected, and establishing a model by adopting a maximum likelihood method. The output results of the software include: and (3) correcting the copy number variation result of the sample to be detected, and detecting the tumor cell ratio and the chromosome ploidy and displaying the result graphically.
The above methods all have certain technical drawbacks, such as: the resolution of pathological section staining is low, and exact tumor cell ratios cannot be obtained, and only approximate ranges can be given. The method can only be used for detecting the tumor cell ratio in tumor tissues and is not suitable for ctDNA. The capture sequencing resolution is high, but the analysis process is complex. Current analytical software for captured data is, in part, only applicable to whole exon sequencing. Software suitable for capturing data of non-full exons also has some defects, has low sample ratio on tumor cells and low sensitivity, and is not designed for ctDNA.
Sequenza: the design of sequencing data for the whole exon is not suitable for capture sequencing.
FACETS: ctDNA present at low concentrations in plasma or other types of body fluids cannot be detected.
PureCN: tumor heterogeneity was not taken into account and estimates for cfDNA samples with DNA fragments derived from different tissues were inaccurate, assuming that there was only one clone. The estimation of the ploidy of the chromosome is inaccurate, so the accuracy of the tumor cell proportion is influenced. Furthermore, like facts, ctDNA present at low concentrations in plasma or other types of body fluids cannot be detected.
Disclosure of Invention
The invention aims to provide a ctDNA ratio detection method and a ctDNA ratio detection device based on capture sequencing, and aims to solve the technical problem of low accuracy in ctDNA ratio detection in the prior art.
In order to achieve the above object, according to one aspect of the present invention, there is provided a ctDNA fraction detection method based on capture sequencing. The detection method comprises the following steps: s1, acquiring gene data of capture sequencing of a base line sample DNA and a cfDNA to be tested, and processing the gene data to obtain a mutation list after the base line sample DNA is annotated, a mutation list after the cfDNA to be tested is annotated and a cfDNA copy number variation list to be tested; s2, performing statistical test on each mutation in the cfDNA to be tested by using the homozygous and heterozygous sites in the DNA of the baseline sample, and selecting sites which have significantly different mutation frequencies between the DNA of the baseline sample and the cfDNA to be tested and meet preset filtering conditions as candidate SNP sites; s3, judging the mutation types of the candidate SNP sites of the normal cell DNA and the ctDNA by combining the copy number mutation condition of the region where the candidate SNP sites are located; and S4, establishing a probability model by using the number and copy number of the support reads of different bases of the candidate SNP sites and using a maximum likelihood method, and calculating the ctDNA ratio through the probability model.
Further, the evaluation indexes of the probability model include: and performing ctDNA ratio estimation on each candidate SNP site, judging the difference of ctDNA sources, and detecting the ctDNA ratio of the whole cfDNA to be detected.
And further, after the ctDNA proportion is calculated by the probability model, a scatter diagram and a probability density distribution diagram are drawn by a visualization module to display the result.
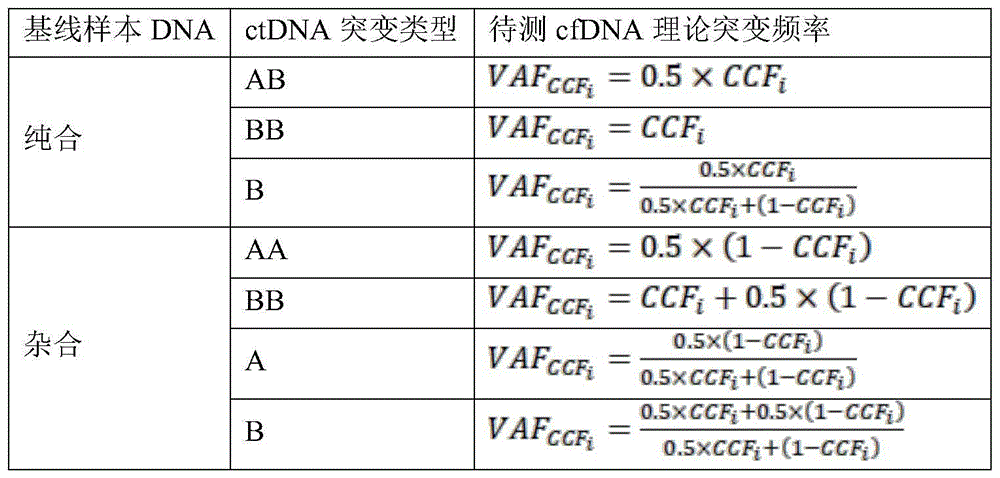
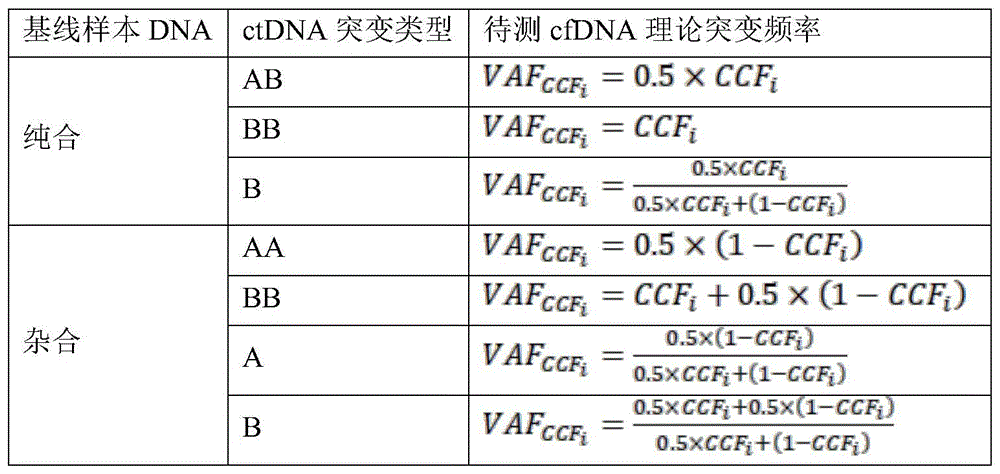
Further, the judgment criteria used in S3 are shown in table 1 below:
TABLE 1

Wherein A in the mutation type represents a reference base type, B represents a mutation base type, and the judgment standard of the copy number deletion of the cfDNA to be detected is as follows:

in the above formula CN i Is the copy number of the ith candidate SNP site of the sample, CCF i The ctDNA proportion corresponding to the ith candidate SNP site of the sample is determined, namely the standard of cfDNA copy number deletion to be detected is changed according to the finally predicted change of the ctDNA proportion.
Further, the cfDNA to be tested at a given CCF for various possibilities of mutation type of candidate SNP site i Theoretical frequency of sudden change of time Calculated according to the formula in table 2 below:
TABLE 2
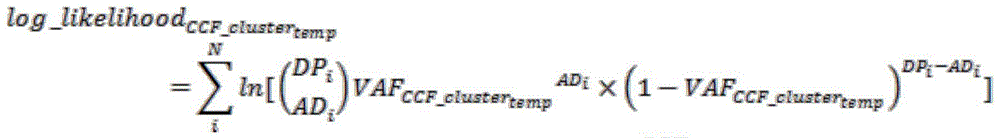
The total sequencing depth, the number of mutant base supported reads and the mutation frequency of the candidate SNP sites satisfy the distribution represented by the following formula:
AD i ~B(DP i ,VAF i )
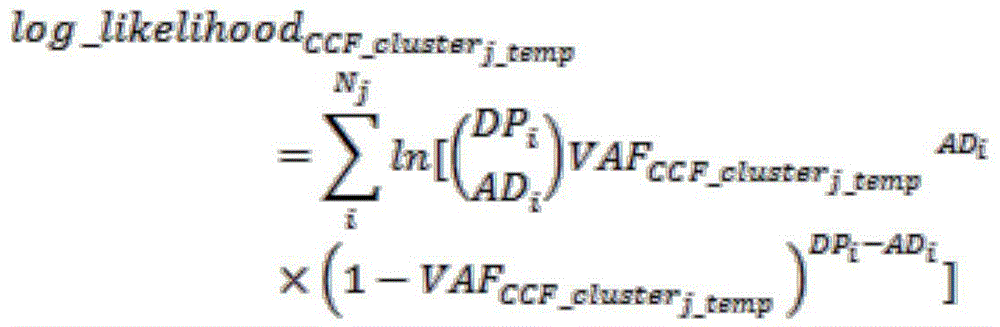
wherein, AD i The number of mutant base support reads of the ith candidate SNP site of the sample; DP i Is the total sequencing depth of the ith candidate SNP site in the sample; VAF i Is the mutation frequency of the ith candidate SNP site of the sample; for a given CCF i Substitution distribution and theoretical mutation frequency Calculating the position of each site in the CCF i Obtaining the corresponding AD i And DP i The likelihood value of (d); CCF (complementary fluorescence) for maximizing position point i likelihood value by using maximum likelihood method for each candidate SNP position point i The ratio is the CCF of the site i The specific log maximum likelihood formula is as follows:

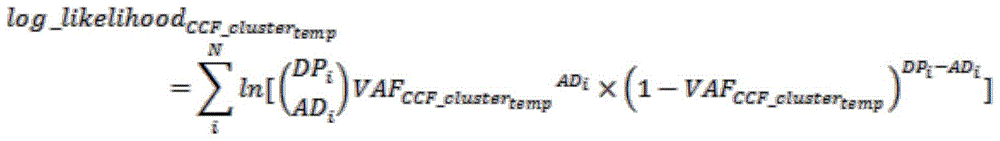
further, the detection method further comprises: mutation types and CCF of sites which are homozygous for candidate SNP sites of baseline sample DNA and have no deletion in copy number of cfDNA to be detected i The prediction specifically comprises the following steps: performing Hartigans unimodal test with the original hypothesis of unimodal distribution on CCFs of other sites except the sites which are homozygous for the candidate SNP site of the baseline sample DNA and have no deletion in the copy number of the cfDNA to be detected: if the test accepts the original hypothesis, and the multimodal distribution does not exist, the part of sites are assumed to be from the same tumor tissue source, and the CCF of all N candidate SNP sites is estimated in the maximum likelihood way to be used as the CCF temp :
If the test rejects the original hypothesis, and a multimodal distribution is considered to exist, the bits are evaluatedCCF of points i Clustering was performed assuming that the candidate SNP sites clustered into the same cluster are all from the same tumor tissue source and have the same CCF j (ii) a The number J of the clustered clusters is confirmed by a gap method; after completion of clustering, N for each cluster j CCF of individual candidate SNP sites j Maximum likelihood estimation is performed separately as CCF j_temp :
Complete tumor tissue origin clustering and CCF of other sites j_temp After the calculation, for the candidate SNP loci of which the mutation types cannot be determined, likelihood values which are homozygous mutation, heterozygous mutation and homologous to the known cluster are respectively calculated, and the candidate SNP loci are classified according to the standard of maximizing the likelihood values:

after the process is completed, the mutation types and the sources of all candidate SNP sites are determined; adding newly determined candidate SNP sites of mutation types and sources, repeating the maximum likelihood estimation process on the candidate SNP sites of each source cluster to obtain ctDNA source number J and a source-divided ratio prediction result CCF-cluster j 。
Further, the detection method further comprises a step of detecting the comparison prediction result, and specifically comprises the following steps: if the cfDNA to be detected contains a plurality of tumor tissue sources, the tumor tissue sources with the highest ratio contain less than 2 candidate SNP sites or less than 10% of the total candidate SNP sites, the estimation result of the tissue source is considered to be unreliable, and the estimation result is rejected; if the final highest ratio estimation result of the cfDNA to be detected is lower than 15%, or the number of candidate SNP sites is too small, or the final estimation results of the homozygous site and the heterozygous site of the base line sample DNA are obviously different, the high low ctDNA ratio of the cfDNA to be detected is considered to be possible, the heterozygous sites of all base line sample DNA are removed, the filtering condition of the heterozygous sites is relaxed, and the list of the candidate SNP sites is re-extracted and estimated; for part of cfDNA to be detected, when enough candidate SNP sites for prediction are not obtained after the candidate SNP site list is re-extracted, the ctDNA proportion of the cfDNA to be detected is considered to be extremely low, and the extremely low percentage is lower than 2%.
Further, in S2, the performing a statistical test on the mutation of each SNP site in the cfDNA to be tested includes:
the total sequencing depth, the number of mutant base support reads and the mutation frequency of the SNP sites satisfy the distribution represented by the following formula:
AD i ~B(DP i ,VAF i )
wherein, AD i The number of mutant base support reads of the ith SNP site of the sample; DP i Is the total sequencing depth of the ith SNP site of the sample; VAF i Is the mutation frequency of the ith SNP site of the sample; the above formula represents AD i Obey n = DP i ,p=VAF i The binomial distribution of (c);
based on the above probability distribution, the following verification was performed using the binomial test for each SNP site:
1) Whether homozygous in baseline sample DNA, baseline sample mutation frequency =0%,
assuming a background error of 0.01%, baseline sample DNA was examined;
the original assumption is that: VAF i <0.0001;
The alternative assumption is that: VAF i ≥0.0001;
Checking that p-value is greater than 0.05 as above, accepting the original hypothesis that the baseline sample DNA is homozygous at this site;
2) Whether heterozygous in baseline sample DNA, baseline sample mutation frequency =50%;
the heterozygous mutation frequency is 50%;
the original hypothesis is as follows: VAF i =0.5;
The alternative assumption is that: VAF i ≠0.5;
Checking that p-value is greater than 0.05 as above, accepting the original hypothesis that the baseline sample DNA is heterozygous at this site;
3) Whether mutation exists in the cfDNA to be detected, whether the frequency is higher than a background error and a sequencing error, assuming that the background error is 0.01%, and the sample sequencing error of the cfDNA to be detected is a median of mutation frequencies of SNP sites of which all mutation frequencies of the sample are lower than 1%;
the original assumption is that: VAF i <max{0.0001,median(all SNP VAF)};
The alternative assumption is that: VAF i ≥max{0.0001,median(all SNP VAF)};
If the p-value is less than 0.05 through the test, the original hypothesis is rejected, and the cfDNA to be detected is mutated at the site;
4) Whether the cfDNA to be tested is heterozygous or not, the base line sample DNA mutation frequency =50%,
the heterozygous mutation frequency is 50%;
the original assumption is that: VAF i =0.5;
The alternative assumption is that: VAF i ≠0.5;
Detecting that the p-value is more than 0.05 as above, and accepting the original hypothesis that the cfDNA to be detected is heterozygous at the site;
in addition, fisher accurate detection is used for detecting whether the mutation frequency in the cfDNA to be detected is obviously different from that of the base line sample DNA, and the mutation frequency of the cfDNA to be detected is not equal to the DNA mutation frequency of the base line sample:
the original hypothesis is as follows: VAF _ cfDNA i =VAF-baseline i ;
The alternative assumption is that: VAF _ cfDNA i ≠VAF-baseline i 。
If the p-value is less than 0.05 through the test, the original hypothesis is rejected, and the mutation frequency of the cfDNA to be detected is obviously different from that of the baseline DNA sample;
preferably, the preset filtration conditions in S2 are as follows:
reading a polymorphism gene list built in an algorithm, and if polymorphism exists in a gene where a site in an SNP general list to be filtered, rejecting the SNP;
if the depth of the site in the cfDNA to be detected and the DNA of the baseline sample is less than 50x, rejecting the SNP;
if the copy number of the gene with the locus is higher than 2.2 or lower than 1, the SNP is knocked out;
if the site is located within 50bp upstream or downstream of any InDel in the InDel list, removing the SNP;
if the locus is homozygous in the base line sample DNA, the mutation frequency of the cfDNA to be detected is required to be higher than that of the base line sample DNA, and the mutation frequency is obviously different from that of background noise or the base line sample DNA in the detection;
if the locus is heterozygous in the baseline sample DNA, the cfDNA to be detected is required to be not heterozygous, and the mutation frequency is obviously different from that of the cfDNA to be detected.
According to another aspect of the invention, a detection device based on ctDNA fraction of capture sequencing is provided. The device is used for storing or operating the module, or the module is a component of the device; the module is a software module, the number of the software modules is one or more, and the software module is used for executing any one of the detection methods.
Further, the software module includes: the device comprises a to-be-detected cfDNA SNP filtering module, a ctDNA proportion estimation module and a ctDNA proportion detection result visualization module of the to-be-detected cfDNA; or the software module comprises an automation module which integrates the to-be-detected cfDNA SNP filtering module, the ctDNA proportion estimation module of the to-be-detected cfDNA and the ctDNA proportion detection result visualization module.
By applying the technical scheme of the invention, the mutation of the sample to be detected on the homozygous and heterozygous sites in the baseline sample is simultaneously used, so that the usable mutation site information is increased; the mutation homozygosity, heterozygosity and copy number variation conditions of the base line sample and the sample to be detected are detected and filtered by a statistical detection method, so that the reliability of a site finally used for estimating the ratio is ensured; further, the invention considers the possibility that ctDNA comes from a plurality of tumor tissue sources, and verifies the possibility, and simultaneously improves the CNV detection sensitivity and accuracy of plasma ctDNA from a plurality of aspects.
Furthermore, the method carries out targeted SNP site screening on the capture sequencing data of a special sample with low tumor cell ratio, especially a plasma ctDNA sample, and can be used for the tumor cell or ctDNA ratio of a low-purity tissue sample or a plasma sample more sensitively and accurately. The ctDNA gradient dilution cell line test experiment verifies that the method can accurately detect the ctDNA ratio in the mixed sample, has extremely high linear correlation with the dilution gradient, can distinguish different ctDNA sources and give the ratio of each source.
Drawings
The accompanying drawings, which are incorporated in and constitute a part of this application, are included to provide a further understanding of the invention, and are incorporated in and constitute a part of this specification, illustrate embodiment(s) of the invention and together with the description serve to explain the invention and not to limit the invention. In the drawings:
fig. 1 shows a schematic flow chart of a ctDNA ratio detection method based on capture sequencing according to an embodiment of the present invention; and
FIG. 2 is a graph showing the results of identification of sample F-1 and sample F-2 using the plot module in example 1.
Detailed Description
It should be noted that the embodiments and features of the embodiments in the present application may be combined with each other without conflict. The present invention will be described in detail below with reference to the embodiments with reference to the attached drawings.
Abbreviations or terms referred to in the present invention are explained as follows:
ctDNA: circulating tumor DNA, tumor cells actively secrete DNA fragments which have undergone gene mutation into body fluid during division and proliferation.
And (3) PCR: polymerase chain reaction, a technique used to amplify specific DNA fragments.
reads: and (4) sequencing, reading the length, and detecting genome or transcriptome sequence fragments by a sequencer.
fastq: one common type of high-throughput sequencing file is the type of file in which raw sequencing data is stored.
bwa: an alignment method software is used for searching the position of a sequencing sequence in a human gene reference sequence and outputting a bam format result file.
And sam: a sequence alignment format for storing the results of a sequenced sequence back-pasted to a reference genome.
bam: the binary compressed format of sam file is used to store the results of the sequence being pasted back to the reference genome.
SAMtools: a tool for processing bam/sam files.
Picard: a tool for processing high-throughput sequencing data can be used for processing a sam/bam equal ratio result file.
Comparing quality: for quantifying the likelihood of aligning to a wrong location, a higher value indicates a lower likelihood.
VarScan: a tool for processing high throughput sequencing data can be used for identifying SNP and InDel.
Annovar: an annotation tool for SNPs or indels.
cnvkit: a tool for processing high throughput sequencing data can be used to identify copy number variations.
cfDNA gradient dilution samples: obtained by mixing a blood cell DNA sample with a plasma cfDNA sample containing ctDNA, by adjusting the mixing ratio of the samples, a set of samples having different cfDNA proportion to ctDNA proportion was obtained.
Baseline sample: samples containing only normal DNA, typically blood cell DNA samples or normal tissue DNA samples. In the present example, a blood cell DNA sample is used.
Aiming at the technical problems mentioned in the background art, the invention aims to provide the following method or device suitable for ctDNA detection, overcome the defects of low sensitivity, low accuracy, poor stability and the like of the existing software, provide a reliable detection method for ctDNA ratio detection, and provide a result display scheme easy to interpret.
The main technical principle of the invention is as follows: based on capture sequencing, it was possible to capture different ratios of mutant and wild-type support reads in cfDNA versus baseline DNA at the location where the somatic mutation occurred. Firstly, filtering mutation sites, extracting sites with remarkably different mutation frequencies between matched samples as candidate SNP sites, combining the condition of copy number mutation of the region where the sites are located, and determining the mutation types of normal cell DNA and ctDNA. And then, establishing a probability model by using a maximum likelihood method according to the number and copy number of the supported reads of different bases of the candidate SNP sites. And (3) while establishing the model, considering the possibility that the ctDNA comes from a plurality of tumor tissue sources, and finally outputting the ctDNA ratio detection result and the graphical display of the ctDNA ratio and the result in which the mutation unit is in the ctDNA sample.
According to an exemplary embodiment of the present invention, a ctDNA fraction detection method based on capture sequencing is provided. The detection method comprises the following steps: s1, acquiring gene data of capture sequencing of a base line sample DNA and a cfDNA to be tested, and processing the gene data to obtain a mutation list after the base line sample DNA is annotated, a mutation list after the cfDNA to be tested is annotated and a cfDNA copy number variation list to be tested; s2, simultaneously using homozygous and heterozygous sites in the base line sample DNA to perform statistical test on each mutation in the cfDNA to be tested, and selecting sites which have significantly different mutation frequencies between the base line sample DNA and the cfDNA to be tested and meet preset filtering conditions as candidate SNP sites; s3, judging the mutation types of the candidate SNP sites of the normal cell DNA and the ctDNA by combining the copy number mutation condition of the region where the candidate SNP sites are located; and S4, establishing a probability model by using the number and copy number of the support reads of different bases of the candidate SNP sites and using a maximum likelihood method, and calculating the ctDNA ratio through the probability model. The "preset filtering condition" can be set according to actual requirements.
Preferably, the evaluation index of the probability model includes: and performing ctDNA ratio estimation on each candidate SNP site, judging the difference of ctDNA sources, and detecting the ctDNA ratio of the whole cfDNA to be detected.
According to a typical embodiment of the invention, after the ctDNA proportion is calculated by the probability model, a scatter diagram and a probability density distribution diagram are drawn by a visualization module to display the result. In one embodiment of the present invention, a main flow of a ctDNA ratio detection method based on capture sequencing is shown in fig. 1, and mainly includes the following steps: 1. acquiring capture sequencing fastq files of a baseline sample DNA (also called baseline DNA) and cfDNA (possibly plasma cfDNA) to be detected, performing sequence comparison by using a genome comparison tool bwa mem, and performing sequencing and labeling repeated processing on the compared bam files by using SAMtools and Picard tools; 2. obtaining read information arranged according to positions of the processed bam literature by SAMtools, and detecting and annotating SNP and InDel on the arranged mpieup file by VarScan and Annovar to obtain an annotated mutation list of the base line sample DNA and the cfDNA sample to be detected; 3. detecting the copy number of the cfDNA to be detected by using a cnvkit to obtain a copy number variation list; 4. the SNP filtering module is utilized to sort the mutation list annotated by the baseline sample DNA and the cfDNA to be detected and the copy number mutation list of the cfDNA to be detected, select the available mutation sites and output a sorted candidate SNP site list file; 5. analyzing candidate SNP sites by using the ctDNA proportion estimation module, outputting a ctDNA proportion detection result and the source and proportion condition of each candidate SNP site in the ctDNA; 6. by using the detection result visualization module, a scatter diagram and a probability density distribution diagram are drawn according to the detection result to display the result.
Typically, the input file required by the present invention comprises: a mutation list file (txt format, which requires that chromosome, position, reference base type, mutation base type, site sequencing depth, mutation support reads quantity and gene name of each mutation must be contained in a sample to be detected (cfDNA) and a baseline sample DNA after SNP and InDel detection and annotation, and a copy number variation list (cns format, which contains chromosome, copy number variation starting point, termination point, gene name in an interval, copy number variation log2 ratio, interval average depth, probe design quantity in the interval and eight columns of information in weight) obtained after cnvkit analysis of the cfDNA to be detected.
Typically, the output file of the present invention comprises: a candidate mutation list (comprising the depth of the candidate mutation in the baseline sample and the sample to be detected, the number of mutation support reads and the CNV result), a ctDNA detection result file (comprising the ctDNA proportion detection result of the sample to be detected), and a candidate SNP site detection result file (comprising the clone and proportion detection result of part of somatic mutation in the sample to be detected (cfDNA).
In an exemplary embodiment of the present invention, the ctDNA fraction detection device based on capture sequencing mainly comprises the following modules:
sample to be tested SNP filter module (filter module): the module requires input and output file prefixes, output paths, requirements for SNP minimum mutation frequency, mutation list txt files after a sample to be detected and a baseline sample are annotated, and copy number mutation list cns paths obtained after the sample to be detected is analyzed through cnvkit.
The module firstly arranges chromosomes, positions, reference base types, mutant base types and gene names of the mutations of all SNP (single nucleotide polymorphism) of a sample to be detected (cfDNA) according to an input sample mutation list to be detected. And extracting the total sequencing depth, the mutant base support reads number and the mutation frequency of each mutation at the corresponding position in the baseline sample from the input baseline sample mutation list, extracting the copy number of the gene of each mutation in the sample to be detected from the input copy number mutation list, and generating the SNP total table to be filtered containing all the information.
Besides the SNP general table to be filtered, all InDel in the DNA mutation list of the input sample to be detected and the baseline sample are extracted, and the corresponding chromosomes and positions are arranged to generate an InDel list.
After the above steps are completed, statistical tests are performed on the sites in the SNP summary table.
The total sequencing depth of the SNP sites, the number of mutant base support reads and the mutation frequency satisfy the distribution represented by the following formula:
AD i ~B(DP i ,VAF i )
wherein, AD i The number of mutant base support reads of the ith SNP site of the sample; DP i Is the total sequencing depth of the ith SNP site of the sample; VAF i Is the mutation frequency of the ith SNP site of the sample; the above formula represents AD i Obey n = DP i ,p=VAF i The distribution of two terms of (1).
Based on the above probability distribution, the following verification was performed using the binomial test for each SNP site:
(1) Whether homozygous in baseline sample DNA (baseline sample mutation frequency = 0%)
The baseline sample DNA was examined assuming a background error of 0.01%.
The original assumption is that: VAF i <0.0001;
The alternative assumption is that: VAF i ≥0.0001。
The p-value greater than 0.05 was tested as described above, and the baseline sample was homozygous at this site, subject to the original hypothesis.
(2) Whether heterozygous in the baseline sample (baseline sample mutation frequency = 50%)
The frequency of heterozygous mutations was 50%.
The original assumption is that: VAF i =0.5;
An alternative assumption is that: VAF i ≠0.5。
The p-value was tested to be greater than 0.05 as described above, and the baseline sample was heterozygous at this site, subject to the original hypothesis.
(3) Whether the mutation is not background noise or sample sequencing error in the sample to be tested (mutation frequency of the sample to be tested is higher than background noise/sample sequencing error)
Assuming that the background error is 0.01%, the sample sequencing error of the sample to be tested is the median of the mutation frequencies of all the SNP sites of which the mutation frequency is lower than 1%.
The original assumption is that: VAF i <max{0.0001,median(all SNP VAF)};
The alternative assumption is that: VAF i ≥max{0.0001,median(all SNP VAF)}。
The original hypothesis was rejected by testing p-value less than 0.05 as above, and the sample to be tested was mutated at this site.
(4) Whether the sample to be tested is heterozygous (mutation frequency of baseline sample = 50%)
The frequency of heterozygous mutations was 50%.
The original assumption is that: VAF i =0.5;
The alternative assumption is that: VAF i ≠0.5。
The p-value greater than 0.05 was tested as described above, and the test sample was heterozygous at this site, subject to the original hypothesis.
In addition, fisher's exact test is used for testing whether the mutation frequency in the sample to be tested is obviously different from that of the baseline sample (the mutation frequency of the sample to be tested is not equal to that of the baseline sample):
the original hypothesis is as follows: VAF-cfDNA i =VAF-baseline i ;
The alternative assumption is that: VAF-cfDNA i ≠VAF-baseline i 。
Rejecting the original hypothesis by testing a p-value less than 0.05 as described above, the mutation frequency in the test sample was significantly different from the baseline sample.
The filtration conditions were 6 groups in total:
(1) Reading a polymorphism gene list built in an algorithm, and if polymorphism exists in a gene where a site in an SNP general list to be filtered, rejecting the SNP;
(2) If the depth of the site in the sample to be detected and the baseline sample is less than 50x, removing the SNP;
(3) If the copy number of the gene with the locus is higher than 2.2 or lower than 1, the SNP is knocked out;
(4) If the site is located within 50bp upstream or downstream of any InDel in the InDel list, removing the SNP;
(5) If the locus is homozygous in the baseline sample, the mutation frequency of the sample to be detected is required to be higher than that of the baseline sample, and the mutation frequency is obviously different from that of background noise or the baseline sample in the test;
(6) If the locus is heterozygous in the baseline sample, the sample to be tested is required to be not heterozygous, and the mutation frequency is obviously different from that of the sample to be tested.
And after the filtering step is completed, outputting a filtered candidate SNP locus general table. The output path is a given output path, and the prefix of the output file is formulated by the input parameters;
a ctDNA ratio estimation module (estimate module) of a sample to be tested: the module requires an input-output file prefix, an output path, and a candidate mutation list file path of a sample to be tested.
The module judges mutation types of the sites in the base line sample DNA and the ctDNA according to the homozygous/heterozygous condition of the base line sample, the mutation frequencies of the base line sample and the sample to be detected and the copy number of the sample to be detected according to a candidate SNP site general table output by the filtering module. The specific judgment conditions are as follows in table 1:
TABLE 1


Wherein A in the mutation type represents a reference base type, and B represents a mutation base type. The judgment standard of the copy number loss of the sample to be detected is as follows:

in the above formula CN i Is the copy number of the ith candidate SNP site of the sample, CCF i Is the ctDNA ratio corresponding to the ith candidate SNP site of the sample. That is, the criteria for copy number loss vary according to the finally predicted ratio.
For each possibility of the mutation type of the candidate SNP site, the sample to be tested is subjected to given CCF i Theoretical frequency of sudden change of time The calculation can be made according to the following formula in table 2:
TABLE 2
Considering that each candidate SNP site satisfies AD i ~B(DP i ,VAF i ) The distribution represented, for a given CCF i Can substitute the distribution and the theoretical mutation frequency Calculating the position of each site in the CCF i Obtaining the corresponding AD i And DP i The likelihood value of (c). Using the maximum likelihood for each candidate SNP siteMethod, CCF to maximize the likelihood of site i i The ratio is the CCF of the site i And (5) predicting the value. The specific log maximum likelihood formula is:

because the base line sample is homozygous and the copy number of the sample to be detected has no missing site, the ctDNA contained in the sample to be detected can not be determined to contain heterozygous mutation or homozygous mutation, and the CCF of the site can not be accurately calculated only according to the site information i . Aiming at the problem, the invention integrates other sites outside the sites, mutation types and CCF of the sites i And (6) performing prediction.
The Hartigans unimodal test, originally assumed to be unimodal, was first performed on CCFs at other sites:
if the test accepts the original hypothesis, it is assumed that no multimodal distribution is present. Then assuming that the sites are all from the same tumor tissue source, the CCF of all N SNPs is estimated as the maximum likelihood temp :
If the test rejects the original hypothesis that multimodal distribution is present, then CCF for these sites i And (6) clustering. It is assumed that candidate SNP sites clustered into the same cluster are all derived from the same tumor tissue source and have the same CCF j . The number of clusters J of the cluster was confirmed by the gap method. After completion of clustering, N for each cluster j CCF of individual candidate SNP sites j Maximum likelihood estimation is performed separately as CCF j-temp :

Complete tumor tissue origin clustering and CCF of other sites j_temp After the calculation, candidate SN of which mutation type can not be determined is subjected toP sites, whose likelihood values as homozygous mutations, heterozygous mutations and homologous to known cluster are calculated, respectively, and SNPs are classified with a criterion that maximizes the likelihood values:

after the above process is completed, the mutation types and sources of all SNPs are determined.
Adding candidate SNP locus sites of newly determined mutation types and sources, repeating the maximum likelihood estimation process on the candidate SNP locus P of each source cluster to obtain ctDNA source number J and a source-divided ratio prediction result CCF-cluster j 。
And (4) inspecting the ratio prediction result, and judging whether the estimation result is reliable or not and whether the sample has the possibility of low ctDNA ratio or not. The specific judgment method and the solution are as follows:
(1) If the sample contains multiple tumor tissue sources, the highest ratio of tumor tissue sources, and the number of SNP sites contained is less than 2 or less than 10% of the total number of SNPs, the estimation result of the tissue source is not reliable. Rejecting the estimation result;
(2) If the final highest percentage estimation result of the sample is less than 15%, or the number of SNPs is too small (wherein the criterion of "too small number" of candidate SNP sites can be adjusted according to the difference of the sequencing data, for example, in an embodiment of the present invention, too small number of candidate SNP sites means that when the candidate SNP sites included in the main tumor tissue source are less than 2 heterozygous sites in the baseline sample DNA, or any one of the homozygous sites in the baseline sample DNA is less than 2 heterozygous sites), or the homozygous sites of the baseline sample is significantly different from the final estimation result of the heterozygous sites, it is considered that the sample to be tested has a higher low ctDNA percentage. And (4) rejecting heterozygous sites of all baseline samples, properly relaxing filtering conditions of the heterozygous sites, re-extracting the SNP list and estimating.
(3) For some samples, when sufficient SNPs for prediction are not obtained after extracting the SNP list again, the ctDNA ratio of the sample is considered to be very low (less than 2%).
After all the analysis steps are completed, outputting the final ctDNA source quantity J and the ratio prediction result CCF-cluster of the branch sources j Outputting a SNP list ordered according to chromosomes and positions as a prediction result file two for the prediction result file one, wherein the SNP list comprises ctDNA sources and CCFs corresponding to each SNP i . The output path is a given output path, and the prefix of the output file is specified by the input parameters;
a test result visualization module (plot module) of the sample to be tested: the module requires the path of the ctDNA ratio estimation result list corresponding to the input and output file prefix and the candidate mutation site and the result file path containing the ctDNA source number and the ctDNA ratio of the sample to be detected.
The module firstly estimates the belonged source and CCF of each SNP provided in the second output file according to the ctDNA ratio i Drawing CCF according to source i Probability density distribution graph, wherein different sources are shown using different colors.
And drawing a scatter diagram to display the CCF of each SNP by taking the SNP mutation position as a horizontal axis (sorting according to chromosome and position) and the ctDNA ratio corresponding to the site as a vertical axis according to the result i And drawing a horizontal straight line according to the CCF-cluster of each ctDNA source provided by the first ctDNA ratio estimation module output file, and reflecting the height of each source ratio. Also, different traits or colors are used in the figure to demonstrate different sources.
Finally, the two pictures are output as pdf-formatted pictures in a left-right parallel display mode, and the detection result is visually displayed, so that the detection result is conveniently explained. The output path is consistent with the path of the input file, and the prefix of the output file is specified by the input parameter; automated ctDNA proportion analysis module (autocall): the method integrates the SNP filtering module (filter module) of the sample to be detected, the ctDNA ratio estimation module (estimate module) of the sample to be detected and the visual module (plot module) of the detection result of the sample to be detected, can complete all detection steps at one time by inputting the information required by all the three modules at one time, and outputs all output files.
In one embodiment of the present invention, two detection operation modes are provided: the first method is that a sample to be detected SNP filtering module (filter module), a sample to be detected ctDNA ratio estimation module (estimate module) and a ctDNA ratio detection result visualization module (plot module) are respectively operated; the second is to run an automated ctDNA proportion detection module (autocall module) that integrates the three modules described above.
The advantageous effects of the present invention will be further described with reference to examples.
Example 1
1. Preparation of samples
Blood cell DNA and cfDNA samples of 6 tumor patients (respectively labeled as sample a, sample B, sample C, sample D, sample E, and sample F) were selected and subjected to the following operations:
1) Purification and quantification of cfDNA
And (3) performing 2100 quality inspection on the cfDNA in the 6 to-be-detected samples to see whether large fragments exist. Purifying the cfDNA sample containing the large fragments, purifying the cfDNA sample by using 0.5-time magnetic beads due to the characteristic that the magnetic beads firstly adsorb the large fragments, adsorbing the large fragments on the magnetic beads at the moment, absorbing supernate into 2.5-time magnetic beads, and recovering all products except the large fragments. Qubit quantification was performed on all samples.
2) Purification and quantification of blood cell DNA
Taking a sufficient amount of 6 pairs of blood cell DNA in a sample to be detected, breaking the blood cell DNA into DNA fragments of about 200bp by covaris ultrasound, and carrying out qubit quantification on the fragmented blood cell DNA by judging whether the size of the fragments is proper or not by 2100 quality inspection.
Preparation of cfDNA gradient samples
Using the above 6 pairs of samples, dilutions were performed according to the gradient described in table 3 below for a total of 32 samples, with 2 replicates of the original cfDNA sample and the gradient diluted sample, except for the blood cell DNA sample as the reference sample:
TABLE 3

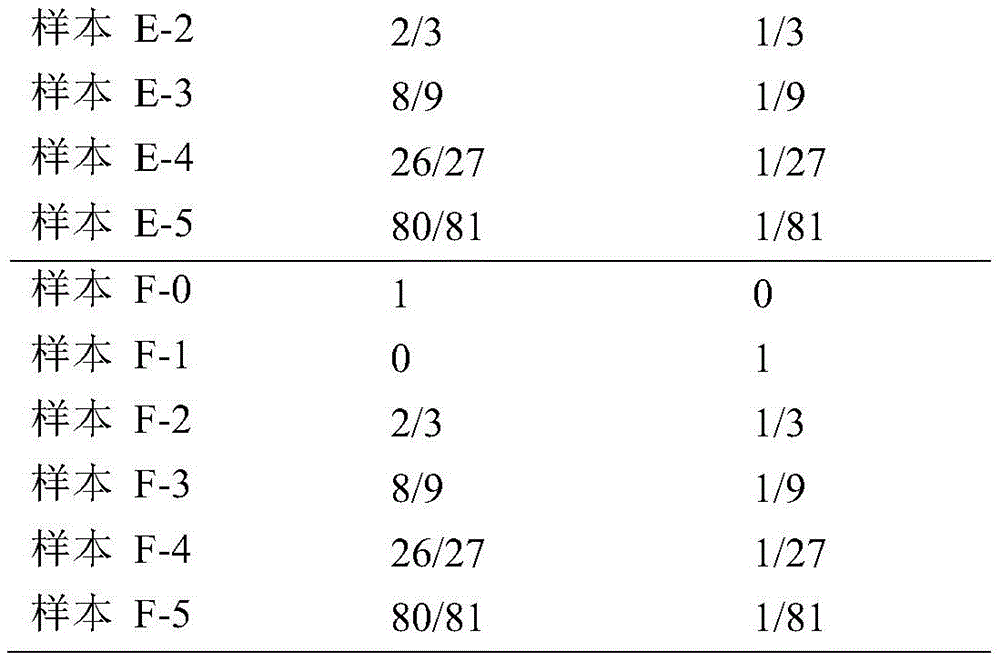
Since the initial amount required for pooling was 20ng, at least 60ng of each concentration gradient was prepared and diluted in duplicate in order to ensure that the samples prepared were able to be run in duplicate. And fully and uniformly mixing the samples diluted each time, and then diluting the subsequent samples. The dilution procedure was as follows:
1) Preparation of 1/3 original cfDNA mutation frequency sample
60ng of broken blood cell DNA is added into 30ng of cfDNA, namely the stock solution is diluted by 3 times to obtain a 90ng 1/3 original mutation frequency sample, and because the 30ng of the frequency sample is required to be used in subsequent dilution, the 60ng 1/3 original mutation frequency sample is remained finally.
2) Preparation of 1/9 original cfDNA mutation frequency sample
Adding 60ng of broken blood cell DNA into 30ng 1/3 of the original mutation frequency sample, namely diluting by 3 times to obtain 90ng 1/9 of the original mutation frequency sample, and finally, because 30ng of the frequency sample is needed to be used in subsequent dilution, 60ng 1/9 of the original mutation frequency sample remains.
3) Preparation of 1/27 original cfDNA mutation frequency sample
Adding 60ng of broken blood cell DNA into 30ng 1/9 of original mutation frequency samples, namely diluting by 3 times to obtain 90ng 1/27 of original mutation frequency samples, and finally leaving 70ng 1/27 of original mutation frequency samples because 20ng of the frequency samples are needed in subsequent dilution.
4) Preparation of 1/81 original cfDNA mutation frequency sample
The sample was diluted 3 times by adding 40ng of disrupted blood cell DNA to the sample at 20ng 1/27 of the original mutation frequency to obtain a 60ng 1/81 sample at the original mutation frequency.
Library construction, capture, and sequencing of cfDNA gradient samples
20ng of fragmented DNA was used as an initial amount to construct a library using KAPA hyper prediction kit (Roche), and the library was obtained by end repair, 3' end addition of polyA, ligation of a sequencing linker, unbiased amplification, and purification. The details are as follows:
1) Blunt ended and added with A at the 3' end
The reaction system is shown in table 4:
TABLE 4
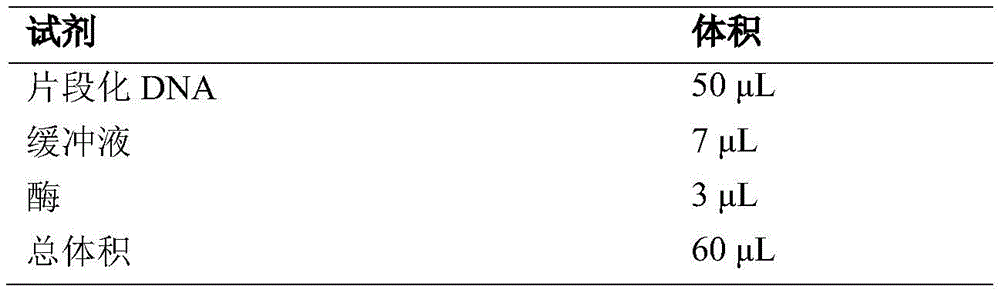
The buffer and enzyme should be mixed in the EP tube, vortexed and mixed with the DNA and reacted as shown in Table 5:
TABLE 5

This step of operation sets the PCR tube lid temperature to 85 ℃ instead of 105 ℃. If the next experiment is performed immediately after the end of the run, the end temperature should be set at 20 deg.C instead of 4 deg.C
2) Connecting joint
A linker of 7.5. Mu.M was used for 20ng of DNA. The reaction system was formulated as follows:
TABLE 6

The buffer and enzyme should be mixed well in an EP tube in advance, centrifuged after vortexing, and incubated at 20 ℃ for 15 minutes.
3) Post-ligation purification
Adding 88 mu L of Agencour AMPure XP purified magnetic beads into the reaction system in the previous step, fully vortexing and shaking, and slightly centrifuging. Adsorbing for 5-15 min at room temperature to make DNA and magnetic beads fully combined. The EP tube was placed on a magnetic stand until the liquid was clear and the supernatant was slowly discarded. 200 μ L of 80% ethanol was added, incubated for 30 seconds, and the ethanol in the EP tube was slowly discarded. The ethanol washing was repeated once. Drying the EP tube at room temperature for 3-5 minutes until the ethanol is completely volatilized. The EP tube was removed from the magnetic stand, 22. Mu.L of ultrapure water was added, vortexed, and incubated at room temperature for 2 minutes to elute the DNA. The EP tube was placed on a magnetic stand until the liquid cleared, the supernatant was transferred to a new EP tube, 1. Mu.L of the supernatant was taken for DNA concentration determination, and the remainder was subjected to library amplification.
4) PCR amplification
The PCR system was formulated as follows:
TABLE 7

After sufficient shaking, the mixture was rapidly centrifuged, and PCR was performed under the following conditions of Table 8:
TABLE 8

5) Purification after amplification
Adding 50 mu L of Agencour AMPure XP purified magnetic beads into the reaction system in the previous step, fully whirling and oscillating, and slightly centrifuging. Adsorbing for 5-15 min at room temperature to make DNA and magnetic beads fully combined. The EP tube is placed on a magnetic frame until the liquid is clear, and the supernatant is slowly discarded. 200 μ L of 80% ethanol was added, incubated for 30 seconds, and the ethanol in the EP tube was slowly discarded. The ethanol washing was repeated once. Drying the EP tube at room temperature for 3-5 minutes until the ethanol is completely volatilized. The EP tube was removed from the magnetic stand, 52. Mu.L of ultrapure water was added, vortexed, and incubated at room temperature for 2 minutes to elute the DNA. And (3) placing the EP tube on a magnetic frame to be adsorbed until the liquid is clear, transferring the supernatant to a new EP tube, taking 1 mu L of the supernatant to measure the DNA concentration, and obtaining the rest library.
Capture and sequencing of cfDNA gradient samples
1) Library Capture
Reagents were added to a new 1.5ml centrifuge tube in the order required in table 9 below:
TABLE 9

The sample size was calculated from the number of libraries, and if 1 capture sample was added to 6 libraries, 167ng would have to be added to each library.
Blowing and beating with a pipette, sealing the EP tube with a sealing film, inserting a plurality of small holes on the film, and drying with a vacuum centrifugal concentrator at 60 deg.C and 1350r/min until the liquid is completely evaporated. After the liquid was evaporated to dryness, the components as shown in table 10 below were added:
watch 10

Vortex, shake and mix well, centrifuge briefly to remove tube wall residue. The DNA was denatured by incubation at 95 ℃ for 10 min in a thermostatted metal bath and centrifuged briefly to remove residual tube wall. Transfer the hybridization mixture to a new PCR tube with a pipette, add 4.5. Mu.l probe, vortex, shake, mix well, and centrifuge briefly to remove wall residue. Incubating for 16-20 hours at 47 ℃ in a PCR instrument, and setting the temperature of a heating cover of the PCR instrument to be more than 57 ℃.
2) Trapped product rinse
The elution buffer was diluted as in table 11 below:
TABLE 11

Repeating the steps once.
Add 100. Mu.l of 1 Xmagnetic bead elution buffer to the tube and mix it by vortexing. The EP tube was placed on a magnetic rack and adsorbed until the liquid cleared, and the supernatant was aspirated off with a pipette.
Repeating the steps once.
Add 100. Mu.l of 1 Xmagnetic bead elution buffer to the tube and mix it by vortexing. The EP tube was placed on a magnetic rack until the liquid cleared, and the supernatant was aspirated off with a pipette. Add 15. Mu.l of capture product to the magnetic bead centrifuge tube, pipette well and incubate at 47 ℃ for 45 minutes. Vortex for 3 seconds at 15 minute intervals to keep the beads in suspension. Add 100. Mu.l of 1 Xelution buffer I preheated at 47 ℃ to the centrifuge tube, vortex and mix well. The EP tube was placed on a magnetic rack and adsorbed until the liquid cleared, and the supernatant was aspirated off with a pipette. The tube was removed from the magnetic stand and 200. Mu.l of 47 ℃ preheated 1 Xelution buffer IV was added and mixed by pipetting. Incubate at 47 ℃ for 5 minutes in a constant temperature metal bath.
Repeating the steps once.
The EP tube was placed on a magnetic rack until the liquid cleared, and the supernatant was aspirated off with a pipette. The tubes were removed and 200. Mu.l of unheated 1 Xelution buffer I was added to each tube in sequence and vortexed for 2 minutes. The EP tube was placed on a magnetic rack and adsorbed until the liquid cleared, and the supernatant was aspirated off with a pipette. The centrifuge tubes were removed, 200. Mu.l of 1 Xelution buffer II were added to each tube in sequence, and vortexed for 1 minute. The EP tube was placed on a magnetic rack and adsorbed until the liquid cleared, and the supernatant was aspirated off with a pipette. The tubes were removed and 200. Mu.l of 1 Xelution buffer III was added to each tube in sequence and vortexed for 30 seconds. The EP tube was placed on a magnetic rack and adsorbed until the liquid cleared, and the supernatant was aspirated off with a pipette. The centrifuge tube was removed, 40. Mu.l of water was added, and the mixture was pipetted and mixed.
3) Amplification of captured products
To the above 40. Mu.L of the mixture was added the components shown in Table 12 below:
TABLE 12

Vortex, shake and mix well, dispense 50 μ l/tube into two new PCR tubes, amplify according to the reaction program shown in Table 13 below:
watch 13

4) Purification of the captured product
Repeating the steps once, and standing for 3-5 minutes at room temperature until the ethanol is completely volatilized.
The EP tube was removed from the magnetic stand, 52. Mu.L of ultrapure water was added, vortexed, and incubated at room temperature for 2 minutes to elute the DNA. And (4) placing the EP tube on a magnetic frame to be adsorbed until the liquid is clear, and transferring the supernatant to a new EP tube to obtain the captured product.
The DNA concentration was measured by taking 1. Mu.L.
5) Sequencing
1. Processing offline fastq data into input files usable by each software
After downloading data, firstly processing the downloaded data from the fastq file into a bam file, wherein the specifically used software and steps are as follows:
1) Comparison of
Calling bwa-0.7.12mem to compare each pair of fastq files as paired Reads to the hg19 human reference genome sequence, and generating an initial bam file without using other parameter options except-M parameters and IDs of specified Reads groups;
2) Sorting
Calling a SortSam module of Picard-2.1.0, sorting the initial bam files according to chromosome positions, and setting parameters to be 'SORT _ ORDER = coordinate';
3) Screening
SAMtools-1.3 view is called to screen the sorted bam files, and '-F0 x 900' is used as a parameter.
4) Repeat of mark
Calling a MarkDuplicates module of Picard-2.1.0 to mark the repeated sequence in the screened bam file, filtering the repeated sequence during subsequent analysis, and analyzing by using the data after duplication removal;
5) Building an index
And calling an index module of SAMtools-1.3 to establish an index for the finally generated bam file, and generating a bai file matched with the bam file after the marking is repeated.
6. Detection of ctDNA fraction of cfDNA gradient samples with other software
1)FACETS
In the detection, a sample A-0, a sample B-0, a sample C-0, a sample D-0, a sample E-0 and a sample F-0 (namely, a blood cell DNA sample of 6 patients) are respectively used as reference samples, and a bam file of the reference sample corresponding to the sample to be detected, a bed file of a capture interval according to records in advance and a fasta file of a human reference genome sequence are used as input files. Firstly, using an mpileup module of SAMtools to generate an mpileup file according to a bam file, a bed file and a fasta file of a human reference genome sequence of each sample; generating a mutation list vcf file of each sample according to the mpileup file by using an mpileup2cns module of VarScan; generating a snpmat file for FACETS by using the vcf file of the sample to be detected and the corresponding reference sample; finally, the tumor purity (in this example, the ratio of ctDNA to the sample to be tested) and the chromosome ploidy of the sample are predicted by using FACETS. The default parameters of the software are used when setting the parameters. The specific tumor purity and chromosomal ploidy results for each sample are shown in table 14 below:
TABLE 14

Wherein the theoretical ctDNA ratio is obtained by calculating the mean value of the tumor purities of two samples with the cfDNA ratio of 1 by the cfDNA ratio; samples that failed to detect tumor purity were labeled with "-", and when R-square was calculated, it was processed at 0% and correlation was calculated against cfDNA.
In addition, the technology of the same sample is repeated twice, and the correlation coefficient of the ratio result of ctDNA obtained by FACETS estimation is 0.8951.
The detection result of FACETS on the ploidy of the chromosome is relatively accurate, but the detection accuracy on the purity of the tumor is extremely low. When a sample with a high ctDNA ratio is detected, the detection result of facts is low, and when a sample with a low ctDNA ratio is detected, most samples cannot give a detection result, and the detection result of few samples is high.
2)PureCN
In the detection, a sample A-0, a sample B-0, a sample C-0, a sample D-0, a sample E-0 and a sample F-0 (namely, blood cell samples of 6 patients) are respectively used as reference samples, and a bam file of the reference sample corresponding to the sample to be detected and the sample, a capture information interval file generated in advance from a bed file recording a capture interval, a fasta file recording a human reference genome sequence and a bigWig file are used as input files. Firstly, generating a coverage file by using a coverage module of PureCN by using a bam file and a capture information interval file of each sample; generating an SNP list vcf file for bams of each sample to be detected and a reference sample by using a mutect software; and finally, detecting the tumor purity and the chromosome ploidy of each sample to be detected by using the coverage files of the sample to be detected and the corresponding reference sample and the vcf file of the sample to be detected through PureCN, and setting the parameters by using the default parameters of the software. The specific tumor purity and chromosomal ploidy results for each sample are shown in table 15 below:
watch 15


Wherein the theoretical ctDNA ratio is calculated by multiplying the mean value of the tumor purities of two samples with the cfDNA ratio of 1 by the cfDNA ratio. In addition, the same sample is subjected to two technical repetitions, and the correlation coefficient of the ctDNA ratio estimated by PureCN is 0.5850.
PureCN obviously has high chromosome ploidy prediction on all samples, has poor consistency on the detection result of the same sample, has high tumor purity prediction on low-concentration plasma dilution samples, and is not suitable for detecting samples with low ctDNA ratio.
7. Detection of ctDNA proportion of cfDNA gradient sample by using the method
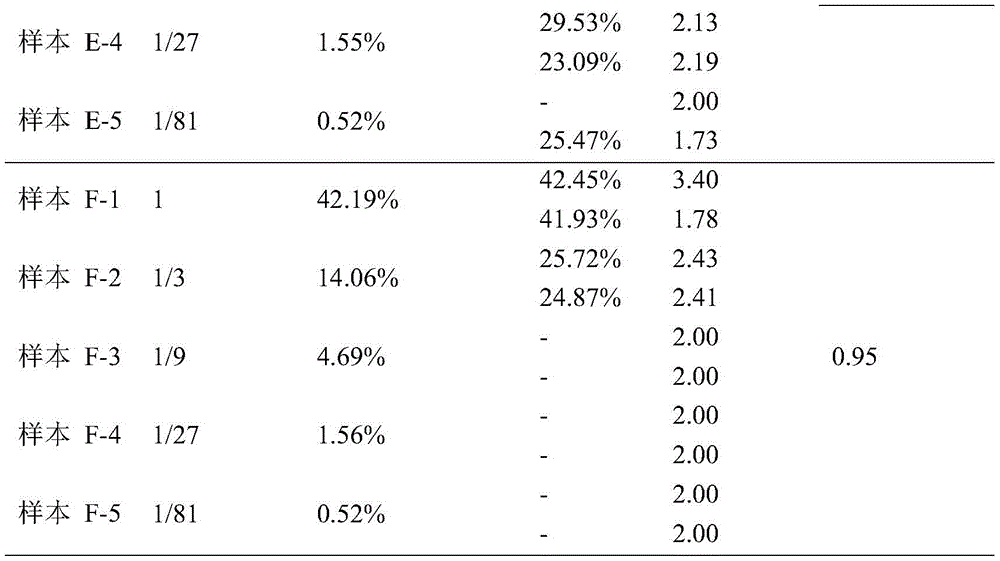
In the detection, a sample A-0, a sample B-0, a sample C-0, a sample D-0, a sample E-0 and a sample F-0 (namely, blood cell samples of 6 patients) are respectively used as reference samples, and a bam file of the reference sample corresponding to the sample to be detected and a fasta file of a human reference genome sequence are used as input files. Firstly, using an mpileup module of SAMtools to generate an mpileup file according to a bam file, a bed file and a fasta file of a human reference genome sequence of each sample; generating a mutation list vcf file of each sample according to the mpileup file by using an mpileup2cns module of VarScan, and annotating the vcf file by using Annovar software; in addition, a cnvkit is used, and an input file is used for obtaining a copy number variation result cns file of the sample to be detected; the annotated mutation list file and the cns file are in the format required by the invention, and are respectively used as input files of the invention, and are detected by using an autocall module, and the detection results of each concentration gradient sample are shown in the following table 16:
TABLE 16


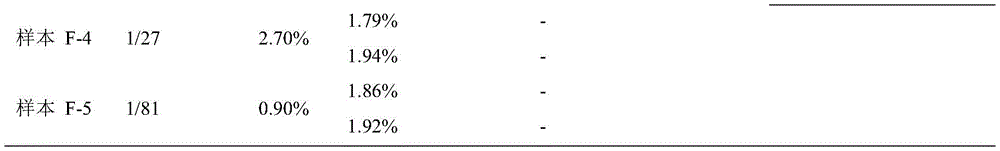
Wherein the theoretical ctDNA ratio is calculated by multiplying the mean value of the ratio of the main tumor sources of the two samples with the cfDNA ratio of 1 by the cfDNA ratio.
With the technical solution of the present invention (see the detailed description section in particular), the results are accurate for samples with high ctDNA ratio or low ctDNA ratio, and the linear relationship with the dilution gradient is very obvious, and R-square of all 6 groups of samples exceeds 0.9. The ctDNA ratio of the sample can be stably detected even if the sample is diluted by 1/81. In addition, the technology of the same sample is repeated twice, the ctDNA ratio estimated by the method has the correlation coefficient of 0.9985, and the consistency of the detection result is high.
Compared with other tumor cell ratio detection software, the technical scheme of the invention is more stable, has higher sensitivity for detecting high and low ratio samples, has higher consistency with the theoretical ctDNA ratio and lower detection lower limit, can output the ratios of different ctDNA sources, and is more suitable for the detection of ctDNA.
The plot of the detection results of the samples F-1 and F-2 is shown by plot using plot module, as shown in FIG. 2.
Wherein the abscissa of the right scatter plot represents the position of the corresponding SNP (sorted by chromosome and position), the ordinate represents the ratio detection result corresponding to the SNP, the horizontal line represents the ratio of the ctDNA source (shown as cluster in the figure), and the color or shape represents different ctDNA sources. The left graph is the probability density distribution graph of the detection result according to the SNP and the corresponding proportion in the right graph.
It can be seen from fig. 2 that the fractional detection result of each ctDNA source (shown as cluster in the figure) of the 1/3 dilution gradient sample is linearly related to the undiluted sample, and the SNP distribution contained in each source is relatively consistent.
From the above description, it can be seen that the above-described embodiments of the present invention achieve the following technical effects:
1) And simultaneously, carrying out statistical test on each mutation by using homozygous and heterozygous sites in the DNA of the baseline sample, and using strict screening standards to ensure that all the sites selected for calculating the ctDNA ratio are reliable sites. Currently, the detection of tumor proportion is mainly performed by using mutation information of a baseline sample and a sample to be detected. To avoid confounding low frequency somatic mutations with background noise, homozygous sites in the baseline sample are typically removed by the detection software. Although this approach can eliminate the effect of background noise on the result, it also wastes a lot of available information and seriously affects the accuracy when detecting low concentration samples. The invention effectively distinguishes the low-frequency mutation from the background noise by using a statistical test method, keeps more effective information while avoiding the influence of the background noise on the detection result, and improves the sensitivity of the detection method. In addition, the present invention eliminates mutations due to polymorphisms by further filtering the mutations using a built-in list of polymorphic genes.
2) Only the copy number stable or copy number missing regions are used for the estimation. The existing detection software generally detects the tumor proportion and does not limit the copy number of the mutation region. However, the situation of the copy number amplification region is complex, and a large uncertainty is introduced, so that the estimation effect of a subsequent probability model is influenced. The invention eliminates the mutation of the copy number amplification region, reduces the uncertainty, and simplifies the subsequent detection steps without reducing the accuracy of the model.
3) And (3) using a maximum likelihood method, judging the difference between the ratio estimation of ctDNA and the ctDNA source of each effective mutation, and detecting the ratio condition of the whole ctDNA of the sample to be detected. Since ctDNA is derived from multiple tumor tissues, each mutation may be from a different tumor tissue, and the corresponding ctDNA fraction may vary.
The above description is only a preferred embodiment of the present invention and is not intended to limit the present invention, and various modifications and changes may be made by those skilled in the art. Any modification, equivalent replacement, or improvement made within the spirit and principle of the present invention should be included in the protection scope of the present invention.
Claims (10)
1. A ctDNA proportion detection method based on capture sequencing is characterized by comprising the following steps:
s1, acquiring gene data of capture sequencing of a base line sample DNA and a cfDNA to be tested, and processing the gene data to obtain a mutation list after the base line sample DNA is annotated, a mutation list after the cfDNA to be tested is annotated and a cfDNA copy number variation list to be tested;
s2, performing statistical test on each mutation in the cfDNA to be detected by using the homozygous and heterozygous sites in the baseline sample DNA, and selecting sites which have significantly different mutation frequencies between the baseline sample DNA and the cfDNA to be detected and meet preset filtering conditions as candidate SNP sites;
s3, judging the mutation types of the candidate SNP sites of the normal cell DNA and the ctDNA by combining the copy number mutation condition of the region where the candidate SNP sites are located; and
s4, establishing a probability model by using the number and copy number of support reads of different bases of the candidate SNP site and a maximum likelihood method, and calculating to obtain a ctDNA ratio through the probability model;
the judgment criteria used in S3 are shown in table 1 below:
TABLE 1

Wherein A in the mutation type represents a reference base type, B represents a mutation base type, and the judgment standard of the cfDNA copy number deletion to be detected is as follows:

in the above formula CN i Is the ith candidate SNP site of the sampleCopy number of dots, CCF i And (3) the ctDNA proportion corresponding to the ith candidate SNP site of the sample, namely, the standard of the cfDNA copy number deletion to be detected is changed along with the change of the ctDNA proportion predicted finally.
2. The detection method according to claim 1, wherein the evaluation index of the probability model comprises: and performing ctDNA ratio estimation on each candidate SNP site, judging the difference of the ctDNA sources, and detecting the ctDNA ratio of the whole cfDNA to be detected.
3. The detection method according to claim 1, wherein a scatter diagram and a probability density distribution diagram are drawn by a visualization module after the ctDNA proportion is calculated by the probability model, and the result is displayed.
4. The method of claim 1, wherein the cfDNA to be tested is at a given CCF for each likelihood of mutation type of the candidate SNP site i Theoretical frequency of mutation of hour Calculated according to the formula in table 2 below:
TABLE 2

The total sequencing depth, the number of mutant base supported reads and the mutation frequency of the candidate SNP sites satisfy the distribution represented by the following formula:
AD i ~B(DP i ,VAF i )
wherein, AD i Is the number of mutant base support reads of the ith candidate SNP site of the sample; DP i Is the total sequencing depth of the ith candidate SNP site in the sample; VAF i Is the mutation frequency of the ith candidate SNP site of the sampleRate; the above formula represents AD i Obey n = DP i ,p=VAF i The second distribution of (a); for a given CCF i Substituting the distribution into the theoretical mutation frequency Calculating the position of each site in the CCF i Obtaining the corresponding AD i And DP i The likelihood value of (d); a CCF for maximizing the i likelihood value of the site by using a maximum likelihood method for each candidate SNP site i The ratio is the CCF of the site i The specific log maximum likelihood formula is as follows:

5. the detection method according to claim 4, wherein the step S3 further comprises: mutation types and CCF of sites which are homozygous for the candidate SNP sites of the baseline sample DNA and have no deletion in the copy number of the cfDNA to be detected i The prediction specifically comprises the following steps:
s31, performing Hartigans unimodal test with the original hypothesis of unimodal distribution on CCFs of other sites except the sites which are homozygous for the candidate SNP site of the base line sample DNA and have no deletion in the copy number of the cfDNA to be detected:
if the test accepts the original hypothesis, and the multimodal distribution does not exist, assuming that the part of the sites are all from the same tumor tissue source, carrying out maximum likelihood estimation on CCF of all N candidate SNP sites to be used as CCF temp :

If the test rejects the original hypothesis that a multimodal distribution exists, then CCF for these sites i Clustering was performed assuming that the candidate SNP sites clustered into the same cluster are all fromThe same tumor tissue source and the same CCF j (ii) a The number J of the clustered clusters is confirmed by a gap method; after completion of clustering, N for each cluster j CCF of each candidate SNP locus j Maximum likelihood estimation is performed separately as CCF j_temp :

S32, finishing the tumor tissue source clustering and CCF of other sites j_temp After the calculation, for the candidate SNP sites for which the mutation type cannot be determined, the likelihood values of the candidate SNP sites as homozygous mutation, heterozygous mutation and homologous to known cluster are calculated respectively, and the candidate SNP sites are classified according to the criterion of maximizing the likelihood values:
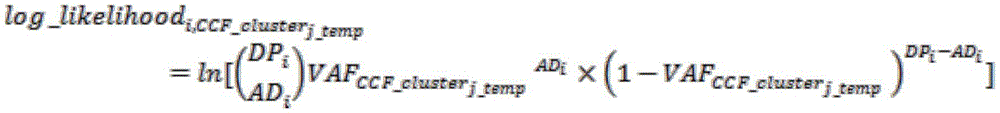
after the processes of S31 and S32 are completed, the mutation types and the sources of all the candidate SNP sites are determined;
adding the candidate SNP sites of newly determined mutation types and sources, repeating the maximum likelihood estimation process on the candidate SNP sites of each source cluster to obtain the ctDNA source number J and the ratio prediction result CCF _ cluster of the branch sources j 。
6. The detection method according to claim 5, further comprising a step of checking the result of the comparison prediction, specifically comprising:
if the cfDNA to be detected contains a plurality of tumor tissue sources and the highest-ratio tumor tissue source and the number of the candidate SNP sites contained in the cfDNA is less than 2 or less than 10 percent of the total number of the candidate SNP sites, the estimation result of the tissue source is considered to be unreliable, and the estimation result is rejected;
if the final highest percentage estimation result of the cfDNA to be detected is lower than 15%, or the number of the candidate SNP sites is too small, or the final estimation results of the homozygous sites and the heterozygous sites of the base line sample DNA are obviously different, the cfDNA to be detected is considered to have higher low percentage of the ctDNA, all the heterozygous sites of the base line sample DNA are removed, the filtering conditions of the heterozygous sites are relaxed, and the list of the candidate SNP sites is re-extracted and estimated;
and regarding part of the cfDNA to be detected, when enough candidate SNP sites for prediction are not obtained after the candidate SNP site list is re-extracted, considering that the ctDNA proportion of the cfDNA to be detected is extremely low, wherein the extremely low is lower than 2%.
7. The detection method according to claim 1, wherein in the step S2, the performing a statistical test on the mutation of each SNP site in the cfDNA to be detected comprises:
the total sequencing depth, the number of mutant base support reads and the mutation frequency of the SNP sites satisfy the distribution represented by the following formula:
AD i ~B(DP i ,VAF i )
wherein, AD i The number of mutant base support reads of the ith SNP site of the sample; DP i Is the total sequencing depth of the ith SNP site of the sample; VAF i Is the mutation frequency of the ith SNP site of the sample; the above formula represents AD i Obey n = DP i ,p=VAF i The second distribution of (a);
based on the above two distributions, the following verification was performed for each SNP site using the two-item test:
1) Whether homozygous in the baseline sample DNA, baseline sample mutation frequency =0%,
testing the baseline sample DNA assuming a background error of 0.01%;
the original hypothesis is as follows: VAF i <0.0001;
The alternative assumption is that: VAF i ≥0.0001;
Accepting the original hypothesis if the p-value is greater than 0.05, the baseline sample DNA is homozygous at that site;
2) Whether heterozygous in the baseline sample DNA, baseline sample mutation frequency =50%;
the heterozygous mutation frequency is 50%;
the original hypothesis is as follows: VAF i =0.5;
An alternative assumption is that: VAF i ≠0.5;
Accepting the original hypothesis that the baseline sample DNA is heterozygous at the site if the p-value is greater than 0.05;
3) Whether mutation exists in the cfDNA to be detected, whether the frequency is higher than a background error and a sequencing error, assuming that the background error is 0.01%, wherein the sample sequencing error of the cfDNA to be detected is a median of mutation frequencies of SNP sites of which all mutation frequencies of the sample are lower than 1%;
the original assumption is that: VAF i <max{0.0001,median(all SNP VAF)};
The alternative assumption is that: VAF i ≥max{0.0001,median(all SNP VAF)};
If the p-value is detected to be less than 0.05, rejecting the original hypothesis, wherein the cfDNA to be detected is mutated at the site;
4) Whether it is heterozygous in the cfDNA to be tested, the baseline sample DNA mutation frequency =50%, and the heterozygous mutation frequency is 50%;
the original assumption is that: VAF i =0.5;
The alternative assumption is that: VAF i ≠0.5;
If the p-value is detected to be more than 0.05, the original hypothesis is accepted, and the cfDNA to be detected is heterozygous at the site;
in addition, a Fisher precise test is used for testing whether the mutation frequency in the cfDNA to be tested is significantly different from the base line sample DNA, wherein the mutation frequency of the cfDNA to be tested is not equal to the base line sample DNA mutation frequency:
the original assumption is that: VAF _ cfDNA i =VAF_baseline i ;
The alternative assumption is that: VAF _ cfDNA i ≠VAF_baseline i ;
Rejecting the original hypothesis if the p-value is less than 0.05, the mutation frequency of the cfDNA to be tested is significantly different from the baseline sample DNA.
8. The detection method according to claim 7, wherein the preset filtering conditions in S2 are as follows:
reading a polymorphism gene list built in an algorithm, and if polymorphism exists in a gene where a site in an SNP general list to be filtered, rejecting the SNP;
if the depth of the site in the cfDNA to be detected and the base line sample DNA is less than 50x, rejecting the SNP;
if the copy number of the gene at the locus is higher than 2.2 or lower than 1, the SNP is knocked out;
if the locus is positioned within 50bp of the upstream or downstream of the position of any InDel in the InDel list, removing the SNP;
if the locus is homozygous in the baseline sample DNA, the mutation frequency of the cfDNA to be detected is required to be higher than that of the baseline sample DNA, and the mutation frequency is obviously different from background noise or the baseline sample DNA in the test;
if the locus is heterozygous in the baseline sample DNA, it is required that the cfDNA to be tested is not heterozygous and the mutation frequency is significantly different from the cfDNA to be tested.
9. A ctDNA fraction detection device based on capture sequencing, characterized in that the device is used for storing or running modules, or the modules are part of the device; wherein the module is a software module, the software module is one or more, and the software module is used for executing the detection method according to any one of claims 1 to 8.
10. The detection apparatus according to claim 9, wherein the software module comprises: the system comprises a to-be-detected cfDNA SNP filtering module, a ctDNA proportion estimation module and a ctDNA proportion detection result visualization module, wherein the to-be-detected cfDNA SNP filtering module is used for estimating the ctDNA proportion of the to-be-detected cfDNA; or
The software module comprises an automation module which integrates the to-be-detected cfDNA SNP filtering module, the ctDNA proportion estimation module of the to-be-detected cfDNA and the ctDNA proportion detection result visualization module.
Priority Applications (1)
| Application Number | Priority Date | Filing Date | Title |
|---|---|---|---|
| CN201910049677.7A CN109887548B (en) | 2019-01-18 | 2019-01-18 | ctDNA ratio detection method and detection device based on capture sequencing |
Applications Claiming Priority (1)
| Application Number | Priority Date | Filing Date | Title |
|---|---|---|---|
| CN201910049677.7A CN109887548B (en) | 2019-01-18 | 2019-01-18 | ctDNA ratio detection method and detection device based on capture sequencing |
Publications (2)
| Publication Number | Publication Date |
|---|---|
| CN109887548A CN109887548A (en) | 2019-06-14 |
| CN109887548B true CN109887548B (en) | 2022-11-08 |
Family
ID=66926287
Family Applications (1)
| Application Number | Title | Priority Date | Filing Date |
|---|---|---|---|
| CN201910049677.7A Active CN109887548B (en) | 2019-01-18 | 2019-01-18 | ctDNA ratio detection method and detection device based on capture sequencing |
Country Status (1)
| Country | Link |
|---|---|
| CN (1) | CN109887548B (en) |
Families Citing this family (21)
| Publication number | Priority date | Publication date | Assignee | Title |
|---|---|---|---|---|
| CN110106063B (en) * | 2019-05-06 | 2022-07-08 | 臻和精准医学检验实验室无锡有限公司 | System for detecting 1p/19q combined deletion of glioma based on second-generation sequencing |
| CN112151116A (en) * | 2019-06-27 | 2020-12-29 | 天津中科智虹生物科技有限公司 | Method and device for sequencing tumor genes |
| CN110349625B (en) * | 2019-07-23 | 2022-02-08 | 中国科学院心理研究所 | Method for establishing human brain gene expression space-time norm |
| CN110808081B (en) * | 2019-09-29 | 2022-07-08 | 深圳吉因加医学检验实验室 | Model construction method for identifying tumor purity sample and application |
| CN110867207B (en) * | 2019-11-26 | 2021-07-30 | 北京橡鑫生物科技有限公司 | Evaluation method and evaluation device for validating NGS variant detection methods |
| CN112458162B (en) * | 2020-11-16 | 2023-04-18 | 北京迈基诺基因科技股份有限公司 | Organ transplantation ddcfDNA detection reagent and method |
| CN114517223B (en) * | 2020-11-20 | 2023-09-12 | 福建和瑞基因科技有限公司 | Method for screening SNP loci and application thereof |
| CN112631562B (en) * | 2020-12-01 | 2022-08-23 | 上海欧易生物医学科技有限公司 | Second-generation sequencing sample mixing method based on python, application, equipment and computer readable storage medium |
| CN112735517A (en) * | 2020-12-30 | 2021-04-30 | 深圳市海普洛斯生物科技有限公司 | Method, device and storage medium for detecting joint deletion of chromosomes |
| CN112397150B (en) * | 2021-01-20 | 2021-04-20 | 臻和(北京)生物科技有限公司 | Device and method for predicting ctDNA methylation level based on target region capture sequencing |
| CN113257347B (en) * | 2021-05-14 | 2022-02-11 | 温州谱希医学检验实验室有限公司 | Data processing method of annotated mutation detection result file and related equipment |
| CN113408945B (en) * | 2021-07-15 | 2023-03-24 | 广西中烟工业有限责任公司 | Method and device for detecting purity of flue-cured tobacco, electronic equipment and storage medium |
| CN113628683B (en) * | 2021-08-24 | 2024-04-09 | 慧算医疗科技(上海)有限公司 | High-throughput sequencing mutation detection method, device and apparatus and readable storage medium |
| CN114005489B (en) * | 2021-12-28 | 2022-03-22 | 成都齐碳科技有限公司 | Analysis method and device for detecting point mutation based on third-generation sequencing data |
| CN114446386B (en) * | 2022-01-17 | 2024-02-02 | 中国人民解放军国防科技大学 | Method for detecting ctDNA of blood |
| CN114420204B (en) * | 2022-03-29 | 2022-06-17 | 北京贝瑞和康生物技术有限公司 | Method, computing device and storage medium for predicting copy number of gene to be tested |
| CN115394357B (en) * | 2022-09-01 | 2023-06-30 | 杭州链康医学检验实验室有限公司 | Site combination for judging sample pairing or pollution and screening method and application thereof |
| CN115966259B (en) * | 2022-12-26 | 2023-10-13 | 南京普恩瑞生物科技有限公司 | Sample homology detection and verification method and system based on logistic regression modeling |
| CN116676373B (en) * | 2023-07-28 | 2023-11-21 | 臻和(北京)生物科技有限公司 | Sample dilution factor quantification method and application thereof |
| CN117604086B (en) * | 2023-11-17 | 2024-09-03 | 苏州吉因加生物医学工程有限公司 | A method for quantifying plasma ctDNA levels in subjects |
| CN120183492A (en) * | 2025-03-04 | 2025-06-20 | 苏州华谦科技有限公司 | A method, device and storage medium for fully automated kinship identification of multiple lines |
Citations (5)
| Publication number | Priority date | Publication date | Assignee | Title |
|---|---|---|---|---|
| CN106845153A (en) * | 2016-12-29 | 2017-06-13 | 安诺优达基因科技(北京)有限公司 | A kind of device for using Circulating tumor DNA pattern detection somatic mutation |
| CN107423578A (en) * | 2017-03-02 | 2017-12-01 | 北京诺禾致源科技股份有限公司 | Detect the device of somatic mutation |
| CN108690871A (en) * | 2018-03-29 | 2018-10-23 | 深圳裕策生物科技有限公司 | Insertion and deletion mutation detection methods, device and storage medium based on the sequencing of two generations |
| CN108733975A (en) * | 2018-03-29 | 2018-11-02 | 深圳裕策生物科技有限公司 | Tumor colonies mutation detection method, device and storage medium based on the sequencing of two generations |
| CN109033749A (en) * | 2018-06-29 | 2018-12-18 | 深圳裕策生物科技有限公司 | A kind of Tumor mutations load testing method, device and storage medium |
Family Cites Families (1)
| Publication number | Priority date | Publication date | Assignee | Title |
|---|---|---|---|---|
| SI3241914T1 (en) * | 2009-11-05 | 2019-07-31 | The Chinese University Of Hong Kong | Fetal genomic analysis from a maternal biological sample |
-
2019
- 2019-01-18 CN CN201910049677.7A patent/CN109887548B/en active Active
Patent Citations (5)
| Publication number | Priority date | Publication date | Assignee | Title |
|---|---|---|---|---|
| CN106845153A (en) * | 2016-12-29 | 2017-06-13 | 安诺优达基因科技(北京)有限公司 | A kind of device for using Circulating tumor DNA pattern detection somatic mutation |
| CN107423578A (en) * | 2017-03-02 | 2017-12-01 | 北京诺禾致源科技股份有限公司 | Detect the device of somatic mutation |
| CN108690871A (en) * | 2018-03-29 | 2018-10-23 | 深圳裕策生物科技有限公司 | Insertion and deletion mutation detection methods, device and storage medium based on the sequencing of two generations |
| CN108733975A (en) * | 2018-03-29 | 2018-11-02 | 深圳裕策生物科技有限公司 | Tumor colonies mutation detection method, device and storage medium based on the sequencing of two generations |
| CN109033749A (en) * | 2018-06-29 | 2018-12-18 | 深圳裕策生物科技有限公司 | A kind of Tumor mutations load testing method, device and storage medium |
Non-Patent Citations (1)
| Title |
|---|
| 基于靶向外显子深度测序的转移性乳腺癌患者循环肿瘤DNA定量检测及其临床应用研究;梁会营;《中国博士学位论文全文数据库 (医药卫生科技辑)》;20170215(第2期);E072-496 * |
Also Published As
| Publication number | Publication date |
|---|---|
| CN109887548A (en) | 2019-06-14 |
Similar Documents
| Publication | Publication Date | Title |
|---|---|---|
| CN109887548B (en) | ctDNA ratio detection method and detection device based on capture sequencing | |
| US11043283B1 (en) | Systems and methods for automating RNA expression calls in a cancer prediction pipeline | |
| EP3274475B1 (en) | Alignment and variant sequencing analysis pipeline | |
| CN109767810B (en) | High-throughput sequencing data analysis method and device | |
| Meggendorfer et al. | Analytical demands to use whole-genome sequencing in precision oncology | |
| Bastida et al. | Molecular diagnosis of inherited coagulation and bleeding disorders | |
| CN111341383B (en) | Method, device and storage medium for detecting copy number variation | |
| CN106778073B (en) | A method and system for assessing changes in tumor burden | |
| CN113450871B (en) | Method for identifying sample identity based on low-depth sequencing | |
| CN116631508A (en) | Detection method for tumor specific mutation state and application thereof | |
| CN117587159B (en) | Chilli SNP molecular marker combination, SNP chip and application thereof | |
| CN113564266B (en) | SNP typing genetic marker combination, detection kit and application | |
| CN112029842B (en) | Kit and method for ABO blood type genotyping based on high-throughput sequencing | |
| Fiévet et al. | ART-DeCo: easy tool for detection and characterization of cross-contamination of DNA samples in diagnostic next-generation sequencing analysis | |
| CN105925665A (en) | Kit, database establishment method, and method and system for detecting area target variation | |
| WO2024140368A1 (en) | Sample cross contamination detection method and device | |
| CN113136422A (en) | Method for detecting high-throughput sequencing sample contamination by grouping SNP sites | |
| CN115896256A (en) | Method, device, equipment and storage medium for detecting RNA insertion deletion mutation based on second-generation sequencing technology | |
| CN117059164A (en) | A method and its application for detecting sample cross-contamination based on SNP sites | |
| CN117265139B (en) | A SNP marker related to body weight of Suffolk sheep and its screening method and application | |
| KR101795662B1 (en) | Apparatus and Method for Diagnosis of metabolic disease | |
| CN110444253B (en) | Method and system suitable for mixed pool gene positioning | |
| CN114171116B (en) | Method for assessing fetal DNA concentration by maternal dissociation and intrinsic DNA and application thereof | |
| CN114093428B (en) | System and method for detecting low-abundance mutation under ctDNA ultrahigh sequencing depth | |
| CN119360954A (en) | A method, device and medium for screening gene markers and gene markers obtained by screening |
Legal Events
| Date | Code | Title | Description |
|---|---|---|---|
| PB01 | Publication | ||
| PB01 | Publication | ||
| SE01 | Entry into force of request for substantive examination | ||
| SE01 | Entry into force of request for substantive examination | ||
| GR01 | Patent grant | ||
| GR01 | Patent grant |