Detailed Description
Hereinafter, a mode for carrying out the present invention (referred to as "the present embodiment") will be described in detail with reference to the drawings and the like. The example described in the present embodiment is an example of a petroleum refinery. However, the present invention is not limited to petroleum refineries, and may be applied to chemical plants, power plants, water treatment plants, pharmaceutical manufacturing plants, and the like. Further, whether or not the name carries a "plant," the present invention may be applied in facilities that typically produce products containing electricity.
(oil refinery)
A schematic diagram of a petroleum refinery 51 is illustrated in accordance with fig. 1. The schematic diagram is also a diagram illustrating a flow of raw materials and products. Petroleum refinery 51 is generally a large-scale production facility that produces petroleum products 53 using crude oil 52 as a feedstock. The petroleum product 53 is classified into gas and liquid, and the liquid is classified into naphtha, kerosene, light oil, heavy oil, and the like according to the difference in boiling point thereof.
Crude oil 52 as a raw material is preheated by a heat exchanger 54 and then heated by a heating furnace 55. The heating furnace 55 is supplied with a heating fuel 56. The crude oil leaving the heating furnace 55 is sent to an atmospheric distillation tower 58 after removing light gas components in a pre-flash tower 57. Steam 59 is supplied to the atmospheric distillation column 58. In the atmospheric distillation tower 58, the crude oil is separated into gas, naphtha, kerosene, gas oil, and the like, and a residue. The residue inside is preheated by the heat exchanger 60 and the heating furnace 61, and then sent to the vacuum distillation tower 62. A part of the remaining portion is sent to a steam stripper 63, and light components, inorganic components are removed. Steam 59 is supplied to the steam stripper 63. The residue is further freed of light components by the vacuum distillation tower 62 and refined with coke and pitch. In addition, heavy components (coke and pitch) are reduced in weight in the reformer 64. Each refined product is subjected to a process such as hydrodesulfurization in the hydrogen refining apparatus 65 and stored.
Sensors (not shown) are installed at most positions of facilities, pipelines, and the like constituting an oil refinery. The sensors measure the temperature, pressure, flow rate per unit time, etc. of the gas or liquid passing through the interior. The sensor also measures the temperature of the device itself. For example, a plurality of divided "stages" are arranged inside the atmospheric distillation column 58 along the flow direction of the fluid. Temperature sensors are provided in each of these segments.
(nomenclature, etc.)
The operating conditions are set values for the equipment constituting the plant and the like. Various operating conditions exist depending on the type of equipment and the like. Items such as "volume per unit time of crude oil consumed", "temperature of heating furnace immediately downstream of atmospheric distillation tower", "pressure of steam supplied to atmospheric distillation tower" and the like may be the operating conditions. Then, the respective items can be represented by time series (each time point). Therefore, the operation condition is usually "a matrix (X) in which items are arranged in rows and time points are arranged" and actually "the method of using the plant" is the operation condition.
The operation state is a measurement value measured by a sensor of equipment, piping, or the like provided in a plant. There are various operating states depending on the type of equipment and the like. For example, items such as "the temperature of the first stage below the atmospheric distillation column", "the temperature of the preflash column", "the quality of produced naphtha", "the amount of consumed electric power" and the like may be in an operating state. Then, the respective items may be represented by time series (each time point). Therefore, the operation state is usually "a matrix (Y) in which items are arranged in rows and time points are arranged" and actually "the operation of the plant itself".
The operation index means an index of money related to raw material supply, product sale, finance, and the like. Even if the types of plants are various, most of the business indexes are common. For example, items such as "income", "expense", "profit", "accumulated profit", etc. may be the operation index. Then, the respective items may be represented by time series (each time point). Therefore, the operation index is usually "a matrix (Z) in which items are arranged and time points are arranged", and the operation index is actually "the plant economy itself".
(relationship between operating conditions, operating states, and operational index)
If the operating condition X is determined, the operating state Y is also determined. Now, this relationship is expressed as the function "Y ═ f1(X) ". If the operating state Y is determined and the unit prices of the products, the consumed power, the raw materials, etc., are determined, the business index Z is also determined. The unit price is "a matrix (P) in which the types of products, power consumption, raw materials, and the like are arranged in rows and the time points are arranged in columns". Each element of the unit price P is the unit price at that point in time of the product or the like.
Now, this relationship is expressed as the function "Z ═ f2(Y, P) ". Incidentally, if "f" is eliminated1And f2"Y" of "can be derived as" Z ═ F (X, P) ". That is, "F" is "F1And f2"is used. "Z ═ F (X, P)" simply means "if the usage method and unit price of the plant are determined, the economy of the plant is determined".
(simulation)
The plant operation optimization device according to the present embodiment (hereinafter, may be simply referred to as "the present device") can output the operation state Y in a simulated manner using the operation condition X set by the user as an input. That is, the present apparatus can use the function "Y ═ f1(X) ". Further, the present apparatus can automatically generate the operating condition X without waiting for the user to set the operating condition X, and can input the generated operating condition X to output the operating state Y in a simulated manner.
(evaluation of economic efficiency)
The present apparatus can output the operation index Z using the operation state Y and the unit price P as inputs. That is, the present apparatus can use the function "Z ═ f2(Y,P)”。
(abnormality diagnosis)
The device can divide the operation state Y into a plurality of categories by using the Adaptive Resonance Theory (ART). Since "normal" or "abnormal" can be associated with the category, the present apparatus can detect an abnormality in the operating state Y. Specifically, the present apparatus can perform the following processing.
(# 1: Collection of sample)
The apparatus collects samples of a plurality of operating states Y. This sample is a set of operating states Y in the case where the plant is known to be "normal" or "abnormal".
(#2 classification of samples)
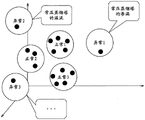
Let the operating state Y be a matrix of n rows by m columns. That is, the operating state Y has n-dimensional elements at m time points. The device dots m points in the space by assuming an n-dimensional space and assigning values of n elements to respective coordinate axes of the space. Fig. 2 is a diagram showing an example of the case where the n-dimensional space described here is a 3-dimensional space. Then, a plurality of points at the time of abnormality such as "flooding of the atmospheric distillation column" occur are concentrated at a certain position in the space. As another example, a plurality of points in the case where an abnormality such as "leakage from the atmospheric distillation column" occurs are concentrated at other positions in the space. Of course, even at a point where the plant is normal, for example, the same season in which the plant is used, the same mutual point for the users of the plant, and the like are gathered at a close position.
Therefore, the present apparatus groups m points at a short distance from each other. The number of groups is not particularly limited, but each group corresponds to any category of "abnormal 1", "abnormal 2", "abnormal 3", "normal 1", "normal 2", "normal 3", and. Each class forms a "ball" within the n-dimensional space. If the present apparatus can identify the type, it is possible to detect the specific content of the abnormality, such as "type abnormality 1 is an overflow of the atmospheric distillation column".
(# 3: diagnosis)
In this case, a plurality of operation states Y to be diagnosed are set. The operation state Y to be diagnosed may be an operation state (actual data) actually obtained as a result of plant operation, or may be a result (simulated data) simulated by the present apparatus. The apparatus dots a point indicating an operation state Y of a diagnostic object in the space, and specifies a category (ball) including the dot. The operation states Y to be diagnosed are also determined for m time points if they are a matrix of n rows × m columns.
(concrete examples of operating conditions, operating states, and management indexes)
Specific examples of the operating conditions X, the operating states Y, and the business index Z will be described with reference to fig. 3. The horizontal axis of fig. 3 is a time point. The more to the right of fig. 3, the later time point is indicated. Each row of the operating condition X is an item of the operating condition X. The unit of the intersection of the vertical axis and the horizontal axis stores the set values for the devices and the like constituting the plant. The set values of the units are of course different, but are shown here as "·" omitted.
Each row of the operating state Y is an item of the operating state Y. In the unit of the intersection of the vertical axis and the horizontal axis, the measurement value measured by the sensor provided in the equipment, the pipe, or the like of the plant is stored. The measured values of the units are of course different, but the set value is indicated here by "·" in an omitted manner. The value "·" here is a result of simulation of the present apparatus based on "·" in the operating state X, as described above. In this sense, "·" of the operating state Y is a virtual value although it is a "measured value".
Each row of the business index Z is an item of the business index Z. In a cell of an intersection of the vertical axis and the horizontal axis, a value of an index of money relating to raw material supply, product sales, finance, and the like is stored. The values of the elements are naturally different, but are indicated here by "·" in an omitted manner. The value "·" here is calculated from the operating state Y and the unit price P as described above.
Specific examples of the operation condition X, the maintenance M, the operation state Y, and the operation index Z will be described with reference to fig. 4. Fig. 4 differs from fig. 3 in that there is a maintenance M in fig. 4. The suffix "d" of "X", "Y", and "Z" has the meaning of "reconsidered as maintenance is performed" (detailed later). Maintenance M is also a matrix, with the horizontal axis being the point in time. The vertical axis is specific to the plant maintenance. Then, the character string of "execution" is stored in any one of the cells at the intersection of the vertical axis and the horizontal axis. The "execution" indicates that the maintenance is performed at that point in time.
Refer to fig. 3 and 4. The present apparatus detects the normality and abnormality of a plant based on the operation state Y of fig. 3, and outputs a diagnosis result. In this case, for example, the present apparatus detects the type "abnormality 1" at the time point "t 2" and detects the type "abnormality 2" at the time point "t 4" (detects the type "normal o" at another time point). The auxiliary storage device 15 of the present apparatus includes an "abnormality/maintenance correspondence table" (not shown) in which maintenance corresponding to an abnormality is stored in association with the type of the abnormality. The apparatus searches the abnormality/maintenance correspondence table using "abnormality 1" as a search key, and acquires the corresponding maintenance, and searches the abnormality/maintenance correspondence table using "abnormality 2" as a search key, and acquires the corresponding maintenance. The maintenance acquired at this time is the maintenance M of fig. 4.
The present apparatus corrects a part (pre-flash column related) of the operating conditions X (fig. 3) corresponding to "execution" 71 (fig. 4) of maintenance M. That is, the present apparatus stores the assumed value after the maintenance. As a result, a part of the value after time t4 of the operating condition Xd (fig. 4) changes from "·". In addition, a part of the operation conditions X (fig. 3) (relating to the atmospheric distillation column) is corrected in accordance with "execution" 72 (fig. 4) of the maintenance M. As a result, a part of the value after time t2 of the operating condition Xd (fig. 4) changes from "·".
Next, the present apparatus simulates the operation state Yd based on the operation condition Xd. In the simulation result, i.e., the operating state Yd (fig. 4), a part of the value is changed from "· ·" to "###" or "b b" as compared with the operating state Y (fig. 3).
Then, the present apparatus calculates the operation index Zd from the operation state Yd and the unit price P. As a result, in the operation index Zd (fig. 4), the value after the time point t2 is changed from "· to" · as compared with the operation index Z (fig. 3).
(production facility management optimizing device)
The structure of the production facility operation optimization apparatus 1 is explained with reference to fig. 5. The production facility operation optimization apparatus 1 is a general computer, and includes a central control apparatus 11, an input apparatus 12 such as a keyboard, an output apparatus 13 such as a display, a main storage apparatus 14, and an auxiliary storage apparatus 15. These devices are interconnected by a bus. The auxiliary storage device 15 stores the operating conditions X, the operating state Y, the business index Z, and the unit price P. The simulation unit 21, the diagnosis unit 22, the maintenance proposing unit 23, the re-simulation unit 24, the economic evaluation unit 25, and the economic optimization unit 26 in the main storage device 14 are programs. Hereinafter, when the description is mainly given with "the o portion" as the main object, the central control unit 11 reads out each program from the auxiliary storage unit 15, and realizes the function of each program after loading the program into the main storage unit 14 (detailed later).
(control Picture)
The control screen is explained with reference to fig. 6. The control screen 31 is a screen displayed on the output device 13 of the production facility operation optimization device 1. The plant configuration screen 32 in the control screen 31 schematically displays the configuration of the plant. The graph screen 33 displays data appropriately represented by a time-series graph such as a temperature value in the operating state Y. The histogram screen 34 displays, for example, a histogram of the passage time series of the production of the product in the operation state Y to appropriately represent the data. The diagnosis screen 35 displays category transition (detailed later). The maintenance screen 36 displays the contents of the maintenance M by a character string. The economic screen 37 displays the operation index Z by a graph. The icon/button column 38 is an area for displaying a graphic of a sample when the user draws a plant structure, a button pressed by the user when the user operates the apparatus, and the like.
(treatment Process)
The process is illustrated in accordance with fig. 7. Fig. 8 to 16 will be described at appropriate timing.
In step S101, the simulation unit 21 creates an operation condition X. The method of creating the operating condition X by the simulation unit 21 is any of the following methods.
(1) The simulation unit 21 receives a user input of a matrix such as the operation condition X in fig. 3 via the input device 12, for example.
(2) The simulation unit 21 reads the past operating conditions X from the auxiliary storage device 15. It is assumed that the past actual operating conditions X are stored in the auxiliary storage device 15.
(3) The simulation unit 21 automatically creates the virtual operating conditions X. In this case, the simulation unit 21 may create all or a part of the values of the operating conditions X from the random numbers generated at random. The simulation unit 21 may create a plurality of operating conditions X according to a predetermined plan (an operating time saving plan, a raw material saving plan, a night tilt operating plan, a winter tilt operating plan, and the like).
In step S102, the simulation unit 21 simulates the operation state Y. Specifically, in step 1, the simulation unit 21 creates the operating state Y from the operating condition X created in step S101.
In the 2 nd stage, the simulation unit 21 displays the operation state Y as a result of the simulation on the output device 13. In this case, the simulation unit 21 may display a matrix such as the operating state Y in fig. 3, for example, or may display a predetermined part of the operating state Y in a graph-like manner on the graph screen 33 of the control screen 31. Examples of the graphs displayed at this time are fig. 8 and 9. In fig. 8 and 9, the horizontal axis represents time, and the vertical axis represents the temperature of each stage of the atmospheric distillation column. Depending on the operating condition X prepared in step S101, the temperature of each stage of the atmospheric distillation column may be stable or may fluctuate at a certain cycle and the average level may be stable (fig. 8), and the temperature of a certain stage of the atmospheric distillation column may tend to decrease (fig. 9).
In step S103, the diagnostic unit 22 detects an abnormality based on the operating state Y. Specifically, in step 1, the diagnosis unit 22 dots a point indicating the operation state Y as a result of the simulation in step 1 in the above-described n-dimensional space, and specifies a category (ball) including the dot at each time point. When the specified category is "abnormality" o, the diagnosis section 22 detects an abnormality.
The diagnostic unit 22 displays the specified category on the output device 13, 2. In this case, the diagnosis unit 22 may graphically display the type transition on the diagnosis screen 35 of the control screen 31 as shown in fig. 10 and 11.
The horizontal axes of fig. 10 and 11 are time points, and "0", "1", and.. and "7" in the vertical axis are numbers of categories (balls) in the n-dimensional space, and respectively indicate "normal 0", "normal 1", and.. and "normal 7". The vertical axes "8", "9", "10", and "11" represent "abnormality 8", "abnormality 9", "abnormality 10", and "abnormality 11", respectively. The category transition of fig. 10 corresponds to fig. 8, and the normal category is periodically displayed. The category transition of fig. 11 corresponds to fig. 9, initially, displaying normal categories, but thereafter, starting to appear abnormal categories, and finally, no normal categories have appeared any more.
In step S104, the maintenance presenting unit 23 presents maintenance. Specifically, the maintenance proposing unit 23 searches the abnormality/maintenance correspondence table using the category "abnormality o" specified in "1 st" in step S103 as a search key, and specifies the corresponding maintenance. This determines, for example, maintenance such as maintenance M in fig. 4.
The maintenance presenting unit 23 corrects the portion of the operating condition X corresponding to the maintenance specified in "1 st" of step S104 to set the operating condition Xd as the maintenance presenting unit 2.
In the 3 rd step, the maintenance presenting unit 23 displays the maintenance M and the operation condition Xd on the output device 13. The abnormality/maintenance correspondence table is a format for supporting a plurality of maintenance operations for 1 abnormality, and is a candidate for the maintenance presenting unit 23 to create and display a plurality of operating conditions Xd.
In step S105, the re-simulation unit 24 simulates the operation state Yd when the maintenance is performed. Specifically, in step 1, the re-simulation unit 24 creates the operating state Yd based on the operating condition Xd created in step S104, i.e., the "2 nd" condition. The re-simulation unit 24 creates a plurality of candidates of the operating state Yd.
The re-simulation unit 24 displays a plurality of candidates of the simulated operation state Yd on the output device 13, 2.
In step S106, the economic evaluation unit 25 creates a business index Z. Specifically, in step 1, the economic evaluation unit 25 creates the business index Z based on the operating state Y and the unit price P simulated in step S102, i.e., in "1 st".
The economic evaluation unit 25 creates the business index Zd based on the operating state Yd and the unit price P simulated in the "1 st" of step S105. Further, the economic evaluation unit 25 creates a plurality of candidates of the operation index Zd.
In the 3 rd aspect, the economic evaluation unit 25 displays the plurality of candidates of the business index Z created in the "1 st" of step S106 and the business index Zd created in the "2 nd" of step S106 as the economic screen 37 of the control screen 31 on the output device 13. At this time, the economic evaluation unit 25 displays a plurality of candidates of the business index Z and the business index Zd in a comparable manner. The economic evaluation unit 25 may also display a plurality of candidates of the operating condition X serving as a basis of the business index Z and the operating condition Xd serving as a basis of the plurality of candidates of the business index Zd in a manner that they can be compared with each other. The economic evaluation unit 25 may display the business index Zd graphically as shown in fig. 12(a), or may display the business index Z graphically as shown in fig. 12 (b). Further, the economic evaluation unit 25 may graphically display the difference obtained by subtracting the business index Z from the business index Zd for each business index item. Fig. 13 is an example in which the difference in the accumulated profit is graphed.
In step S107, the economic optimization unit 26 determines the optimal operating condition Xd. Specifically, the economic optimization unit 26 receives a user designation of any one of the operation index items 1. Here, it is assumed that the user specifies "cumulative profit".
The economic optimization unit 26 specifies the operating condition Yd with the maximum "cumulative profit" at a certain time point among the plurality of candidates of the operating condition Yd simulated in the "1 st" in step S105.
The eco-optimizing unit 26 determines the operating condition Xd that is the basis of the operating state Yd determined in the "2 nd" of step S107, and displays the determined operating condition Xd on the output device 13.
It is needless to say that in "1 st" in step S107, it may be preferable for the user to specify that the value of the operation index is small (for example, "payout"). In this case, in the "2 nd" of step S107, the economic optimization unit 26 specifies the operating state Yd in which the "expenditure" at a certain time point is minimum. Further, the cumulative profit or the like may not be "maximum" or "minimum", but "90% or more at maximum" or "within a maximum number of" from the start ". Further, the cumulative profit or the like does not have to be "large" or "small" as long as it falls within a range having some meaning in business.
After that, the processing is ended.
(modification of treatment Process)
Here, the item (row) of the operating condition X is represented by Xi. Then, the item (row) of the business index Z is represented as Zi. Z of the most important in the businessiThe "income" is set. Then, x is set to be the one whose influence on "income" is most desired to be knowniWhat is the case (for example, "the amount of crude oil introduced" or the like).
As described above, the relationship of "Z ═ F (X, P)" holds. That is, the partial differential coefficient "δ z" at a certain time point can be seti/δxi"x large enough to satisfy a predetermined referenceiDetermined as a "bottleneck item". Of course, z in a certain period may be usediIncrease or decrease of (a) to x satisfying a predetermined referenceiDetermined as a "bottleneck item".
Therefore, the simulation unit 21 simulates the operation state Y corresponding to each sample by using most of the past operation conditions X as the samples. The economic evaluation unit 25 creates the operation index Z for each operation state Y as a simulation result. The economic optimization unit 26 first accepts the user input of the item "z" of particular interesti". On the basis of this, the economic optimization unit 26 determines the bottleneck item x as described abovei. Then, the maintenance presenting unit 23 is limited to xiMaintenance of value changes of (bottleneck project) to propose maintenance M.
(detection)
The significance of the diagnosis of the operating state Y by the diagnosis unit 22 is great. If the diagnostic unit 22 is not present and the abnormality cannot be detected from the operating state Y, the operating state Y is, for example, as shown in fig. 14(a) and 14 (b). The temperature in the 2 nd, 4 th, 6 th and 8 th stages of the atmospheric distillation tower 58 is lowered, and the production amount of gasoline and light oil is reduced. Conversely, the production amount of kerosene increases. Thus, the maintenance personnel must perform some maintenance each time they find a temperature drop (in the figure, at a rate of 4 months per time).
When the diagnostic unit 22 diagnoses the operating state Y, the type of the diagnosis result is changed as shown in fig. 15, for example. The diagnosis unit 22 detects abnormalities every 2 months. The maintenance proposing section 23 naturally proposes some maintenance M. The maintenance personnel then perform the maintenance M which was proposed preventively. The operating state Yd when preventive maintenance is performed in this way is shown in fig. 16(a) and 16(b), for example. The temperatures in the 2 nd, 4 th, 6 th and 8 th stages are stable, and the yields of gasoline, light oil and kerosene are also stable.
Fig. 12(b) described above corresponds to the case where the diagnostic unit 22 is not present, and fig. 12(a) corresponds to the case where the diagnostic unit 22 diagnoses the operating state Y. The cumulative profit of fig. 12(a) is slightly higher than the cumulative profit of fig. 12 (b).
(effects of the embodiment)
The production facility operation optimization device of the present embodiment achieves the following effects.
(1) The user can know the economical operating conditions and the required maintenance for ensuring the normal operating state.
(2) Since the operating conditions for simulating the operating state are automatically created, the burden on the user is small.
(3) The user can limit the important operation conditions to a large number of operation conditions and perform simulation (for example, a bottleneck project).
(4) The user can easily compare the operation index reflecting the maintenance condition with the operation index reflecting other conditions.
(5) The user can apply the production facility operation optimization apparatus to, in particular, a petroleum refinery or the like of a large scale.
The present invention is not limited to the above-described embodiments, and various modifications are also included. For example, the above-described embodiments are described in detail to facilitate understanding of the present invention, and are not limited to having all the configurations described. In addition, a part of the structure of one embodiment may be replaced with the structure of another embodiment, and the structure of another embodiment may be added to the structure of one embodiment. In addition, other configurations may be added, deleted, or replaced for a part of the configurations of the embodiments.
A part or all of the above-described structures, functions, processing units, and the like may be realized by hardware by designing them in an integrated circuit, for example. The above-described structures, functions, and the like can be realized by software by analyzing and executing a program for realizing each function by a processor. Information of programs, tables, files, and the like that realize the respective functions can be placed in a memory, a hard disk, a recording device such as an SSD (Solid State Drive), or a recording medium such as an IC card, an SD card, or a DVD.
The control lines and information lines that are considered necessary for the description are shown, but the present invention is not limited to the control lines and information lines that are all shown on the product. It is believed that virtually all structures are interconnected.
Description of the symbols
1 production facility operation optimizing device
11 central control device
12 input device
13 output device
14 main storage device (storage unit)
15 auxiliary storage device (storage part)
21 simulation part
22 diagnostic part
23 maintenance lift-out part
24 re-simulation part
25 section for evaluating economic efficiency
26 economics optimization department
P unit price
X operating conditions
Y operating state
Z business index