CN106294301B - Report generation method and device - Google Patents
Report generation method and device Download PDFInfo
- Publication number
- CN106294301B CN106294301B CN201610649885.7A CN201610649885A CN106294301B CN 106294301 B CN106294301 B CN 106294301B CN 201610649885 A CN201610649885 A CN 201610649885A CN 106294301 B CN106294301 B CN 106294301B
- Authority
- CN
- China
- Prior art keywords
- report
- displayed
- page
- menu
- data
- Prior art date
- Legal status (The legal status is an assumption and is not a legal conclusion. Google has not performed a legal analysis and makes no representation as to the accuracy of the status listed.)
- Active
Links
Images


Classifications
-
- G—PHYSICS
- G06—COMPUTING OR CALCULATING; COUNTING
- G06F—ELECTRIC DIGITAL DATA PROCESSING
- G06F40/00—Handling natural language data
- G06F40/10—Text processing
- G06F40/166—Editing, e.g. inserting or deleting
- G06F40/177—Editing, e.g. inserting or deleting of tables; using ruled lines
- G06F40/18—Editing, e.g. inserting or deleting of tables; using ruled lines of spreadsheets
-
- G—PHYSICS
- G06—COMPUTING OR CALCULATING; COUNTING
- G06F—ELECTRIC DIGITAL DATA PROCESSING
- G06F40/00—Handling natural language data
- G06F40/10—Text processing
- G06F40/166—Editing, e.g. inserting or deleting
- G06F40/174—Form filling; Merging
-
- G—PHYSICS
- G06—COMPUTING OR CALCULATING; COUNTING
- G06F—ELECTRIC DIGITAL DATA PROCESSING
- G06F40/00—Handling natural language data
- G06F40/10—Text processing
- G06F40/166—Editing, e.g. inserting or deleting
- G06F40/177—Editing, e.g. inserting or deleting of tables; using ruled lines
Landscapes
- Engineering & Computer Science (AREA)
- Theoretical Computer Science (AREA)
- Health & Medical Sciences (AREA)
- Artificial Intelligence (AREA)
- Audiology, Speech & Language Pathology (AREA)
- Computational Linguistics (AREA)
- General Health & Medical Sciences (AREA)
- Physics & Mathematics (AREA)
- General Engineering & Computer Science (AREA)
- General Physics & Mathematics (AREA)
- Information Transfer Between Computers (AREA)
- User Interface Of Digital Computer (AREA)
Abstract
Description
技术领域technical field
本发明涉及数据处理的技术领域,尤其涉及一种报表生成方法和装置。The present invention relates to the technical field of data processing, and in particular, to a method and device for generating a report.
背景技术Background technique
Bootstrap,来自Twitter,是目前很受欢迎的前端框架。Bootstrap是基于HTML(HyperText Markup Language,超级文本标记语言)、CSS(Cascading Style Sheets,层叠样式表)、JavaScript的,它简洁灵活,使得web开发更加快捷。bootstrap table是基于bootstrap的插件,它扩展和丰富了bootstrap表格的操作,如格式化表格,表格选择器,表格工具栏,分页等等。如图1所示,bootstrap table实现了单行表头的固定,单行可选列。现有的bootstrap table功能比较单一,存在很多缺陷,如不支持多行表头、不支持多行可选列、不支持数据列排序、不支持数据列指标预警、不支持交叉报表显示、不支持数据分页、大数据量载入时页面等待时间过长,用户体验较差、大数据量展现时选择列的显示或隐藏会因操作过多的DOM(Document Object Model,文档对象模型)元素,容易引发内存不足从而造成页面崩溃,无法渲染报表等。Bootstrap, from Twitter, is currently a very popular front-end framework. Bootstrap is based on HTML (HyperText Markup Language, Hyper Text Markup Language), CSS (Cascading Style Sheets, Cascading Style Sheets), JavaScript, it is concise and flexible, making web development faster. Bootstrap table is a bootstrap-based plugin that extends and enriches the operations of bootstrap tables, such as formatting tables, table selectors, table toolbars, paging, and more. As shown in Figure 1, the bootstrap table implements the fixation of a single-row header, and a single-row optional column. The existing bootstrap table function is relatively simple, and there are many defects, such as not supporting multi-line headers, not supporting multi-line optional columns, not supporting data column sorting, not supporting data column indicator warning, not supporting cross report display, not supporting Data paging, page waiting time is too long when a large amount of data is loaded, the user experience is poor, and the display or hiding of selected columns when displaying a large amount of data will be due to excessive manipulation of DOM (Document Object Model, Document Object Model) elements. Causes insufficient memory to cause page crashes, unable to render reports, etc.
发明内容SUMMARY OF THE INVENTION
本发明的主要目的在于提供一种报表生成方法和装置,旨在解决现有bootstraptable功能单一的技术问题。The main purpose of the present invention is to provide a method and device for generating a report, aiming at solving the technical problem of a single function of the existing bootstraptable.
为实现上述目的,本发明提供的一种报表生成方法,所述报表生成方法应用于web报表展现插件,所述报表生成方法包括:In order to achieve the above purpose, the present invention provides a report generation method, the report generation method is applied to a web report display plug-in, and the report generation method includes:
初始化报表的菜单框架,根据所述菜单框架生成所述报表的子表数据;Initialize the menu frame of the report, and generate the sub-table data of the report according to the menu frame;
根据所述子表数据渲染所述报表,确定渲染后的所述报表中各表头的父子关系;Render the report according to the sub-table data, and determine the parent-child relationship of each header in the rendered report;
根据各表头的父子关系确定所述报表的级联菜单,以生成报表。The cascading menu of the report is determined according to the parent-child relationship of each table header to generate the report.
优选地,所述根据各表头的父子关系确定所述报表的级联菜单,以生成报表的步骤包括:Preferably, the step of determining the cascading menu of the report according to the parent-child relationship of each header to generate the report includes:
根据各表头的父子关系确定所述报表树状的级联菜单;Determine the cascading menu of the report tree according to the parent-child relationship of each header;
根据所接收的对所述级联菜单的操作指令,以及所述级联菜单中各菜单选项当前的状态属性,生成对应的报表。A corresponding report is generated according to the received operation instruction on the cascading menu and the current state attributes of each menu option in the cascading menu.
优选地,所述根据各表头的父子关系确定所述报表的级联菜单的步骤之后,还包括:Preferably, after the step of determining the cascading menu of the report according to the parent-child relationship of each header, the method further includes:
确定所述报表中需要排序的待排序列,设置所述待排序列对应的排序图标,并注册所述排序图标的点击事件。Determine the to-be-sorted column to be sorted in the report, set a sorting icon corresponding to the to-be-sorted column, and register a click event of the sorting icon.
优选地,所述确定所述报表中需要排序的待排序列,设置所述待排序列对应的排序图标,并注册所述排序图标的点击事件的步骤之后,还包括:Preferably, after the steps of determining the to-be-sorted column that needs to be sorted in the report, setting a sorting icon corresponding to the to-be-sorted column, and registering the click event of the sorting icon, the method further includes:
当所述报表为多页报表时,设置所述报表的分页方式;When the report is a multi-page report, set the paging mode of the report;
若所述分页方式为第一分页方式,则确定所述报表中待显示数据的行数,以及每页报表所能显示数据的行数;If the paging mode is the first paging mode, determining the number of rows of data to be displayed in the report and the number of rows of data that can be displayed in each page of the report;
根据所述待显示数据的行数和每页报表所能显示数据的行数计算所述报表的页数;Calculate the number of pages of the report according to the number of rows of the data to be displayed and the number of rows of data that can be displayed on each page of the report;
若所述分页方式为第二分页方式,则根据所述报表中数据的总行数,以及渲染后的所述报表中各行的行高计算滚动条的长度,以得到所述第二分页方式中滚动条的长度。If the paging mode is the second paging mode, the length of the scroll bar is calculated according to the total number of rows of data in the report and the row height of each row in the rendered report, so as to obtain the scrolling in the second paging mode. the length of the bar.
优选地,所述根据所述待显示数据的行数和每页报表所能显示数据的行数计算所述报表的页数的步骤之后,还包括:Preferably, after the step of calculating the number of pages of the report according to the number of rows of the data to be displayed and the number of rows of data that can be displayed on each page of the report, the method further includes:
判断各页报表所显示的行数是否小于每页报表所能显示的行数;Determine whether the number of rows displayed on each page of the report is less than the number of rows that can be displayed on each page of the report;
若某页报表所显示行数小于每页报表所能显示的行数,则将该页报表标记为待补齐分页报表;If the number of rows displayed on a page of the report is less than the number of rows that can be displayed on each page of the report, the page of the report will be marked as a paginated report to be completed;
根据每页报表所能显示的行数补齐所述待补齐分页报表的行高,以使所述报表中各分页报表的高度一致。The row height of the to-be-completed paginated report is filled according to the number of lines that can be displayed in each page of the report, so that the heights of the paginated reports in the report are consistent.
此外,为实现上述目的,本发明还提供一种报表生成装置,所述报表生成装置应用于web报表展现插件,所述报表生成装置包括:In addition, in order to achieve the above purpose, the present invention also provides a report generation device, the report generation device is applied to a web report display plug-in, and the report generation device includes:
生成模块,用于初始化报表的菜单框架,根据所述菜单框架生成所述报表的子表数据;A generation module, for initializing the menu frame of the report, and generating the sub-table data of the report according to the menu frame;
渲染模块,用于根据所述子表数据渲染所述报表,确定渲染后的所述报表中各表头的父子关系;A rendering module, configured to render the report according to the sub-table data, and determine the parent-child relationship of each header in the rendered report;
确定模块,用于根据各表头的父子关系确定所述报表的级联菜单,以生成报表。The determining module is used for determining the cascading menu of the report according to the parent-child relationship of each table header, so as to generate the report.
优选地,所述确定模块包括:Preferably, the determining module includes:
确定单元,用于根据各表头的父子关系确定所述报表树状的级联菜单;A determination unit, used for determining the cascading menu of the report tree according to the parent-child relationship of each header;
处理单元,用于根据所接收的对所述级联菜单的操作指令,以及所述级联菜单中各菜单选项当前的状态属性,生成对应的报表。The processing unit is configured to generate a corresponding report according to the received operation instruction on the cascading menu and the current state attributes of each menu option in the cascading menu.
优选地,所述报表生成装置还包括图标设置模块,用于确定所述报表中需要排序的待排序列,设置所述待排序列对应的排序图标,并注册所述排序图标的点击事件。Preferably, the report generating apparatus further includes an icon setting module, configured to determine the to-be-sorted column to be sorted in the report, set a sorting icon corresponding to the to-be-sorted column, and register a click event of the sorting icon.
优选地,所述报表生成装置还包括:Preferably, the report generation device further includes:
分页设置模块,用于当所述报表为多页报表时,设置所述报表的分页方式;a paging setting module, used for setting the paging mode of the report when the report is a multi-page report;
所述确定模块还用于若所述分页方式为第一分页方式,则确定所述报表中待显示数据的行数,以及每页报表所能显示数据的行数;The determining module is further configured to determine the number of rows of data to be displayed in the report and the number of rows of data that can be displayed on each page of the report if the paging mode is the first paging mode;
计算模块,用于根据所述待显示数据的行数和每页报表所能显示数据的行数计算所述报表的页数;a calculation module for calculating the number of pages of the report according to the number of rows of the data to be displayed and the number of rows of the data that can be displayed in each page of the report;
所述计算模块还用于若所述分页方式为第二分页方式,则根据所述报表中数据的总行数,以及渲染后的所述报表中各行的行高计算滚动条的长度,以得到所述第二分页方式中滚动条的长度。The calculation module is further configured to calculate the length of the scroll bar according to the total number of rows of data in the report and the row height of each row in the rendered report if the paging mode is the second paging mode, so as to obtain the result. The length of the scroll bar in the second paging method.
优选地,所述报表生成装置还包括:Preferably, the report generation device further includes:
判断模块,用于判断各页报表所显示的行数是否小于每页报表所能显示的行数;The judgment module is used to judge whether the number of rows displayed in each page of the report is less than the number of rows that can be displayed in each page of the report;
标记模块,用于若某页报表所显示行数小于每页报表所能显示的行数,则将该页报表标记为待补齐分页报表;The marking module is used to mark the page of the report as a paginated report to be completed if the number of rows displayed on a certain page of the report is less than the number of rows that can be displayed on each page of the report;
补齐模块,用于根据每页报表所能显示的行数补齐所述待补齐分页报表的行高,以使所述报表中各分页报表的高度一致。The complementing module is used for complementing the row height of the paginated report to be completed according to the number of rows that can be displayed on each page of the report, so that the heights of the paginated reports in the report are consistent.
本发明通过根据初始化后的菜单框架生成报表的子表数据,根据所述子表数据渲染所述报表,根据渲染后的所述报表中各表头的父子关系确定各表头的级联菜单,以生成报表。实现了通过web报表展现插件生成所需要的报表,使所生成的Bootstrap table报表相对于传统的Bootstrap table报表功能更加丰富。The present invention generates the sub-table data of the report according to the initialized menu frame, renders the report according to the sub-table data, and determines the cascading menu of each header according to the parent-child relationship of each header in the rendered report, to generate a report. It realizes the required report generation through the web report display plug-in, so that the generated Bootstrap table report has more functions than the traditional Bootstrap table report.
附图说明Description of drawings
图1为目前bootstrap table的一种示意图;Figure 1 is a schematic diagram of the current bootstrap table;
图2本发明报表生成方法的较佳实施例的流程示意图;Fig. 2 is the schematic flow chart of the preferred embodiment of the report generation method of the present invention;
图3为本发明实施例中根据各表头的父子关系确定所述报表的级联菜单,以生成报表的一种流程示意图;3 is a schematic flow chart of determining a cascading menu of the report according to the parent-child relationship of each table header to generate a report in an embodiment of the present invention;
图4为本发明报表生成装置的较佳实施例的功能模块示意图;Fig. 4 is the functional module schematic diagram of the preferred embodiment of the report generation device of the present invention;
图5为本发明实施例中确定模块的一种功能模块示意图;5 is a schematic diagram of a functional module of a determination module in an embodiment of the present invention;
图6为本发明实施例中渲染后的报表的一种示意图;6 is a schematic diagram of a rendered report in an embodiment of the present invention;
图7为本发明实施例中报表中各表头父子关系的一种示意图;7 is a schematic diagram of the parent-child relationship of each header in the report in the embodiment of the present invention;
图8为本发明实施例中报表的级联菜单的一种示意图;8 is a schematic diagram of a cascading menu of a report in an embodiment of the present invention;
图9为本发明实施例中待补齐分页报表补齐高度之后的一种示意图;Fig. 9 is a kind of schematic diagram after the height of the pagination report to be filled up in the embodiment of the present invention;
图10为本发明实施例中一种具体实施方式的示意图。FIG. 10 is a schematic diagram of a specific implementation manner in an embodiment of the present invention.
本发明目的的实现、功能特点及优点将结合实施例,参照附图做进一步说明。The realization, functional characteristics and advantages of the present invention will be further described with reference to the accompanying drawings in conjunction with the embodiments.
具体实施方式Detailed ways
应当理解,此处所描述的具体实施例仅仅用以解释本发明,并不用于限定本发明。It should be understood that the specific embodiments described herein are only used to explain the present invention, but not to limit the present invention.
本发明提供一种报表生成方法。The invention provides a report generation method.
参照图2,图2为本发明报表生成方法较佳实施例的流程示意图。Referring to FIG. 2, FIG. 2 is a schematic flowchart of a preferred embodiment of a report generation method of the present invention.
在本实施例中,所述报表生成方法包括:In this embodiment, the report generation method includes:
步骤S10,初始化报表的菜单框架,根据所述菜单框架生成所述报表的子表数据;Step S10, initialize the menu frame of the report, and generate the sub-table data of the report according to the menu frame;
在本实施例中,通过使用web报表展现插件(FTable)生成报表,所述FTable采用JQuery和Bootstrap技术对传统HTML表格进行了功能扩充,所述JQuery用于操作DOM,所述Bootstrap用于CSS/HTML布局。所述JQuery是继prototype之后又一个优秀的Javascript库。所述JQuery使用户能更方便地处理HTML(标准通用标记语言下的一个应用)、events、实现动画效果,并且方便地为网站提供ajax交互。所述JQuery是一个兼容多浏览器的javascript库。In this embodiment, a report is generated by using a web report presentation plug-in (FTable), the FTable uses JQuery and Bootstrap technology to expand the functions of traditional HTML tables, the JQuery is used for operating the DOM, and the Bootstrap is used for CSS/ HTML layout. The JQuery is another excellent Javascript library after prototype. The JQuery enables users to more conveniently process HTML (an application under the standard general markup language), events, realize animation effects, and conveniently provide ajax interaction for websites. The JQuery is a multi-browser compatible javascript library.
当在生成报表过程中,所述FTable先初始化报表的菜单框架。其中,所述报表的菜单框架包括所述报表所在的div容器、所述报表的标题、所述报表中各数据的单位、所述报表中每页报表所能记录数据的行数、所述报表的起始记录数、所述报表的分页方式、所述报表tbody中需要合并的列、所述报表中需要预警显示的列、是否在所述报表中显示选择菜单和是否在所述报表中显示下载按钮及下载类型等。如通过params.divid='container'表示所述报表所在的div容器。When generating a report, the FTable first initializes the menu frame of the report. The menu frame of the report includes the div container where the report is located, the title of the report, the unit of each data in the report, the number of rows of data that can be recorded on each page of the report, the report The number of starting records, the paging method of the report, the columns to be merged in the report tbody, the columns to be displayed in the report for warning, whether to display the selection menu in the report and whether to display it in the report Download button and download type, etc. For example, params.divid='container' indicates the div container where the report is located.
当所述FTable初始化所述报表的菜单框架时,所述FTable根据所述菜单框架设置所述子表的参数,生成所述报表的子表数据,得到所述报表的子表。所述子表的参数包括所述报表中每页报表所能记录的行数,即每页报表中的记录数,以及每页报表的起始行的记录数。如通过params.rownum=10以及params.rowth=0生成所述报表的子表,其中,所述params.rownum=10表示所述报表中每页所能记载的记录数为10,当所述报表中一共只有10页,且所述报表中的记录数超过100条时,所述报表只会显示100条记录数,超过的则不会显示。所述params.rownum可为空,所述报表中每页所能记载的记录数默认为每页报表自适应的记录数。所述params.rowth=0表示所述报表的起始记录数,所述params.rowth可为空,所述params.rowth默认为0,表示从所述报表的第一条记录数开始显示。When the FTable initializes the menu frame of the report, the FTable sets the parameters of the sub-table according to the menu frame, generates sub-table data of the report, and obtains the sub-table of the report. The parameters of the sub-table include the number of rows that can be recorded in each page of the report in the report, that is, the number of records in each page of the report, and the number of records in the starting row of each page of the report. For example, the sub-table of the report is generated by params.rownum=10 and params.rowth=0, wherein the params.rownum=10 indicates that the number of records that can be recorded on each page in the report is 10. When the report There are only 10 pages in total in the report, and when the number of records in the report exceeds 100, the report will only display 100 records, and if it exceeds, it will not be displayed. The params.rownum can be empty, and the number of records that can be recorded on each page in the report defaults to the number of records that are adaptive to each page of the report. The params.rowth=0 indicates the starting number of records of the report, the params.rowth can be empty, and the params.rowth is 0 by default, indicating that the display starts from the first record of the report.
步骤S20,根据所述子表数据渲染所述报表,确定渲染后的所述报表中各表头的父子关系;Step S20, rendering the report according to the sub-table data, and determining the parent-child relationship of each header in the rendered report;
步骤S30,根据各表头的父子关系确定所述报表的级联菜单,以生成报表。Step S30: Determine the cascading menu of the report according to the parent-child relationship of each header to generate the report.
当生成所述报表的子表数据后,根据所述子表数据渲染所述报表,得到渲染后的报表,如图6所示。进一步地,在渲染过程中,只渲染所述报表中的当前页所显示的DOM元素,以避免所述报表在选择需要显示或者隐藏的列时,因操作过多的DOM元素,引发内存不足从而造成页面崩溃,无法渲染报表的情况出现。After the sub-table data of the report is generated, the report is rendered according to the sub-table data to obtain a rendered report, as shown in FIG. 6 . Further, in the rendering process, only the DOM elements displayed on the current page in the report are rendered, so as to avoid insufficient memory due to operating too many DOM elements when the report selects columns that need to be displayed or hidden. The page crashes and the report cannot be rendered.
当得到渲染后的报表后,还原所述报表中表头合并的行和列,确定所述报表中各表头的父子关系。如图7所示,在本实施例,合并后的填充单元用HB表示。由图6可知,E02-套餐与E0201-版本,以及E0202222-数量为父子关系,E02-套餐为父,E0201-版本和E0202222-数量为子,而E0201-版本与E020101、E020102以及合计为父子关系,E0201-版本为父,E020101、E020102和合计为子。由图7可知,由于E0201-版本和E0202222-数量的父选项都为E02-套餐,则还原所述报表之后,E0202222-数量所对应的父选项用HB表示;而E020101、E020102和合计的父选项都为E02-版本,因此,还原所述报表之后,E020102和合计所对应的父选项用HB表示。After the rendered report is obtained, the rows and columns of the merged headers in the report are restored, and the parent-child relationship of each header in the report is determined. As shown in FIG. 7 , in this embodiment, the combined filling unit is represented by HB. As can be seen from Figure 6, E02-package and E0201-version, and E0202222-quantity are parent-child relationships, E02-packages are parent, E0201-version and E0202222-quantity are children, and E0201-version and E020101, E020102 and the total are parent-child relationships , E0201-Version is the parent, E020101, E020102 and Total are the children. As can be seen from Figure 7, since the parent options of E0201-version and E0202222-quantity are both E02-packages, after restoring the report, the parent options corresponding to E0202222-quantity are represented by HB; and the parent options of E020101, E020102 and the total Both are E02-versions. Therefore, after restoring the report, the parent options corresponding to E020102 and the total are represented by HB.
当确定所述报表中各表头的父子关系之后,根据各表头的父子关系确定所述报表的级联菜单,以生成报表。After the parent-child relationship of each header in the report is determined, a cascading menu of the report is determined according to the parent-child relationship of each header to generate a report.
在本实施例中,当得到渲染后的报表后,还原所述报表中表头合并的行和列,确定所述报表中各表头的父子关系,不需要人为判定所述报表中各表头之间的父子关系,降低了开发者的难度和工作量。In this embodiment, after the rendered report is obtained, the rows and columns of the merged headers in the report are restored, and the parent-child relationship of the headers in the report is determined, without the need to manually determine the headers in the report The parent-child relationship between them reduces the difficulty and workload of developers.
本实施例通过根据初始化后的菜单框架生成报表的子表数据,根据所述子表数据渲染所述报表,根据渲染后的所述报表中各表头的父子关系确定各表头的级联菜单,以生成报表。实现了通过web报表展现插件生成所需要的报表,使所生成的Bootstrap table报表相对于传统的Bootstrap table报表功能更加丰富。In this embodiment, the sub-table data of the report is generated according to the initialized menu frame, the report is rendered according to the sub-table data, and the cascading menu of each header is determined according to the parent-child relationship of each header in the rendered report. , to generate the report. It realizes the required report generation through the web report display plug-in, so that the generated Bootstrap table report has more functions than the traditional Bootstrap table report.
参照图3,图3为本发明实施例中根据各表头的父子关系确定所述报表的级联菜单,以生成报表的一种流程示意图。Referring to FIG. 3 , FIG. 3 is a schematic flow chart of determining a cascading menu of the report according to the parent-child relationship of each header in an embodiment of the present invention to generate a report.
在本实施例中,所述步骤S30包括:In this embodiment, the step S30 includes:
步骤S31,根据各表头的父子关系确定所述报表树状的级联菜单;Step S31, determining the cascading menu of the report tree according to the parent-child relationship of each header;
步骤S32,根据所接收的对所述级联菜单的操作指令,以及所述级联菜单中各菜单选项当前的状态属性,生成对应的报表。Step S32: Generate a corresponding report according to the received operation instruction on the cascade menu and the current state attributes of each menu option in the cascade menu.
当确定所述报表中各表头的父子关系之后,根据各表头的父子关系确定所述报表树状的级联菜单,所述树状的级联菜单用checkbox,ul,li,Glyphicons字体图标组合定制而成。所述checkbox是在HTML中让使用者与首页上的素材发生交互作用的一种方法,其中包含checkbox控件就是我们一般所说的复选框,通常用于某选项的打开或关闭。所述li表示列表项,所述ul表示无序排列。如图8所示,在图8中,所述报表的右上角上显示有所述报表中各表头的级联菜单,从所述级联菜单中,我们可以清楚地知道所述报表中各表头的父子关系。在本实施例中,所述级联菜单一共包括三级,第一级菜单有E01-颜色、E02-套餐、E03-数量、E04-姓名、E05-姓名和E06-姓名;第二级菜单为E02-套餐的子选项,包括E0201-版本和E0202222-数量;第三级菜单为E0201-版本的子选项,包括E020101、E020102和合计。需要说明的是,所述报表的级联菜单的级数并不限制于本实施例所描述的三级,具体的可以根据具体需要而设置。After the parent-child relationship of each header in the report is determined, a tree-like cascading menu of the report is determined according to the parent-child relationship of each header, and the tree-like cascading menu uses checkbox, ul, li, Glyphicons font icons Combination custom made. The checkbox is a method for users to interact with the material on the home page in HTML, and the checkbox control contained therein is what we generally call a checkbox, which is usually used to turn on or off an option. The li represents a list item, and the ul represents an unordered arrangement. As shown in Fig. 8, in Fig. 8, a cascading menu of each header in the report is displayed on the upper right corner of the report. From the cascading menu, we can clearly know that each table in the report The parent-child relationship of the header. In this embodiment, the cascading menu includes three levels in total, the first level menu includes E01-color, E02-package, E03-quantity, E04-name, E05-name and E06-name; the second-level menu is The sub-options of E02-package include E0201-version and E0202222-quantity; the third-level menu is the sub-options of E0201-version, including E020101, E020102 and total. It should be noted that, the number of levels of the cascading menu of the report is not limited to the three levels described in this embodiment, and can be specifically set according to specific needs.
当确定所述报表树状的级联菜单之后,接收到用户对于所述级联菜单的操作指令时,确定所述级联菜单中各菜单选项当前的状态属性,以生成对应的报表。所述级联菜单中各菜单选项当前的状态属性为显示状态或者隐藏状态。当所述菜单选项当前的状态属性为显示状态,且接收到用户点击该菜单选项的操作指令时,则将所述菜单选项从显示状态转换为隐藏状态;当所述菜单选项当前的状态属性为隐藏状态,且接收到用户点击该菜单选项的操作指令时,则将所述菜单选项从隐藏状态转换为显示状态。进一步地,在接收到用户点击所述菜单选项的点击操作指令时,需要根据所述报表中各表头的父子关系对应显示或者隐藏相应的列。如图8所示,若用户在第三级菜单同时取消E020101,E020102,合计三个菜单选项,则这三个菜单选项的父选项E0201-版本也要同步取消选中,如果E0202222-数量此时也是处于取消选中状态,即E0202222-数量也要从显示状态转换为隐藏状态,则E0201-版本和E0202222-数量的父选项E02-套餐也要同步取消,即E02-套餐也要被隐藏,则与各个菜单所对应的tbody数据也要做同步隐藏、显示处理,所述tbody是一个HTML语言标签表格主体,该标签用于组合HTML表格的主体内容。如当要隐藏E020101菜单选项时,则与E020101菜单对应的数据0002、0102、0202、0302、0402、0502、0602、0702、0802和0902也要对应隐藏。进一步地,根据所述报表中列属性visibility的值处理隐藏列,删除之前还原所述报表时用HB填充的列,以生成对应的报表并显示所生成的报表。After the cascading menu in the report tree is determined, when an operation instruction of the user on the cascading menu is received, the current state attribute of each menu option in the cascading menu is determined to generate a corresponding report. The current state attribute of each menu option in the cascading menu is a displayed state or a hidden state. When the current state attribute of the menu option is the display state, and an operation instruction of the user clicking the menu option is received, the menu option is converted from the display state to the hidden state; when the current state attribute of the menu option is hidden state, and when an operation instruction of the user clicking on the menu option is received, the menu option is converted from the hidden state to the displayed state. Further, when a click operation instruction of the user clicking the menu option is received, the corresponding column needs to be displayed or hidden correspondingly according to the parent-child relationship of each header in the report. As shown in Figure 8, if the user cancels E020101 and E020102 at the same time in the third-level menu, totaling three menu options, the parent option E0201-version of these three menu options should also be simultaneously unchecked. If E0202222-quantity is also at this time In the unchecked state, that is, the E0202222-quantity should also be converted from the displayed state to the hidden state, then the parent option E02-package of E0201-version and E0202222-quantity should also be canceled synchronously, that is, the E02-package should also be hidden, and the parent options of E0201-version and E0202222-quantity should also be cancelled simultaneously The tbody data corresponding to the menu also needs to be hidden and displayed synchronously. The tbody is an HTML language tag table body, and the tag is used to combine the main body content of the HTML table. If you want to hide the E020101 menu option, the
进一步地,所述报表生成方法还包括:Further, the report generation method also includes:
确定所述报表中需要排序的待排序列,设置所述待排序列对应的排序图标,并注册所述排序图标的点击事件。Determine the to-be-sorted column to be sorted in the report, set a sorting icon corresponding to the to-be-sorted column, and register a click event of the sorting icon.
进一步地,当需要对所述报表中的一列或者多列的数据进行排序时,将所述报表中需要排序的列记为待排序列,设置所述待排序列对应的排序图标,并注册所述图标的点击事件。当侦测到用户点击所述排序图标的点击事件时,根据预设的排序算法对所述报表中的待排序列进行排序。在本实施例中,排序所用的算法为冒泡算法。需要说明的是,排序算法包括但不限于冒泡排序算法,还可以为鸡尾酒排序算法、计数排序算法和合并排序算法等。如可以通过params.order函数所对应的配置信息设置排序图标,通过排序函数F.bubble=function(parm){...}实现冒泡算法的排序。Further, when the data of one or more columns in the report needs to be sorted, the column that needs to be sorted in the report is marked as the column to be sorted, the sorting icon corresponding to the column to be sorted is set, and all the columns to be sorted are registered. Click event of the described icon. When a click event of the user clicking on the sorting icon is detected, the to-be-sorted columns in the report are sorted according to a preset sorting algorithm. In this embodiment, the algorithm used for sorting is a bubble algorithm. It should be noted that the sorting algorithm includes but is not limited to a bubble sorting algorithm, and may also be a cocktail sorting algorithm, a counting sorting algorithm, a merge sorting algorithm, and the like. For example, the sorting icon can be set by the configuration information corresponding to the params.order function, and the sorting of the bubble algorithm can be realized by the sorting function F.bubble=function(parm){...}.
需要说明的是,当对所述报表中的待排序列进行排序之后,因为改变了所述报表中所显示数据的顺序,所以需要再次生成所述报表的子表数据、渲染所述报表等。It should be noted that, after sorting the to-be-sorted columns in the report, since the order of data displayed in the report is changed, it is necessary to generate sub-table data of the report again, render the report, and so on.
本实施例通过生成所述报表的树状的级联菜单,供用户可以通过所述报表的级联菜单选择显示或者隐藏所述报表中相应的数据。进一步地,通过设置所述报表的排序图标,实现对所述报表的排序功能,扩充了所生成报表的功能。In this embodiment, a tree-like cascading menu of the report is generated, so that the user can choose to display or hide the corresponding data in the report through the cascading menu of the report. Further, by setting the sorting icon of the report, the function of sorting the report is realized, and the function of the generated report is expanded.
进一步地,为了增加所生成的报表的功能,提出本实施例。Further, in order to increase the function of the generated report, this embodiment is proposed.
在本实施例中,所述报表生成方法还包括:In this embodiment, the report generation method further includes:
步骤a,当所述报表为多页报表时,设置所述报表的分页方式;Step a, when the report is a multi-page report, the paging mode of the report is set;
步骤b,若所述分页方式为第一分页方式,则确定所述报表中待显示数据的行数,以及每页报表所能显示数据的行数;Step b, if the paging mode is the first paging mode, then determine the number of rows of data to be displayed in the report, and the number of rows of data that can be displayed in each page of the report;
步骤c,根据所述待显示数据的行数和每页报表所能显示数据的行数计算所述报表的页数;Step c, calculating the number of pages of the report according to the number of rows of the data to be displayed and the number of rows of the data that can be displayed in each page of the report;
当所述报表为多页报表时,可以根据需要设置所述报表的分页方式。所述FTable支持的分页方式包括两种分页方式,第一分页方式为传统分页,第二分页方式为滚动分页。当所述报表的分页方式为传统分页方式时,通过使用jPage插件(Jquery)实现所述报表的传统分页。在采用传统分页对所述报表进行分页过程中,要确定所述报表中待显示数据的行数,即所述报表中待显示的记录数,以及每页报表所能显示数据的行数,然后根据所述待显示数据的行数和每页报表所能显示数据的行数计算所述报表的页数。When the report is a multi-page report, the pagination mode of the report can be set as required. The paging modes supported by the FTable include two paging modes, the first paging mode is traditional paging, and the second paging mode is scrolling paging. When the paging mode of the report is the traditional paging mode, the traditional paging of the report is realized by using a jPage plug-in (Jquery). In the process of paging the report using traditional paging, the number of rows of data to be displayed in the report is determined, that is, the number of records to be displayed in the report, and the number of rows of data that can be displayed on each page of the report, and then The number of pages of the report is calculated according to the number of lines of the data to be displayed and the number of lines of data that can be displayed on each page of the report.
步骤d,若所述分页方式为第二分页方式,则根据所述报表中数据的总行数,以及渲染后的所述报表中各行的行高计算滚动条的长度,以得到所述第二分页方式中滚动条的长度。Step d, if the paging mode is the second paging mode, calculate the length of the scroll bar according to the total number of rows of data in the report and the row height of each row in the rendered report to obtain the second paging The length of the scroll bar in the mode.
若所述分页方式为第二分页方式,即采用滚动分页方式显示所述报表中的数据,则根据所述报表中数据的总行数,以及渲染后的所述报表中各行的行高计算滚动条的长度,以得到所述第二分页方式中滚动条的长度。需要说明的是,在采用滚动分页方式显示所述报表中的数据时,用户可以根据需要设置是显示所述报表中当前所显示的部分数据,还是将所述报表中的全部数据都通过所述滚动分页方式显示出来。进一步地,通过所述滚动分页方式可以实现交叉分页显示所述报表中的数据,即可以将所述报表中的前面一页的部分数据与后面一页的部分数据同时显示出来,供用户查看。If the paging mode is the second paging mode, that is, the data in the report is displayed in a scrolling paging mode, the scroll bar is calculated according to the total number of rows of data in the report and the row height of each row in the rendered report. to obtain the length of the scroll bar in the second paging mode. It should be noted that when the data in the report is displayed in the way of scrolling paging, the user can set whether to display part of the data currently displayed in the report or pass all the data in the report through the The scrolling pagination method is displayed. Further, the data in the report can be displayed by cross paging through the scroll paging method, that is, part of the data on the previous page and part of the data on the next page in the report can be simultaneously displayed for the user to view.
进一步地,所述报表生成方法还包括:Further, the report generation method also includes:
步骤e,判断各页报表所显示的行数是否小于每页报表所能显示的行数;Step e, judging whether the number of rows displayed in each page of the report is less than the number of rows that can be displayed in each page of the report;
步骤f,若某页报表所显示行数小于每页报表所能显示的行数,则将该页报表标记为待补齐分页报表;In step f, if the number of rows displayed in a certain page of the report is less than the number of rows that can be displayed in each page of the report, the page of the report is marked as a paging report to be completed;
步骤g,根据每页报表所能显示的行数补齐所述待补齐分页报表的行高,以使所述报表中各分页报表的高度一致。In step g, the row heights of the to-be-completed paginated report are supplemented according to the number of rows that can be displayed on each page of the report, so that the heights of the paginated reports in the report are consistent.
当采用传统分页方式显示所述报表中的数据时,判断所述报表中各页报表所显示的行数是否小于每页报表所能显示的行数。若某页报表所显示行数小于每页报表所能显示的行数,则将该页报表标记为待补齐分页报表,根据每页报表所能显示的行数补齐所述待补齐分页报表的行高,以使所述报表中各分页报表的高度一致。如若一页报表能显示20行数据,而某页报表只显示了18行数据,则将只显示了18行数据的这页报表标记为待补齐分页报表,根据显示20行数据的该页报表补齐所述待补齐分页报表的行高,以使所述报表中各分页报表的高度一致。如图9所示,通过在所述待补齐分页报表中补充“-”,以使所述报表中各分页报表的高度一致,使所述报表的页面美观,而且,若需要通过滚动方式显示所述报表中的数据时,在计算滚动分页方式滚动条的长度时,由于所述报表各页报表的高度一致,降低了计算滚动分页方式滚动条的长度的计算量。When the data in the report is displayed in a traditional paging manner, it is determined whether the number of rows displayed by each page of the report in the report is less than the number of rows that can be displayed in each page of the report. If the number of rows displayed on a page of the report is less than the number of rows that can be displayed on each page of the report, the page of the report will be marked as a pagination report to be completed, and the pagination to be completed will be completed according to the number of rows that can be displayed in each page of the report. The row height of the report, so that the heights of the paginated reports in the report are consistent. If one page of report can display 20 rows of data, and a certain page of report only displays 18 rows of data, then mark this page of report that only displays 18 rows of data as a paging report to be completed, according to the page of the report that displays 20 rows of data The row height of the paginated report to be filled is filled, so that the heights of the paginated reports in the report are consistent. As shown in Fig. 9, by adding "-" in the paging report to be completed, the height of each paging report in the report is consistent, so that the page of the report is beautiful, and if necessary, it can be displayed by scrolling. When calculating the length of the scroll bar in the scrolling paging mode, the heights of the reports on each page of the report form are the same when calculating the length of the scroll bar in the scrolling paging mode.
进一步地,在本实施例中,通过所述FTable得到所述报表的具体实施方式可为:Further, in this embodiment, the specific implementation of obtaining the report through the FTable may be:

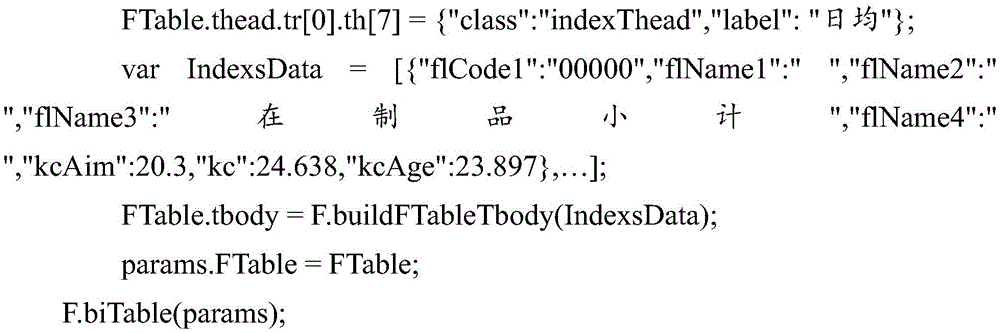
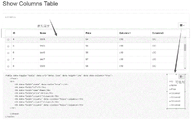
在本实施例中,在用params.warning设置所述报表的预警列时,ActureValue表示所述报表中对应列的实际值,TargetValue表示所述报表中对应的列的目标值,rule表示所述报表中预警列的显示规则,区分正向和负向指标,在本实施例中,用1表示正向指标,值越大越好,用0表示负向指标,值越小越好(如利润指标就是正向指标,越高越好,能耗就是负向指标,越低越好);color表示所述报表中异常指标所对应的数值的显示颜色。Class和style表示控制所述报表中各字段样式,即在所述报表中是显示还是隐藏隐藏该字段。tbody是所述报表的记录数据,即所述报表中所含有的数据,通过Jquery的$.ajax的方式从服务器端获取所述报表需展现的数据,其格式为List<Map>,用JSONArray.fromObject()把List<Map>数据转成json数据格式以进行显示。通过FTable的buildFTableTbody方法把data转成FTable.tbody,其中所述报表中的数值字段默认靠右对齐,文字字段靠左对齐。然后配置所述报表所需的params.thead和params.tbody后,调用FTableF.biTable(params),即可生成如图10所示的报表。在图10中,用方框圈起来的数字24.638、23.897、3.833、4.122、1.12、1.069、0.185、0.143、0.162、0.512、0.13和0.157为预警列,表示这几个的数值已超过设定的标准值。在显示这个几个数值的时候,可以设置与其他数值不同颜色进行显示,以达到警示用户的效果。In this embodiment, when params.warning is used to set the warning column of the report, ActureValue indicates the actual value of the corresponding column in the report, TargetValue indicates the target value of the corresponding column in the report, and rule indicates the report The display rules of the middle warning column distinguish between positive and negative indicators. In this embodiment, 1 is used to represent a positive indicator, the larger the value, the better, and 0 is used to represent a negative indicator, and the smaller the value, the better (for example, the profit indicator is Positive indicator, the higher the better, the energy consumption is a negative indicator, the lower the better); color indicates the display color of the value corresponding to the abnormal indicator in the report. Class and style indicate to control the style of each field in the report, that is, whether to display or hide the field in the report. tbody is the record data of the report, that is, the data contained in the report. The data to be displayed by the report is obtained from the server through the $.ajax method of Jquery. The format is List<Map>, using JSONArray. fromObject() converts List<Map> data into json data format for display. The data is converted into FTable.tbody through the buildFTableTbody method of FTable, wherein the numerical fields in the report are aligned to the right by default, and the text fields are aligned to the left. Then, after configuring the params.thead and params.tbody required by the report, call FTableF.biTable(params) to generate the report as shown in Figure 10. In Figure 10, the numbers 24.638, 23.897, 3.833, 4.122, 1.12, 1.069, 0.185, 0.143, 0.162, 0.512, 0.13 and 0.157 are the warning columns, indicating that the values of these numbers have exceeded the set values. standard value. When displaying these several values, you can set different colors to display with other values to achieve the effect of alerting the user.
本发明进一步提供一种报表生成装置。The present invention further provides a report generation device.
参照图4,图4为本发明报表生成装置的较佳实施例的功能模块示意图。Referring to FIG. 4, FIG. 4 is a schematic diagram of functional modules of a preferred embodiment of the report generating apparatus of the present invention.
在本实施例中,所述报表生成装置包括:In this embodiment, the report generating device includes:
生成模块10,用于初始化报表的菜单框架,根据所述菜单框架生成所述报表的子表数据;
在本实施例中,通过使用web报表展现插件(FTable)生成报表,所述FTable采用JQuery和Bootstrap技术对传统HTML表格进行了功能扩充,所述JQuery用于操作DOM,所述Bootstrap用于CSS/HTML布局。所述JQuery是继prototype之后又一个优秀的Javascript库。所述JQuery使用户能更方便地处理HTML(标准通用标记语言下的一个应用)、events、实现动画效果,并且方便地为网站提供ajax交互。所述JQuery是一个兼容多浏览器的javascript库。In this embodiment, a report is generated by using a web report presentation plug-in (FTable), the FTable uses JQuery and Bootstrap technology to expand the functions of traditional HTML tables, the JQuery is used for operating the DOM, and the Bootstrap is used for CSS/ HTML layout. The JQuery is another excellent Javascript library after prototype. The JQuery enables users to more conveniently process HTML (an application under the standard general markup language), events, realize animation effects, and conveniently provide ajax interaction for websites. The JQuery is a multi-browser compatible javascript library.
当在生成报表过程中,所述FTable先初始化报表的菜单框架。其中,所述报表的菜单框架包括所述报表所在的div容器、所述报表的标题、所述报表中各数据的单位、所述报表中每页报表所能记录数据的行数、所述报表的起始记录数、所述报表的分页方式、所述报表tbody中需要合并的列、所述报表中需要预警显示的列、是否在所述报表中显示选择菜单和是否在所述报表中显示下载按钮及下载类型等。如通过params.divid='container'表示所述报表所在的div容器。When generating a report, the FTable first initializes the menu frame of the report. The menu frame of the report includes the div container where the report is located, the title of the report, the unit of each data in the report, the number of rows of data that can be recorded on each page of the report, the report The number of starting records, the paging method of the report, the columns to be merged in the report tbody, the columns to be displayed in the report for warning, whether to display the selection menu in the report and whether to display it in the report Download button and download type, etc. For example, params.divid='container' indicates the div container where the report is located.
当所述FTable初始化所述报表的菜单框架时,所述FTable根据所述菜单框架设置所述子表的参数,生成所述报表的子表数据,得到所述报表的子表。所述子表的参数包括所述报表中每页报表所能记录的行数,即每页报表中的记录数,以及每页报表的起始行的记录数。如通过params.rownum=10以及params.rowth=0生成所述报表的子表,其中,所述params.rownum=10表示所述报表中每页所能记载的记录数为10,当所述报表中一共只有10页,且所述报表中的记录数超过100条时,所述报表只会显示100条记录数,超过的则不会显示。所述params.rownum可为空,所述报表中每页所能记载的记录数默认为每页报表自适应的记录数。所述params.rowth=0表示所述报表的起始记录数,所述params.rowth可为空,所述params.rowth默认为0,表示从所述报表的第一条记录数开始显示。When the FTable initializes the menu frame of the report, the FTable sets the parameters of the sub-table according to the menu frame, generates sub-table data of the report, and obtains the sub-table of the report. The parameters of the sub-table include the number of rows that can be recorded in each page of the report in the report, that is, the number of records in each page of the report, and the number of records in the starting row of each page of the report. For example, the sub-table of the report is generated by params.rownum=10 and params.rowth=0, wherein the params.rownum=10 indicates that the number of records that can be recorded on each page in the report is 10. When the report There are only 10 pages in total in the report, and when the number of records in the report exceeds 100, the report will only display 100 records, and if it exceeds, it will not be displayed. The params.rownum can be empty, and the number of records that can be recorded on each page in the report defaults to the number of records that are adaptive to each page of the report. The params.rowth=0 indicates the starting number of records of the report, the params.rowth can be empty, and the params.rowth is 0 by default, indicating that the display starts from the first record of the report.
渲染模块20,用于根据所述子表数据渲染所述报表,确定渲染后的所述报表中各表头的父子关系;A
确定模块30,用于根据各表头的父子关系确定所述报表的级联菜单,以生成报表。The determining
当生成所述报表的子表数据后,根据所述子表数据渲染所述报表,得到渲染后的报表,如图6所示。进一步地,在渲染过程中,只渲染所述报表中的当前页所显示的DOM元素,以避免所述报表在选择需要显示或者隐藏的列时,因操作过多的DOM元素,引发内存不足从而造成页面崩溃,无法渲染报表的情况出现。After the sub-table data of the report is generated, the report is rendered according to the sub-table data to obtain a rendered report, as shown in FIG. 6 . Further, in the rendering process, only the DOM elements displayed on the current page in the report are rendered, so as to avoid insufficient memory due to operating too many DOM elements when the report selects columns that need to be displayed or hidden. The page crashes and the report cannot be rendered.
当得到渲染后的报表后,还原所述报表中表头合并的行和列,确定所述报表中各表头的父子关系。如图7所示,在本实施例,合并后的填充单元用HB表示。由图6可知,E02-套餐与E0201-版本,以及E0202222-数量为父子关系,E02-套餐为父,E0201-版本和E0202222-数量为子,而E0201-版本与E020101、E020102以及合计为父子关系,E0201-版本为父,E020101、E020102和合计为子。由图7可知,由于E0201-版本和E0202222-数量的父选项都为E02-套餐,则还原所述报表之后,E0202222-数量所对应的父选项用HB表示;而E020101、E020102和合计的父选项都为E02-版本,因此,还原所述报表之后,E020102和合计所对应的父选项用HB表示。After the rendered report is obtained, the rows and columns of the merged headers in the report are restored, and the parent-child relationship of each header in the report is determined. As shown in FIG. 7 , in this embodiment, the combined filling unit is represented by HB. As can be seen from Figure 6, E02-package and E0201-version, and E0202222-quantity are parent-child relationships, E02-packages are parent, E0201-version and E0202222-quantity are children, and E0201-version and E020101, E020102 and the total are parent-child relationships , E0201-Version is the parent, E020101, E020102 and Total are the children. As can be seen from Figure 7, since the parent options of E0201-version and E0202222-quantity are both E02-packages, after restoring the report, the parent options corresponding to E0202222-quantity are represented by HB; and the parent options of E020101, E020102 and the total Both are E02-versions. Therefore, after restoring the report, the parent options corresponding to E020102 and the total are represented by HB.
当确定所述报表中各表头的父子关系之后,根据各表头的父子关系确定所述报表的级联菜单,以生成报表。After the parent-child relationship of each header in the report is determined, a cascading menu of the report is determined according to the parent-child relationship of each header to generate a report.
在本实施例中,当得到渲染后的报表后,还原所述报表中表头合并的行和列,确定所述报表中各表头的父子关系,不需要人为判定所述报表中各表头之间的父子关系,降低了开发者的难度和工作量。In this embodiment, after the rendered report is obtained, the rows and columns of the merged headers in the report are restored, and the parent-child relationship of the headers in the report is determined, without the need to manually determine the headers in the report The parent-child relationship between them reduces the difficulty and workload of developers.
本实施例通过根据初始化后的菜单框架生成报表的子表数据,根据所述子表数据渲染所述报表,根据渲染后的所述报表中各表头的父子关系确定各表头的级联菜单,以生成报表。实现了通过web报表展现插件生成所需要的报表,使所生成的Bootstrap table报表相对于传统的Bootstrap table报表功能更加丰富。In this embodiment, the sub-table data of the report is generated according to the initialized menu frame, the report is rendered according to the sub-table data, and the cascading menu of each header is determined according to the parent-child relationship of each header in the rendered report. , to generate the report. It realizes the required report generation through the web report display plug-in, so that the generated Bootstrap table report has more functions than the traditional Bootstrap table report.
参照图5,图5为本发明实施例中确定模块的一种功能模块示意图。Referring to FIG. 5 , FIG. 5 is a schematic diagram of a functional module of a determination module in an embodiment of the present invention.
在本实施例中,所述确定模块30包括:In this embodiment, the determining
确定单元31,用于根据各表头的父子关系确定所述报表树状的级联菜单;Determining
处理单元32,用于根据所接收的对所述级联菜单的操作指令,以及所述级联菜单中各菜单选项当前的状态属性,生成对应的报表。The
当确定所述报表中各表头的父子关系之后,根据各表头的父子关系确定所述报表树状的级联菜单,所述树状的级联菜单用checkbox,ul,li,Glyphicons字体图标组合定制而成。所述checkbox是在HTML中让使用者与首页上的素材发生交互作用的一种方法,其中包含checkbox控件就是我们一般所说的复选框,通常用于某选项的打开或关闭。所述li表示列表项,所述ul表示无序排列。如图8所示,在图8中,所述报表的右上角上显示有所述报表中各表头的级联菜单,从所述级联菜单中,我们可以清楚地知道所述报表中各表头的父子关系。在本实施例中,所述级联菜单一共包括三级,第一级菜单有E01-颜色、E02-套餐、E03-数量、E04-姓名、E05-姓名和E06-姓名;第二级菜单为E02-套餐的子选项,包括E0201-版本和E0202222-数量;第三级菜单为E0201-版本的子选项,包括E020101、E020102和合计。需要说明的是,所述报表的级联菜单的级数并不限制于本实施例所描述的三级,具体的可以根据具体需要而设置。After the parent-child relationship of each header in the report is determined, a tree-like cascading menu of the report is determined according to the parent-child relationship of each header, and the tree-like cascading menu uses checkbox, ul, li, Glyphicons font icons Combination custom made. The checkbox is a method for users to interact with the material on the home page in HTML, and the checkbox control contained therein is what we generally call a checkbox, which is usually used to turn on or off an option. The li represents a list item, and the ul represents an unordered arrangement. As shown in Fig. 8, in Fig. 8, a cascading menu of each header in the report is displayed on the upper right corner of the report. From the cascading menu, we can clearly know that each table in the report The parent-child relationship of the header. In this embodiment, the cascading menu includes three levels in total, the first level menu includes E01-color, E02-package, E03-quantity, E04-name, E05-name and E06-name; the second-level menu is The sub-options of E02-package include E0201-version and E0202222-quantity; the third-level menu is the sub-options of E0201-version, including E020101, E020102 and total. It should be noted that, the number of levels of the cascading menu of the report is not limited to the three levels described in this embodiment, and can be specifically set according to specific needs.
当确定所述报表树状的级联菜单之后,接收到用户对于所述级联菜单的操作指令时,确定所述级联菜单中各菜单选项当前的状态属性,以生成对应的报表。所述级联菜单中各菜单选项当前的状态属性为显示状态或者隐藏状态。当所述菜单选项当前的状态属性为显示状态,且接收到用户点击该菜单选项的操作指令时,则将所述菜单选项从显示状态转换为隐藏状态;当所述菜单选项当前的状态属性为隐藏状态,且接收到用户点击该菜单选项的操作指令时,则将所述菜单选项从隐藏状态转换为显示状态。进一步地,在接收到用户点击所述菜单选项的点击操作指令时,需要根据所述报表中各表头的父子关系对应显示或者隐藏相应的列。如图8所示,若用户在第三级菜单同时取消E020101,E020102,合计三个菜单选项,则这三个菜单选项的父选项E0201-版本也要同步取消选中,如果E0202222-数量此时也是处于取消选中状态,即E0202222-数量也要从显示状态转换为隐藏状态,则E0201-版本和E0202222-数量的父选项E02-套餐也要同步取消,即E02-套餐也要被隐藏,则与各个菜单所对应的tbody数据也要做同步隐藏、显示处理,所述tbody是一个HTML语言标签表格主体,该标签用于组合HTML表格的主体内容。如当要隐藏E020101菜单选项时,则与E020101菜单对应的数据0002、0102、0202、0302、0402、0502、0602、0702、0802和0902也要对应隐藏。进一步地,根据所述报表中列属性visibility的值处理隐藏列,删除之前还原所述报表时用HB填充的列,以生成对应的报表并显示所生成的报表。After the cascading menu in the report tree is determined, when an operation instruction of the user on the cascading menu is received, the current state attribute of each menu option in the cascading menu is determined to generate a corresponding report. The current state attribute of each menu option in the cascading menu is a displayed state or a hidden state. When the current state attribute of the menu option is the display state, and an operation instruction of the user clicking the menu option is received, the menu option is converted from the display state to the hidden state; when the current state attribute of the menu option is hidden state, and when an operation instruction of the user clicking on the menu option is received, the menu option is converted from the hidden state to the displayed state. Further, when a click operation instruction of the user clicking the menu option is received, the corresponding column needs to be displayed or hidden correspondingly according to the parent-child relationship of each header in the report. As shown in Figure 8, if the user cancels E020101 and E020102 at the same time in the third-level menu, totaling three menu options, the parent option E0201-version of these three menu options should also be simultaneously unchecked. If E0202222-quantity is also at this time In the unchecked state, that is, the E0202222-quantity should also be converted from the displayed state to the hidden state, then the parent option E02-package of E0201-version and E0202222-quantity should also be canceled synchronously, that is, the E02-package should also be hidden, and the parent options of E0201-version and E0202222-quantity should also be cancelled simultaneously The tbody data corresponding to the menu also needs to be hidden and displayed synchronously. The tbody is an HTML language tag table body, and the tag is used to combine the main body content of the HTML table. If you want to hide the E020101 menu option, the
进一步地,所述报表生成装置还包括:图标设置模块,用于确定所述报表中需要排序的待排序列,设置所述待排序列对应的排序图标,并注册所述排序图标的点击事件。Further, the report generating apparatus further includes: an icon setting module, configured to determine the to-be-sorted column to be sorted in the report, set a sorting icon corresponding to the to-be-sorted column, and register a click event of the sorting icon.
进一步地,当需要对所述报表中的一列或者多列的数据进行排序时,将所述报表中需要排序的列记为待排序列,设置所述待排序列对应的排序图标,并注册所述图标的点击事件。当侦测到用户点击所述排序图标的点击事件时,根据预设的排序算法对所述报表中的待排序列进行排序。在本实施例中,排序所用的算法为冒泡算法。需要说明的是,排序算法包括但不限于冒泡排序算法,还可以为鸡尾酒排序算法、计数排序算法和合并排序算法等。如可以通过params.order函数所对应的配置信息设置排序图标,通过排序函数F.bubble=function(parm){...}实现冒泡算法的排序。Further, when the data of one or more columns in the report needs to be sorted, the column that needs to be sorted in the report is marked as the column to be sorted, the sorting icon corresponding to the column to be sorted is set, and all the columns to be sorted are registered. Click event of the described icon. When a click event of the user clicking on the sorting icon is detected, the to-be-sorted columns in the report are sorted according to a preset sorting algorithm. In this embodiment, the algorithm used for sorting is a bubble algorithm. It should be noted that the sorting algorithm includes but is not limited to a bubble sorting algorithm, and may also be a cocktail sorting algorithm, a counting sorting algorithm, a merge sorting algorithm, and the like. For example, the sorting icon can be set by the configuration information corresponding to the params.order function, and the sorting of the bubble algorithm can be realized by the sorting function F.bubble=function(parm){...}.
需要说明的是,当对所述报表中的待排序列进行排序之后,因为改变了所述报表中所显示数据的顺序,所以需要再次生成所述报表的子表数据、渲染所述报表等。It should be noted that, after sorting the to-be-sorted columns in the report, since the order of data displayed in the report is changed, it is necessary to generate sub-table data of the report again, render the report, and so on.
本实施例通过生成所述报表的树状的级联菜单,供用户可以通过所述报表的级联菜单选择显示或者隐藏所述报表中相应的数据。进一步地,通过设置所述报表的排序图标,实现对所述报表的排序功能,扩充了所生成报表的功能。In this embodiment, a tree-like cascading menu of the report is generated, so that the user can choose to display or hide the corresponding data in the report through the cascading menu of the report. Further, by setting the sorting icon of the report, the function of sorting the report is realized, and the function of the generated report is expanded.
进一步地,为了增加所生成的报表的功能,提出本实施例。Further, in order to increase the function of the generated report, this embodiment is proposed.
在本实施例中,所述报表生成装置还包括:In this embodiment, the report generating device further includes:
分页设置模块,用于当所述报表为多页报表时,设置所述报表的分页方式;a paging setting module, used for setting the paging mode of the report when the report is a multi-page report;
所述确定模块还用于若所述分页方式为第一分页方式,则确定所述报表中待显示数据的行数,以及每页报表所能显示数据的行数;The determining module is further configured to determine the number of rows of data to be displayed in the report and the number of rows of data that can be displayed on each page of the report if the paging mode is the first paging mode;
计算模块,用于根据所述待显示数据的行数和每页报表所能显示数据的行数计算所述报表的页数;a calculation module for calculating the number of pages of the report according to the number of rows of the data to be displayed and the number of rows of the data that can be displayed in each page of the report;
当所述报表为多页报表时,可以根据需要设置所述报表的分页方式。所述FTable支持的分页方式包括两种分页方式,第一分页方式为传统分页,第二分页方式为滚动分页。当所述报表的分页方式为传统分页方式时,通过使用jPage插件(Jquery)实现所述报表的传统分页。在采用传统分页对所述报表进行分页过程中,要确定所述报表中待显示数据的行数,即所述报表中待显示的记录数,以及每页报表所能显示数据的行数,然后根据所述待显示数据的行数和每页报表所能显示数据的行数计算所述报表的页数。When the report is a multi-page report, the pagination mode of the report can be set as required. The paging modes supported by the FTable include two paging modes, the first paging mode is traditional paging, and the second paging mode is scrolling paging. When the paging mode of the report is the traditional paging mode, the traditional paging of the report is realized by using a jPage plug-in (Jquery). In the process of paging the report using traditional paging, the number of rows of data to be displayed in the report is determined, that is, the number of records to be displayed in the report, and the number of rows of data that can be displayed on each page of the report, and then The number of pages of the report is calculated according to the number of lines of the data to be displayed and the number of lines of data that can be displayed on each page of the report.
所述计算模块还用于若所述分页方式为第二分页方式,则根据所述报表中数据的总行数,以及渲染后的所述报表中各行的行高计算滚动条的长度,以得到所述第二分页方式中滚动条的长度。The calculation module is further configured to calculate the length of the scroll bar according to the total number of rows of data in the report and the row height of each row in the rendered report if the paging mode is the second paging mode, so as to obtain the result. The length of the scroll bar in the second paging method.
若所述分页方式为第二分页方式,即采用滚动分页方式显示所述报表中的数据,则根据所述报表中数据的总行数,以及渲染后的所述报表中各行的行高计算滚动条的长度,以得到所述第二分页方式中滚动条的长度。需要说明的是,在采用滚动分页方式显示所述报表中的数据时,用户可以根据需要设置是显示所述报表中当前所显示的部分数据,还是将所述报表中的全部数据都通过所述滚动分页方式显示出来。进一步地,通过所述滚动分页方式可以实现交叉分页显示所述报表中的数据,即可以将所述报表中的前面一页的部分数据与后面一页的部分数据同时显示出来,供用户查看。If the paging mode is the second paging mode, that is, the data in the report is displayed in a scrolling paging mode, the scroll bar is calculated according to the total number of rows of data in the report and the row height of each row in the rendered report. to obtain the length of the scroll bar in the second paging mode. It should be noted that when the data in the report is displayed in the way of scrolling paging, the user can set whether to display part of the data currently displayed in the report or pass all the data in the report through the The scrolling pagination mode is displayed. Further, the data in the report can be displayed by cross paging through the scroll paging method, that is, part of the data on the previous page and part of the data on the next page in the report can be simultaneously displayed for the user to view.
进一步地,所述报表生成装置还包括:Further, the report generation device also includes:
判断模块,用于判断各页报表所显示的行数是否小于每页报表所能显示的行数;The judgment module is used to judge whether the number of rows displayed in each page of the report is less than the number of rows that can be displayed in each page of the report;
标记模块,用于若某页报表所显示行数小于每页报表所能显示的行数,则将该页报表标记为待补齐分页报表;The marking module is used to mark the page of the report as a paginated report to be completed if the number of rows displayed on a certain page of the report is less than the number of rows that can be displayed on each page of the report;
补齐模块,用于根据每页报表所能显示的行数补齐所述待补齐分页报表的行高,以使所述报表中各分页报表的高度一致。The complementing module is used for complementing the row height of the paginated report to be completed according to the number of rows that can be displayed on each page of the report, so that the heights of the paginated reports in the report are consistent.
当采用传统分页方式显示所述报表中的数据时,判断所述报表中各页报表所显示的行数是否小于每页报表所能显示的行数。若某页报表所显示行数小于每页报表所能显示的行数,则将该页报表标记为待补齐分页报表,根据每页报表所能显示的行数补齐所述待补齐分页报表的行高,以使所述报表中各分页报表的高度一致。如若一页报表能显示20行数据,而某页报表只显示了18行数据,则将只显示了18行数据的这页报表标记为待补齐分页报表,根据显示20行数据的该页报表补齐所述待补齐分页报表的行高,以使所述报表中各分页报表的高度一致。如图9所示,通过在所述待补齐分页报表中补充“-”,以使所述报表中各分页报表的高度一致,使所述报表的页面美观,而且,若需要通过滚动方式显示所述报表中的数据时,在计算滚动分页方式滚动条的长度时,由于所述报表各页报表的高度一致,降低了计算滚动分页方式滚动条的长度的计算量。When the data in the report is displayed in a traditional paging manner, it is determined whether the number of rows displayed by each page of the report in the report is less than the number of rows that can be displayed in each page of the report. If the number of rows displayed on a page of the report is less than the number of rows that can be displayed on each page of the report, the page of the report will be marked as a pagination report to be completed, and the pagination to be completed will be completed according to the number of rows that can be displayed in each page of the report. The row height of the report, so that the heights of the paginated reports in the report are consistent. If one page of report can display 20 rows of data, and a certain page of report only displays 18 rows of data, then mark this page of report that only displays 18 rows of data as a paging report to be completed, according to the page of the report that displays 20 rows of data The row height of the paginated report to be filled is filled, so that the heights of the paginated reports in the report are consistent. As shown in Fig. 9, by adding "-" in the paging report to be completed, the height of each paging report in the report is consistent, so that the page of the report is beautiful, and if necessary, it can be displayed by scrolling. When calculating the length of the scroll bar in the scrolling paging mode, the heights of the reports on each page of the report form are the same when calculating the length of the scroll bar in the scrolling paging mode.
进一步地,在本实施例中,通过所述FTable得到所述报表的具体过程可为:Further, in this embodiment, the specific process of obtaining the report through the FTable may be:


在本实施例中,在用params.warning设置所述报表的预警列时,ActureValue表示所述报表中对应列的实际值,TargetValue表示所述报表中对应的列的目标值,rule表示所述报表中预警列的显示规则,区分正向和负向指标,在本实施例中,用1表示正向指标,值越大越好,用0表示负向指标,值越小越好(如利润指标就是正向指标,越高越好,能耗就是负向指标,越低越好);color表示所述报表中异常指标所对应的数值的显示颜色。Class和style表示控制所述报表中各字段样式,即在所述报表中是显示还是隐藏隐藏该字段。tbody是所述报表的记录数据,即所述报表中所含有的数据,通过Jquery的$.ajax的方式从服务器端获取所述报表需展现的数据,其格式为List<Map>,用JSONArray.fromObject()把List<Map>数据转成json数据格式以进行显示。通过FTable的buildFTableTbody方法把data转成FTable.tbody,其中所述报表中的数值字段默认靠右对齐,文字字段靠左对齐。然后配置所述报表所需的params.thead和params.tbody后,调用FTableF.biTable(params),即可生成如图10所示的报表。在图10中,用方框圈起来的数字24.638、23.897、3.833、4.122、1.12、1.069、0.185、0.143、0.162、0.512、0.13和0.157为预警列,表示这几个的数值已超过设定的标准值。在显示这个几个数值的时候,可以设置与其他数值不同颜色进行显示,以达到警示用户的效果。In this embodiment, when params.warning is used to set the warning column of the report, ActureValue indicates the actual value of the corresponding column in the report, TargetValue indicates the target value of the corresponding column in the report, and rule indicates the report The display rules of the middle warning column distinguish between positive and negative indicators. In this embodiment, 1 is used to represent a positive indicator, the larger the value, the better, and 0 is used to represent a negative indicator, and the smaller the value, the better (for example, the profit indicator is Positive indicator, the higher the better, the energy consumption is a negative indicator, the lower the better); color indicates the display color of the value corresponding to the abnormal indicator in the report. Class and style indicate to control the style of each field in the report, that is, whether to display or hide the field in the report. tbody is the record data of the report, that is, the data contained in the report. The data to be displayed by the report is obtained from the server through the $.ajax method of Jquery. The format is List<Map>, using JSONArray. fromObject() converts List<Map> data into json data format for display. The data is converted into FTable.tbody through the buildFTableTbody method of FTable, wherein the numerical fields in the report are aligned to the right by default, and the text fields are aligned to the left. Then, after configuring the params.thead and params.tbody required by the report, call FTableF.biTable(params) to generate the report as shown in Figure 10. In Figure 10, the numbers 24.638, 23.897, 3.833, 4.122, 1.12, 1.069, 0.185, 0.143, 0.162, 0.512, 0.13 and 0.157 are the warning columns, indicating that the values of these numbers have exceeded the set values. standard value. When displaying these several values, you can set different colors to display with other values to achieve the effect of alerting the user.
上述本发明实施例序号仅仅为了描述,不代表实施例的优劣。通过以上的实施方式的描述,本领域的技术人员可以清楚地了解到上述实施例方法可借助软件加必需的通用硬件平台的方式来实现,当然也可以通过硬件,但很多情况下前者是更佳的实施方式。基于这样的理解,本发明的技术方案本质上或者说对现有技术做出贡献的部分可以以软件产品的形式体现出来,该计算机软件产品存储在一个存储介质(如ROM/RAM、磁碟、光盘)中,包括若干指令用以使得一台终端设备(可以是手机,计算机,服务器,或者网络设备等)执行本发明各个实施例所述的方法。The above-mentioned serial numbers of the embodiments of the present invention are only for description, and do not represent the advantages or disadvantages of the embodiments. From the description of the above embodiments, those skilled in the art can clearly understand that the method of the above embodiment can be implemented by means of software plus a necessary general hardware platform, and of course can also be implemented by hardware, but in many cases the former is better implementation. Based on this understanding, the technical solutions of the present invention can be embodied in the form of software products in essence or the parts that make contributions to the prior art, and the computer software products are stored in a storage medium (such as ROM/RAM, magnetic disk, CD-ROM), including several instructions to make a terminal device (which may be a mobile phone, a computer, a server, or a network device, etc.) to execute the methods described in the various embodiments of the present invention.
以上仅为本发明的优选实施例,并非因此限制本发明的专利范围,凡是利用本发明说明书及附图内容所作的等效结构或等效流程变换,或直接或间接运用在其他相关的技术领域,均同理包括在本发明的专利保护范围内。The above are only preferred embodiments of the present invention, and are not intended to limit the scope of the present invention. Any equivalent structure or equivalent process transformation made by using the contents of the description and drawings of the present invention, or directly or indirectly applied in other related technical fields , are similarly included in the scope of patent protection of the present invention.
Claims (6)
Priority Applications (1)
| Application Number | Priority Date | Filing Date | Title |
|---|---|---|---|
| CN201610649885.7A CN106294301B (en) | 2016-08-09 | 2016-08-09 | Report generation method and device |
Applications Claiming Priority (1)
| Application Number | Priority Date | Filing Date | Title |
|---|---|---|---|
| CN201610649885.7A CN106294301B (en) | 2016-08-09 | 2016-08-09 | Report generation method and device |
Publications (2)
| Publication Number | Publication Date |
|---|---|
| CN106294301A CN106294301A (en) | 2017-01-04 |
| CN106294301B true CN106294301B (en) | 2020-10-13 |
Family
ID=57667524
Family Applications (1)
| Application Number | Title | Priority Date | Filing Date |
|---|---|---|---|
| CN201610649885.7A Active CN106294301B (en) | 2016-08-09 | 2016-08-09 | Report generation method and device |
Country Status (1)
| Country | Link |
|---|---|
| CN (1) | CN106294301B (en) |
Families Citing this family (8)
| Publication number | Priority date | Publication date | Assignee | Title |
|---|---|---|---|---|
| CN109582938B (en) * | 2017-09-28 | 2023-01-13 | 北京国双科技有限公司 | Report generation method and device |
| CN107967248A (en) * | 2017-12-13 | 2018-04-27 | 机械工业第六设计研究院有限公司 | A kind of method that list is realized based on Bootstrap collocation types |
| CN108009145A (en) * | 2017-12-18 | 2018-05-08 | 深圳市康必达控制技术有限公司 | Report form generation method and device |
| CN110569300A (en) * | 2018-05-17 | 2019-12-13 | 江苏优瀛科技有限公司 | Method and system for realizing data sorting of report forms with tree hierarchical structure |
| CN112000687B (en) * | 2020-07-14 | 2025-01-07 | 金医慧通科技有限公司 | Method, device, computer equipment and storage medium for generating business account table |
| CN112597750B (en) * | 2020-12-28 | 2025-01-21 | 珠海新华通软件股份有限公司 | Method, editor and medium for designing dynamic detection report template online |
| CN115034691A (en) * | 2022-08-11 | 2022-09-09 | 四川弘和通讯集团有限公司 | Oil and gas station safety early warning and management method and device, electronic equipment and medium |
| CN118095237B (en) * | 2024-03-11 | 2024-12-06 | 一汽—大众汽车有限公司 | Table generation method, electronic device and storage medium |
Citations (7)
| Publication number | Priority date | Publication date | Assignee | Title |
|---|---|---|---|---|
| CN101876971A (en) * | 2010-06-22 | 2010-11-03 | 北京伟库电子商务科技有限公司 | Report form showing method and device |
| CN102841938A (en) * | 2012-08-14 | 2012-12-26 | 北京久其软件股份有限公司 | Method and system for generating parameterized report |
| CN103176702A (en) * | 2011-12-22 | 2013-06-26 | 北大方正集团有限公司 | Table information display and operation method applied to B/S structure |
| CN103714127A (en) * | 2013-12-11 | 2014-04-09 | 金蝶软件(中国)有限公司 | Information-grouping showing method and information-grouping showing system for tables |
| CN103902718A (en) * | 2014-04-09 | 2014-07-02 | 浪潮软件股份有限公司 | Report control and application thereof |
| CN105095249A (en) * | 2014-05-05 | 2015-11-25 | 中国石油化工股份有限公司 | Method generating multi-dimension report form |
| CN105718436A (en) * | 2015-12-18 | 2016-06-29 | 武汉开目信息技术有限责任公司 | New type table data management method |
Family Cites Families (2)
| Publication number | Priority date | Publication date | Assignee | Title |
|---|---|---|---|---|
| US9411797B2 (en) * | 2011-10-31 | 2016-08-09 | Microsoft Technology Licensing, Llc | Slicer elements for filtering tabular data |
| CN103559292A (en) * | 2013-11-07 | 2014-02-05 | 大连东方之星信息技术有限公司 | Method for dynamically establishing and displaying multiple levels of forms in customized mode |
-
2016
- 2016-08-09 CN CN201610649885.7A patent/CN106294301B/en active Active
Patent Citations (7)
| Publication number | Priority date | Publication date | Assignee | Title |
|---|---|---|---|---|
| CN101876971A (en) * | 2010-06-22 | 2010-11-03 | 北京伟库电子商务科技有限公司 | Report form showing method and device |
| CN103176702A (en) * | 2011-12-22 | 2013-06-26 | 北大方正集团有限公司 | Table information display and operation method applied to B/S structure |
| CN102841938A (en) * | 2012-08-14 | 2012-12-26 | 北京久其软件股份有限公司 | Method and system for generating parameterized report |
| CN103714127A (en) * | 2013-12-11 | 2014-04-09 | 金蝶软件(中国)有限公司 | Information-grouping showing method and information-grouping showing system for tables |
| CN103902718A (en) * | 2014-04-09 | 2014-07-02 | 浪潮软件股份有限公司 | Report control and application thereof |
| CN105095249A (en) * | 2014-05-05 | 2015-11-25 | 中国石油化工股份有限公司 | Method generating multi-dimension report form |
| CN105718436A (en) * | 2015-12-18 | 2016-06-29 | 武汉开目信息技术有限责任公司 | New type table data management method |
Non-Patent Citations (1)
| Title |
|---|
| 用级联菜单高效管理多个工作簿方法的研究;连瑞梅;《办公自动化杂志》;20070831(第113期);29-30,20 * |
Also Published As
| Publication number | Publication date |
|---|---|
| CN106294301A (en) | 2017-01-04 |
Similar Documents
| Publication | Publication Date | Title |
|---|---|---|
| CN106294301B (en) | Report generation method and device | |
| US9043698B2 (en) | Method for users to create and edit web page layouts | |
| TWI453658B (en) | A dynamic composing method for displayed screen | |
| US7856596B2 (en) | Method and system for separation of content and layout definitions in a display description | |
| US11048484B2 (en) | Automated responsive grid-based layout design system | |
| CN107229474B (en) | Method and device for rapidly configuring Java interface and chart service based on visual interface | |
| US10366155B2 (en) | Method and apparatus for displaying data grids | |
| US20160098250A1 (en) | Application prototyping tool | |
| US8982145B2 (en) | Display error indications | |
| CN102902545B (en) | Markup language element is decomposed for animation | |
| CN110674227A (en) | Method, system, medium and terminal for generating data visualization chart and page | |
| CN108829710A (en) | A kind of data analysing method and device | |
| CN105824517B (en) | A kind of implementation method and device of desktop | |
| US8732615B2 (en) | Unified interface for display and modification of data arrays | |
| CN111597489B (en) | Realization method and device for draggable custom form component based on mobile terminal | |
| US11157680B1 (en) | Systems for suggesting content components | |
| CN110618813A (en) | Method, device and equipment for quickly generating docking media interface and storage medium | |
| CN108319683A (en) | Webpage display process, device and terminal | |
| CN105677627A (en) | Table operation method and apparatus | |
| CN109634610B (en) | Interface marking data generation method and device | |
| KR20140021044A (en) | Chart element variations | |
| CN109992750A (en) | Form object screening method, device, electronic device and storage medium | |
| CN111382192A (en) | Data list display method and device and electronic equipment | |
| US10140278B2 (en) | Computer-implemented methods and systems for associating files with cells of a collaborative spreadsheet | |
| CN112286576B (en) | Cross-platform rendering method, client and medium |
Legal Events
| Date | Code | Title | Description |
|---|---|---|---|
| C06 | Publication | ||
| PB01 | Publication | ||
| C10 | Entry into substantive examination | ||
| SE01 | Entry into force of request for substantive examination | ||
| TA01 | Transfer of patent application right |
Effective date of registration: 20171207 Address after: 510000 Guangzhou City, Guangzhou, Guangdong, Fangcun Avenue, one of the 314 self compiled Applicant after: Guangzhou Pinwei Software Co., Ltd. Address before: Liwan District Fangcun Huahai street Guangzhou city Guangdong province 510000 No. 20 self 1-5 building (only for office use) Applicant before: Guangzhou VIPSHOP Information and Technology Co., Ltd. |
|
| GR01 | Patent grant | ||
| GR01 | Patent grant | ||
| TR01 | Transfer of patent right |
Effective date of registration: 20220104 Address after: 510000 Room 601, 128 Dingxin Road, Haizhu District, Guangzhou City, Guangdong Province (office only) Patentee after: Vipshop (Guangzhou) Software Co.,Ltd. Address before: 510000 No. 314, Fangcun Avenue, Liwan District, Guangzhou City, Guangdong Province Patentee before: GUANGZHOU PINWEI SOFTWARE Co.,Ltd. |
|
| TR01 | Transfer of patent right |