CN105353013B - Method for identifying ionized species in a sample - Google Patents
Method for identifying ionized species in a sample Download PDFInfo
- Publication number
- CN105353013B CN105353013B CN201510701287.5A CN201510701287A CN105353013B CN 105353013 B CN105353013 B CN 105353013B CN 201510701287 A CN201510701287 A CN 201510701287A CN 105353013 B CN105353013 B CN 105353013B
- Authority
- CN
- China
- Prior art keywords
- scan
- output current
- potential
- sample
- current
- Prior art date
- Legal status (The legal status is an assumption and is not a legal conclusion. Google has not performed a legal analysis and makes no representation as to the accuracy of the status listed.)
- Active
Links
- 238000000034 method Methods 0.000 title claims abstract description 55
- 125000002015 acyclic group Chemical group 0.000 claims abstract description 152
- 230000005284 excitation Effects 0.000 claims abstract description 125
- 230000002441 reversible effect Effects 0.000 claims abstract description 66
- 239000012491 analyte Substances 0.000 claims description 94
- 230000004044 response Effects 0.000 claims description 51
- 230000002829 reductive effect Effects 0.000 claims description 31
- 125000004122 cyclic group Chemical group 0.000 abstract description 85
- 238000005259 measurement Methods 0.000 abstract description 47
- 238000004458 analytical method Methods 0.000 abstract description 27
- 239000000126 substance Substances 0.000 abstract description 12
- VYFYYTLLBUKUHU-UHFFFAOYSA-N dopamine Chemical compound NCCC1=CC=C(O)C(O)=C1 VYFYYTLLBUKUHU-UHFFFAOYSA-N 0.000 description 52
- 238000007254 oxidation reaction Methods 0.000 description 52
- RZVAJINKPMORJF-UHFFFAOYSA-N Acetaminophen Chemical compound CC(=O)NC1=CC=C(O)C=C1 RZVAJINKPMORJF-UHFFFAOYSA-N 0.000 description 50
- 238000009792 diffusion process Methods 0.000 description 45
- 230000003647 oxidation Effects 0.000 description 41
- 238000004082 amperometric method Methods 0.000 description 40
- 238000004832 voltammetry Methods 0.000 description 40
- WQZGKKKJIJFFOK-GASJEMHNSA-N Glucose Natural products OC[C@H]1OC(O)[C@H](O)[C@@H](O)[C@@H]1O WQZGKKKJIJFFOK-GASJEMHNSA-N 0.000 description 37
- 239000008103 glucose Substances 0.000 description 37
- LEHOTFFKMJEONL-UHFFFAOYSA-N Uric Acid Chemical compound N1C(=O)NC(=O)C2=C1NC(=O)N2 LEHOTFFKMJEONL-UHFFFAOYSA-N 0.000 description 31
- TVWHNULVHGKJHS-UHFFFAOYSA-N Uric acid Natural products N1C(=O)NC(=O)C2NC(=O)NC21 TVWHNULVHGKJHS-UHFFFAOYSA-N 0.000 description 31
- 229940116269 uric acid Drugs 0.000 description 31
- 229960003638 dopamine Drugs 0.000 description 26
- 229960005489 paracetamol Drugs 0.000 description 25
- YAGKRVSRTSUGEY-UHFFFAOYSA-N ferricyanide Chemical compound [Fe+3].N#[C-].N#[C-].N#[C-].N#[C-].N#[C-].N#[C-] YAGKRVSRTSUGEY-UHFFFAOYSA-N 0.000 description 22
- 230000006870 function Effects 0.000 description 22
- 238000006722 reduction reaction Methods 0.000 description 19
- 239000004020 conductor Substances 0.000 description 16
- 210000002381 plasma Anatomy 0.000 description 16
- 230000008859 change Effects 0.000 description 12
- 230000009467 reduction Effects 0.000 description 12
- 238000004891 communication Methods 0.000 description 11
- 239000013060 biological fluid Substances 0.000 description 10
- 239000000376 reactant Substances 0.000 description 10
- 230000027756 respiratory electron transport chain Effects 0.000 description 10
- 102000004190 Enzymes Human genes 0.000 description 9
- 108090000790 Enzymes Proteins 0.000 description 9
- 229940088598 enzyme Drugs 0.000 description 9
- 238000012545 processing Methods 0.000 description 9
- 230000007704 transition Effects 0.000 description 9
- 108090000854 Oxidoreductases Proteins 0.000 description 8
- 102000004316 Oxidoreductases Human genes 0.000 description 8
- 230000008901 benefit Effects 0.000 description 8
- 238000006479 redox reaction Methods 0.000 description 8
- 230000004888 barrier function Effects 0.000 description 7
- 230000002596 correlated effect Effects 0.000 description 7
- 238000003869 coulometry Methods 0.000 description 7
- 238000002484 cyclic voltammetry Methods 0.000 description 7
- 239000007788 liquid Substances 0.000 description 7
- 238000012935 Averaging Methods 0.000 description 6
- 210000004369 blood Anatomy 0.000 description 6
- 239000008280 blood Substances 0.000 description 6
- 230000000875 corresponding effect Effects 0.000 description 6
- 238000001075 voltammogram Methods 0.000 description 6
- 238000003556 assay Methods 0.000 description 5
- 238000002848 electrochemical method Methods 0.000 description 5
- 239000012530 fluid Substances 0.000 description 5
- BPYKTIZUTYGOLE-IFADSCNNSA-N Bilirubin Chemical compound N1C(=O)C(C)=C(C=C)\C1=C\C1=C(C)C(CCC(O)=O)=C(CC2=C(C(C)=C(\C=C/3C(=C(C=C)C(=O)N\3)C)N2)CCC(O)=O)N1 BPYKTIZUTYGOLE-IFADSCNNSA-N 0.000 description 4
- 108010050375 Glucose 1-Dehydrogenase Proteins 0.000 description 4
- 239000002585 base Substances 0.000 description 4
- WQZGKKKJIJFFOK-VFUOTHLCSA-N beta-D-glucose Chemical compound OC[C@H]1O[C@@H](O)[C@H](O)[C@@H](O)[C@@H]1O WQZGKKKJIJFFOK-VFUOTHLCSA-N 0.000 description 4
- 238000006243 chemical reaction Methods 0.000 description 4
- HVYWMOMLDIMFJA-DPAQBDIFSA-N cholesterol Chemical compound C1C=C2C[C@@H](O)CC[C@]2(C)[C@@H]2[C@@H]1[C@@H]1CC[C@H]([C@H](C)CCCC(C)C)[C@@]1(C)CC2 HVYWMOMLDIMFJA-DPAQBDIFSA-N 0.000 description 4
- KJQOYUHYAZGPIZ-PIJHVLQJSA-N conotoxin vc1.1 Chemical compound C([C@H]1C(=O)N2CCC[C@H]2C(=O)N[C@@H](CCC(O)=O)C(=O)N[C@H](C(N[C@@H](CSSC[C@@H]2NC(=O)[C@@H](NC(=O)CN)CSSC[C@H](NC(=O)[C@H](CCCNC(N)=N)NC(=O)[C@@H]3CCCN3C(=O)[C@H](CC(O)=O)NC(=O)[C@H](CO)NC2=O)C(=O)N[C@@H](CC(N)=O)C(=O)N[C@@H](CC=2C=CC(O)=CC=2)C(=O)N[C@@H](CC(O)=O)C(=O)N1)C(N)=O)=O)[C@@H](C)CC)C1=CN=CN1 KJQOYUHYAZGPIZ-PIJHVLQJSA-N 0.000 description 4
- 238000007796 conventional method Methods 0.000 description 4
- 230000000694 effects Effects 0.000 description 4
- 238000005534 hematocrit Methods 0.000 description 4
- 230000001590 oxidative effect Effects 0.000 description 4
- 238000010408 sweeping Methods 0.000 description 4
- 210000000601 blood cell Anatomy 0.000 description 3
- 238000013461 design Methods 0.000 description 3
- 206010012601 diabetes mellitus Diseases 0.000 description 3
- 238000003487 electrochemical reaction Methods 0.000 description 3
- 230000002452 interceptive effect Effects 0.000 description 3
- 238000012067 mathematical method Methods 0.000 description 3
- 230000003287 optical effect Effects 0.000 description 3
- 230000008569 process Effects 0.000 description 3
- 238000003672 processing method Methods 0.000 description 3
- AZQWKYJCGOJGHM-UHFFFAOYSA-N 1,4-benzoquinone Chemical compound O=C1C=CC(=O)C=C1 AZQWKYJCGOJGHM-UHFFFAOYSA-N 0.000 description 2
- WSNMPAVSZJSIMT-UHFFFAOYSA-N COc1c(C)c2COC(=O)c2c(O)c1CC(O)C1(C)CCC(=O)O1 Chemical compound COc1c(C)c2COC(=O)c2c(O)c1CC(O)C1(C)CCC(=O)O1 WSNMPAVSZJSIMT-UHFFFAOYSA-N 0.000 description 2
- OKTJSMMVPCPJKN-UHFFFAOYSA-N Carbon Chemical compound [C] OKTJSMMVPCPJKN-UHFFFAOYSA-N 0.000 description 2
- COLNVLDHVKWLRT-QMMMGPOBSA-N L-phenylalanine Chemical compound OC(=O)[C@@H](N)CC1=CC=CC=C1 COLNVLDHVKWLRT-QMMMGPOBSA-N 0.000 description 2
- 239000002253 acid Substances 0.000 description 2
- 229910052783 alkali metal Inorganic materials 0.000 description 2
- 230000002238 attenuated effect Effects 0.000 description 2
- 230000005540 biological transmission Effects 0.000 description 2
- 229910052799 carbon Inorganic materials 0.000 description 2
- 239000003153 chemical reaction reagent Substances 0.000 description 2
- 235000012000 cholesterol Nutrition 0.000 description 2
- 239000002131 composite material Substances 0.000 description 2
- 230000007423 decrease Effects 0.000 description 2
- 230000003247 decreasing effect Effects 0.000 description 2
- 229940079593 drug Drugs 0.000 description 2
- 239000003814 drug Substances 0.000 description 2
- 238000000840 electrochemical analysis Methods 0.000 description 2
- 210000002615 epidermis Anatomy 0.000 description 2
- 235000021588 free fatty acids Nutrition 0.000 description 2
- 230000007274 generation of a signal involved in cell-cell signaling Effects 0.000 description 2
- 238000011534 incubation Methods 0.000 description 2
- 230000010354 integration Effects 0.000 description 2
- 150000002576 ketones Chemical class 0.000 description 2
- JVTAAEKCZFNVCJ-UHFFFAOYSA-N lactic acid Chemical compound CC(O)C(O)=O JVTAAEKCZFNVCJ-UHFFFAOYSA-N 0.000 description 2
- 229910052751 metal Inorganic materials 0.000 description 2
- 239000002184 metal Substances 0.000 description 2
- 230000033116 oxidation-reduction process Effects 0.000 description 2
- 150000002990 phenothiazines Chemical class 0.000 description 2
- COLNVLDHVKWLRT-UHFFFAOYSA-N phenylalanine Natural products OC(=O)C(N)CC1=CC=CC=C1 COLNVLDHVKWLRT-UHFFFAOYSA-N 0.000 description 2
- 229920000642 polymer Polymers 0.000 description 2
- 239000011148 porous material Substances 0.000 description 2
- 239000000047 product Substances 0.000 description 2
- 102000004169 proteins and genes Human genes 0.000 description 2
- 108090000623 proteins and genes Proteins 0.000 description 2
- 230000000630 rising effect Effects 0.000 description 2
- 238000012546 transfer Methods 0.000 description 2
- 230000001052 transient effect Effects 0.000 description 2
- 150000003626 triacylglycerols Chemical class 0.000 description 2
- 150000005208 1,4-dihydroxybenzenes Chemical class 0.000 description 1
- WJFKNYWRSNBZNX-UHFFFAOYSA-N 10H-phenothiazine Chemical compound C1=CC=C2NC3=CC=CC=C3SC2=C1 WJFKNYWRSNBZNX-UHFFFAOYSA-N 0.000 description 1
- BKIKFYRTTUYTJZ-UHFFFAOYSA-N 7-hydroxy-9,9-dimethylacridin-2-one Chemical compound C1=C(O)C=C2C(C)(C)C3=CC(=O)C=CC3=NC2=C1 BKIKFYRTTUYTJZ-UHFFFAOYSA-N 0.000 description 1
- -1 Alkali metal salts Chemical class 0.000 description 1
- LFQSCWFLJHTTHZ-UHFFFAOYSA-N Ethanol Chemical compound CCO LFQSCWFLJHTTHZ-UHFFFAOYSA-N 0.000 description 1
- 108010015776 Glucose oxidase Proteins 0.000 description 1
- 239000004366 Glucose oxidase Substances 0.000 description 1
- JVTAAEKCZFNVCJ-UHFFFAOYSA-M Lactate Chemical compound CC(O)C([O-])=O JVTAAEKCZFNVCJ-UHFFFAOYSA-M 0.000 description 1
- BWUHFIMIYXLIIO-FYJGNVAPSA-N OC(=O)C1=CC(C(=O)O)=CC(\N=C/2C=C3SC4=CC=CC=C4N=C3C=C\2)=C1 Chemical compound OC(=O)C1=CC(C(=O)O)=CC(\N=C/2C=C3SC4=CC=CC=C4N=C3C=C\2)=C1 BWUHFIMIYXLIIO-FYJGNVAPSA-N 0.000 description 1
- VBLYLVNRHJELKI-YBFXNURJSA-N OS(=O)(=O)C1=CC=C(S(O)(=O)=O)C(\N=C/2C=C3SC4=CC=CC=C4N=C3C=C\2)=C1 Chemical compound OS(=O)(=O)C1=CC=C(S(O)(=O)=O)C(\N=C/2C=C3SC4=CC=CC=C4N=C3C=C\2)=C1 VBLYLVNRHJELKI-YBFXNURJSA-N 0.000 description 1
- 229910021607 Silver chloride Inorganic materials 0.000 description 1
- DGEZNRSVGBDHLK-UHFFFAOYSA-N [1,10]phenanthroline Chemical compound C1=CN=C2C3=NC=CC=C3C=CC2=C1 DGEZNRSVGBDHLK-UHFFFAOYSA-N 0.000 description 1
- KAVRPYNYJLNUHL-ORKRDPRMSA-N [NH4+].C1=C/C(/C=C2SC3=CC=CC=C3N=C12)=N\C=1C=C(C(=O)[O-])C=C(C1)C(=O)[O-].[NH4+] Chemical compound [NH4+].C1=C/C(/C=C2SC3=CC=CC=C3N=C12)=N\C=1C=C(C(=O)[O-])C=C(C1)C(=O)[O-].[NH4+] KAVRPYNYJLNUHL-ORKRDPRMSA-N 0.000 description 1
- 230000005856 abnormality Effects 0.000 description 1
- 230000004913 activation Effects 0.000 description 1
- 230000002411 adverse Effects 0.000 description 1
- 150000001298 alcohols Chemical class 0.000 description 1
- 150000003863 ammonium salts Chemical class 0.000 description 1
- 239000011230 binding agent Substances 0.000 description 1
- 238000009529 body temperature measurement Methods 0.000 description 1
- 239000003575 carbonaceous material Substances 0.000 description 1
- 150000001732 carboxylic acid derivatives Chemical class 0.000 description 1
- 150000005829 chemical entities Chemical class 0.000 description 1
- 239000013626 chemical specie Substances 0.000 description 1
- 239000003795 chemical substances by application Substances 0.000 description 1
- 150000001875 compounds Chemical class 0.000 description 1
- 229920001940 conductive polymer Polymers 0.000 description 1
- 238000012937 correction Methods 0.000 description 1
- 230000007812 deficiency Effects 0.000 description 1
- 230000003111 delayed effect Effects 0.000 description 1
- 230000001419 dependent effect Effects 0.000 description 1
- 238000001514 detection method Methods 0.000 description 1
- 238000003745 diagnosis Methods 0.000 description 1
- 238000010586 diagram Methods 0.000 description 1
- 230000037213 diet Effects 0.000 description 1
- 235000005911 diet Nutrition 0.000 description 1
- 239000003085 diluting agent Substances 0.000 description 1
- 230000009977 dual effect Effects 0.000 description 1
- 238000007812 electrochemical assay Methods 0.000 description 1
- 230000005279 excitation period Effects 0.000 description 1
- 230000001747 exhibiting effect Effects 0.000 description 1
- 210000003722 extracellular fluid Anatomy 0.000 description 1
- 239000000706 filtrate Substances 0.000 description 1
- 229940116332 glucose oxidase Drugs 0.000 description 1
- 235000019420 glucose oxidase Nutrition 0.000 description 1
- 150000004677 hydrates Chemical class 0.000 description 1
- 230000006872 improvement Effects 0.000 description 1
- 210000002977 intracellular fluid Anatomy 0.000 description 1
- YTOVAWUSMUMHIM-UHFFFAOYSA-N iron(2+);5-methylcyclopenta-1,3-diene Chemical compound [Fe+2].C[C-]1C=CC=C1.C[C-]1C=CC=C1 YTOVAWUSMUMHIM-UHFFFAOYSA-N 0.000 description 1
- 239000004310 lactic acid Substances 0.000 description 1
- 235000014655 lactic acid Nutrition 0.000 description 1
- 239000000463 material Substances 0.000 description 1
- 239000011159 matrix material Substances 0.000 description 1
- 238000000691 measurement method Methods 0.000 description 1
- 230000007246 mechanism Effects 0.000 description 1
- 239000000203 mixture Substances 0.000 description 1
- BRTPYBXQVFNPCB-UHFFFAOYSA-N n-phenyl-3h-phenoxazin-3-amine Chemical compound C1=CC2=NC3=CC=CC=C3OC2=CC1NC1=CC=CC=C1 BRTPYBXQVFNPCB-UHFFFAOYSA-N 0.000 description 1
- DLZPPUIHGWXDNJ-UHFFFAOYSA-N n-phenylphenothiazin-3-imine Chemical compound C1=CC=CC=C1N=C1C=C2SC3=CC=CC=C3N=C2C=C1 DLZPPUIHGWXDNJ-UHFFFAOYSA-N 0.000 description 1
- LJXXBBCNKKOAHS-UHFFFAOYSA-N n-phenylphenoxazin-3-imine Chemical compound C1=CC=CC=C1N=C1C=C2OC3=CC=CC=C3N=C2C=C1 LJXXBBCNKKOAHS-UHFFFAOYSA-N 0.000 description 1
- 230000036961 partial effect Effects 0.000 description 1
- 230000037361 pathway Effects 0.000 description 1
- 238000003909 pattern recognition Methods 0.000 description 1
- 229950000688 phenothiazine Drugs 0.000 description 1
- 125000001644 phenoxazinyl group Chemical class C1(=CC=CC=2OC3=CC=CC=C3NC12)* 0.000 description 1
- 229960005190 phenylalanine Drugs 0.000 description 1
- 229920001690 polydopamine Polymers 0.000 description 1
- 238000004313 potentiometry Methods 0.000 description 1
- 239000002244 precipitate Substances 0.000 description 1
- 238000011084 recovery Methods 0.000 description 1
- 230000003252 repetitive effect Effects 0.000 description 1
- YAYGSLOSTXKUBW-UHFFFAOYSA-N ruthenium(2+) Chemical compound [Ru+2] YAYGSLOSTXKUBW-UHFFFAOYSA-N 0.000 description 1
- BPEVHDGLPIIAGH-UHFFFAOYSA-N ruthenium(3+) Chemical compound [Ru+3] BPEVHDGLPIIAGH-UHFFFAOYSA-N 0.000 description 1
- 210000003296 saliva Anatomy 0.000 description 1
- 150000003839 salts Chemical class 0.000 description 1
- 239000004065 semiconductor Substances 0.000 description 1
- 230000035945 sensitivity Effects 0.000 description 1
- 238000000926 separation method Methods 0.000 description 1
- 210000002966 serum Anatomy 0.000 description 1
- 229910052709 silver Inorganic materials 0.000 description 1
- 239000004332 silver Substances 0.000 description 1
- HKZLPVFGJNLROG-UHFFFAOYSA-M silver monochloride Chemical compound [Cl-].[Ag+] HKZLPVFGJNLROG-UHFFFAOYSA-M 0.000 description 1
- 210000003491 skin Anatomy 0.000 description 1
- 159000000000 sodium salts Chemical class 0.000 description 1
- 239000007787 solid Substances 0.000 description 1
- 238000001179 sorption measurement Methods 0.000 description 1
- 230000000638 stimulation Effects 0.000 description 1
- 229940066767 systemic antihistamines phenothiazine derivative Drugs 0.000 description 1
- 210000002700 urine Anatomy 0.000 description 1
- 238000013022 venting Methods 0.000 description 1
- 239000002699 waste material Substances 0.000 description 1
Images


Classifications
-
- G—PHYSICS
- G01—MEASURING; TESTING
- G01N—INVESTIGATING OR ANALYSING MATERIALS BY DETERMINING THEIR CHEMICAL OR PHYSICAL PROPERTIES
- G01N27/00—Investigating or analysing materials by the use of electric, electrochemical, or magnetic means
- G01N27/26—Investigating or analysing materials by the use of electric, electrochemical, or magnetic means by investigating electrochemical variables; by using electrolysis or electrophoresis
- G01N27/28—Electrolytic cell components
- G01N27/30—Electrodes, e.g. test electrodes; Half-cells
- G01N27/327—Biochemical electrodes, e.g. electrical or mechanical details for in vitro measurements
- G01N27/3271—Amperometric enzyme electrodes for analytes in body fluids, e.g. glucose in blood
- G01N27/3272—Test elements therefor, i.e. disposable laminated substrates with electrodes, reagent and channels
-
- G—PHYSICS
- G01—MEASURING; TESTING
- G01N—INVESTIGATING OR ANALYSING MATERIALS BY DETERMINING THEIR CHEMICAL OR PHYSICAL PROPERTIES
- G01N27/00—Investigating or analysing materials by the use of electric, electrochemical, or magnetic means
- G01N27/26—Investigating or analysing materials by the use of electric, electrochemical, or magnetic means by investigating electrochemical variables; by using electrolysis or electrophoresis
- G01N27/28—Electrolytic cell components
- G01N27/30—Electrodes, e.g. test electrodes; Half-cells
- G01N27/327—Biochemical electrodes, e.g. electrical or mechanical details for in vitro measurements
- G01N27/3271—Amperometric enzyme electrodes for analytes in body fluids, e.g. glucose in blood
- G01N27/3273—Devices therefor, e.g. test element readers, circuitry
-
- G—PHYSICS
- G01—MEASURING; TESTING
- G01N—INVESTIGATING OR ANALYSING MATERIALS BY DETERMINING THEIR CHEMICAL OR PHYSICAL PROPERTIES
- G01N27/00—Investigating or analysing materials by the use of electric, electrochemical, or magnetic means
- G01N27/26—Investigating or analysing materials by the use of electric, electrochemical, or magnetic means by investigating electrochemical variables; by using electrolysis or electrophoresis
- G01N27/416—Systems
- G01N27/48—Systems using polarography, i.e. measuring changes in current under a slowly-varying voltage
Landscapes
- Health & Medical Sciences (AREA)
- Life Sciences & Earth Sciences (AREA)
- Chemical & Material Sciences (AREA)
- Biochemistry (AREA)
- General Physics & Mathematics (AREA)
- Electrochemistry (AREA)
- Physics & Mathematics (AREA)
- Analytical Chemistry (AREA)
- Molecular Biology (AREA)
- General Health & Medical Sciences (AREA)
- Chemical Kinetics & Catalysis (AREA)
- Immunology (AREA)
- Pathology (AREA)
- Hematology (AREA)
- Biophysics (AREA)
- Investigating Or Analysing Biological Materials (AREA)
- Measuring Or Testing Involving Enzymes Or Micro-Organisms (AREA)
- Investigating Or Analyzing Materials By The Use Of Electric Means (AREA)
Abstract
The invention relates to a method of identifying ionised species in a sample, comprising: applying an input signal comprising an acyclic scan to the sample, the acyclic scan comprising a forward excitation and a reverse excitation; measuring an output signal comprising an output current responsive to the acyclic scan; and identifying the ionized species from an output current responsive to a forward excitation of the acyclic scan. The method for identifying the ionized substances in the sample can reduce analysis errors by identifying the ionized substances according to the output current of the forward excitation of the non-cyclic scanning, thereby improving the measurement performance.
Description
Divisional application
The present application is a divisional application of patent application No. 201310741285.X (hereinafter referred to as "sub-case"), entitled "system and method having a duty cycle of amperometry and voltammetry", which was filed on 10/7/2009.
The application is provided under the condition that the national intellectual property office considers that the sub-case does not meet the requirement of unity, in particular to a notice of the first examination opinion of the sub-case, wherein the date of issuance is 2015, 5 and 25, and the number of issuance is 2015052001415990.
The above-mentioned sub-case is a divisional application of patent application No. 200980126926.2 (hereinafter referred to as "parent case"), the filing date of which is 7/10/2009, and the title of the invention is "system and method having duty cycle of amperometry and voltammetry".
Reference to related applications
This application claims priority from U.S. provisional patent application No. 61/079,616 entitled "system and method with duty cycle for amperometry and voltammetry", filed on 10.7.2008, which is hereby incorporated by reference in its entirety.
Technical Field
The present invention relates to a method for identifying ionized species in a sample in the field of biosensors.
Background
Biosensor systems provide for the analysis of biological fluids, such as whole blood, serum, plasma, urine, saliva, interstitial or intracellular fluids. Typically, biosensor systems have a measurement device that analyzes a sample in contact with a sensor strip. The sample is typically in liquid form and may be a biological fluid or a derivative of a biological fluid, such as an extract, a diluent, a filtrate or a reconstituted precipitate. The analysis performed by the system may determine the presence and/or concentration of one or more analytes (such as alcohol, glucose, uric acid, lactic acid, cholesterol, bilirubin, free fatty acids, triglycerides, proteins, ketones, phenylalanine, or enzymes) in the biological fluid. This analysis may be helpful in the diagnosis and treatment of physiological abnormalities. For example, a diabetic patient may use the biosensor system to determine the glucose level of their whole blood in order to adjust diet and/or medication.
The biosensor system may be designed to analyze one or more analytes in the same sample or one or more analytes in different samples, and may use different volumes of sample. Some systems can analyze a drop (e.g., 0.25-15 microliters (μ L)) of whole blood. The biosensor system may employ a desktop, portable, and similar measuring device. The portable measuring device may be hand-held and allow identification and/or determination of the amount of one or more analytes in a sample. An example of a portable measuring device is the product of Bayer HealthCare Diabetes Care company (Bayer HealthCare Diabetes Care, Care) located in Tarrytown, New York: breeze Apparatus andan example of a bench-top measuring device is an electrochemical workstation commercially available from CH Instruments of Austin, Tex. The biosensor system provides the desired accuracy and/or precision with a shorter analysis time, thereby bringing tangible benefits to the user.
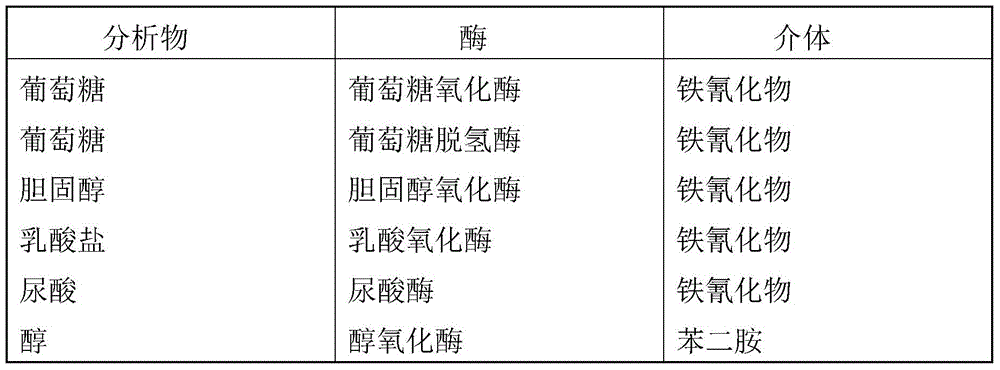
In electrochemical biosensor systems, the concentration of an analyte is determined from the oxidation/reduction reaction or the electrical signal generated by the oxidation-reduction reaction of a measurable species. The measurable species may be an ionized analyte or an ionized species that is sensitive to the analyte when an input signal is applied to the sample. The input signal can be applied in single pulses, multiple pulses, a sequence or a cyclic form. An oxidoreductase (such as an enzyme or the like) may be added to the sample to facilitate electron transfer from a first species to a second species in a redox reaction. The enzyme or the like may react with an analyte to produce a characteristic portion of the output signal. Examples of some specific oxidoreductases and corresponding analytes are given in table I below.
TABLE I


Mediators are used to maintain the oxidation state of the enzyme. While maintaining the oxidation state of the enzyme, the mediator is ionized and can be used as a measurable species sensitive to the analyte. Table II below provides some of the common combinations of enzymes and mediators for use with a particular analyte.
TABLE II
The mediator may be a single electron transfer mediator or a multiple electron transfer mediator. Single electron transfer mediators are chemical moieties (chemical entities) that can carry one additional electron during an electrochemical reaction. The one-electron transfer mediator includes, for example, the following compounds: 1, 1' -dimethylferrocene, ferrocyanide and ferricyanide, ruthenium (III) hexammine and ruthenium (II) hexammine. A multiple electron transfer mediator is a chemical moiety that is capable of carrying multiple electrons upon an electrochemical reaction. The multiple electron transfer mediator includes: two electron transfer mediators such as organoquinones and hydroquinones, including phenanthroline quinone; phenothiazine derivatives and phenoxazine derivatives; 3- (phenylamino) -3H-phenoxazine; phenothiazine; and 7-hydroxy-9, 9-dimethyl-9H-acridin-2-one and its derivatives. The two-electron transfer mediator further includes electroactive organic molecules as described in U.S. Pat. Nos. 5,393,615, 5,498,542, and 5,520,786.
Two electron transfer mediators include 3-phenylimino-3H-phenothiazine (PIPT) and 3-phenylimino-3H-phenoxazine (PIPO). The dual electron mediator also includes a carboxylic acid or salt (e.g., an ammonium salt) of a phenothiazine derivative. The two-electron mediator also includes (E) -2- (3H-phenothiazin-3-ylideneamino) benzene-1, 4-disulfonic acid (structure I), (E) -5- (3H-phenothiazin-3-ylideneamino) isophthalic acid (structure II), (E) -3- (3H-phenothiazin-3-ylideneamino) -5-carboxybenzoic acid ammonium salt (structure III), and combinations thereof. The structural formulae of these mediators are shown below. Although only the diacid structure of the mediator of structure I is shown here, the mono-or di-alkali metal salt of the acid is also implied. For the mediator of structure I, the sodium salt of the acid may also be used. Alkali metal salts of the structure II mediator may also be employed.
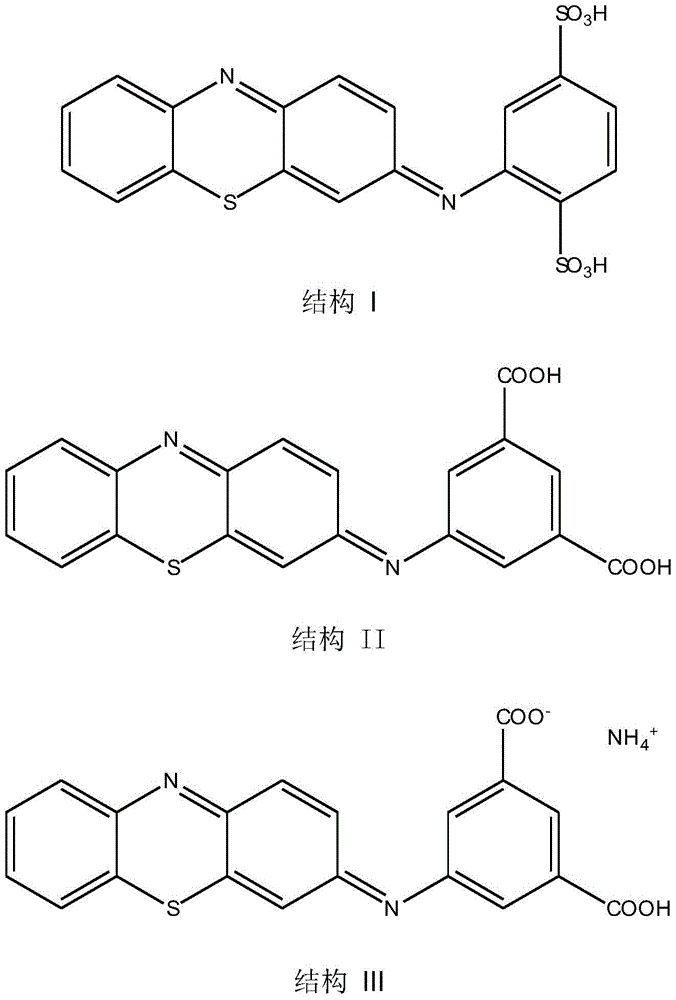
The two-electron mediator has an oxidation-reduction potential of at least 100mV lower than ferricyanide, more preferably at least 150mV lower than ferricyanide. Other two electron mediators may also be used.
Electrochemical biosensor systems typically include a measurement device having electrical contacts connected to electrical conductors in a sensor strip. The sensor strip may be adapted for use externally, in contact with, internally or partially internally with respect to a living organism. When placed externally to a living organism, a sample of biological fluid may be introduced into the sample chamber of the sensor strip. The sensor strip may be placed in the measurement device before, after, or during introduction of the sample for analysis. When in contact with a living organism, the sensor strip may be affixed to the epidermis, thereby establishing fluid communication between the organism and the sensor strip at the epidermis. When placed in or partially in a living organism, the sensor strip may be frequently immersed in a fluid or the fluid may be intermittently introduced into the sensor strip for analysis. The sensor strip may include a fluid reservoir that is partially isolated from or in communication with a volume of fluid. The measuring device may communicate with the sensor strip in a wired or wireless manner (e.g., radio frequency, light-based communication, magnetic or other communication) when in contact with or partially embedded in the living organism.
The electrical conductor portion of the sensor strip may be made of an electrically conductive material such as solid metal, metal paste, conductive carbon material, conductive carbon paste, conductive polymer, and the like. The electrical conductors typically interface with a working electrode, a counter electrode, a reference electrode, and/or other electrodes that extend into the sample chamber. One or more electrical conductors may also extend into the sample chamber to perform functions that the electrodes do not have.
The measuring device applies an input signal to the electrical conductor of the sensor strip. An electrical conductor transmits an input signal through the electrode into the sample. In response to the input signal, a redox reaction of the measurable species generates an electrical output signal. The electrical output signal of the sensor strip may be a current (e.g., generated by amperometry (amperometry) or voltammetry (voltametry)), a potential (e.g., generated by potentiometry or amperometry (galvometry)), or an accumulated charge (e.g., generated by coulometry (coulometry)). The measurement device may have a processing device to measure the output signal and correlate the output signal with the presence and/or concentration of one or more analytes in the biological fluid. The processing means may be in communication with the measuring means, but separate from each other. The communication may be established by wired or wireless means (e.g., radio frequency, light-based communication, magnetic or other communication).
In coulometry, the concentration of an analyte is determined by oxidizing a small amount of the analyte completely and integrating the current during the oxidation to produce a charge indicative of the analyte concentration. Therefore, coulometry captures the total amount of analyte within the sensor strip. An important aspect of coulometry is: at the end of the charge-time integration curve, the rate of change of charge over time is substantially constant to form a steady state. This steady state portion of coulometry forms a relatively flat current region so that the corresponding current can be determined. However, unless a true steady-state current is estimated from the unstable-state output, coulometry requires a thorough conversion of all analytes to reach steady-state. As a result, the method may waste time or be inaccurate due to the estimation. The sample size of the sensor strip must also be controlled to provide accurate results, which is difficult to achieve with mass-produced equipment.
Another electrochemical method for determining the amount of an analyte in a biological fluid is amperometry. In amperometry, current is measured at a substantially constant potential (voltage) while a substantially constant potential is applied between the working and counter electrodes of the sensor strip and the measured current is expressed as a function of time. The measured output current is used to determine the amount of analyte in the sample. Amperometry measures the rate at which an electrochemically active species (e.g., an analyte or mediator) is oxidized or reduced in the vicinity of the working electrode. Many variations for biosensor amperometry have been described in, for example, U.S. patent nos. 5,620,579, 5,653,863, 6,153,069 and 6,413,411.
Voltammetry is another electrochemical method that can be used to determine the amount of an analyte in a biological fluid. Voltammetry differs from amperometry in that the potential of the input signal applied between the working and counter electrodes of the sensor strip varies over time. The measured current is a function of the potential and/or time of the input signal. For more information on voltammetry, see "electrochemical methods: Fundamentals and Applications", published in 1980, by A.J.Bard and L.R.Faulkner.
Various methods of applying an input signal to the sensor strip (such as pulse, sequence or loop methods are common) are used to account for errors in the measured analyte concentration. For example, in US 4,897,162, the input signal comprises a triangular wave synthesized by successively applying rising and falling voltages. Further, WO 2004/053476, U.S. patent documents nos. 2003/0178322 and 2003/0113933 describe input signals containing rising and falling voltages which are applied continuously and alternate in polarity.
The electrochemical charge decay may be correlated to the analyte concentration in the sample using an equation describing the current linearly related to time (e.g., expressed in natural logarithm (ln)). Thus, the output current may be expressed as a function of time with an exponential, where a negative exponent represents the charge decay process. After the output current is initially reduced, the rate of reduction may remain relatively constant, thereby entering a steady state or continuing to fluctuate.
The measurement performance of a biosensor system is defined in terms of "accuracy" and/or "precision". Improvements in accuracy and/or precision may lead to improved measurement performance of the biosensor system. Accuracy can be expressed in terms of the deviation of the analyte reading of the sensor compared to a reference value (greater deviation indicates less accuracy), while accuracy can be expressed in terms of the range or variance of the plurality of analyte readings relative to a mean. The deviation is the difference between the value measured by the biosensor and the confirmed reference value, and may be either an "absolute deviation" or a "relative deviation". The absolute deviation may be expressed in units of measure, such as milligrams per deciliter (mg/dL), while the relative deviation may be expressed as a percentage of the absolute deviation value divided by the reference value. The reference value may be obtained using a reference instrument such as YSI 2300STAT PLUS available from YSI Inc. of Yellow Springs (Ohio), OhioTM) Thus obtaining the product.
Many biosensor systems incorporate one or more methods to correct errors and thus bias associated with analysis. Concentration values derived from an analysis with errors may be inaccurate. The ability to correct for these inaccurate analyses may improve the accuracy and/or precision of the obtained concentration values. The error correction system may compensate for one or more errors, such as errors that occur when the concentration of the measurable species is not correlated with the concentration of the analyte. For example, reduced mediators are generated in response to oxidation of the analyte, and when the biosensor system determines the concentration of the reduced mediator, those reduced mediators that were not generated by oxidation of the analyte may cause the system to indicate that more analyte than the correct value is present in the sample due to the presence of the mediator background. Thus, the "mediator background" is due to the deviation introduced into the measured analyte concentration by the measurable species that is not responsive to the base analyte concentration.
When the output signal is not correlated with the concentration of the measurable substance in the sample, the inaccuracy of the measurement also increases. For example, when the biosensor system determines the concentration of the measurable substance from the output signal, those output currents that are not produced by the measurable substance may cause the system to indicate that more analyte than the correct value is present in the sample due to the presence of interference currents. Thus, an "interference bias" is a bias introduced into a measured analyte concentration by an interferent that produces an output current that is not responsive to the base analyte concentration.
From the above description, there is a constant need for electrochemical sensor systems with improved measurement performance, in particular those that can provide an increasingly accurate and/or precise determination of the analyte concentration of a living being. The system, apparatus and method of the present invention overcome at least one of the deficiencies of conventional systems.
Disclosure of Invention
A method of identifying ionized species in a sample, comprising: applying an input signal comprising an acyclic scan to the sample, the acyclic scan comprising a forward excitation and a reverse excitation; measuring an output signal comprising an output current responsive to the acyclic scan; and identifying the ionized species from an output current responsive to a forward excitation of the acyclic scan.
Other systems, methods, features and advantages of the invention will be or will become apparent to one with skill in the art upon examination of the following figures and detailed description. That is, other systems, methods, features, and advantages described above, which fall within the scope of the present disclosure, are also within the scope of the present disclosure and are protected by the following claims.
Drawings
The invention can be better understood with reference to the following drawings and description. The components in the figures are not necessarily to scale, emphasis instead being placed upon illustrating the principles of the invention.
FIG. 1 illustrates an electrochemical analysis method for determining the presence and/or concentration of an analyte in a sample, wherein an input signal is adjusted according to an output current of a voltammetric scan.
Fig. 2 shows a flow of applying an input signal.
Fig. 3A-3D show input signals for a gated amperometry method in which multiple duty cycles are applied to the sensor strip after introduction of the sample.
FIGS. 4A-4D show the input signals for gated voltammetry, where the potential changes over time.
Fig. 4E shows a comparison of cyclic scan and non-cyclic scan.
Fig. 4F shows other acyclic scans with different starting, reverse and ending potentials.
Fig. 5A shows a cyclic scan of the sensor system.
Fig. 5B shows a comparison of cyclic and acyclic scans, where the forward excitation of the acyclic scan is initiated near the apparent potential E °' of the redox couple.
Fig. 5C shows a non-cyclic scan, where the reverse scan is terminated before the reverse current peak.
Fig. 5D shows a cyclic scan in which an acyclic scan is superimposed on a Diffusion Limited Current (DLC) region.
FIG. 5E shows the acyclic scan output currents of the acyclic scans of ACV-3 and ACV-4 in FIG. 4F.
Fig. 5F shows a comparison of the output current for cyclic and non-cyclic scans.
FIG. 6A shows a half-integral plot corresponding to the cyclic voltammogram of FIG. 5A.
Fig. 6B shows a half-integral graph of output current data corresponding to the acyclic scan of fig. 5C.
Fig. 6C shows the half-integration of the cyclic scan and the acyclic scan in fig. 5B.
Fig. 6D shows the current values recorded and half-integrated for the non-cyclic scan of fig. 5D.
Fig. 7A-7C show input signals including the duty cycle of amperometry and voltammetry.
Fig. 8A shows an input signal with a total of five duty cycles, where the first pulse is a stepped amperometric excitation and each of the last four pulses is a multi-excitation pulse synthesized by the amperometric excitation and the voltammetric sweep.
Fig. 8B shows an input signal with a total of eight duty cycles, where the first and second pulses are amperometric excitations, and each of the last six pulses is a multi-excitation pulse synthesized by voltammetric scanning and amperometric excitations.
Fig. 9A shows an input signal with a total of eight duty cycles.
FIG. 9B shows the output current as a function of time that results when the input signal of FIG. 9A is applied to the sensor strip by the measurement device. The sensor strip contains plasma, glucose at about 55mg/dL as the analyte, and uric acid at a concentration of 0 or about 4mg/dL or about 12mg/dL as the interferent.
Fig. 9C and 9D show graphs of output current versus potential for linear scanning and non-cyclic scanning.
The analysis of FIG. 9B is repeated in FIG. 9E, where the plasma sample includes about 110mg/dL of glucose, uric acid indigenous to the plasma, and about 8mg/dL of acetaminophen as an additional interferent.
Fig. 9F shows a detail of a linear scan demonstrating a third duty cycle corresponding to three independent peaks of mediator, uric acid and acetaminophen, respectively.
Fig. 9G is a graph showing that the output current value due to the acyclic scan was changed from about 0.2v to about 0.3v and then returned to substantially eliminate the output current value caused by uric acid and acetaminophen.
Fig. 10A shows an input signal with a total of eight duty cycles.
FIG. 10B shows the output current as a function of time that results when the input signal of FIG. 10A is applied to the sensor strip by the measurement device. The sensor strip contained plasma, glucose as the analyte at about 55mg/dL or 111mg/dL, without additional uric acid.
Fig. 10C and 10D show graphs of output current versus potential for linear and non-cyclic scans.
FIG. 10E shows the output current as a function of time that results when the input signal of FIG. 10A is applied to the sensor strip by the measurement device. The sensor strip contained plasma, glucose as the analyte at about 445mg/dL or about 670mg/dL, without additional uric acid.
Fig. 10F and 10G show the relationship between the output current and the potential for linear and non-cyclic scanning.
FIG. 11A shows the output current as a function of time that results when the input signal of FIG. 9A is applied to the sensor strip by the measurement device. The sensor strip contains plasma, glucose at about 111mg/dL as the analyte, and either acetaminophen at 8mg/dL or a combination of acetaminophen at 8mg/dL and dopamine at 40mg/dL as the interferents.
Fig. 11B shows an enlarged view of the output current recorded by the non-cyclic scanning duty cycles 6 and 8 and the amperometric excitation duty cycle 7 of fig. 11A.
Fig. 11C shows an enlarged view of the output current resulting from the linear sweep of the third duty cycle in fig. 11A.
Fig. 11D shows a graph of the output current versus the potential for the acyclic scanning duty cycle 8 for three samples.
Fig. 12A shows an input signal with a total of eight duty cycles, wherein duty cycles 1, 2,4, 5, 7 are amperometric excitations, duty cycle 3 is a linear scan, and duty cycles 6, 8 are acyclic scans.
FIG. 12B shows the output current as a function of time that results when the input signal of FIG. 12A is applied to the sensor strip by the measurement device. The sensor strip contained plasma, about 66mg/dL glucose as the analyte, no additional interferents or about 12mg/dL dopamine.
Fig. 12C shows an enlarged view of the output current recorded by the acyclic scanning duty cycles 6, 8 and the amperometric excitation duty cycle 7.
Fig. 12D and 12E show graphs of output current versus potential for the acyclic scans of duty cycles 6, 8 for two samples.
FIG. 12F shows the current response as a function of glucose concentration, where the glucose concentration for each sample was determined from a single output current.
FIG. 12G shows the current response as a function of glucose concentration, where the glucose concentration for each sample was determined from the average output current.
FIG. 13 shows a schematic diagram of a biosensor system for determining the concentration of an analyte in a sample.
Detailed Description
Electrochemical analytical sensor systems measure the concentration of an analyte in a sample, such as the concentration of glucose in whole blood. The system includes means for applying an input signal to the sample, the input signal including a duty cycle of the amperometry and a duty cycle of the at least one voltammetry. The input signal may be free of a duty cycle of an amperometry method when at least one duty cycle of a non-cyclic scan is applied to the sample. Each duty cycle includes excitation and relaxation. The excitation may be based on amperometry or voltammetry. The system adjusts the amperometric and/or voltammetric portions of the input signal based on the output current generated by the voltammetric portion of the input signal. The system can adjust the input signal to reduce the output current in response to the interferer while reducing the output current nonlinearity, thereby improving measurement performance.
The system identifies the presence and/or identity of one or more ionizable species in the sample by responding to an output current derived from one or more voltammetric scans. The system identifies the presence and/or identity of one or more ionizable species in the sample based on the output current resulting from one or more linear scans. The system identifies the presence and/or identity of one or more ionizable species in the sample based on an output current resulting from forward excitation of one or more acyclic scans. The system may use derivative and/or ratiometric or other methods to determine the presence and/or oxidation potential of one or more ionized species in the sample from the output current in response to the voltammetric scan. The system may select amperometric excitation and/or acyclic scan potentials based on a ratio determined by current values obtained from acyclic scans.
The output current generated by the one or more interferent may be reduced by adjusting one or more of the amperometrically activated potentials and/or one or more of the non-cyclically scanned potentials based on the output current obtained from the voltammetric scan. The output current from the voltammetric scan may also be used to adjust one or more amperometrically activated potentials and/or one or more non-cyclic scanned potentials to reduce non-linearity of the output current generated by the one or more ionized species. The system of the present invention reduces the output current generated by the interferent while adjusting the potential of one or more excitations to reduce the non-linearity of the output current, relative to conventional systems operating at a single higher potential to reduce the possibility of non-linear response.
The output current from the voltammetric scan can also be used to adjust one or more amperometrically activated potentials and/or one or more non-cyclic scanned potentials to determine the concentration of the analyte, which can be further adjusted to determine the concentration of the interferent. Thus, by adjusting the potential of the input signal, the system can determine the concentration of one or more ionised species in the sample and report or use the determined value to correct the reported concentration value. The redox potential of two or more ionized species may be better determined by adjusting the scan rate of one or more linear or non-cyclic scans based on the output current obtained from the linear or non-cyclic scans.
The system may compare the output currents generated by one or more amperometric excitations to determine the concentration of an analyte, interferent or other ionized species in the sample. The system may determine the concentration of an analyte, interferent or other ionised species in the sample from the output current obtained from the one or more acyclic scans. The system may determine the concentration of an analyte, interferent or other ionised species in the sample by averaging the output currents from one or more acyclic scans. The system may analyze the data using one or more data processing methods including semi-integral, derivative, and semi-derivative based data processing.
Amperometric duty cycles are advantageously implemented using simpler electronics and methods, but with short transient decay of short pulse widths. For example, averaging the current values during a period in which the input signal of the current analysis method of a short pulse width causes attenuation may degrade the measurement performance of the system due to the change in the output current. In contrast, a linear voltammetric scan or an acyclic voltammetric scan can produce a relatively stable output current over a defined potential range. The relative stability of the voltammetry output signal can be improved when the voltammetry input signal is within the Diffusion Limited Current (DLC) region of the excited measurable species. The measurement becomes easier due to the improved stability of the current values and the measurement performance of the system can be improved by using some data processing techniques, such as averaging the signals.
FIG. 1 shows an electrochemical assay method 100 for determining the presence and/or concentration of an analyte in a sample. In a sample introduction step 110, a sample is introduced into the biosensor. A portion of the analyte in the sample undergoes a redox reaction, at a redox reaction step 120. In an electron transfer step 130, electrons are selectively transferred from the analyte to the mediator. In this way, the concentration of the ionized mediator in the sample becomes sensitive to the concentration of the analyte in the sample. An input signal including an amperometric duty cycle and a voltammetric duty cycle is applied to the sample at an input signal application step 140. The output current in response to the at least one voltammetric sweep is analyzed to determine the presence and/or characteristics of one or more contributing ionized species, at a voltammetry output amperometry step 150. The input signal is adjusted according to the output current generated by the at least one voltammetric scan, at an input signal adjustment step 160. At a sample determination step 170, the presence and/or concentration of one or more contributing ionized species (such as analytes) in the sample is determined from the one or more output signals. In a sample concentration transmission step 180, the determined ionized species concentration may be displayed, stored, further processed, and the like.
At a sample introduction step 110, a sample is introduced into a sensor portion of the system, such as a sensor strip. The sensor strip includes at least one working electrode and at least one counter electrode. The electrodes may comprise one or more reagent layers (reagentlayer). The working electrode may include a diffusion barrier layer that is an integral part of the reactant layer or a layer that is different from the reactant layer. The diffusion barrier provides a porous space having an internal volume in which measurable species may reside. For a more detailed description of the device and the use of a Diffusion Barrier, reference may be made to U.S. patent document 2007/0246357 entitled "Concentration Determination in a Diffusion Barrier Layer".
In redox reaction step 120 of fig. 1, a portion of the analyte present in the sample is chemically or biochemically oxidized or reduced, such as by an oxidoreductase. This occurs when the sample hydrates (hydrate) the reagent. At an electron transfer step 130, electrons can be selectively transferred between the analyte and the mediator based on an oxidation or reduction reaction, thereby forming an ionized measurable species, such as from the analyte or the mediator. This is advantageous in providing an initial time delay or "incubation period" for the chemical reaction of the reactant with the analyte.
In an input signal application step 140 of fig. 1, an input signal is applied to the sample. The input signal is an electrical signal, such as a current or potential, that varies significantly in amplitude or is switched on and off in a set sequence. Thus, the input signal is a series of excitations separated by relaxations. The system may apply one or more input signals to the sample, including those for determining the presence and/or concentration of an analyte and for determining other factors, such as the value of a hematocrit of the sample or an interference current.
The input signal includes a plurality of duty cycles and may have one or more pulse intervals. The pulse interval is the pulse width or sum of the excitation width and the relaxation width that make up the duty cycle. Each pulse has an amplitude and a width. The amplitude represents the intensity of the potential, current, etc. of the excitation signal. The amplitude may be substantially constant (e.g., during amperometric excitation) or may be varied (e.g., during voltammetric scanning). Pulse width is the duration of the amperometric excitation or voltammetric scan. The pulse width of the input signal may vary or be substantially the same. Each relaxation has a relaxation width, which is the duration of the relaxation. The relaxation widths of the input signals may vary or be substantially the same.
The gating input signal may improve the measurement performance of the system by adjusting the pulse width and the relaxation width of the duty cycle. Without wishing to be bound by any particular theory, this increase in measurement performance may be achieved by drawing the excited measurable species at the working electrode from within the diffusion barrier.
Preferred input signals include applying at least 3,4, 6, 8 or 10 duty cycles in less than 30 seconds, 10 seconds or 5 seconds. More preferably, at least 3 duty cycles are applied within 10 seconds. It is currently particularly preferred that at least 4 duty cycles are applied in less than 7 seconds. Preferably, the width of each excitation pulse is independently selected between 0.1 and 3 seconds, more preferably between 0.2 and 1.2 seconds. Currently, a particularly preferred input signal pulse width is independently selected between 0.3 seconds and 0.8 seconds. Preferred pulse intervals are in the range of less than 3 seconds, 2.5 seconds, or 1.5 seconds. Currently, input signals having a pulse width of 0.3 to 0.5 seconds and a pulse interval of 0.7 to 2 seconds are particularly preferred. The input signal may have other pulse widths and spacings.
The nature of this duty cycle repetitive excitation-relaxation is distinct from the conventional method of continuously applying a voltage to and continuously drawing a current from a sensor strip. In the above-described conventional method, the applied voltage may have a fixed potential, or a potential that is swept from a positive potential to a negative potential, or a potential that is swept from a positive potential or a negative potential to a zero potential with respect to a reference potential. Even at zero relative potential, the above method continuously draws current from the sensor strip during the read pulse, which allows the electrochemical reaction to continue throughout the read pulse. Thus, in the conventional methods described above, the reaction that produces the measurable species in response to the analyte concentration, and the diffusion of the measurable species to the working electrode, are both affected by the current during the zero potential of the read pulse. The input signal analysis method 100 is clearly distinguished from conventional methods that employ a single long duration pulse in a variety of measurement methods, such as those disclosed in U.S. patent No. 5,243,516.
The duty cycle of each amperometry method includes an excitation period. During which time current (amperage) can be measured from the sensor strip while the potential (voltage) applied to the sensor strip remains substantially constant. The amperometrically excited potential can vary within + -10%, + -5% or + -2% over time, preferably within + -2%. The duty cycle of each voltammetry assay comprises a linear, cyclic or acyclic scan period. Current (amperage) can be measured from the sensor bars during the scan as the potential (voltage) applied to the sensor bars varies substantially linearly with time. The potential may be stabilized within a linear range of + -10%, + -5% or + -2% over time, preferably within a linear range of + -2% over time. During voltammetric scanning, the potential may change continuously with time. The input signal application step 140 can include a duty cycle of an amperometry method and a duty cycle of at least one voltammetry method. The input signal application step 140 may not include a duty cycle of amperometry when at least one duty cycle of acyclic scanning is applied to the sample.
In the voltammetry output current analysis step 150, the output current in response to at least one voltammetric scan is analyzed to determine the presence and/or characteristics of one or more ionized species. Multiple voltammetric scans can be used, and multiple voltammetric scans can be used. The presence and/or characteristics of one or more ionized species in a sample may be identified based on the output current resulting from forward excitation of the linear scan, the cyclic scan, and/or one or more acyclic scans. The ionized species may be one or more measurable species associated with one or more analytes or ionization interferents, etc. in the sample. From the output current in response to the voltammetric sweep, a derivative, ratio, or other method is employed to determine the presence of one or more ionized species in the sample.
In an input signal adjustment step 160, the input signal is adjusted according to the output current of the at least one voltammetric sweep. The amperometric excitation or voltammetric sweep is adjusted according to the output current of the at least one voltammetric sweep. The above adjustments may be made to reduce or eliminate interference currents in the output current resulting from amperometric excitation or non-cyclic scanning. The above adjustments may be made to reduce or eliminate non-linear responses in the output current resulting from amperometric excitation or non-cyclic scanning. The above adjustments may be made to determine the concentration of one ionized species over another. One or more adjustments may be made to the input signal to address one or more of the above-mentioned conditions. Thus, the system can operate at different potentials depending on the ionized species of a particular sample.
In a sample determination step 170, the output signal in response to the input signal is analyzed to determine the presence and/or concentration of one or more ionized species in the sample. The output signal may comprise the current measured during the entire or a portion of the amperometric excitation and/or voltammetric scan. The output signal may or may not also include the current measured during relaxation or partial relaxation. The output signal may also include a current and/or potential measured at the working electrode during at least a portion of the relaxation period that is not used to determine the concentration of the analyte in the sample. Since multiple ionizable species in a sample may be ionized by different portions of the input signal, the presence and/or concentration of multiple analytes, mediators, interferents, and the like may be determined. Additional current, time, and/or other values may also be analyzed. Although the sample determination step 170 follows the voltammetry output amperometry step 150 and the input signal adjustment step 160 in fig. 1, this is not required. It is also possible to determine the concentration of one or more ionised species and then modify the determined concentration based on the information obtained in the input signal adjustment step 160.
For further discussion of data processing and related digital implementations of electrochemical current conversion, reference may be made to the following documents: bard, a.j., Faulkner, l.r., "Electrochemical Methods: fundametals and applications," 1980; oldham, k.b.; "A Signal-Independent electroanalytical method," anal. chem.1972,44,196; goto, m., Oldham, k.b. "Semi-integral electroanalysis: Shapes of Neopolarograms," anal. chem.1973,45,2043; Dalrymple-Alford, p., Goto, m., Oldham, k.b., "Peak shares in Semi-differential electroanalysis," anal.chem.1977,49,1390; oldham, k.b. "volume: a general electrochemical Procedure impacted by a Universal Algorithm," anal. chem.1986,58,2296; pedrosa, J.M., Martin, M.T., Ruiz, J.J., Camacho, L., "Application of the Cyclic Semi-Integral volt-assay and Cyclic Semi-Differential volt-assay to the Determination of the Reduction Mechanism of aNi-Porphyrin," J.electric.Chem.2002, 523, 160; klicka, R, "Adsorption in Semi-Differential voltametry," J.Electroanal.chem.1998,455, 253.
In a sample concentration transmission step 180, the measurement device may display, wirelessly or by wire, transmit data, store data for future reference, further process, and/or perform other operations using the determined concentration of one or more ionizable species. For example, a measured value of one analyte, mediator or interferent may be corrected for by a measured value of another analyte, mediator or interferent, thereby improving the measurement performance of the system.
Fig. 2 shows an input signal 200, which may be applied in step 140 of fig. 1. In a first pulse step 210, the sample is electrochemically excited with a first pulse of the input signal. In an output signal generating step 220, an output signal is generated in response to the input signal. At a relaxation step 230, the sample is allowed to relax. The pulse step 210, the output signal generation step 220, and the relaxation step 230 collectively form a duty cycle 240. In a second duty cycle 250, the duty cycle 240 is repeated with a second pulse replacing the first pulse 210 of the input signal 200.
In a first pulsing step 210 of fig. 2, the system ionizes an ionizable species. The pulses may be amperometric and thus have a substantially constant voltage and polarity throughout the duration. Therefore, amperometry can determine the concentration of an analyte in a sample by electrochemically measuring the rate at which an oxidation reaction or a reduction reaction of an ionized species occurs at a substantially constant potential. Conversely, the pulses may be voltammetric, and thus have a potential that varies or "sweeps" in a substantially linear fashion across a plurality of voltages of substantially constant polarity. Thus, voltammetric analysis can determine the concentration of the analyte in the sample by measuring the rate at which the ionized species undergoes an oxidation or reduction reaction at a potential that varies with time.
In the output signal generation step 220 of fig. 2, the system generates an output signal in response to the one or more ionized species in the sample and the first pulse 210 of the input signal. The output signal (e.g., one or more current values) may be measured continuously or intermittently, and may also be recorded as a function of time. The output signals may include an initially attenuated signal, an increased and then attenuated signal, a signal that reaches steady state, and a transient signal. The steady state current is measured when the change in current with respect to time is substantially constant. Unlike conventional steady-state currents or slowly decaying currents, instantaneous (rapidly decaying) current values can be derived from input signals with multiple duty cycles.
The sample is relaxed in a relaxation step 230. In the relaxation step 230, the current is reduced to at least half the current at maximum excitation, or at least to the same order of magnitude as the current at maximum excitation. At the relaxation step 230, the current may be reduced to a zero current state, which may be achieved by opening the circuit to which the sensor bars are coupled or in other ways. The electrical circuit may be closed mechanically, electrically, or otherwise to provide actuation (on state) or opened to provide relaxation (off state). The zero current state does not include periods of substantially no amplitude despite the presence of the electrical signal.
In the relaxation step 230, an ionizing agent, such as an oxidoreductase, may react with the analyte without a potential to produce other measurable species. For example, a glucose biosensor having glucose oxidase and a ferricyanide mediator as reactants generates additional ferrocyanide (reduced mediator) in response to the analyte concentration in the sample, without being affected by the potential, during the relaxation step 230.
In the second duty cycle 250 of fig. 2, the first pulse 210 is replaced with a second pulse that combines with the relaxation 230 to provide the second duty cycle 250 of the input signal. The second duty cycle 250 may have the same or different pulse widths and/or intervals as the first duty cycle 240. The second pulse may be amperometric or voltammetric. As with the first pulse 210, the second pulse excites an ionized species, which may be, for example, an ionized analyte, mediator, or interferent.
Although the first and second pulses may be amperometric or voltammetric, they are different. Therefore, if the first pulse 210 is amperometric, the second pulse is voltammetric; whereas if the first pulse 210 is voltammetric, the second pulse is amperometric. One or more amperometric, voltammetric, or other pulses may precede the first pulse 210, separate the first pulse 210 from the second pulse, and/or follow the second pulse. Other combinations of amperometric excitation and voltammetric scanning may also be used.
Fig. 3A-3D show the input signal for gated amperometry, which applies multiple duty cycles to the sensor strip after introduction of the sample. Square wave pulses are used in these figures; however, other waveforms compatible with the sensor system and the sample being measured may be used. For example, each of the illustrated excitations may include a plurality of shorter duration pulses. Fig. 3A shows an input signal with 9 duty cycles, where 0.5 second pulses are separated by a 1 second open circuit delay to provide a Redox Intensity (RI) of 0.357(5/14), where RI is the total excitation time divided by the sum of the total excitation time and the total delayed relaxation time of the input signal. Thus, in fig. 3A, the second duty cycle has an excitation 320 and a relaxation 330. The output signal produced from the gated amperometric input signal may be represented as a current recorded as a function of time.
The input signal of fig. 3A includes a last read pulse 310 having a longer duration, which contains an increased voltage. The increased voltage of the last read pulse enables detection of substances with higher oxidation potential, such as control solutions (control). The last read pulse has substantially the same voltage as the duty-cycled excitation pulse, for example, last read pulse 340 in FIG. 3B may be used. For a more complete discussion of the final read pulse, see U.S. patent No. 2009/0014339 entitled "oxidizing specificities as an Internal Reference in Control solutions for Biosensors".
Fig. 3D shows the input signal for gated amperometry wherein the initial pulse 360 is applied at a higher voltage than the following four pulses. Further, the relaxation width between the initial pulse 360 and the second pulse 370 is different compared to the relaxation width of the remaining pulses. In contrast to the amperometric excitations of FIGS. 3A-3C, each amperometric excitation of FIG. 3D includes two portions of substantially stable voltage to provide a stepped amperometric pulse. So that the input signal of a gated amperometry method with a plurality of substantially stable voltages per pulse can be used.
FIGS. 4A-4F show the duty cycle of gated voltammetry with potential variation over time, compared to the amperometric excitation of FIGS. 3A-3D. Fig. 4A shows a gated linear scan comprising a forward scan 410, while fig. 4B shows a gated cyclic scan comprising a forward scan 410 combined with a commutation point 415 and a reverse scan 420. The commutation point is the point in the cyclic or acyclic scan where the forward scan stops and the reverse scan starts. Forward scan 410, in combination with reverse scan 420, may substantially cover the potential range of the mediator (e.g., ferricyanide). Fig. 4C and 4D show gated acyclic scans. Where the start voltage of the forward scan is different from the end voltage of the reverse scan in fig. 4C, while the forward and reverse scans in fig. 4D occur substantially in the Diffusion Limited Current (DLC) region of one species of the redox couple (e.g., ferricyanide/ferrocyanide of the ferrocyanide redox couple).
Fig. 4E shows the result of comparing the cyclic scan and the acyclic scan. The cyclic sweep CV-1 starts at an initial potential of-0.3 v (where the reducing species in the redox couple dominates), increases to a +0.6v turn-around point potential, and then returns to the initial-0.3 v potential. The cyclic sweep CV-2 starts at an initial potential of-0.2 v (where the reducing species in the redox couple dominates), increases to a commutation point potential of +0.4v, and then returns to the initial-0.2 v potential.
The acyclic scan ACV-1 starts at an initial potential of 0v (where the reducing species in the redox couple is at the same concentration as the oxidizing species), increases to a commutation point potential of +0.6v, and then returns to the initial 0v potential. The acyclic scan ACV-2 starts at an initial potential of +0.2v, increases to a commutation point potential of +0.3v, and then returns to the initial +0.2v potential. Preferably, the +0.2v and +0.3v potentials are within the Diffusion Limited Current (DLC) region of the redox couple. For example, ferrocyanide has a plateau from about +0.1v to +0.6v when compared to the redox potential of the ferricyanide/ferrocyanide redox couple, as determined according to the cyclic scan CV-1. Other starting, commutating, and ending potentials may also be used depending on factors such as the redox characteristics of the redox couple.
Fig. 4F shows other acyclic scans with different start, commutation and end potentials. The acyclic scan ACV-3 starts at an initial potential of-0.3 v (where the reducing species in the redox couple dominates), increases to a commutation point potential of +0.6v, and then returns to a potential of +0.1v before the reverse potential scan substantially begins the reduction of the redox couple. The acyclic scan ACV-4 starts at an initial potential of-0.3 v (where the reducing species in the redox couple dominates), increases to a commutation point potential of +0.4v, and then returns to a potential of +0.1v before the reverse potential scan substantially starts to reduce the redox couple. The acyclic scan ACV-5 starts at an initial potential of 0v (where the reducing species in the redox couple is at the same concentration as the oxidizing species), increases to a commutation point potential of +0.6v, and then returns to a potential of approximately +0.15v before the reverse potential scan substantially starts to reduce the redox couple. Other starting, commutating, and ending potentials may also be used depending on factors such as the redox characteristics of the redox couple.
During a linear scan (such as the forward scan 410 shown in fig. 4A), the current at the working electrode is measured as the potential at the working electrode varies linearly with time at a constant rate. The sweep range, such as from-0.5 v to +0.5v, may cover both the reduced state and the oxidized state of the redox couple, so that a transition from the first state to the second state occurs. A redox couple is two chemical species in pairs having different oxidation numbers, wherein the reduction of the species with the higher oxidation number produces the species with the lower oxidation number, and the oxidation of the species with the lower oxidation number produces the species with the higher oxidation number.
Voltammograms (current versus voltage) can be characterized by the following curves: during the scan, the curve starts at the initial current, reaches the peak current, and decays to the lower Diffusion Limited Current (DLC) level. The initial current depends substantially on the applied potential, but not on the Diffusion Limited Current (DLC). If the scan is slow enough, this Diffusion Limited Current (DLC) region can be considered as a plateau region in the voltammogram.
The diffusion-limited current (DLC) region is considered to represent a state in which the oxidation reaction or reduction reaction of ionized substances on the surface of a conductor reaches a maximum rate, which is substantially diffusion-limited. Diffusion is limited by the rate at which ionized species move from the sample to the conductor surface. Alternatively, when the working electrode of the sensor strip includes a diffusion barrier, the diffusion may be limited by the rate at which ionized species move from the diffusion barrier to the surface.
After the forward scan 410 is completed, a reverse potential linear scan 420 is applied for either a cyclic or acyclic scan (as shown in fig. 4B and 4C-4D, respectively). The application rate of the reverse potential linear scan 420 may be substantially the same as or different from the application rate of the forward scan 410. The process of scanning the potential is therefore: from a first lower value to a higher value and back to a second lower value, wherein the first lower value and the second lower value may be the same or different for each cyclic scan or acyclic scan. Cyclic scanning, and in some cases acyclic scanning, can detect a transition of a redox species from a reduced state to an oxidized state (or vice versa) that is related to an applied potential or to a rate of diffusion of the redox species to the surface of the conductor.
Cyclic and acyclic scans may better represent the Diffusion Limited Current (DLC) region of the scan than linear scans. Cyclic and acyclic scans are also particularly advantageous for determining the amount of Diffusion Limited Current (DLC) for quasi-reversible redox couples at fast scan rates. The quasi-reversible redox couple refers to the si in the redox couplessThe separation between the forward and reverse scans of the half-integration at half-height of the transition is greater than 30 mV. For additional information on linear and cyclic sweep voltammetry, reference may be made to "Electrochemical Methods: Fundamentals and applications" by A.J.Bard and L.R.Faulkner,1980 ".
Even with reversible redox couples or quasi-reversible redox couples, an underactivated electrode does not provide acceptable Diffusion Limited Current (DLC) conditions. Therefore, an electrode activation method (as described in U.S. Pat. No. 5,429,735) may be employed to achieve good electrode activity.
In addition to the pulse width (which may be a shorter case as shown in fig. 4D or a longer case as shown in fig. 4B), the change (scan) rate of the potential (mV/s) is also variable. For the gating input signal, voltammetric sweeps varying at a rate of at least 176mV/s are preferred, sweep rates from 200mV/s to 5000mV/s are more preferred, and sweep rates from 500mV/s to 1500mV/s are particularly preferred at present.
The gating input signal may have a Redox Intensity (RI) that varies according to a pulse width and a relaxation width of the duty cycle. The output signal produced by the gating input signal may be represented by a current that is recorded as a function of time. For a more detailed discussion of gated amperometric input signals, reference may be made to U.S. patent document 2008/0173552, entitled "gated amperometry". The output signal generated from the gated voltammetry input signal can be represented by a current that is recorded as a function of applied voltage and time. For a more detailed discussion of the input signal to Gated Voltammetry, reference is made to U.S. patent document 2008/0179197, entitled "Gated Voltammetry".
The higher the Redox Intensity (RI) in the input signal, the smaller the mediator background error introduced by the mediator into the assay results. The input signals shown in FIGS. 3A-3D and 4A-4C are oxidation pulses used to excite (e.g., oxidize) a reduced mediator (i.e., a measurable species). Thus, the greater the oxidation current applied to the sensor strip over a given time, the less likely the mediator will be reduced by other pathways than the oxidation reaction of the analyte. The oxidation reaction of the analyte provides a recorded current value. Combining multiple duty cycles of the gated amperometric and voltammetric input signals may eliminate the need for an initial pulse to update the mediator's oxidation state. For ferricyanide and organic two-electron mediators having structures I-III, the input signal has a Redox Intensity (RI) value of at least 0.01, 0.3, 0.6 or 1, preferably a Redox Intensity (RI) value of 0.1 to 0.8, 0.2 to 0.7, or 0.4 to 0.6. Other Redox Intensity (RI) values may also be used or are preferred for other mediators or combinations of mediators.
FIG. 5A shows a cyclic voltammogram from a 25mV/s cyclic scan of the ferricyanide/ferrocyanide redox couple (e.g., from the CV-1 scan of FIG. 4E). The voltammogram has the following characteristics: containing the forward current peak during forward excitation, sweeping from-0.3 v to +0.6v, and the reverse current peak during reverse voltage sweep, sweeping from +0.6v back to-0.3 v. The forward current peak represents the oxidation of ferrocyanide and the reverse current peak represents the reduction of ferricyanide. The forward and reverse current peaks are centered around the apparent potential E °' of the ferrocyanide/ferricyanide redox couple when referenced to the counter electrode. In this regard, the potential of the counter electrode is substantially dependent on the reduction potential of ferricyanide (i.e., the predominant redox species present on the counter electrode).
When the starting potentials of the forward scan and the reverse scan (the range of the scans) are selected so as to cover the reduction state of the redox couple andin the case of an oxidized state, the scanning range can be reduced to shorten the analysis time. Preferably, however, the scan range includes a Diffusion Limited Current (DLC) region of the redox couple. For example, the reduction of a ferrocyanide/ferricyanide reversible redox couple ([ Red) at a scan rate of 25mV/s]) Concentration and oxidation of substance ([ Ox)]) The concentration of the species and the resulting electrode potential can be described using the Nernst (Nernst) equation, see equation (1) below. The reversible redox couple is two redox species, of which si isssAt half the height of the transition, the interval between the forward and reverse scans of the half integration is at most 30 mV. For example, in FIG. 6A, si is removedssForward and reverse half-integral scans of ferricyanide/ferrocyanide redox couples are also shown in addition to the transition heights. At half height sissThe spacing between the forward scan line and the reverse scan line on the intersection of the transition line with the forward scan line and the reverse scan line was 29mV, thereby establishing the reversibility of the ferricyanide/ferrocyanide redox couple at the scan rates shown.

In the nernst equation, R is the gas constant of 8.314 joule/(mole × K), F is the Faraday constant of 96,5000coul./equiv., n is the number of equiv. per mole, and T is the kelvin temperature value. When the potential at the working electrode is compared to its own redox potential, the apparent potential E DEG' will become substantially zero, and the above equation reduces to:

from equation (2), the potential at the working electrode changes by approximately 60mV when the rate of oxidized mediator to reduced mediator changes by a factor of 10. The reverse is also true. Thus, for the cases where the concentration ratios of ferricyanide [ Ox ] to ferrocyanide [ Red ] are 10:1, 100:1, 1000:1, and 10000:1, the potential on the working electrode is about 60mV, 120mV, 180mV, and 240mV, respectively, from the zero potential.
Thus, a sweep range of-180 mV to +180mV when the ratio of ferricyanide to ferrocyanide is-1000: 1 can result in substantially complete oxidation of the reduced species on the working electrode. At 180mV, the oxidation rate is limited by how fast the reduced mediator can diffuse to the conductor surface, and from this potential upwards there is a Diffusion Limited Current (DLC) region. Thus, if the commutation point is set to 400mV from zero potential, a Diffusion Limited Current (DLC) region of 200mV may be provided.
For a reversible system, it is preferable to provide a sweep range of 400mV to 600mV, scanning from 200mV to 300mV on each side of the apparent potential E deg.' of the redox couple. For a quasi-reversible system, it is preferable to provide a sweep range of 600mV to 1000mV, scanning from 300mV to 500mV on each side of the apparent potential E °' of the redox couple.
Quasi-reversible systems prefer a larger scan range because the Diffusion Limited Current (DLC) area may be smaller. In addition to the intrinsic quasi-reversible redox couple, a fast scan may result in a reversible redox couple exhibiting quasi-reversible behavior at slow scan rates. Therefore, it may be preferable to provide a large quasi-reversible scanning range for redox couples that are reversible at high scan rates.
Preferably, by selecting the scan range, a Diffusion Limited Current (DLC) region of at least 25mV, 50mV, 100mV, 150mV or 300mV is provided. On the other hand, the commutation point for the cyclic scan or the acyclic scan is selected so as to provide a Diffusion Limited Current (DLC) region from 25mV to 400mV, from 50mV to 350mV, from 100mV to 300mV, or from 175mV to 225 mV. For reversible systems, the commutation point for cyclic or acyclic scanning can be selected to provide a Diffusion Limited Current (DLC) region from 180mV to 260mV or from 200mV to 240 mV. For quasi-reversible systems, the commutation point for cyclic or acyclic scanning can be selected to provide a Diffusion Limited Current (DLC) region from 180mV to 400mV or from 200mV to 260 mV.
Once the commutation point is selected to provide the desired Diffusion Limited Current (DLC) region, the duration of the reverse scan for the acyclic scan is also selected. As can be seen in FIG. 5B, the forward scan is initiated at about-0.025 mV and the reverse scan is terminated to form a non-cyclic scan, such as can be obtained from the ACV-1 scan of FIG. 4E, wherein the ACV-1 scan contains more forward current peaks than reverse current peaks. As can be seen from a comparison of FIG. 5B, despite the difference in peak current obtained from the cyclic (CV-1) and acyclic (ACV-1) scans, the Diffusion Limited Current (DLC) area of the scans is nearly identical, especially for the reverse scan.
On the other hand, as shown in fig. 5C, the reverse sweep may be terminated before the reverse current peak is reached. When the forward scan starts at a sufficiently negative potential (e.g., -0.3mV in FIG. 5C) to reach the middle of the potential range of the redox couple (e.g., -0.05mV in FIG. 5C), then the forward scan encompasses the entire range of redox potentials of the redox couple. This type of scan can be obtained from the pulse CV-2 in FIG. 4E. Thus, by terminating the reverse excitation at a potential that is 50mV to 500mV, 150mV to 450mV, or 300mV to 400mV lower than the potential at the point of commutation, for example, for a ferricyanide/ferrocyanide redox couple, a reverse current peak may not be included.
Similarly, terminating the reverse scan before reaching the reverse current peak can also be achieved by terminating the reverse scan when the reverse scan current value deviates from the Diffusion Limited Current (DLC) region. A change in reverse scan current of at least 2%, 5%, 10%, or 25% may be used to indicate the onset of a reverse scan current peak.
FIG. 5D compares the cyclic voltammogram at 1v/s (including the forward oxidation peak and the reverse oxidation peak of the redox couple) with the acyclic voltammogram at 1v/s (excluding the forward oxidation peak and the reverse oxidation peak of the redox couple). As shown in the ACV-2 acyclic scan of FIG. 5D, the acyclic scan has a start and end point of 200mV, and a commutation point of 300 mV. The preferred range of acyclic scans within the ferricyanide/ferrocyanide redox couple Diffusion Limited Current (DLC) region, which excludes the forward and reverse redox peaks, is from 10mV to 200mV, more preferably from 50mV to 100 mV. After reaching the current peak, the cyclic voltammogram with the full scan range decays significantly, whereas the non-cyclic voltammogram has a substantially flat current region within the scan range. The current region may be directly correlated to the analyte concentration in the sample.
As can be seen from fig. 5D, the current values recorded by the acyclic scan are numerically smaller than those recorded by the cyclic scan, while the background current for the acyclic scan is lower. The unexpected benefits are: the reduction of the background current can be achieved without starting the non-cyclic scan at the recovery peak of the cyclic scan. Thus, the "signal/background ratio" can be increased due to the decay of the background current, so that a fast and short acyclic scan in the redox couple Diffusion Limited Current (DLC) region can improve the measurement performance of the system.
Fig. 5E shows that the steady state portion of the current can be independent of the commutation point potential. FIG. 5F compares the output current of the cyclic sweep CV-1 of FIG. 4E with the output current of the non-cyclic sweep ACV-5 of FIG. 4F. These graphical representations allow substantially similar steady state currents to be obtained from different starting potentials.
FIG. 6A shows a semi-integral plot of the cyclic voltammogram of FIG. 5A, where a flat region extending from about 0.1v to 0.6v defines the Diffusion Limited Current (DLC) region or plateau region of current. This plateau region is contained in the voltammetry output current of FIG. 5A, extending from peak potential to high potential. Similarly, FIG. 6B shows a half-integral of the acyclic voltammogram of FIG. 5C, wherein the reverse excitation is terminated before the start of the reverse current peak. Fig. 6C shows that when half-integral curves of the cyclic and acyclic scans of fig. 5B are plotted, the Diffusion Limited Current (DLC) region of the return scan is easily established so that accurate currents can be read from commutation points as low as 50 mV. Furthermore, the peak of the semi-integral plot is responsive to the value of the hematocrit in the sample, and the peak magnitude is quantitatively related to the hematocrit level.
FIG. 6D shows the half-integrations of the cyclic scan in FIG. 5D and the non-cyclic scan of 200-300 mV. Since there is no redox transition region in the acyclic scan, the shape of the sivoltammogram of the short acyclic scan is different from the shape of the voltammogram of the cyclic scan. By starting the acyclic scan in the Diffusion Limited Current (DLC) region, the background si current decreases at a faster rate than observed for cyclic voltammograms, thereby increasing the "signal/background ratio" of the acyclic scan. In addition, the reverse si current of the acyclic scan shows a plateau that describes the concentration of analyte in the sample more accurately than the forward si current. Thus, acyclic scanning of the diffusion-limited current (DLC) region may provide greater analytical accuracy than cyclic scanning.
Cyclic scanning and non-cyclic scanning have a number of advantages associated with linear scanning. On the one hand, the reverse scan section from the commutation point to the start point of the reverse current peak value can better represent the true diffusion-limited current (DLC) value than the diffusion-limited current (DLC) region of the forward scan. For quasi-reversible redox systems or fast scans, forward scans do not indicate clear Diffusion Limited Current (DLC) regions, while reverse scanned Diffusion Limited Current (DLC) regions may more accurately represent analyte concentrations.
Acyclic scanning has a number of advantages over cyclic scanning, including: shorter pulse widths, and a substantial reduction in the amount of mediator electrochemically converted to a measurable state. Thus, if the mediator is reduced in response to the analyte and electrochemically oxidized during the measurement, terminating the reverse scan before the oxidized mediator is electrochemically reduced can reduce the amount of reduced mediator in the sample that is not responsive to the analyte. Similarly, the potential at which the forward scan is initiated is higher than the potential at which reduction of the measurable species occurs, again reducing the amount of reduced mediator in the sample that is not responsive to the analyte. Both of the above-described acyclic scans can be completed in a shorter analysis time, which is of great benefit to the user.
Fig. 7A-7C show input signals including the duty cycle of amperometry and voltammetry. The input signal may also comprise an initial incubation period, etc. Fig. 7A shows an input signal with a total of seven duty cycles. Three of the duty cycles included square wave amperometric excitations with two different amplitudes, and the remaining four duty cycles included linear sweeps. The voltammetric sweep rate was 1v/s, and about 0.7 seconds (sec) was required to complete the sweep from-0.3 v to +0.4 v. The pulse width of the voltammetric scan corresponds approximately to the 1 second pulse width of the amperometric scan. Assuming that the working and counter electrodes contain the same redox couple, the linear scan covers a potential range of: from the substantially reduced form (-0.3v) to the substantially oxidized form (+0.4v) of the redox couple. The linear sweep terminates at the primary oxidation endpoint (+0.4v) of the redox couple and is no longer reversed.
Fig. 7B shows an input signal with a total of eight duty cycles. Wherein three duty cycles comprise square wave amperometric excitations of substantially the same amplitude and the remaining five duty cycles comprise cyclic sweeps and it is assumed that the working and counter electrodes comprise the same mediator. The amperometric scan and the cyclic scan have approximately the same scan rate of 1v/s, requiring approximately 1.4 seconds to complete the scan from-0.3 v to +0.4v and back to-0.3 v. Assuming that the working and counter electrodes contain the same redox couple, the potential range covered by the cyclic scan is: from the substantially reduced form (-0.3v) to the substantially oxidized form (+0.4v) of the redox couple. However, unlike FIG. 7A, the voltammetric scan in FIG. 7B contains a reversal point at the substantially oxidized form (+0.4v) of the redox couple and returns to the substantially reduced form (-0.3 v).
Fig. 7C shows an input signal with a total of five duty cycles. Wherein two duty cycles comprise square wave amperometric excitations of substantially the same amplitude and the remaining three duty cycles comprise acyclic scans, and it is assumed that the working and counter electrodes comprise the same mediator. The input signal of fig. 7C also contains a non-cyclic scan as the last read pulse, since no relaxation follows after the excitation. The amperometric excitation and acyclic scans had approximately the same scan rate of 1v/s, requiring approximately 0.2 seconds to complete the scan from +0.2v to +0.3v and back to +0.2 v. Since the voltammetric sweep occurs in the plateau region of the redox couple, the current is substantially flat over a relatively narrow potential range of the 0.1v oxidation reaction. Such voltammetric scans provide output signals comprising currents representative of measurable species: the measurable species does not decay faster under amperometry, but can be excited in a shorter time. Such output signals are preferably selected to improve the measurement performance of the system. Input signals having the above and other duty cycle settings can be used to improve the measurement performance of the system.
Fig. 8A shows an input signal with a total of five duty cycles. Where the first pulse 860 is a stepped amperometric excitation and each of the following four pulses is a multi-excitation pulse 870 synthesized by amperometric excitation and voltammetric sweep. Each multi-stimulation pulse includes a non-cyclic portion 872 and an amperometric stimulation portion 874. Although the acyclic scan portion 872 is described as beginning, it is contemplated that it may follow the amperometric excitation portion 874. Also, a plurality of the above-mentioned portions may be included in the same pulse. Each of the pulses 860, 870 is followed by relaxation to form a duty cycle. A final read pulse followed by no relaxation may be used. The pulse width of the acyclic scan portion 872 and the amperometric excitation portion 874 are approximately equal. However, one of them may be longer. The non-cyclic scanning portion of the pulse may occur in the plateau region of the redox couple. Such output signals are preferably selected to improve the measurement performance of the system. Input signals having the above and other duty cycle settings can be used to improve the measurement performance of the system.
Fig. 8B shows an input signal with a total of eight duty cycles. Where the first pulse 861 and the second pulse 862 are amperometric excitations and each of the following six pulses is a composite multi-excitation pulse 870 of voltammetric sweep and amperometric excitations. Each multi-stimulus pulse begins with a linear scan portion 871 and transitions to a amperometric stimulus portion 875. Although the linear scan portions 871 are described as being initiated, they may actually follow the amperometric excitation portions 875. Also, a plurality of the above-mentioned portions may be included in the same pulse. Each of the pulses 861, 862, 863 is followed by a relaxation to form a duty cycle. A final read pulse followed by no relaxation may be used. The pulse width of the linear scan portion 871 is approximately equal to that of the amperometric excitation portion 875. However, one of them may be longer. The voltammetric sweep portion of the pulse can occur in the plateau region of the redox couple. Such output signals are preferably selected to improve the measurement performance of the system. Input signals having the above and other duty cycle settings can be used to improve the measurement performance of the system.
An input signal comprising a plurality of duty cycles has the following advantages: shorten analysis time, reduce the influence of mediator background and hemocytometer. The output signal generated by amperometry can be used for temperature measurement, under-fill, and offset compensation as described in the following: WO 2007/100651; U.S. patent document No. 2009/0095071 entitled "underfillddetection System for a Biosensor"; and U.S. provisional application No. 61/012,716, entitled "Slope-based Assembly", filed on 12/10 of 2007. Other compensation methods, such as the method of adjusting an input signal in response to an output signal described below, may also be implemented with an output signal generated from an input signal having multiple duty cycles.
In contrast, voltammetry provides the following output signals: the output signal may be integrated so that the signal may be enhanced even in the case of a fast scan, thereby producing an analyte response signal with an improved signal-to-noise ratio even in the case of a low analyte concentration of the sample. Other data processing methods, including semi-integral, derivative, and semi-derivative, may also be advantageous for processing the voltammetric output signal. For a more detailed description of the above data processing method reference is made to WO 2007/040913. Voltammetry can also provide qualitative data about the ionizable species in the sample. The output of both amperometry and voltammetry may be used independently to determine the concentration of one or more analytes. Averaging the output results or other processing may be used to improve the measurement accuracy of the system. The output of an amperometry analysis of the same analyte may also be compared to the output of a voltammetry analysis to determine a concentration value with high accuracy and/or precision.
Fig. 9A shows an input signal with a total of eight duty cycles. In which duty cycles 1, 2,4, 5 and 7 have amperometric excitation, duty cycle 3 has a linear scan, and duty cycles 6 and 8 have a non-cyclic scan. The number of each duty cycle is indicated by a number above the associated excitation. The amperometric excitation for duty cycle 1 was 1v voltage, while the amperometric excitation for duty cycle 2 was 0.2v voltage. The amperometric excitation for duty cycles 4, 5 and 7 was 0.25 v. The linear scan rate was about 0.5v/s, from 0v to about 0.7 v. The acyclic scan rate is about 1v/s, scans from about 0.2v to a commutation point of about 0.3v and then returns. The acyclic scan is at the following potential: this potential falls within the Diffusion Limited Current (DLC) region (about 300mV to 500mV) of the mediator having structure I. Input signals having other different numbers and types of duty cycles, potentials, and scan rates may also be used. For example, the above-described linear scanning may be replaced with cyclic scanning.
FIG. 9B shows the output current as a function of time obtained when the measurement device applies the input signal of FIG. 9A to a sensor strip containing plasma, glucose at a concentration of about 55mg/dL as an analyte, and uric acid at a concentration of 0 or about 4mg/dL or about 12mg/dL as an interferent. Other analytes and interferents may also be used. The sensor strip includes working and counter electrodes, glucose dehydrogenase as an oxidoreductase, and an organic two-electron mediator having structure I (which has an oxidation-reduction potential about 200mV lower than ferricyanide). Other sensor strip designs and reactants may also be used.
The voltage of the input signal of the working electrode with respect to the counter electrode, which corresponds to the output current, is clearly indicated by a straight line (amperometry) or a line superimposed at an angle on the right side or above the output current curve of each duty cycle (voltammetry). From the current obtained from the linear scan, the left shoulder portion of the output current of the linear scan is responsive to the mediator concentration in the sample, while the right shoulder portion of the output current of the linear scan is responsive to the uric acid concentration in the sample.
Fig. 9C and 9D are graphs showing the relationship between the output current and the potential in the linear scanning of the duty cycle 3 and the acyclic scanning of the duty cycle 6, respectively. The vertical dashed lines in fig. 9C represent the 0.25v potentials for amperometric excitation of duty cycles 4, 5 and 7. In FIG. 9C, peak 910 is due to the oxidation reaction of the mediator and is a response to the analyte; the peak 920 is caused by the oxidation reaction of uric acid and is a response to an interfering substance. The output current indicates that: a trough appears at a potential of about 0.3v to 0.4v between the peak of about 0.18v caused by mediators and the peak of about 0.58v caused by uric acid. The valleys allow the system to determine that at least two contributing ionized species are present in the sample. Since the derivative of the output current value is positive or negative when the output current rises or falls, respectively, the derivative of the output current for the linear sweep can be used to determine the peaks and valleys. One method of determining peaks and valleys using derivatives is: the starting point to end point data points are continuously differentiated, for example: xn-xn-1, or x2-x1, x3-x2, x4-x3 … …. Thus, a peak is present when the sign of the differential in a limited range changes from positive to negative; or when the sign of the differential changes from negative to positive, indicating the presence of a trough. Other mediators and interferents may also produce different peaks and valleys. Other mathematical methods may also be used to determine the peaks and troughs in the output current.
By employing amperometric excitation or non-cyclic scanning at potentials below about 0.4v and a mediator having structure I, current values caused by uric acid interferents can be reduced or substantially eliminated. In this way, the system may utilize the output current generated by the linear sweep of the third duty cycle to adjust the potential of one or more of the amperometric excitations or the non-cyclical sweeps, thereby reducing the output current generated in response to the interferent.
As for the current obtained from the linear scan of fig. 9B, the measurement device set duty cycles 5 and 7 to a potential of about 0.25v to substantially exclude the interference of uric acid. Thus, using a correlation equation or other method to correlate the output current of the amperometric duty cycles 5 and/or 7 with the analyte concentration in the sample can improve measurement performance and reduce bias caused by uric acid interferents as compared to methods that analyze at potentials in excess of 0.3 v. The system may also make other adjustments to the amperometric excitation or the non-cyclic sweep based on the output current of the linear sweep to improve the measurement performance of the system.
Alternatively, if uric acid is the target analyte, the output current of the linear sweep may be used to adjust the potential of the subsequent amperometric excitation or acyclic sweep to about 0.6v, resulting in an output current responsive to the mediator and uric acid. Then, the output current value obtained at a potential of less than about 0.4v may be subtracted from the output current value obtained at a potential of about 0.6v to obtain an output current value mainly responsive to uric acid concentration, while the output current value mainly responsive to the mediator is also excluded. The above-described comparison by subtraction or other methods may also be applied to the output current value, or the concentration value, or other values determined from the output current value by means of a correlation equation or the like.
The concentration of one or more ionized species is determined by subtraction or related mathematical methods, since ionized species having a lower oxidation potential produce an output current at both lower and higher potentials, while ionized species having a higher oxidation potential do not produce an output current at a significantly lower potential. The mathematical method removes the output current of one or more lower potential species from the output current of the high potential species. Thus, the system can determine the concentration of one or more ionised species in the sample and report or use the determination to correct the reported concentration value.
In fig. 9D, the output current in response to uric acid interferents is substantially eliminated as the acyclic scan potential of duty cycle 6 sweeps from about 0.2v to about 0.3v and then back. This is achieved by substantially superimposing the output currents of the three non-cyclic scans. Thus, the output current resulting from the acyclic scan (which sweeps from about 0.2v to about 0.3v and back again) which can be correlated with the mediator concentration, and thus the analyte concentration in the sample, is substantially unaffected by the uric acid interferent.
In fig. 9E, the foregoing analysis as for fig. 9B was repeated for the following plasma samples: the plasma sample included about 110mg/dL of glucose, uric acid indigenous to the plasma, and about 8mg/dL of acetaminophen as an interferent. In fig. 9F, a detail of a linear scan of the third duty cycle reveals three independent peaks 910, 920 and 930 corresponding to mediator, uric acid and acetaminophen, respectively. In fig. 9G, the output current values due to uric acid and acetaminophen were substantially eliminated as the potential of the acyclic scan was changed from about 0.2v to about 0.3v and then returned. As previously discussed with respect to fig. 9D, a single ionized species contributing to the output current is reflected by the substantial superposition of the output currents of the two non-cyclic sweeps. Thus, the output current of the acyclic scan (from about 0.2v to about 0.3v and back) which can be correlated to the mediator concentration and thus to the analyte concentration in the sample is substantially unaffected by uric acid and acetaminophen interferents.
Fig. 10A shows an input signal with a total of eight duty cycles, where duty cycles 1, 2,4, 5, and 7 are amperometric excitations, duty cycle 3 is a linear scan, and duty cycles 6 and 8 are acyclic scans. The amperometric excitation of duty cycle 1 was about 0.4v potential, while the amperometric excitation of duty cycle 2 was about 0.2v potential. The amperometric excitation of duty cycles 4, 5 and 7 was at a potential of about 0.25 v. The scan rate for the linear scan in FIG. 10A is faster, about 1v/s, compared to FIG. 9A, while covering the same scan range from 0v to about 0.7 v. The acyclic scan is applied at a rate of about 1v/s, it scans from about 0.2v to a commutation point of about 0.3v and then back, thus having a pulse width of about 0.1 s. Input signals having other different numbers and types of duty cycles, potentials, and scan rates may also be used. For example, the above-described linear scanning may be replaced with cyclic scanning.
FIG. 10B shows the output current as a function of time obtained when the measurement device applied the input signal of FIG. 10A to a sensor strip containing plasma, glucose as the analyte at about 55mg/dL or about 111mg/dL, and no additional uric acid. Other analytes may also be used. The sensor strip includes a working electrode and a counter electrode, glucose dehydrogenase as an oxidoreductase, and an organic two-electron mediator having structure I. The voltage of the working electrode with respect to the input signal of the counter electrode, which corresponds to the output current, is clearly indicated by a straight line (amperometry) or a line superimposed at an angle on the right side or above the output current of each duty cycle (voltammetry). The right shoulder of the output current produced by the linear scan when no additional uric acid was added to the sample indicates: uric acid is inherent in blood.
Fig. 10C and 10D show the relationship between the output current and the potential in the linear scanning of the duty cycle 3 and the acyclic scanning of the duty cycle 8, respectively. The vertical dashed line in fig. 10C represents the 0.25v potential for amperometric excitation of duty cycles 2,4, 5 and 7. In FIG. 10C, the peak 1010 is due to an oxidation reaction of the mediator and is the response to the analyte; while peak 1020 is caused by other oxidizable species, possibly uric acid as previously described. The peak 1010 of both mediators reaches a maximum before the voltage at the working electrode relative to the counter electrode is 0.15 v. As previously described, the output current indicates: a trough appears at a potential of about 0.3v to 0.4v between the peak of about 0.15v caused by mediator and the peak of about 0.6v caused by uric acid. The valleys enable the system to determine that at least two ionized species are present in the sample that contribute to the generation of the output current.
Fig. 10D shows the output current generated by the acyclic scan of the duty cycle 6. The output currents are separated from each other relative to the X-axis to enable discrimination of mediator concentrations and thus determination of analyte concentration. The measurement device may also determine the concentration of the analyte in the sample by the output current from one or more amperometric duty cycles due to the applied amperometric excitation being 0.25 v.
FIG. 10E shows the output current as a function of time that results when the input signal of FIG. 10A is applied to the sensor strip by the measurement device. The sensor strip contained plasma, glucose as the analyte at about 445mg/dL or about 670mg/dL, with no additional uric acid. In contrast to fig. 10B, fig. 10E depicts the nonlinear output current resulting from the acyclic scan of duty cycles 6 and 8, wherein the output current resulting from the forward excitation of the acyclic scan increases with potential. The increase with potential can be viewed as a relatively flat but still increasing portion 1030 of the output current before the commutation point of the acyclic scan of duty cycles 6 and 8.
Fig. 10F and 10G show the relationship between the output current and the potential in the linear scanning of the duty cycle 3 and the acyclic scanning of the duty cycle 6, respectively. The vertical dashed lines of fig. 10F and 10G indicate the 0.25v potential for amperometric excitation of duty cycles 4, 5 and 7. The mediator oxidation peak in response to the higher glucose concentrations of 445mg/dL and 670mg/dL is clearly shifted to the right of the 0.25v potential in FIG. 10F compared to FIG. 10C (which gives results from the lower glucose concentrations of 55mg/dL and 111 mg/dL). As can be seen in FIG. 10F, the maximum redox potential (approximately 0.28v for the 670mg/dL sample) is higher than the amperometric excitation potential, so the amperometric excitation output current (e.g., duty cycles 4 and 5 in FIG. 10E) will contain a nonlinear response.
Since the Diffusion Limited Current (DLC) region of the mediator has moved to a higher potential, the 0.2v to 0.3v range of the acyclic scan occurs substantially before and/or in the oxidation peak of the mediator. Thus, the output currents of the acyclic scan duty cycles 6 and 8 occur substantially after the oxidation peak of the mediator in FIG. 10B, and substantially before and/or during the oxidation peak of the mediator in FIG. 10E. Since the acyclic scan range of fig. 10E does not fall within the region of the mediator Diffusion Limited Current (DLC) after the oxidation peak, but falls within the peak region, the output current resulting from the forward excitation (increasing potential) of the acyclic scan increases with increasing input potential. Thus, the output currents resulting from the acyclic scan duty cycles 6 and 8 will also contain a non-linear response.
The system can detect a non-linear response based on the slope of the output current resulting from the forward excitation of the acyclic scan. A comparison of the output current 1050 of the forward acyclic scan line of FIG. 10D with the output current 1055 of the forward acyclic scan line of FIG. 10G shows that: output current 1055 of fig. 10G has a substantially positive slope relative to output current 1050 of fig. 10D. This confirms that: for higher glucose concentrations 445 and 670mg/dL, the output current from the acyclic scan is not substantially derived from the Diffusion Limited Current (DLC) region of the mediator, but is responsive to the varying potential of the acyclic scan. Thus, the forward scan portion of the acyclic scan (with increasing potential) may provide qualitative data similar to that obtained by the linear scan, thereby enabling the acyclic scan to provide an output current that may be used to determine whether a non-linear response exists at one or more potentials.
Depending on the severity of the nonlinear response, the system may end the analysis or adjust the amperometrically excited potential and/or the acyclic scanned potential based on the output current resulting from the one or more voltammetric scans to reduce the nonlinearity of the current resulting from the adjusted amperometric excitation and/or acyclic scans. By the above method, the system can adjust the amperometric potential and/or the acyclic scanned potential to be within the Diffusion Limited Current (DLC) region of one or more ionized species.
After determining the maximum oxidation current of the one or more ionised species, the operating potential of the subsequent excitation may be adjusted to a potential at least 50mV or at least 100mV higher than the potential of the oxidation peak. This adjustment can reduce the non-linearity of the output current resulting from subsequent excitations and improve the measurement performance of the system. Thus, for the higher glucose concentrations of FIGS. 10E-10G, the data obtained from the linear scan and/or the acyclic scan can be used to increase the input potential for subsequent amperometric excitation and/or the starting potential for subsequent acyclic scans to greater than about 0.3v to reduce the nonlinearity of the output current. For different systems, samples, sensor strips, etc., other amperometric input potentials may be used to reduce the non-linearity of the output current.
Uric acid and acetaminophen interferents, whose oxidation potentials do not substantially overlap with the oxidation potential of the mediator having structure I, II or III, are used in FIGS. 9 and 10. In contrast, FIG. 11A shows the measured output current as a function of time. The output current is obtained when the measuring device applies the input signal of fig. 9A to the sensor strip. The sensor strip contains plasma, approximately 111mg/dL glucose as the analyte, and either 8mg/dL acetaminophen or a combination of 8mg/dL acetaminophen and 40mg/dL dopamine as the interferent. Other analytes and interferents may also be used. The oxidation potential of dopamine is slightly higher than that of the mediator with structure I, II or III and overlaps with that of acetaminophen. The sensor strip includes a working electrode and a counter electrode, glucose dehydrogenase as an oxidoreductase, and an organic two-electron mediator having structure I. Other sensor strip designs and reactants may also be used.
Fig. 11B provides an enlarged view of the output currents recorded by the acyclic scanning duty cycles 6 and 8 and the output currents recorded by the duty cycle 7 amperometric excitation. As previously mentioned, acetaminophen interference is essentially invisible in the output current values recorded for the amperometric excitation duty cycle 7, and does not adversely affect the measurement performance of the system with respect to determining analyte concentrations according to the amperometric duty cycle. However, the current values recorded by amperometric excitation duty cycle 7 indicate that: on the right side of the decay there is a minor effect 1160 caused by dopamine. Thus, for samples containing acetaminophen, the glucose concentration determined from this peak shows substantially no interfering deviations caused by acetaminophen. But if the sample contains dopamine some disturbing errors will be indicated.
Fig. 11C shows a graph of the output current versus potential for the linear scan duty cycle 3 of fig. 11A. The vertical dashed lines indicate the 0.25v potentials for amperometric excitation of duty cycles 4, 5 and 7. For samples containing additional acetaminophen, the resulting output current substantially overlapped the output current obtained from the 0-added sample up to about 0.45v (well beyond the 0.25v potential of amperometric excitation duty cycle 7). In contrast, for samples containing additional acetaminophen and dopamine, the onset of the dopamine-induced output current can be seen at about 0.22v, i.e., within the range of the output current obtained at the 0.25v potential of amperometric excitation duty cycle 7. As previously described for fig. 11B, there may be some interference error caused by dopamine in the glucose concentration determined from the output current generated by the 0.25v amperometric excitation.
Fig. 11D is a graph showing the relationship between the output current and the potential generated by the non-cyclic scanning duty cycle 6 for three samples. The output current produced by forward excitation of the acyclic scan of the 0-added sample and the sample containing additional acetaminophen showed a decreasing output current, while the current values obtained from the samples with additional acetaminophen and dopamine decreased and increased. Thus, forward excitation of the acyclic scan indicates the presence of an output current in response to a second contributing ionised species (in this case a dopamine interferent) that decreases and then increases, with a sweep in the range of about 0.2v to about 0.3 v. The system can detect the presence of additional ionized species from the curve of the current curve as follows: the output current caused by the additional ionized species is within the forward excitation range of the acyclic scan.
The presence of one or more contributing ionised species may be determined by ratioing the output current of the acyclic scan. The first ratio may be determined based on the start and midpoint of the output current value of the forward acyclic scan (R)1Start of output current/midpoint of output current). The second ratio may be determined based on the midpoint of the output current for the forward acyclic scan and the commutation point (R)2Mid-point of the output current/commutation point of the output current). If both ratios are greater than 1, a functional ionised species is present. Conversely, if the first ratio is greater than 1 and the second ratio is less than 1, there are at least two contributing ionized species. In addition to the ratio method, other methods (e.g., derivative, integral, pattern recognition, etc.) may be used to compare the output currents obtained from the duty cycle of the acyclic scan to determine whether a plurality of ionized species are observed by the acyclic scan.
In the acyclic scan of FIG. 11D, the output current obtained from samples without acetaminophen and dopamine interferents had a first ratio of 1.65(7.36/4.47 μ A) and a second ratio of 1.26(4.47/3.54 μ A). Since both ratios are greater than 1, it is indicated that only one contributing ionised species, in this case a mediator, is present. The first ratio and the second ratio of the output current of the sample containing acetaminophen as an interferent are both greater than 1. Since both ratios are greater than 1, it is indicated that only one of the contributing ionised species, in this case the mediator, is present. As confirmed in fig. 11B and 11C, the additional acetaminophen had little effect on the deviation of the analyte concentration determined by amperometric excitation using a potential of 0.25 v. The output current obtained from the sample containing acetaminophen and dopamine had a first ratio of 1.26(4.35/3.37 μ A) and a second ratio of 0.79(3.37/4.27 μ A). Since the second ratio is less than 1, it is indicative of the presence of at least two contributing ionized species. Thus, the output current recorded for a 0.2v to 0.3v scan yields a glucose concentration that contains a dopamine-induced bias.
Since the acyclic scan determines that two contributing ionised species are present in the scan range of 0.2v to 0.3v, the maximum potential of its subsequent acyclic scan may be reduced until the second ratio increases above 1, thereby reducing the current output in response to the dopamine interferent and reducing the interferent bias present in the glucose concentration. As described above, since the potential is lowered to select the range of the acyclic scan or the potential excited by the amperometry, the negative influence caused by the nonlinear response and the variation of the interfering substance is canceled, and the linearity of the output current value can be detected. The presence and/or potential of one or more contributing ionised species is preferably determined using acyclic scanning. Amperometric excitation is preferably used to provide output current values with reduced non-linearity and interferent error for determination of concentration. Since the amperometric excitation is applied at a substantially constant single potential, the value of the single potential of the amperometric excitation is most likely to become low enough to reduce the output current in response to the interferent, or high enough to reduce the non-linearity. Any combination of linear or non-cyclic scanning may be used to determine the presence and/or potential of an active ionised species and/or the non-linearity of the output current at a certain potential or range of potentials.
Fig. 12A shows an input signal with a total of eight duty cycles, where duty cycles 1, 2,4, 5, and 7 are amperometric excitations, duty cycle 3 is a linear scan, and duty cycles 6 and 8 are acyclic scans. The amperometry of duty cycles 4, 5 and 7 excited a potential of approximately 0.25 v. The linear scan rate is about 1v/s, from 0 to about 0.7 v. The non-cyclic sweep of duty cycle 6 is at a rate of about 1v/s, sweeping from about 0.15v to about 0.25v and back again. The non-cyclic sweep of duty cycle 8 is at a rate of about 1v/s, sweeping from about 0.2v to about 0.3v and back again. Input signals having other different numbers and types of duty cycles, potentials, and scan rates may also be used. For example, the above-described linear scanning may be replaced with cyclic scanning.
Fig. 12B shows output current as a function of time. This output current is obtained when the measuring device applies the input signal shown in fig. 12A to the sensor strip. The sensor strip contained plasma, about 66mg/dL glucose as the analyte, and no additional interferents or about 12mg/dL dopamine. Other analytes and interferents may also be used. The sensor strip includes a working electrode and a counter electrode, glucose dehydrogenase as an oxidoreductase, and an organic two-electron mediator having structure I. Other sensor strip designs and reactants may also be used.
Fig. 12C shows an enlarged view of the output current recorded by the acyclic scan of duty cycles 6, 8 and the amperometric excitation of duty cycle 7. From the dopamine peak 1230 (mediator peak 1210), it can be seen that the duty cycle 6 of the acyclic scan at the lower 0.15v to 0.25v potential contains less current in response to dopamine than the duty cycle 8 of the acyclic scan at the higher 0.2v to 0.3v potential. Amperometric excitation of the 0.25v potential duty cycle 7 produced the following output currents: from the intermediate peaks of the output current, it can be seen that the output current contains dopamine-induced output current, thereby reducing the accuracy of the analyte concentration determined from the output current (about 15% to 20% of the positive deviations present in the glucose concentration determined from amperometric scanning of the output current are estimated from the polydopamine interferents). This can be obtained from the output current resulting from the acyclic scan of the 0.25v input potential.
Fig. 12D and 12E show graphs of output current versus potential for the acyclic scanning duty cycles 6 and 8 applied to two samples. As previously described, the presence of one or more contributing ionized species may be determined from the ratio of the acyclic scan output currents. As can be seen from the acyclic scan at the lower potential in FIG. 12D, the output current of the sample without dopamine had a first ratio of 1.65 (3.6/2.2. mu.A) and a second ratio of 1.22 (2.2/1.79. mu.A). Since both ratios are greater than 1, it is indicated that only one of the contributing ionised species, in this case the mediator, is present. The output current of the sample containing dopamine had a first ratio of 1.63(3.77/2.31 μ A) and a second ratio of 0.95(2.31/2.43 μ A). Since the second ratio is less than 1, it indicates the presence of a second contributing ionised species, in this case a dopamine interferent. However, the second ratio of 0.95 is close to 1, indicating that the interferents have little effect on the assay results for the potential range of 0.15v to 0.25 v. Therefore, amperometric excitation may select a potential range of 0.15v to 0.25v if this range can provide a ratio of scan potentials close to 1.
In FIG. 12E, the output current obtained from the dopamine-free sample has a first ratio of 1.99(4.18/2.1 μ A) and a second ratio of 1.23(2.1/1.7 μ A) as seen by the 0.2v to 0.3v potential sweep. Since both ratios are greater than 1, it is indicated that only one of the contributing ionised species, in this case the mediator, is present. The output current of the sample containing dopamine as an interferent had a first ratio of 1.7(4.56/2.67 μ A) and a second ratio of 0.91(2.67/2.95 μ A). Since the second ratio is less than 1, it indicates the presence of a second contributing ionised species, in this case a dopamine interferent. Comparing the second ratio (0.91) for the acyclic scan at the higher potential with the second ratio (0.95) for the acyclic scan at the lower potential, it can be seen that the amperometrically activated potential can be selected from the range of lower potential scans because the lower potential is more effective at excluding the current output in response to dopamine interference.
The input signal of FIG. 12A may also be applied to whole blood samples containing various known glucose concentrations at a hematocrit level of 25%, 40%, or 55% (v/v). A YSI reference device is utilized to determine a reference (known) glucose concentration for each sample. FIG. 12F shows the response of a single output current per sample as a function of known glucose concentration. The single output current is generated by the amperometric duty cycle 5 excitation. FIG. 12G shows the response of the average output current per sample as a function of known glucose concentration. The average output current is obtained by averaging the output currents obtained from the acyclic scanning duty cycle 6.
From the following Table IIIIt is seen that the average output current corresponds to the value of R of the concentration, compared to the single output current2Slightly larger. Thus, the glucose concentration determined from the average output current of the acyclic scan is comparable to the glucose concentration determined from the single output current of the acyclic scan. As the slope values of the relevant rows in the table are increased, the average output current of the non-cyclic scanning improves the sensitivity of the system to a certain degree. An increase in the slope value indicates an increased correlation of the output current to the actual concentration of analyte in the sample. Thus, the analyte concentration may be determined from a single output current and/or a composite output current by averaging or the like. The single or average output current may be used to determine the concentration of one or more analytes in the sample using one or more data processing and/or correlation equations. Although the input signal comprising the amperometry and the duty cycle of at least one voltammetry method are discussed above, the amperometric excitation may also employ a non-cyclic scan by which the concentration of the analyte may also be determined. Thus, no amperometric duty cycle is required for the input signal. For additional information regarding the determination of analyte concentration from Gated Voltammetry input signals, reference may be made to U.S. patent document No. 2008/0179197, entitled "Gated Voltammetry".
TABLE III
| 25% blood |
40% blood |
55% blood cell volume meter | |
| Single current R2 | 0.9957 | 0.9966 | 0.9972 |
| Single current slope | 0.0223 | 0.0191 | 0.0163 |
| Average current R2 | 0.9964 | 0.9957 | 0.9988 |
| Average current slope | 0.0256 | 0.0222 | 0.0195 |
Although not shown in the figure, if the system determines from the output current of the voltammetric sweep that a number of contributing ionized species are present in the sample, the system may reduce the voltammetric sweep rate in order to better determine the output current. For example, if there are closely spaced peaks in the output current of the linear sweep, the sweep rate can be reduced from 1v/s to 0.5v/s to improve the resolution of the output current over the target potential range. Other scan rates may of course be selected.
Fig. 13 shows a biosensor system 1300. The system uses an input signal comprising a duty cycle of an amperometry method and at least one duty cycle of a voltammetry method to determine the concentration of an analyte in a sample of the biological fluid. The input signal may be free of amperometric duty cycles when at least one acyclic scanning duty cycle is applied to the sample. The biosensor system 1300 includes a measurement device 1302 and a sensor strip 1304 that can be installed in any analytical instrument, including a bench-top device, a portable or handheld device, and the like. The biosensor system 1300 may be used to determine the concentration of an analyte or interferent, including: alcohols, glucose, uric acid, lactate, cholesterol, bilirubin, free fatty acids, triglycerides, proteins, ketones, phenylalanine, enzymes, acetaminophen, dopamine, and the like. Although a specific configuration is shown, the biosensor system 1300 may also take a configuration that includes other components.
The measurement device 1302 and the sensor strip 1304 may be adapted for use in an electrochemical sensor system or a combined electrochemical/optical sensor system. By reducing the output current generated by the interferent, the duty cycle of the combined amperometry and voltammetry may increase the accuracy and/or precision of sensor system 1300, or may enable sensor system 1300 to determine the concentration of multiple ionizable species. Although a specific configuration is shown, the biosensor system 1300 may also take a configuration that includes other components.
The sensor strip 1304 has a base 1306 that forms a chamber 1308 and a channel 1310 having an opening 1312. The chamber 1308 and the passage 1310 may be covered with a cover having a vent hole. The chamber 1308 defines a partially enclosed space. Chamber 1308 can contain a composition that helps retain the liquid sample, such as a water-swellable polymer or a porous polymer matrix. Reactants can be placed in chamber 1308 and/or channel 1310. The reactants may include one or more enzymes, enzyme systems, mediators, binders, and the like. The sensor strip 1304 may also have a sample interface 1314 adjacent to the chamber 1308. The sample interface 1314 may partially or completely surround the chamber 1308. The sensor bar 1304 can have other configurations. For example, the sensor strip 1304 may be adapted for use in contact with the skin by making the chamber 1308 from a porous material or by placing the chamber 1308 behind a porous material in which the sample is stored.
The sample interface 1314 has conductors connected to at least one working electrode and at least one counter electrode. The electrodes may be located substantially in the same plane or in multiple planes (e.g., facing planes). The electrodes may be disposed on the surface of base 1306 that forms chamber 1308 and may protrude into or within chamber 1308. The insulating layer may partially cover the conductors and/or electrodes. The counter electrode can be used to balance the potential on the working electrode during analysis. The equilibrium potential can be achieved by: the counter electrode is made of an inert material (such as carbon) and contains a soluble redox species (such as ferricyanide) in chamber 1308. Alternatively, the equilibrium potential may be a reference potential realized by: a counter electrode is fabricated with a reference redox couple (e.g., silver/silver chloride) to form a combined reference-counter electrode. The sample interface 1314 may have other electrodes and conductors. The sample interface 1314 may have an optical port or aperture for viewing the sample. The sample interface 1314 may have other components and structures.
The measurement device 1302 includes electronic circuitry 1316 connected to a sensor interface 1318 and a display 1320. The electronic circuit 1316 includes: a processor 1322 coupled to signal generator 1324, and a storage medium 1328. The measurement device 1302 may also have other components and configurations.
In response to processor 1322, signal generator 1324 sends an electrical input signal to sensor interface 1318. The electrical input signal can be transmitted to the sample interface 1314 through the sensor interface 1318, thereby applying the electrical input signal to the sample of biological fluid. The electrical input signal may be a potential or a current, and may be constant, variable, or a combination of both (e.g., applying an alternating current signal with a direct current bias). The electrical input signal may be applied in the form of a single pulse, multiple pulses, a sequence or a cycle. The electrical input signal may include an amperometric duty cycle and at least one voltammetric duty cycle. The electrical input signal may be free of amperometric duty cycles when at least one duty cycle of the acyclic scan is applied to the sample. The electrical input signal may comprise at least three duty cycles of amperometry and at least two duty cycles of acyclic scanning. The signal generator 1324 may also record the output signal from the sensor interface as a generator-recorder.
The storage medium 1328 may be magnetic, optical, semiconductor memory, other processor readable storage device, or the like. The storage medium 1328 may be a fixed storage device, a removable storage device (such as a memory card), or a remotely accessed device, among others.
In processor 1322, the output signal produced from the adjusted input signal is correlated with the concentration of the at least one ionized species in the sample using one or more correlation equations. Processor 1322 may use the concentration of another ionized species to correct the concentration of the ionized species. The results of the analytes may be output to display 1320 and may be stored in storage medium 1328.
The correlation equation between the ionized species and the output signal may be expressed graphically, mathematically, or a combination of both. The correlation equation may be represented by a Program Number (PNA) table, other lookup tables, etc. stored in the storage medium 1328. The instructions for performing the analysis may be provided by computer readable software code stored in storage medium 1328. The code may be object code or any other code that may describe or control the functionality described herein. In processor 1322, the analyzed data may be subjected to one or more data processing steps, including the determination of decay rates, K constants, ratios, and the like.
The sensor interface 1318 has contacts that connect to or are in electrical communication with conductors in the sample interface 1314 of the sensor strip 1304. Through the contacts, the sensor interface 1318 transmits the electrical input signal generated by the signal generator 1324 to the conductors in the sample interface 1314. Through the above contacts, sensor interface 1318 also transmits the output signal of the sample to processor 1322 and/or signal generator 1324.
In use, a liquid sample for analysis is transferred into the reservoir formed by chamber 1308 by introducing liquid into opening 1312. The liquid sample flows in through the channel 1310, filling the chamber 1308 with liquid, while venting the original air. The liquid sample chemically reacts with a reactant placed in channel 1310 and/or chamber 1308.
The following definitions are set forth herein to provide a clear and consistent understanding of the specification and claims.
The term "linear sweep" refers to voltammetric excitation, in which the voltage is varied at a constant rate in a single "forward direction", such as increasing from-0.5 v to +0.5v to provide a sweep range of 1.0 v. The sweep range may cover both the reduced state and the oxidized state of the redox couple such that a transition from one state to the other occurs. The linear scan may be continuous or approximated by a series of incremental changes in potential. If the time intervals at which the increments occur are short, they correspond to a continuous linear scan. Therefore, applying a potential change that varies approximately linearly may be considered a linear scan.
The term "cyclic sweep" refers to voltammetric excitation combined with a linear forward sweep and a linear reverse sweep, where the sweep range includes the oxidation reaction peak and the reduction reaction peak of the redox couple. For example, changing the potential from-0.5 v to +0.5v and back to-0.5 v in a cyclic manner is an example of a cyclic scan of a ferricyanide/ferrocyanide redox couple as used in a glucose sensor, where both the oxidation reaction peak and the reduction reaction peak are in the scan range. Both the forward and reverse sweeps may be accomplished by a series of incremental change approximations of the potential. Therefore, applying a potential change that approximates a cyclic change can be considered a cyclic scan.
The term "acyclic scan" refers, in one aspect, to voltammetric excitations having one more forward or reverse current peak than other current peaks. An example of an acyclic scan is as follows: a sweep with forward and reverse linear sweeps, where the start voltage of the forward sweep is different from the end voltage of the reverse sweep, such as from-0.5 v to +0.5v and back to +0.25 v. In another example, the acyclic scan can begin and end at substantially the same potential when scanning from a potential up to ± 20mV, ± 10mV or ± 5mV from the apparent potential E °' of the redox couple. Non-cyclic sweep, on the other hand, refers to voltammetric excitation with forward and reverse linear sweeps that substantially exclude the oxidation reaction output current peak and the reduction reaction output current peak of the redox couple. For example, the excitation may start, reverse, and end in the Diffusion Limited Current (DLC) region of the redox couple, and thus not include the oxidation output current peak and the reduction output current peak of the redox couple. Both forward and reverse sweeps can be achieved by a series of incremental change approximations of the potential. Therefore, applying a potential change that is approximately non-cyclic may be considered a non-cyclic scan.
The terms "fast scan" and "fast scan rate" refer to scans in which the potential varies at a rate of at least 176 mV/s. Preferred fast scan rates are faster than 200mV/s, 500mV/s, 1000mV/s, or 2000 mV/s.
The terms "slow scan" and "slow scan rate" refer to a scan that varies at a rate of up to 175mV/s in voltage. Preferred slow scan rates are slower than 150mV/s, 100mV/s, 50mV/s, or 10 mV/s.
While various embodiments of the invention have been described above, it will be apparent to those of ordinary skill in the art that other embodiments and arrangements are possible within the scope of the invention. Accordingly, the scope of the invention is to be limited only by the following claims and their equivalents.
Claims (9)
1. A method of identifying ionized species in a sample, comprising:
applying an input signal comprising an acyclic scan to the sample, the acyclic scan comprising a forward excitation and a reverse excitation;
measuring an output signal comprising an output current responsive to the acyclic scan;
identifying the ionized species from an output current responsive to a forward excitation of the acyclic scan; and
the first and second ratios of the output currents being greater than 1 to identify the presence of one ionized species, and the second ratios being less than 1 to identify the presence of at least two ionized species,
wherein,
the first ratio is determined based on a start of the output current in response to the forward excitation for the acyclic scan and a midpoint of the output current in response to the forward excitation for the acyclic scan,
the second ratio is determined based on an output current midpoint of the forward excitation in response to the acyclic scan and an output current commutation point of the forward excitation in response to the acyclic scan.
2. The method of claim 1, further comprising employing a derivative of an output current in response to a forward excitation of the acyclic scan.
3. The method of claim 2, wherein the derivative is continuous.
4. The method of claim 2, wherein the sign of the derivative is used to identify the ionized species.
5. The method of claim 1, further comprising identifying the ionized species from the first and second ratios of the output currents when the second ratio of the output currents is less than 1.
6. The method of claim 5, further comprising reducing a maximum potential of a subsequent acyclic scan relative to a maximum potential of the acyclic scan.
7. The method of claim 6, wherein the maximum potential of the subsequent acyclic scan is reduced until the second ratio is greater than 1.
8. The method of claim 5, wherein the first ratio is determined from a start of output current in response to forward excitation of the acyclic scan and a midpoint of output current in response to forward excitation of the acyclic scan, and
wherein the second ratio is determined based on the output current midpoint in response to forward excitation of the acyclic scan and the output current end in response to forward excitation of the acyclic scan.
9. The method of claim 1, further comprising:
applying a duty cycle comprising an amperometric excitation to the sample, wherein the output signal further comprises an output current responsive to the amperometric excitation; and
correlating a portion of the output signal responsive to the amperometric excitation with a concentration of at least one analyte in the sample.
Applications Claiming Priority (3)
| Application Number | Priority Date | Filing Date | Title |
|---|---|---|---|
| US7961608P | 2008-07-10 | 2008-07-10 | |
| US61/079,616 | 2008-07-10 | ||
| CN200980126926.2A CN102089650B (en) | 2008-07-10 | 2009-07-10 | Systems and methods with amperometric and voltammetric duty cycling |
Related Parent Applications (1)
| Application Number | Title | Priority Date | Filing Date |
|---|---|---|---|
| CN200980126926.2A Division CN102089650B (en) | 2008-07-10 | 2009-07-10 | Systems and methods with amperometric and voltammetric duty cycling |
Publications (2)
| Publication Number | Publication Date |
|---|---|
| CN105353013A CN105353013A (en) | 2016-02-24 |
| CN105353013B true CN105353013B (en) | 2020-01-14 |
Family
ID=41262128
Family Applications (3)
| Application Number | Title | Priority Date | Filing Date |
|---|---|---|---|
| CN201510701287.5A Active CN105353013B (en) | 2008-07-10 | 2009-07-10 | Method for identifying ionized species in a sample |
| CN200980126926.2A Active CN102089650B (en) | 2008-07-10 | 2009-07-10 | Systems and methods with amperometric and voltammetric duty cycling |
| CN201310741285.XA Active CN103760213B (en) | 2008-07-10 | 2009-07-10 | There is the system and method for the working cycle of amperometry and volt-ampere analysis |
Family Applications After (2)
| Application Number | Title | Priority Date | Filing Date |
|---|---|---|---|
| CN200980126926.2A Active CN102089650B (en) | 2008-07-10 | 2009-07-10 | Systems and methods with amperometric and voltammetric duty cycling |
| CN201310741285.XA Active CN103760213B (en) | 2008-07-10 | 2009-07-10 | There is the system and method for the working cycle of amperometry and volt-ampere analysis |
Country Status (5)
| Country | Link |
|---|---|
| US (6) | US8262899B2 (en) |
| EP (2) | EP3435077A1 (en) |
| CN (3) | CN105353013B (en) |
| ES (1) | ES2700861T3 (en) |
| WO (1) | WO2010006253A1 (en) |
Families Citing this family (24)
| Publication number | Priority date | Publication date | Assignee | Title |
|---|---|---|---|---|
| AU2005212396A1 (en) | 2004-02-06 | 2005-08-25 | Bayer Healthcare Llc | Oxidizable species as an internal reference for biosensors and method of use |
| WO2009076302A1 (en) | 2007-12-10 | 2009-06-18 | Bayer Healthcare Llc | Control markers for auto-detection of control solution and methods of use |
| ES2700861T3 (en) | 2008-07-10 | 2019-02-19 | Ascensia Diabetes Care Holdings Ag | Systems and methods that include amperometric and voltammetric work cycles |
| WO2010077598A1 (en) | 2008-12-08 | 2010-07-08 | Bayer Healthcare Llc | Low total salt reagent compositions and systems for biosensors |
| US9603522B2 (en) | 2009-08-26 | 2017-03-28 | Mayo Foundation For Medical Education And Research | Detecting neurochemical or electrical signals within brain tissue |
| US8530886B2 (en) * | 2011-03-18 | 2013-09-10 | International Business Machines Corporation | Nitride gate dielectric for graphene MOSFET |
| US9841403B2 (en) | 2011-07-21 | 2017-12-12 | Mayo Foundation For Medical Education And Research | Differentiating analytes detected using fast scan cyclic voltammetry |
| US9903830B2 (en) | 2011-12-29 | 2018-02-27 | Lifescan Scotland Limited | Accurate analyte measurements for electrochemical test strip based on sensed physical characteristic(s) of the sample containing the analyte |
| DE102012101254A1 (en) * | 2012-02-16 | 2013-08-22 | Endress + Hauser Conducta Gesellschaft für Mess- und Regeltechnik mbH + Co. KG | Measuring arrangement and method for detecting an analyte concentration in a measuring medium |
| GB2502253A (en) * | 2012-03-29 | 2013-11-27 | Univ Manchester Metropolitan | Method for detecting a species indicative of microbial growth |
| US10029101B2 (en) | 2013-01-09 | 2018-07-24 | Mayo Foundation For Medical Education And Research | Systems for the detection and delivery of neurochemical and electrical signals for functional restoration |
| US20160192872A1 (en) * | 2013-08-09 | 2016-07-07 | Mayo Foundation For Medical Education And Research | Using kinetic cyclic voltammetry to evaluate analyte kinetics and concentrations |
| WO2016030713A1 (en) * | 2014-08-25 | 2016-03-03 | United Arab Emirates University | Apparatus and method for detection and quantification of biological and chemical analytes |
| US10436772B2 (en) | 2014-08-25 | 2019-10-08 | United Arab Emirates University | Method and system for counting white blood cells electrically |
| US10564123B2 (en) | 2014-05-25 | 2020-02-18 | United Arab Emirates University | Bioreactor system and method of operating same for cellular composition identification and quantification |
| CN109690304A (en) | 2016-07-12 | 2019-04-26 | 安晟信医疗科技控股公司 | The method that electrochemical analysis is carried out by using the alternating output signal from two electrodes |
| US11353417B2 (en) | 2016-12-05 | 2022-06-07 | Ascensia Diabetes Care Holdings Ag | Risk factor monitoring |
| US11040197B2 (en) | 2017-06-22 | 2021-06-22 | Mayo Foundation For Medical Education And Research | Voltammetric neurochemical detection in whole blood |
| CN107807706B (en) * | 2017-11-02 | 2019-09-03 | 宁波大学 | A fast scanning circuit for online ohmic voltage drop precompensation |
| NL1043265B1 (en) * | 2019-01-31 | 2020-08-25 | M M C Int B V | Method for electrochemical detection and identification of drugs, narcotics and precursors thereof |
| US12517088B2 (en) * | 2019-05-15 | 2026-01-06 | Lg Chem, Ltd. | Method for selecting material for organic light-emitting device |
| CA3182449A1 (en) * | 2020-06-11 | 2021-12-16 | Cardiai Technologies Ltd. | Apparatuses and methods for detecting infectious disease agents |
| CA3193805A1 (en) * | 2020-09-24 | 2022-03-31 | Jason Heikenfeld | Aptamer sensors with reference and counter voltage control |
| EP4141443B1 (en) * | 2021-08-26 | 2025-05-07 | Nokia Technologies Oy | Apparatus, methods and computer programs for identifying characteristics of biological samples |
Family Cites Families (46)
| Publication number | Priority date | Publication date | Assignee | Title |
|---|---|---|---|---|
| US1271607A (en) | 1916-08-12 | 1918-07-09 | Ideal Specialties Mfg Company | Paper-fastener. |
| US4897162A (en) | 1986-11-14 | 1990-01-30 | The Cleveland Clinic Foundation | Pulse voltammetry |
| US5243516A (en) | 1989-12-15 | 1993-09-07 | Boehringer Mannheim Corporation | Biosensing instrument and method |
| US5393615A (en) | 1994-02-03 | 1995-02-28 | Miles Inc. | Mediators suitable for the electrochemical regeneration of NADH, NADPH or analogs thereof |
| US5429735A (en) | 1994-06-27 | 1995-07-04 | Miles Inc. | Method of making and amperometric electrodes |
| US5498542A (en) | 1994-09-29 | 1996-03-12 | Bayer Corporation | Electrode mediators for regeneration of NADH and NADPH |
| IE72524B1 (en) | 1994-11-04 | 1997-04-23 | Elan Med Tech | Analyte-controlled liquid delivery device and analyte monitor |
| US6153069A (en) | 1995-02-09 | 2000-11-28 | Tall Oak Ventures | Apparatus for amperometric Diagnostic analysis |
| US5620579A (en) | 1995-05-05 | 1997-04-15 | Bayer Corporation | Apparatus for reduction of bias in amperometric sensors |
| US5520786A (en) | 1995-06-06 | 1996-05-28 | Bayer Corporation | Mediators suitable for the electrochemical regeneration of NADH, NADPH or analogs thereof |
| AUPN661995A0 (en) | 1995-11-16 | 1995-12-07 | Memtec America Corporation | Electrochemical cell 2 |
| US5708247A (en) | 1996-02-14 | 1998-01-13 | Selfcare, Inc. | Disposable glucose test strips, and methods and compositions for making same |
| AU8031898A (en) | 1997-06-16 | 1999-01-04 | Elan Medical Technologies Limited | Methods of calibrating and testing a sensor for (in vivo) measurement of an analyte and devices for use in such methods |
| US7494816B2 (en) | 1997-12-22 | 2009-02-24 | Roche Diagnostic Operations, Inc. | System and method for determining a temperature during analyte measurement |
| US6576117B1 (en) | 1998-05-20 | 2003-06-10 | Arkray | Method and apparatus for electrochemical measurement using statistical technique |
| US6251260B1 (en) | 1998-08-24 | 2001-06-26 | Therasense, Inc. | Potentiometric sensors for analytic determination |
| US6475372B1 (en) | 2000-02-02 | 2002-11-05 | Lifescan, Inc. | Electrochemical methods and devices for use in the determination of hematocrit corrected analyte concentrations |
| US20060091006A1 (en) | 1999-11-04 | 2006-05-04 | Yi Wang | Analyte sensor with insertion monitor, and methods |
| JP4050434B2 (en) | 1999-11-29 | 2008-02-20 | 松下電器産業株式会社 | Sample discrimination method |
| SE0000957D0 (en) * | 2000-02-08 | 2000-03-21 | Digiray Ab | Detector and method for detection of ionizing radiation |
| JP3972063B2 (en) | 2001-01-17 | 2007-09-05 | アークレイ株式会社 | Quantitative analysis method and quantitative analysis apparatus using sensor |
| WO2003000127A2 (en) | 2001-06-22 | 2003-01-03 | Cygnus, Inc. | Method for improving the performance of an analyte monitoring system |
| US7018843B2 (en) | 2001-11-07 | 2006-03-28 | Roche Diagnostics Operations, Inc. | Instrument |
| US20030113933A1 (en) | 2001-12-18 | 2003-06-19 | Rasmus Jansson | Analysis of components in liquids |
| KR100475634B1 (en) | 2001-12-24 | 2005-03-15 | 주식회사 아이센스 | Biosensor equipped with sample introducing part which enables quick introduction of a small amount of sample |
| KR20040077722A (en) | 2002-01-15 | 2004-09-06 | 아가매트릭스, 인코포레이티드 | Method and apparatus for processing electrochemical signals |
| US6863800B2 (en) | 2002-02-01 | 2005-03-08 | Abbott Laboratories | Electrochemical biosensor strip for analysis of liquid samples |
| ES2357318T3 (en) | 2002-03-22 | 2011-04-25 | Animas Technologies Llc | IMPROVEMENT OF THE PERFORMANCE OF AN ANALYTIC MONITORING DEVICE. |
| WO2004053476A1 (en) | 2002-12-09 | 2004-06-24 | Otre Ab | Simplified signal processing method for voltammetry |
| US7132041B2 (en) * | 2003-02-11 | 2006-11-07 | Bayer Healthcare Llc | Methods of determining the concentration of an analyte in a fluid test sample |
| WO2005073708A2 (en) | 2004-01-29 | 2005-08-11 | Siemens Aktiengesellschaft | Method for measuring the concentration or change in concentration of a redox-active substance and corresponding device |
| KR101258714B1 (en) | 2004-10-12 | 2013-04-26 | 바이엘 헬스케어 엘엘씨 | An electrochemical system, an electrochemical sensor strip for determining the concentration of an anylyte in a sample, and a method for using the same |
| GB0423025D0 (en) * | 2004-10-15 | 2004-11-17 | Oxford Biosensors Ltd | Voltammetric ion sensor |
| US8002965B2 (en) | 2005-04-08 | 2011-08-23 | Bayer Healthcare Llc | Oxidizable species as an internal reference in control solutions for biosensors |
| CN103558284B (en) * | 2005-07-20 | 2017-04-12 | 安晟信医疗科技控股公司 | Gated amperometry |
| EP3483598B1 (en) | 2005-09-30 | 2024-11-06 | Ascensia Diabetes Care Holdings AG | Gated voltammetry |
| US7749371B2 (en) | 2005-09-30 | 2010-07-06 | Lifescan, Inc. | Method and apparatus for rapid electrochemical analysis |
| CA3044828A1 (en) | 2006-02-27 | 2007-09-07 | Ascensia Diabetes Care Holdings Ag | Temperature adjusted analyte determination for biosensor systems |
| US7966859B2 (en) | 2006-05-03 | 2011-06-28 | Bayer Healthcare Llc | Underfill detection system for a biosensor |
| US7822557B2 (en) | 2006-10-31 | 2010-10-26 | Abbott Diabetes Care Inc. | Analyte sensors and methods |
| US20090007947A1 (en) | 2006-12-22 | 2009-01-08 | Angela Spangenberg | Portable weather shielding canopy |
| US20090026094A1 (en) | 2007-05-11 | 2009-01-29 | Home Diagnostics, Inc. | Two-pulse systems and methods for determining analyte concentration |
| US8101062B2 (en) | 2007-07-26 | 2012-01-24 | Nipro Diagnostics, Inc. | System and methods for determination of analyte concentration using time resolved amperometry |
| US20090076738A1 (en) | 2007-07-26 | 2009-03-19 | Ferhan Kayihan | System and Methods for Determination of Analyte Concentration Using Time Resolved Amperometry |
| EP3438661B1 (en) | 2007-12-10 | 2022-08-03 | Ascensia Diabetes Care Holdings AG | Slope-based compensation |
| ES2700861T3 (en) * | 2008-07-10 | 2019-02-19 | Ascensia Diabetes Care Holdings Ag | Systems and methods that include amperometric and voltammetric work cycles |
-
2009
- 2009-07-10 ES ES09790276T patent/ES2700861T3/en active Active
- 2009-07-10 CN CN201510701287.5A patent/CN105353013B/en active Active
- 2009-07-10 EP EP18189249.8A patent/EP3435077A1/en not_active Withdrawn
- 2009-07-10 EP EP09790276.1A patent/EP2310843B1/en active Active
- 2009-07-10 US US12/501,107 patent/US8262899B2/en active Active
- 2009-07-10 CN CN200980126926.2A patent/CN102089650B/en active Active
- 2009-07-10 CN CN201310741285.XA patent/CN103760213B/en active Active
- 2009-07-10 WO PCT/US2009/050244 patent/WO2010006253A1/en not_active Ceased
-
2012
- 2012-07-19 US US13/552,954 patent/US8871070B2/en active Active
-
2014
- 2014-10-14 US US14/513,867 patent/US9228978B2/en active Active
-
2015
- 2015-12-03 US US14/958,562 patent/US9726632B2/en active Active
-
2017
- 2017-06-30 US US15/638,628 patent/US10444178B2/en active Active
-
2019
- 2019-09-19 US US16/576,337 patent/US10989683B2/en active Active
Also Published As
| Publication number | Publication date |
|---|---|
| US20160084791A1 (en) | 2016-03-24 |
| WO2010006253A1 (en) | 2010-01-14 |
| CN102089650A (en) | 2011-06-08 |
| US10989683B2 (en) | 2021-04-27 |
| CN105353013A (en) | 2016-02-24 |
| US20170299540A1 (en) | 2017-10-19 |
| EP2310843B1 (en) | 2018-09-05 |
| EP3435077A1 (en) | 2019-01-30 |
| US20120298507A1 (en) | 2012-11-29 |
| CN103760213A (en) | 2014-04-30 |
| US10444178B2 (en) | 2019-10-15 |
| US9726632B2 (en) | 2017-08-08 |
| US8262899B2 (en) | 2012-09-11 |
| CN103760213B (en) | 2016-04-13 |
| CN102089650B (en) | 2014-01-29 |
| EP2310843A1 (en) | 2011-04-20 |
| US20200011829A1 (en) | 2020-01-09 |
| US20100032316A1 (en) | 2010-02-11 |
| ES2700861T3 (en) | 2019-02-19 |
| HK1195626A1 (en) | 2014-11-14 |
| US20150096902A1 (en) | 2015-04-09 |
| US8871070B2 (en) | 2014-10-28 |
| US9228978B2 (en) | 2016-01-05 |
Similar Documents
| Publication | Publication Date | Title |
|---|---|---|
| CN105353013B (en) | Method for identifying ionized species in a sample | |
| CN103901092B (en) | The voltammertry system of detection biological analyte | |
| US20210148851A1 (en) | Rapid-read gated amperometry devices | |
| CN103048442B (en) | Gated voltammetry | |
| US8647487B2 (en) | System and methods for automatically recognizing a control solution | |
| HK1195626B (en) | Systems and methods including amperometric and voltammetric duty cycles | |
| HK1199498B (en) | Voltammetric systems for assaying biological analytes | |
| HK1119242B (en) | Gated voltammetry | |
| HK1184223B (en) | Gated voltammetry | |
| AU2013200186A1 (en) | Gated Voltammetry |
Legal Events
| Date | Code | Title | Description |
|---|---|---|---|
| C06 | Publication | ||
| PB01 | Publication | ||
| C10 | Entry into substantive examination | ||
| SE01 | Entry into force of request for substantive examination | ||
| C41 | Transfer of patent application or patent right or utility model | ||
| TA01 | Transfer of patent application right |
Effective date of registration: 20160825 Address after: Basel Applicant after: BAYER HEALTHCARE LLC Address before: new jersey Applicant before: Bayer Corp. |
|
| GR01 | Patent grant | ||
| GR01 | Patent grant |